Caching Strategies

Local Cache

0 of 7 complete

0%

Contents

Back|Caching StrategiesLocal Cache
1/7
21 min left
  1. Home
  2. System Design: Foundation
  3. Caching Strategies
  4. Local Cache
Related Topics
CachingCore FundamentalsLazy LoadingWeb & Content DeliveryForward ProxyLoad Balancing & ProxiesContent Delivery Network (CDN)Load Balancing & ProxiesData Locality OptimizationData Replication & Distribution
Previous lessonContent Delivery Network (CDN)Next lessonApplication Cache

System Design

1 of 7
Foundation
  • Intermediate
  • Advanced
  • Capstone
  • AI Engineering

    • Foundation
    • Data, RAG and Agents
    • Evaluation, LLM Ops and Security

    systemdesign.academy

    • Home
    • Glossary
    • Interview prep
    • Reviews
    • About
    • Privacy
    • Terms

    this free lesson is part of

    System Design Masterclass

    • 770 lessons, beginner to principal
    • 90 real interview systems taken apart step by step
    • An AI tutor beside every lesson that answers and draws
    • Lifetime access, every new lesson included

    $49 once, by PayPal

    See the System Design course

    Save your progress and get the interview checklist PDF

    System Design Interview Cheat Sheet: the 7 interview stages, the 10 points a scorecard grades, 12 classic systems. 18 pages. Free with an account.

    you just read a free lesson from

    System Design Masterclass

    • 770 lessons, beginner to principal
    • 90 real interview systems taken apart step by step
    • An AI tutor beside every lesson that answers and draws
    • Lifetime access, every new lesson included

    $49 once, by PayPal

    See the System Design course

    A Cache Inside the Process

    A local cache is the simplest one there is. You keep the answer in a variable, and next time somebody asks, you hand back what is already there. No server, no protocol, no configuration.
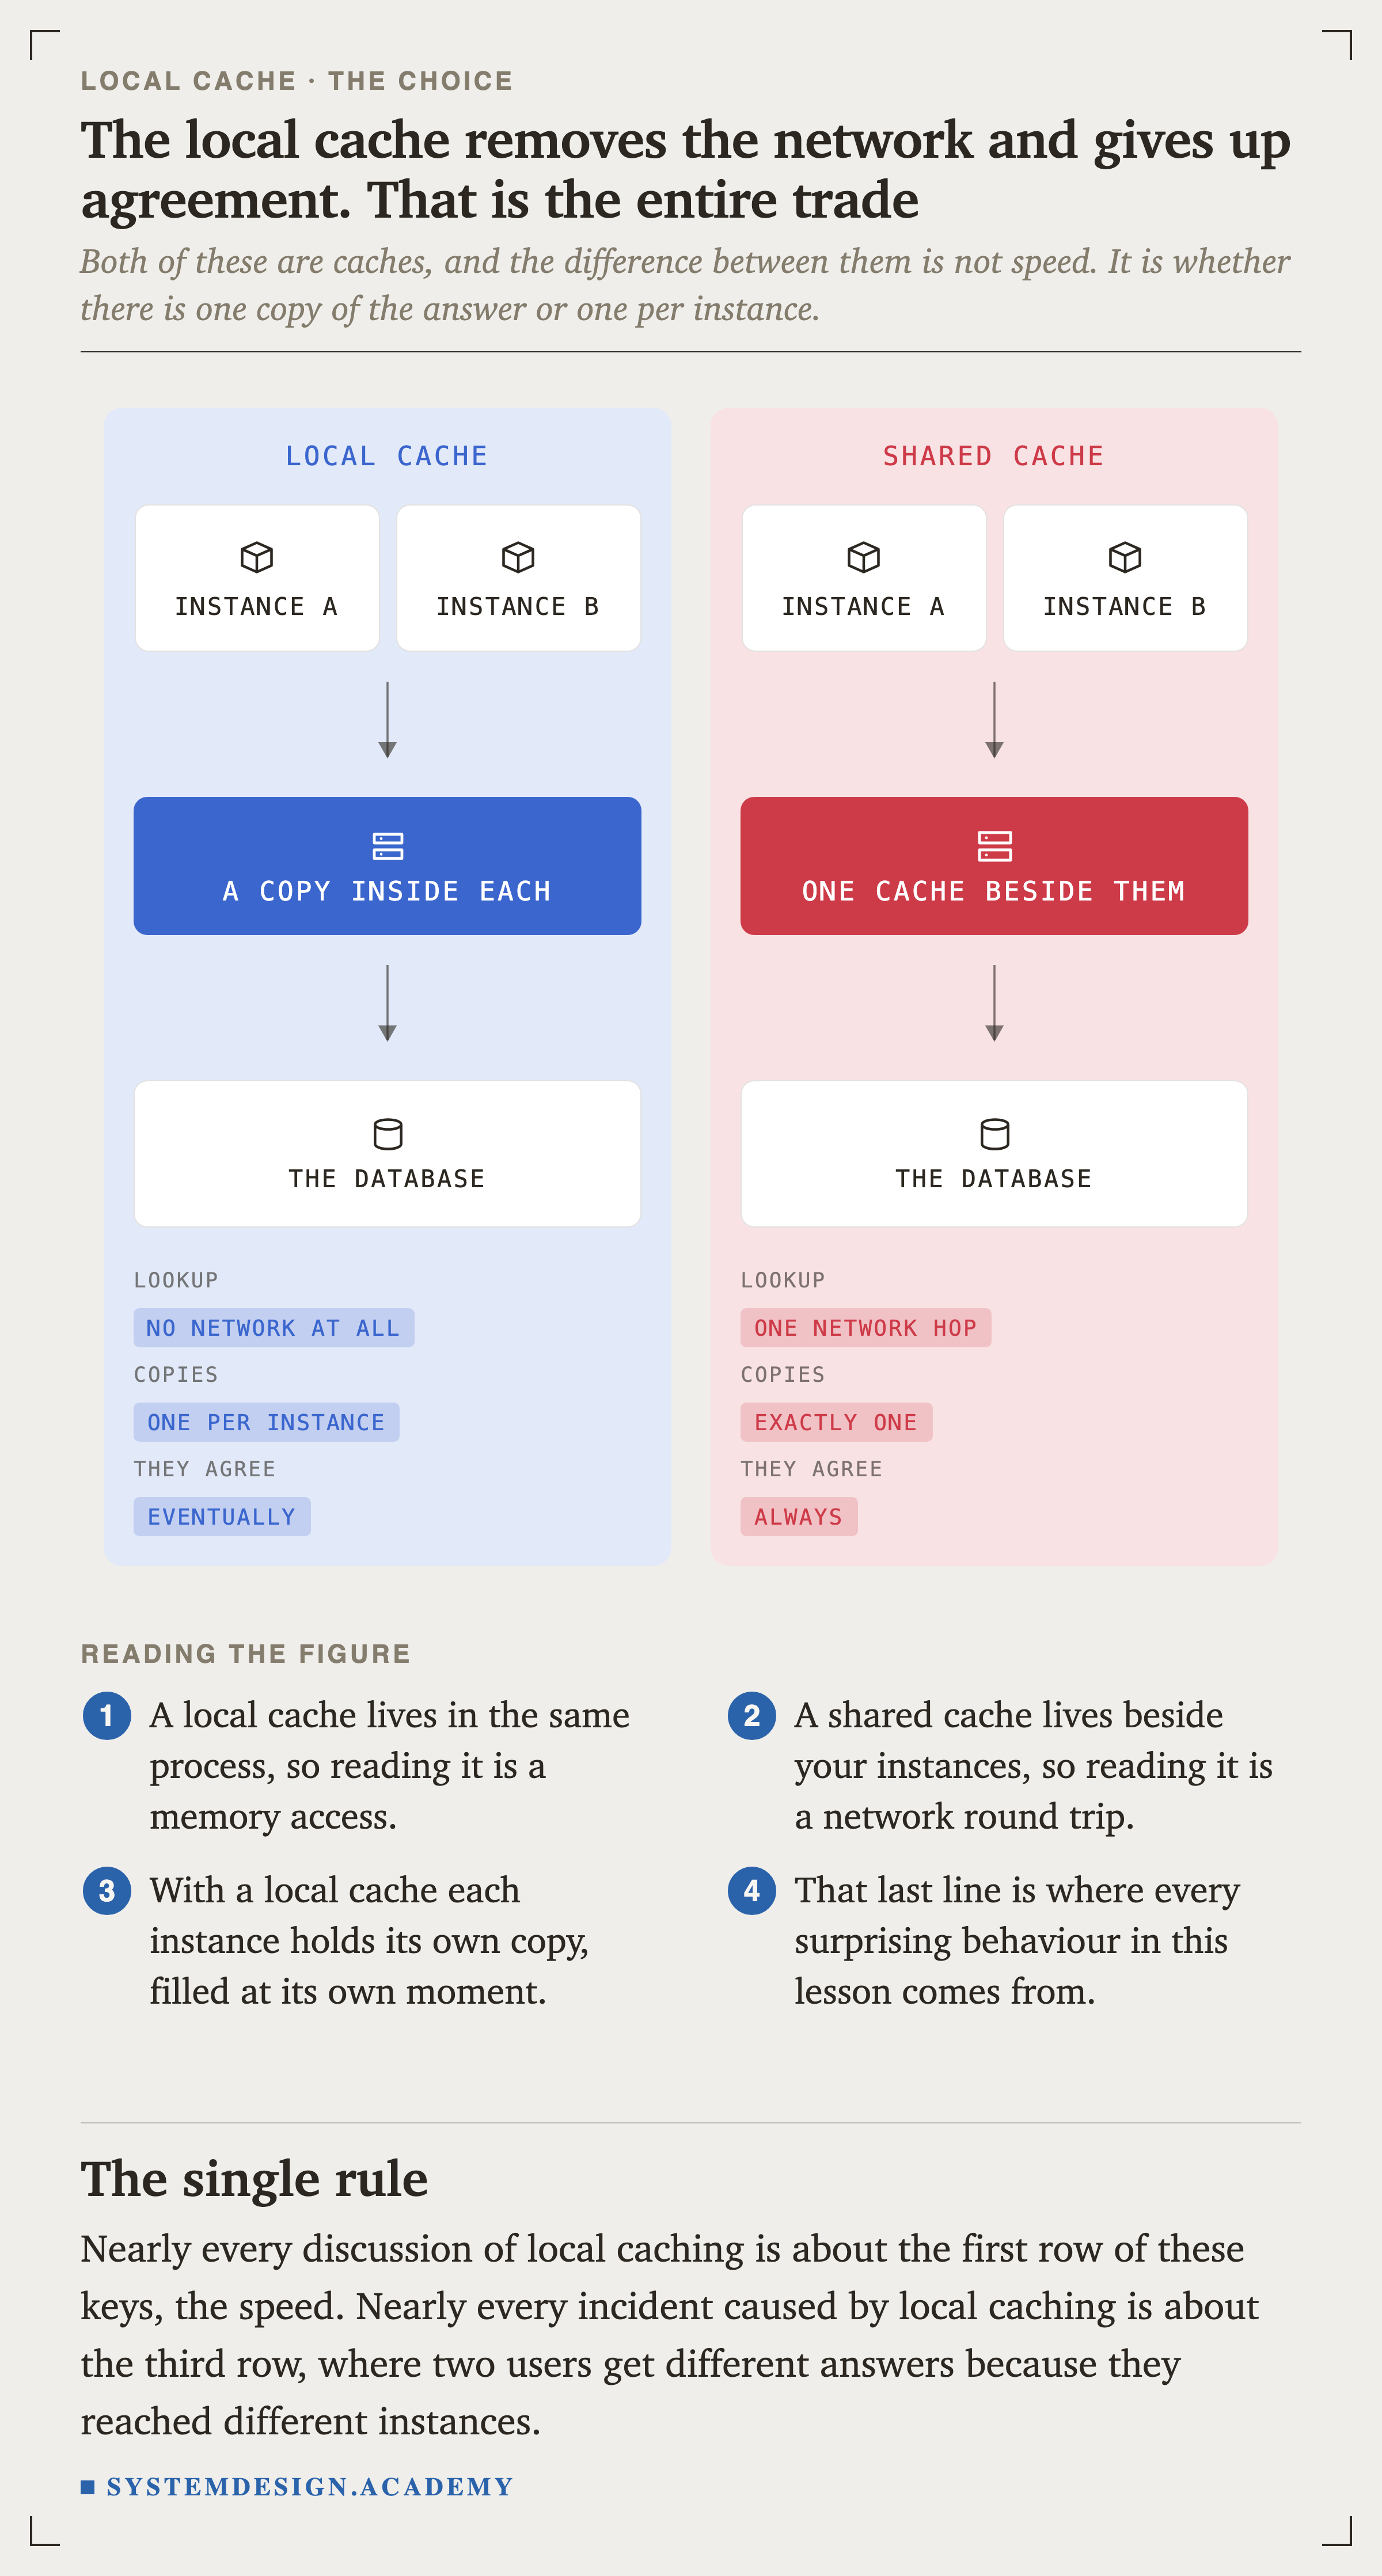
    Two panels. The left, local cache, shows instance A and instance B each feeding into a bar reading a copy inside each, then to the database. Its key reads: lookup no network at all, copies one per instance, they agree eventually. The right, shared cache, shows the same two instances feeding into one cache beside them, then to the database. Its key reads: lookup one network hop, copies exactly one, they agree always.
    ComparisonFigure 1. The trade in full: no network, and no agreement

    Both of these are caches. The difference between them is not speed. It is whether there is one copy of the answer or one copy per instance, and that single difference produces everything surprising in this lesson.

    Nearly every discussion of local is about the first row of those keys. Nearly every incident caused by local caching is about the third.

    What It Buys, Measured

    The script is at scripts/labs/localcache/ladder.py. It measures three things on the machine it runs on: the speed, the memory, and the disagreement.
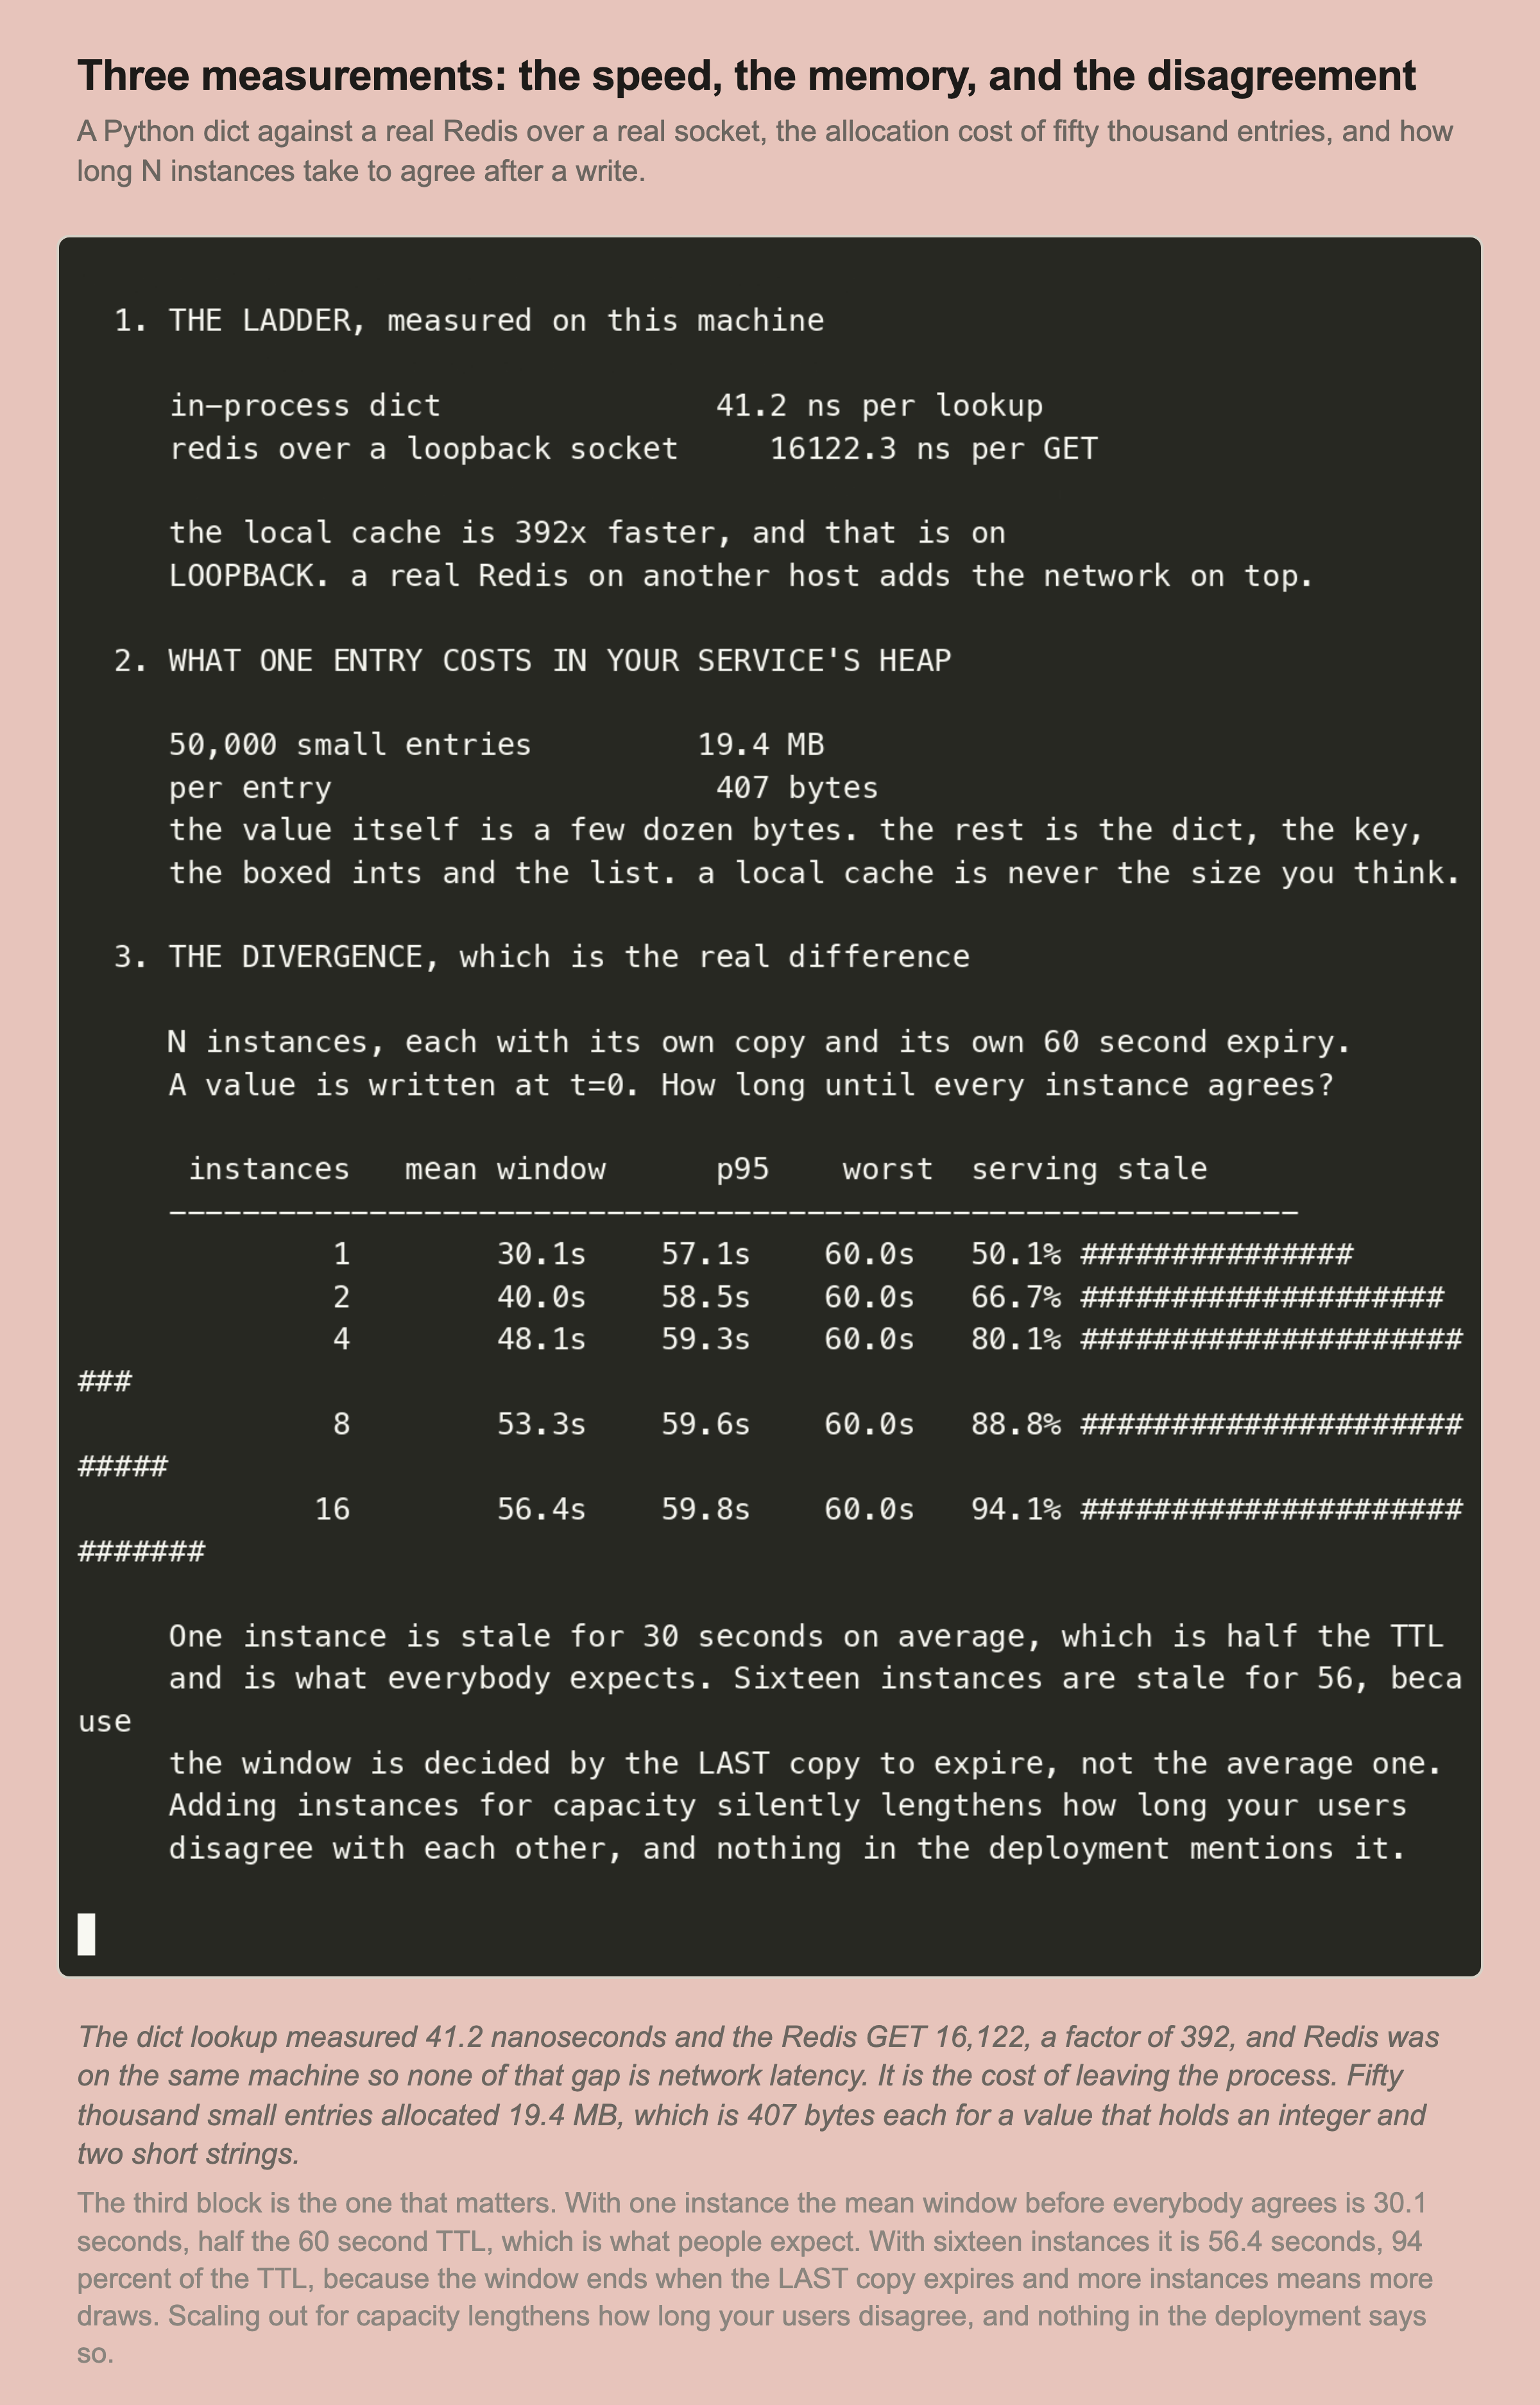
    A recorded terminal session. An in-process dict lookup measures 41.2 nanoseconds and a Redis GET over a loopback socket measures 16,122.3 nanoseconds, a factor of 392. Fifty thousand small entries allocate 19.4 MB, which is 407 bytes per entry. A table then shows the divergence window for 1, 2, 4, 8 and 16 instances with a 60 second TTL: mean windows of 30.1, 40.0, 48.1, 53.3 and 56.4 seconds, with 95th percentiles above 57 seconds throughout and a worst case of 60 in every row.
    RecordedFigure 2. Speed, memory and disagreement, measured in one run

    Three separate measurements, and the third one is the reason this lesson exists. The first two are what people expect. The third is what actually decides whether a local cache is a good idea for your data.
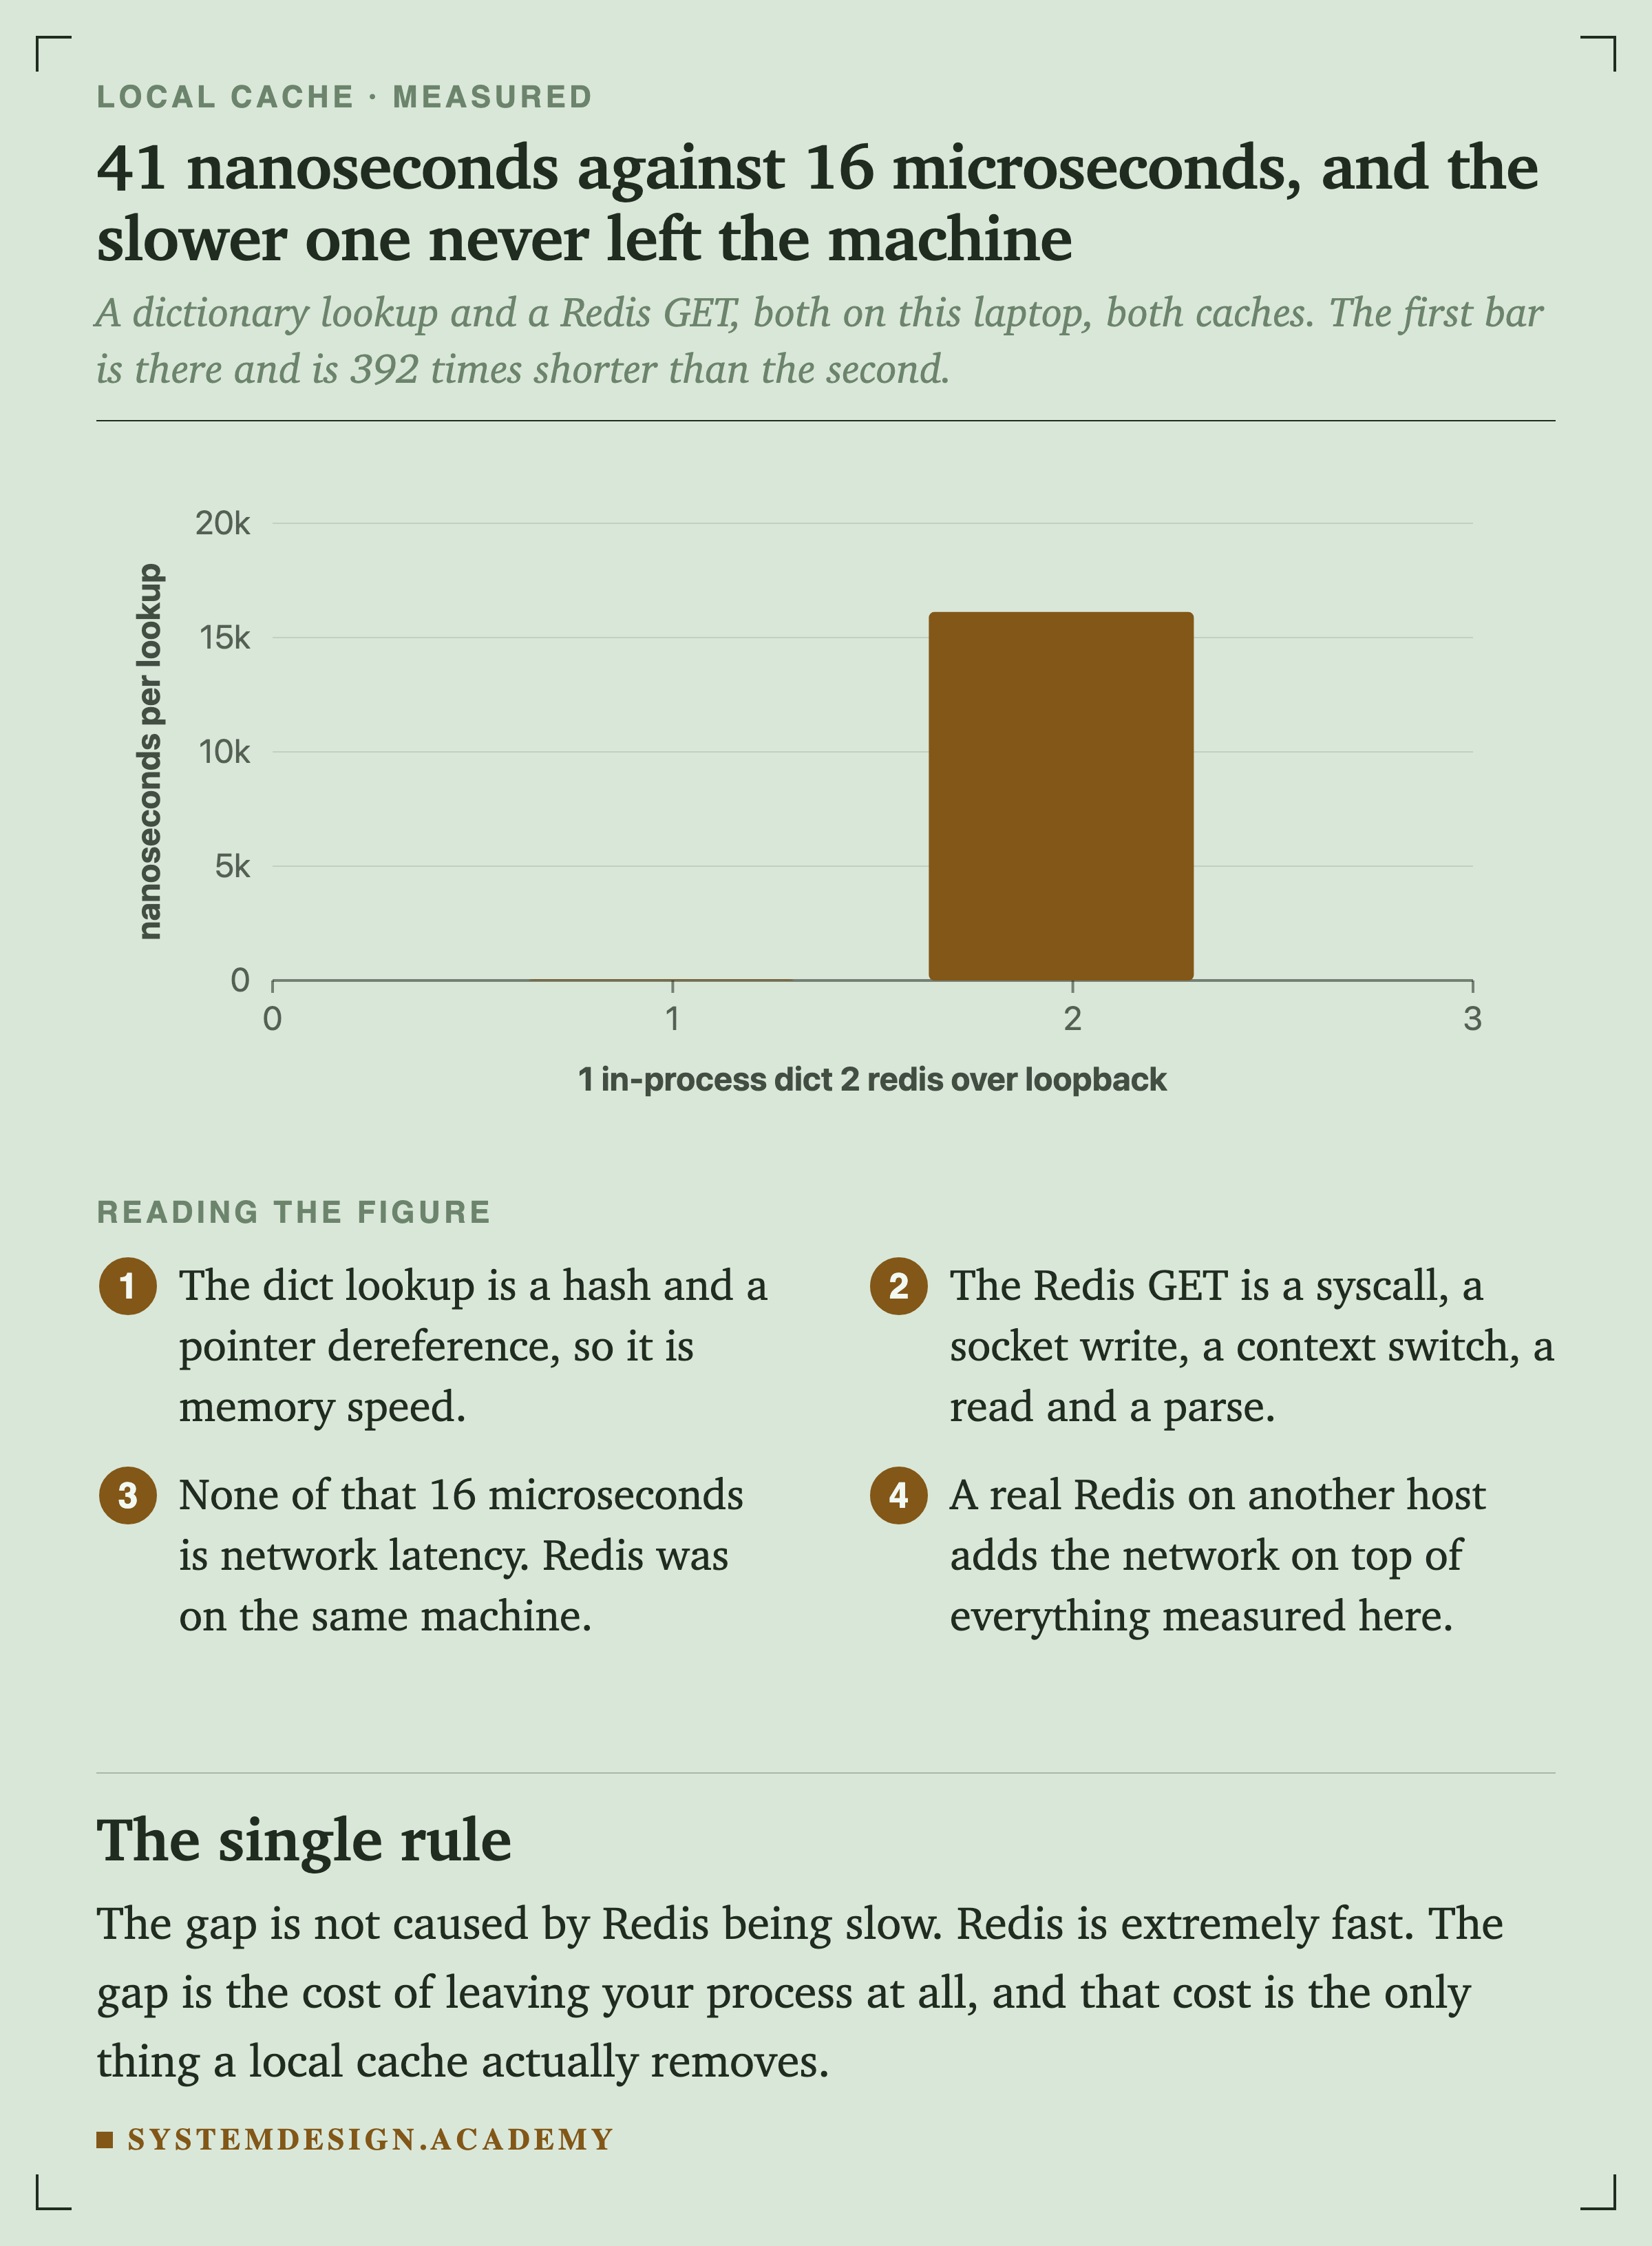
    A bar chart with two bars showing nanoseconds per lookup. The in-process dict bar is 41.2, barely visible against the axis. The Redis over loopback bar is 16,122.3.
    ChartFigure 3. 41 nanoseconds against 16 microseconds, and the slower one never left the machine

    The dict lookup is a hash and a pointer dereference. The Redis GET is a syscall, a socket write, a context switch, a read and a parse. None of that gap is network , because Redis was running on the same laptop.

    The gap is not caused by being slow. Redis is extremely fast. The gap is the cost of leaving your process at all, and that is the only thing a local cache removes.
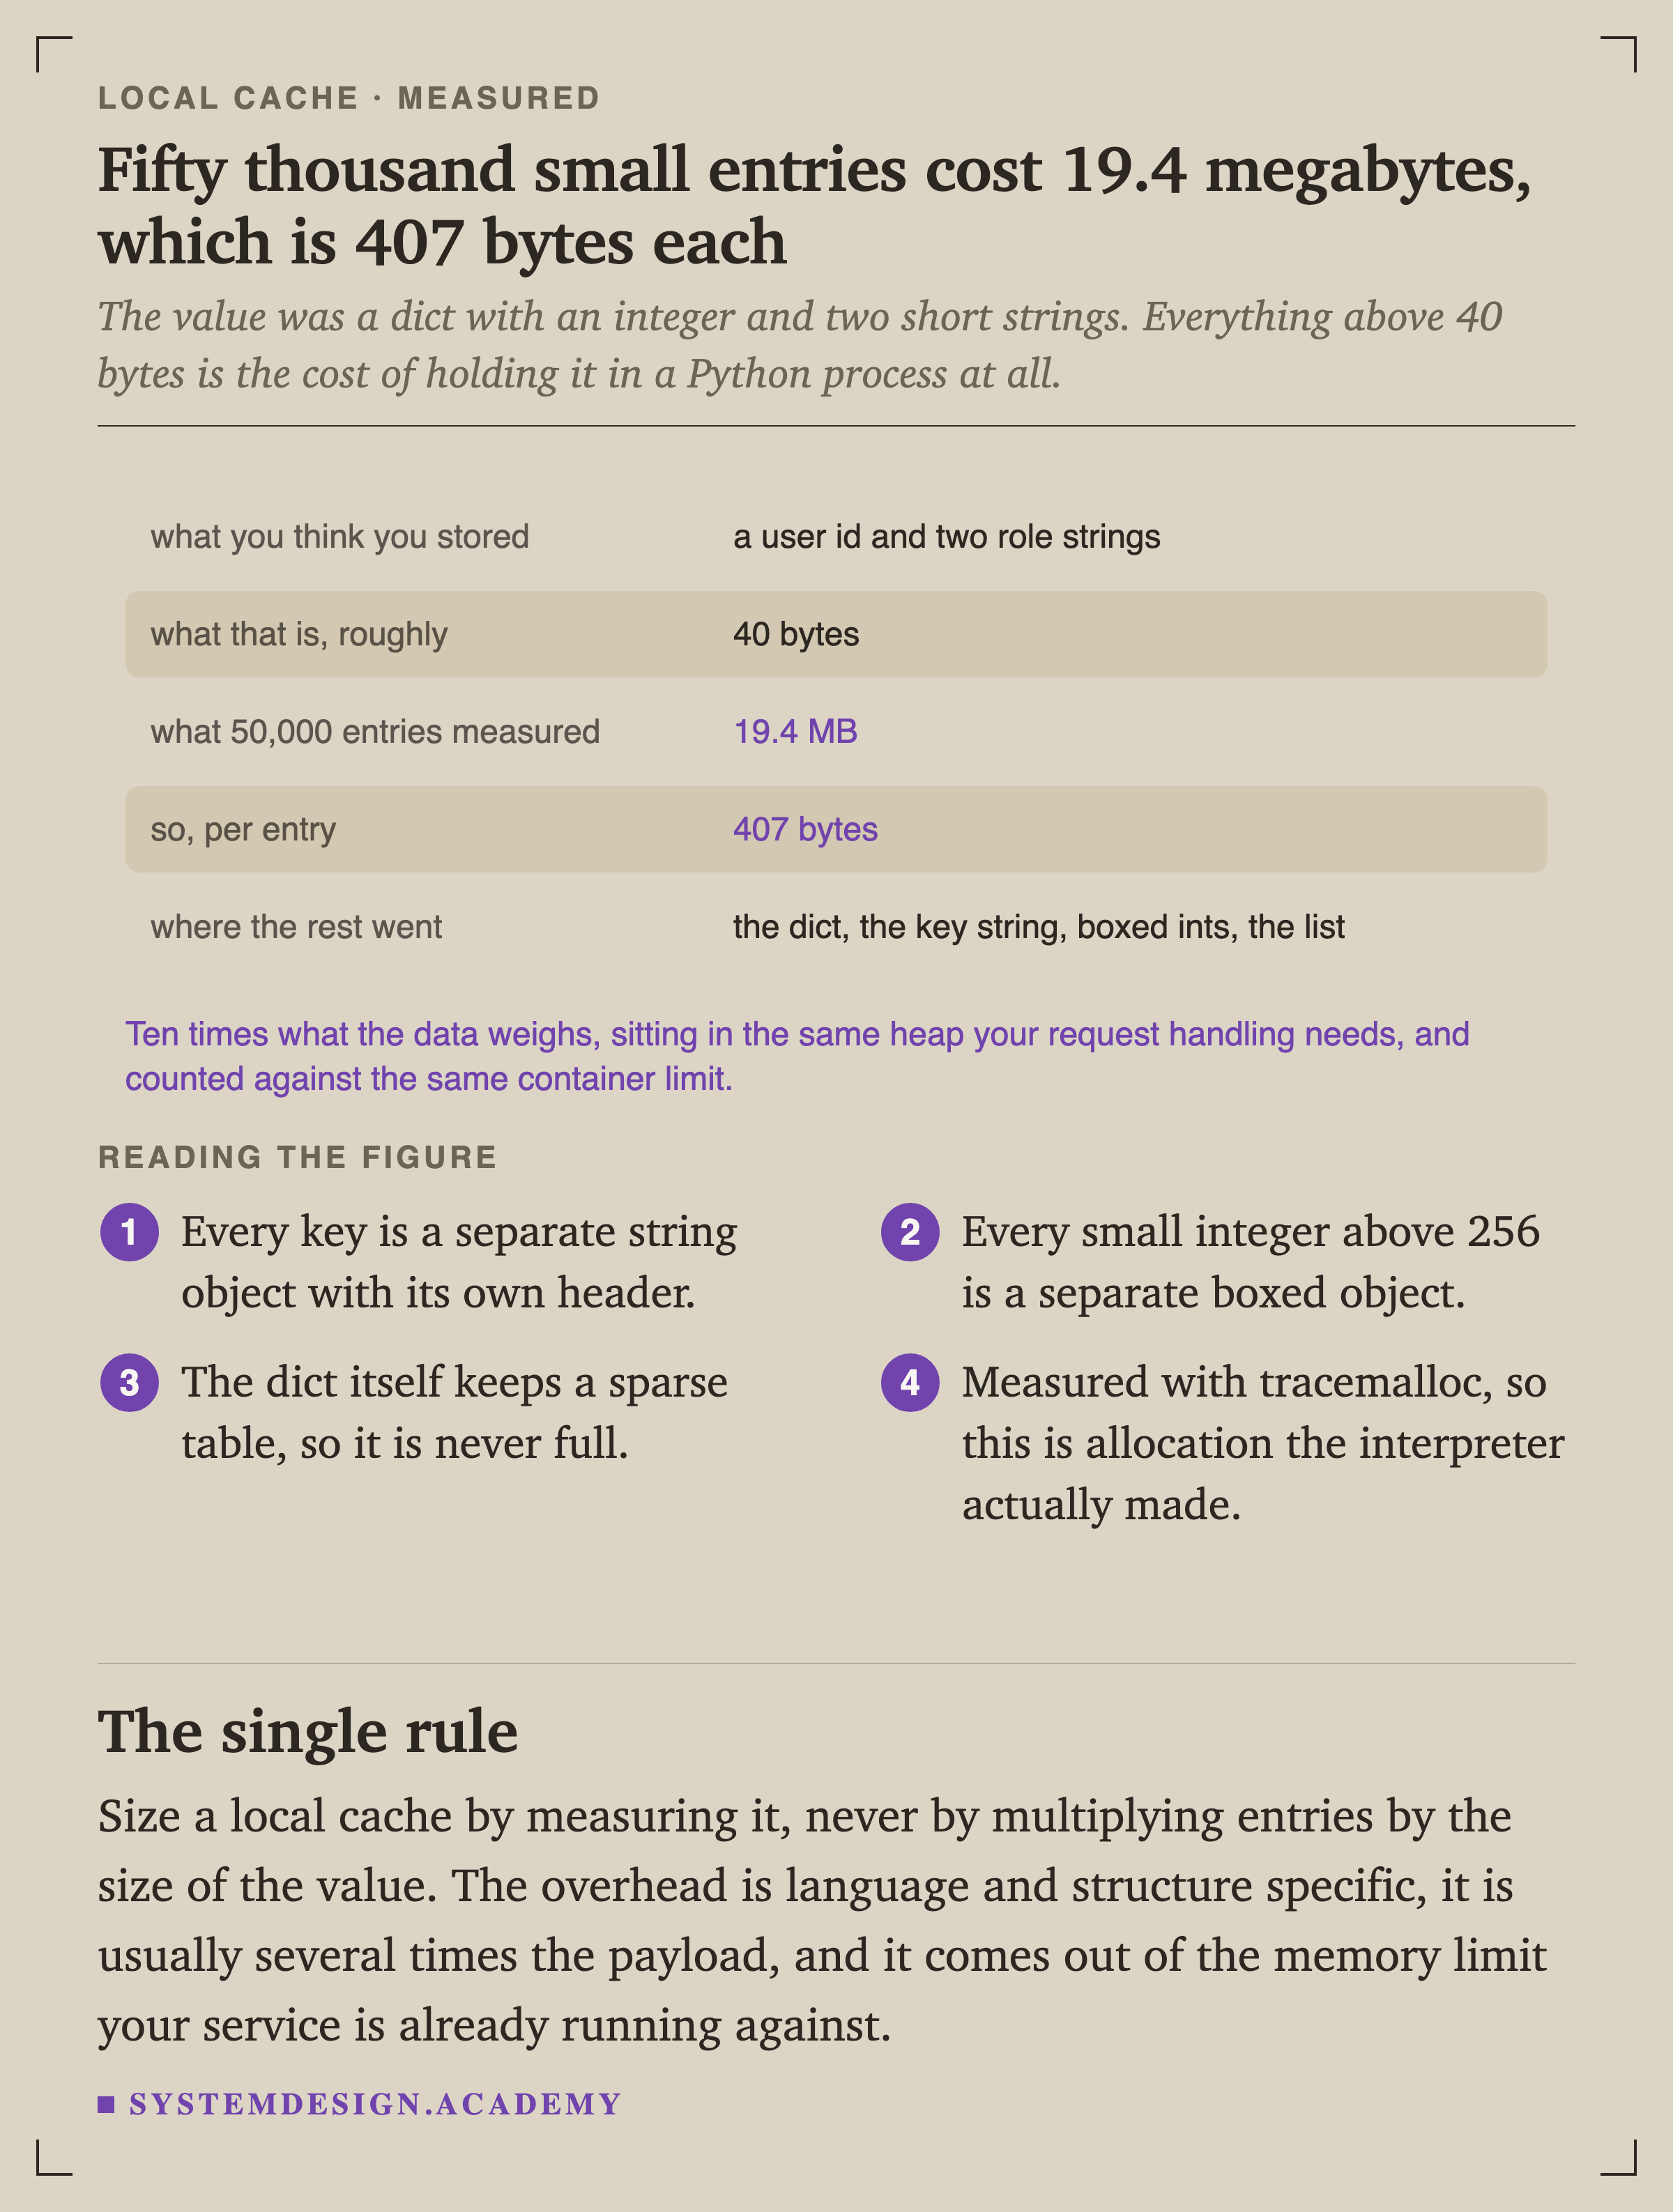
    Five rows. What you think you stored: a user id and two role strings. What that is, roughly: 40 bytes. What 50,000 entries measured: 19.4 MB. So, per entry: 407 bytes. Where the rest went: the dict, the key string, boxed ints, the list. A closing line reads that this is ten times what the data weighs, sitting in the same heap your request handling needs, and counted against the same container limit.
    FigureFigure 4. Fifty thousand small entries cost 19.4 megabytes

    The value was an integer and two short strings. Everything above about 40 bytes is the cost of holding it in a Python process, and it is measured with the interpreter's own allocation tracker instead of estimated.

    Size a local cache by measuring it. Multiplying entries by the size of the value will be wrong by a factor of several, in the direction that runs your service out of memory.

    after “What It Buys, Measured”

    Want to build this yourself?

    Pick it up in Redis Cache, from the System Design course.

    The AI tutor beside the lesson answers your follow-up questions, and can draw.

    See what the course covers

    The Measurement That Changes Your Mind

    Here is the part the table hides. Every instance holds its own copy, and each one filled its copy at whatever moment it first needed the value. So when a value changes, the instances do not become correct together.
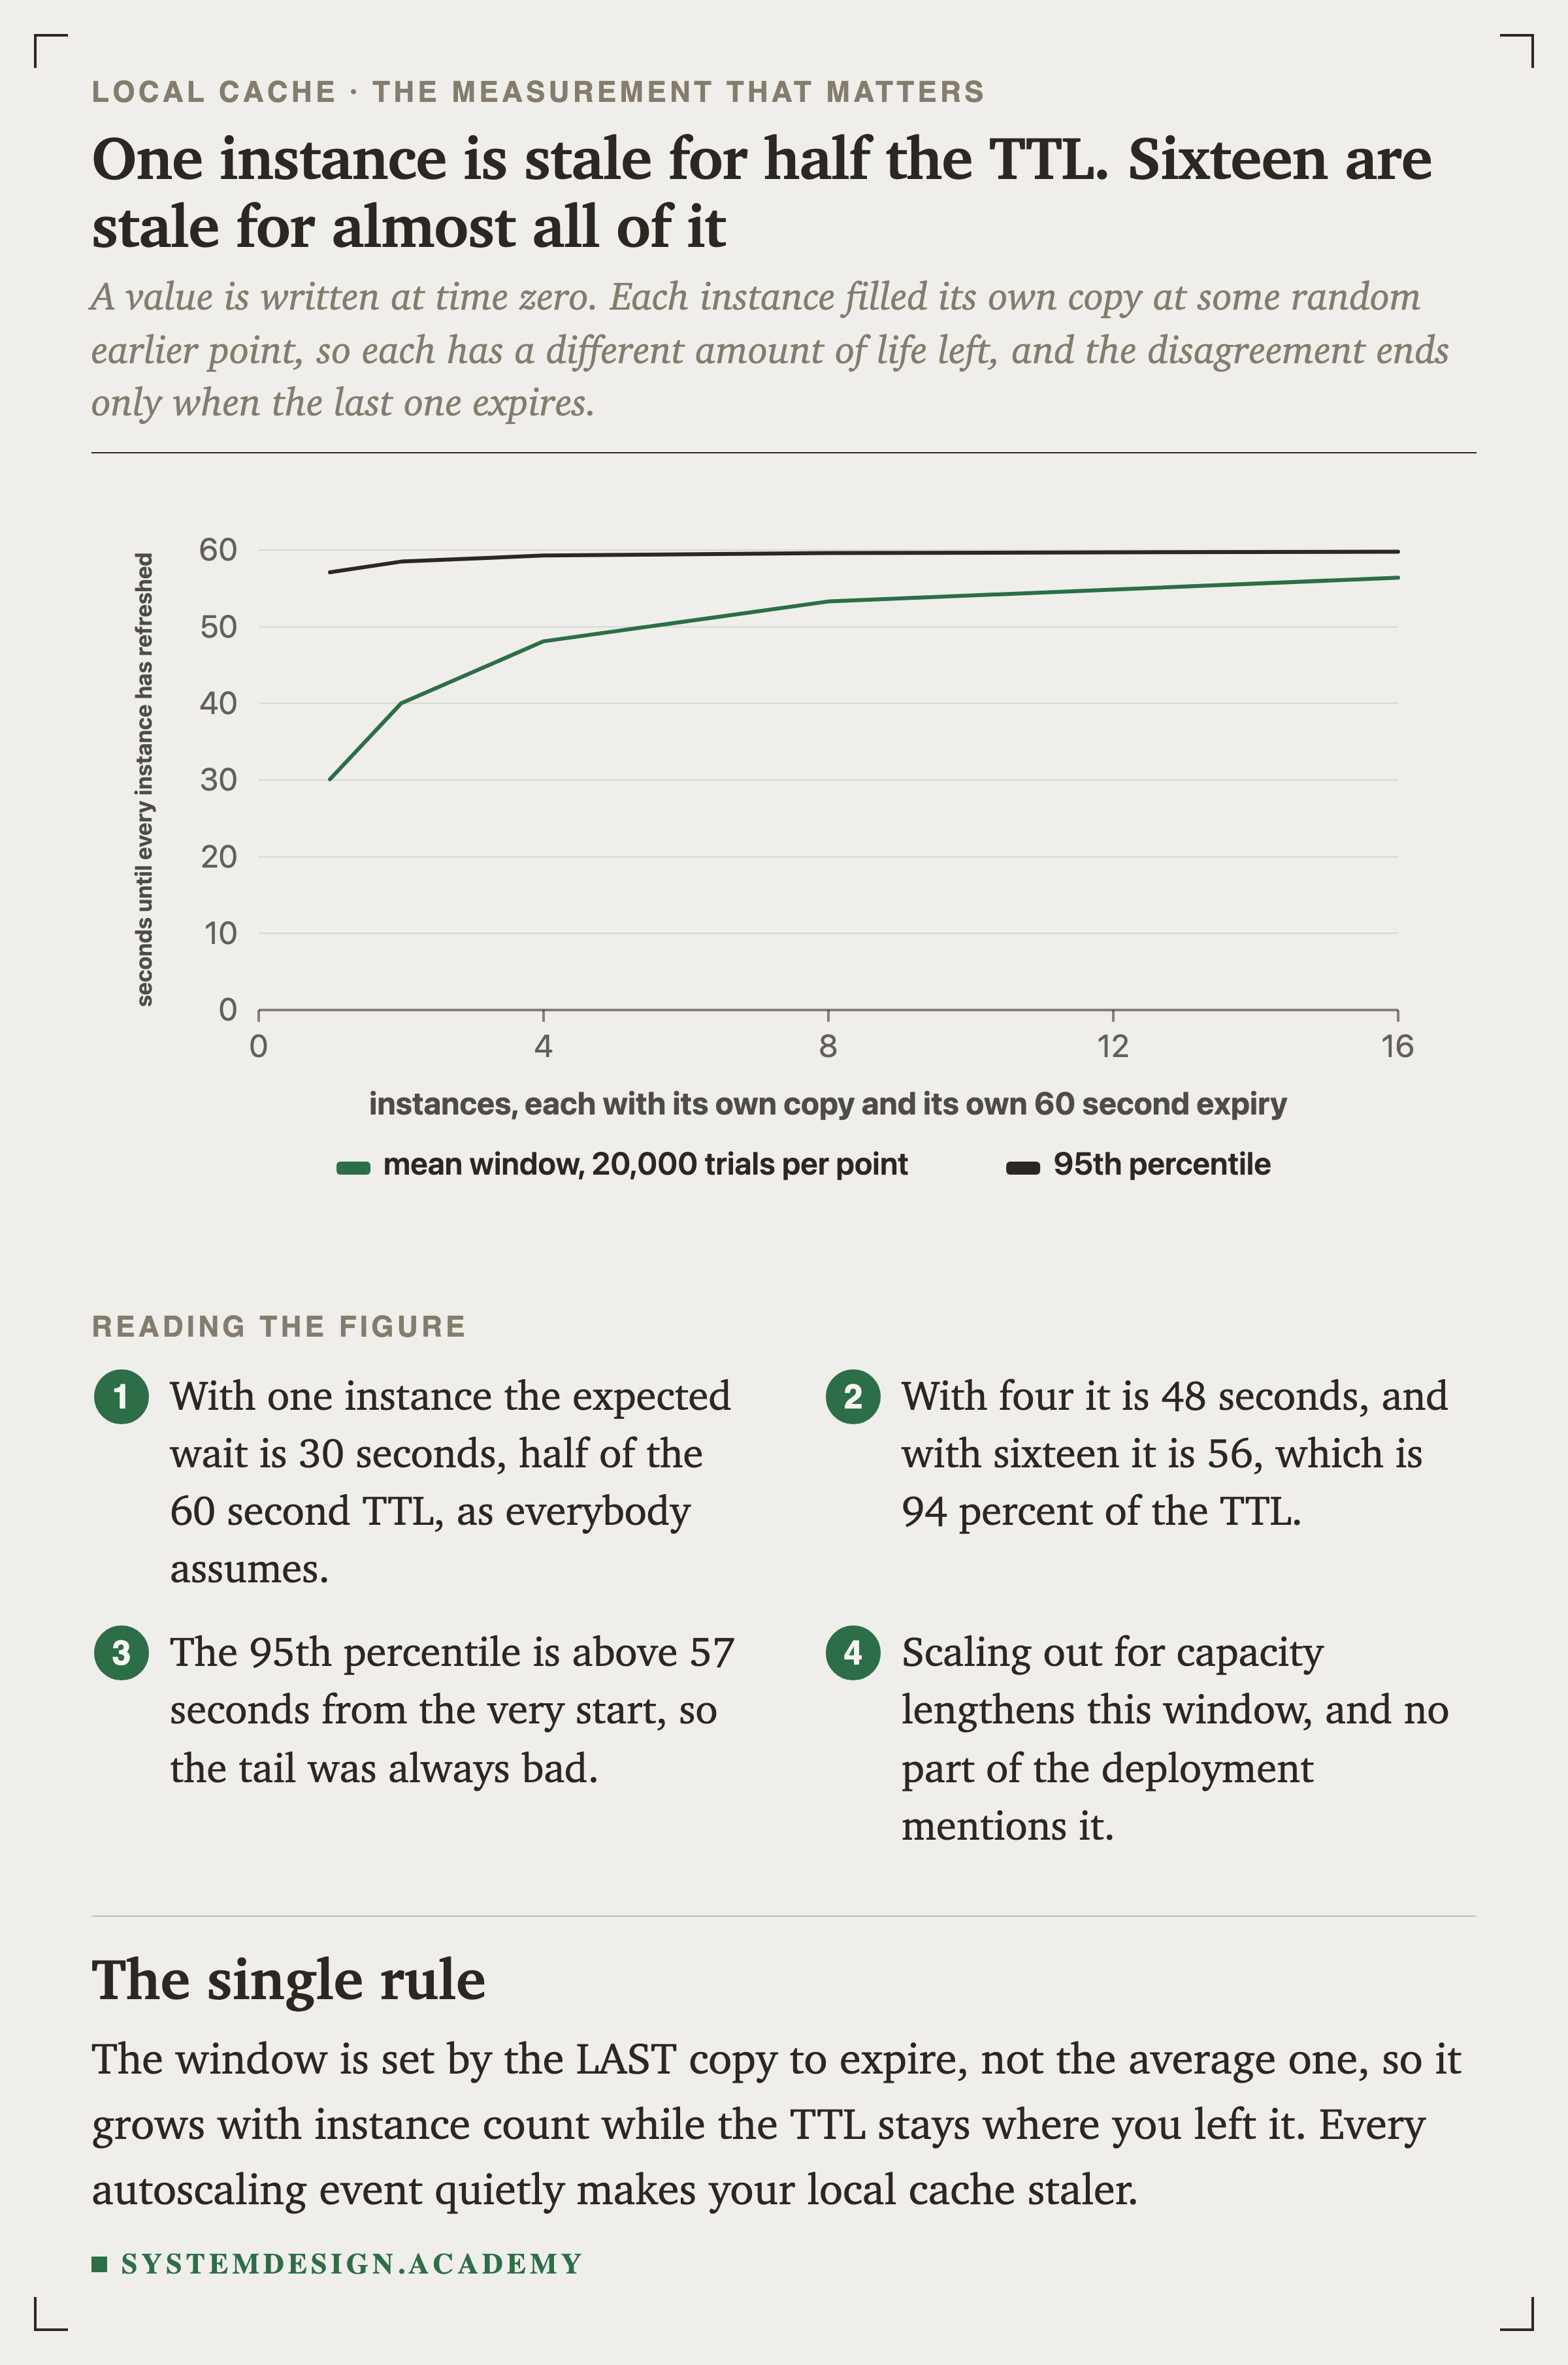
    A line chart of seconds until every instance has refreshed, against instance count. The mean window rises from 30.1 seconds at one instance to 40.0 at two, 48.1 at four, 53.3 at eight and 56.4 at sixteen. A second line shows the 95th percentile, which is already 57.1 seconds at one instance and rises to 59.8 at sixteen.
    ChartFigure 5. One instance is stale for half the TTL, and sixteen for almost all of it

    With one instance the expected wait is 30 seconds, half of the 60 second , which is what everybody assumes. With sixteen instances it is 56 seconds, which is 94 percent of the TTL. The TTL did not change. The instance count did.
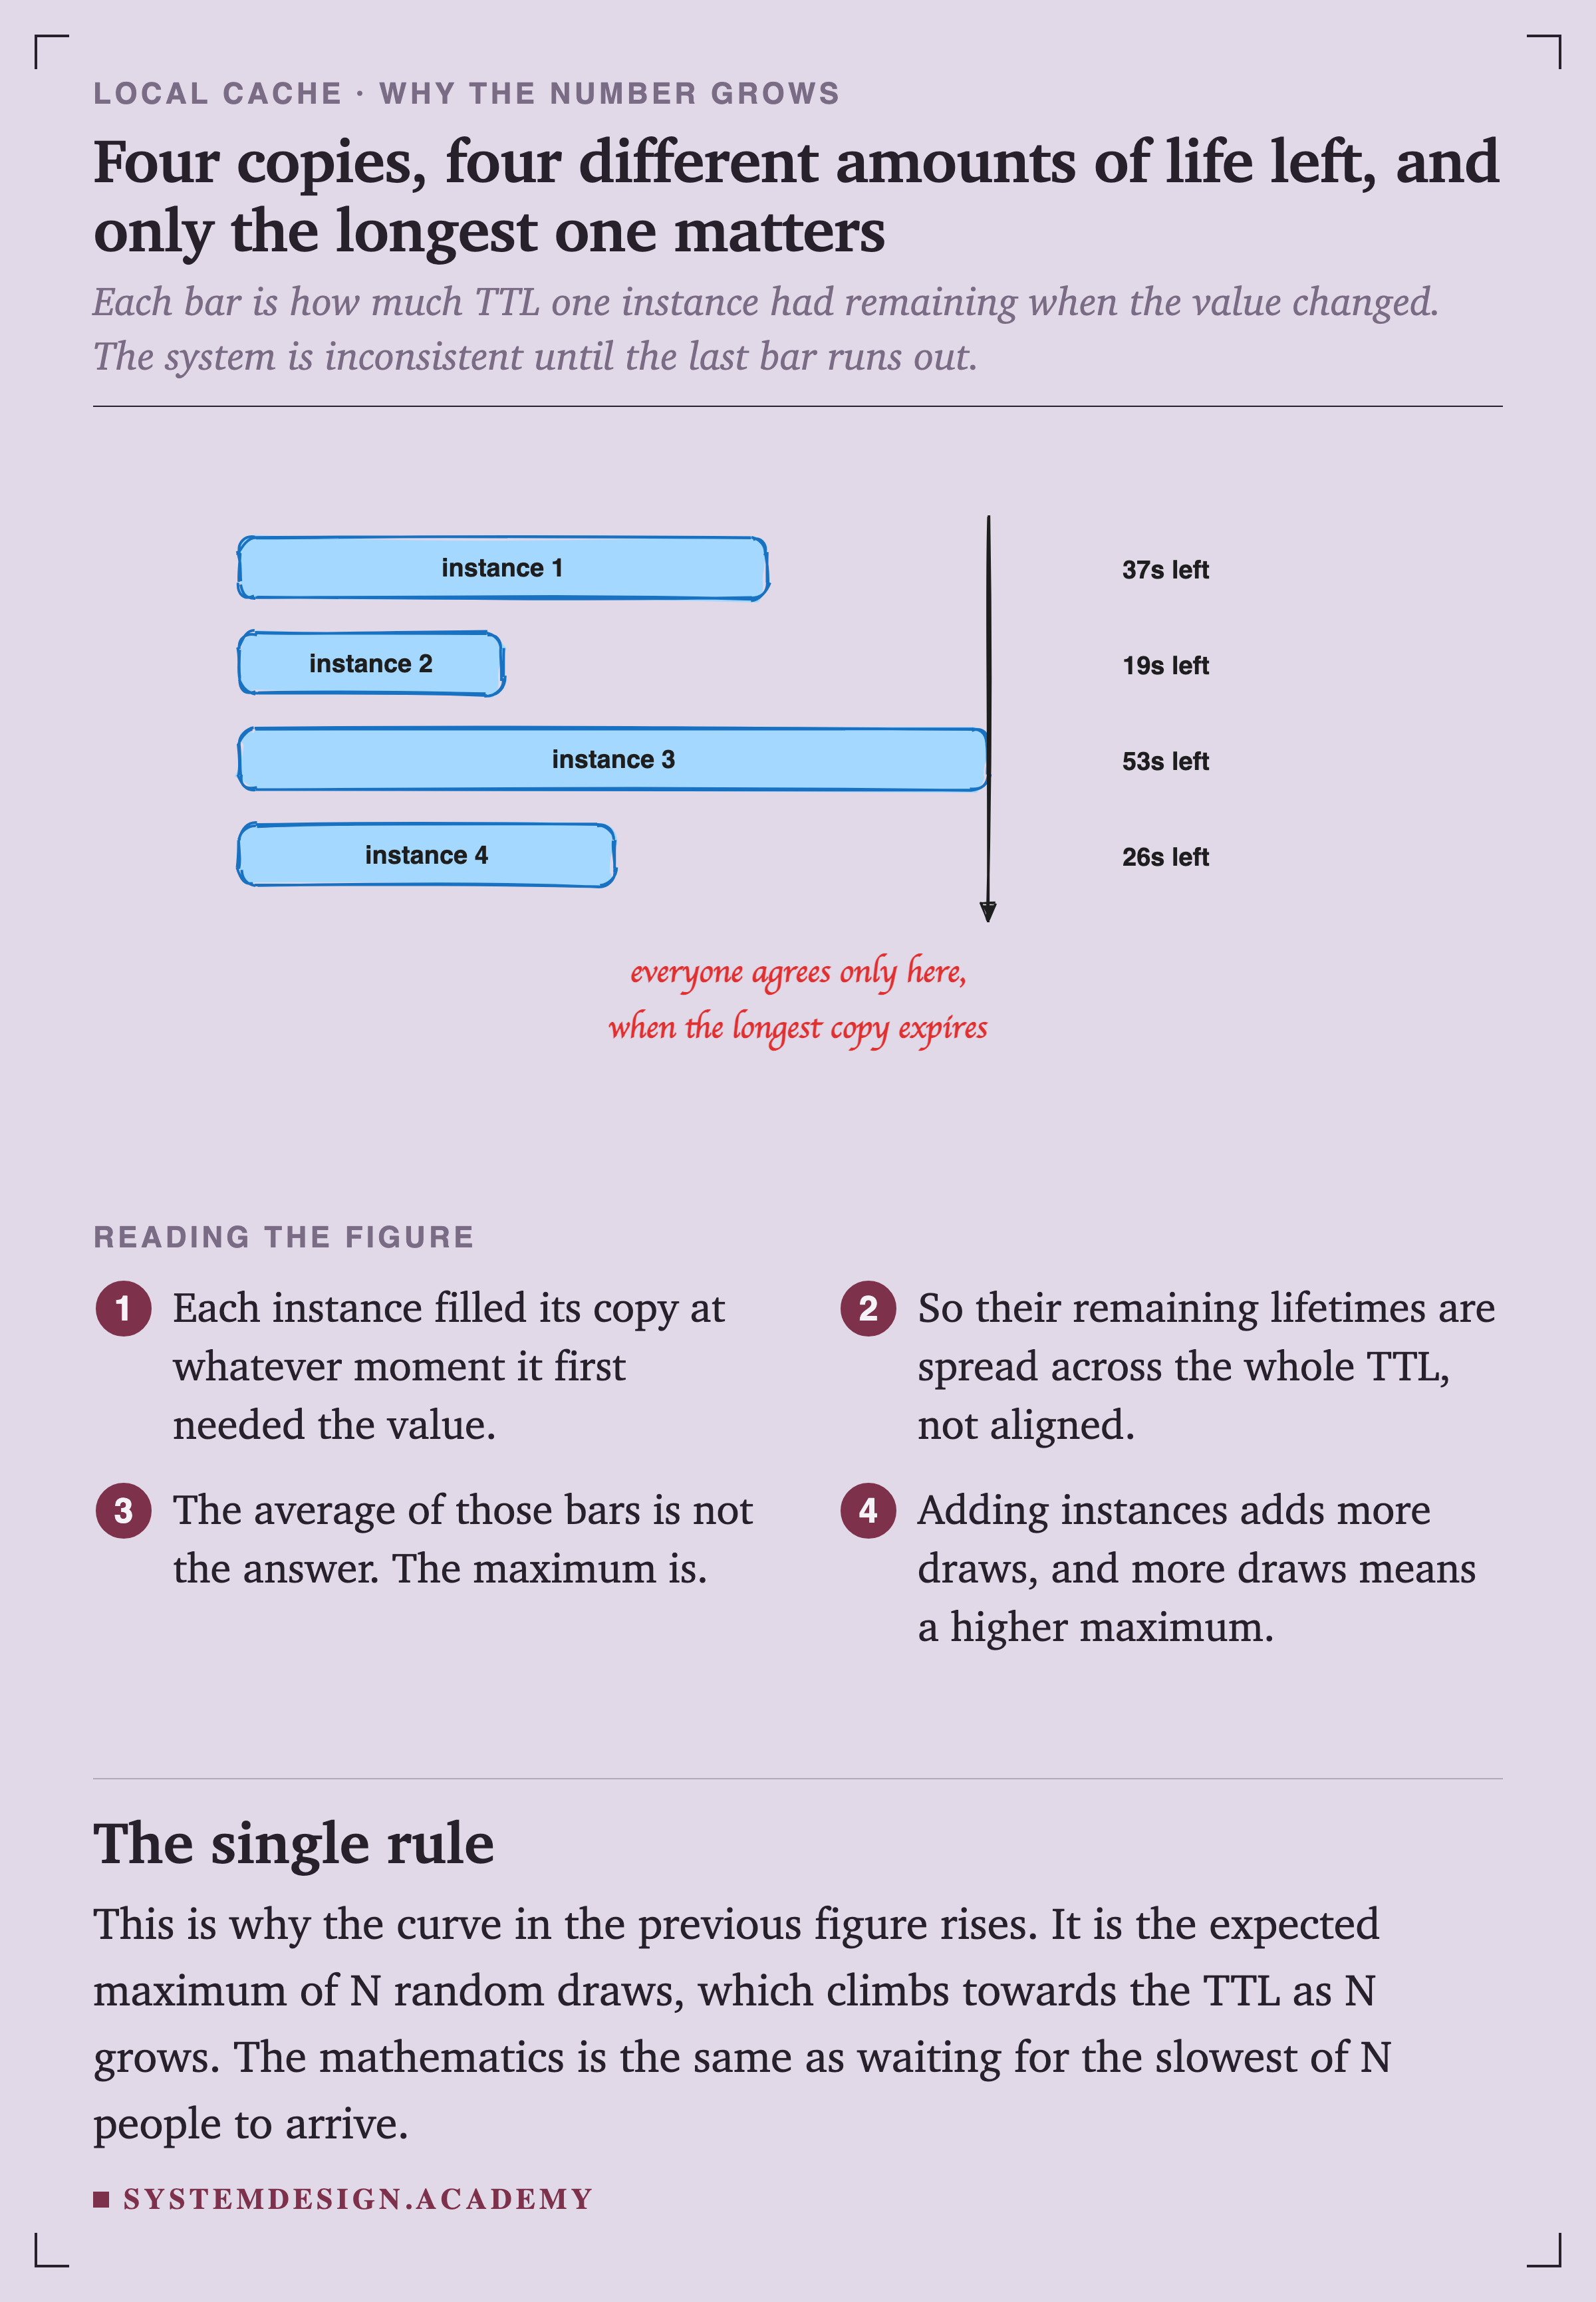
    Four hand-drawn horizontal bars of different lengths, labelled instance 1 through 4, with remaining lifetimes of 37, 19, 53 and 26 seconds. The longest bar is highlighted and a vertical arrow marks its end. A handwritten note reads: everyone agrees only here, when the longest copy expires.
    SketchFigure 6. The average of those bars is not the answer. The maximum is

    The system is inconsistent until the last copy runs out. Adding instances adds more draws from the same distribution, and more draws means a higher expected maximum. It is the same mathematics as waiting for the slowest of N people to arrive.

    Expiry Is Not a Gentle Event
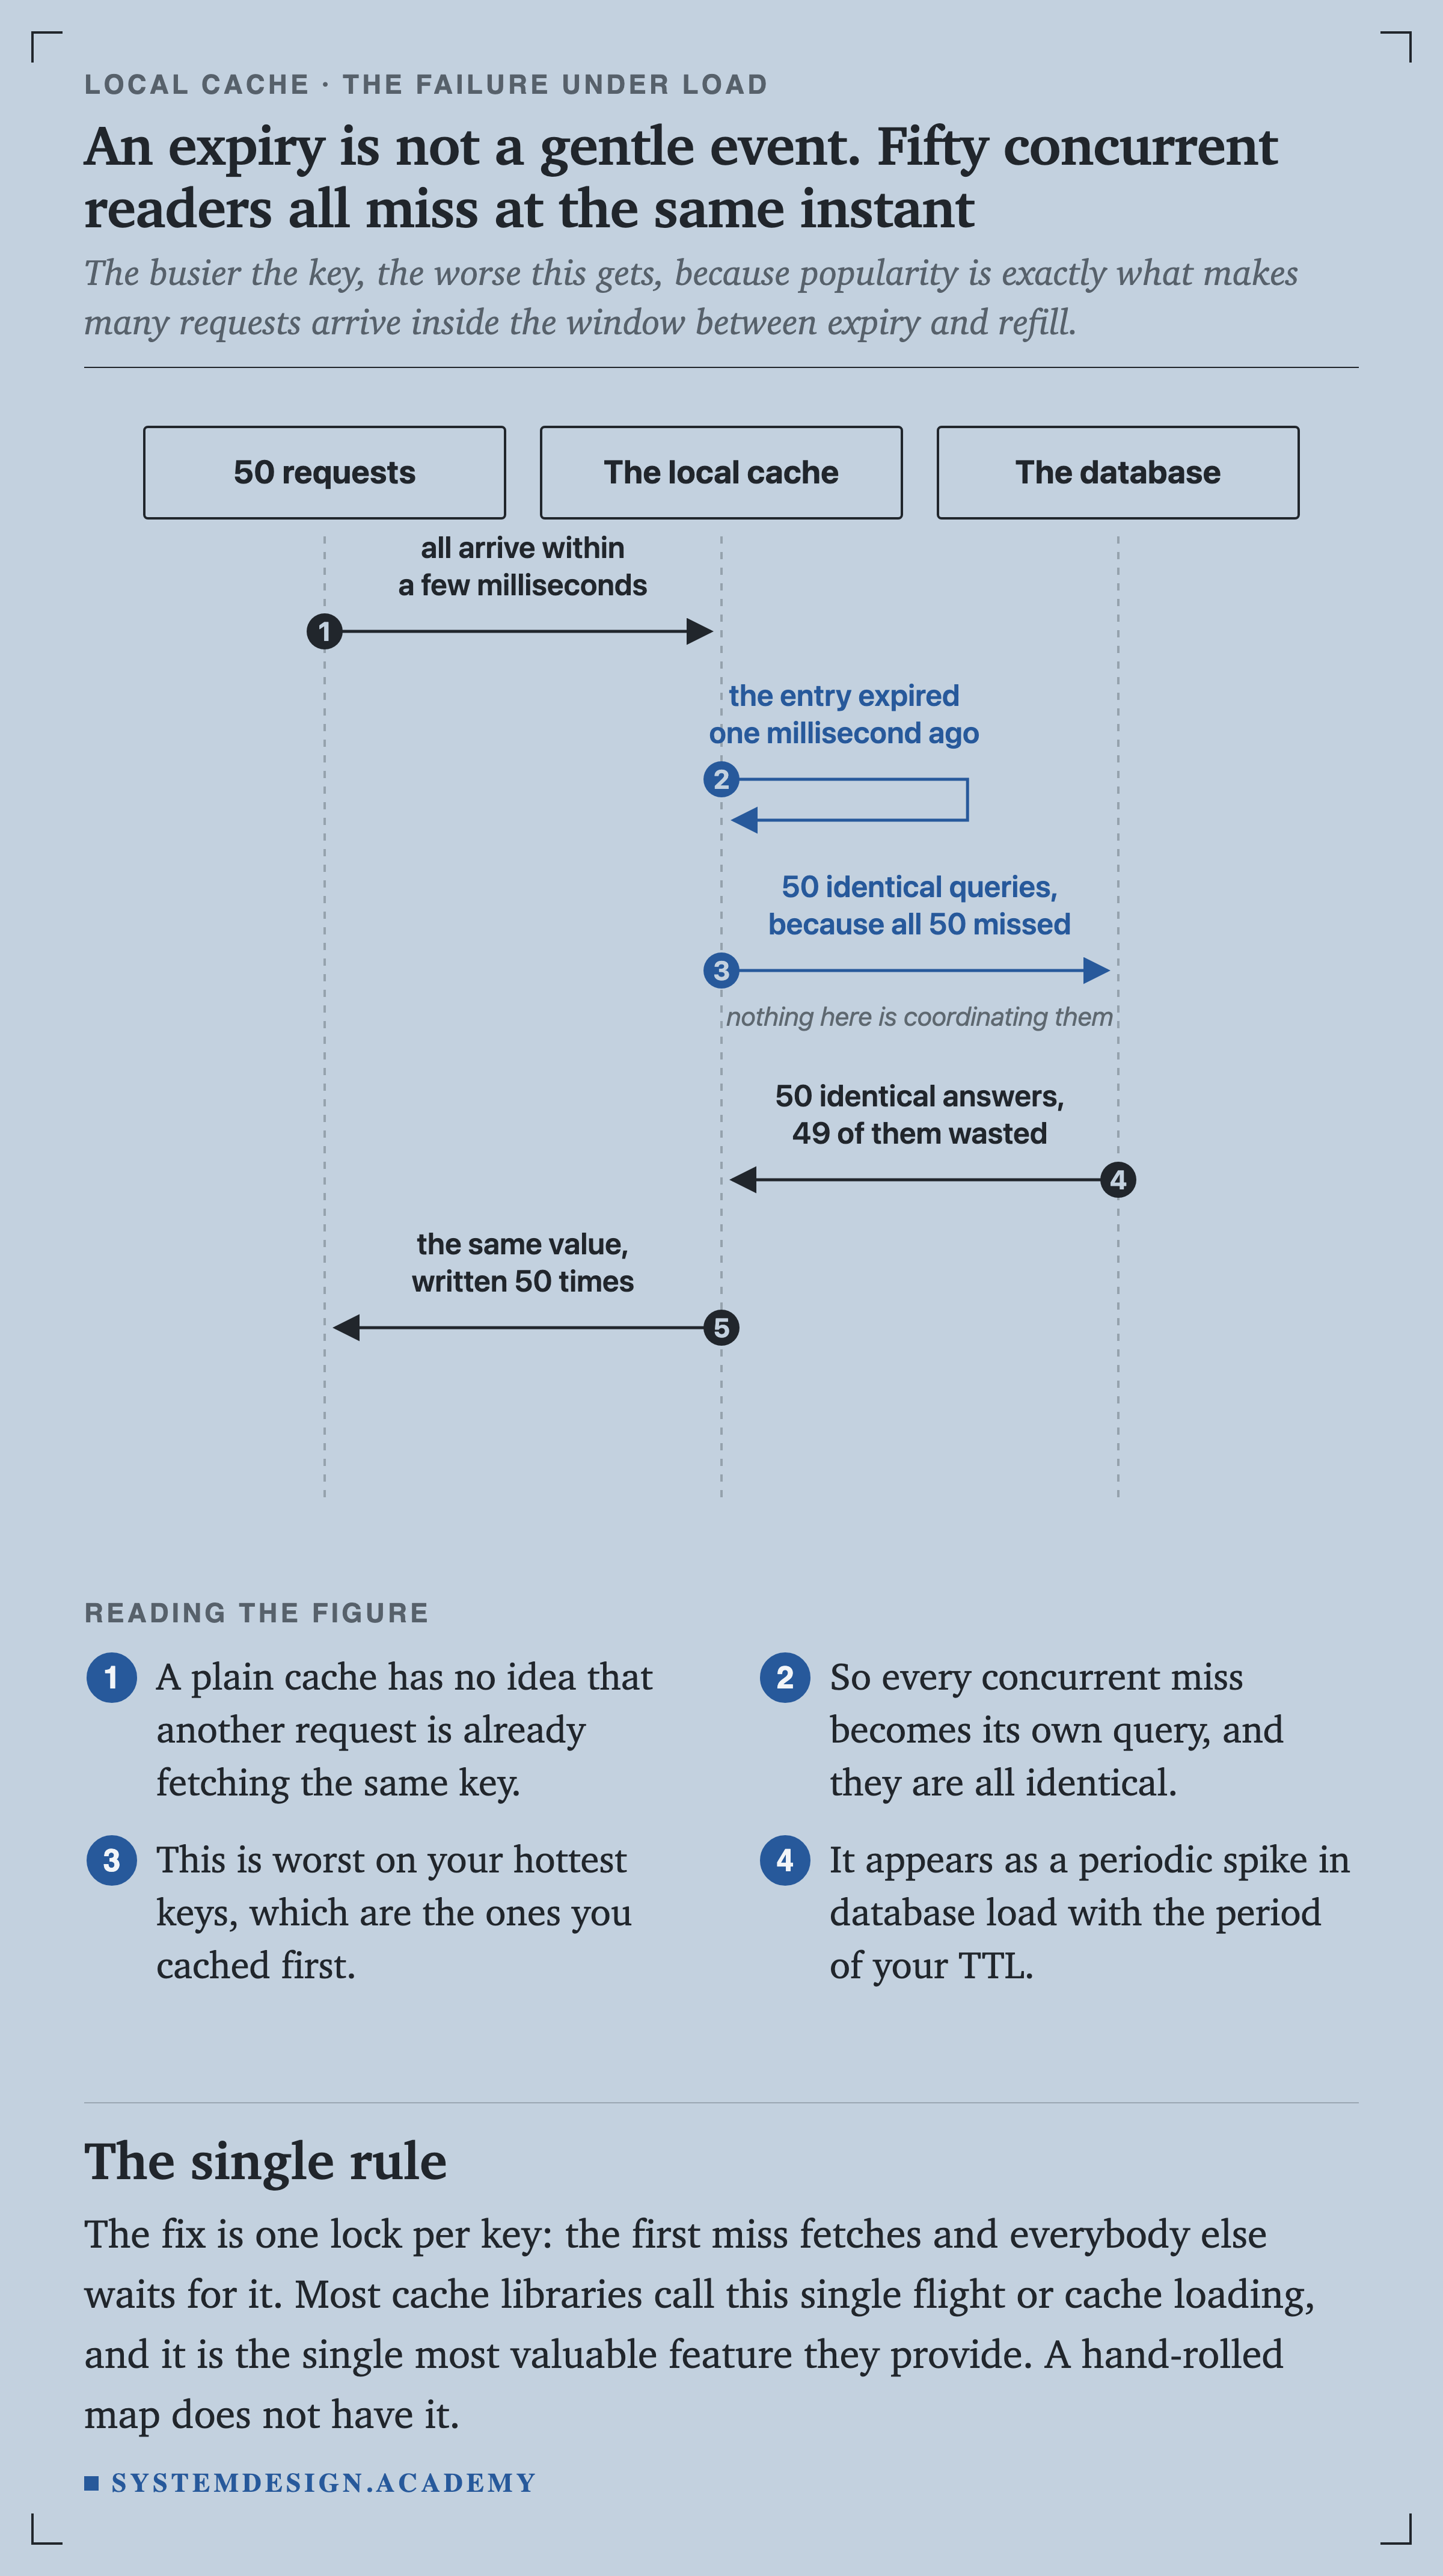
    A sequence diagram with three lifelines: 50 requests, the local cache and the database. All 50 arrive within a few milliseconds. The entry expired one millisecond ago. The cache sends 50 identical queries to the database because all 50 missed, noted as nothing here is coordinating them. The database returns 50 identical answers, 49 of them wasted, and the same value is written 50 times.
    SequenceFigure 8. Fifty concurrent readers all miss at the same instant

    A plain cache has no idea that another request is already fetching the same key, so every concurrent miss becomes its own query. This is worst on your hottest keys, which are the ones you cached first, and it appears as a periodic spike in database load with the period of your .
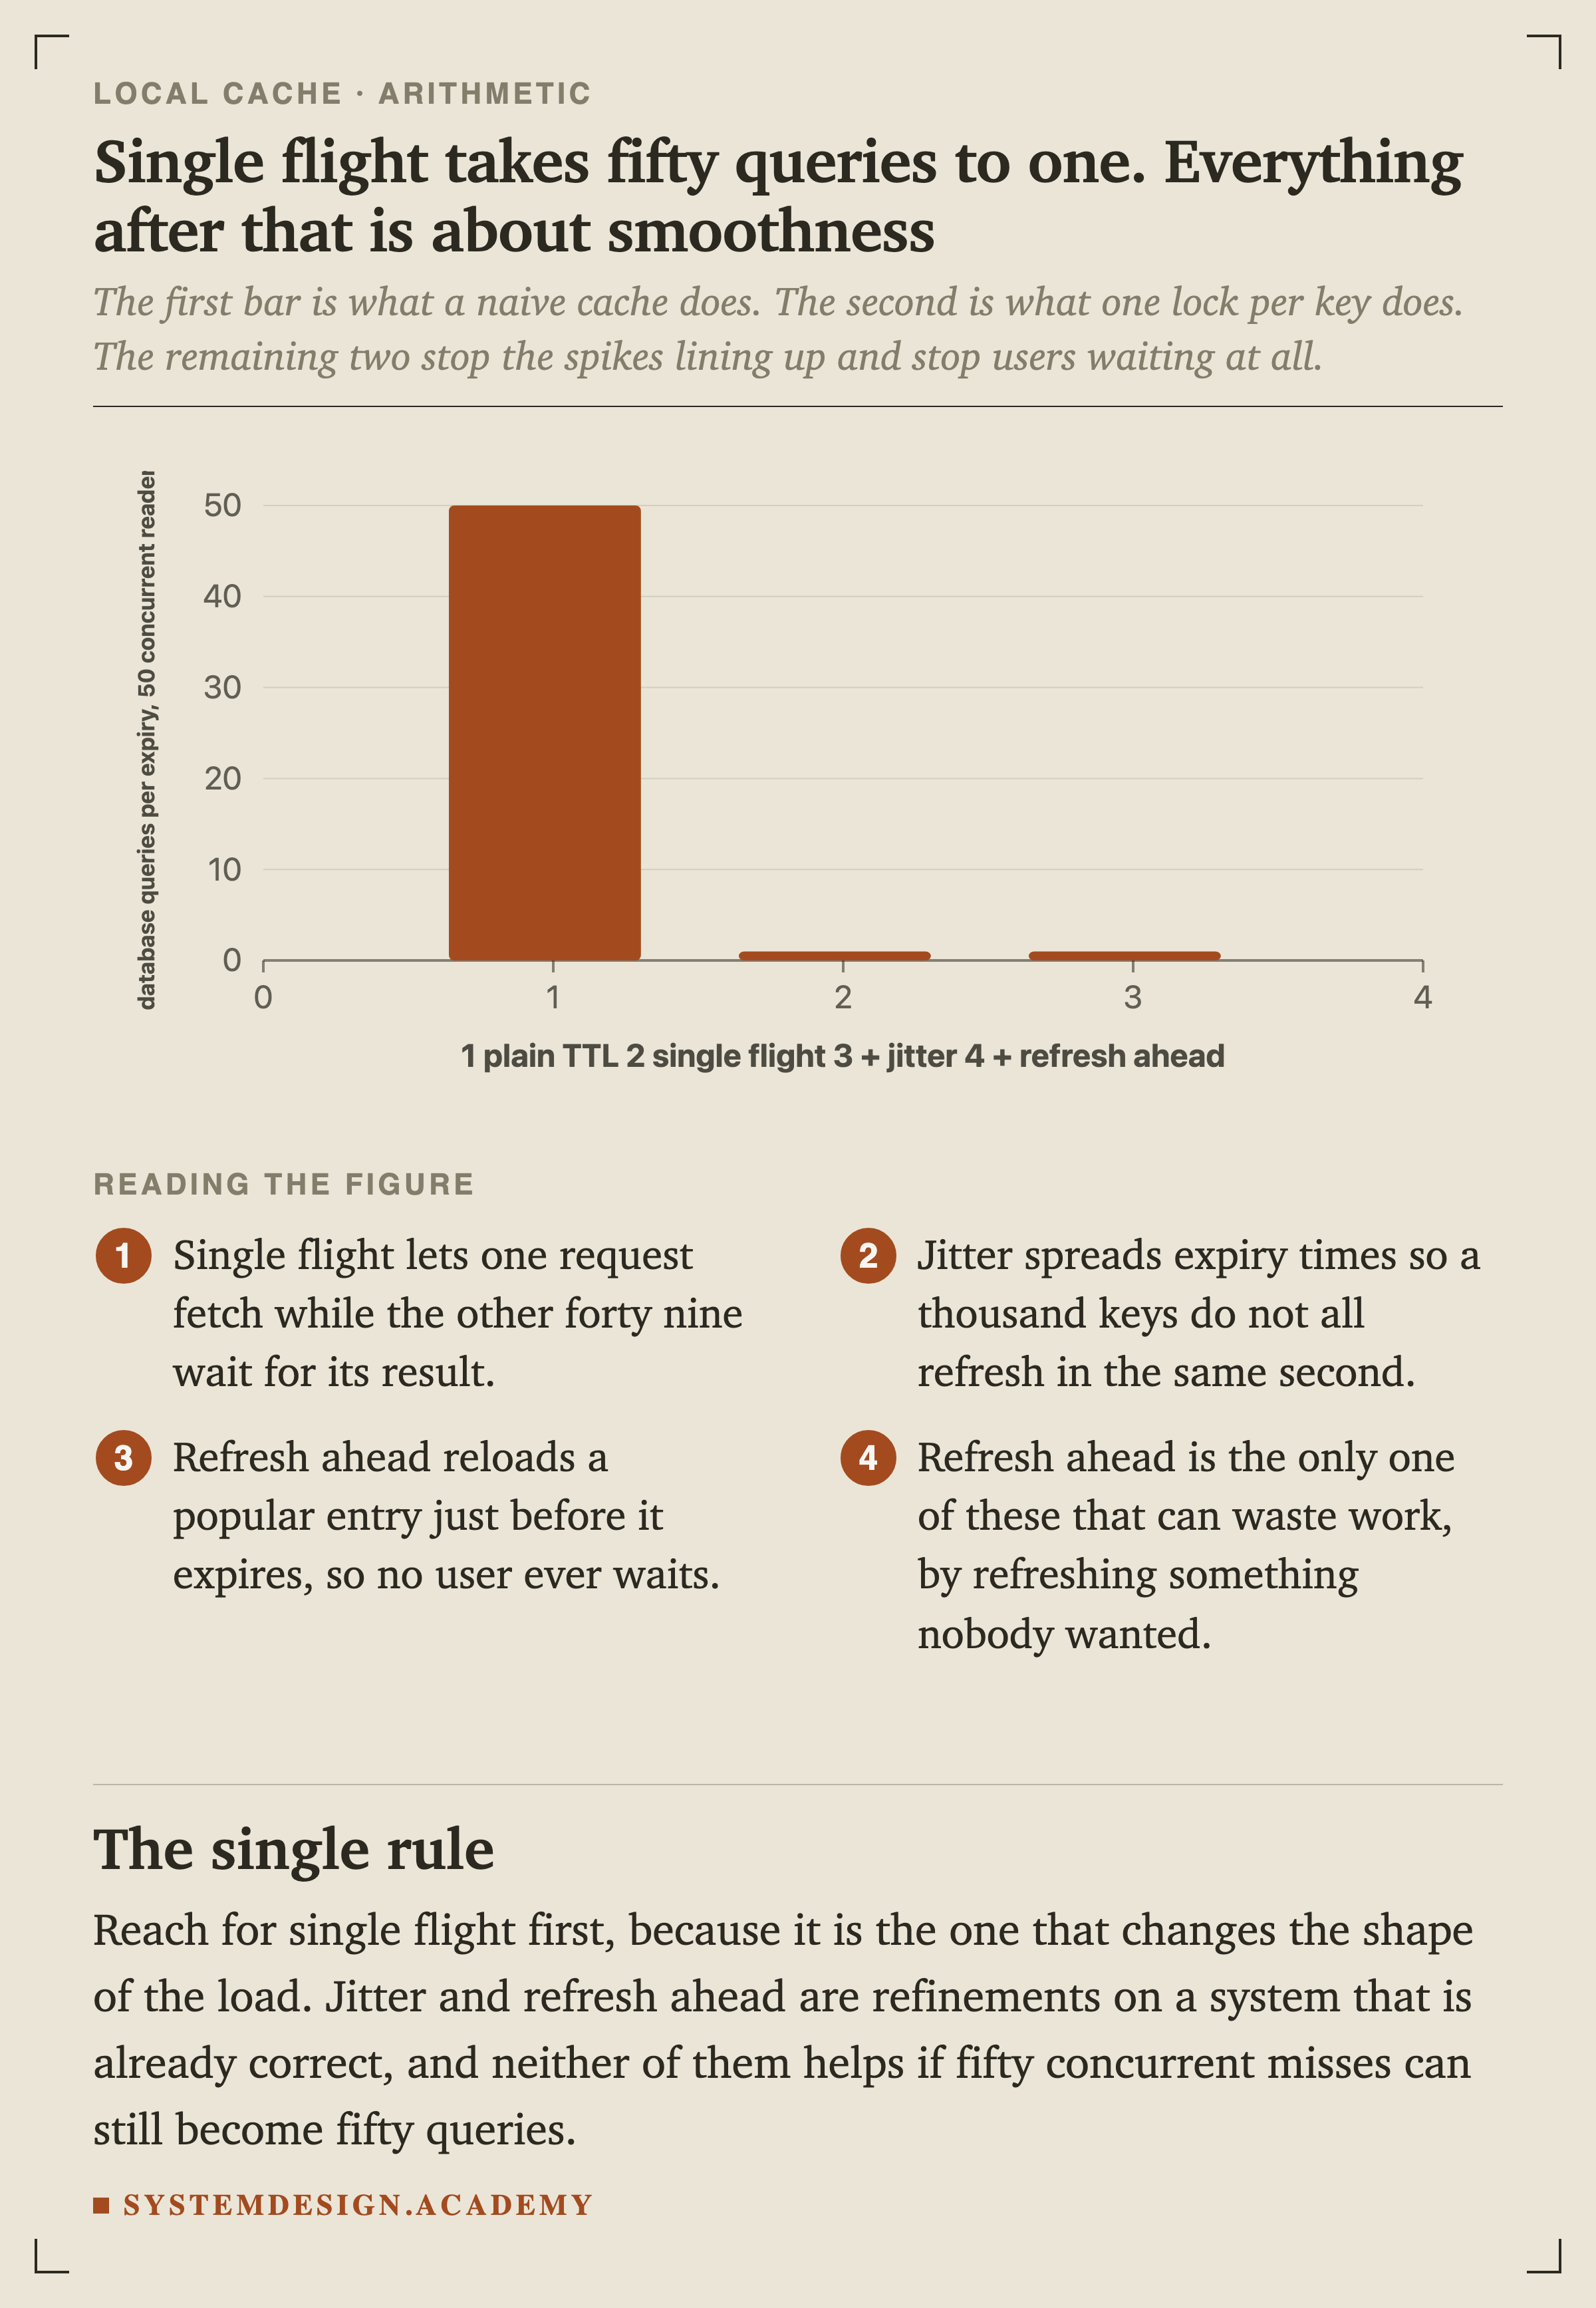
    A bar chart of database queries per expiry with 50 concurrent readers. A plain TTL produces 50. Single flight produces 1. Adding jitter produces 1. Adding refresh ahead produces 0.
    ChartFigure 9. Single flight takes fifty queries to one

    Single flight is one lock per key: the first miss fetches, and everybody else waits for its result. Most cache libraries call this single flight or cache loading, and it is the most valuable thing they provide. A hand-rolled map does not have it.
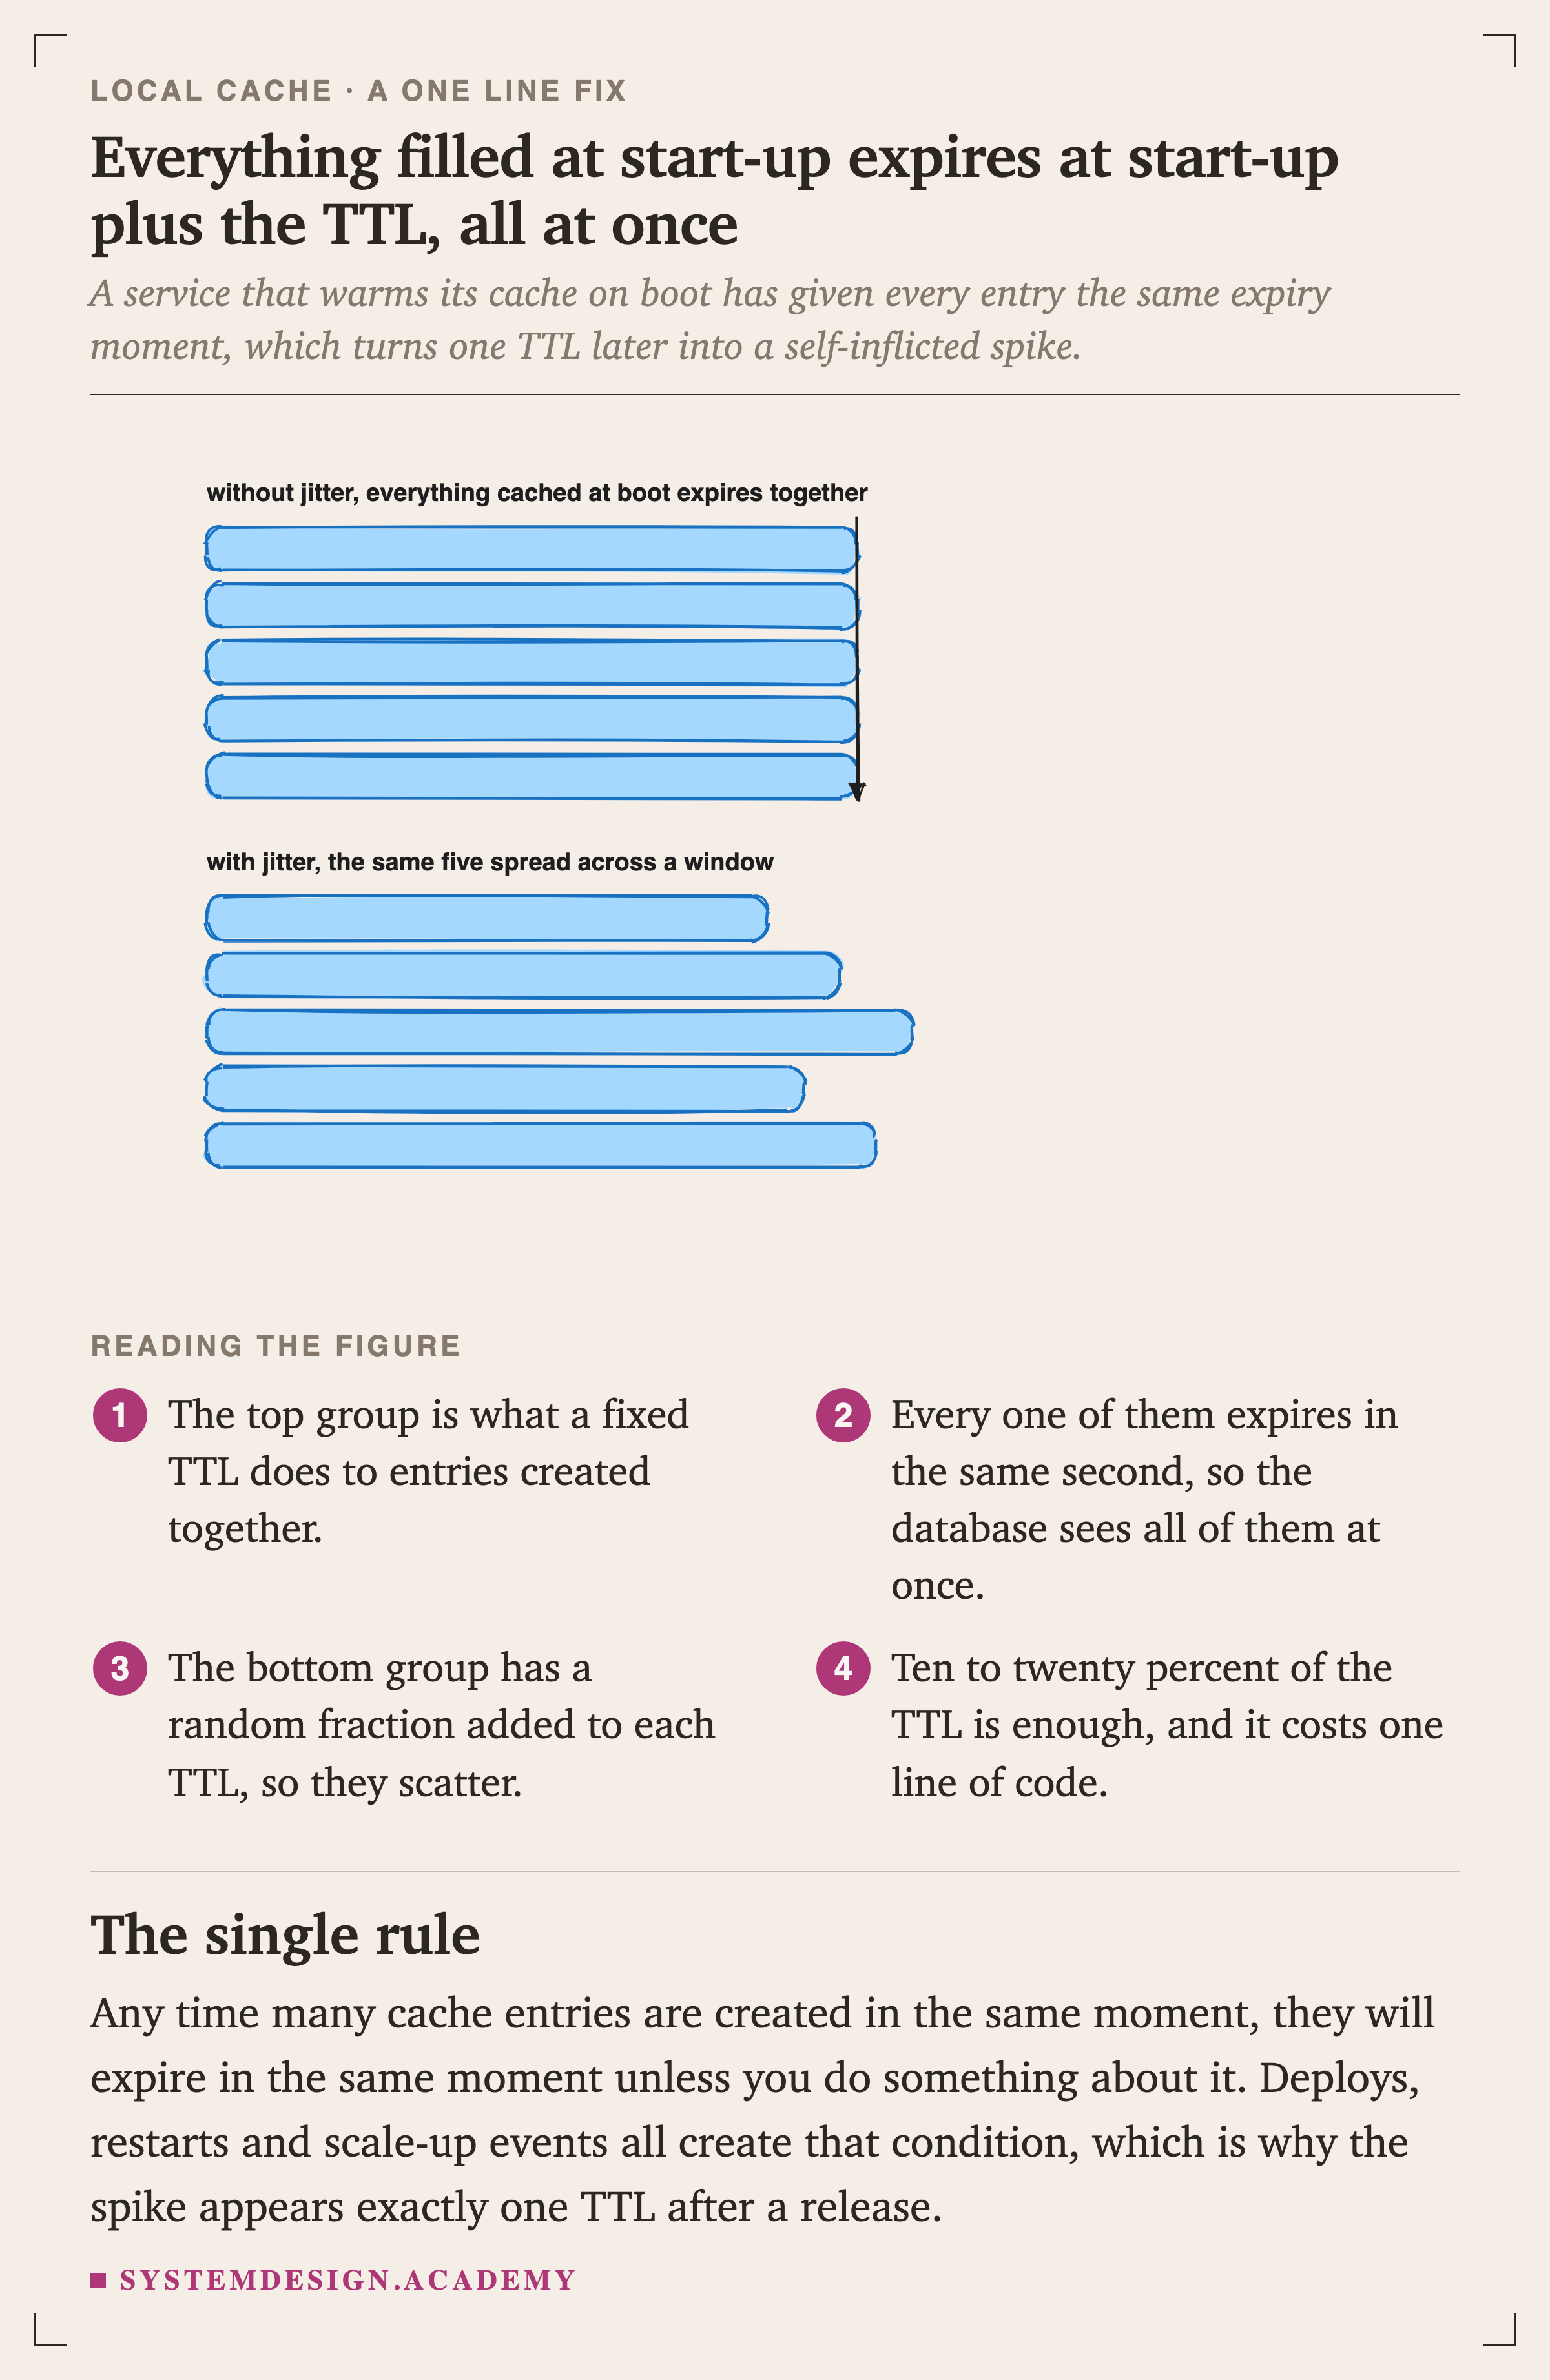
    Two hand-drawn groups of horizontal bars. The top group, labelled without jitter, shows five bars of identical length with a vertical arrow at their shared end. The bottom group, labelled with jitter, shows five bars of slightly different lengths so their ends are scattered.

    Cold Starts and Two Levels

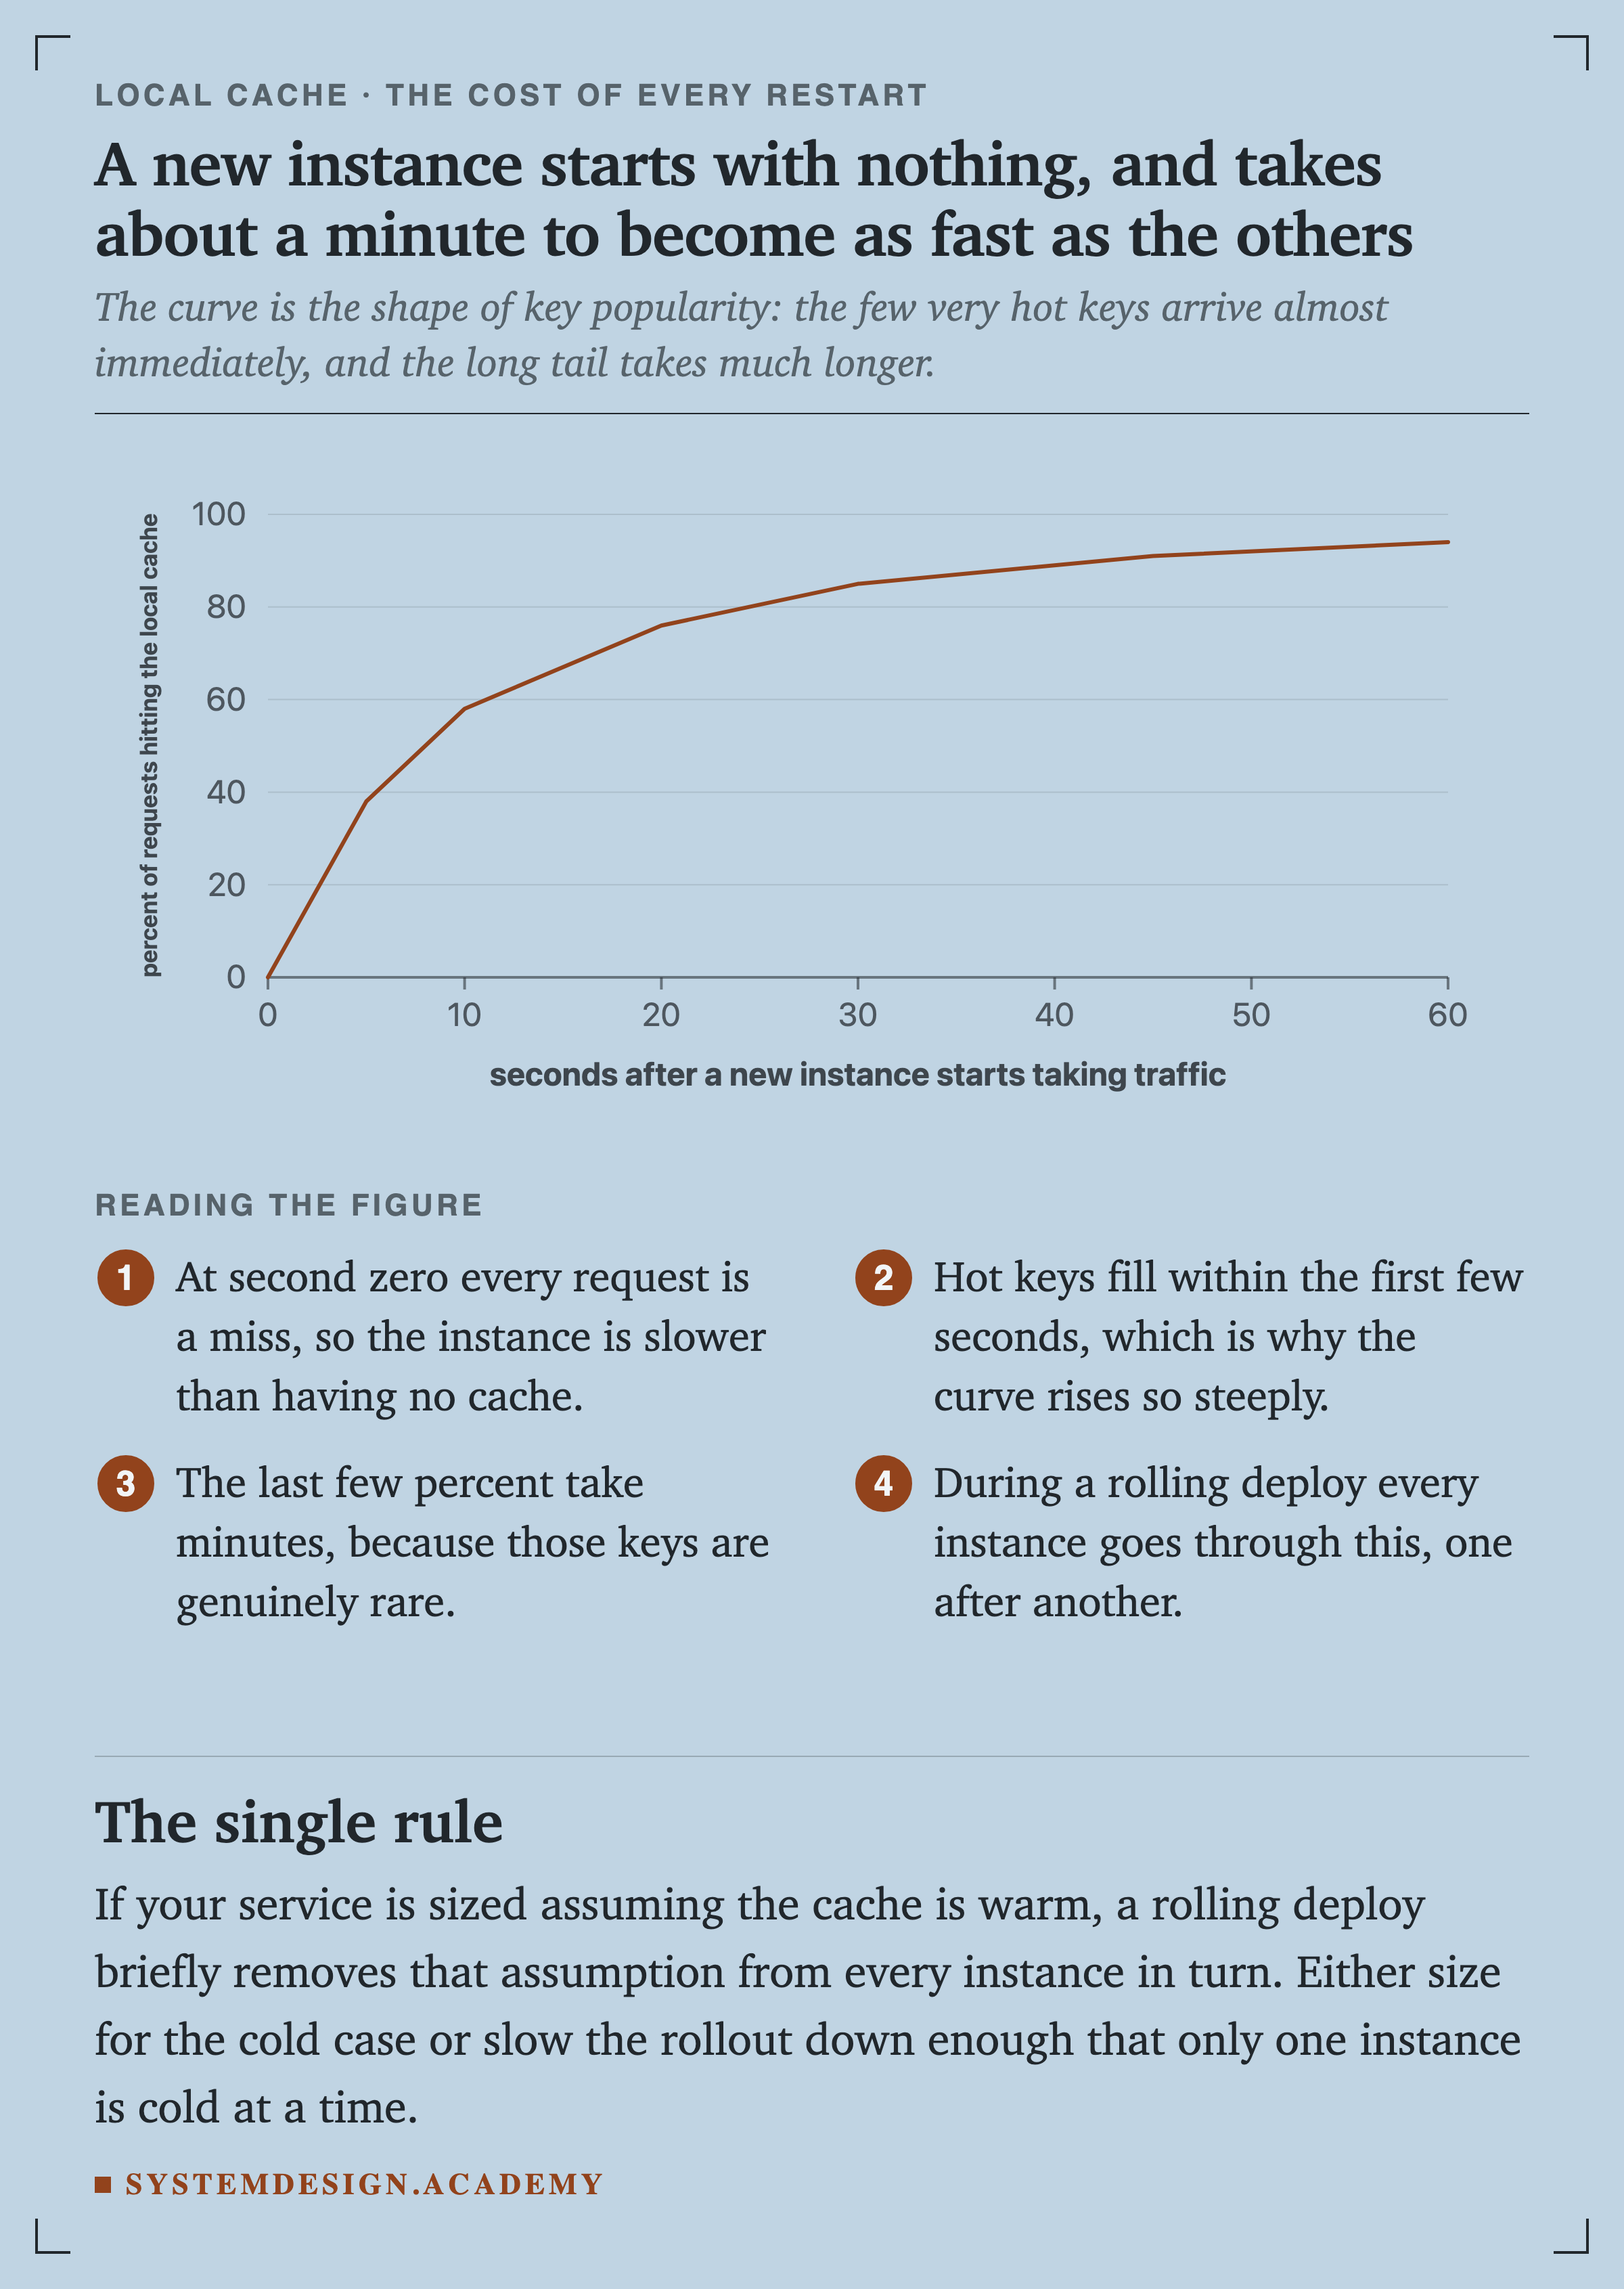
    A line chart of the percentage of requests hitting the local cache against seconds after a new instance starts taking traffic. It rises from 0 at second zero to 38 percent at 5 seconds, 58 at 10, 76 at 20, 85 at 30, 91 at 45 and 94 at 60.
    ChartFigure 11. A new instance takes about a minute to become as fast as the others

    At second zero every request is a miss, so a fresh instance is slower than having no cache at all. Hot keys fill within a few seconds, which is why the curve rises steeply, and the long tail takes minutes. During a rolling deploy every instance goes through this in turn.
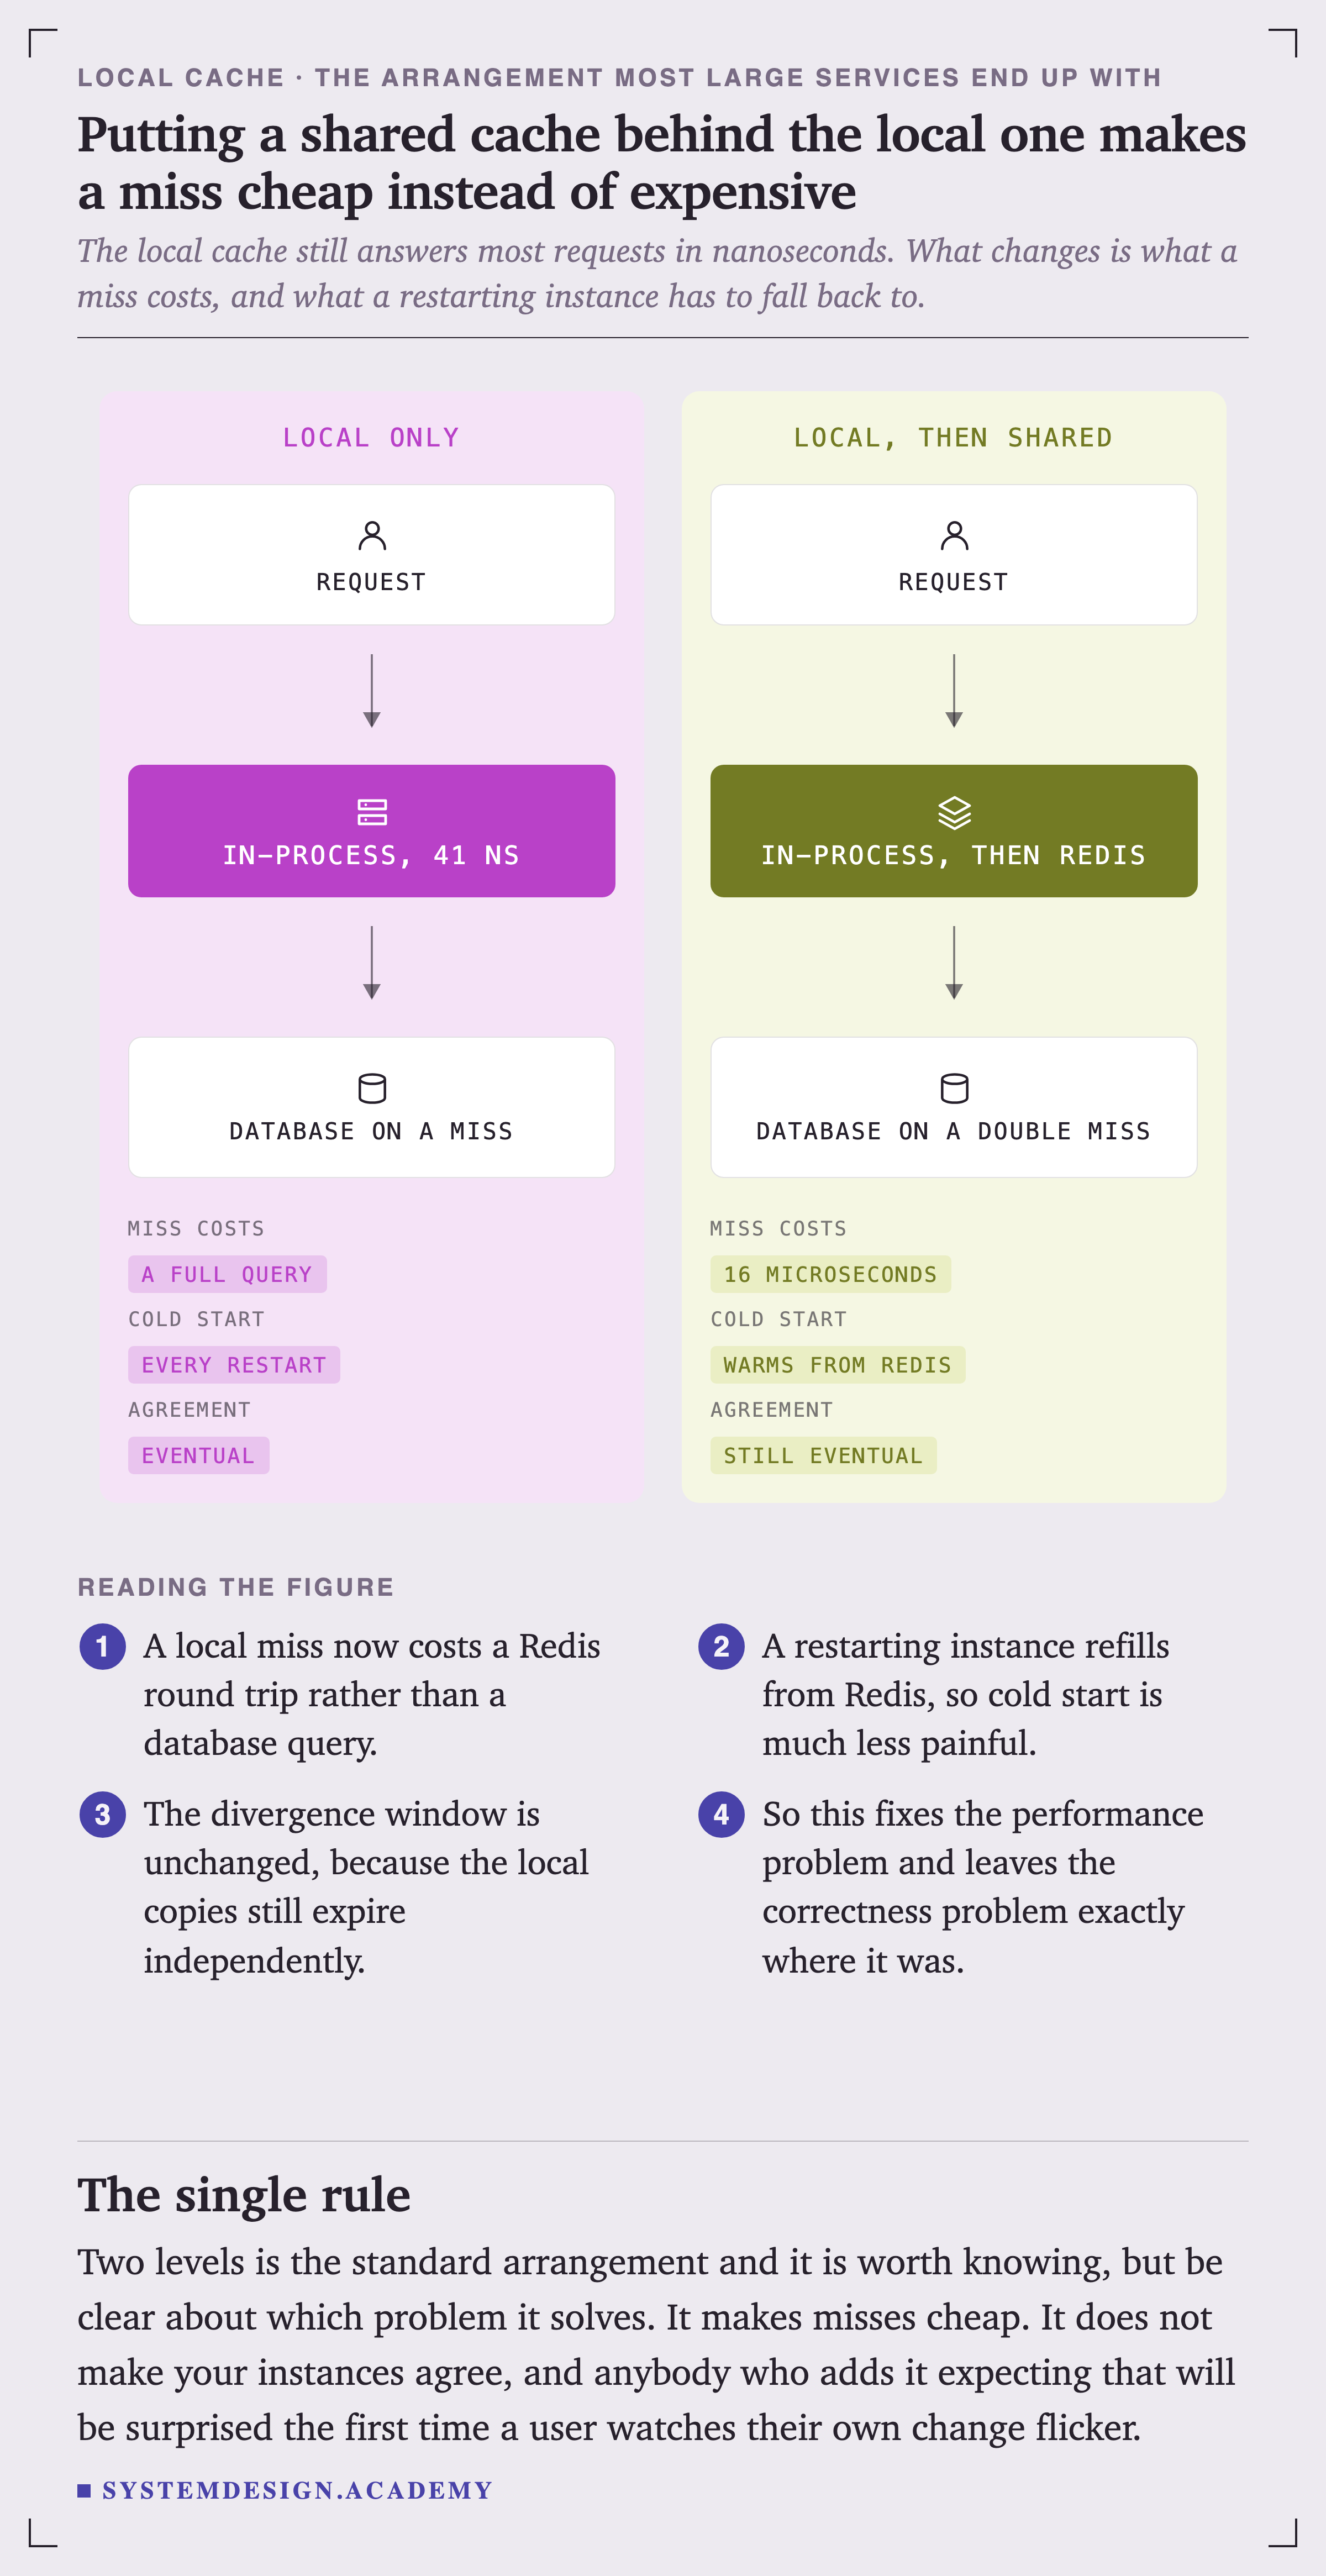
    Two panels. The left, local only, shows a request going to an in-process cache at 41 nanoseconds, then to the database on a miss. Its key reads: miss costs a full query, cold start every restart, agreement eventual. The right, local then shared, shows a request going to in-process then Redis, then to the database on a double miss. Its key reads: miss costs 16 microseconds, cold start warms from Redis, agreement still eventual.
    ComparisonFigure 12. A second level makes a miss cheap, and changes nothing about agreement

    Putting a shared cache behind the local one means a local miss costs a round trip instead of a database query, and a restarting instance refills from Redis. The divergence window is exactly where it was, because the local copies still expire independently.

    Be clear about which problem that solves. It makes misses cheap. It does not make your instances agree.

    When to Use One, and How to Size It
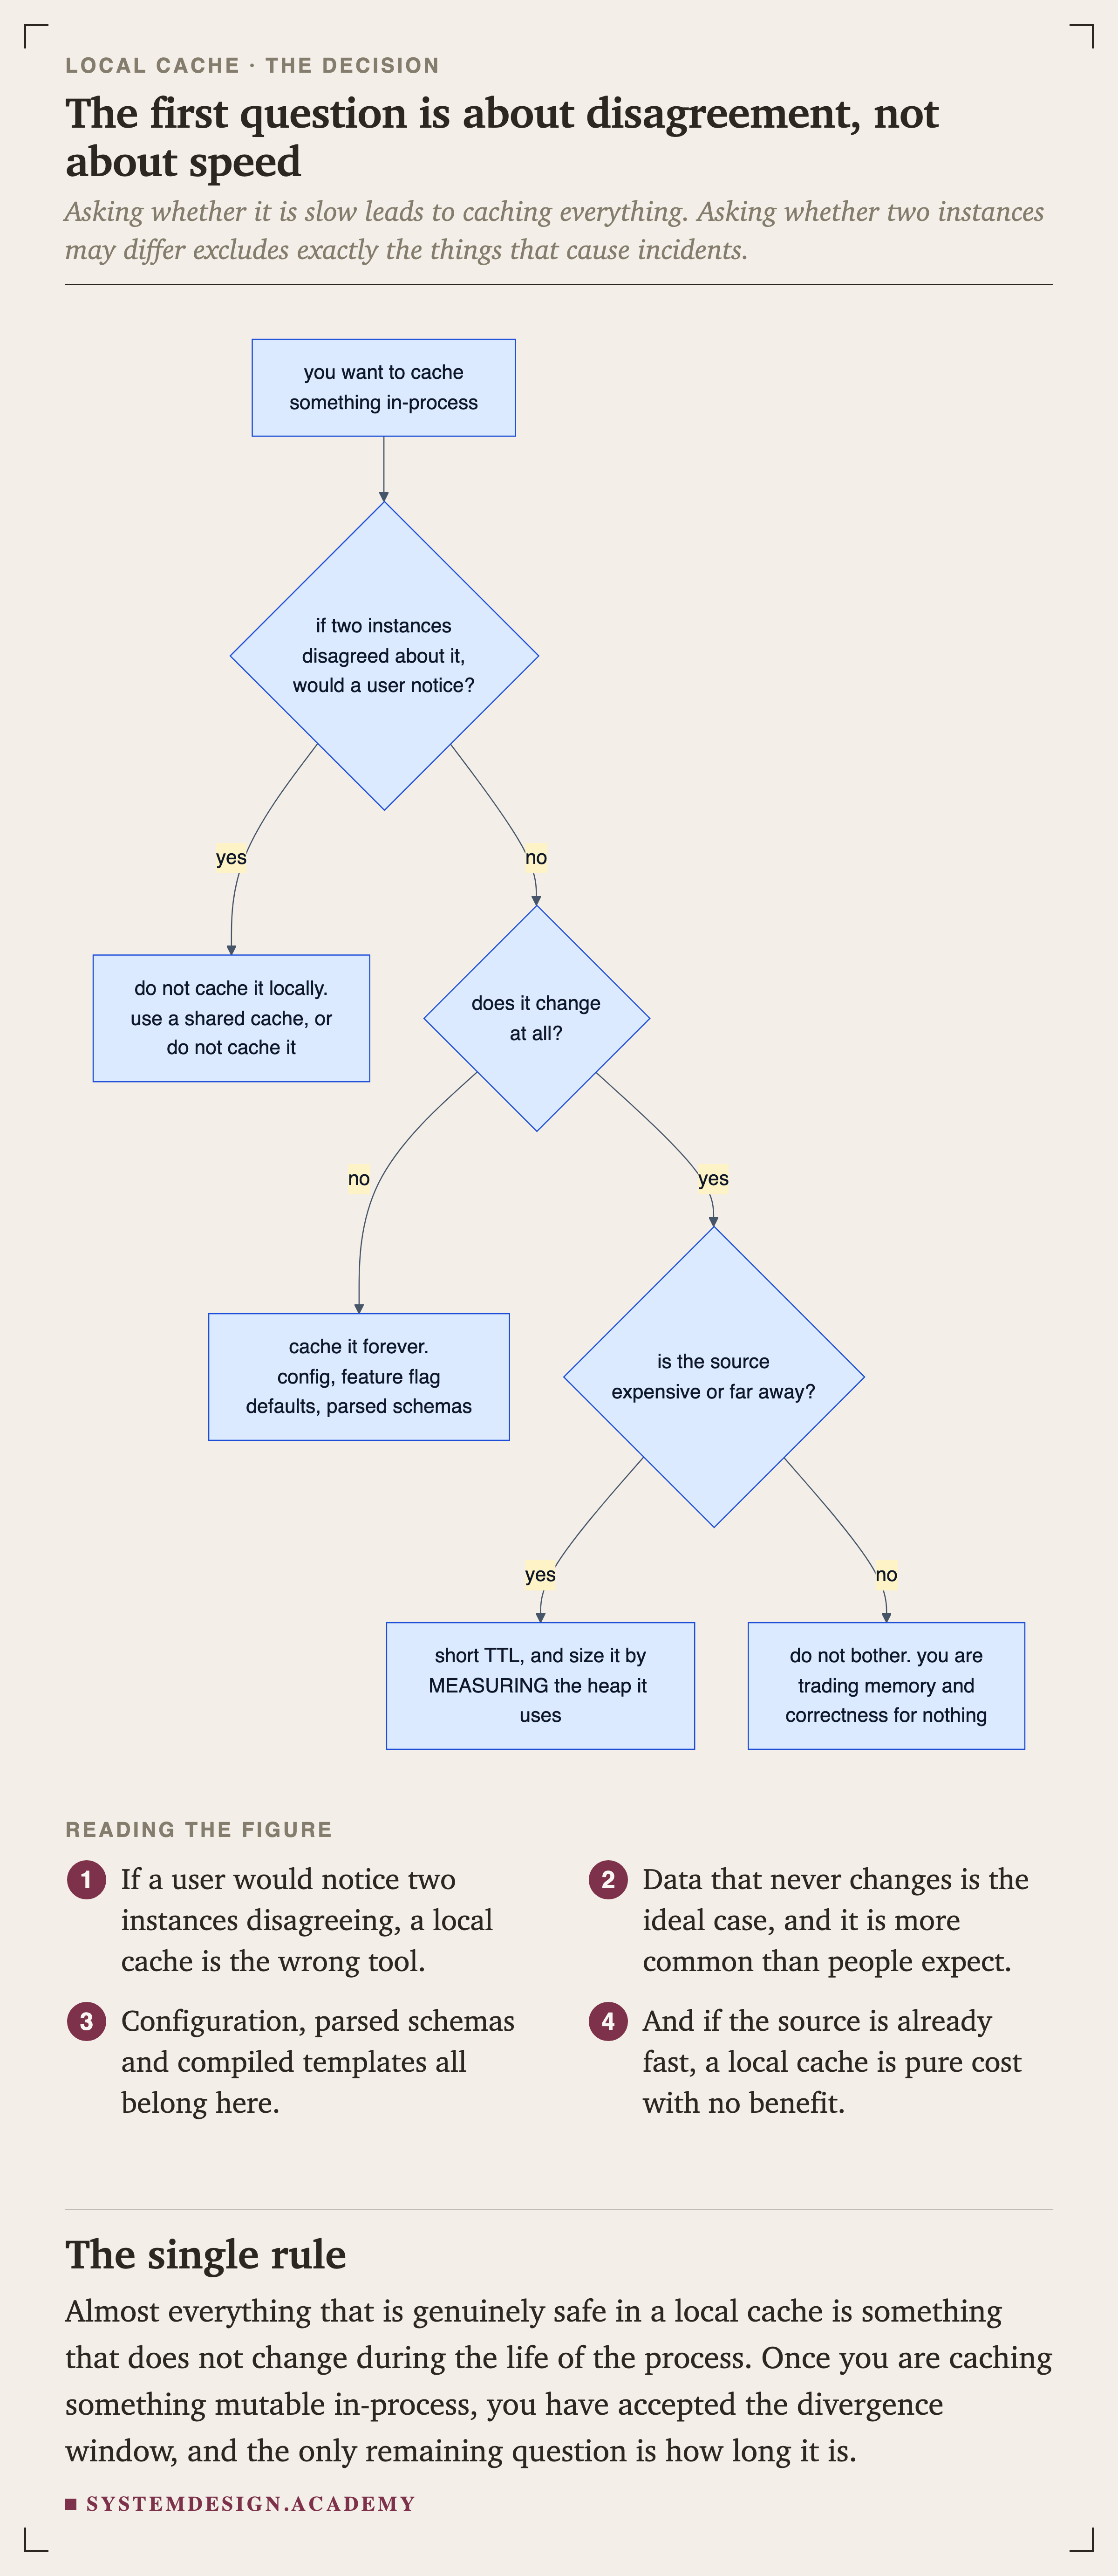
    A flowchart. Starting from wanting to cache something in-process, it asks whether a user would notice if two instances disagreed. If yes, do not cache it locally. If no, it asks whether the value changes at all. If not, cache it forever, for config, feature flag defaults and parsed schemas. If it does change, it asks whether the source is expensive or far away. If yes, use a short TTL and size it by measuring the heap it uses. If no, do not bother, because you are trading memory and correctness for nothing.
    FlowchartFigure 13. The first question is about disagreement, not about speed

    Asking whether something is slow leads to everything. Asking whether two instances may differ excludes exactly the things that cause incidents.
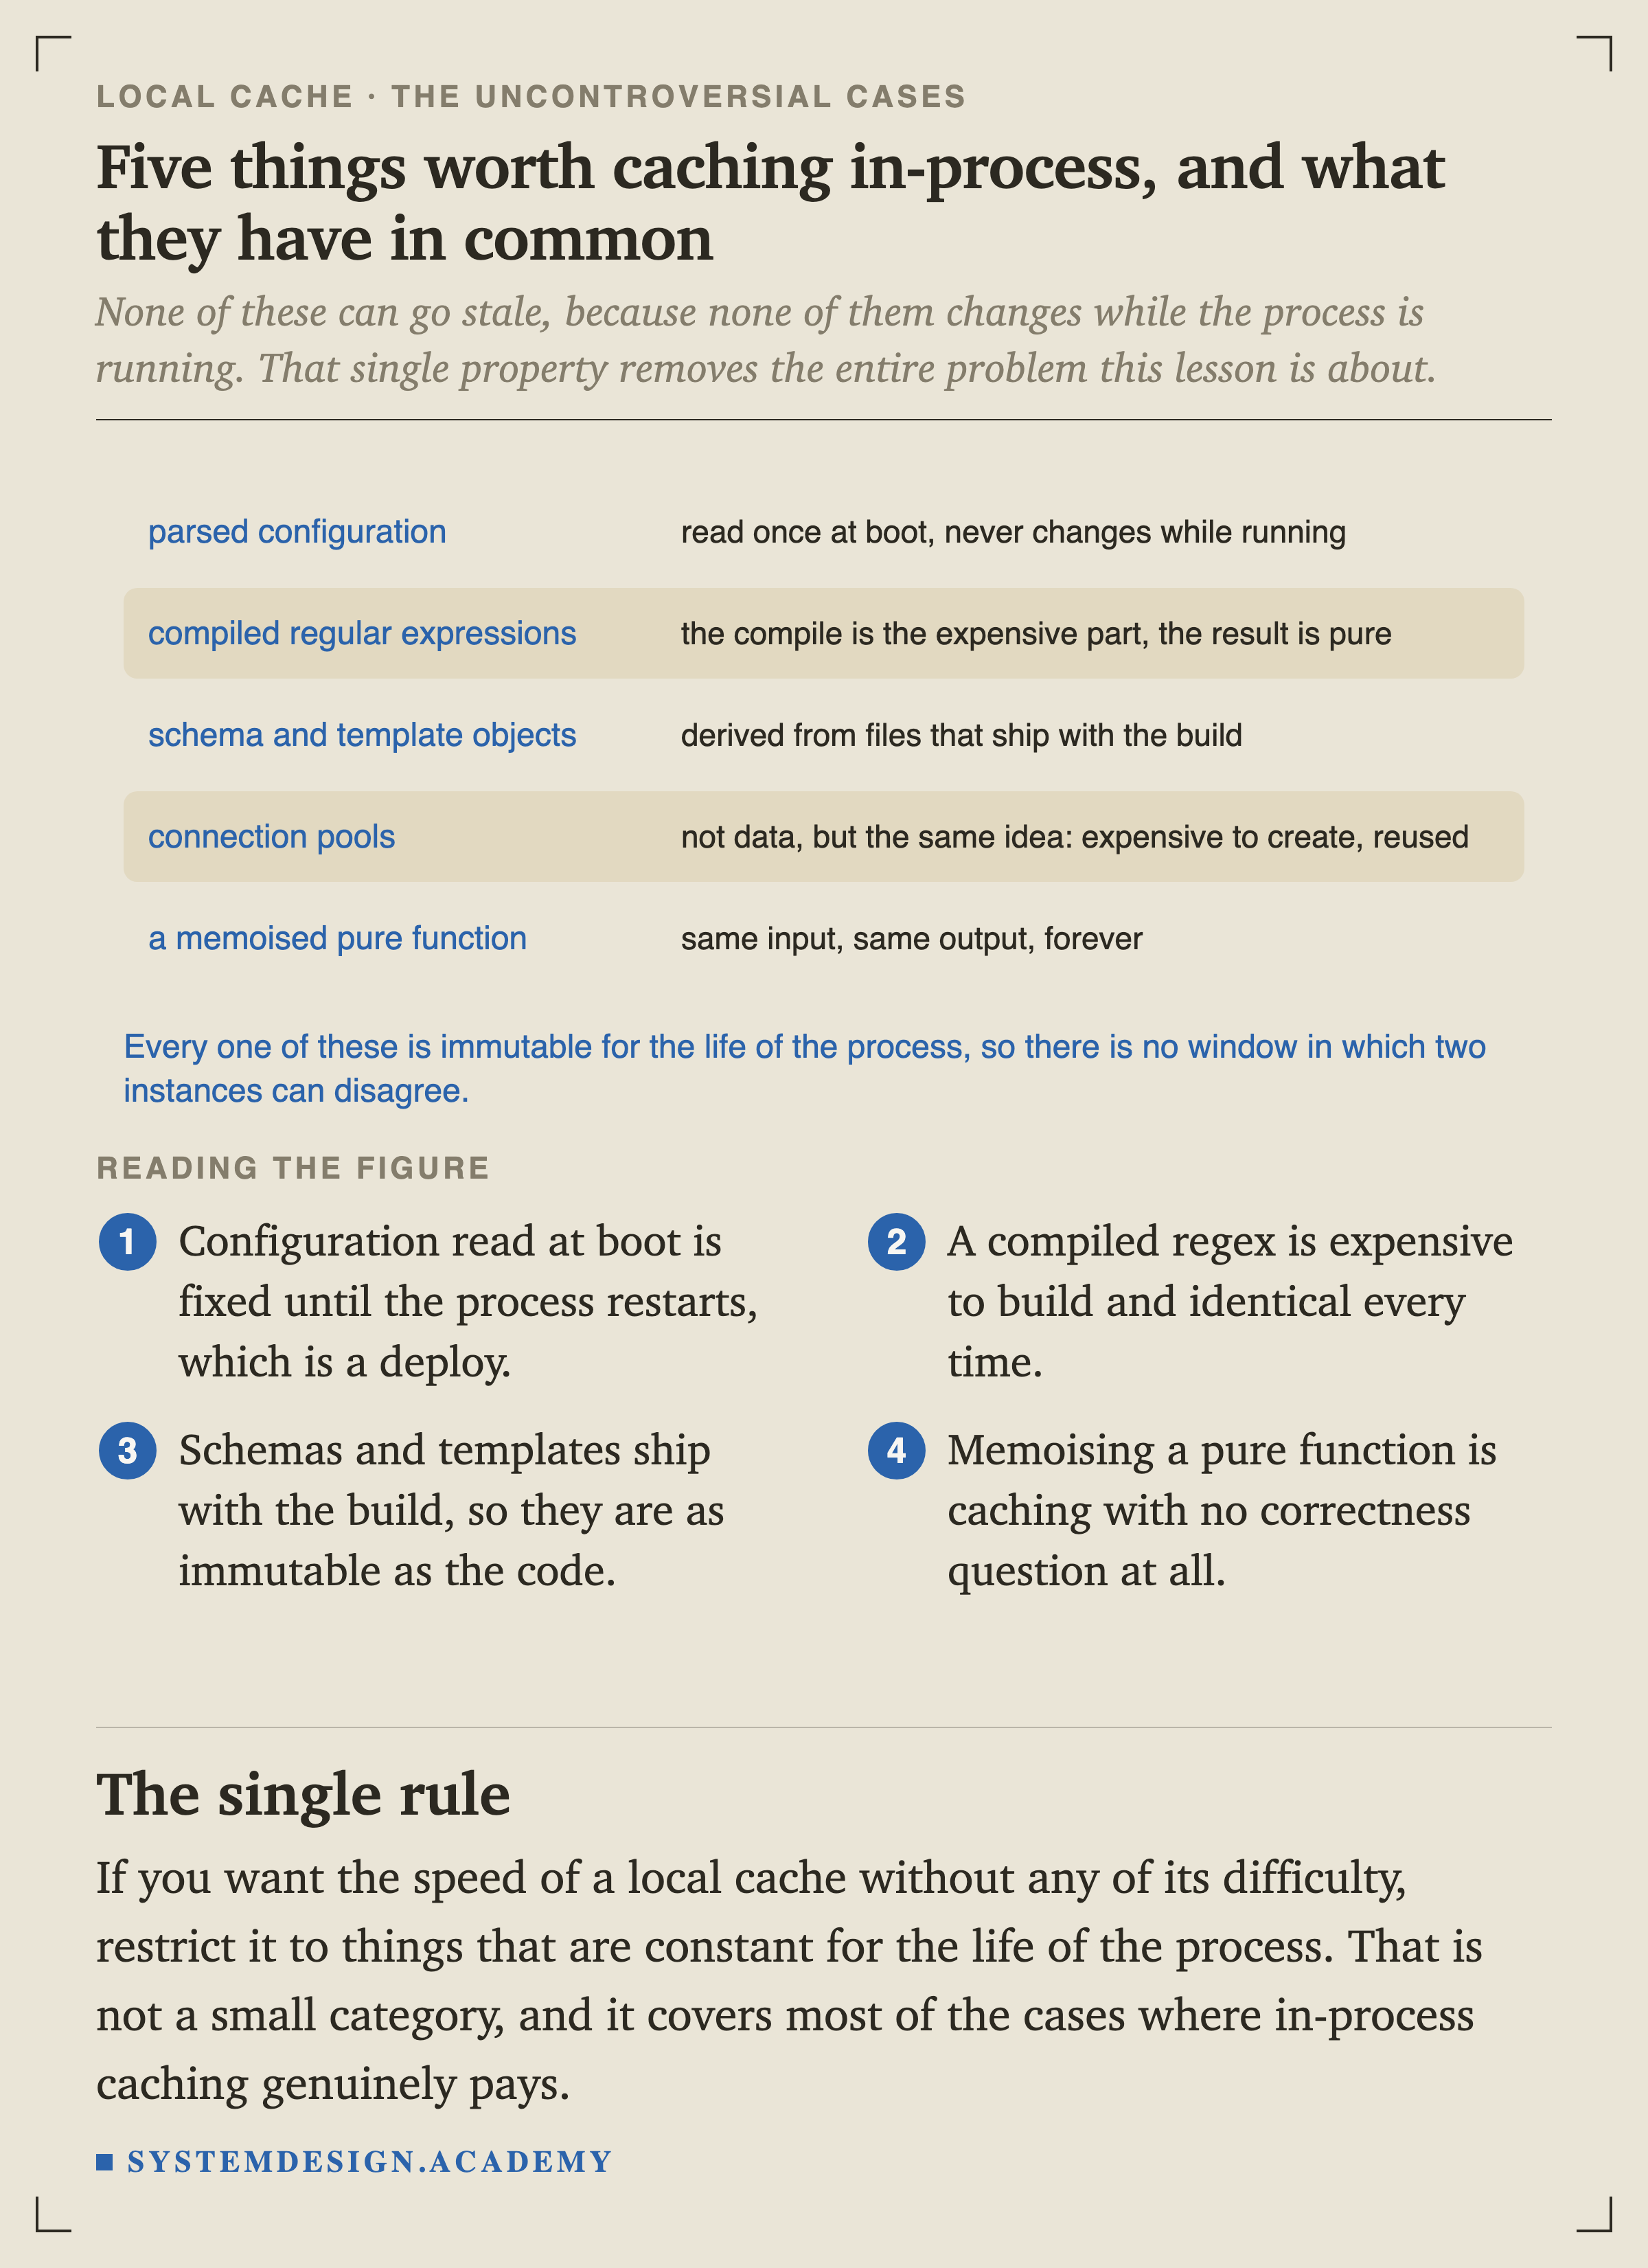
    Five rows. Parsed configuration, read once at boot and never changing while running. Compiled regular expressions, where the compile is the expensive part and the result is pure. Schema and template objects, derived from files that ship with the build. Connection pools, not data but the same idea. A memoised pure function, same input and same output forever. A closing line reads that every one of these is immutable for the life of the process, so there is no window in which two instances can disagree.
    FigureFigure 14. Five things worth caching in-process, and what they have in common

    None of these can go stale, because none of them changes while the process is running. That single property removes the entire problem this lesson is about, and it covers most of the cases where in-process caching genuinely pays.

    Quick Check

    Knowledge Check

    4 questions - Score 80% to pass

    Q1

    You run 16 instances, each with a 60 second local cache TTL. A value changes. How long until every instance is serving the new value?

    Q2

    A dict lookup measured 41 nanoseconds and a Redis GET on the same machine measured 16,122. What is that gap mostly made of?

    Q3

    Your cache holds 50,000 entries, each a small object with an id and two short strings. How much memory should you budget?

    Q4

    A hot key expires and 50 concurrent requests all miss. What happens with a plain TTL cache, and what fixes it?
    So scaling out for capacity lengthens the window in which your users disagree with each other, and nothing in the deployment mentions it.

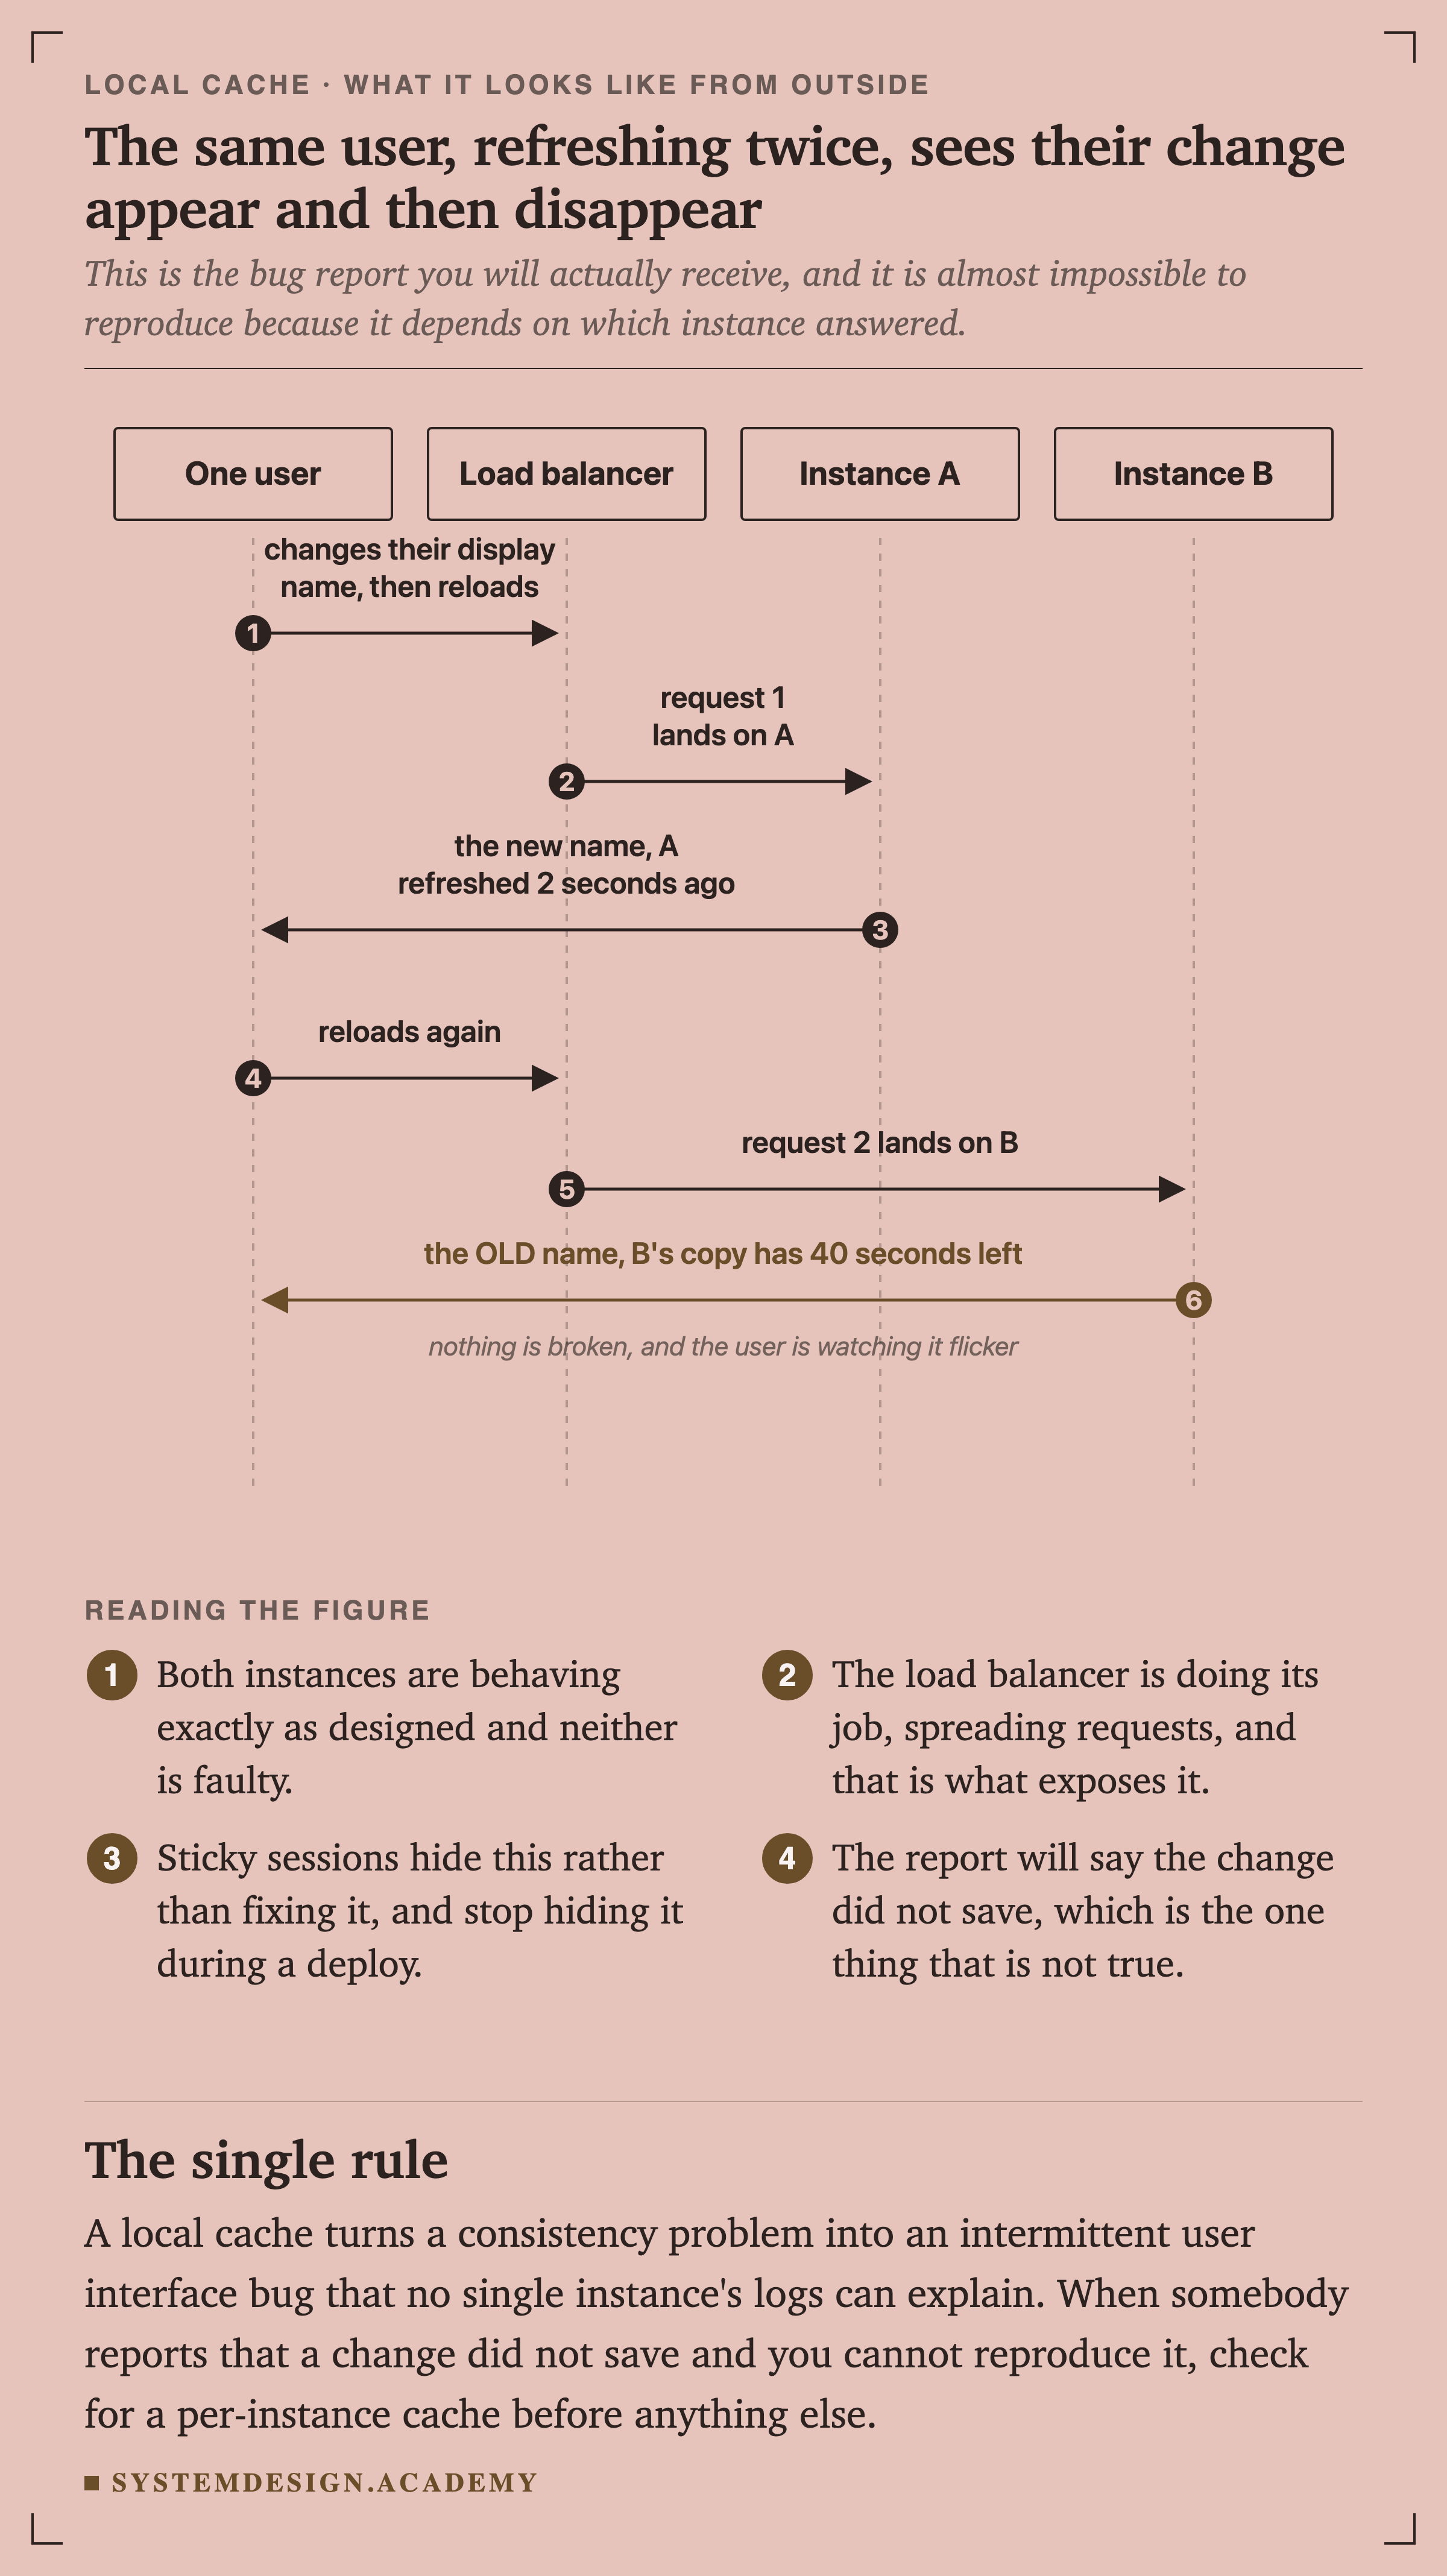
    A sequence diagram with four lifelines: one user, the load balancer, instance A and instance B. The user changes their display name and reloads. Request 1 lands on A, which returns the new name because A refreshed 2 seconds ago. The user reloads again. Request 2 lands on B, which returns the old name because B's copy has 40 seconds left, noted as nothing is broken and the user is watching it flicker.
    SequenceFigure 7. The same user, refreshing twice, sees their change appear and then disappear

    This is the bug report you will actually receive, and it is close to impossible to reproduce because it depends on which instance answered. Both instances are behaving exactly as designed. The doing its job is what exposes it.

    The report will say the change did not save, which is the one thing that is not true.

    SketchFigure 10. Everything filled at start-up expires at start-up plus the TTL

    A service that warms its cache on boot has given every entry the same expiry moment. Adding a random ten to twenty percent to each TTL scatters them, and it costs one line of code. This is why a load spike appears exactly one TTL after a release.

    after “Expiry Is Not a Gentle Event”

    This is the part interviews go deep on.

    In the System Design course, the next step is Time To Live (TTL).

    About 24 minutes, and you can stop and come back any time.

    Open the System Design course page
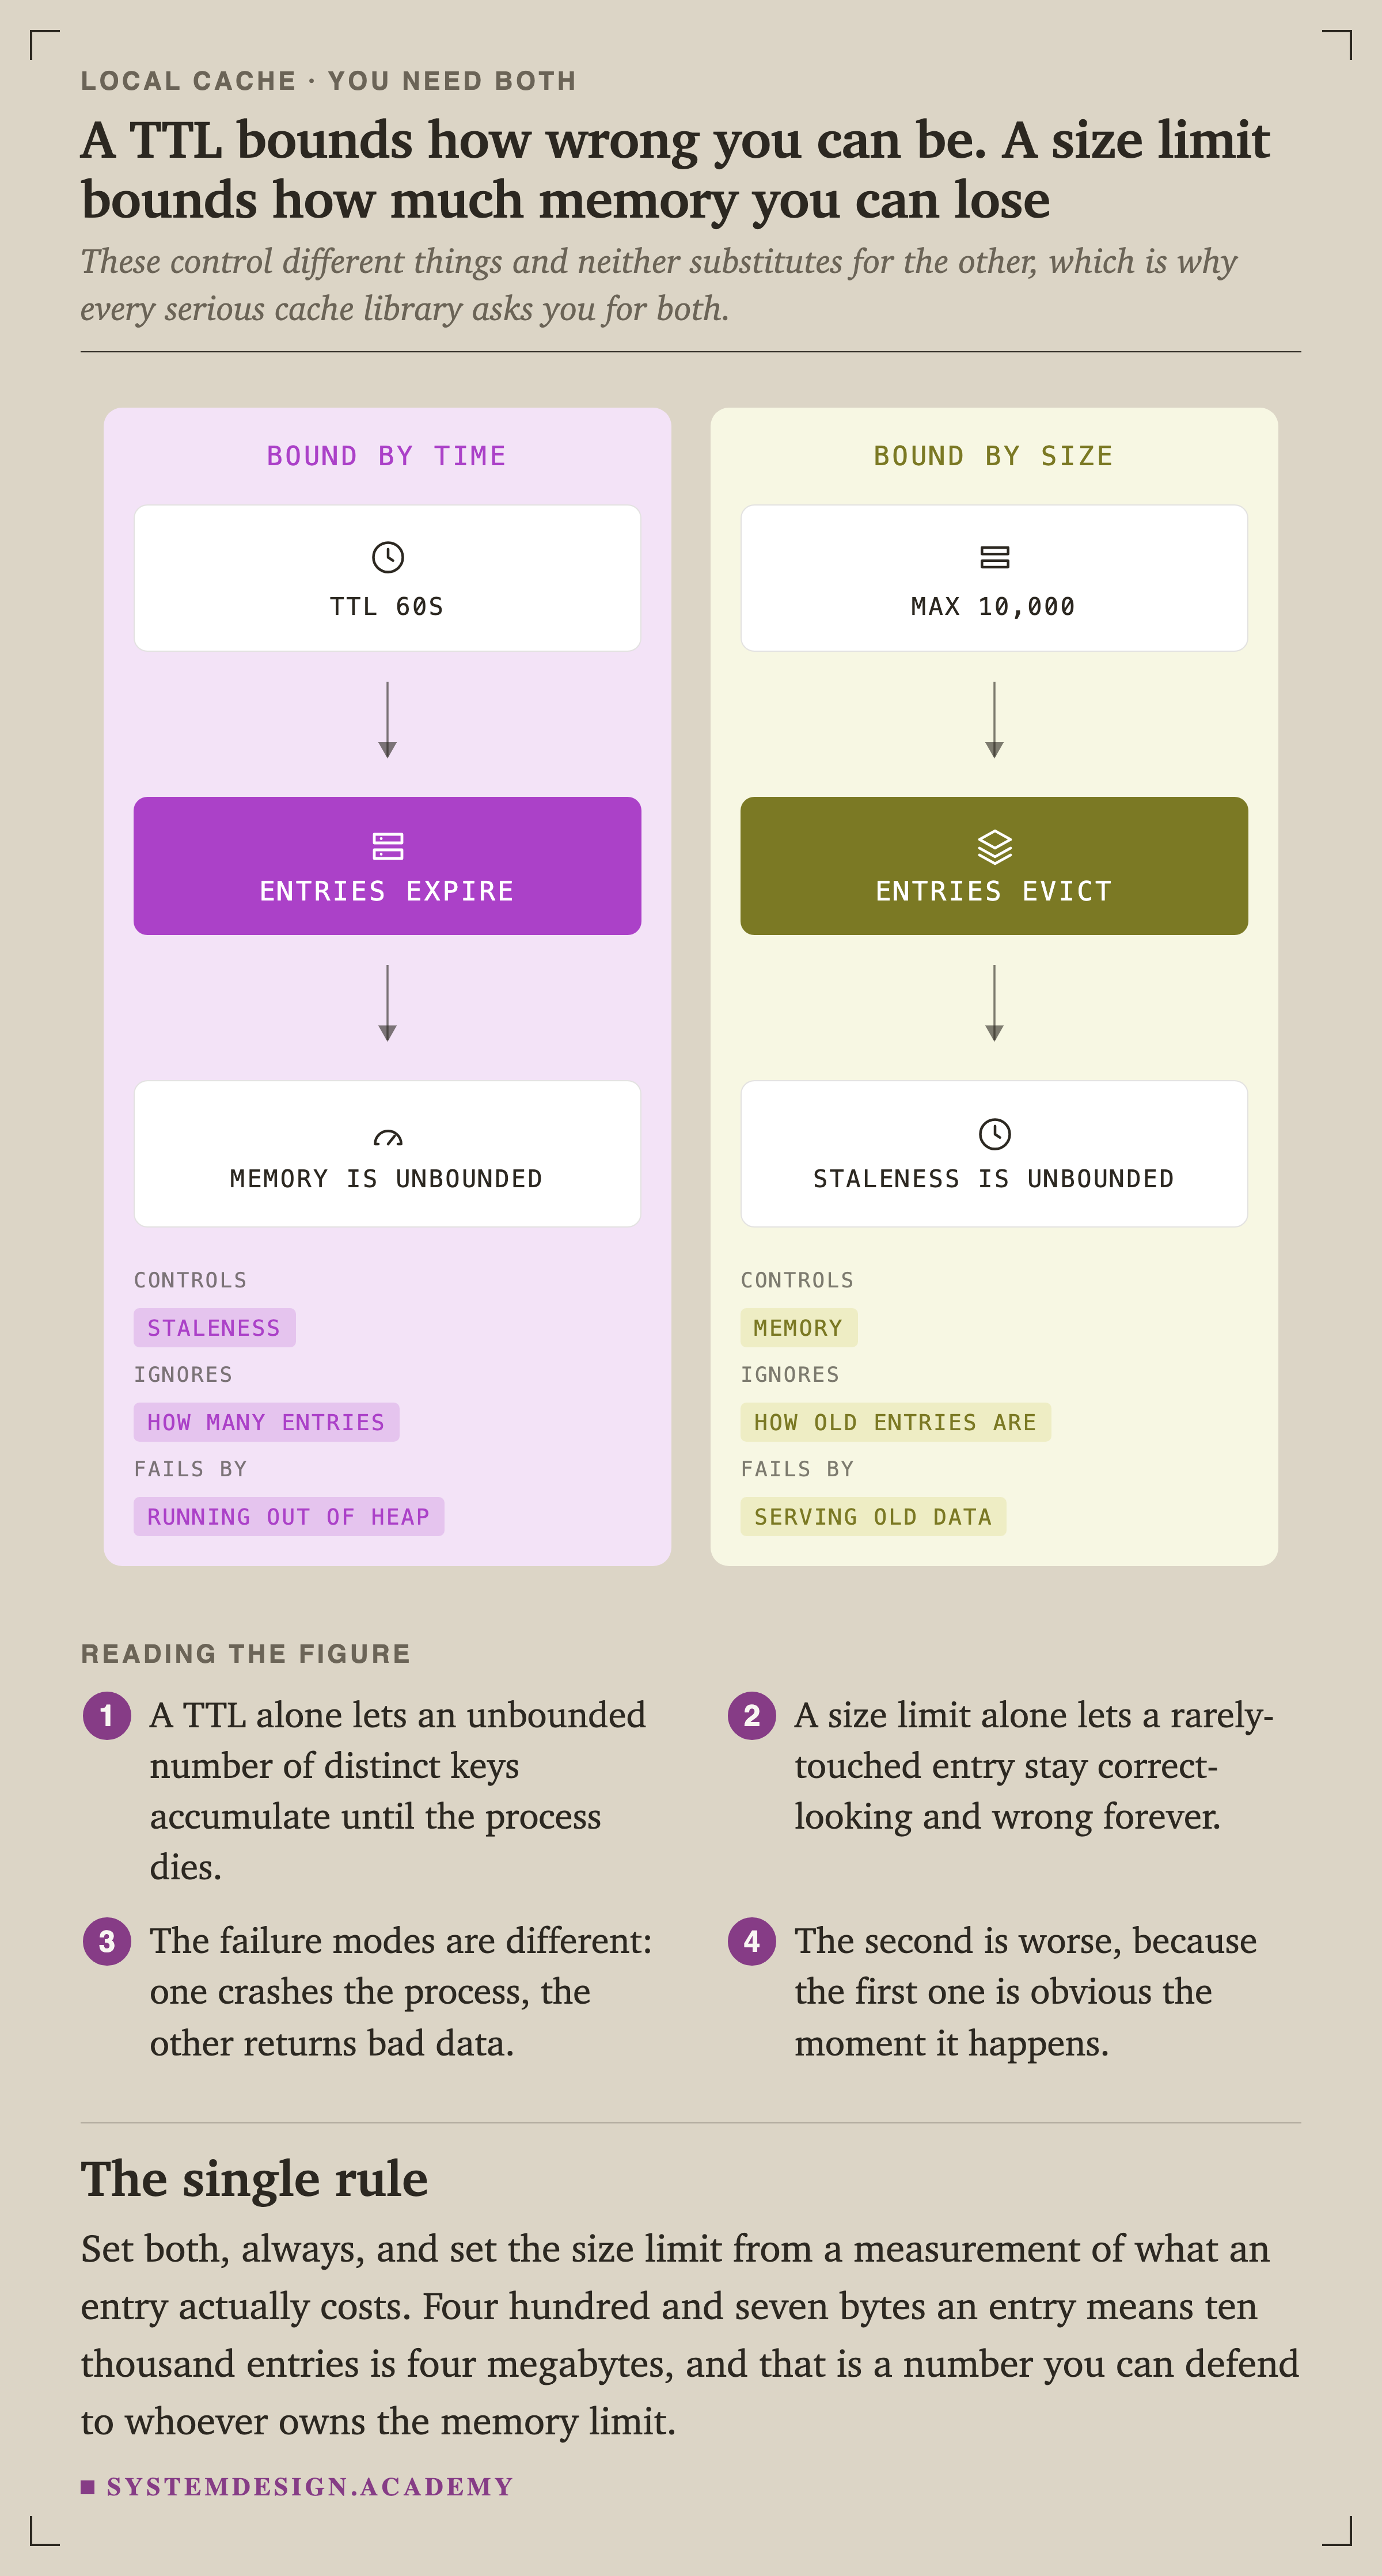
    Two panels. The left, bound by time, shows a TTL of 60 seconds feeding a bar reading entries expire, then a box reading memory is unbounded. Its key reads: controls staleness, ignores how many entries, fails by running out of heap. The right, bound by size, shows a maximum of 10,000 feeding a bar reading entries evict, then a box reading staleness is unbounded. Its key reads: controls memory, ignores how old entries are, fails by serving old data.
    ComparisonFigure 15. A TTL bounds how wrong you can be, and a size limit bounds how much memory you can lose

    These control different things and neither substitutes for the other, which is why every serious cache library asks for both. The failure modes differ too: one crashes the process, the other quietly returns bad data, and the second is worse because the first is obvious.

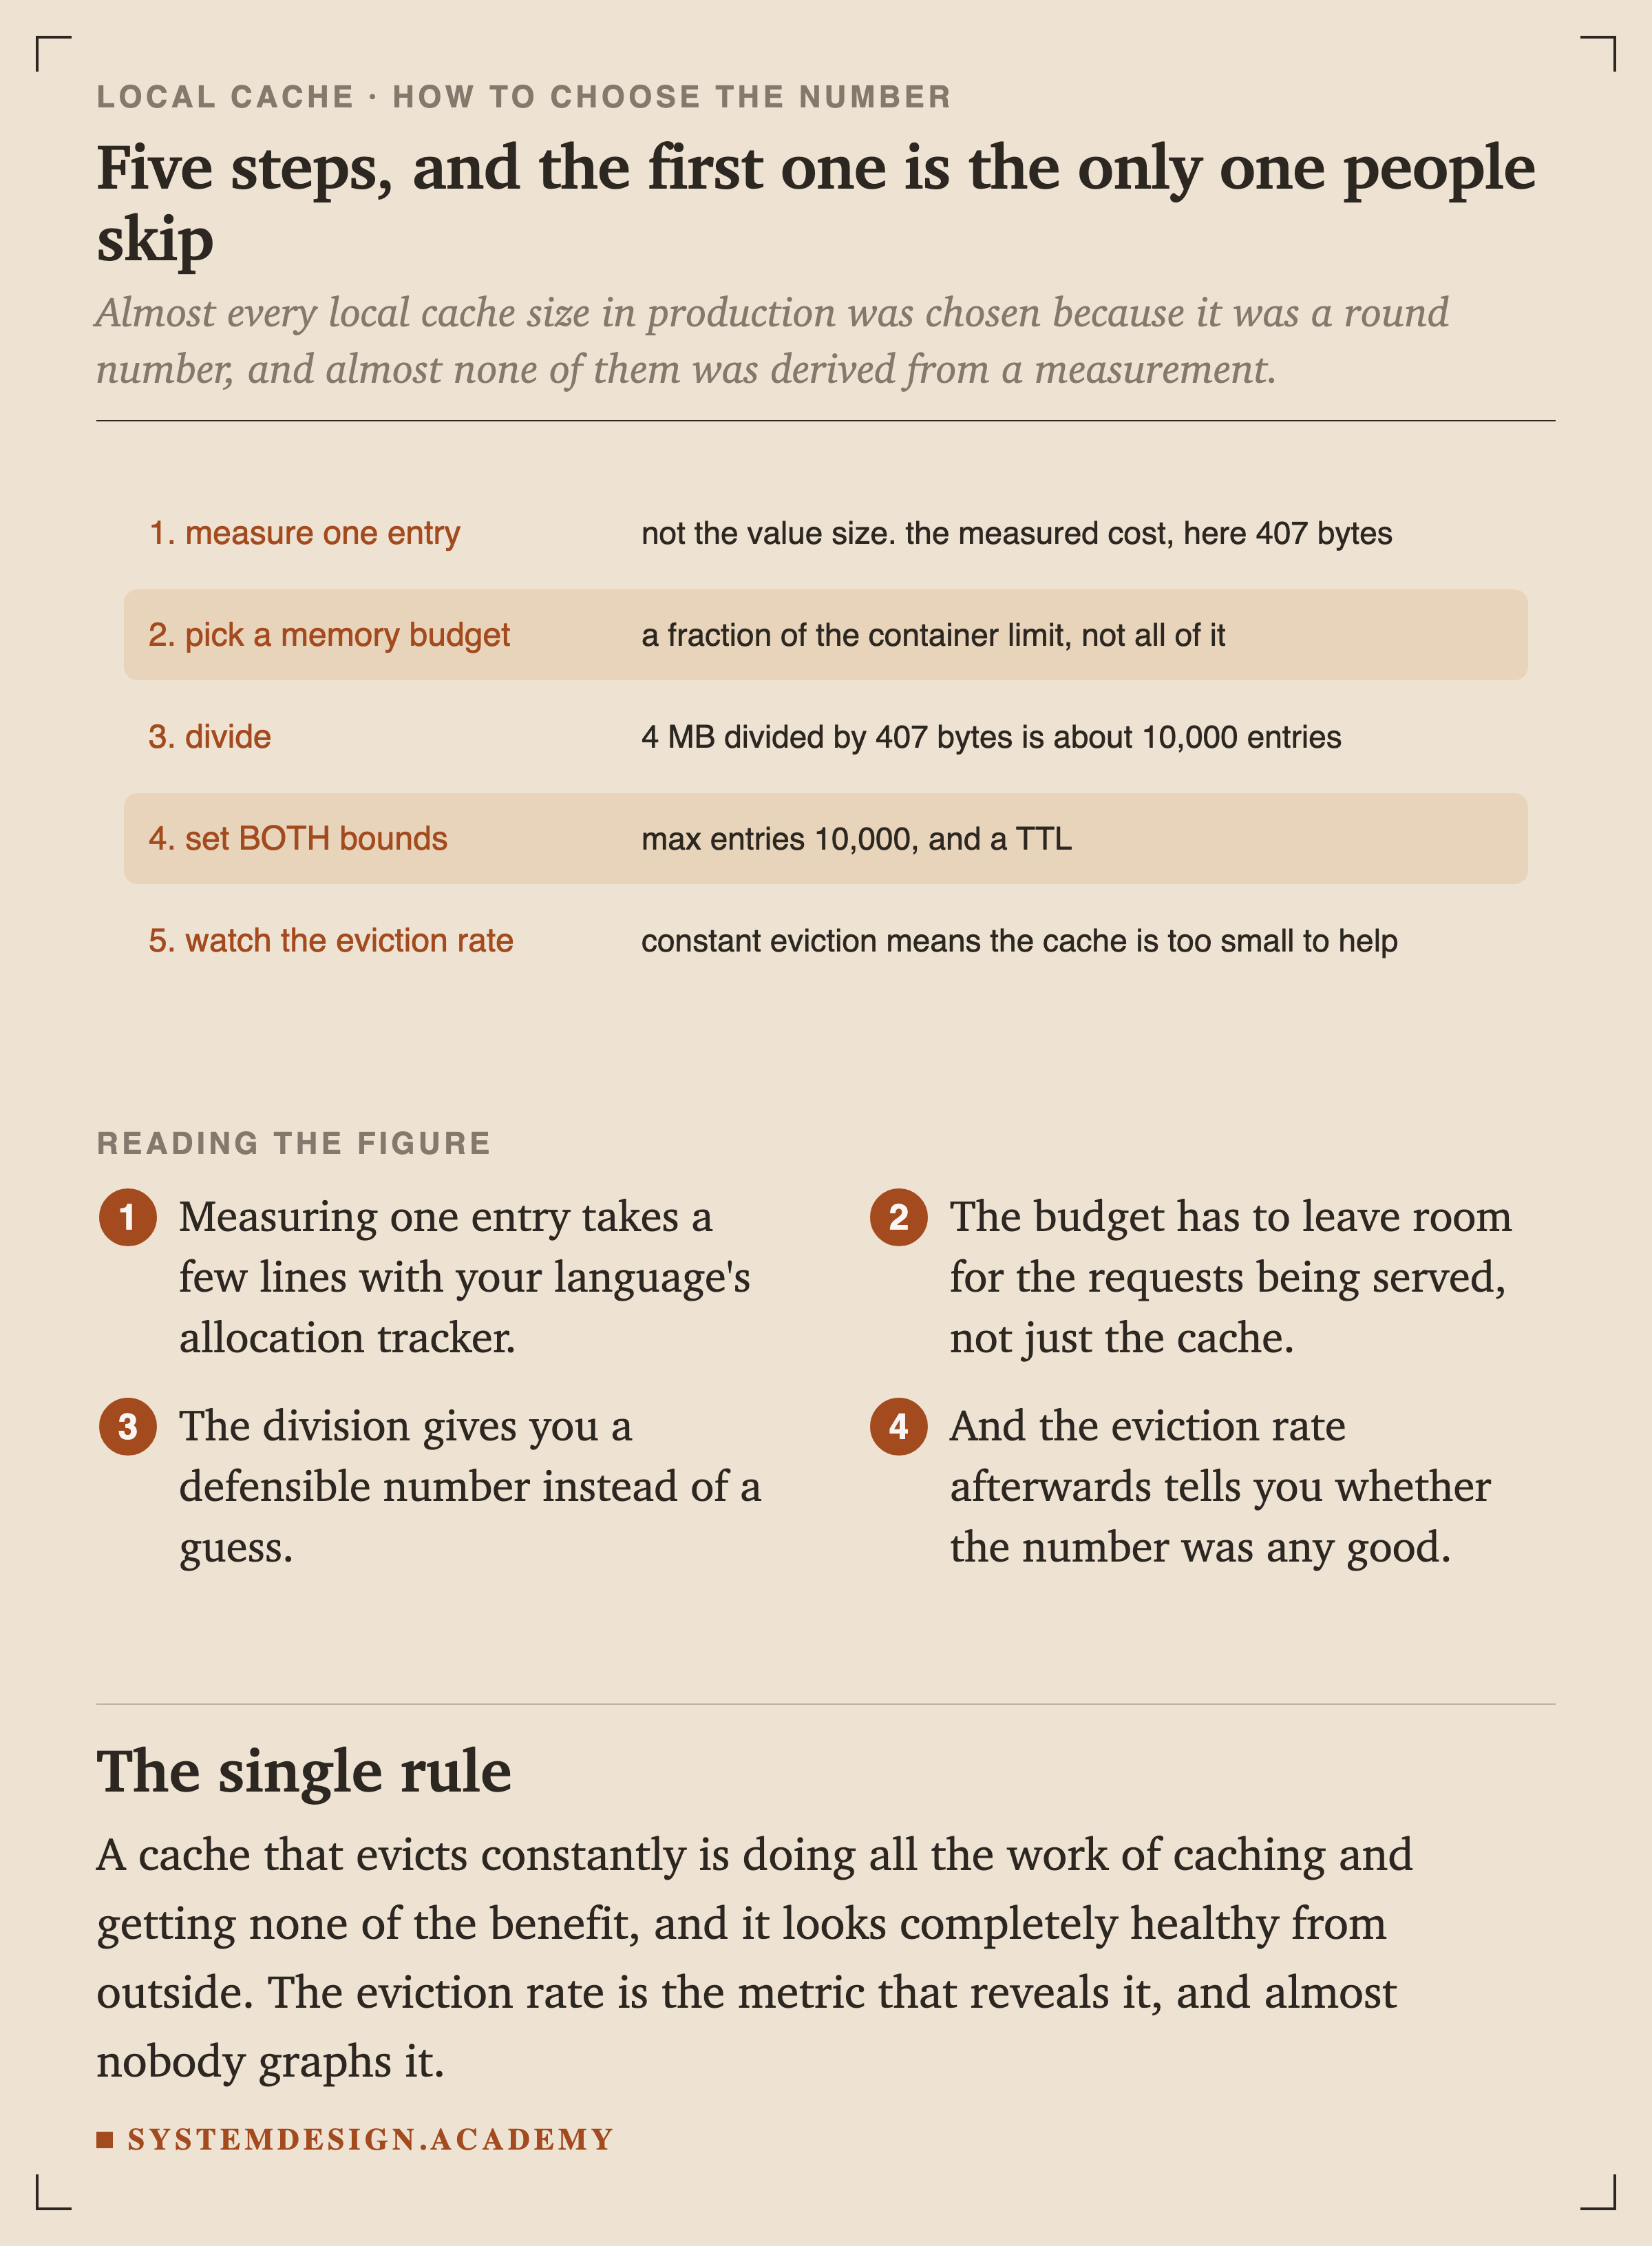
    Five numbered steps. Measure one entry, not the value size but the measured cost, here 407 bytes. Pick a memory budget, a fraction of the container limit. Divide: 4 MB divided by 407 bytes is about 10,000 entries. Set both bounds: max entries 10,000, and a TTL. Watch the eviction rate, because constant eviction means the cache is too small to help.
    FigureFigure 16. Five steps, and the first is the only one people skip

    A cache that evicts constantly is doing all the work of caching and getting none of the benefit, and it looks completely healthy from outside. The eviction rate is the metric that reveals it, and almost nobody graphs it.

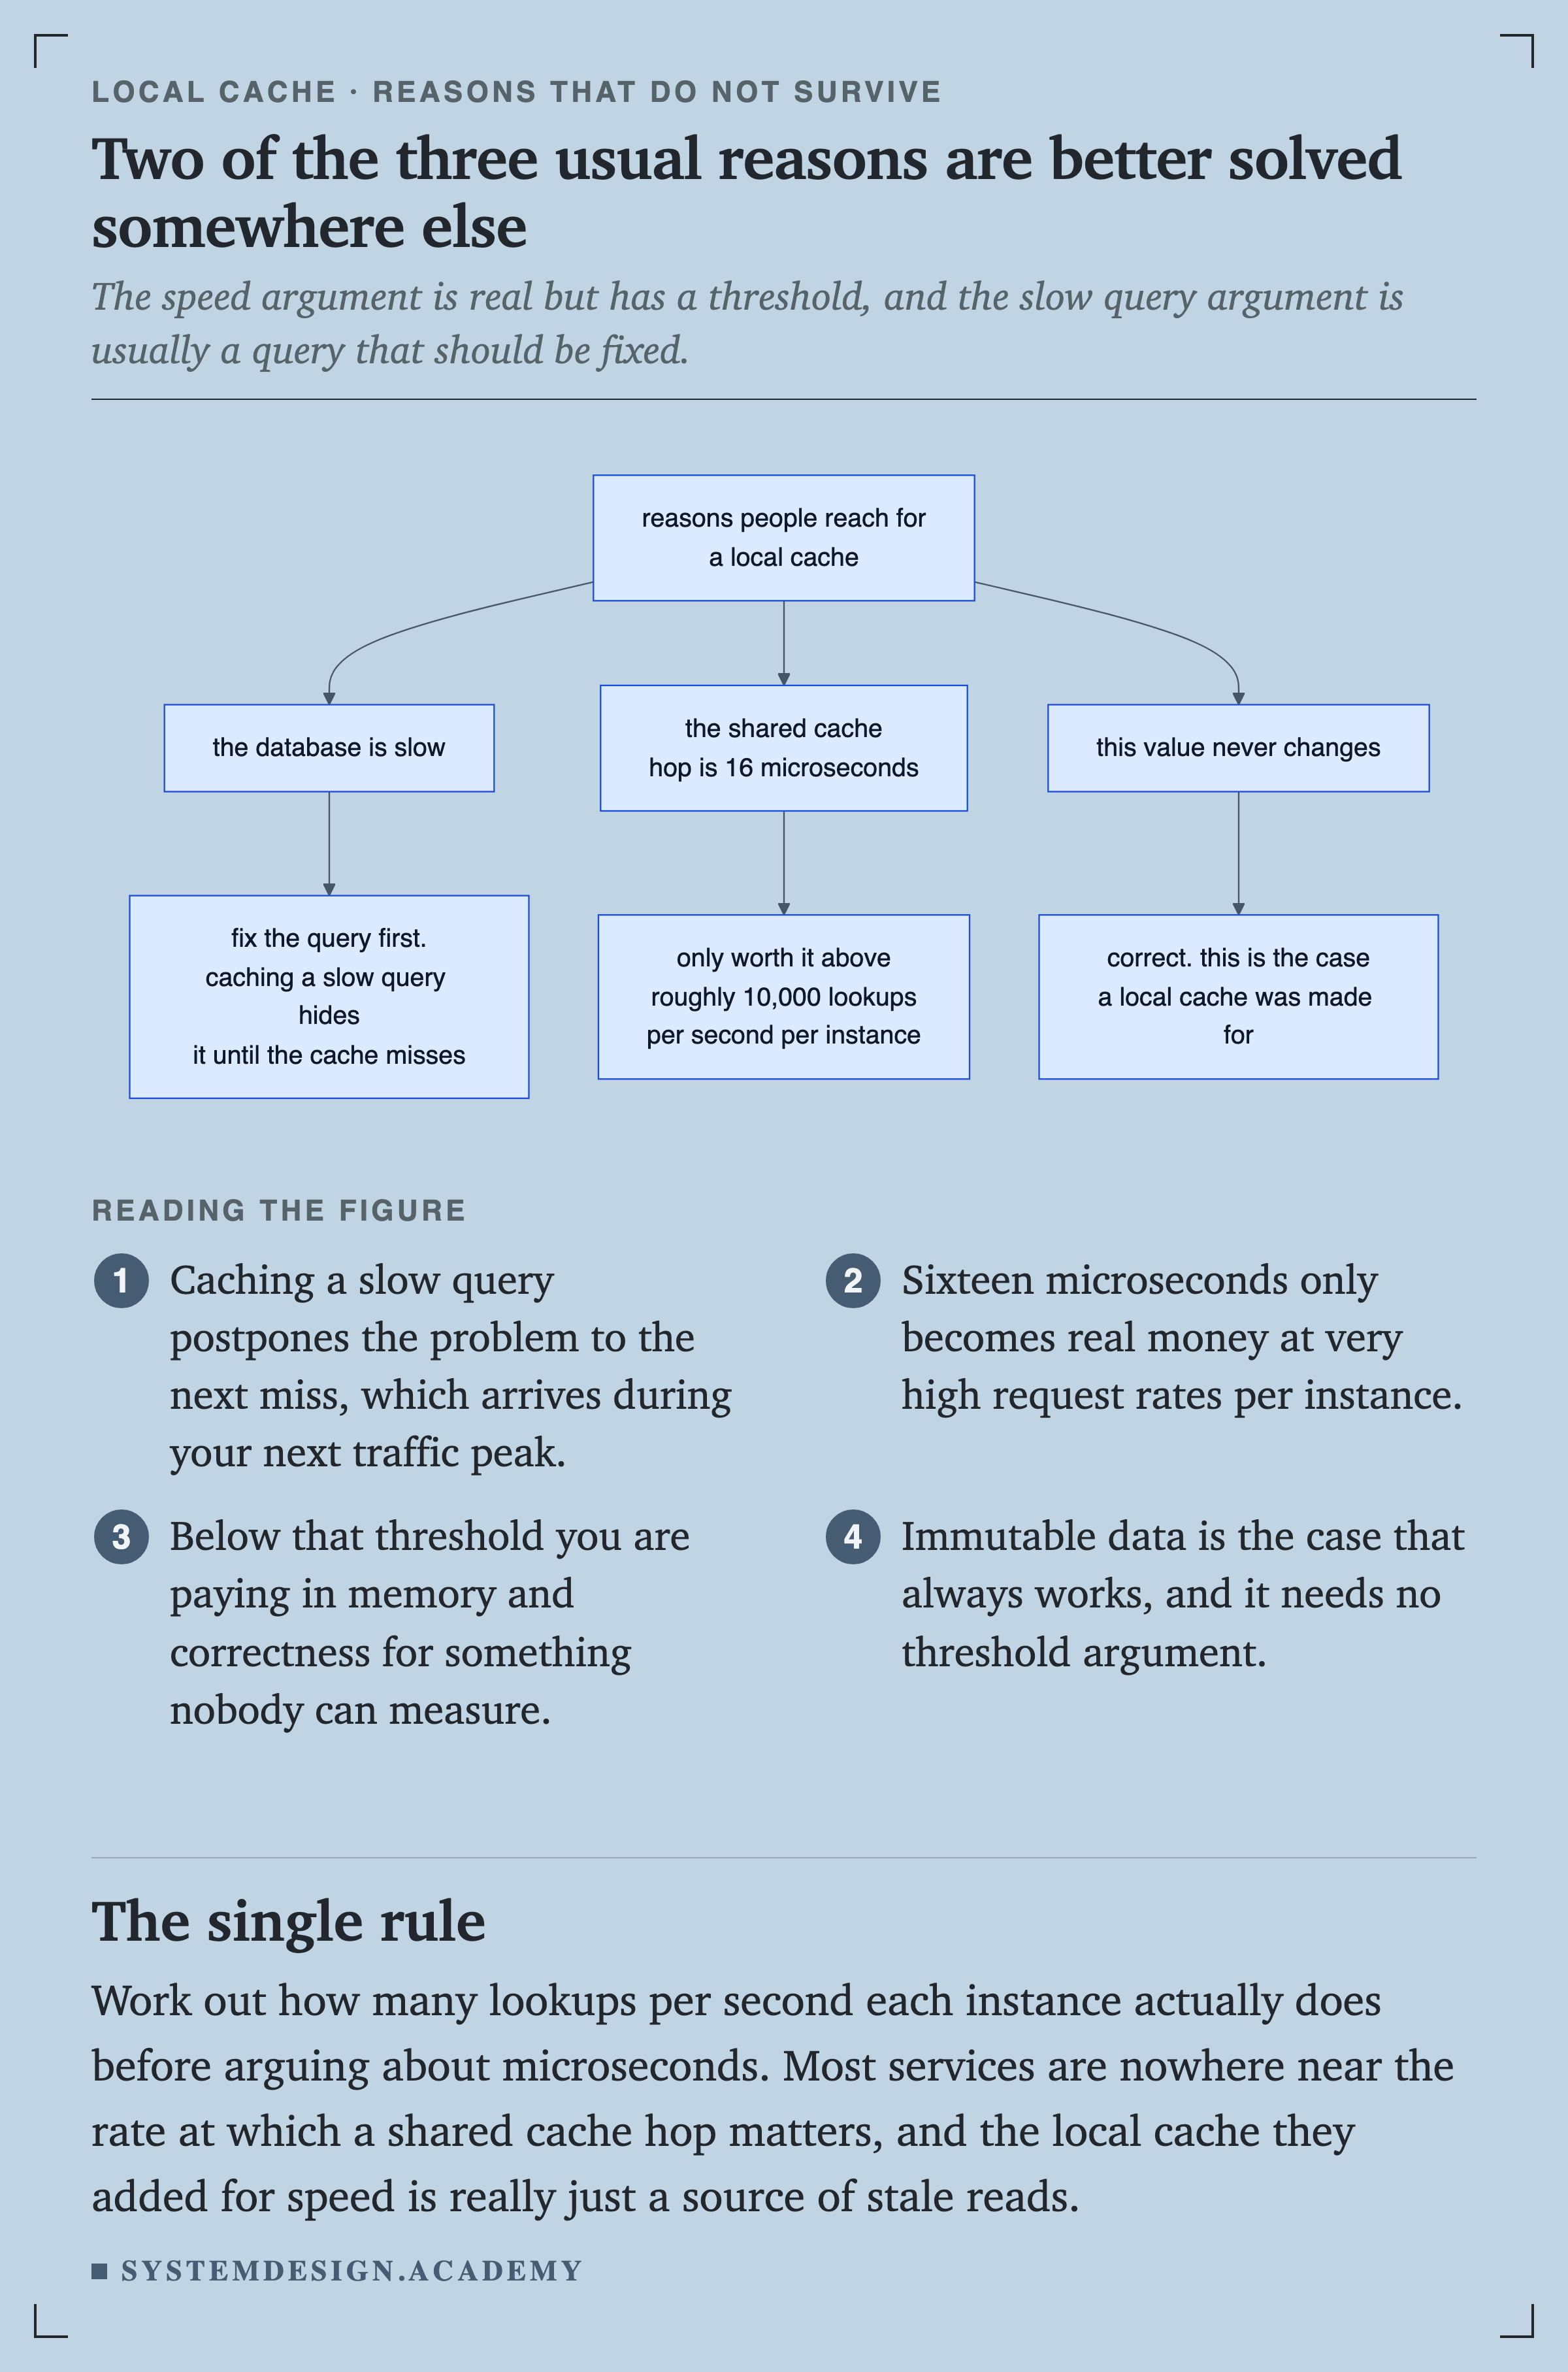
    A flowchart of three reasons people reach for a local cache. The database is slow leads to fix the query first, because caching a slow query hides it until the cache misses. The shared cache hop is 16 microseconds leads to it only being worth it above roughly 10,000 lookups per second per instance. This value never changes leads to correct, this is the case a local cache was made for.
    FlowchartFigure 17. Two of the three usual reasons are better solved somewhere else

    Caching a slow query postpones the problem to the next miss, which arrives during your next traffic peak. And sixteen microseconds only becomes real money at very high request rates per instance, which most services are nowhere near.

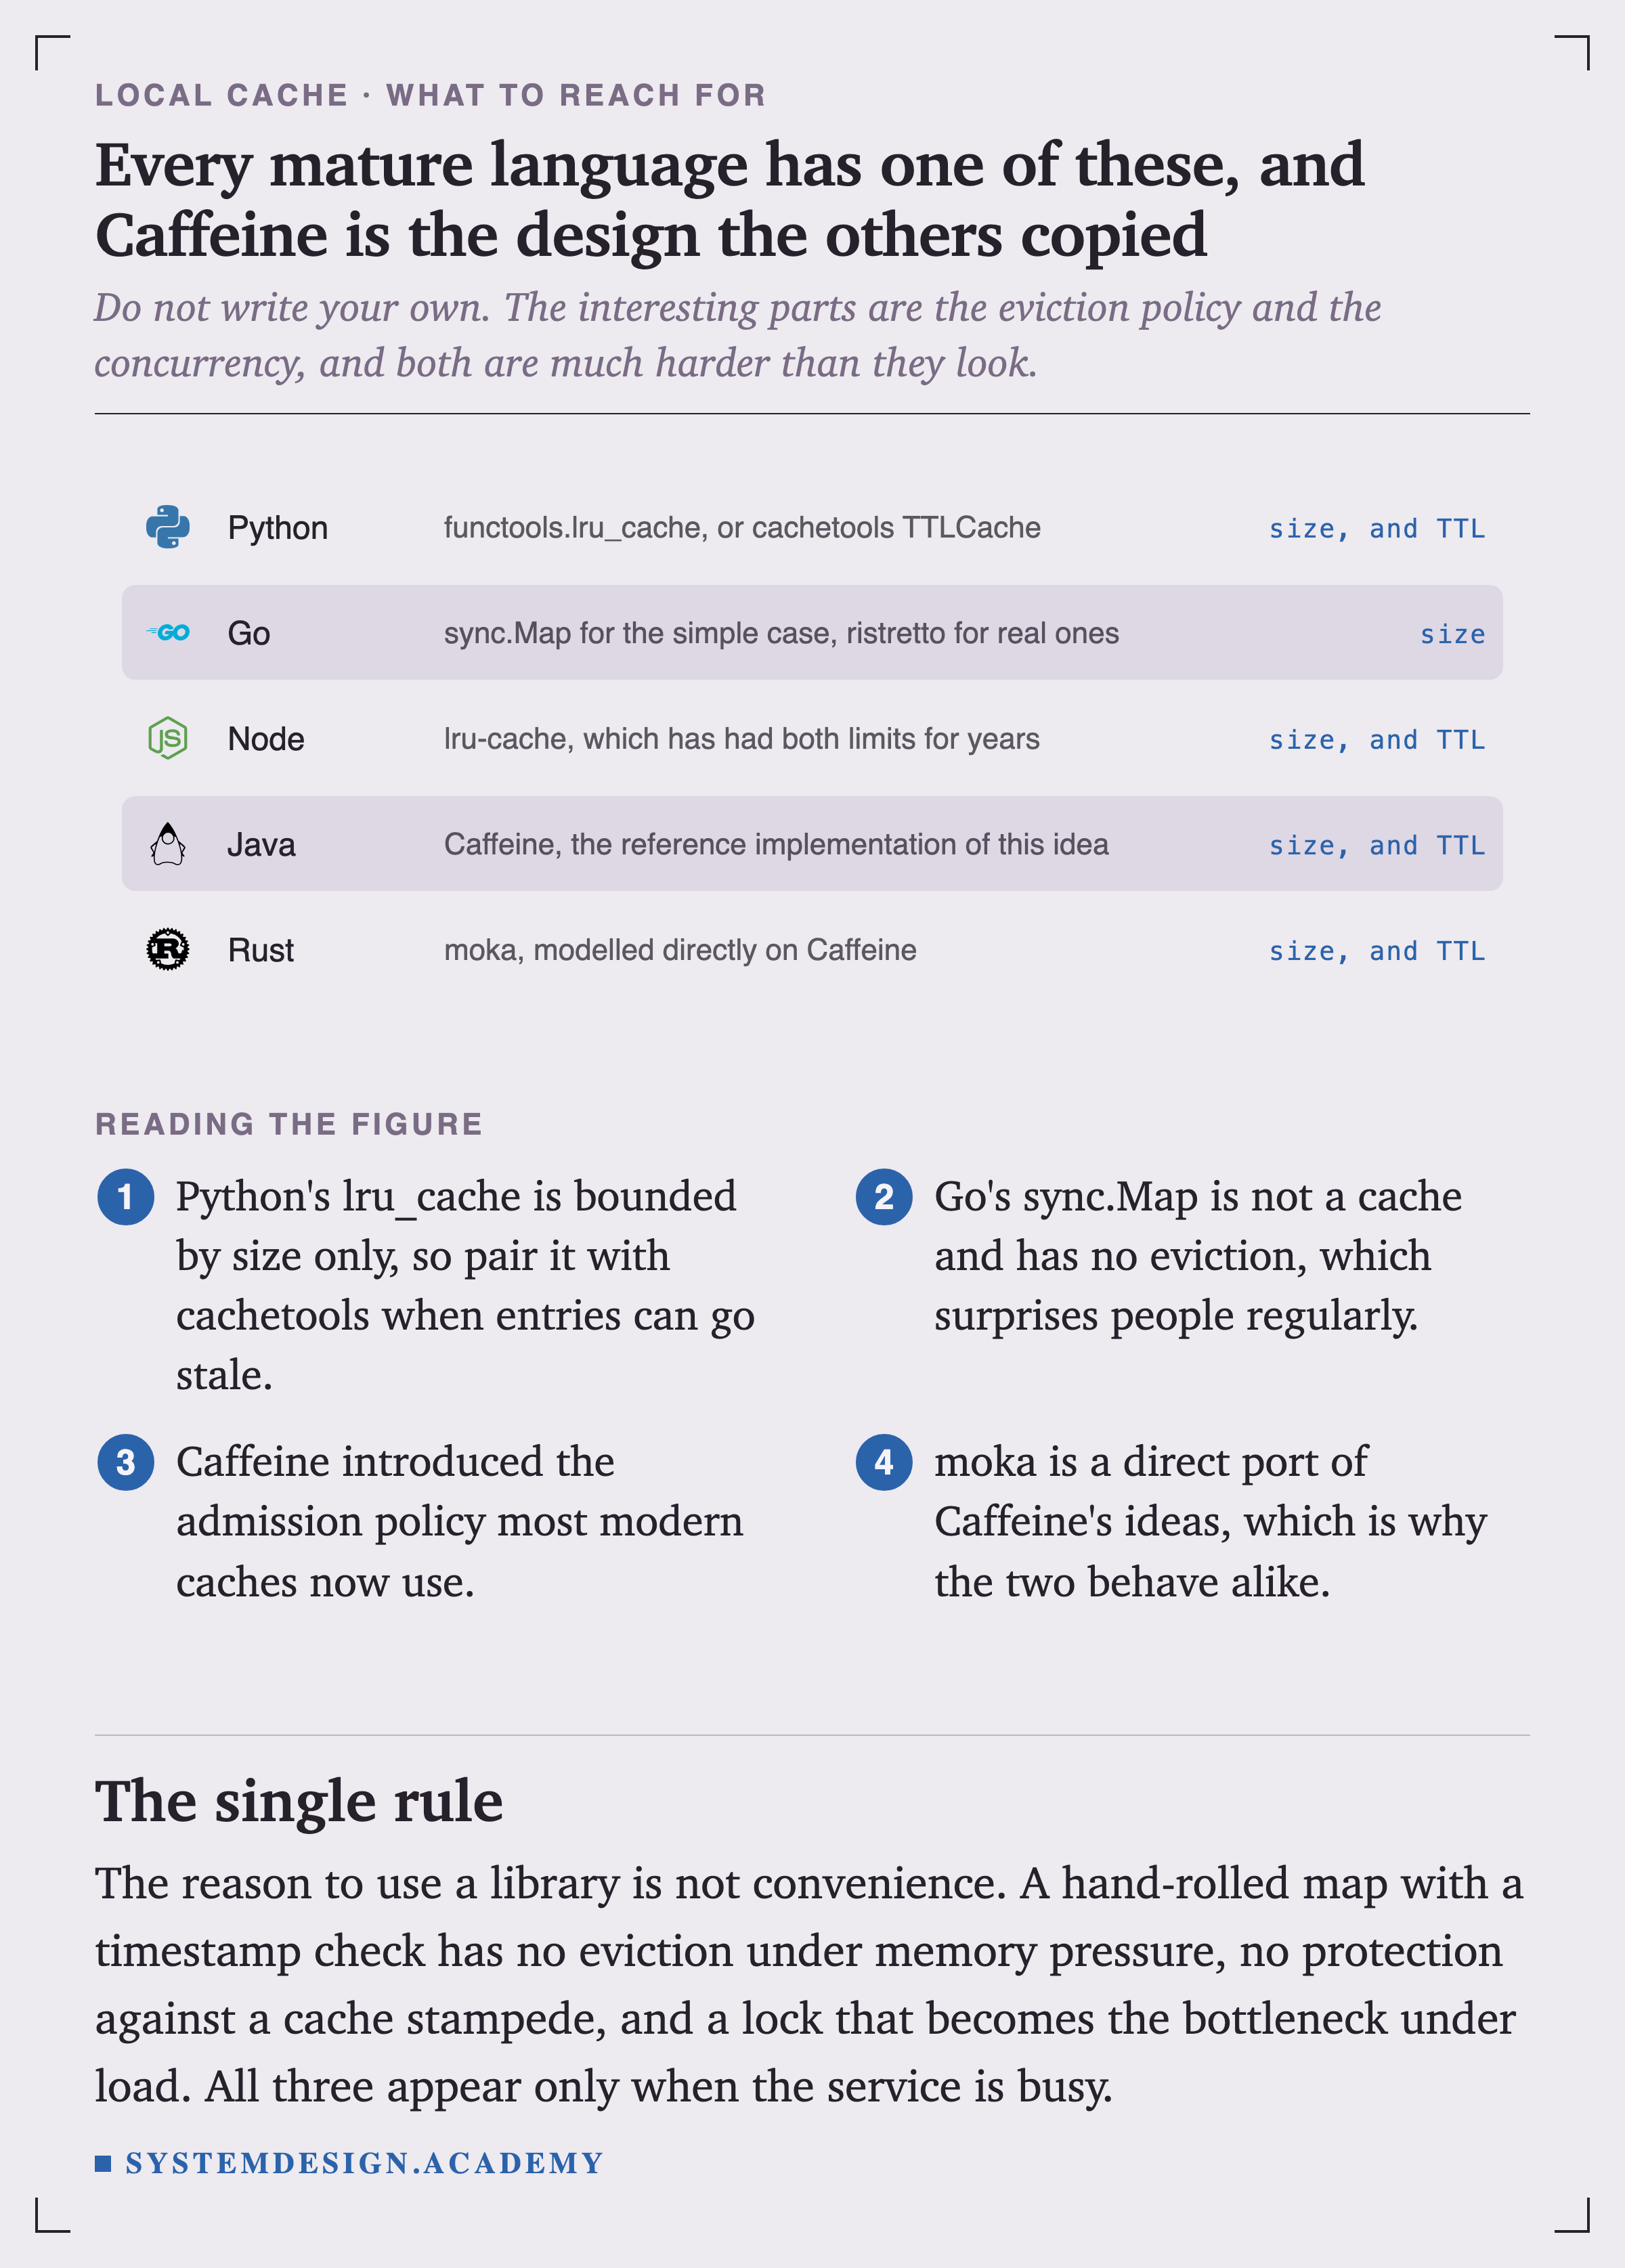
    Five rows, each with a real language logo. Python offers functools.lru_cache or cachetools TTLCache, bounded by size and TTL. Go offers sync.Map for the simple case and ristretto for real ones, bounded by size. Node offers lru-cache with both bounds. Java offers Caffeine, the reference implementation of this idea, with both. Rust offers moka, modelled directly on Caffeine, with both.
    ArchitectureFigure 18. Caffeine is the design the others copied

    Do not write your own. A hand-rolled map with a timestamp check has no eviction under memory pressure, no protection against a stampede, and a lock that becomes the bottleneck under load. All three appear only when the service is busy.

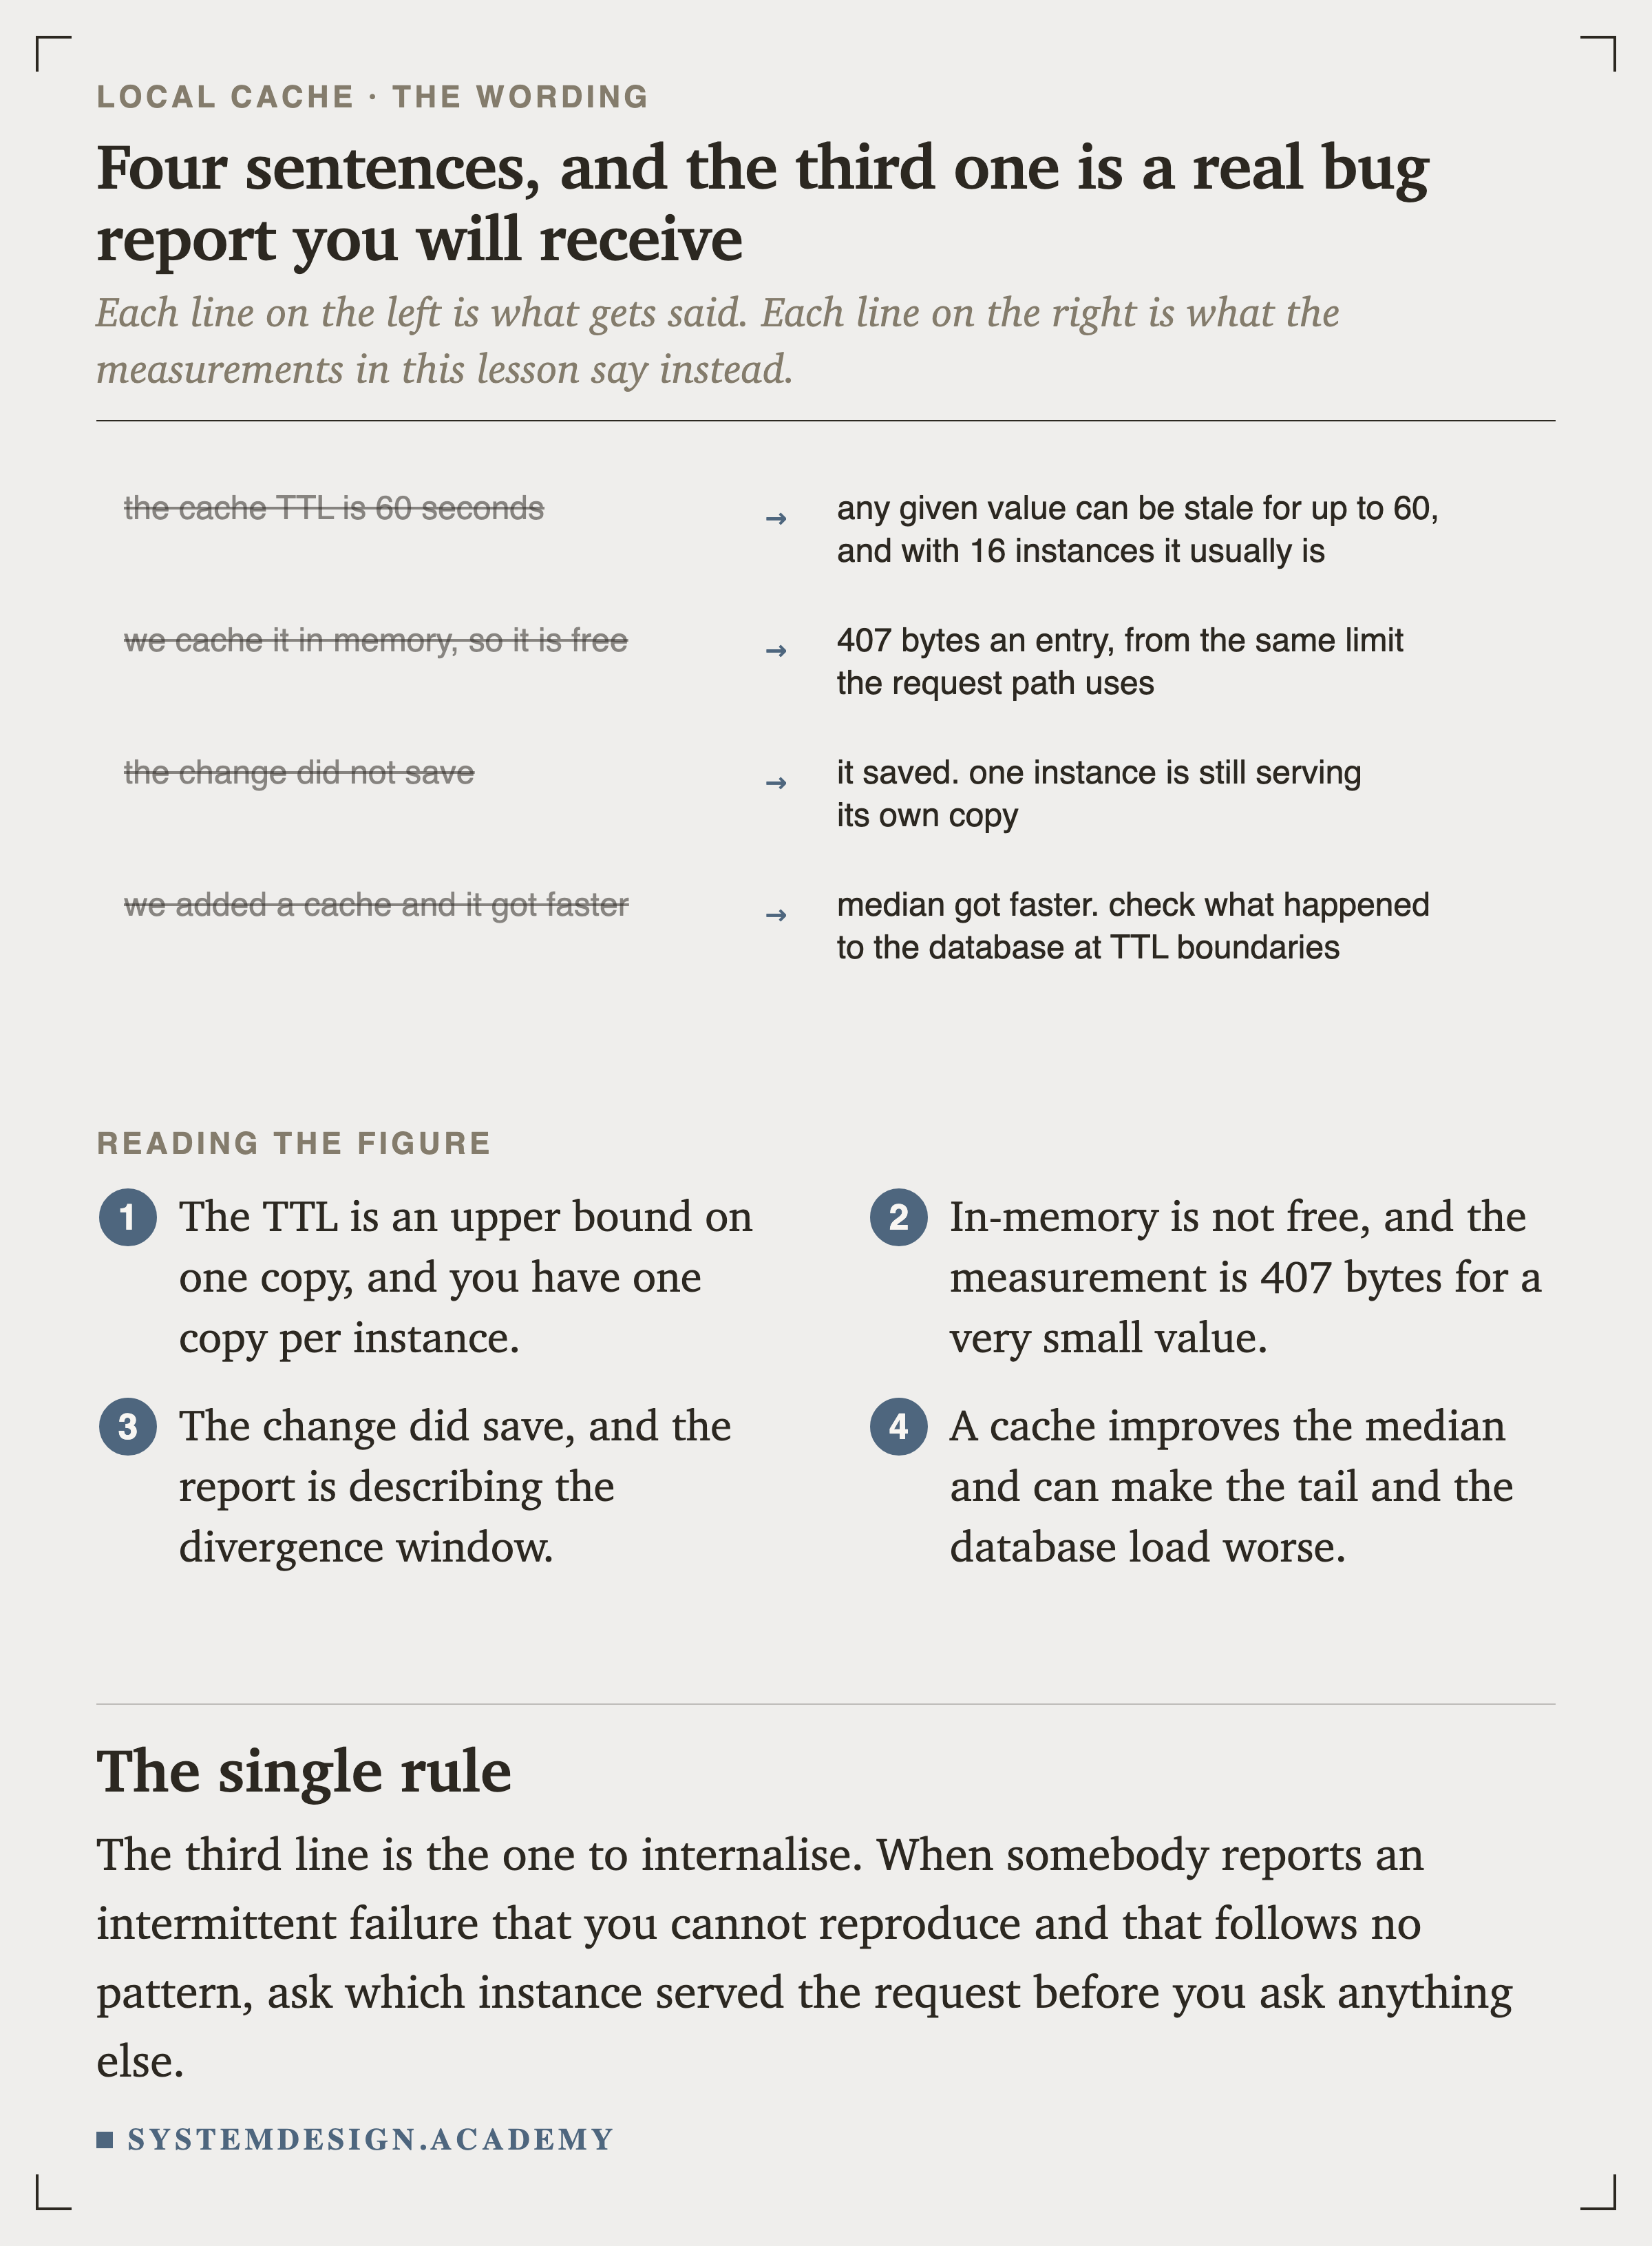
    Four pairs of sentences. The cache TTL is 60 seconds becomes any given value can be stale for up to 60, and with 16 instances it usually is. We cache it in memory so it is free becomes 407 bytes an entry, from the same limit the request path uses. The change did not save becomes it saved, one instance is still serving its own copy. We added a cache and it got faster becomes median got faster, check what happened to the database at TTL boundaries.
    FigureFigure 19. Four sentences, and the third is a real bug report you will receive

    When somebody reports an intermittent failure you cannot reproduce and that follows no pattern, ask which instance served the request before you ask anything else.

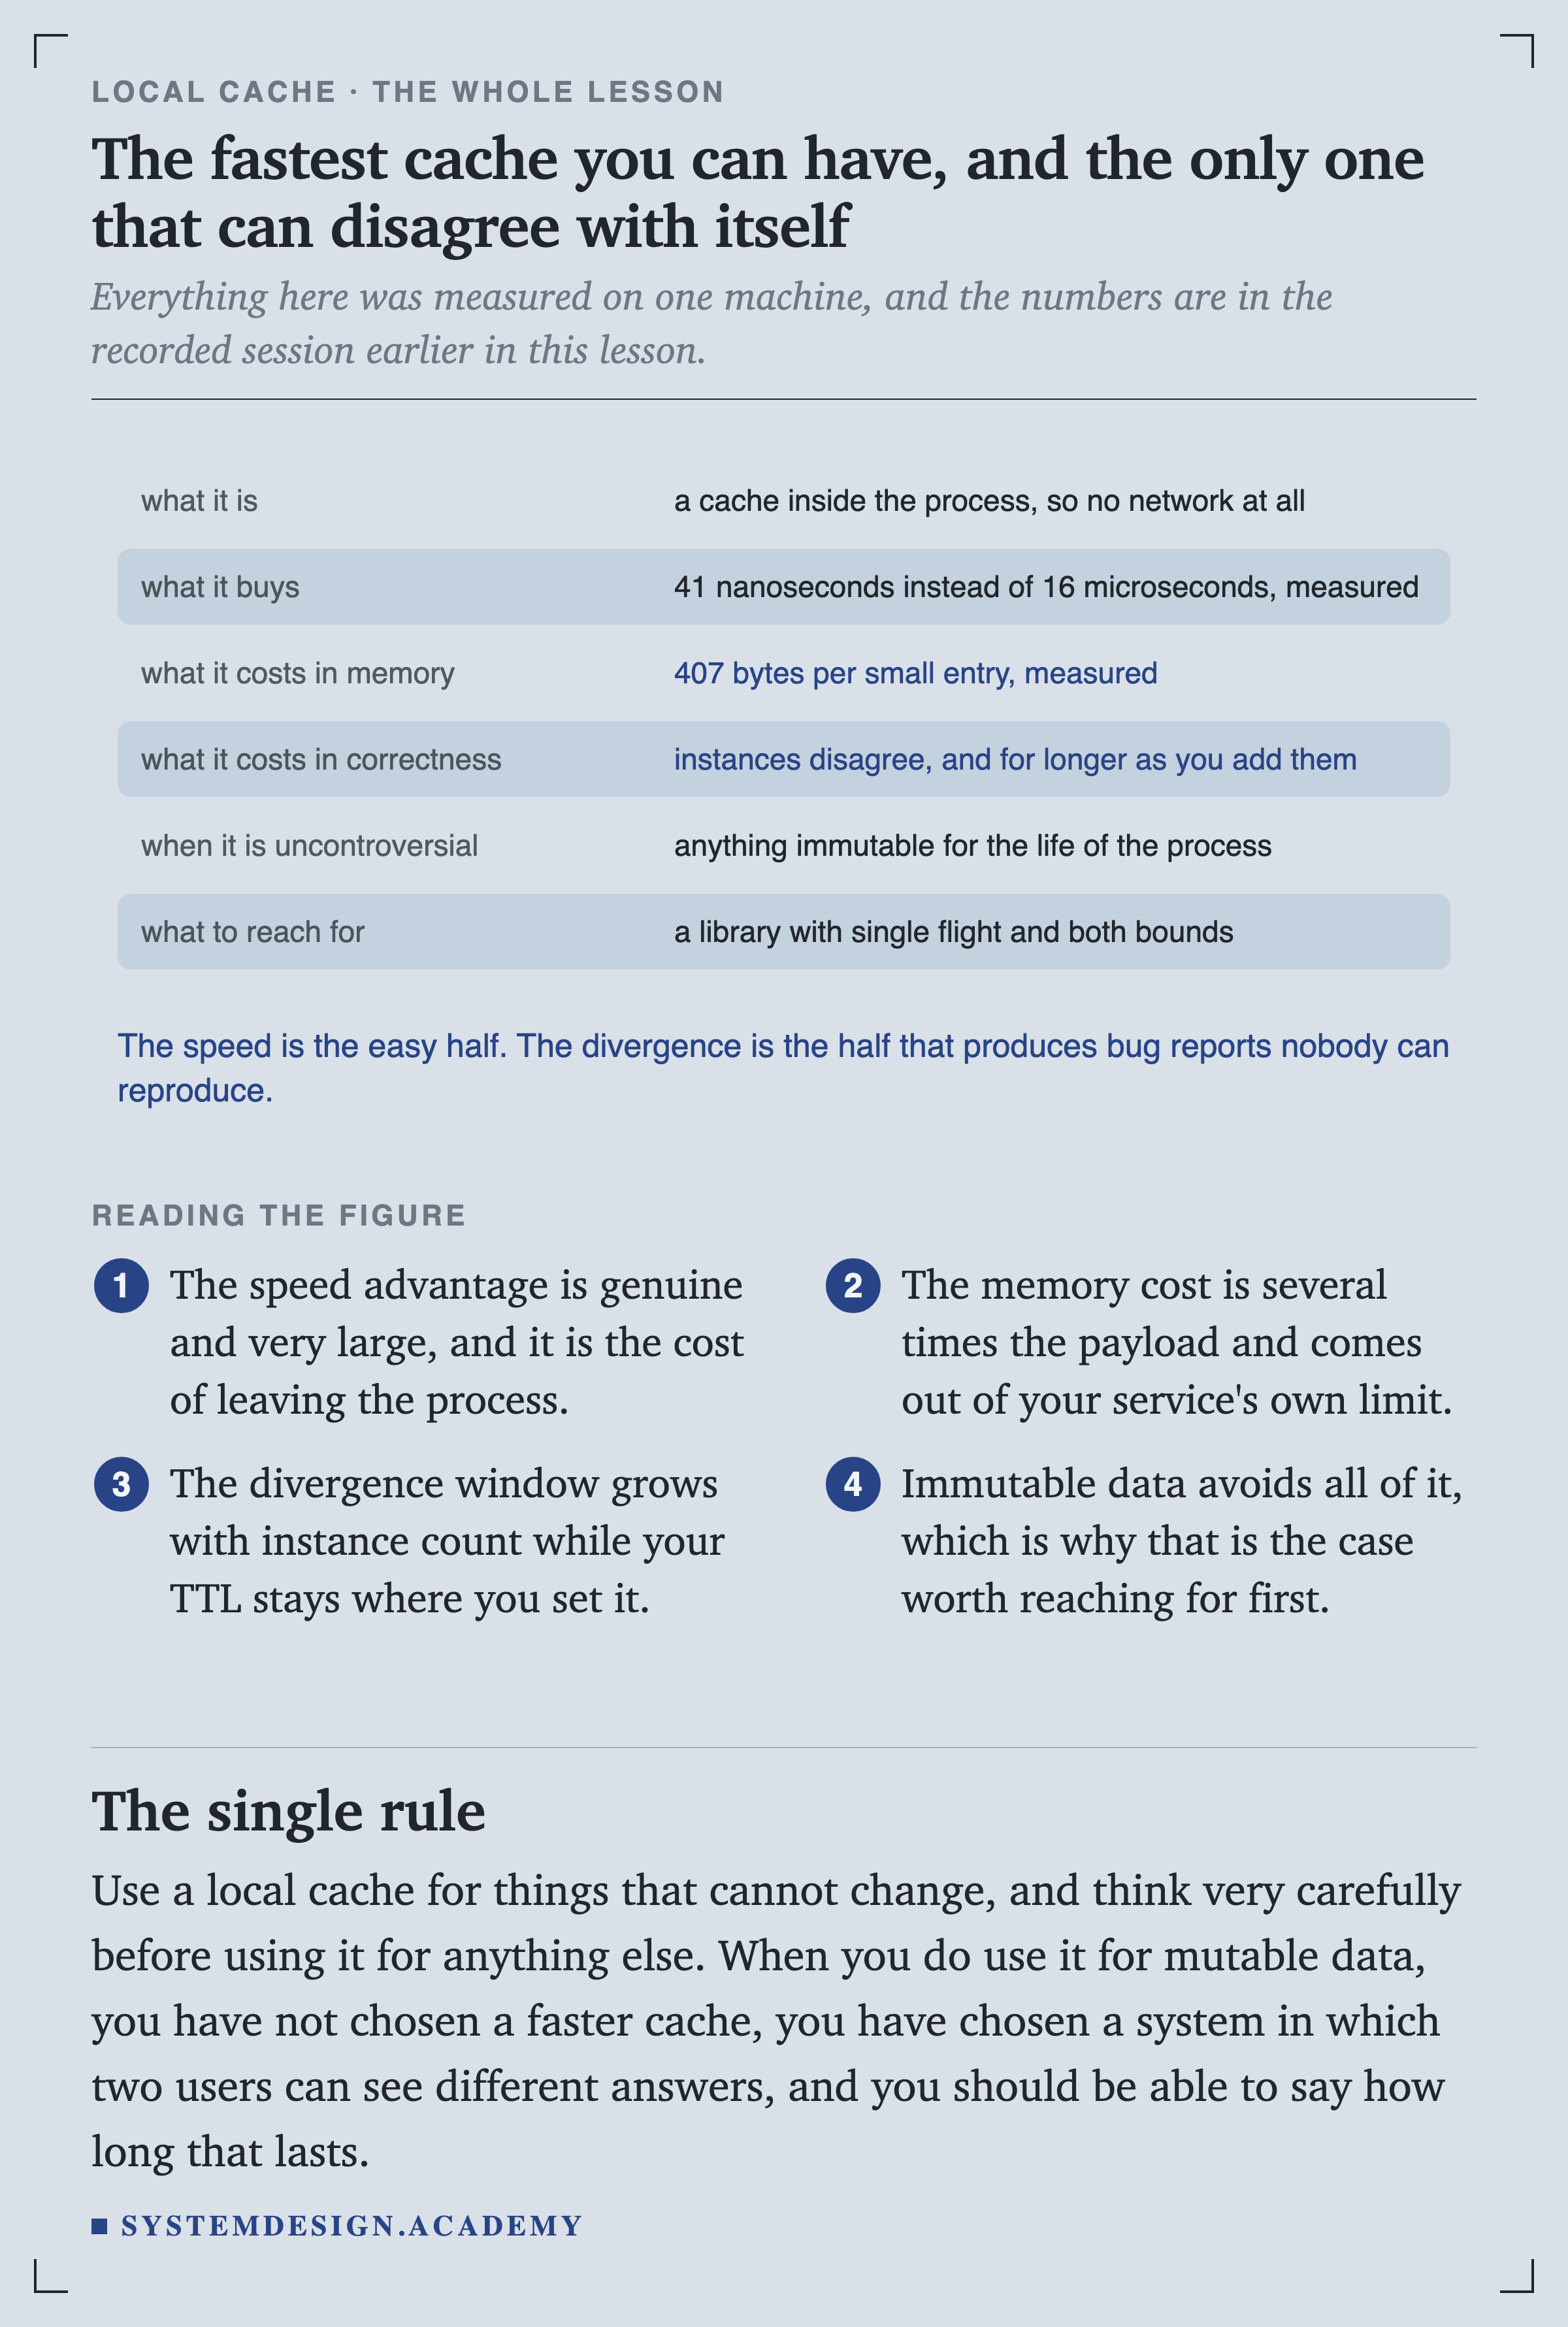
    Six rows summarising the lesson. What it is: a cache inside the process, so no network at all. What it buys: 41 nanoseconds instead of 16 microseconds, measured. What it costs in memory: 407 bytes per small entry, measured. What it costs in correctness: instances disagree, and for longer as you add them. When it is uncontroversial: anything immutable for the life of the process. What to reach for: a library with single flight and both bounds. A closing line reads that the speed is the easy half and the divergence is the half that produces bug reports nobody can reproduce.
    FigureFigure 20. The fastest cache you can have, and the only one that can disagree with itself

    Use a local cache for things that cannot change, and think carefully before using it for anything else. When you do use it for mutable data, you have not chosen a faster cache. You have chosen a system in which two users can see different answers, and you should be able to say how long that lasts.

    after “When to Use One, and How to Size It”

    The free lesson gives you the outline. A lesson gives you the working.

    The System Design course gives this its own lesson: Cache Eviction Policies.

    It starts from the problem and builds up to the design one step at a time.

    See the System Design course $49 once, lifetime access