Here's a number that should bother you: reading from a database takes about 1-10 milliseconds. Reading from an in-memory cache takes about 0.1 milliseconds. That's 10-100x faster.
Now multiply that by thousands of requests per second. If your API makes 5 database queries per request and you're handling 10,000 requests per second, that's 50,000 database queries per second. Your database is crying. Your users are waiting. Your cloud bill is growing.
But here's the thing. A large share of those queries are asking for the exact same data. Ten thousand people loading your homepage are all fetching the same featured products, the same trending posts, the same navigation menu. Yet your database dutifully executes the same query 10,000 times, returning the same result each time.
How large a share depends entirely on your traffic, and anyone who quotes you a single percentage for every application is guessing. What is not a guess is the shape: on almost every read-heavy site, a small number of items are requested enormously more often than the rest. That skew is what makes caching work at all.
Caching says: "Why not do that work once, store the result somewhere fast, and serve it from memory for the next 9,999 requests?"
This isn't a nice-to-have optimization. It's a fundamental architecture pattern, and the companies you use every day depend on it completely. Netflix's cache layer alone absorbs upwards of 30 million requests every second at peak. Facebook built a system called TAO whose own paper says it processes a billion reads a second. Both numbers are in the last slide of this lesson, with their sources.
Take those two figures seriously for a moment. Every one of those reads that the cache answers is a read the database never sees. Remove the cache and that traffic does not disappear, it lands somewhere else.
What Is Caching?
Caching is storing a copy of data in a faster storage layer so future requests for that data can be served without going to the slower original source.
The analogy that makes this click: imagine you're a librarian. Someone asks you for a popular book. You walk to the back of the library, find it on the shelf (10 minutes), bring it to the front desk. Five minutes later, someone else asks for the same book. Do you walk all the way to the back again?
No. You keep a copy on a shelf behind the front desk. Next time someone asks, you grab it in 5 seconds instead of 10 minutes.
That shelf behind the front desk? That's your cache.
In software, the "slow source" is usually a database, an external API, or an expensive computation. The "fast copy" lives in memory (RAM), either on the same server (local cache) or on a dedicated caching server like or Memcached.
Storage Tier
Speed
Cost
Capacity
CPU Cache (L1/L2)
~1 nanosecond
$$$$$
Kilobytes
RAM (application memory)
~100 nanoseconds
$$$$
Gigabytes
In-memory cache (Redis)
~0.1 millisecond (+ network)
$$$
Gigabytes-Terabytes
SSD (database storage)
~0.1-1 millisecond
$$
Terabytes
Hard Drive (HDD)
~5-10 milliseconds
$
Petabytes
Network call (API)
~10-200 milliseconds
$
Unlimited
Caching is fundamentally a trade-off: you sacrifice freshness and memory for speed. The cached data might be slightly stale (more on that soon), and you're using RAM to store it, but the performance gain is dramatic.
Cache Hit vs Cache Miss
The two fundamental paths through any caching system, and understanding these is the key to designing effective caches.
The Cache Hierarchy. Closer Is Faster
Caches exist at every level of a system, from the CPU to the edge. Each layer trades capacity for speed. Understanding this hierarchy helps you decide where to cache what.
Caching Strategies. Where to Cache
Caching isn't one thing, it happens at multiple layers of your system, and each layer serves a different purpose.
Browser Cache
The user's browser stores static assets (CSS, JavaScript, images) locally. When they revisit your site, the browser serves these from disk instead of downloading them again. Controlled via headers like Cache-Control: max-age=31536000. Cost: free. Impact: massive.
CDN Cache
A Content Delivery Network caches your content at edge servers around the world. A user in Tokyo gets your files from a server in Tokyo, not from your origin server in Virginia. CloudFront, Cloudflare, and Fastly are popular choices. This is the single most effective caching layer for static and semi-static content.
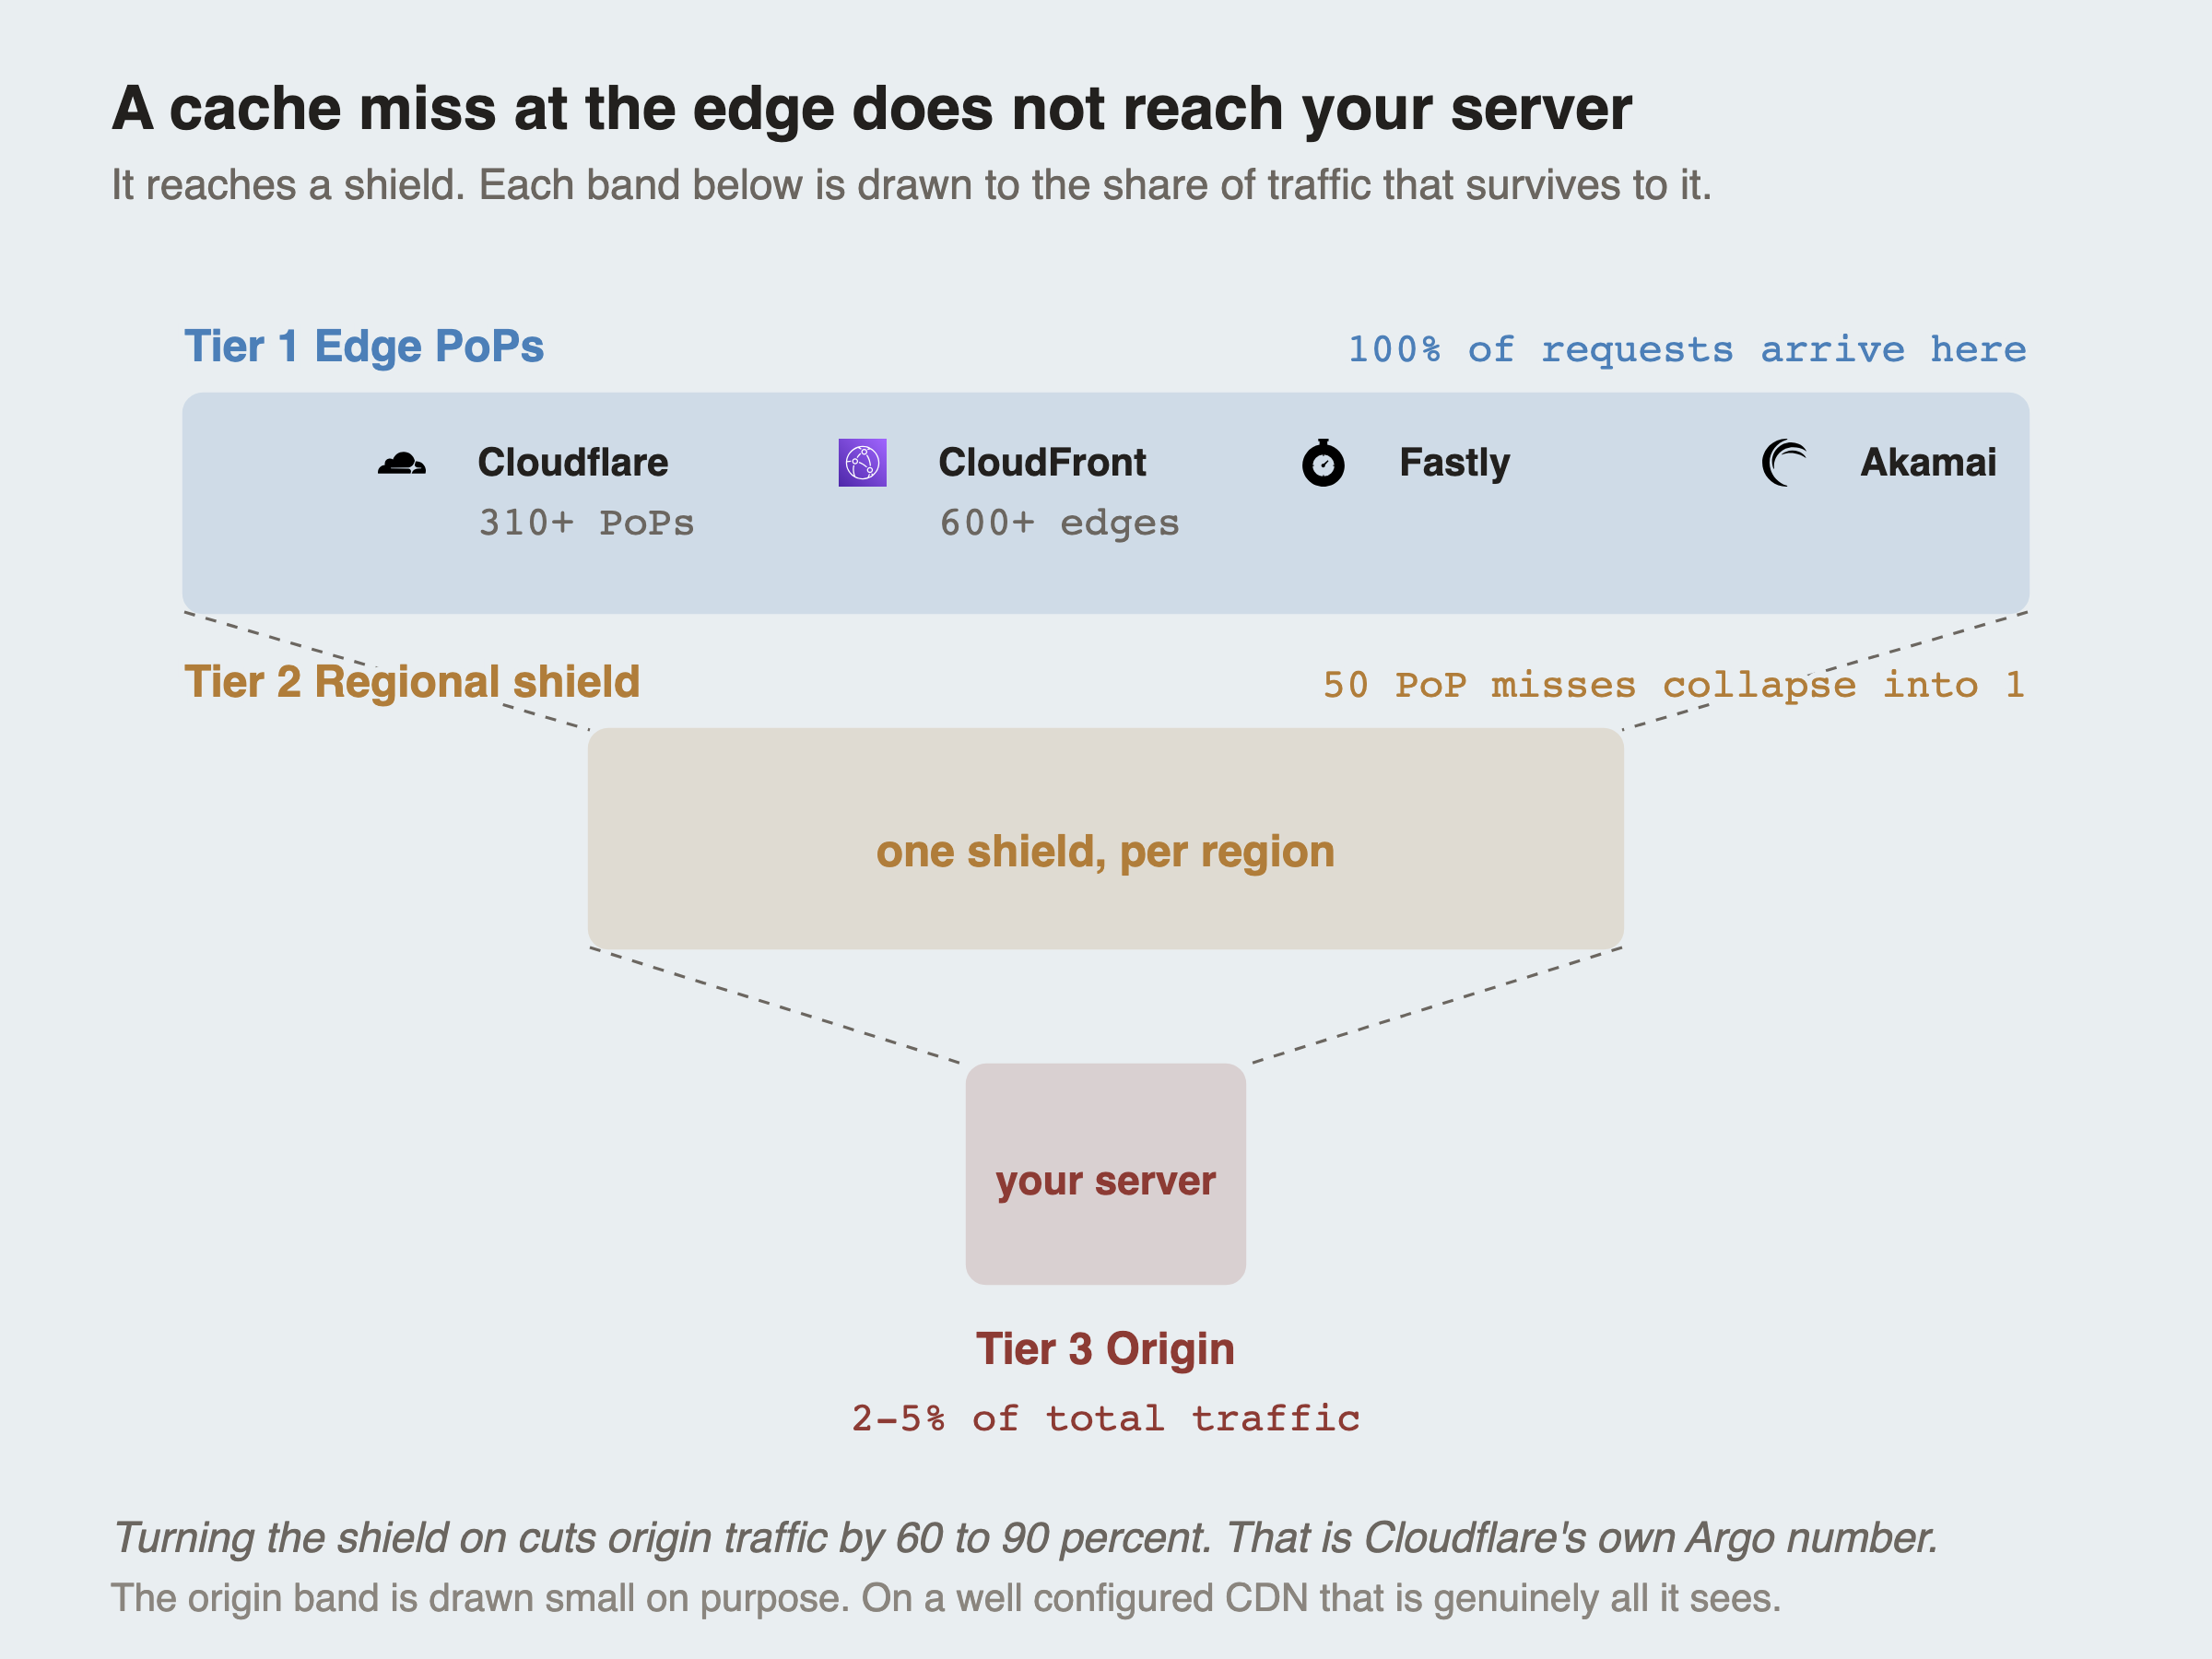
There is a second layer inside a that people miss, and it changes the arithmetic completely.
ArchitectureFigure 2. Each band drawn to the traffic that reaches it
A miss at the edge does not go straight to you. It goes to a regional shield, and every edge in that region shares it, so fifty separate misses for the same object collapse into a single request to your server. The bands are drawn to scale on purpose: by the time traffic reaches the bottom, a well configured CDN is passing you only a few percent of what arrived. Cloudflare's own figure for turning the shield on is a 60 to 90 percent cut in origin traffic.
The Hardest Problem in Caching
There's a famous saying in computer science: "There are only two hard things in computer science: cache invalidation and naming things." Phil Karlton said that, and every engineer who's dealt with stale cache data knows exactly what he meant.
Cache invalidation is the problem of knowing when your cached data is outdated and needs to be refreshed.
You cache a product price at $49.99. The product team changes it to $39.99 in the database. But your cache still says $49.99. Users see the wrong price. If they buy, do they pay the cached price or the real price? Either way, someone's unhappy.
There are three common approaches:
Time-To-Live (): Every cached item has an expiration time. "Cache this for 60 seconds, then fetch fresh data." Simple, predictable, but the data can be stale for up to the TTL duration. If your TTL is 5 minutes, a price change takes up to 5 minutes to reflect.
TTL
Best For
Staleness Risk
5 seconds
Real-time dashboards
Very low
60 seconds
API responses, session data
Low
5 minutes
Product catalogs, search results
Moderate
1 hour
Blog posts, configuration
Low impact
Cache-Aside vs Read-Through vs Write-Through
These are the three fundamental caching patterns. Interviews love asking about them because they reveal whether you understand the trade-offs, not just the concept.
Cache-Aside (Lazy Loading)
The most common pattern. Your application code is responsible for the cache:
Check the cache. If data exists (hit), return it.
If data doesn't exist (miss), fetch from database.
Store the result in cache.
Return the data.
The cache only gets populated when someone actually requests the data. This means cold starts can be slow (every first request is a miss), but you only cache data that's actually being used, no wasted memory on data nobody's requesting.
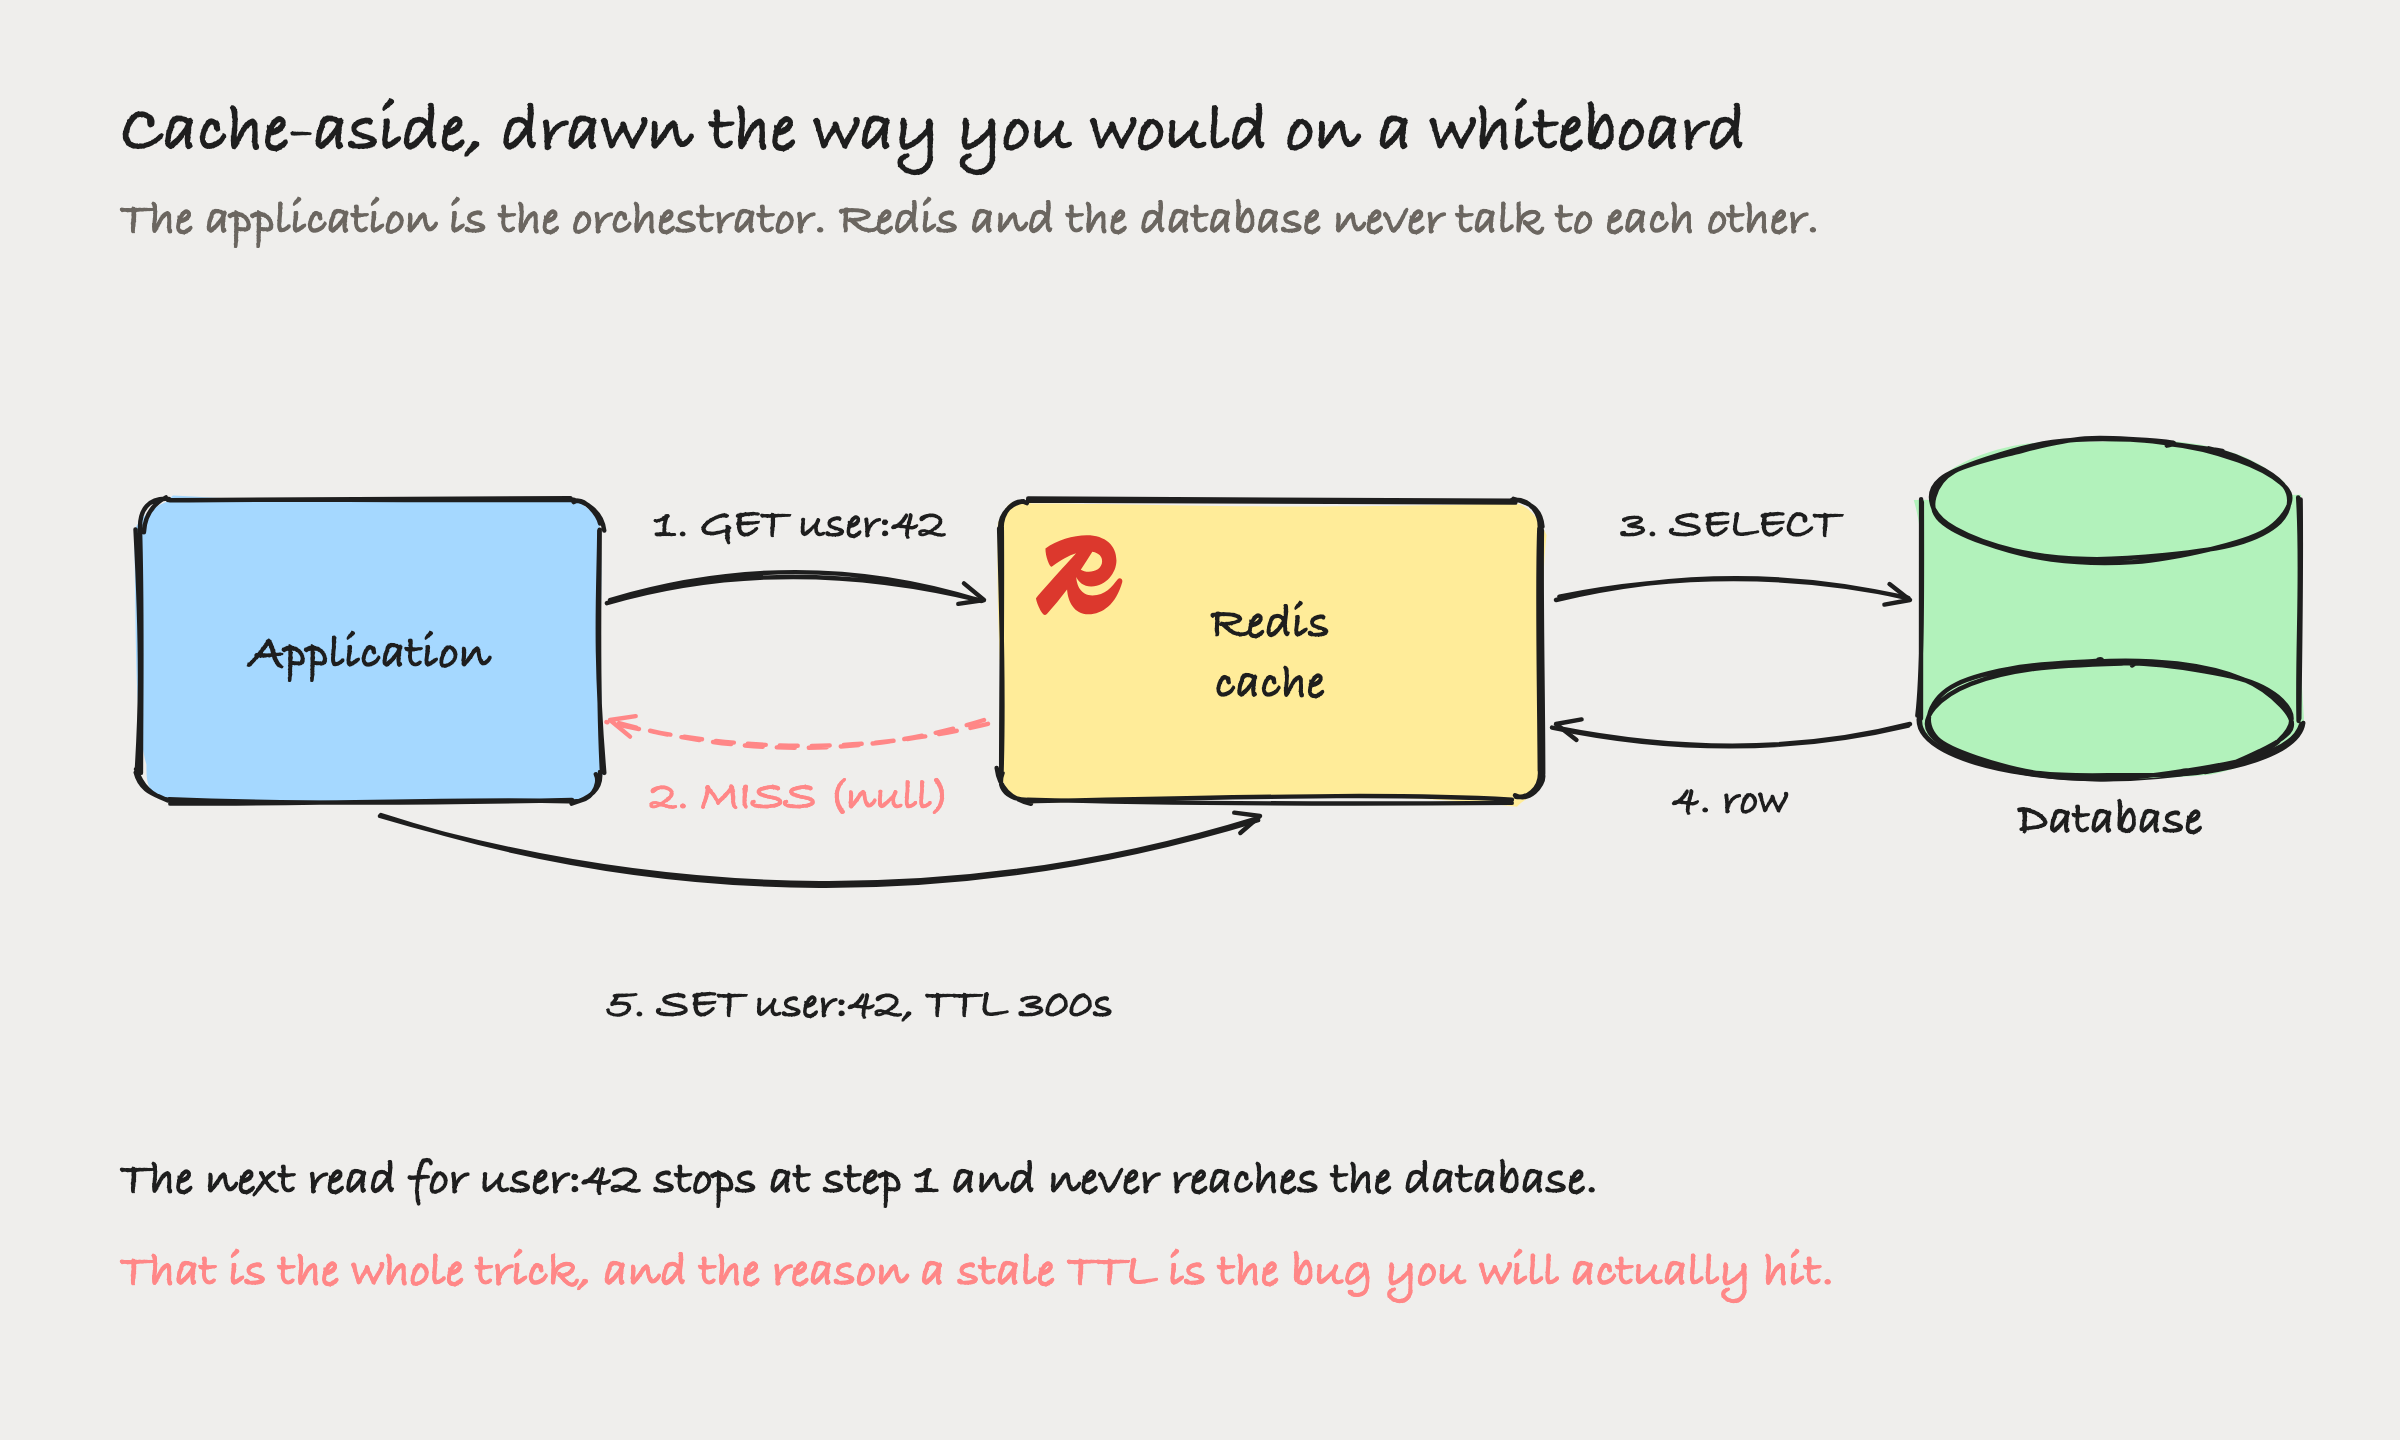
SketchFigure 9. Cache-aside, drawn the way you would on a whiteboard
Follow the arrows and notice who is doing the work: the application. It talks to the cache, and separately it talks to the database. and the database never speak to each other at all, and neither knows the other exists.
That is what makes cache-aside simple to reason about and simple to get subtly wrong. Your code owns every decision, including the one in step 5, which is the step the next figure turns into a bug.
Caching Patterns Compared
Cache-Aside, Read-Through, and Write-Through each make a different trade-off between freshness, complexity, and performance. This side-by-side view captures the decision that matters in practice.
Caching Gotchas That Burn Teams
Cache stampede (thundering herd). A popular cache key expires. Suddenly, thousands of concurrent requests all miss the cache at the same instant and all hit the database together. Your database buckles under the sudden load. The fix: lock the cache key so only one request fetches from the database while the others wait, or use "stale-while-revalidate", serving the slightly stale data while refreshing in the background.
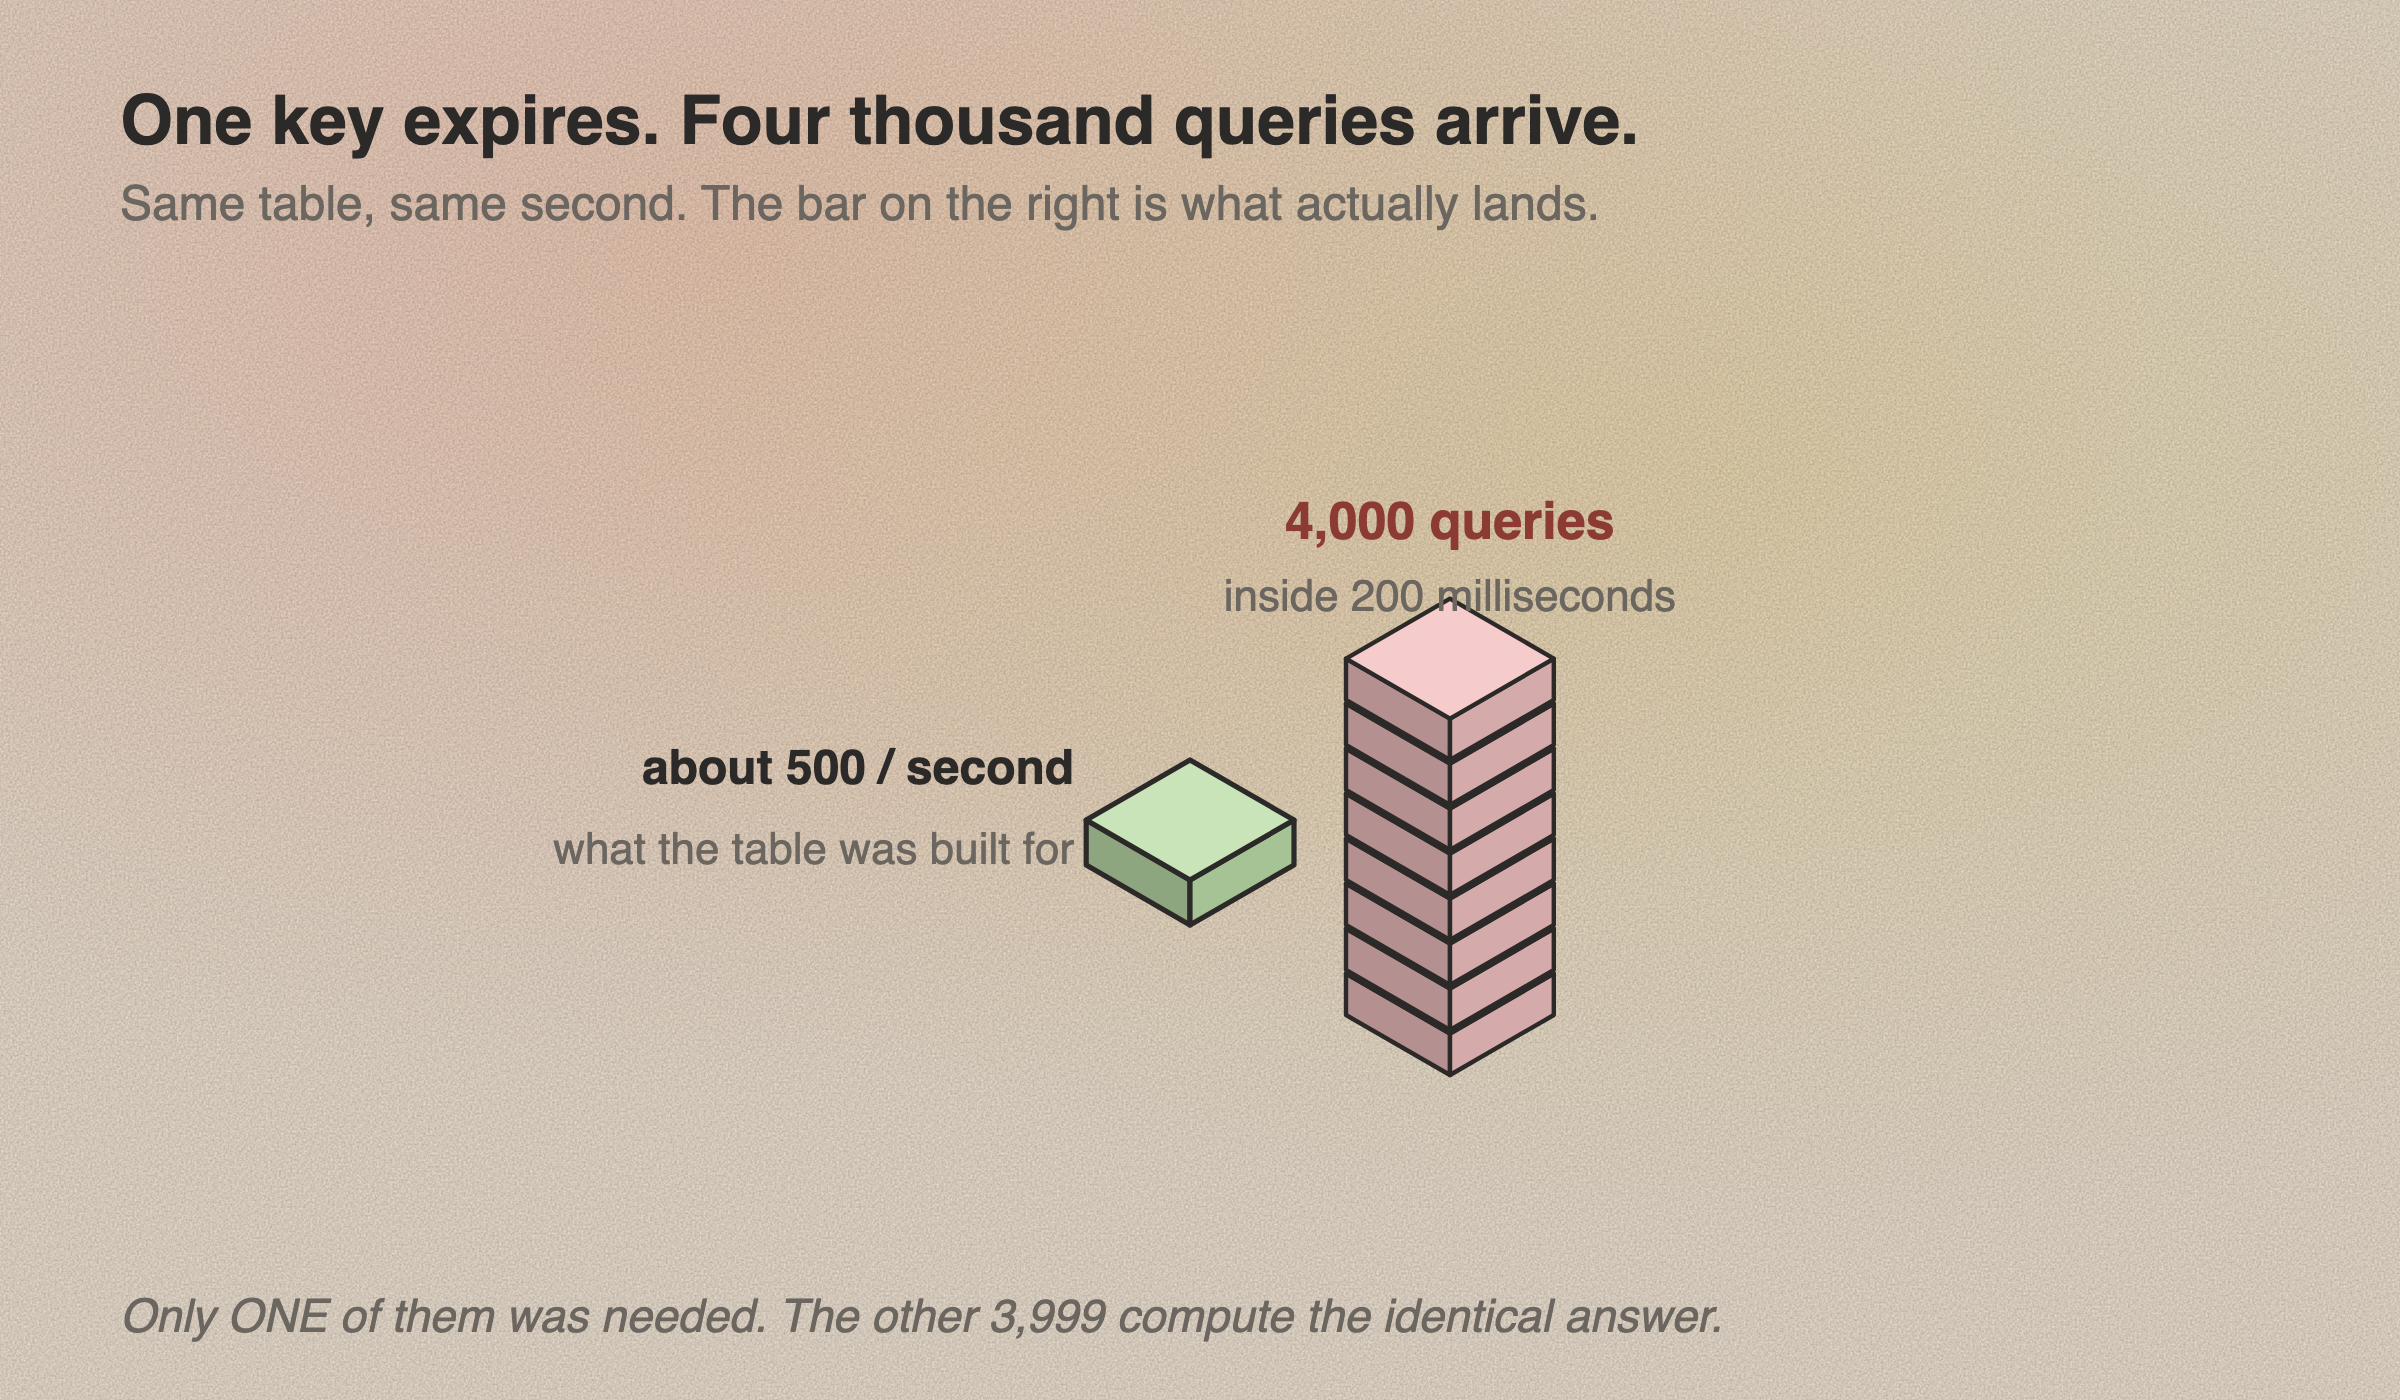
IsometricFigure 12. One key expires, four thousand queries arrive
The two blocks are the same table in the same second. The short one is the load it was sized for. The tall one is what actually lands the moment a popular key expires.
The detail that makes this maddening is at the bottom: every one of those queries is computing the same answer. One of them was necessary. The other 3,999 are duplicated work that arrives as a spike precisely when you can least absorb it.
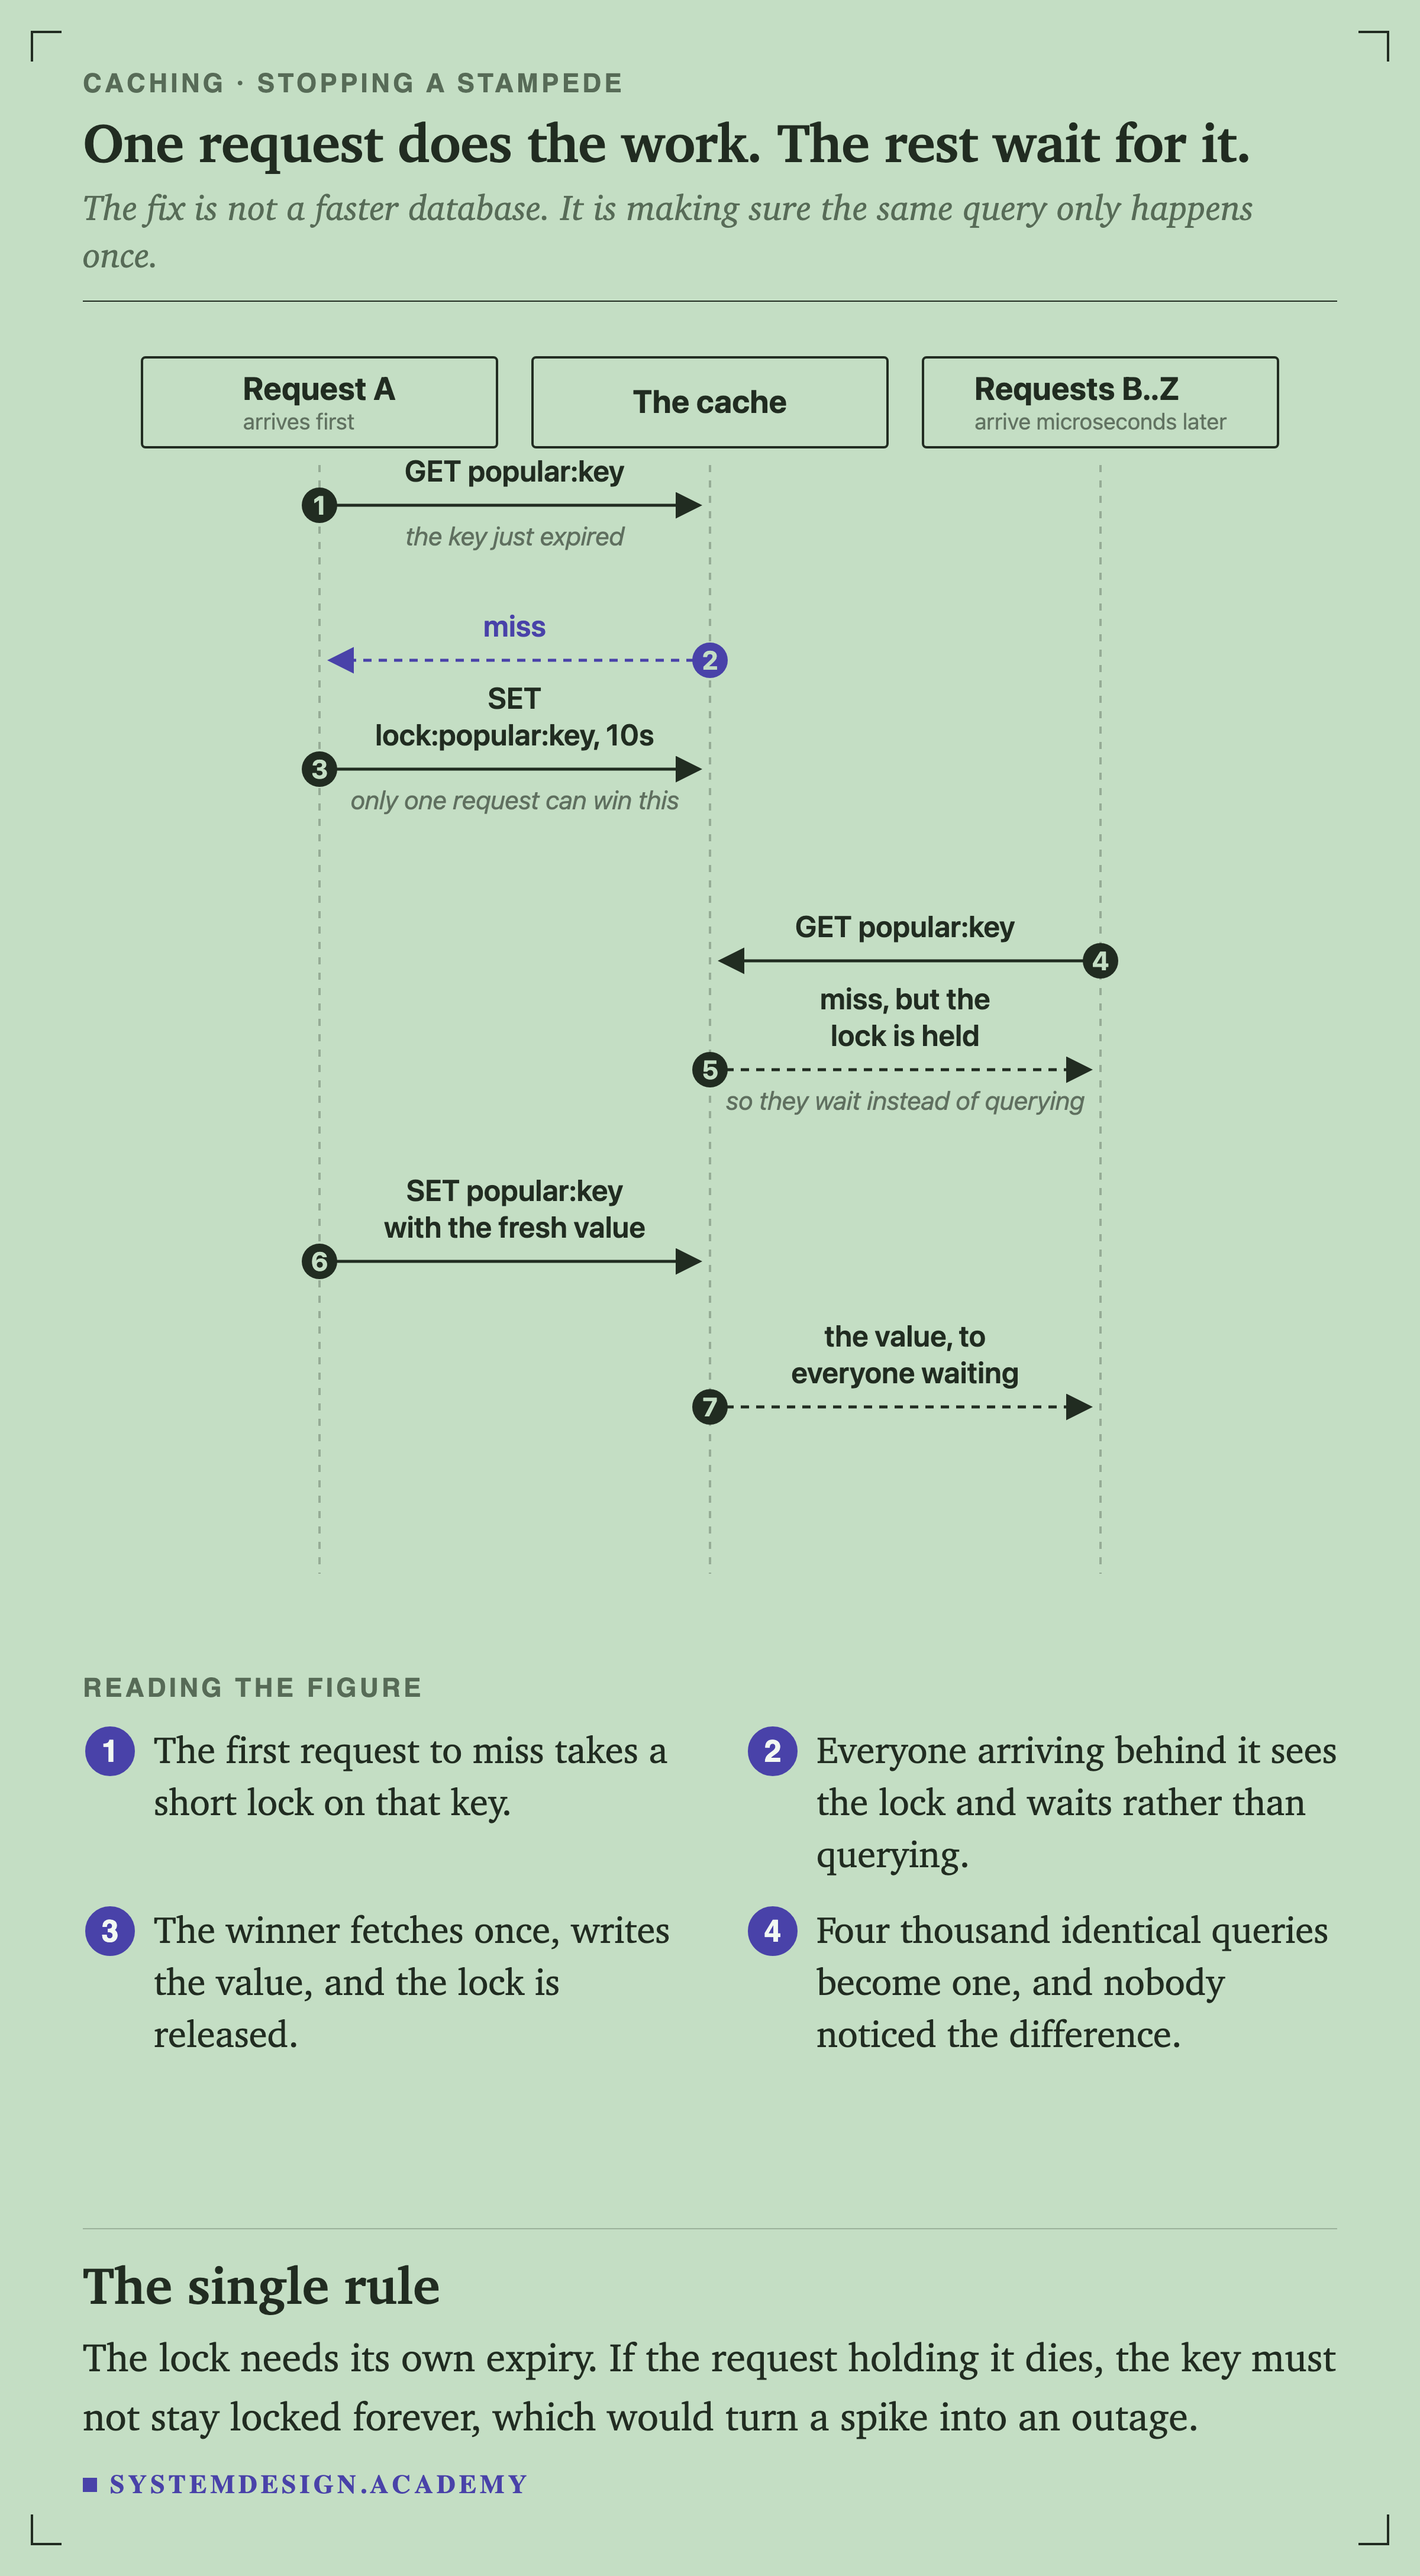
That is why the fix is not a bigger database. It is making sure only one request does the work while the rest wait for it.
How the Giants Cache
Facebook / Meta built TAO (The Associations and Objects cache) because even Memcached wasn't enough on its own. TAO caches the social graph: who is friends with whom, who liked what, who posted where. Their paper, published at USENIX ATC in 2013, states that TAO "can process a billion reads and millions of writes each second", running on thousands of machines over many petabytes of data.
That is the paper's own sentence, and it is worth quoting exactly rather than rounding up. A billion reads per second is already an extraordinary number, and "billions" is a different claim that the paper does not make.
Twitter uses extensively for caching timelines. When you open the app, your timeline is not assembled on the spot by querying hundreds of accounts you follow. It was computed earlier and cached. When someone you follow posts, that post is pushed into the cached timeline of each of their followers, a pattern called fan-out-on-write.
The trade is worth naming, because it is the reason this comes up in interviews. Fanning out on write makes reads cheap and writes expensive: one post by an account with a million followers becomes a million cache updates. That is fine until the account has a hundred million followers, which is why the very largest accounts are usually handled a different way and merged in at read time.
Netflix uses EVCache (built on Memcached) across their . They cache user profiles, playback positions, recommendation results, and much else. Their own engineering writing puts EVCache at upwards of 30 million requests per second at peak, across tens of thousands of Memcached instances, with typical hit rates above 99%.
Note the hit rate. Ninety-nine percent means that for every hundred reads, ninety-nine never reach a database at all. That is what people mean when they say a cache is load-bearing infrastructure rather than an optimisation.
Stack Overflow is the useful counterexample, because they went the other way. They cache aggressively in local memory on each web server rather than reaching for a shared Redis or Memcached tier, and they have written publicly about running the whole site on a famously small number of very powerful machines.
That works for them for a specific reason, and it is the reason worth taking away: their most-cached data is the same for everyone. A rendered question page does not differ per user, so ten servers each holding their own copy wastes some memory and creates no correctness problem. The moment your cached data is per-user, that arithmetic inverts and a shared cache wins.
Quick Check
Knowledge Check
4 questions - Score 80% to pass
Q1
Your cache has a TTL of 5 minutes. A product price changes in the database. What's the worst-case scenario for how long users see the stale price?
Q2
A popular cache key expires at exactly 12:00:00. 5,000 requests arrive simultaneously, all requesting that key. What problem might occur?
Q3
You're choosing between local application cache (in-memory HashMap) and a distributed cache (Redis). Which factor would make you choose Redis?
Q4
Which caching pattern would you choose for data that is read 1000x per second but updated once per hour?
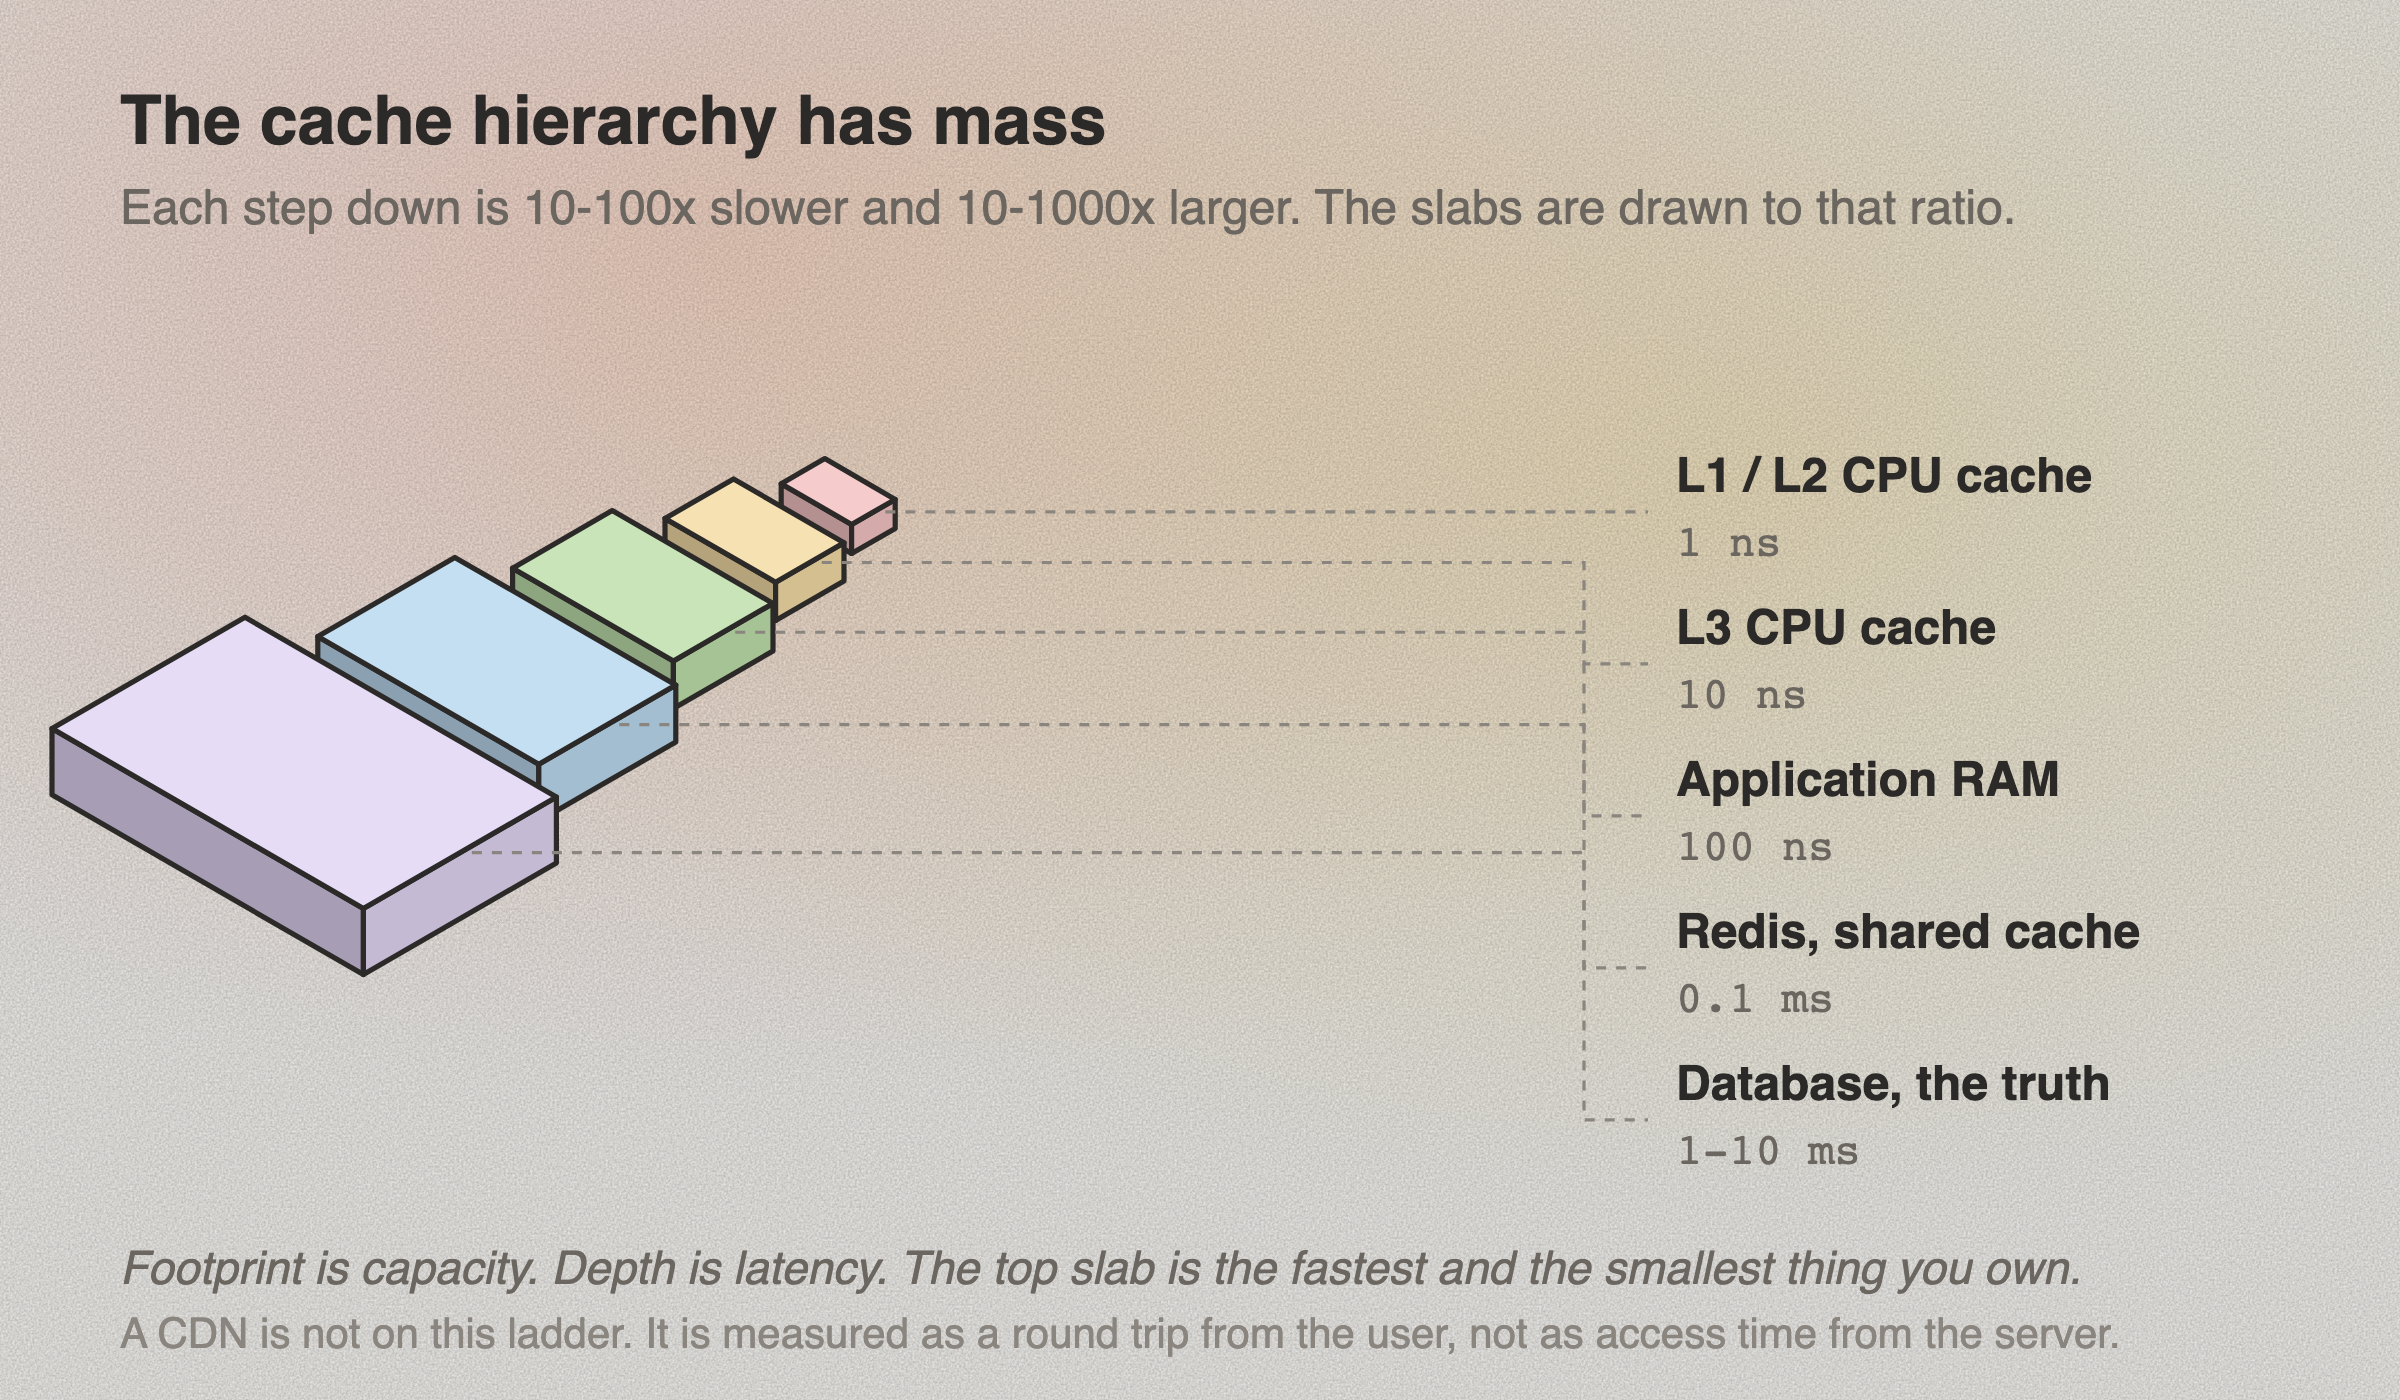
The layered view names the tiers, but it draws them as bands of equal size, which hides the thing that actually decides where you cache. Here is the same hierarchy drawn with volume:
IsometricFive tiers on one axis, drawn to scale
Every slab is a place your data can live. The higher a slab sits, the faster you reach it and the smaller it is. The top slab, the CPU cache, answers in about a nanosecond and holds almost nothing. The bottom slab, the database, takes about a million times longer and holds everything. That trade is why caching is a design decision instead of a switch you flip: you are choosing what is small and hot enough to earn a place near the top.
The CDN is missing on purpose. It belongs in the hierarchy, just not on this axis. Every tier here is measured as how long the server waits to read the data. A CDN number, the familiar 5 to 50 milliseconds, is measured as how long a user's request takes to reach the nearest edge and come back. Put both on one ladder and the picture starts arguing with itself, because a 5 to 50 millisecond CDN would look slower than a 1 to 10 millisecond database, which is nonsense: a CDN hit means the database is never touched at all. The CDN is about distance. This figure is about depth.
Application-Level Cache (Local)
Your application server stores frequently accessed data in its own memory. A Python dictionary, a Node.js Map, a Java HashMap. Blazing fast (no network hop), but the cache is per-server, if you have 10 servers, each one builds its own cache independently, which means wasted memory and potential inconsistencies.
Distributed Cache (Redis / Memcached)
A dedicated caching server (or cluster) that all your application servers share. is the most popular choice. It sits between your application and your database, and all servers read from and write to the same cache. This solves the consistency problem of local caches, everyone sees the same cached data.
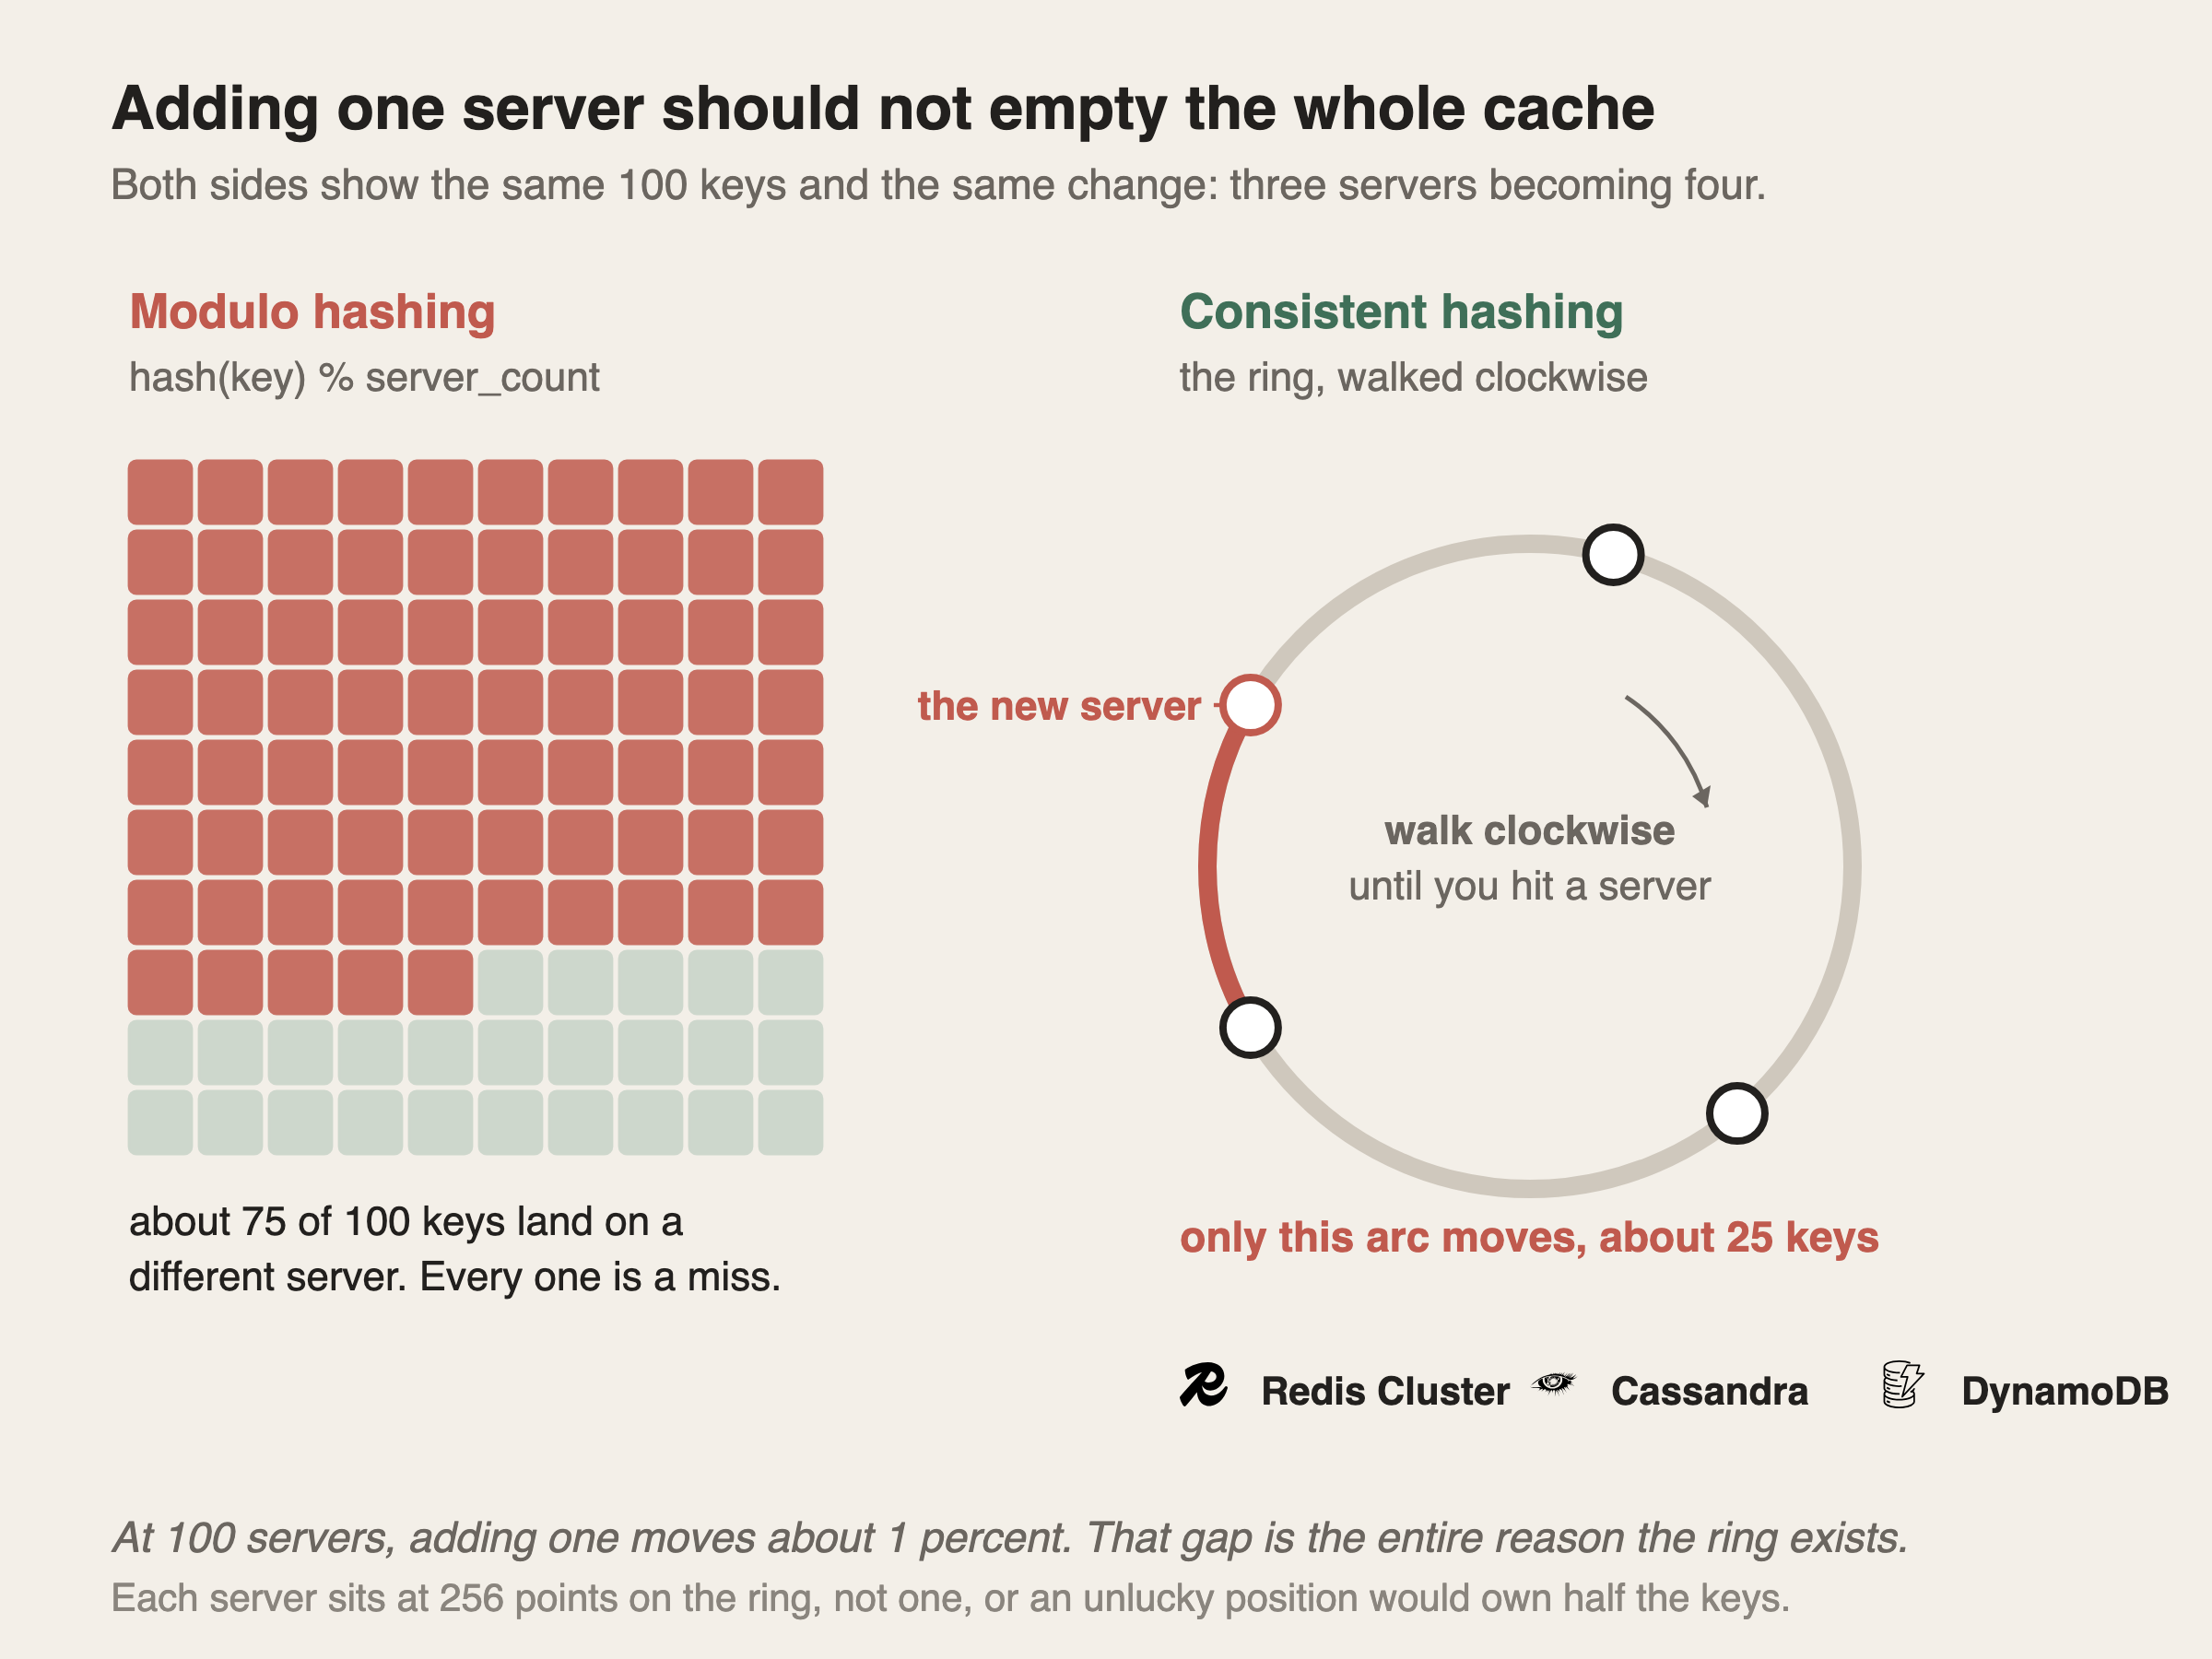
Once the cache is a cluster rather than one box, a new question appears: which server holds which key? The obvious answer is the one that bites.
ArchitectureFigure 5. The same change, under two different rules
Picking a server with hash(key) % server_count works perfectly until the count changes. Add one server to three and the divisor becomes four, so nearly every key computes a different answer: about 75 of these 100 keys move, and every one of those is now a miss that has to be refetched from the database, all at once.
puts servers at points on a ring and walks each key clockwise to the next one. Adding a server only steals the arc behind it, so only about 25 keys move and the rest never notice. At three servers that is 75 against 25; at a hundred servers, adding one moves roughly one percent. That widening gap is the entire reason the ring exists, and it is why Redis Cluster, Cassandra and DynamoDB all use it.
One detail worth carrying: each server sits at around 256 points on the ring rather than one. With a single point each, an unlucky position would leave one server owning half the keyspace.
Database Query Cache
Most databases have built-in caching. Postgres uses shared_buffers to cache frequently accessed data pages in RAM. MySQL has its query cache (though it's been removed in MySQL 8.0 because it caused more problems than it solved at scale). This is the "free" caching layer, it happens automatically, but it's limited to what fits in the database server's RAM.
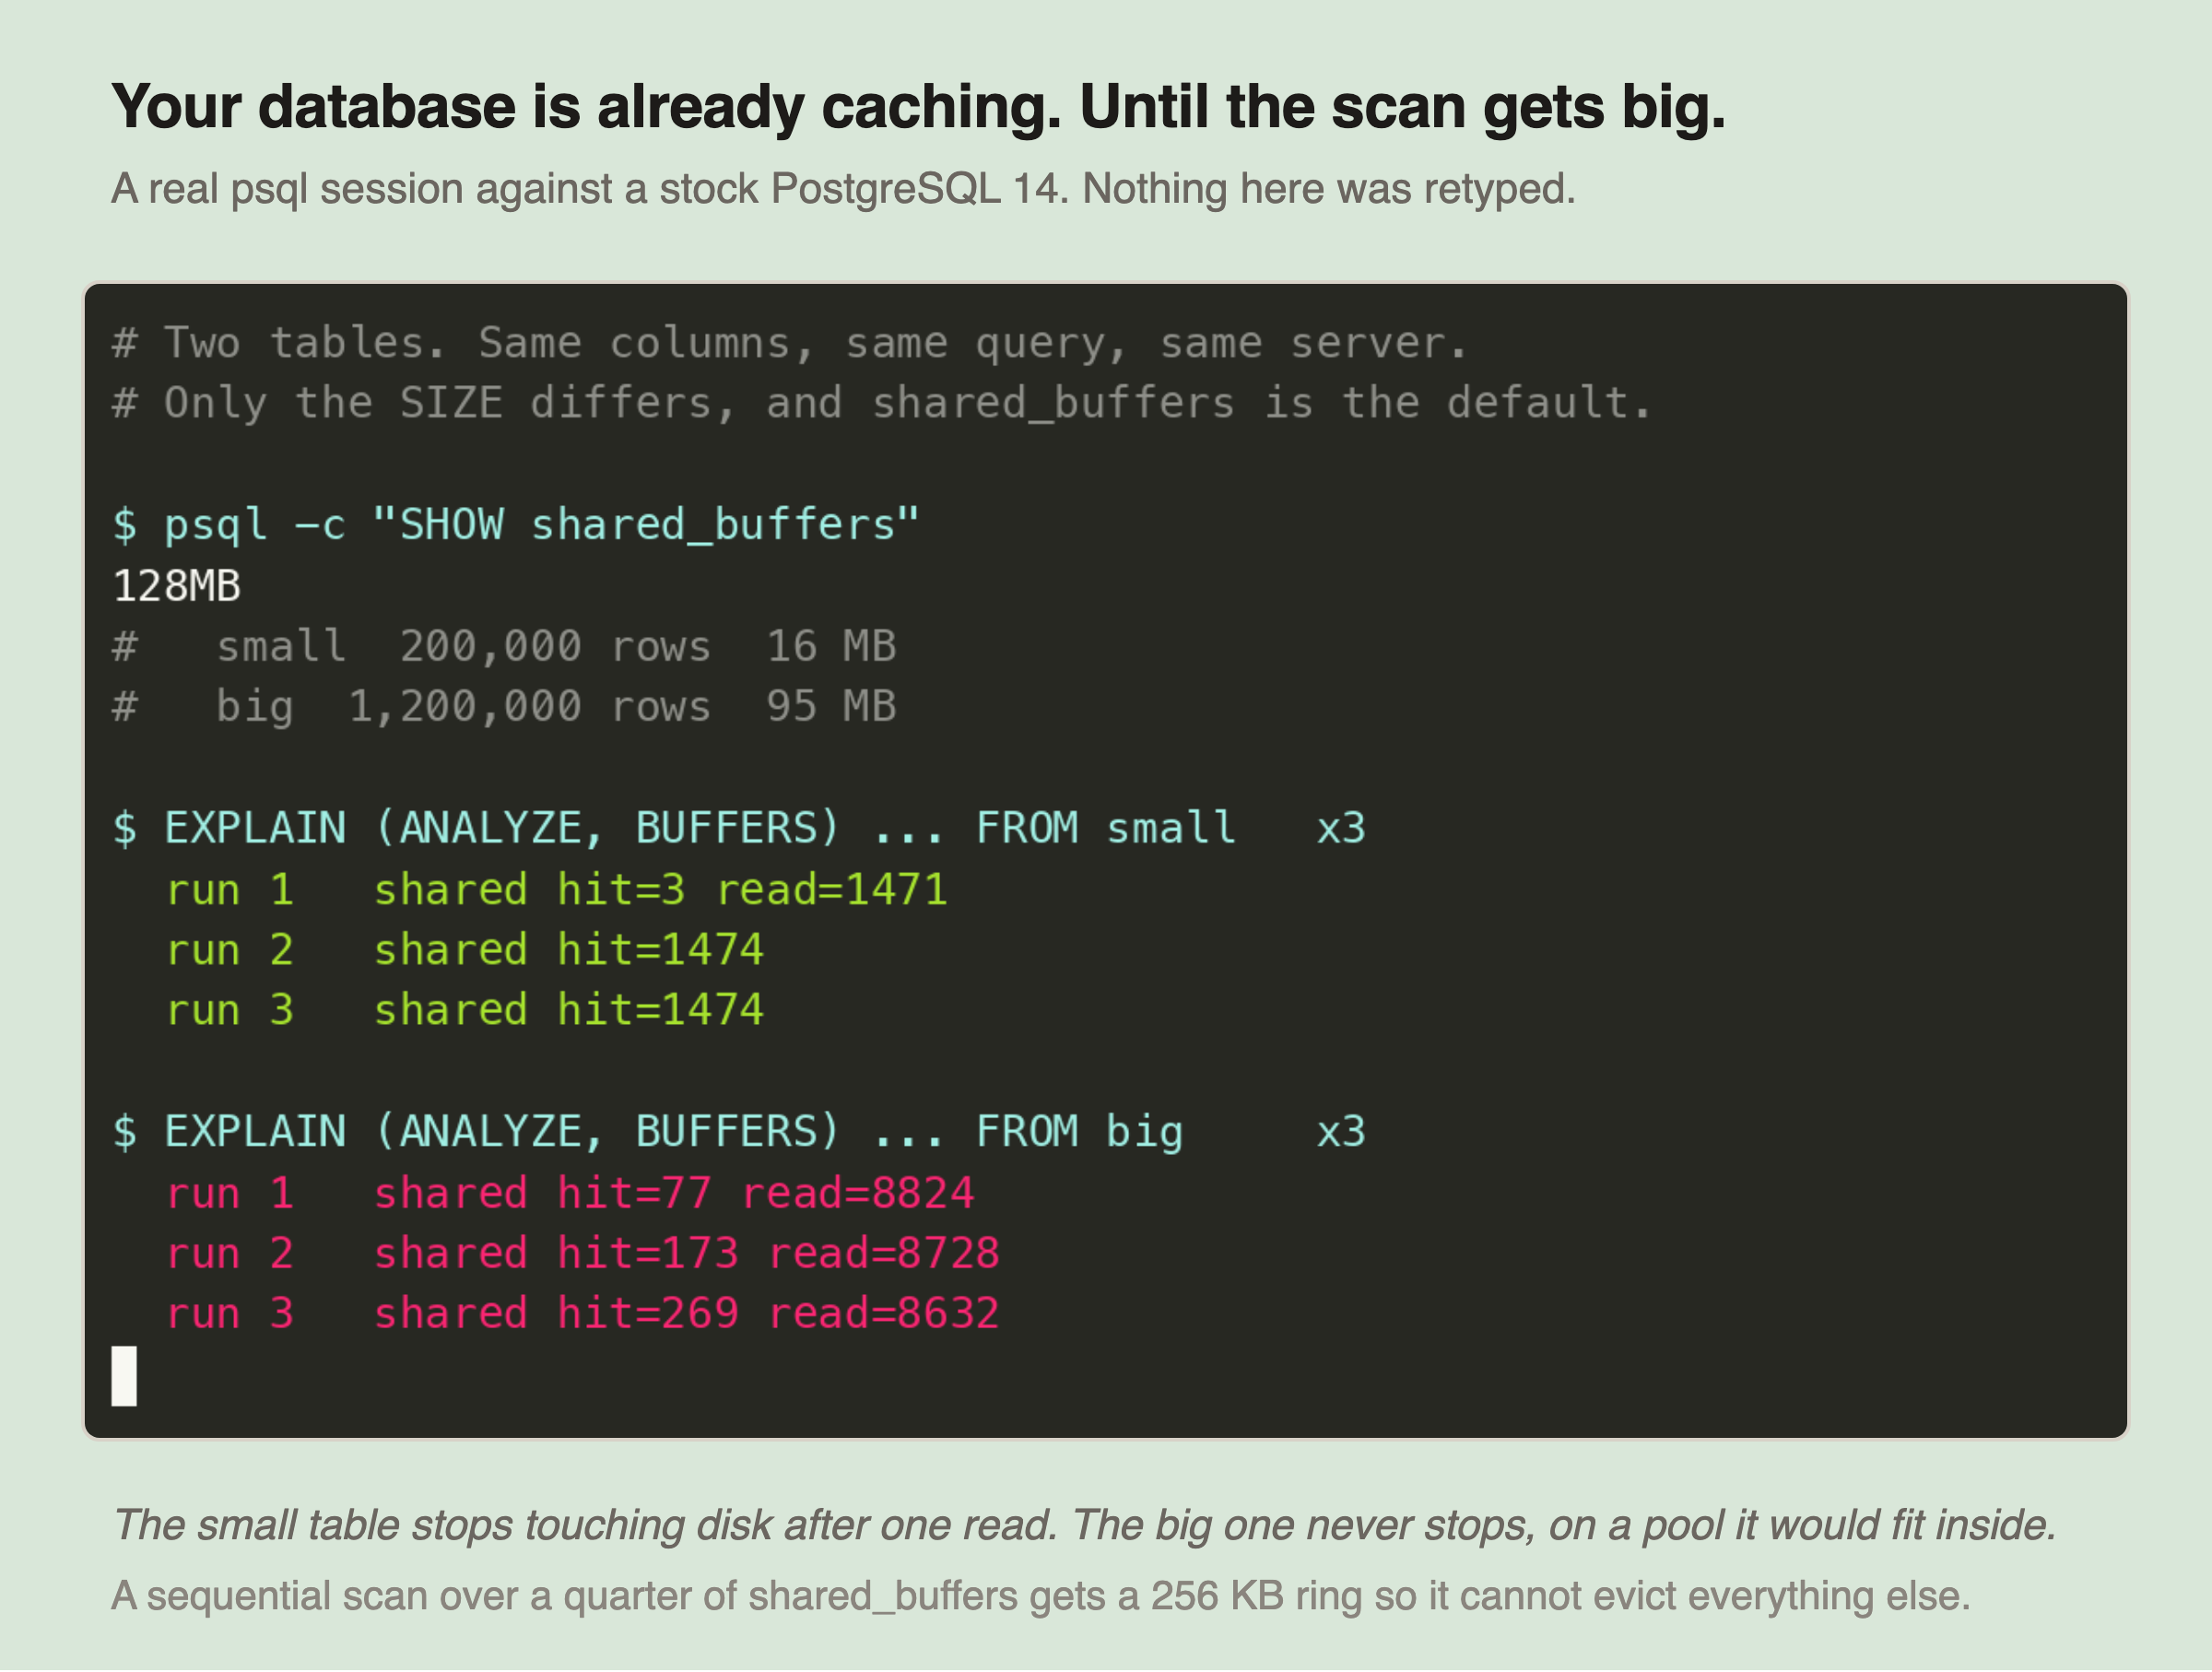
You do not have to take that on trust. Here it is happening, in a real session:
RecordedFigure 8. The database caching for you, and where it quietly stops
The small table stops touching disk entirely after one read. Its 1,471 blocks move into the pool and stay there, so the next two runs are pure hits. That is a real cache working for free, and it is why a slow query often looks fast the second time you try it in a console.
Now look at the big table, because the surprising part is not that it is slower. It is 95 MB against a 128 MB pool, so it fits, and it still reads from disk on every single run. The reads go 8824, 8728, 8632: barely moving.
The reason is a deliberate piece of Postgres design worth carrying with you. A sequential scan over more than about a quarter of shared_buffers is given a small ring buffer of its own, around 256 KB, precisely so that one large scan cannot evict everything else in the cache on its way past. Postgres is protecting the pool from your query. Your data fitting in memory is not the same as your data being cached, and no amount of adding RAM changes that particular behaviour.
The rule of thumb:
Put caches as close to the user as possible. Browser cache > CDN > Application cache > Distributed cache > Database cache. Each layer closer to the user avoids more network hops and more processing.
24 hours
Static content, images
Minimal concern
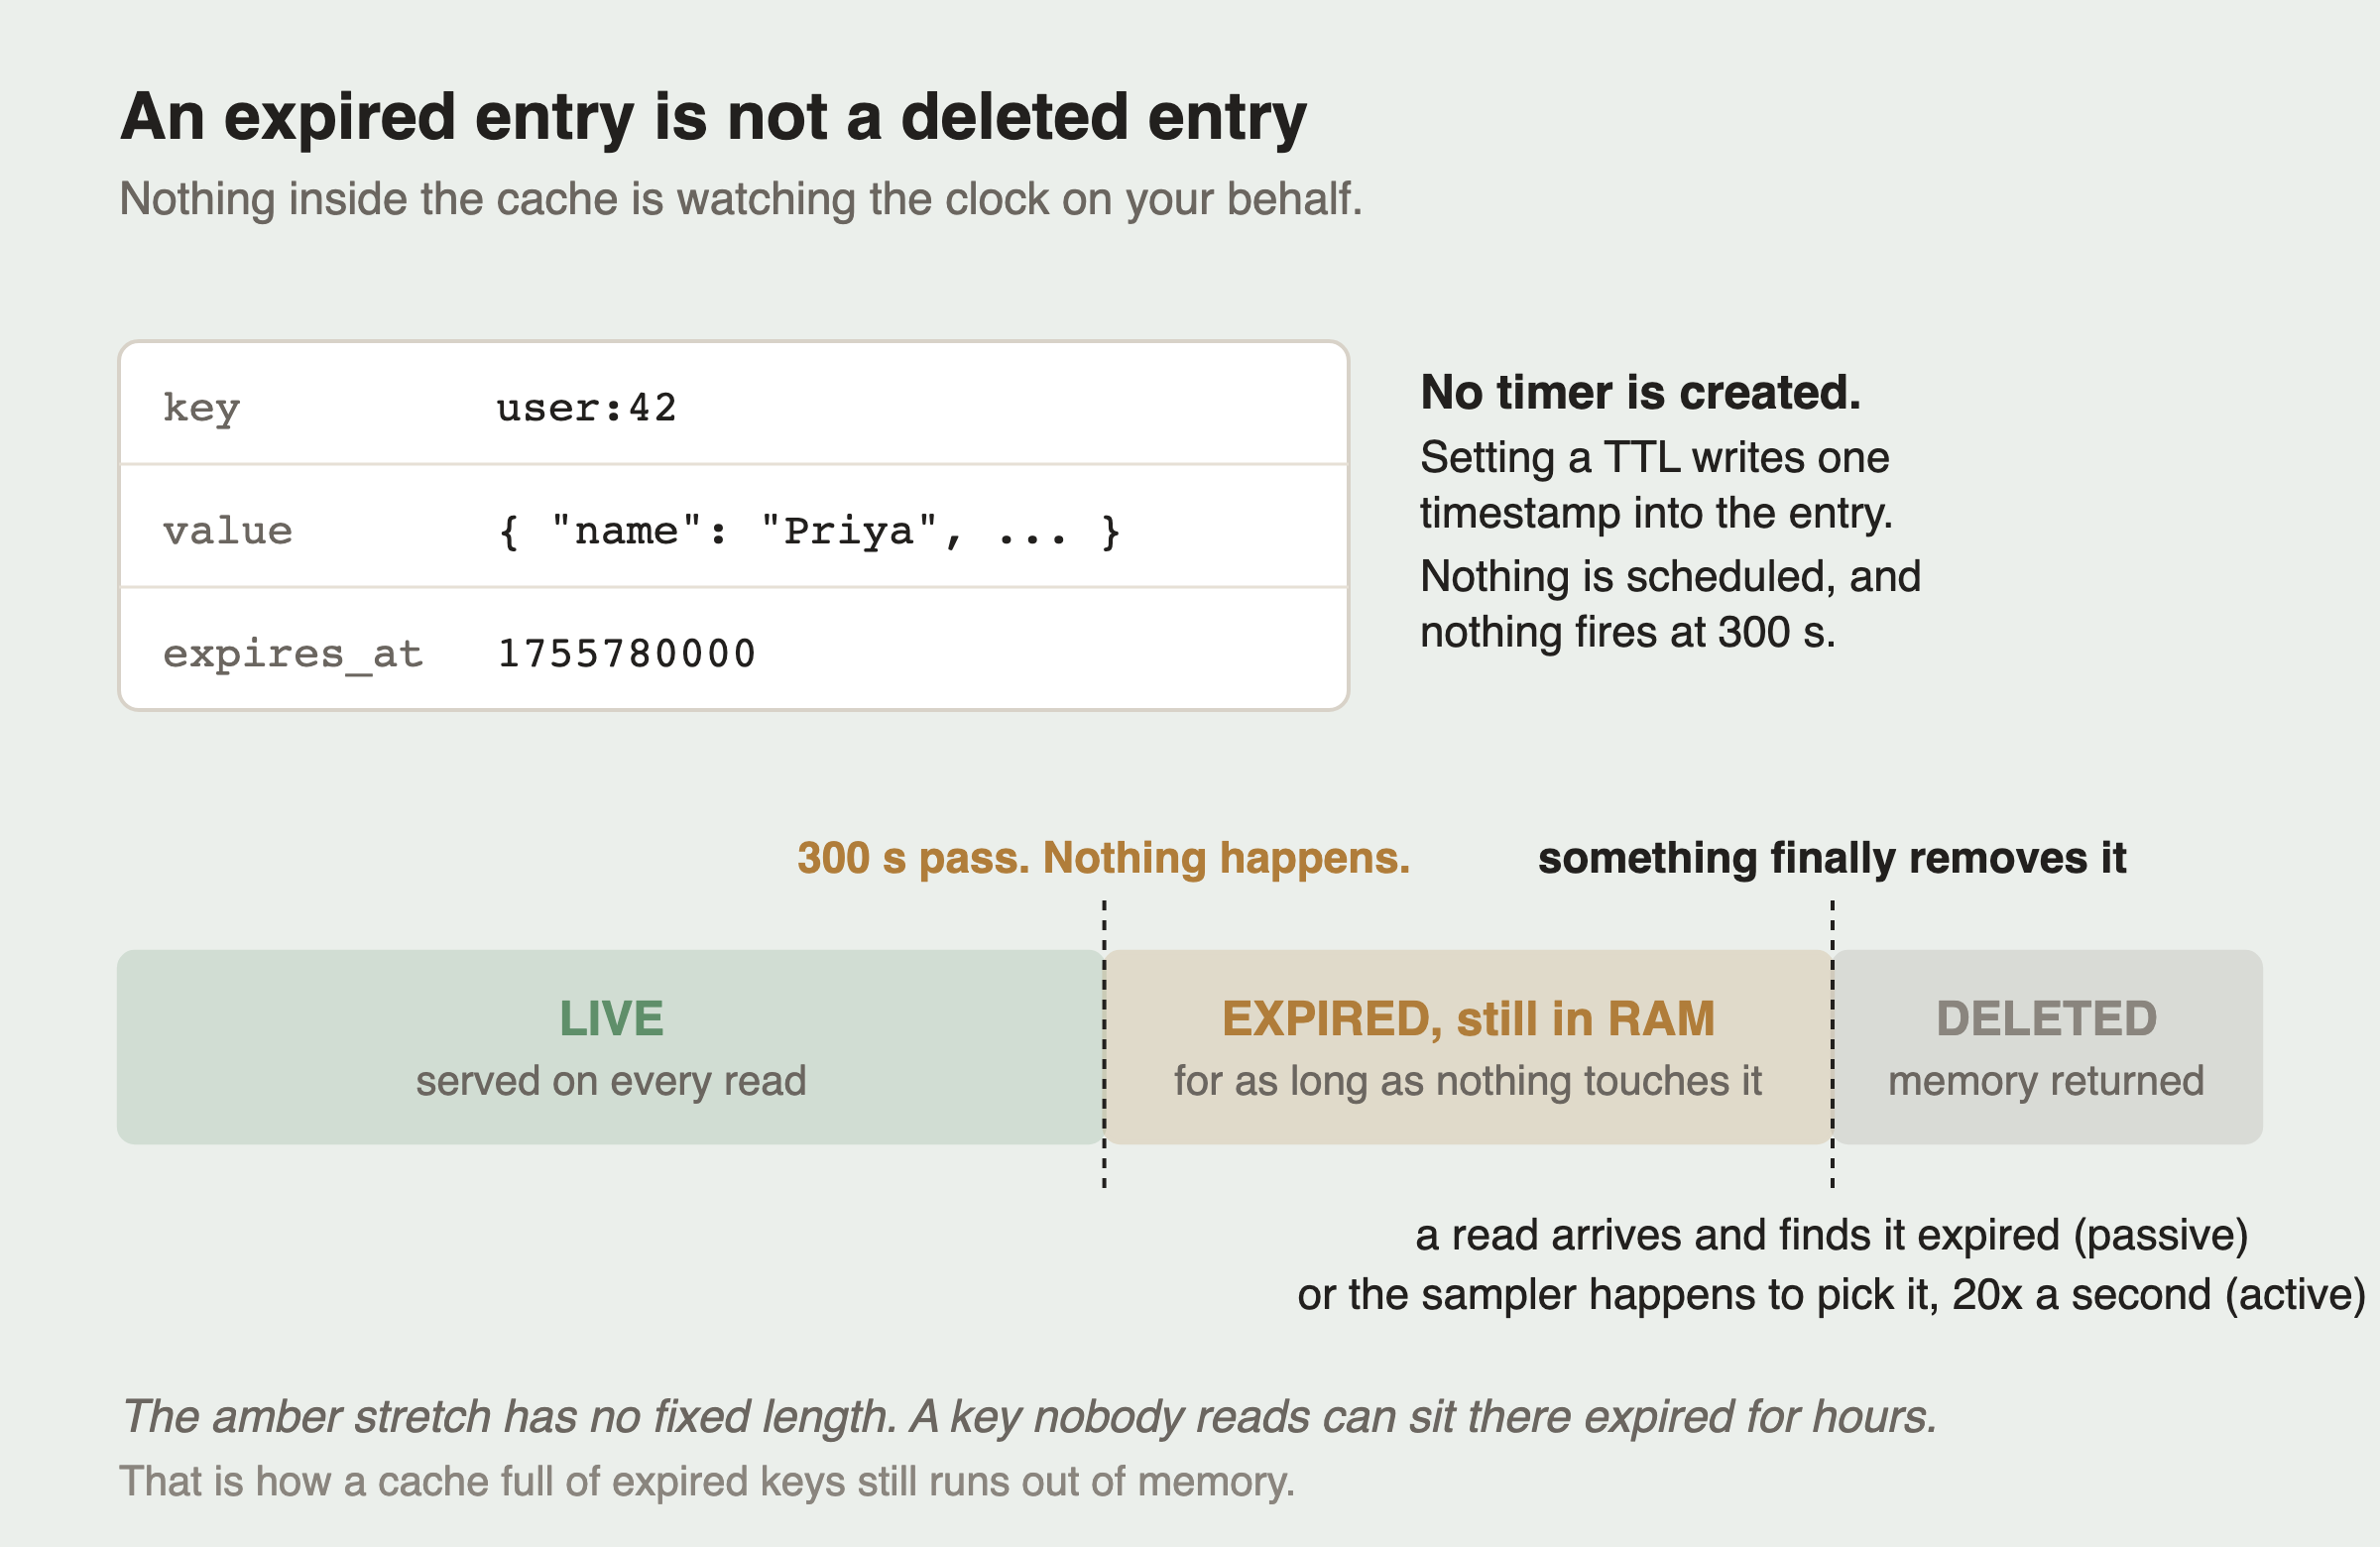
Before you rely on a TTL, it is worth knowing exactly what setting one does, because it is less than most people assume.
ArchitectureFigure 6. An expired entry is not a deleted entry
Setting a TTL does not start a countdown. It writes a single timestamp into the entry and nothing else happens. No timer exists, nothing is scheduled, and nothing fires when the clock passes 300 seconds.
The entry is removed only when something happens to notice: a read arrives and finds it expired, or a background sampler happens to pick it. Until one of those occurs it is still sitting in RAM, taking up space, simply no longer served.
That amber stretch has no fixed length. A key nobody reads can sit expired for hours, which is how a cache full of expired keys still manages to run out of memory.
Write-Through / Write-Behind: When data changes in the database, immediately update the cache too. Write-through updates the cache synchronously (in the same operation). Write-behind updates the cache asynchronously (in the background). This keeps the cache always fresh, but adds complexity to every write operation.
Write-behind carries a cost that is easy to sign up for without noticing, so it is worth seeing drawn.
IsometricFigure 11. What the database has never heard of
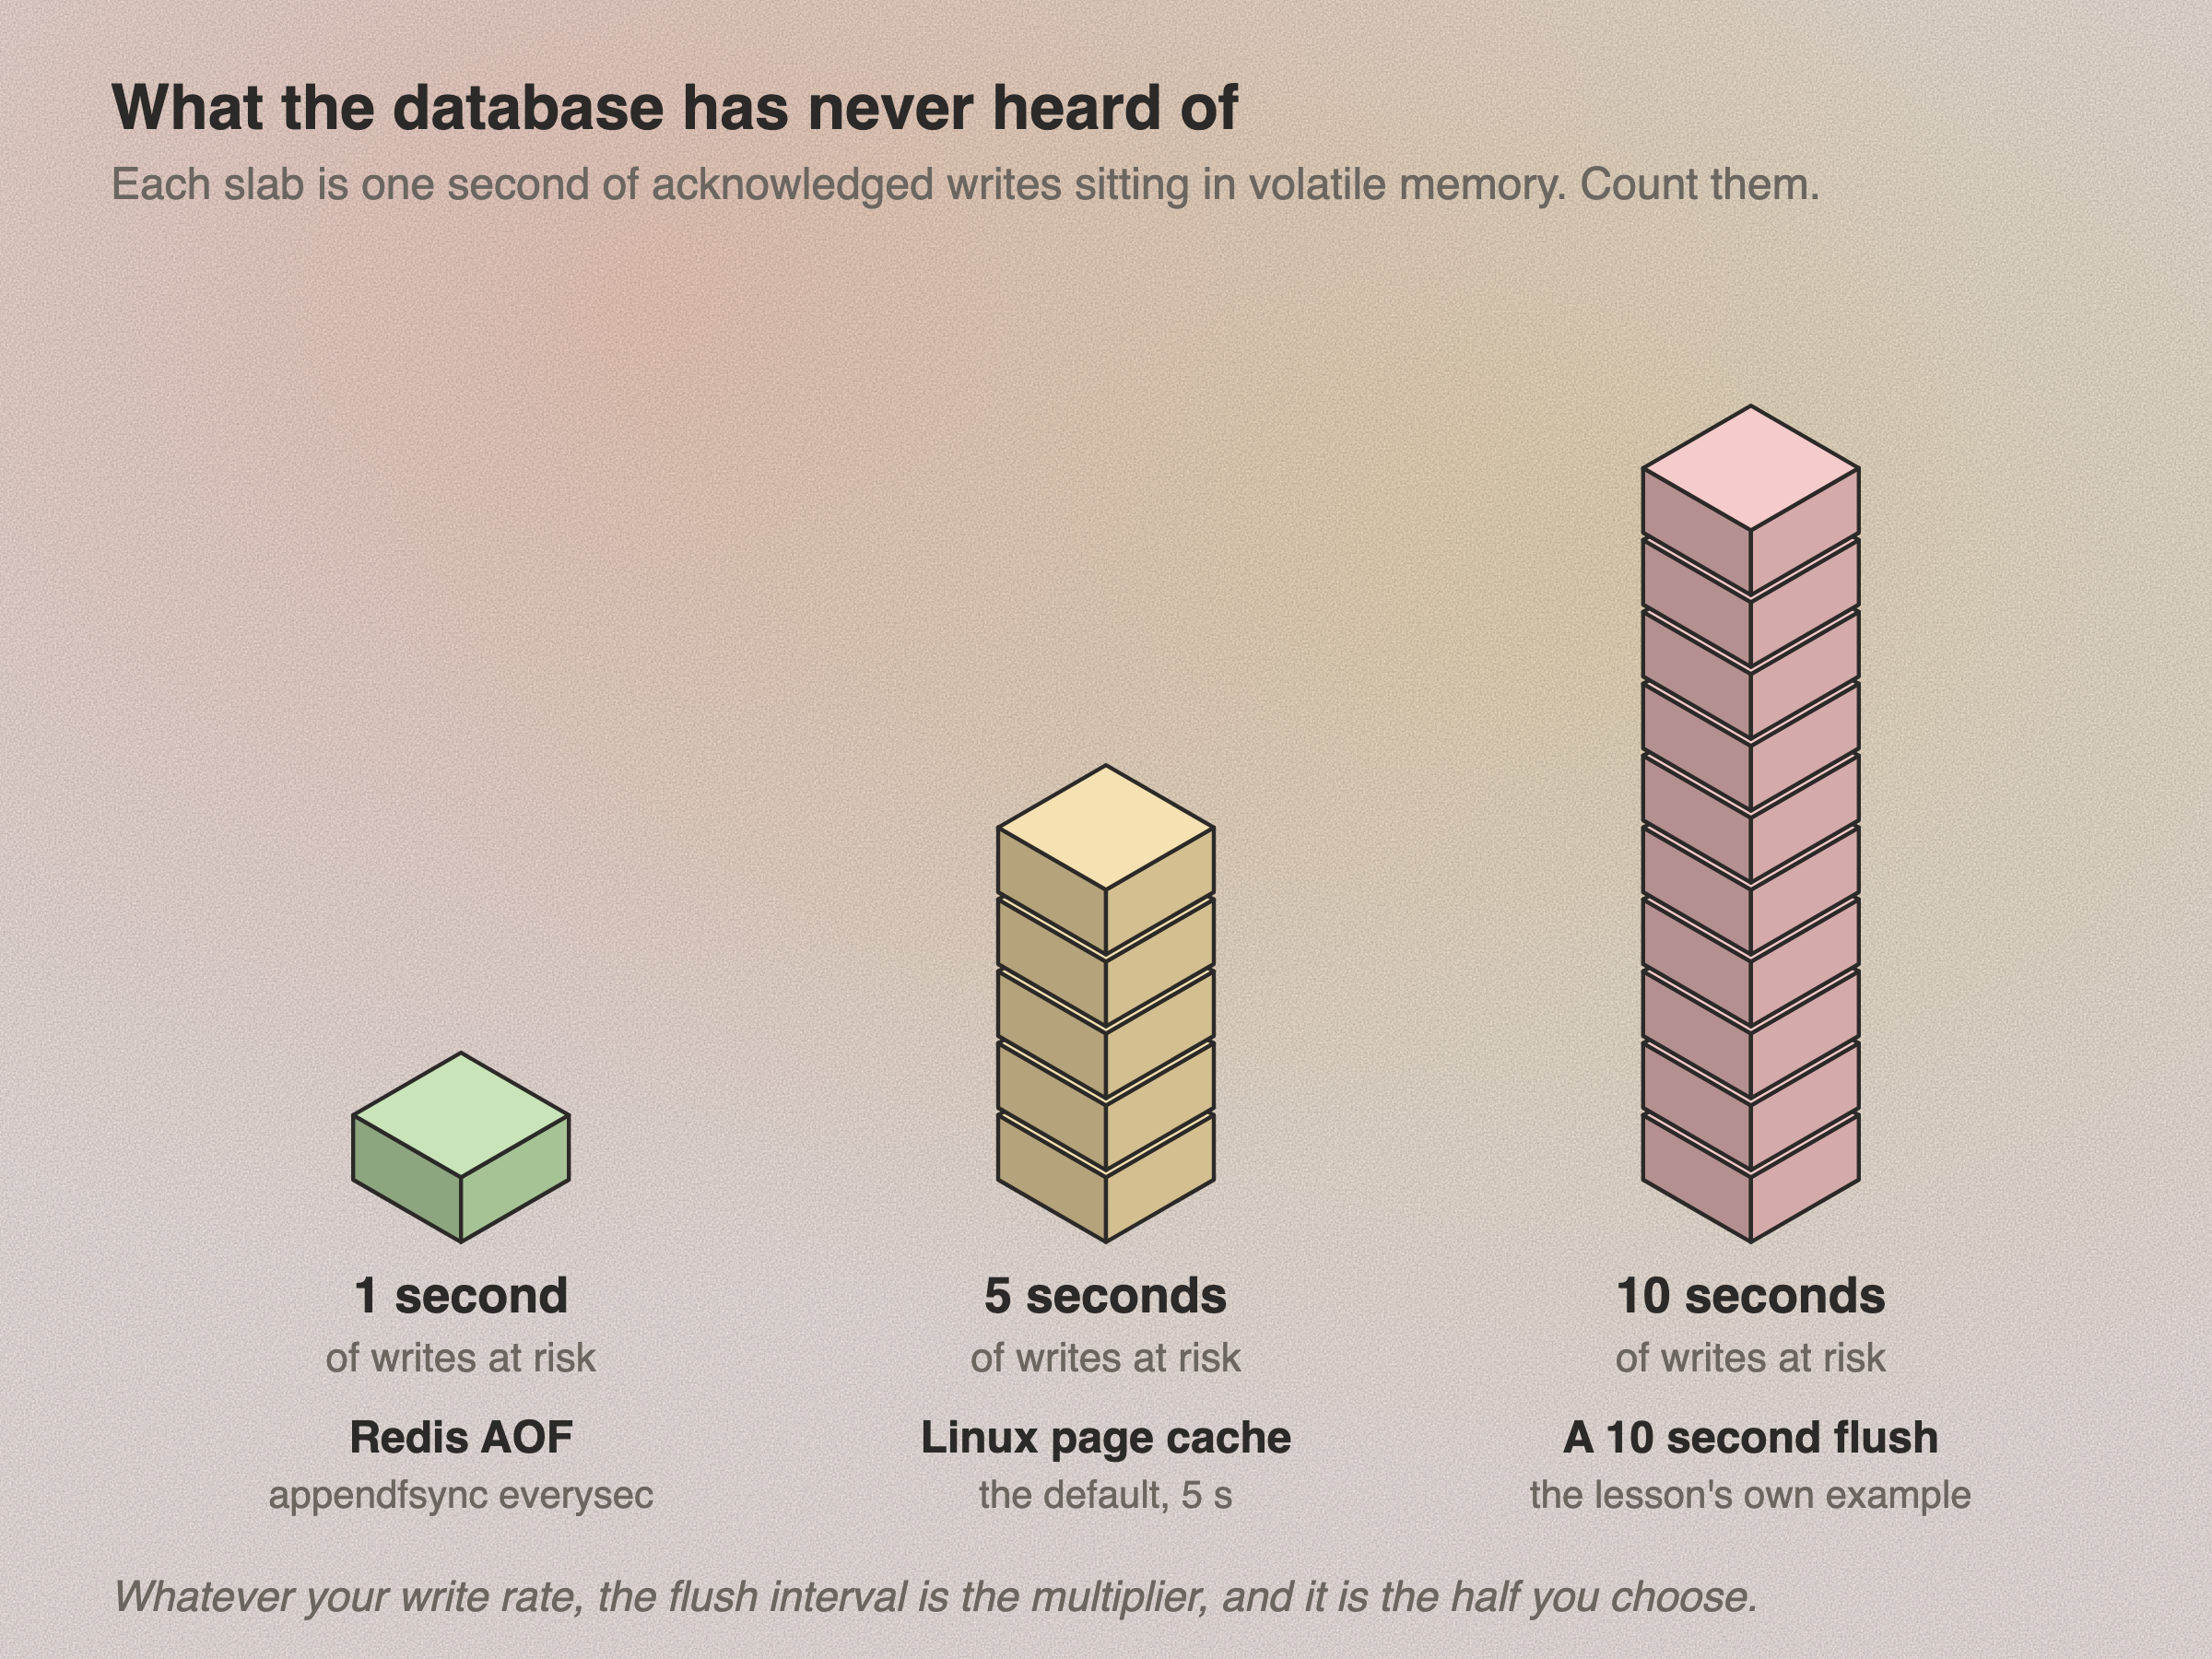
Every slab is one second of writes your application has already told the user succeeded, sitting in memory that has not reached durable storage. If the process dies, that is what is gone, and the database never knew those writes existed.
The stacks are drawn to scale because the relationship is the point: the flush interval is a straight multiplier on how much you can lose. with appendfsync everysec risks about a second. The Linux page cache defaults to around five. A ten second flush risks ten.
Your write rate is set by your traffic. The interval is the half you actually choose, and choosing it is choosing how much data you are willing to lose.
Event-Based Invalidation: When data changes, publish an event ("product-price-changed"). A listener receives the event and deletes or updates the relevant cache entry. This is the most flexible approach but requires an event system (like or Redis Pub/Sub).
In practice, most systems use a combination: TTL as a safety net (even if invalidation fails, the cache will eventually refresh) plus active invalidation for critical data (prices, inventory, authentication).
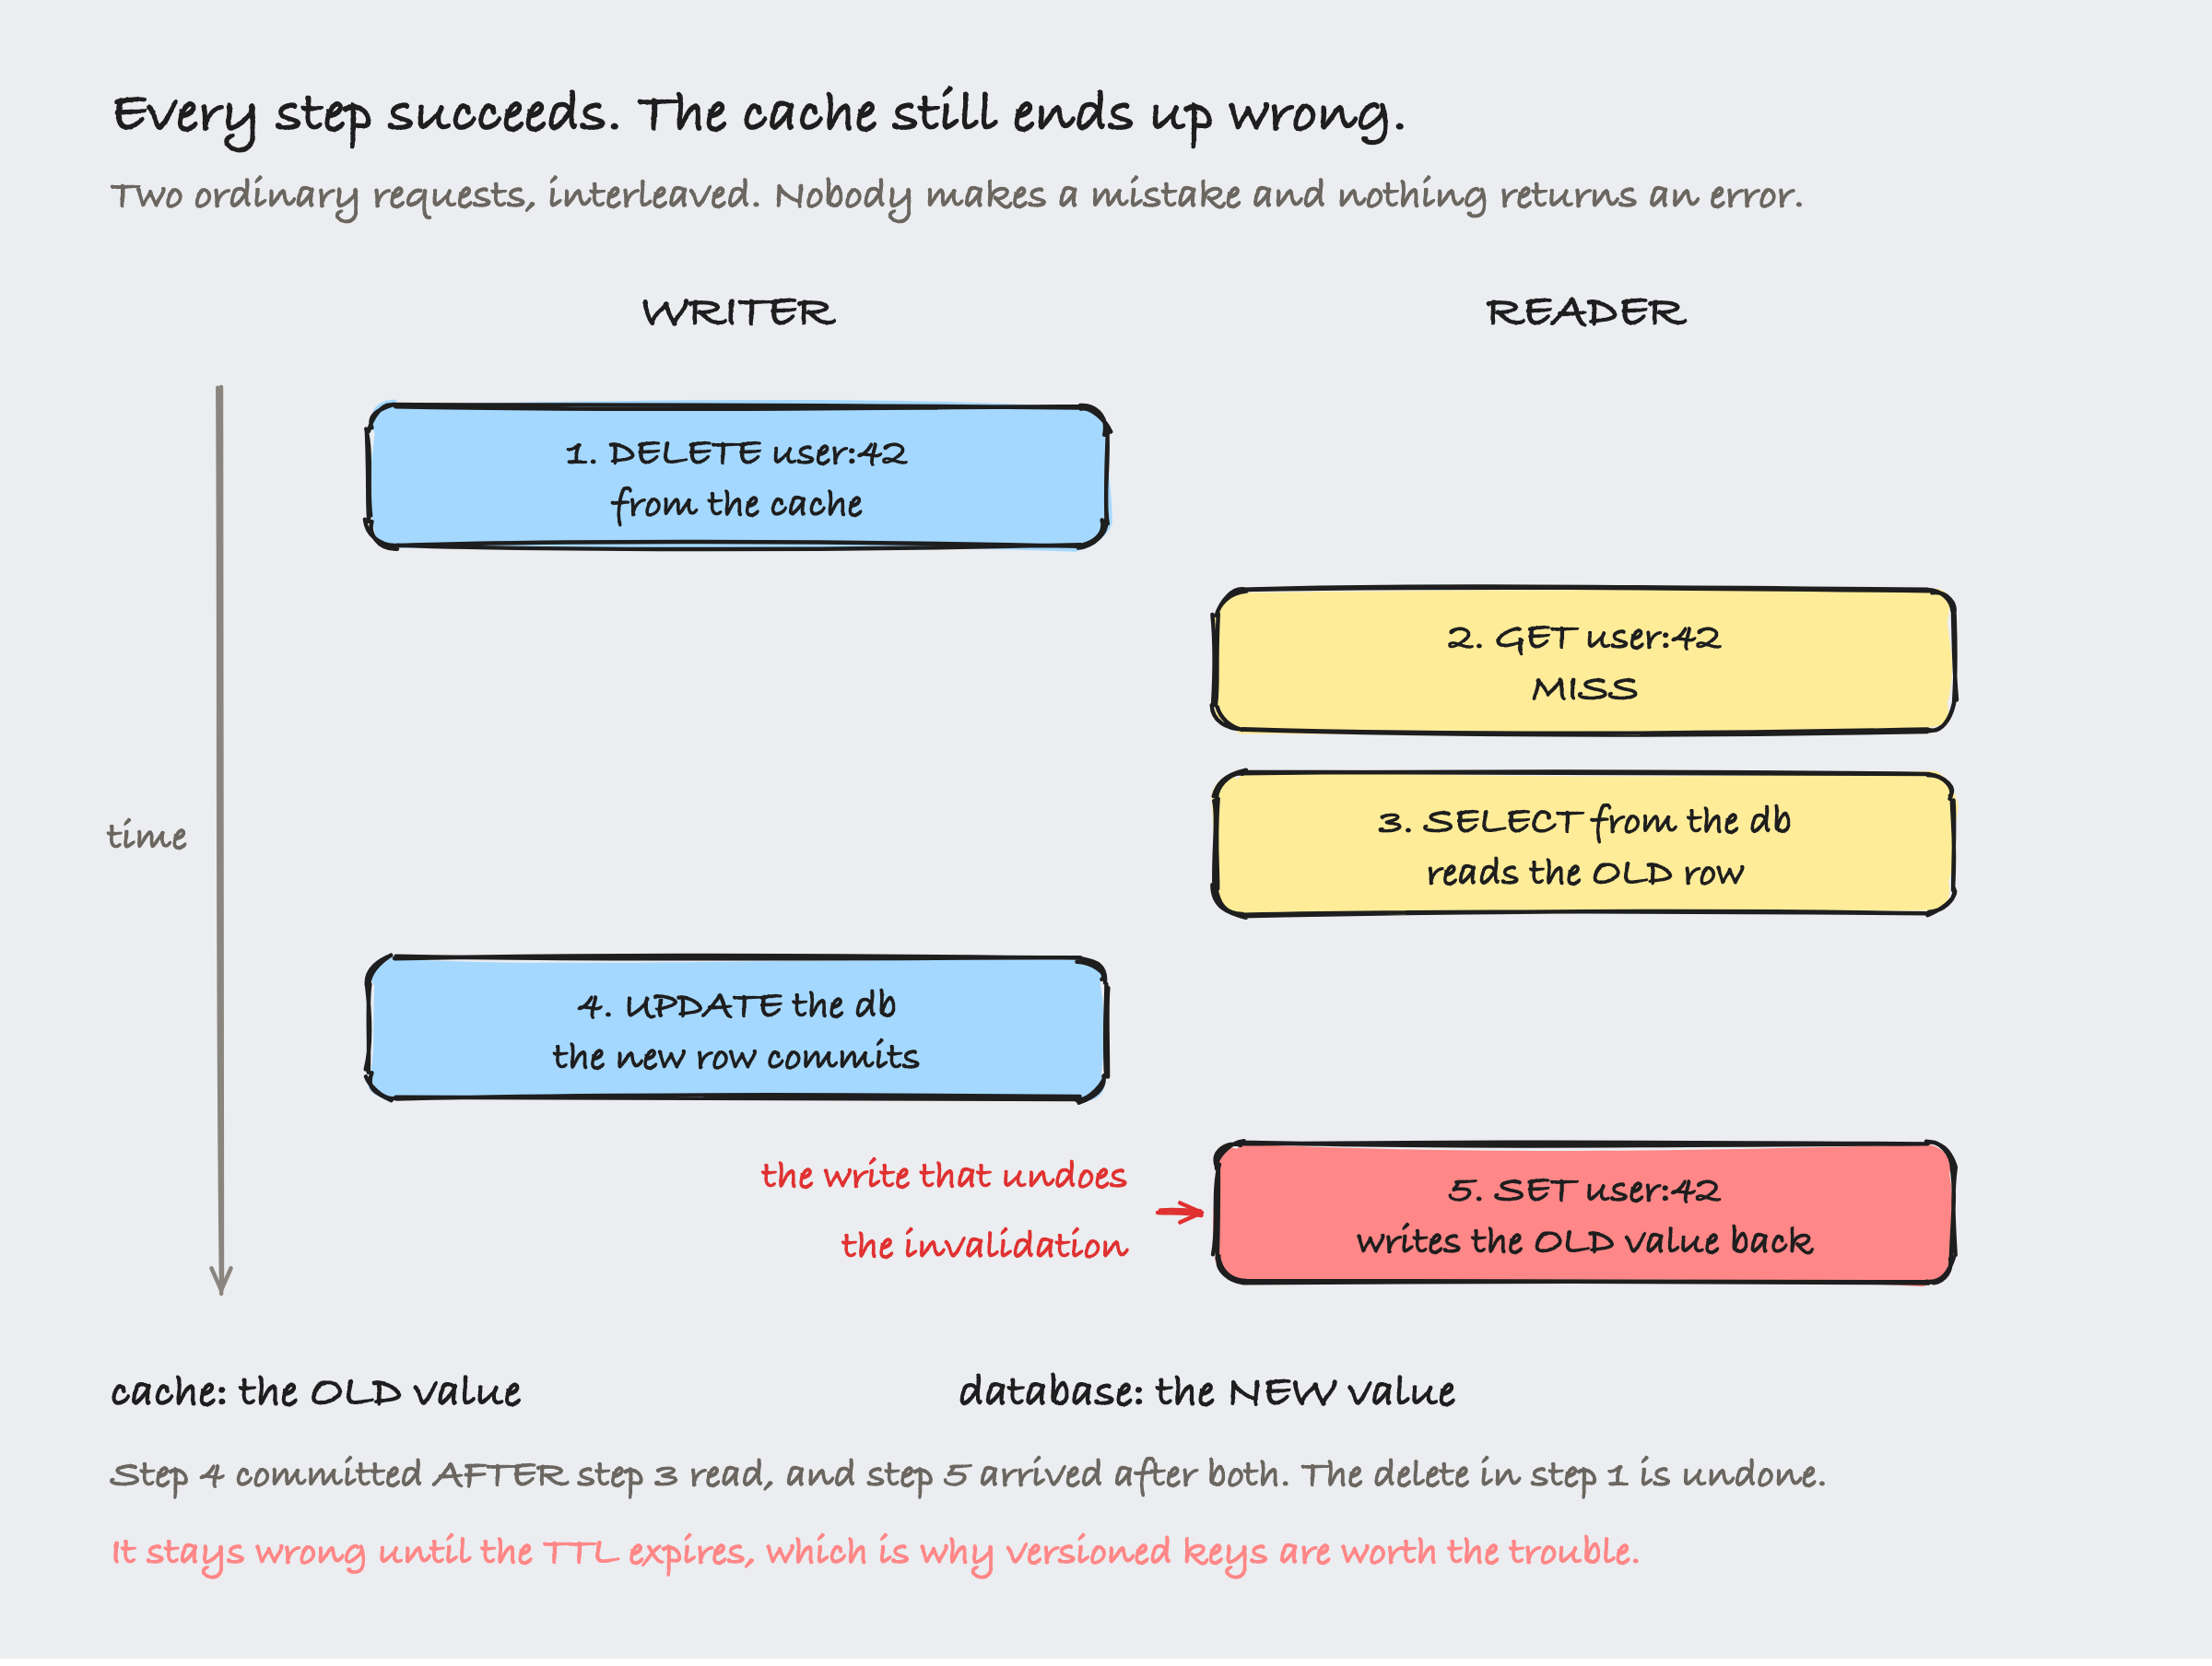
And now the failure that makes invalidation genuinely hard, which is not a bug in any one step.
SketchFigure 10. Every step succeeds and the cache still ends up wrong
Read the five steps in order. Nobody makes a mistake. Nothing returns an error. Every operation does exactly what it was asked to do.
The reader missed the cache and went to the database before the writer's update committed, so it read the old row. Then it did the normal, correct thing at the end of a cache-aside read: it wrote what it found back into the cache. That write landed after the invalidation, so it undid it.
The cache now holds the old value, the database holds the new one, and nothing anywhere is going to notice. It stays wrong until the TTL expires, which is the real argument for a TTL even when you have proper invalidation, and the reason people reach for versioned keys where correctness genuinely matters.
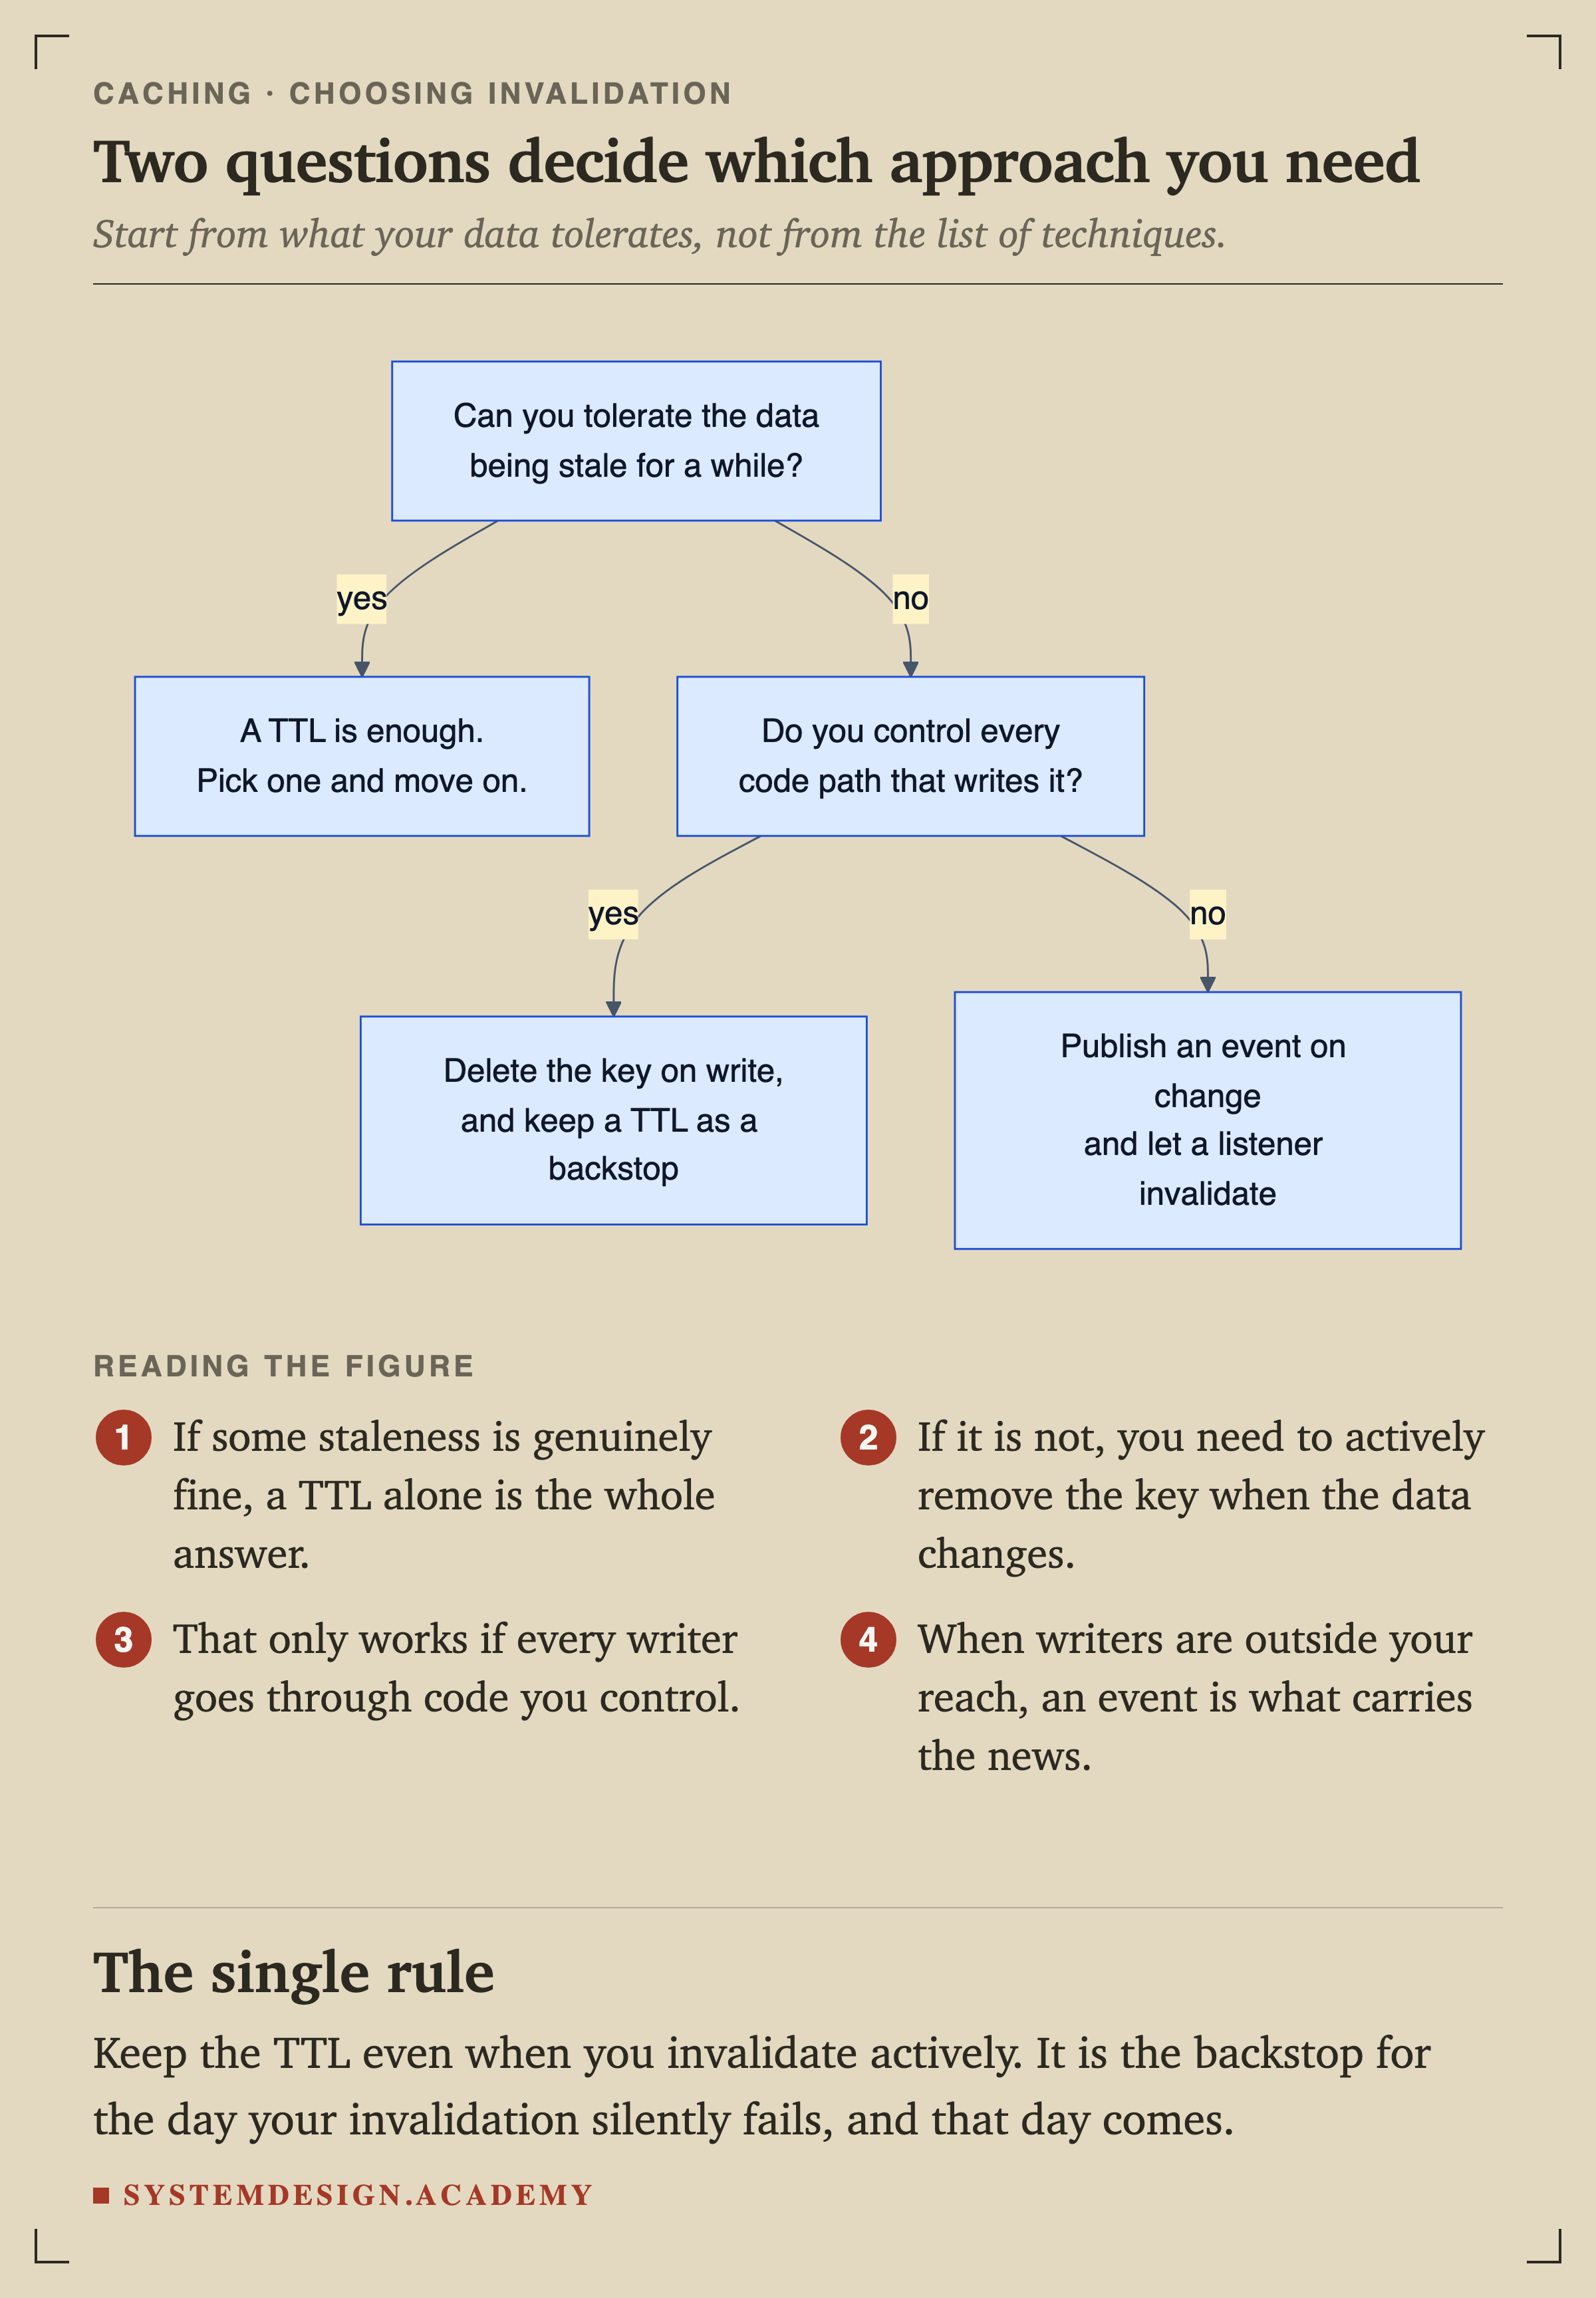
FlowchartFigure 12. Two questions decide which approach you need
Start from what your data tolerates rather than from the list of techniques. If some staleness is genuinely fine, a TTL alone is the entire answer and you can stop there.
If it is not fine, you have to actively remove the key when the data changes, and that only works if every writer goes through code you control. When writers are outside your reach, a published event is what carries the news instead.
Keep the TTL even when you invalidate actively. It is the backstop for the day your invalidation silently fails, and figure 10 is what that day looks like.
The payoff is the second read. Another request for user:42 stops at step 1 and never reaches the database.
Read-Through
The cache itself is responsible for loading data on a miss. Your application only talks to the cache, never directly to the database. If the cache doesn't have the data, it fetches from the database, caches it, and returns it. This simplifies application code but means the cache needs to know how to query your database.
Write-Through
Every write goes through the cache to the database. When you update data, the cache is updated first, then the database. The cache is always up to date, but writes are slower because they hit two systems. This eliminates the stale data problem at the cost of write .
Pattern
Read Performance
Write Performance
Data Freshness
Complexity
Cache-Aside
Great (after warm-up)
Normal (writes skip cache)
Stale until
Low
Read-Through
Great (after warm-up)
Normal
Stale until TTL
Medium
Write-Through
Great (always warm)
Slower (double write)
Always fresh
Medium
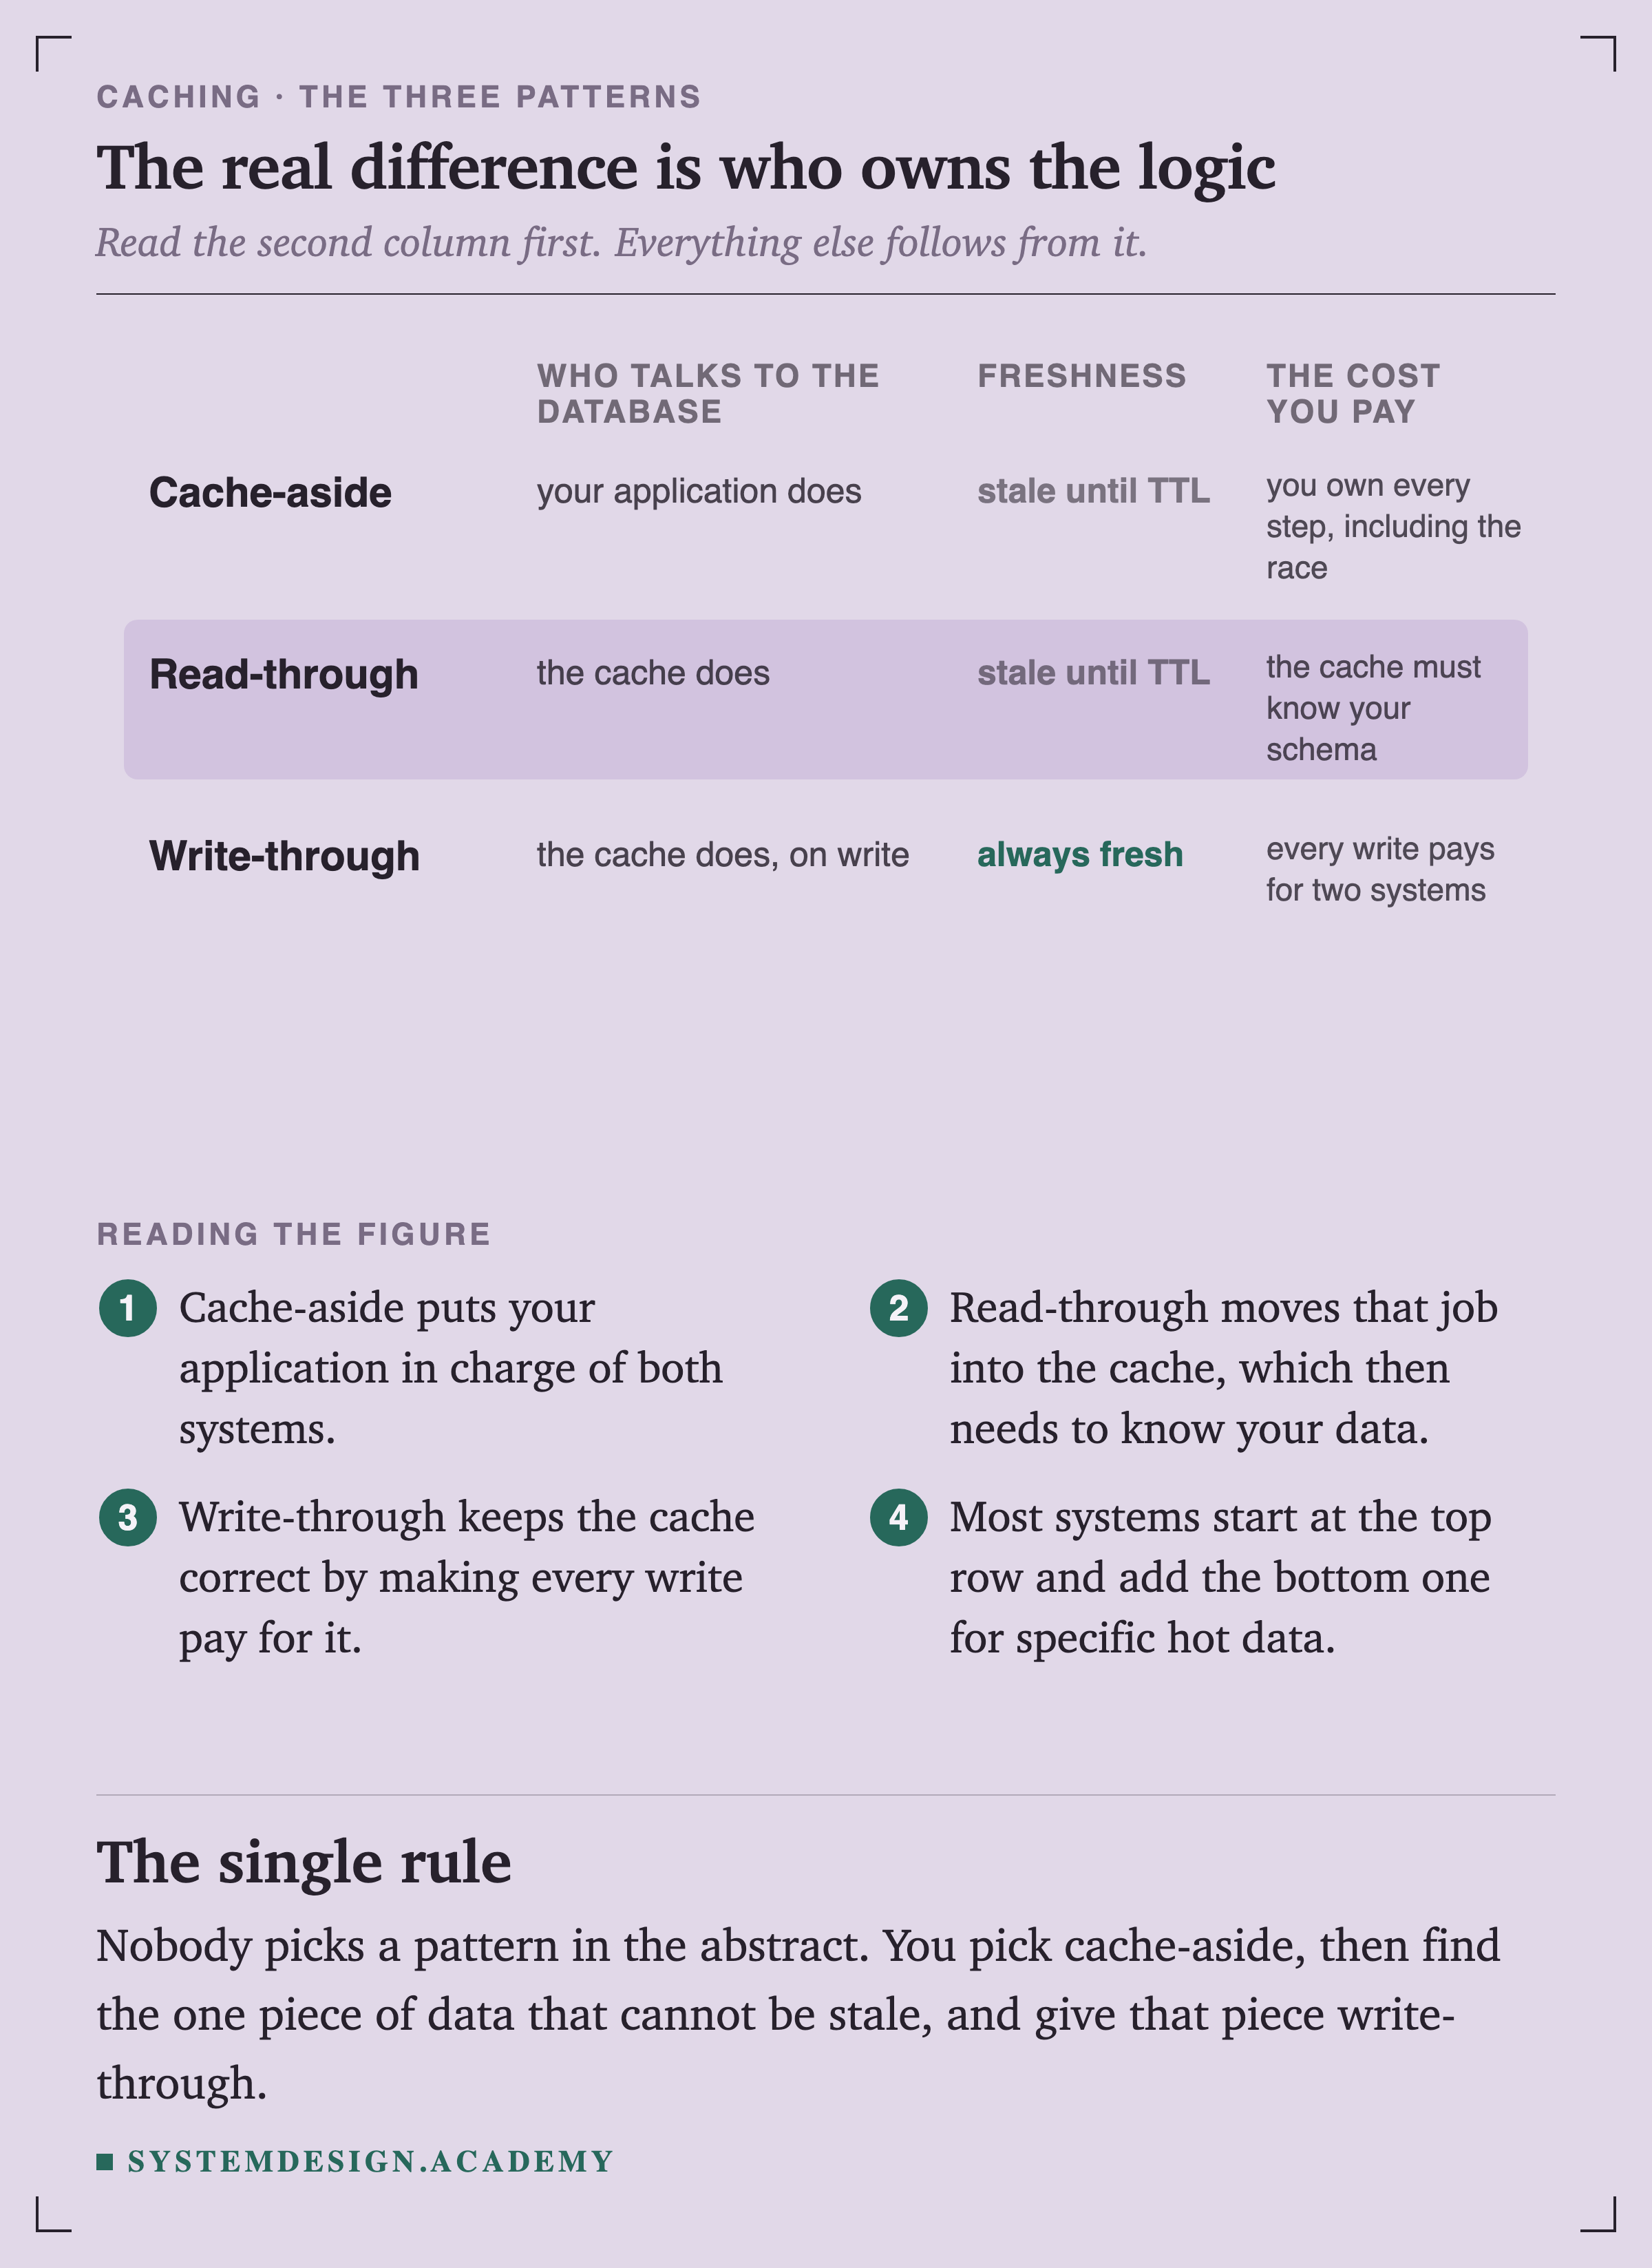
FigureFigure 16. The real difference is who owns the logic
Read the second column first and the rest follows from it. Cache-aside puts your application in charge of both systems. Read-through moves that job into the cache, which then has to know how to fetch your data. Write-through keeps the cache correct by making every write pay for it.
Nobody picks one of these in the abstract. You start at the top row, then find the one piece of data that genuinely cannot be stale, and give that piece write-through.
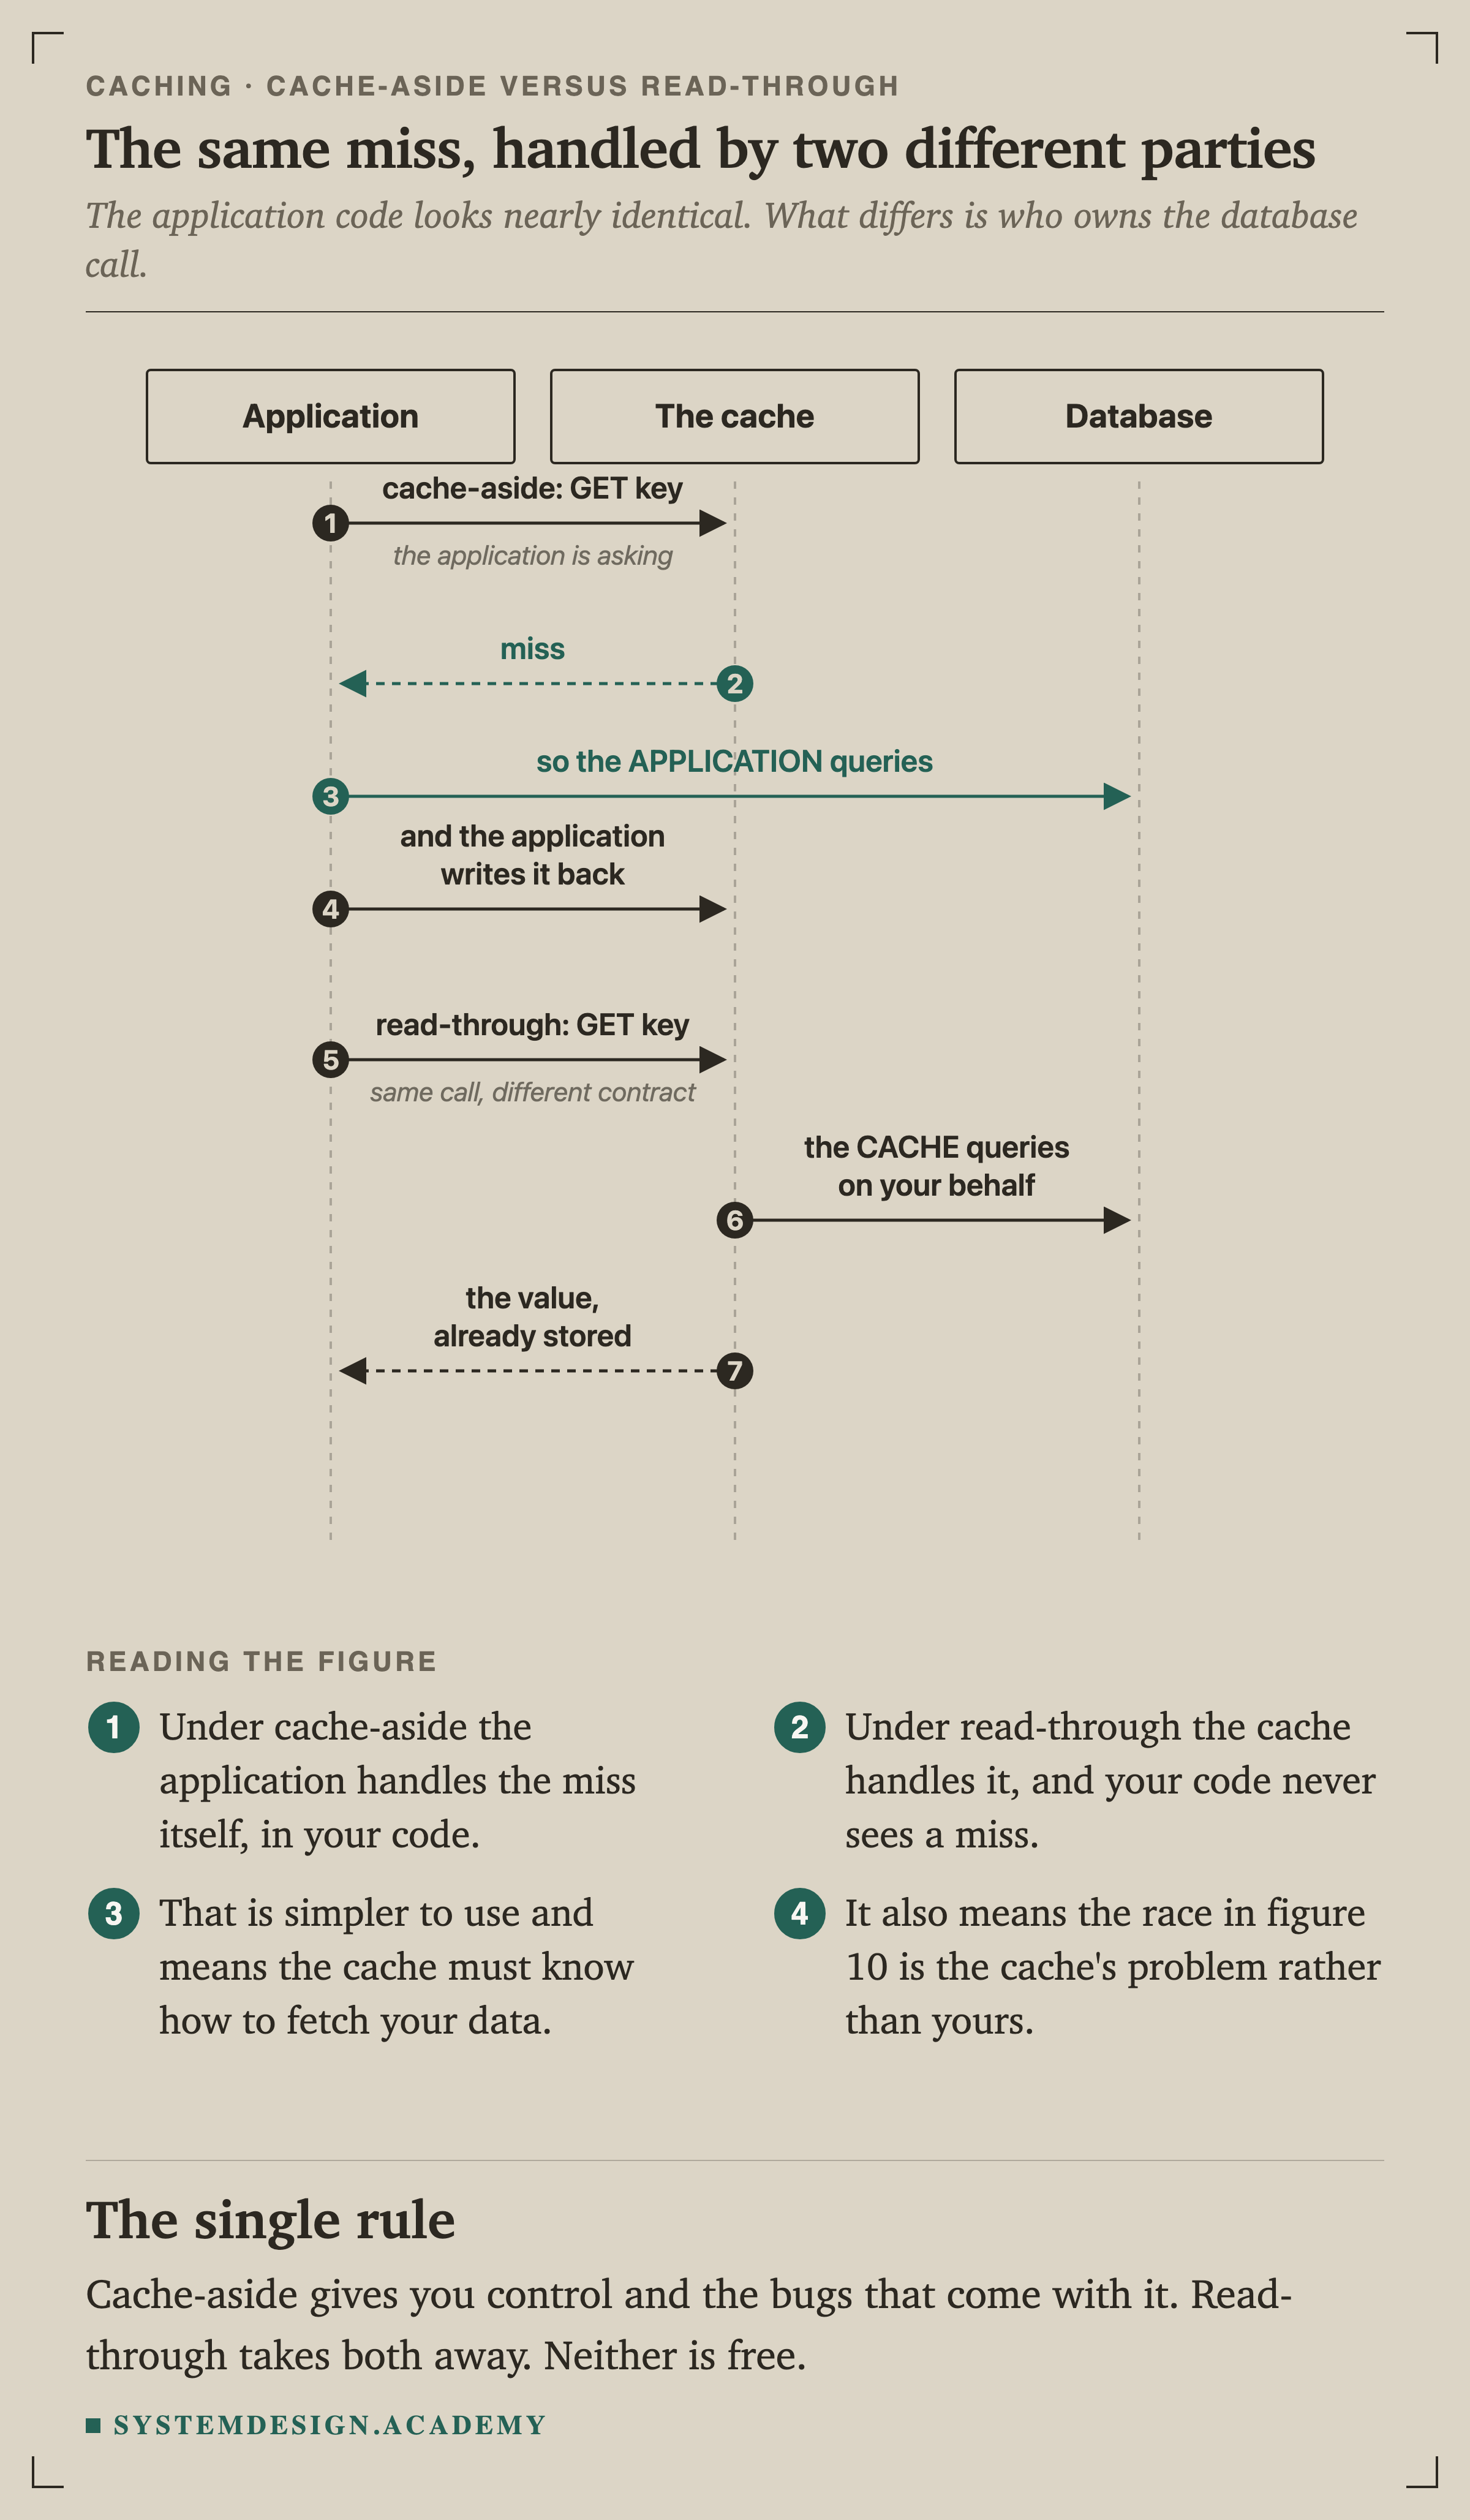
SequenceFigure 17. The same miss, handled by two different parties
The application code looks nearly identical in both halves. What differs is who handles the miss.
Under cache-aside your code sees the miss and deals with it, which is why the race in figure 10 is your bug to prevent. Under read-through the cache never lets your code see a miss at all, so that race becomes the cache's problem instead of yours. Neither is free: one gives you control and the bugs that come with it, the other takes both away.
Most applications start with Cache-Aside because it's the simplest and most flexible. You add Write-Through for specific hot data that absolutely must be fresh.
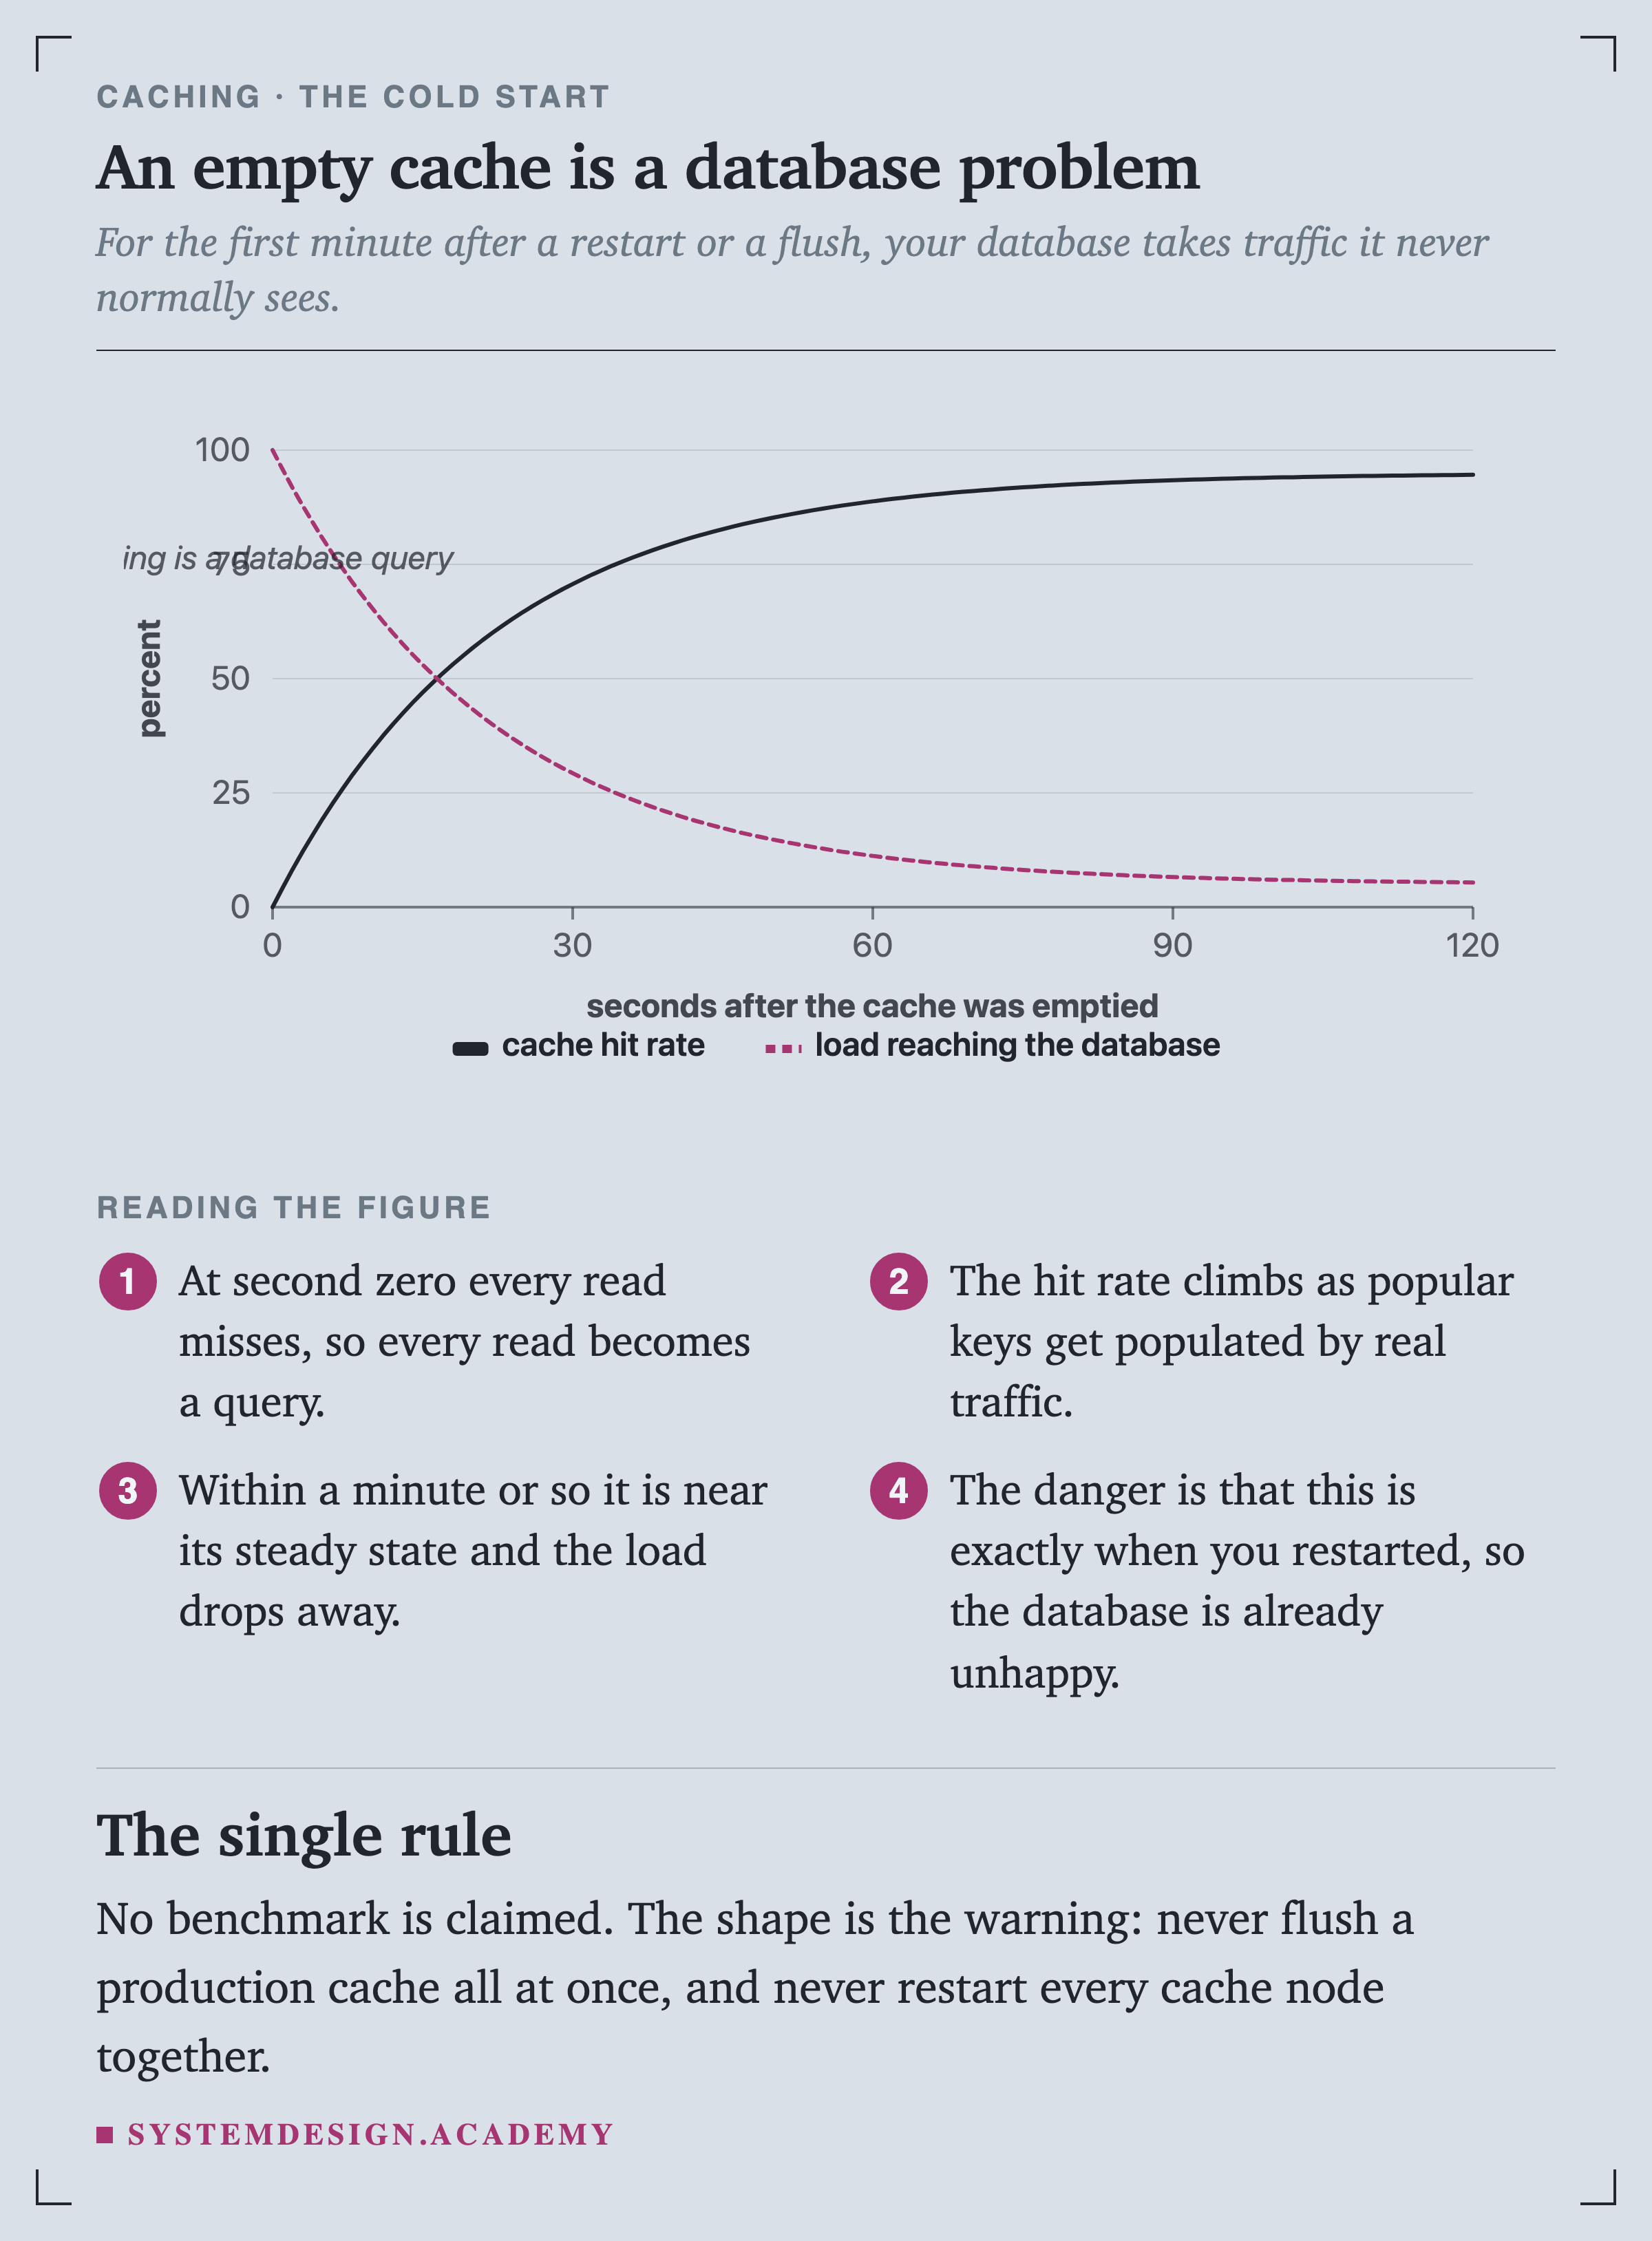
ChartFigure 18. An empty cache is a database problem
At second zero every read misses, so every read becomes a query, and your database briefly carries traffic it never normally sees. The hit rate climbs as real traffic repopulates the popular keys, and within about a minute the load has fallen away.
The danger is the timing. A cache is usually empty because you just restarted something, which is exactly the moment your system is least able to absorb a spike. This is why you never flush a production cache all at once, and never restart every cache node together.
SequenceFigure 14. One request does the work, the rest wait for it
The first request to miss takes a short lock on that key. Everyone arriving behind it sees the lock and waits instead of querying. The winner fetches once, writes the value, and everybody waiting is served from it.
Four thousand identical queries become one, and nobody outside noticed anything.
The lock needs its own expiry, and that detail is not optional. If the request holding it dies mid-fetch, the key must not stay locked forever, or you have turned a brief spike into a permanent outage.
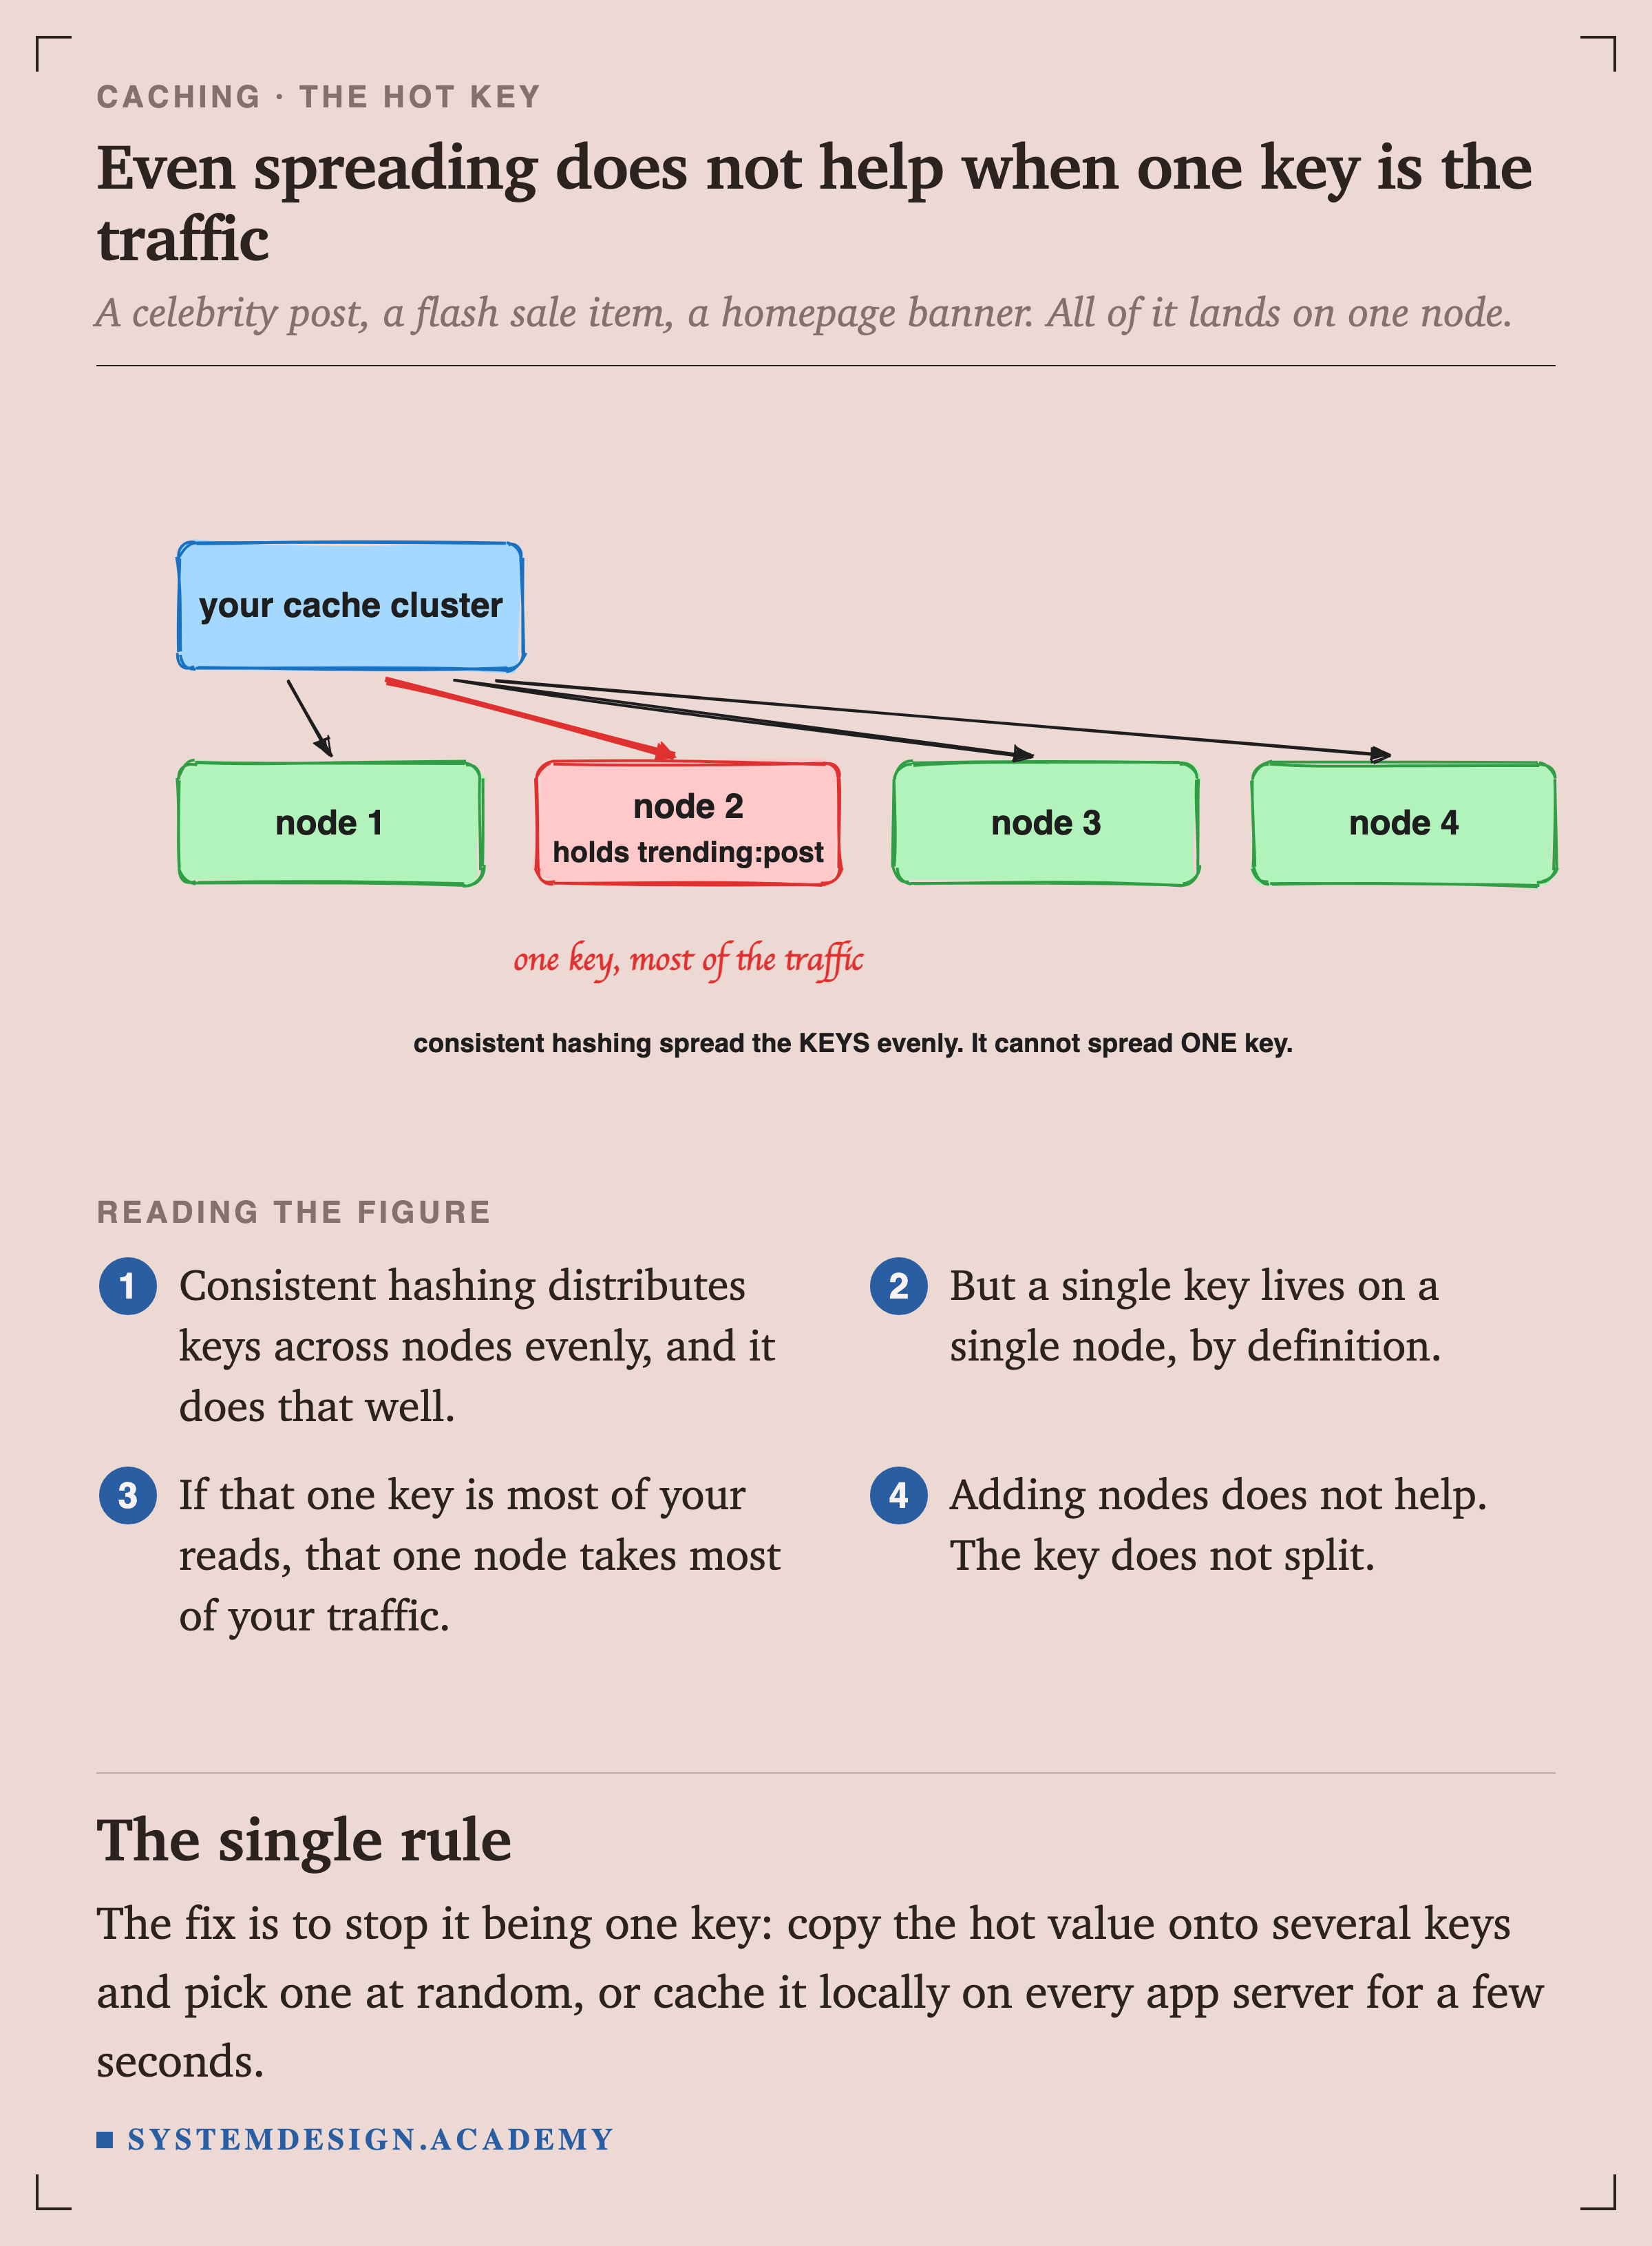
SketchFigure 15. Even spreading does not help when one key is the traffic
distributes keys across nodes evenly and does that job well. But a single key lives on a single node, by definition. If that one key is a celebrity post or a flash-sale item, one node is taking most of your reads and the others are idle.
Adding nodes does not help, because the key does not split. The fix is to stop it being one key: copy the hot value onto several keys and pick one at random, or cache it locally on every application server for a few seconds.
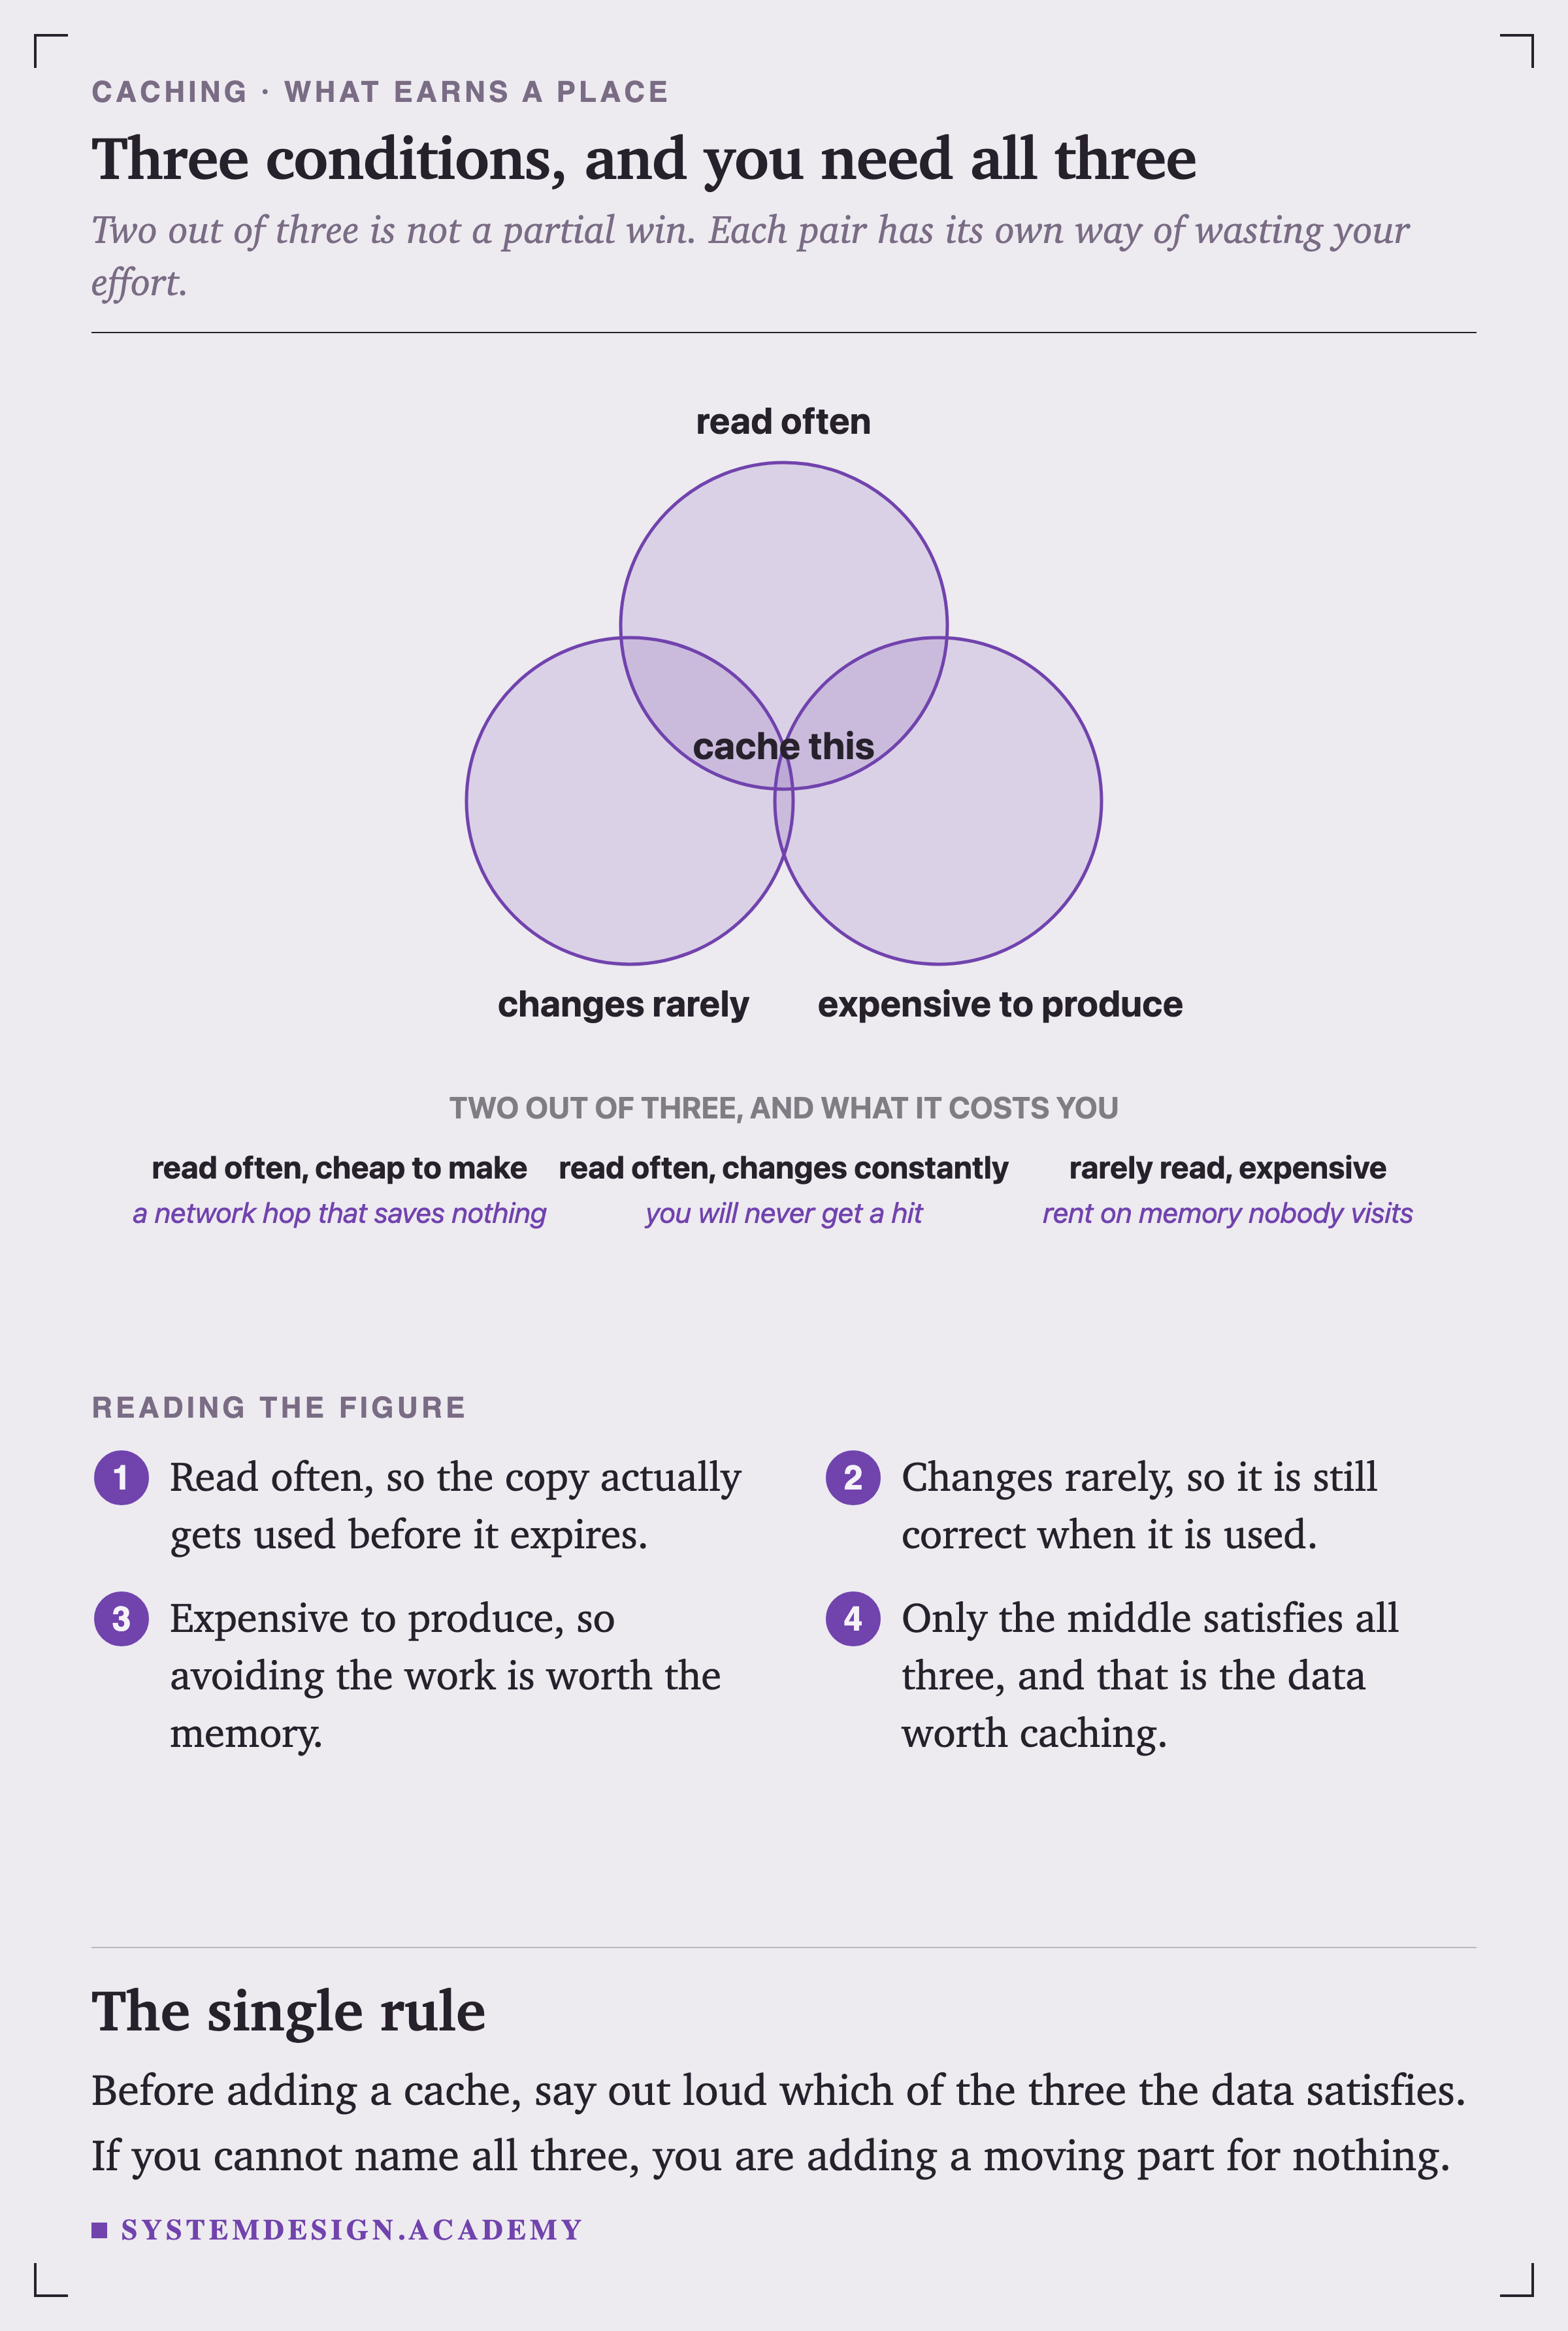
Caching the wrong things. Cache things that are read often, change rarely, and are expensive to compute. All three, not two of three.
FigureFigure 19. Three conditions, and you need all three
Only the centre is worth caching, and the row underneath is why. Each pair is a specific way of wasting effort rather than a partial win: cheap data gains you nothing but a network hop, fast-changing data never survives to be hit, and rarely-read data is memory you are renting for nobody.
Before adding a cache, say all three out loud about your data. If you cannot name all three, you are adding a moving part for nothing.
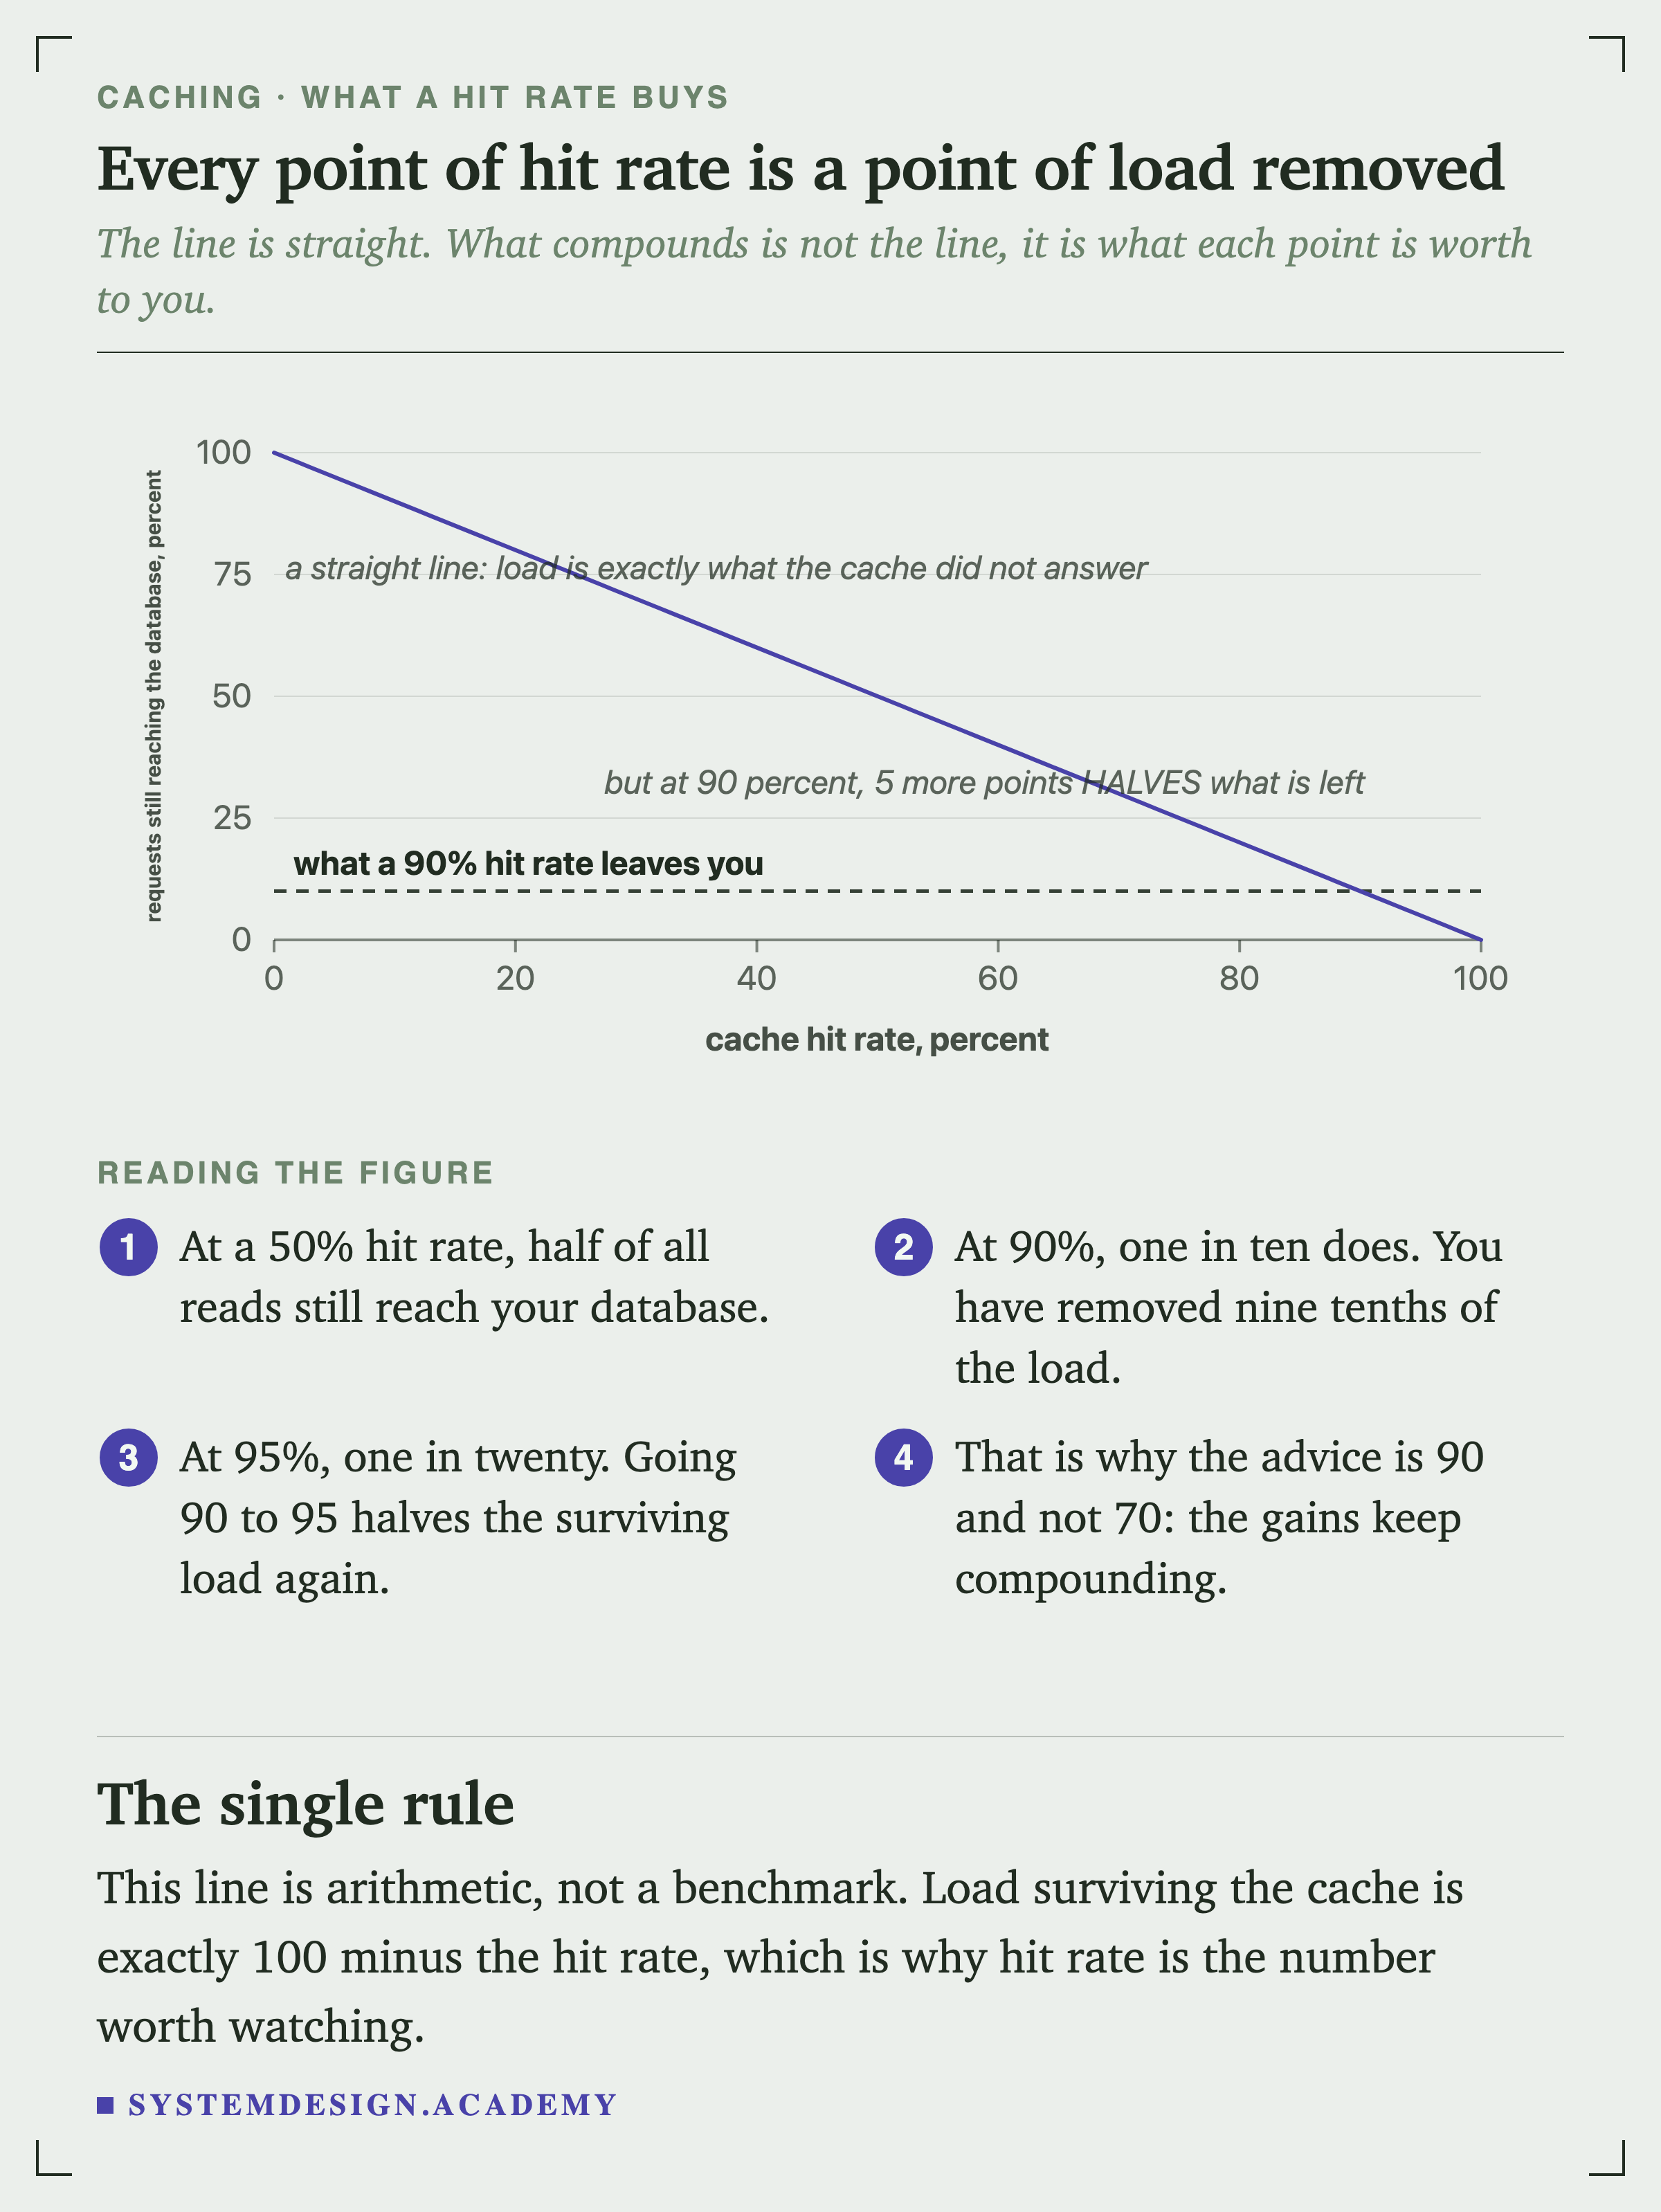
ChartFigure 20. Every point of hit rate is a point of load removed
The line is straight, because the two quantities are the same quantity: whatever the cache did not answer went to the database.
What compounds is not the line, it is what each point is worth. At a 50% hit rate half your reads still hit the database. At 90% it is one in ten. Going from 90 to 95 does not sound like much, and it halves what is left again. That is why the usual advice is 90 rather than 70, and why below 50 a cache is often just a moving part that has not earned its place.
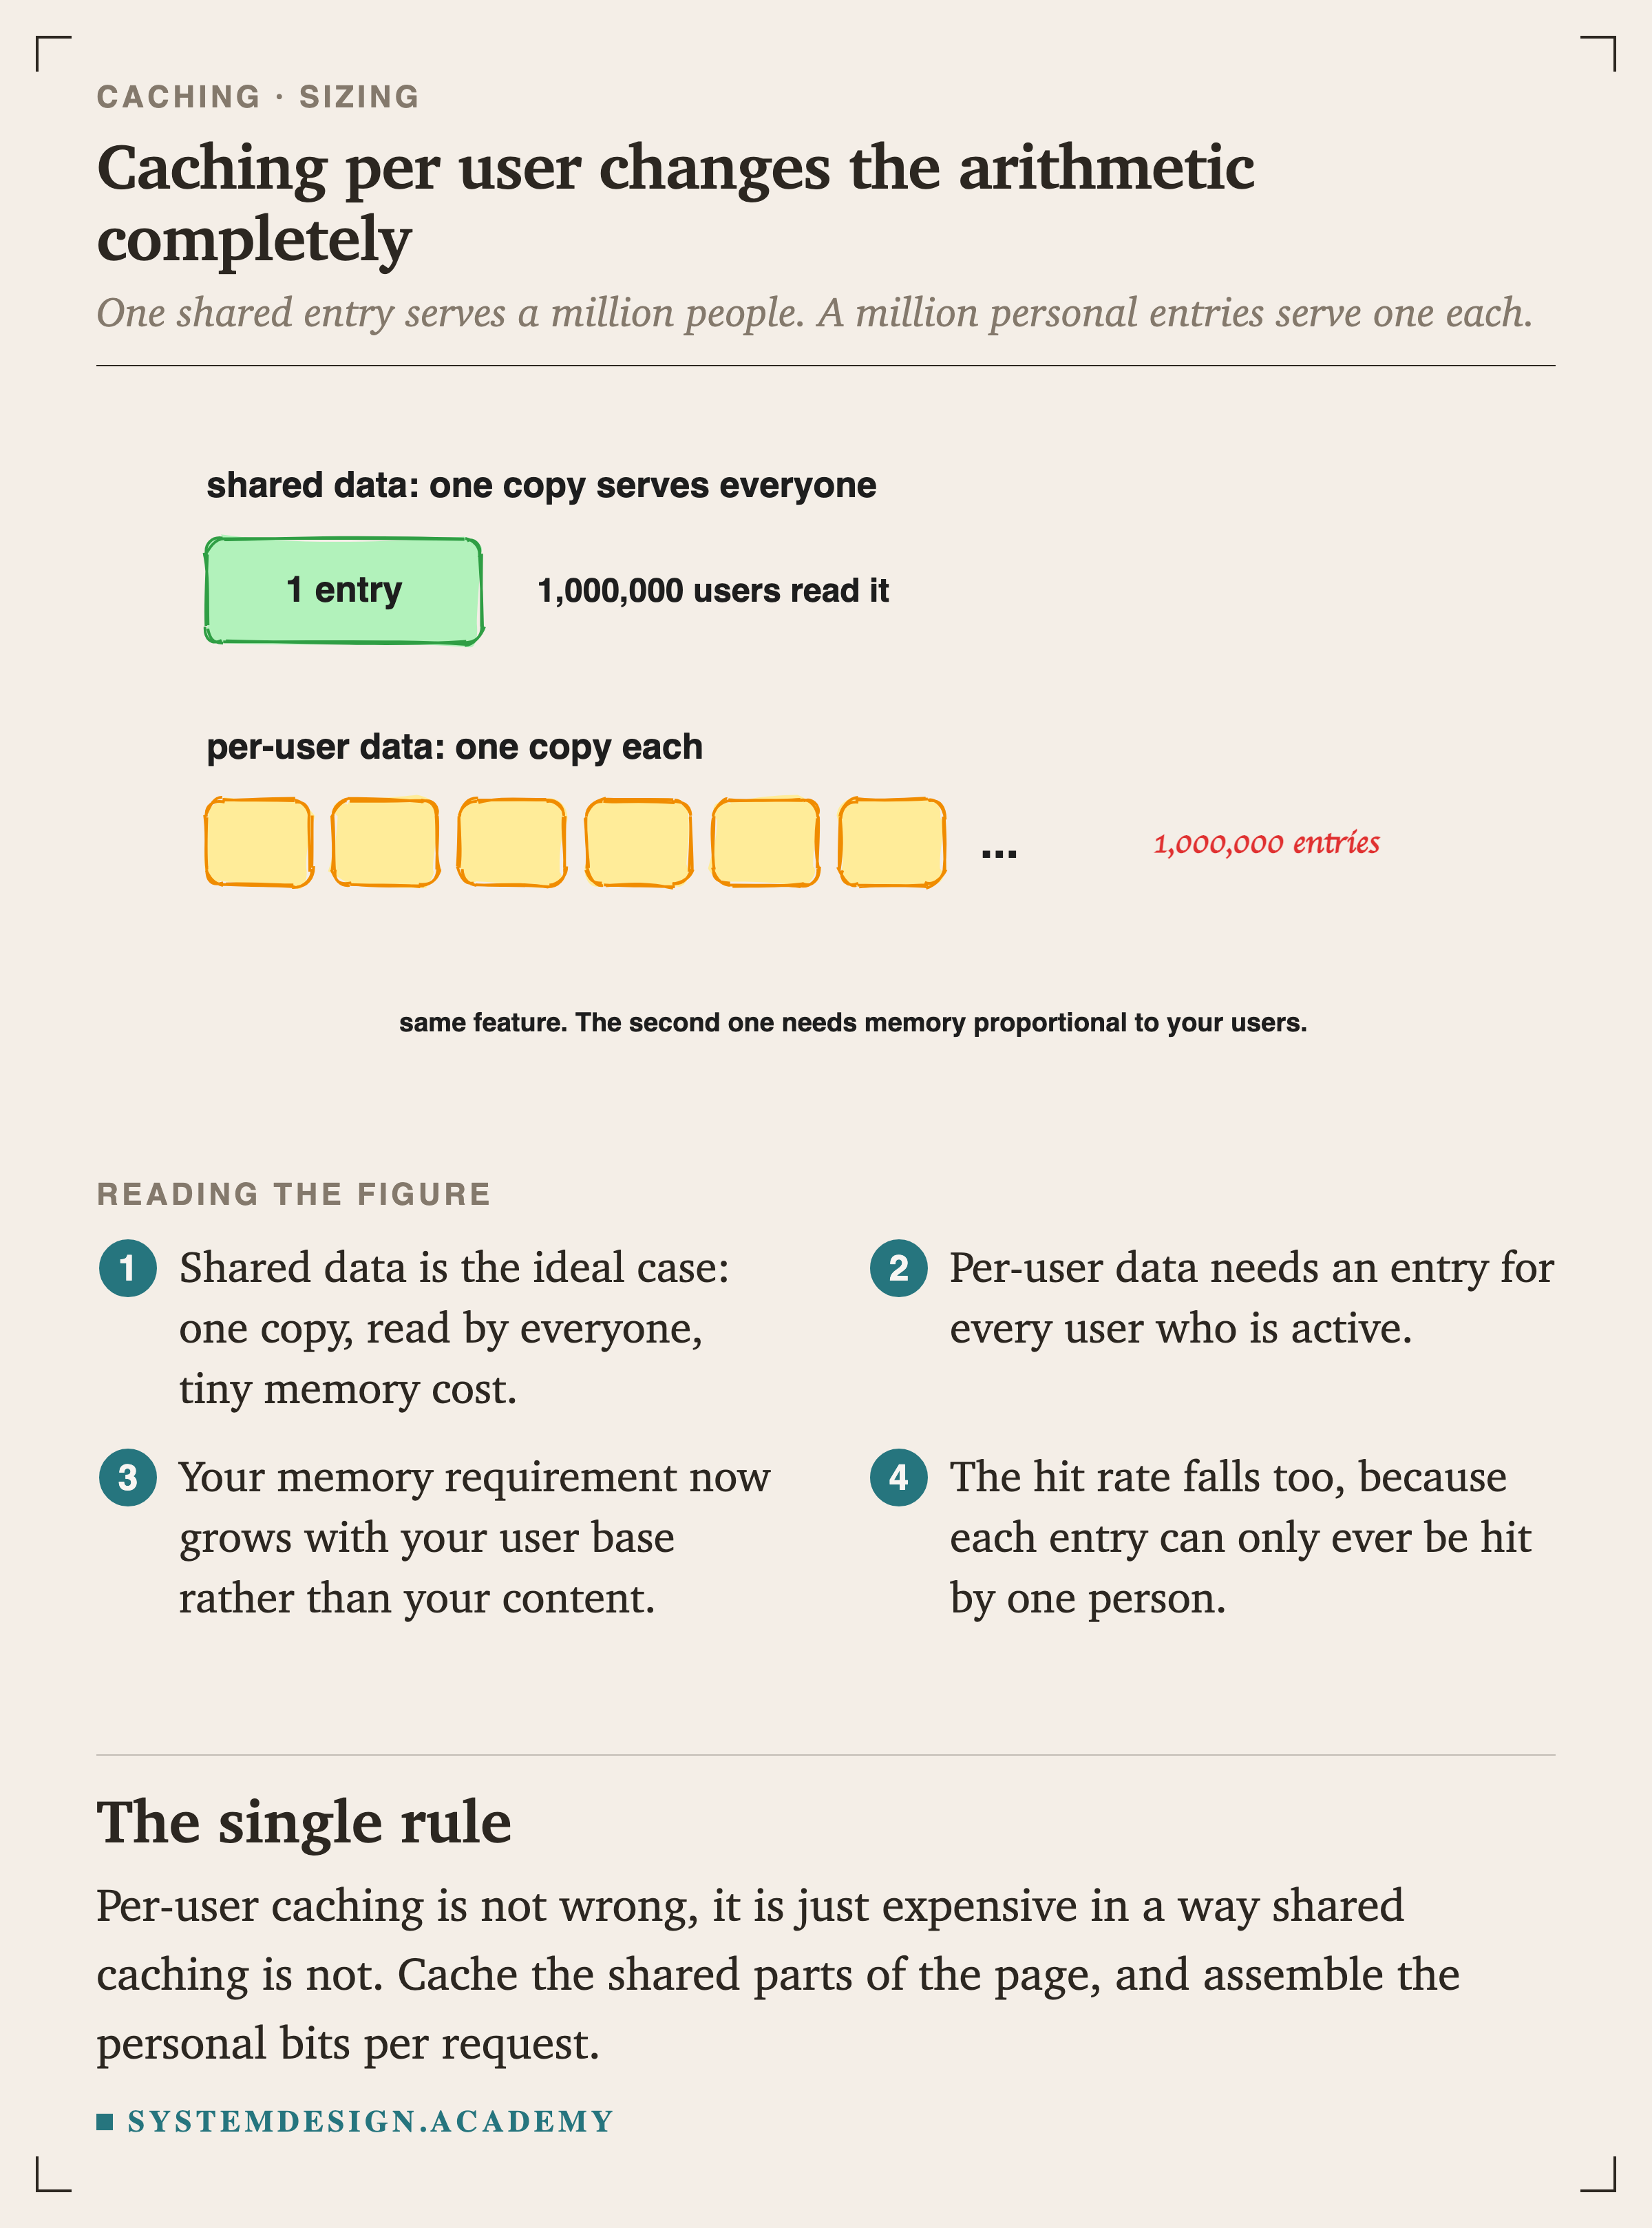
Caching per user. Caching data that's unique per user means you need cache capacity proportional to your user base rather than to your content.
SketchFigure 21. Per-user caching changes the arithmetic
One shared entry serves a million people. A million personal entries serve one person each. Same feature, and completely different memory bills.
The hit rate suffers too, and that is the part people miss. A shared entry can be hit by everybody, so it earns its place quickly. A per-user entry can only ever be hit by one person, so most of them expire having been read once or not at all.
Per-user caching is not wrong. It is expensive in a way shared caching is not, and the usual answer is to cache the shared parts of a page and assemble the personal bits per request.
Memory pressure. Your cache has finite memory. When it fills up, something has to go. LRU (Least Recently Used) eviction is the most common policy, the item that hasn't been accessed the longest gets evicted. But if you don't size your cache correctly, you'll constantly evict and reload data, turning your cache into a bottleneck instead of an accelerator.
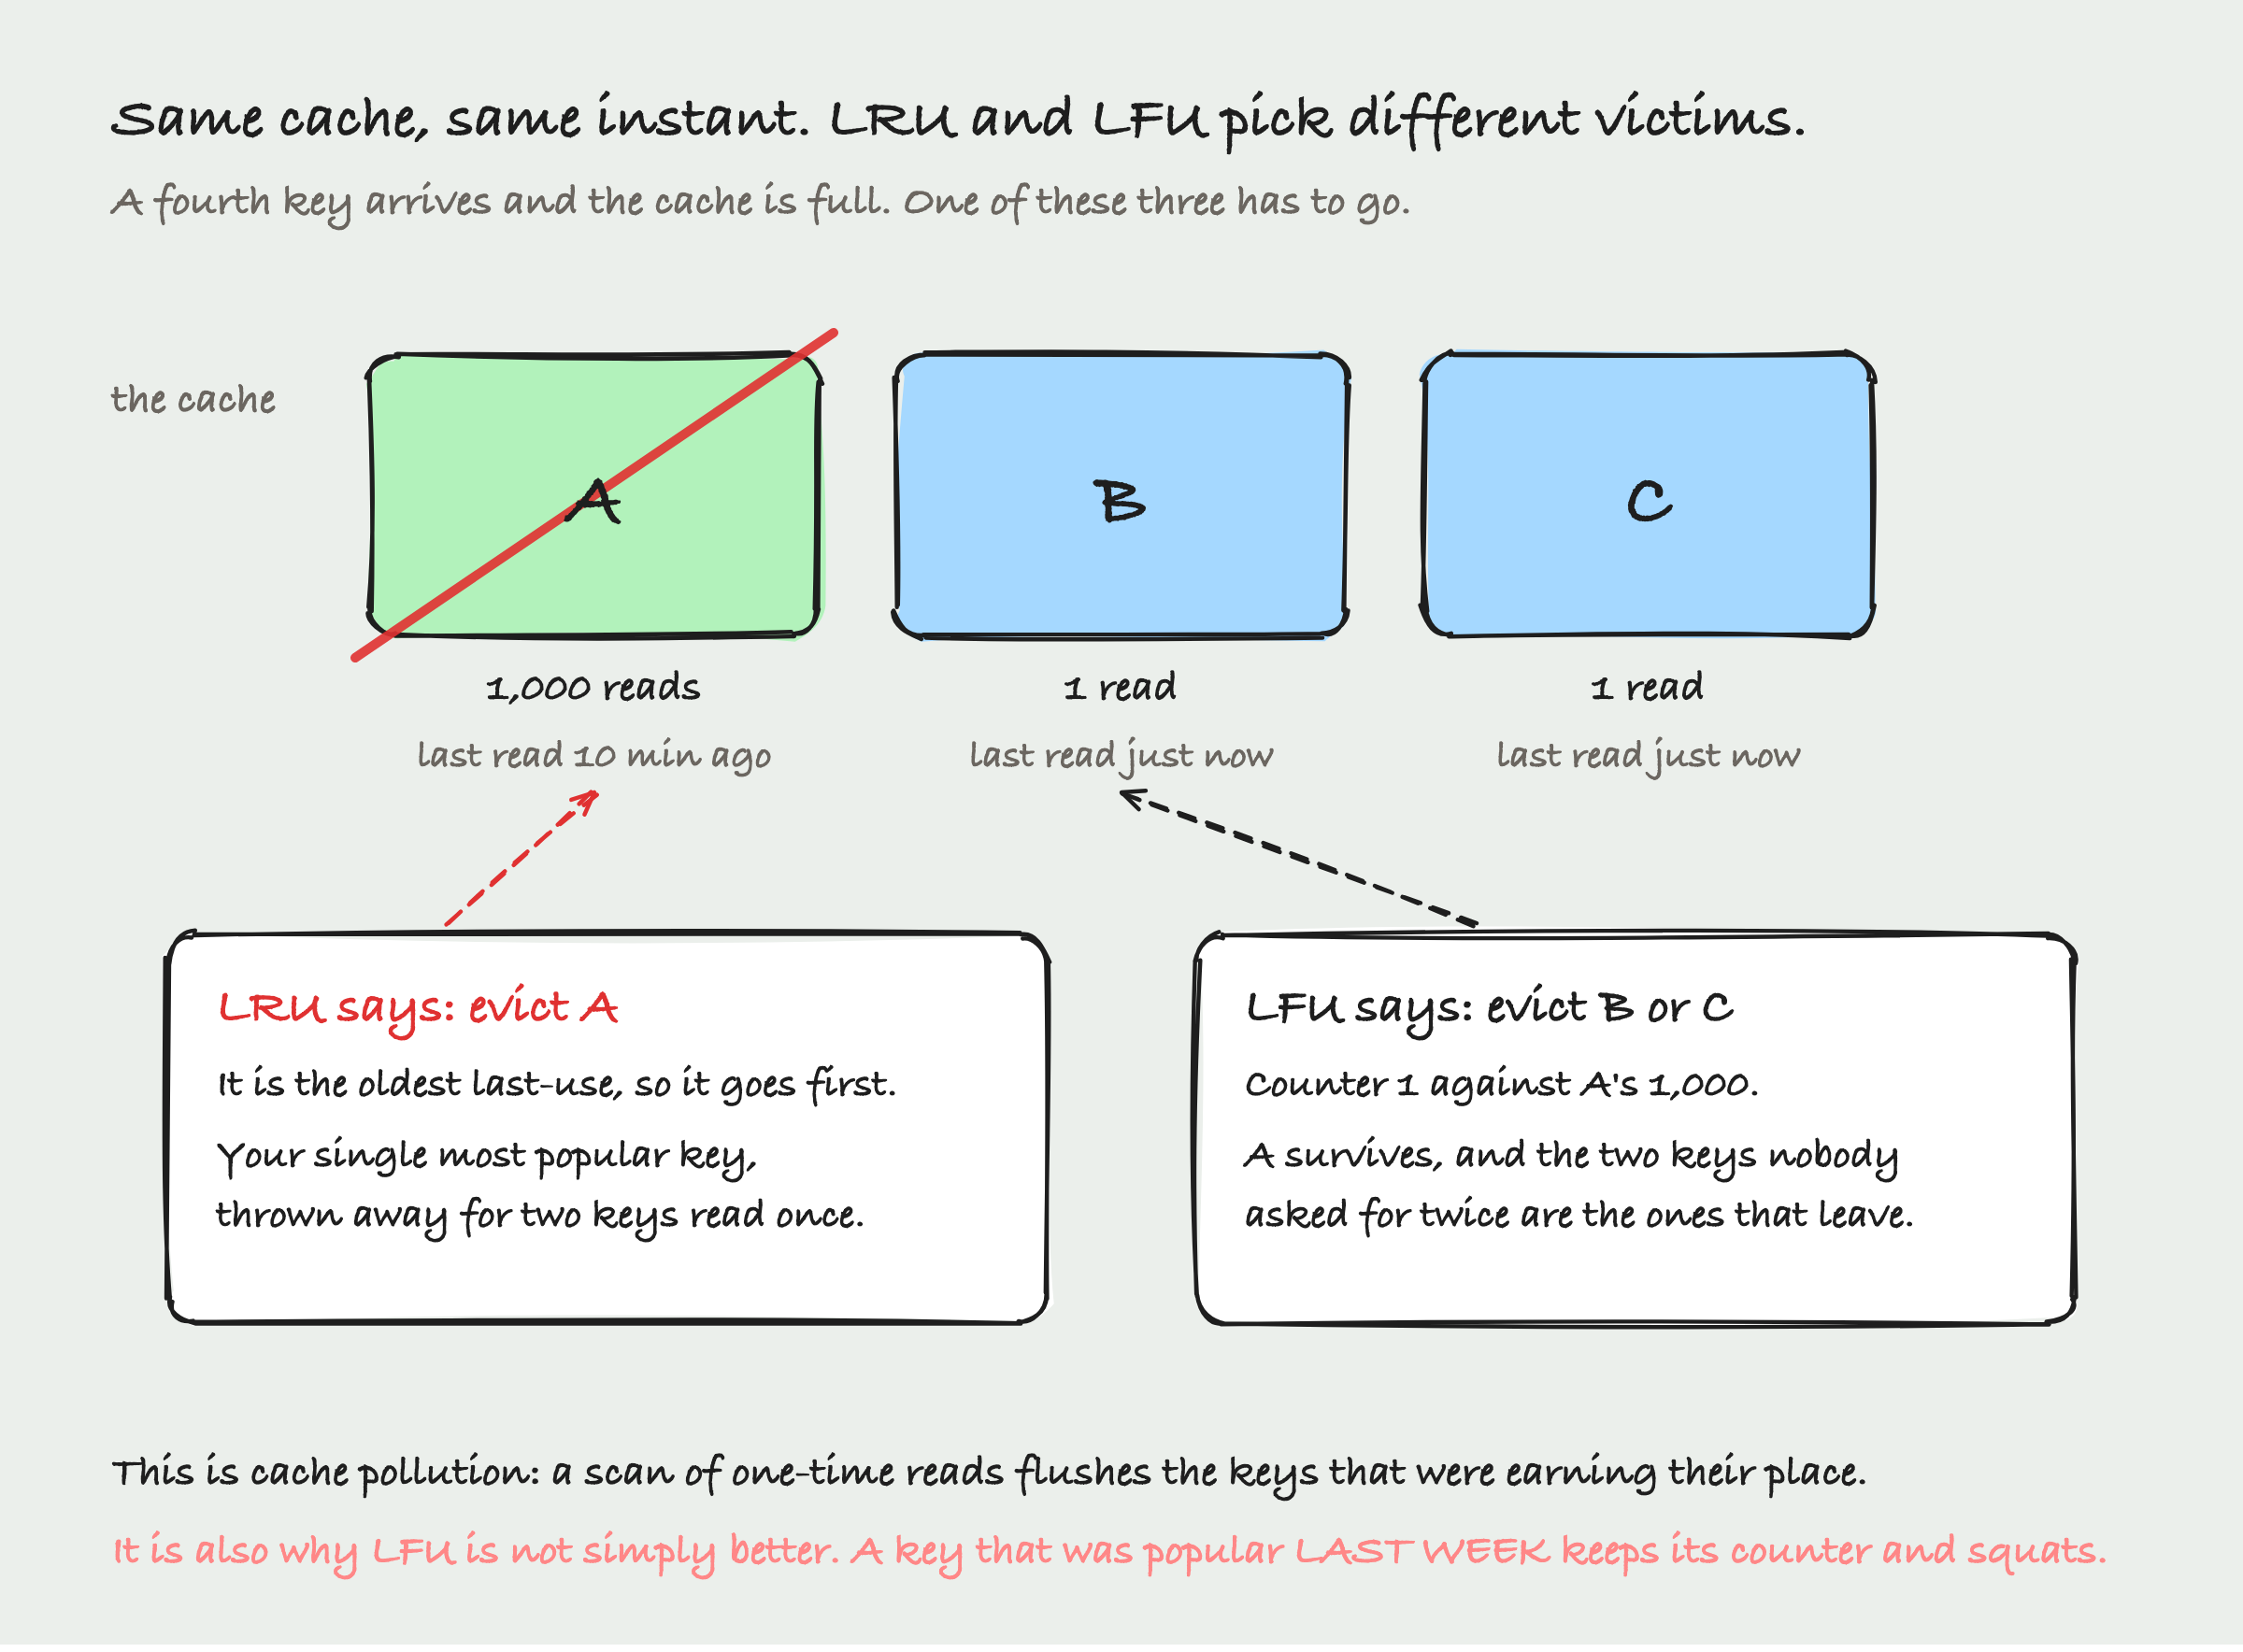
Which item goes is a choice, and the two obvious policies disagree in exactly the case that hurts.
SketchFigure 13. Same cache, same instant, different victims
LRU asks only one question: what was touched longest ago? Here that is A, the key with a thousand reads, and it gets thrown out to make room for two keys that have been read once each. This is cache pollution: a scan of one-time reads flushing the keys that were earning their place.
LFU counts instead of timing, so it keeps A and evicts one of the newcomers, which is clearly right here.
It is not simply better, though, and the honest reason is worth knowing before an interview. A counter remembers forever. A key that was enormously popular last week keeps its high count and squats in the cache long after anyone stopped asking for it, while genuinely hot new keys cannot get in.
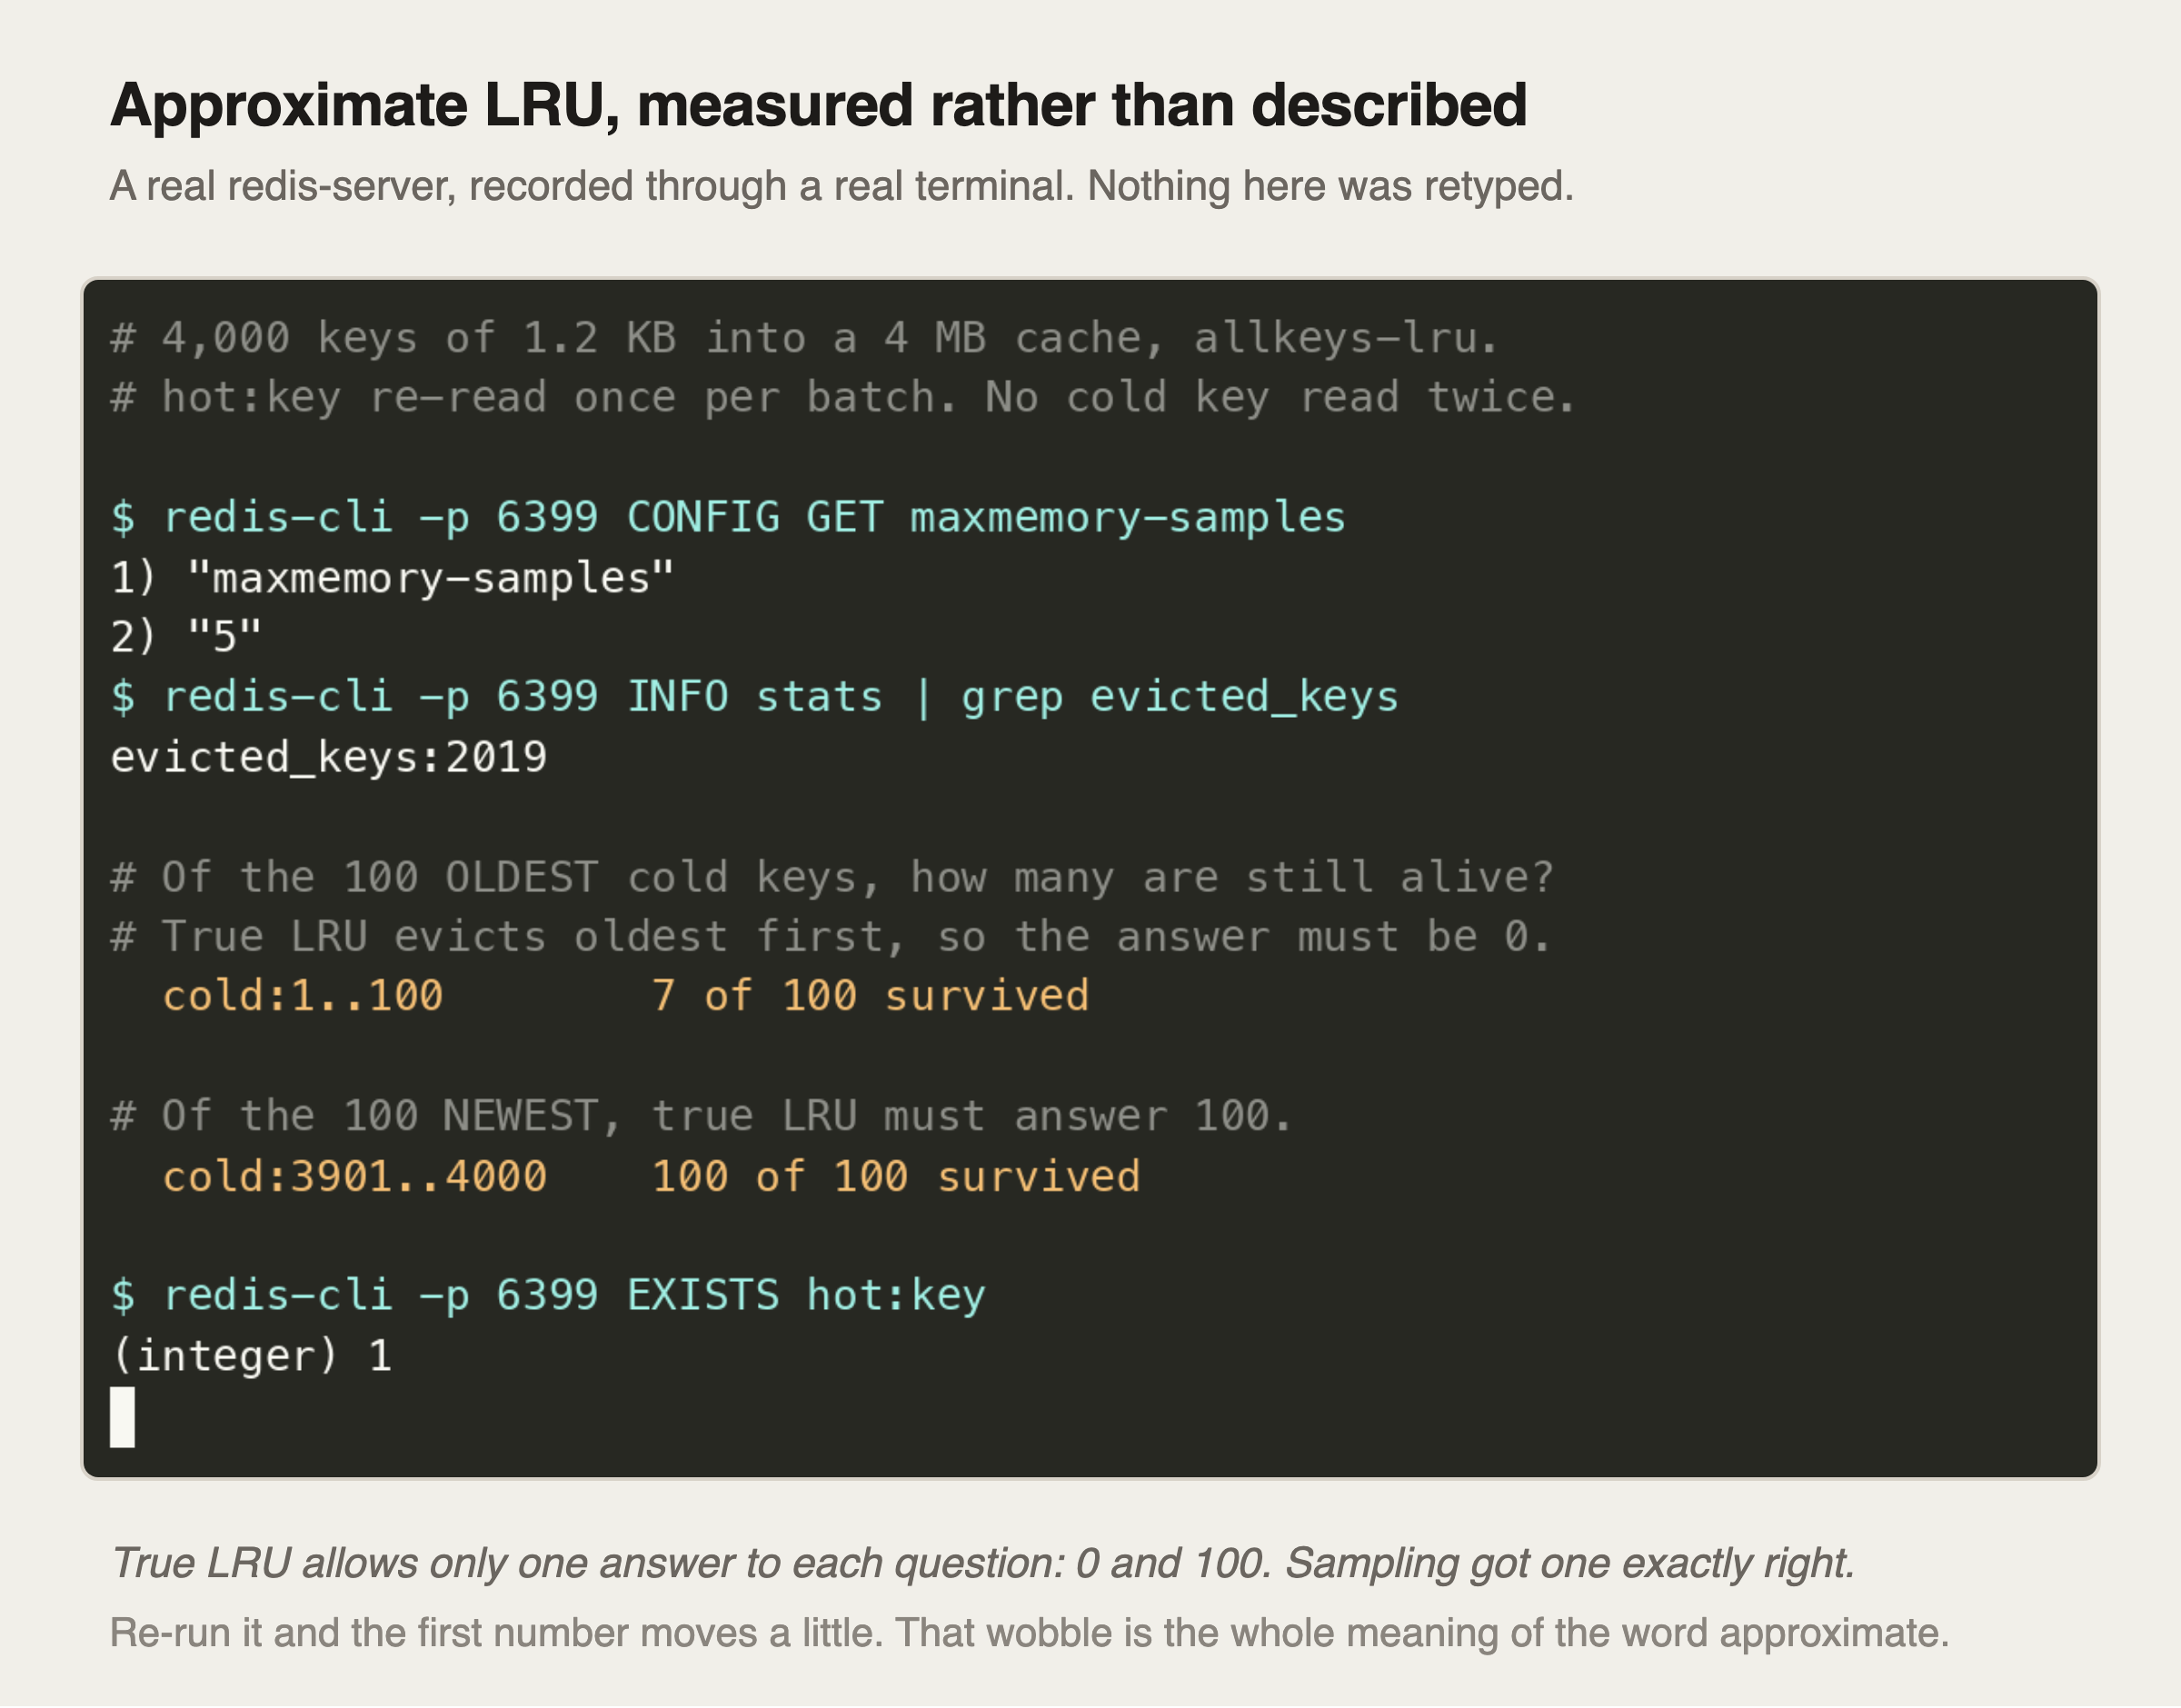
RecordedFigure 14. Approximate LRU, measured rather than described
does not implement true LRU, and this is what that means in practice rather than in a footnote.
True LRU allows exactly one answer to each of these questions. Of the 100 oldest keys, 0 should have survived. Of the 100 newest, all 100 should have. Redis got the second one exactly right and the first one wrong by seven.
The reason is maxmemory-samples, which is 5 by default. When Redis needs to evict, it does not scan every key to find the true oldest. It samples five at random and evicts the oldest of those. That is enormously cheaper and almost always close enough.
Run it again and that first number moves a little. That wobble is the entire meaning of the word approximate, and it is why the policy is fast enough to use at all.
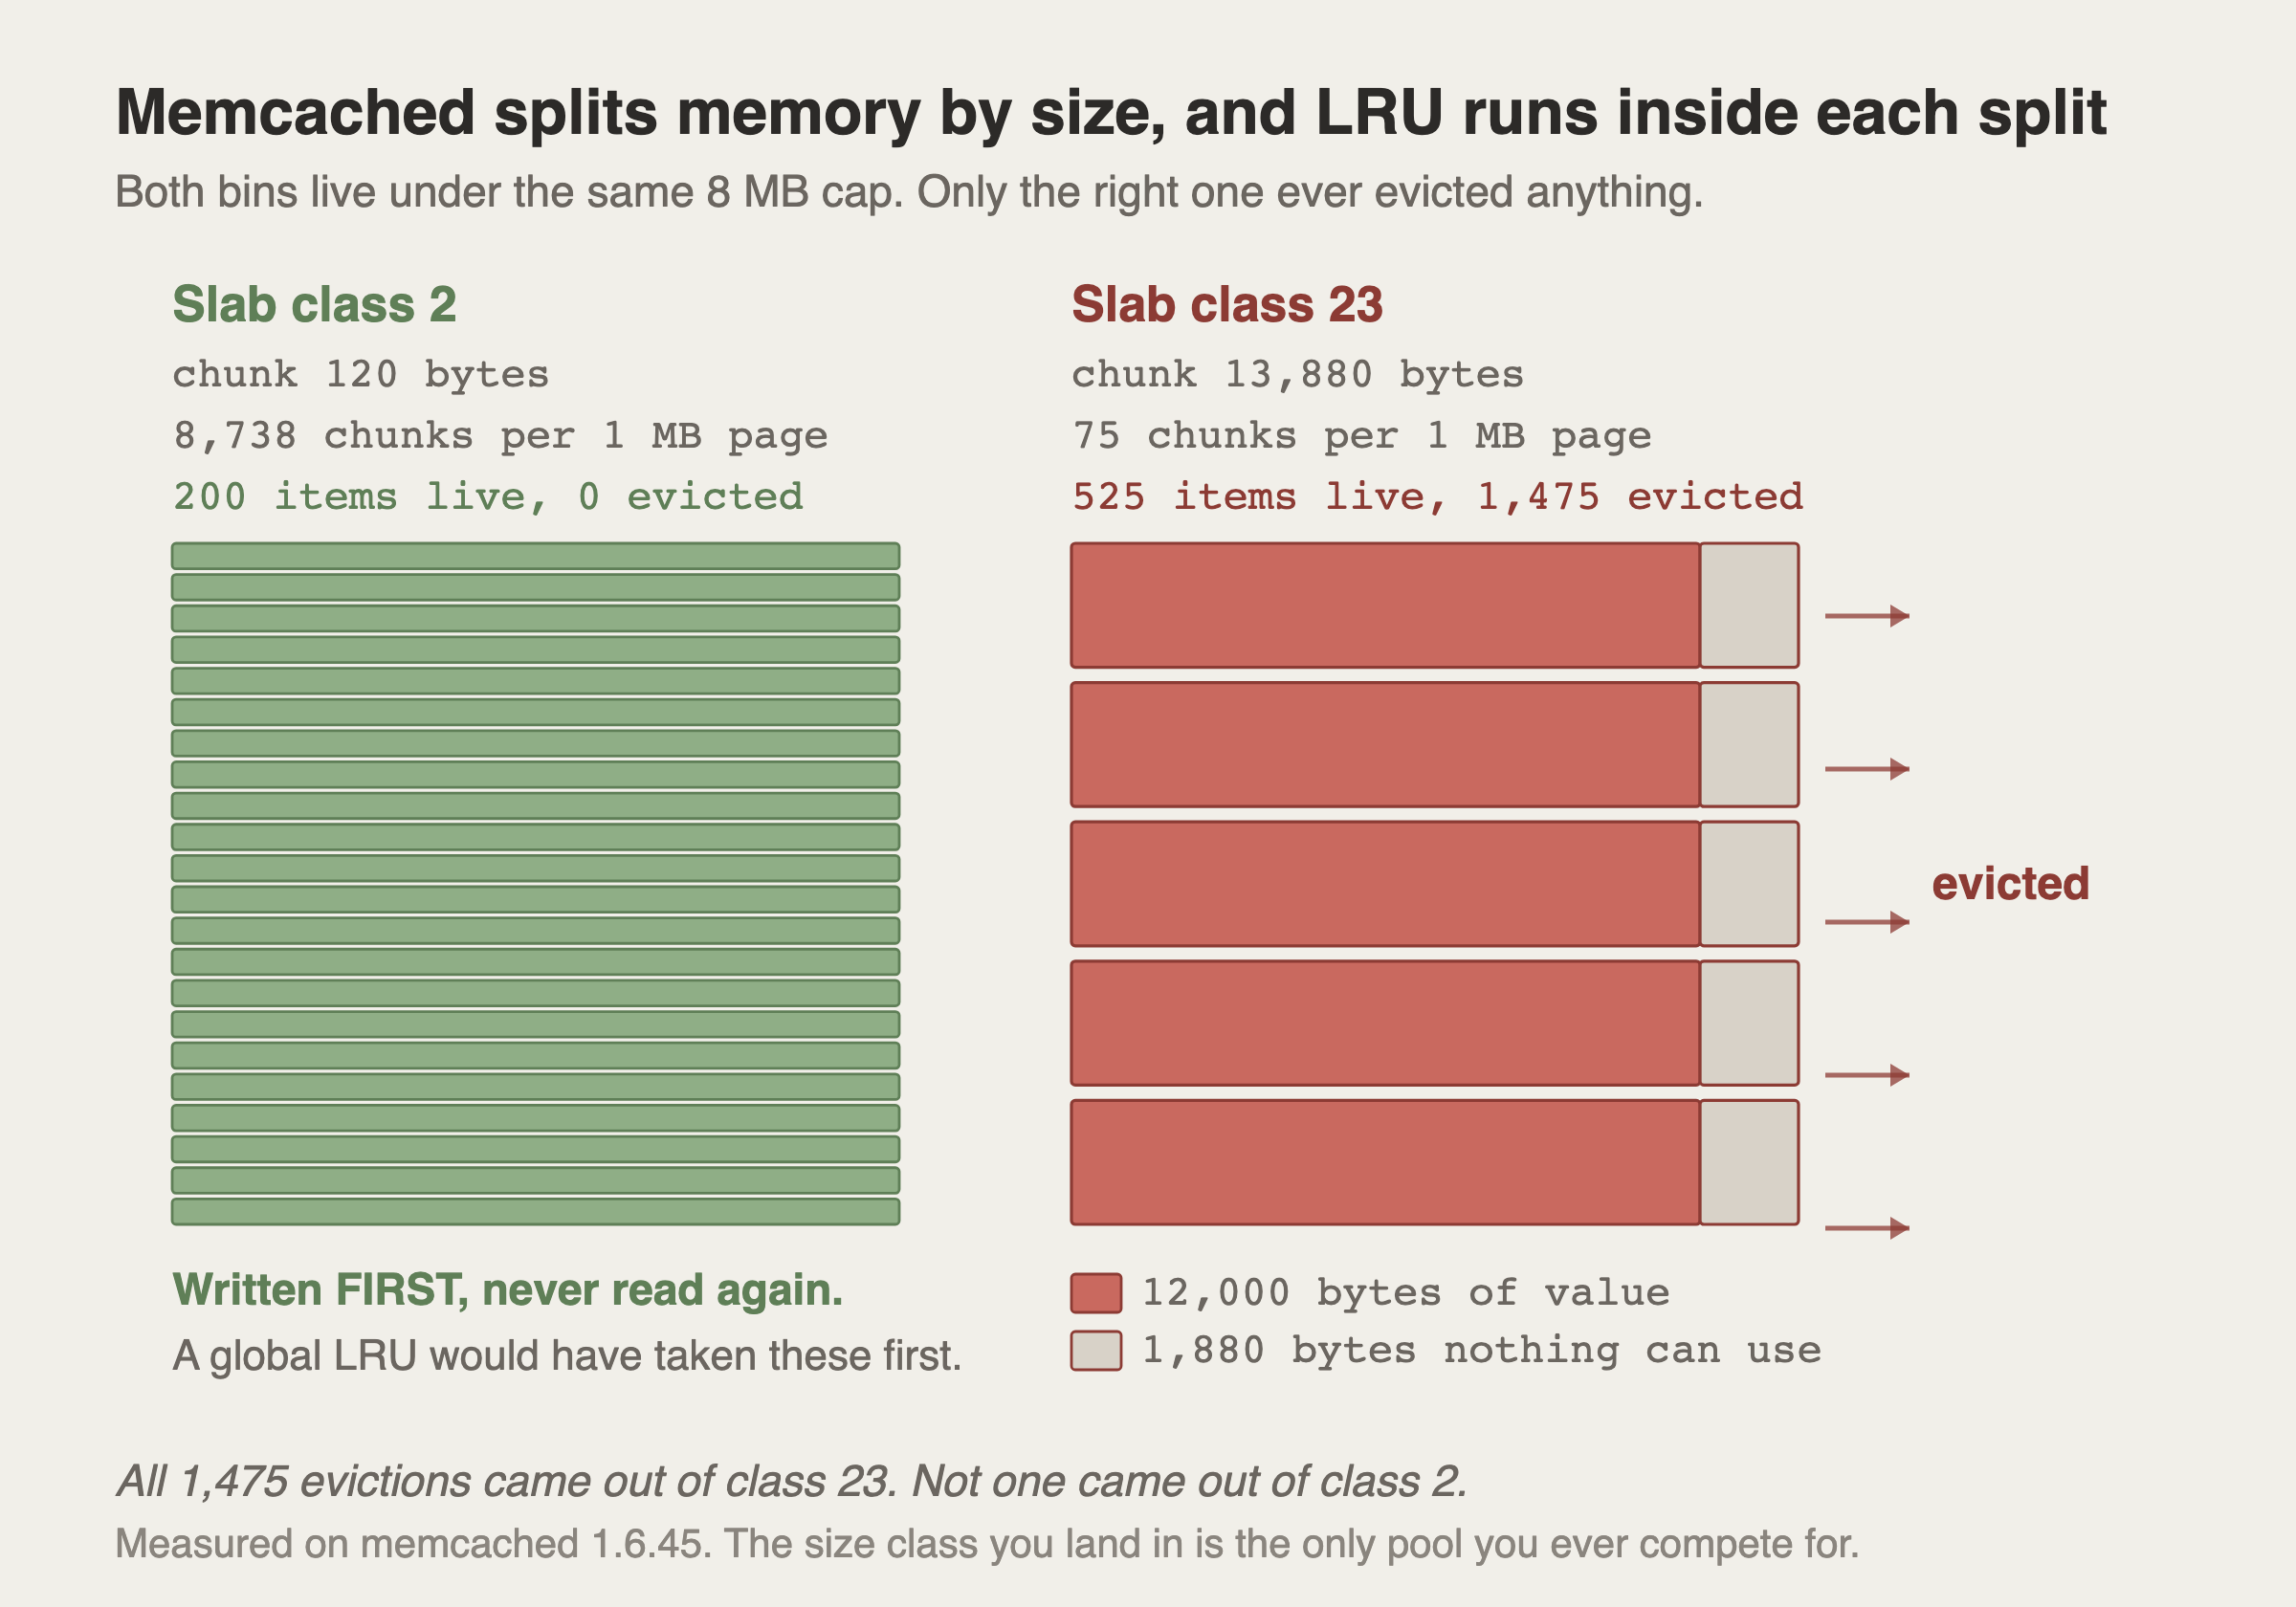
ArchitectureFigure 15. Memcached splits memory by size, and LRU runs inside each split
Memcached does not run one LRU over all your keys. It sorts them into size classes and runs a separate LRU inside each one.
Look at what that produced here. Every one of the 1,475 evictions came out of class 23. Class 2 lost nothing at all, even though its items were written first and never read again, which is precisely what a global LRU would have evicted first.
The grey tails are the second lesson. A 12,000 byte value stored in a 13,880 byte chunk wastes 1,880 bytes that nothing else can use. The size class you land in is the only pool you ever compete for, and it is decided by how big your value happens to be.
Cache inconsistency in distributed systems. You have 10 servers, each with a local cache. You update a product name in the database. 9 servers still have the old name cached. Different users see different names depending on which server they hit. This is why distributed caches (Redis) are preferred for data that must be consistent across servers.