A Result I Wanted To Be True
The previous lesson padded answers with filler and the filler lost. While I was there I ran a second treatment: the same answer with the same words, split one sentence per line. That one won.
Two numbers, ten items, neither of them significant on its own. But the gap between them looked like something: length did nothing and structure did everything. That is a clean, quotable sentence and I wanted it to be true, so I wrote twenty more items and ran it again.
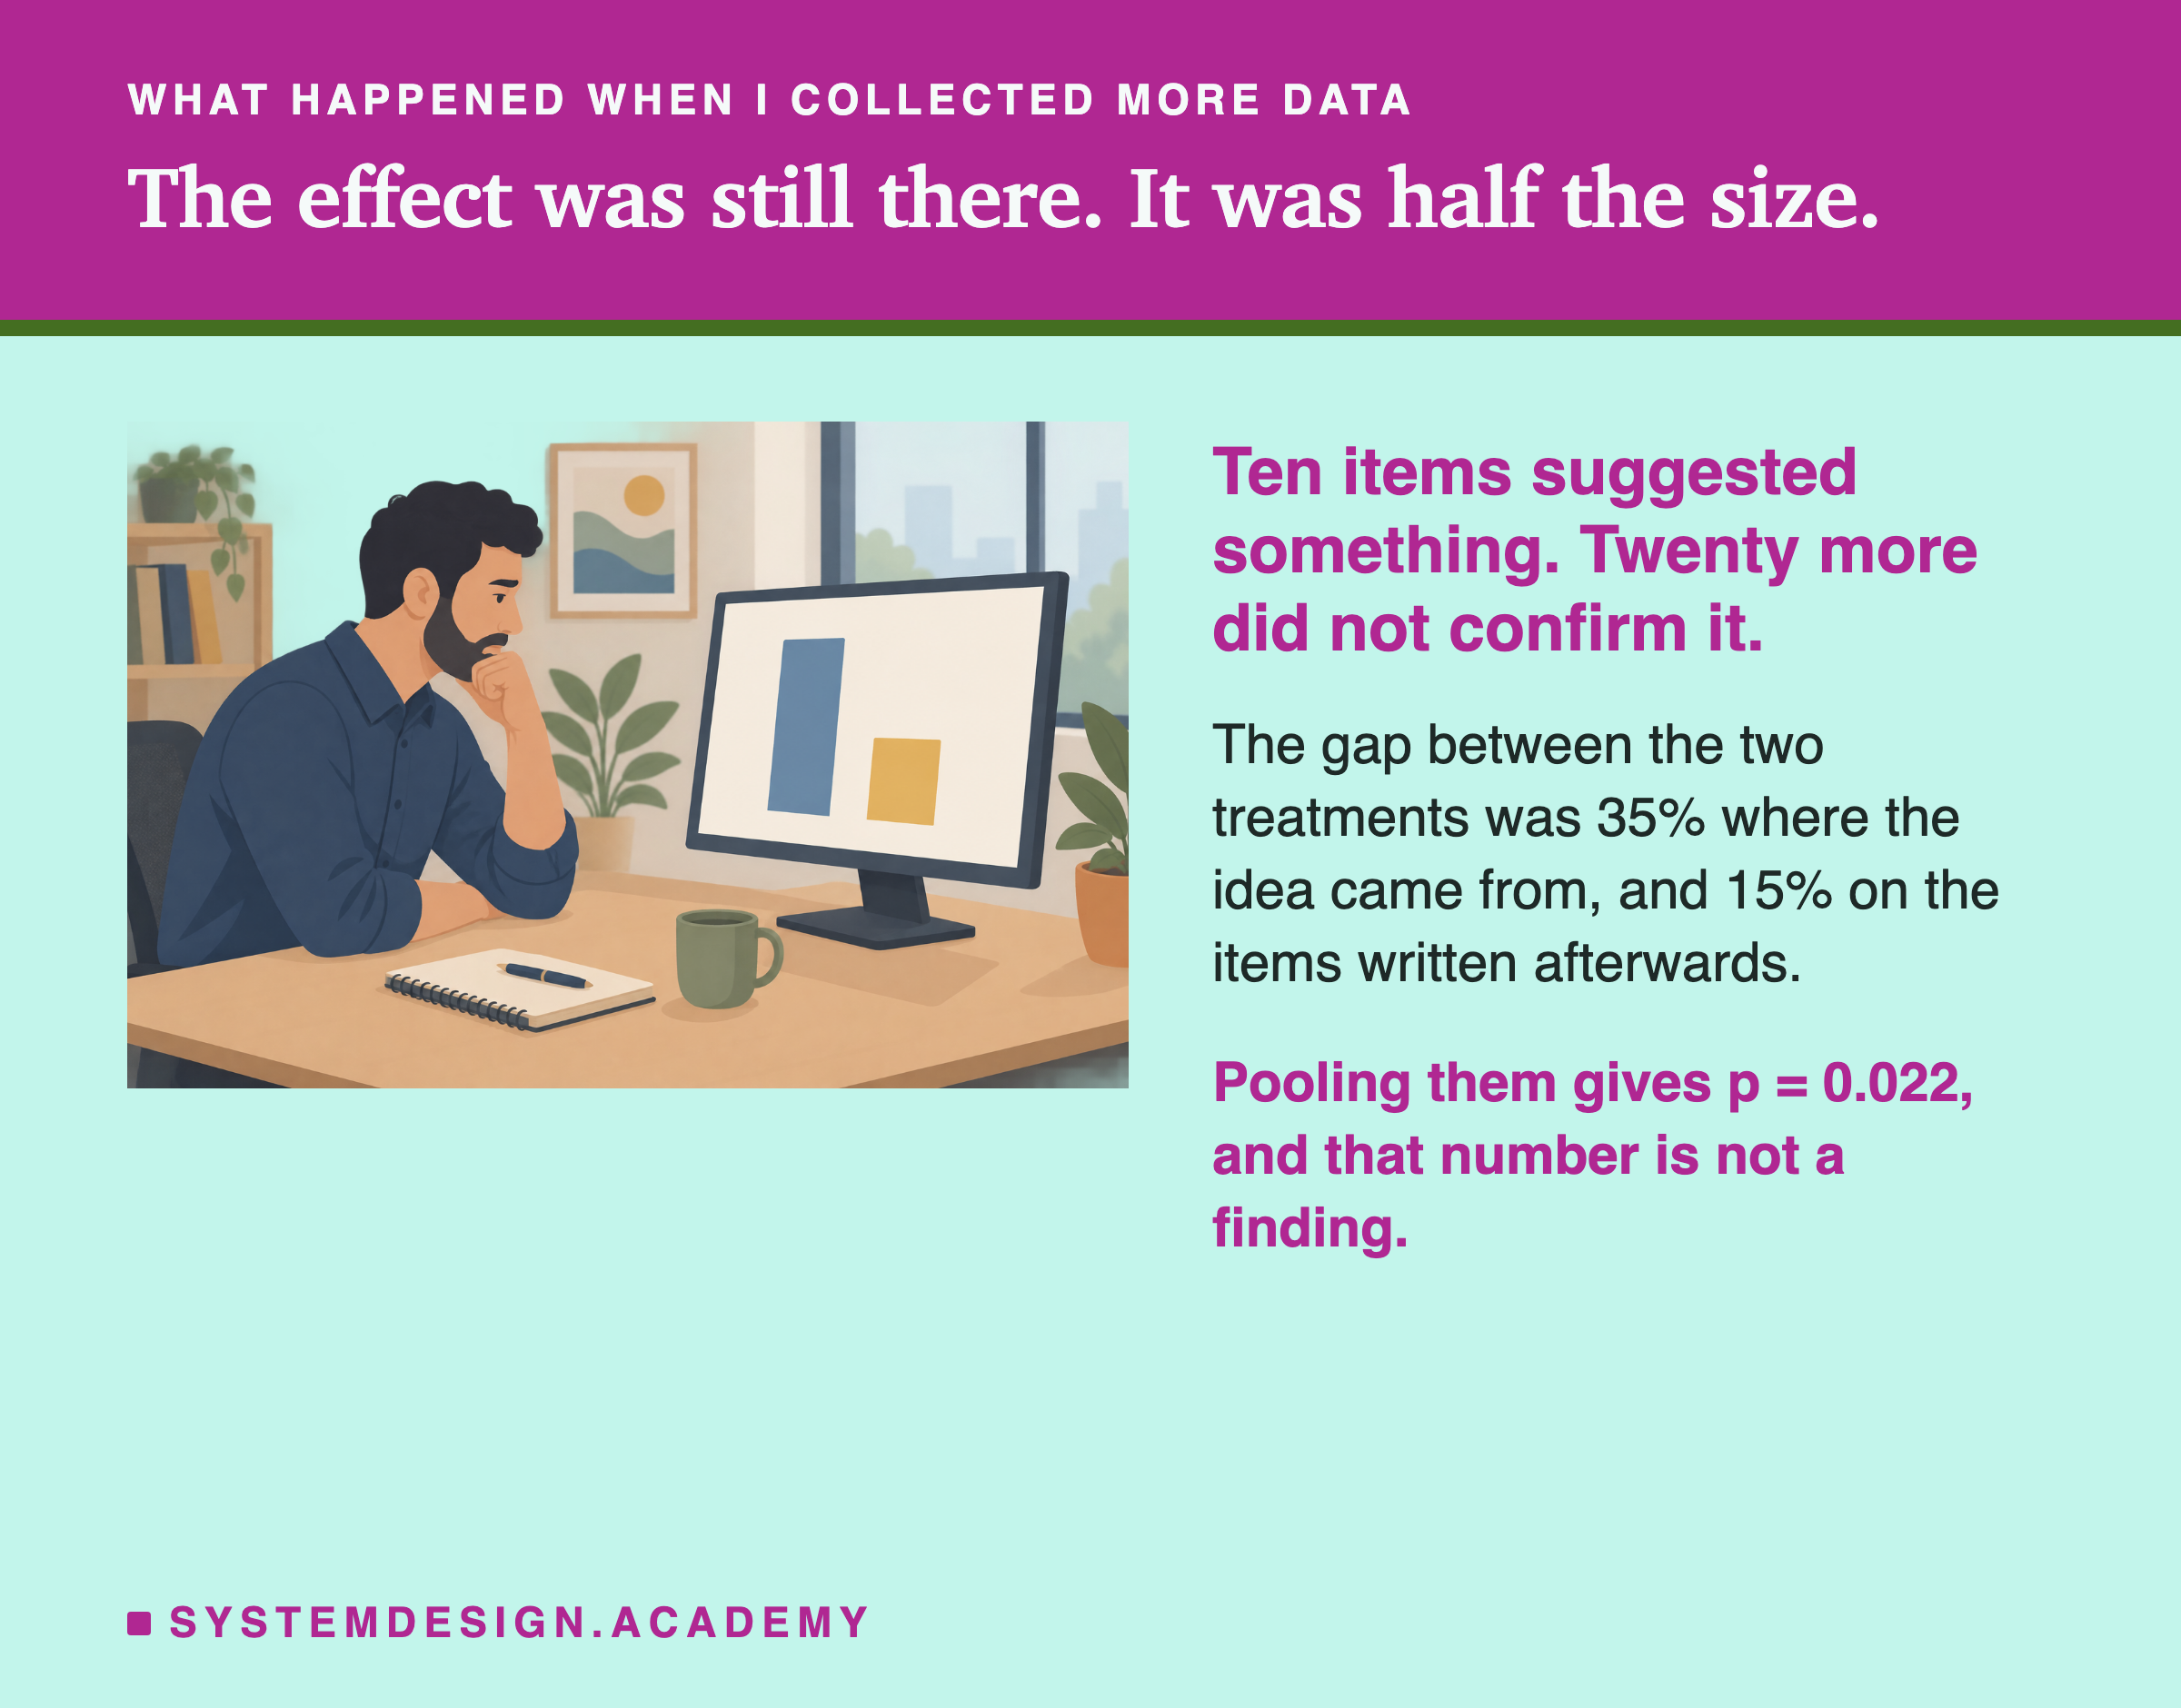
The effect was still there. It was less than half the size, and the test on the new items came back undecided.
This lesson is about what to do with that, because what most people do with it is the thing that makes a p value stop meaning anything.
Where the Idea Came From
Here are the two numbers that started it. Both come from the ten tie items the previous lesson used. A tie item is one where the two answers make the same claim, so nothing about quality can decide the verdict.
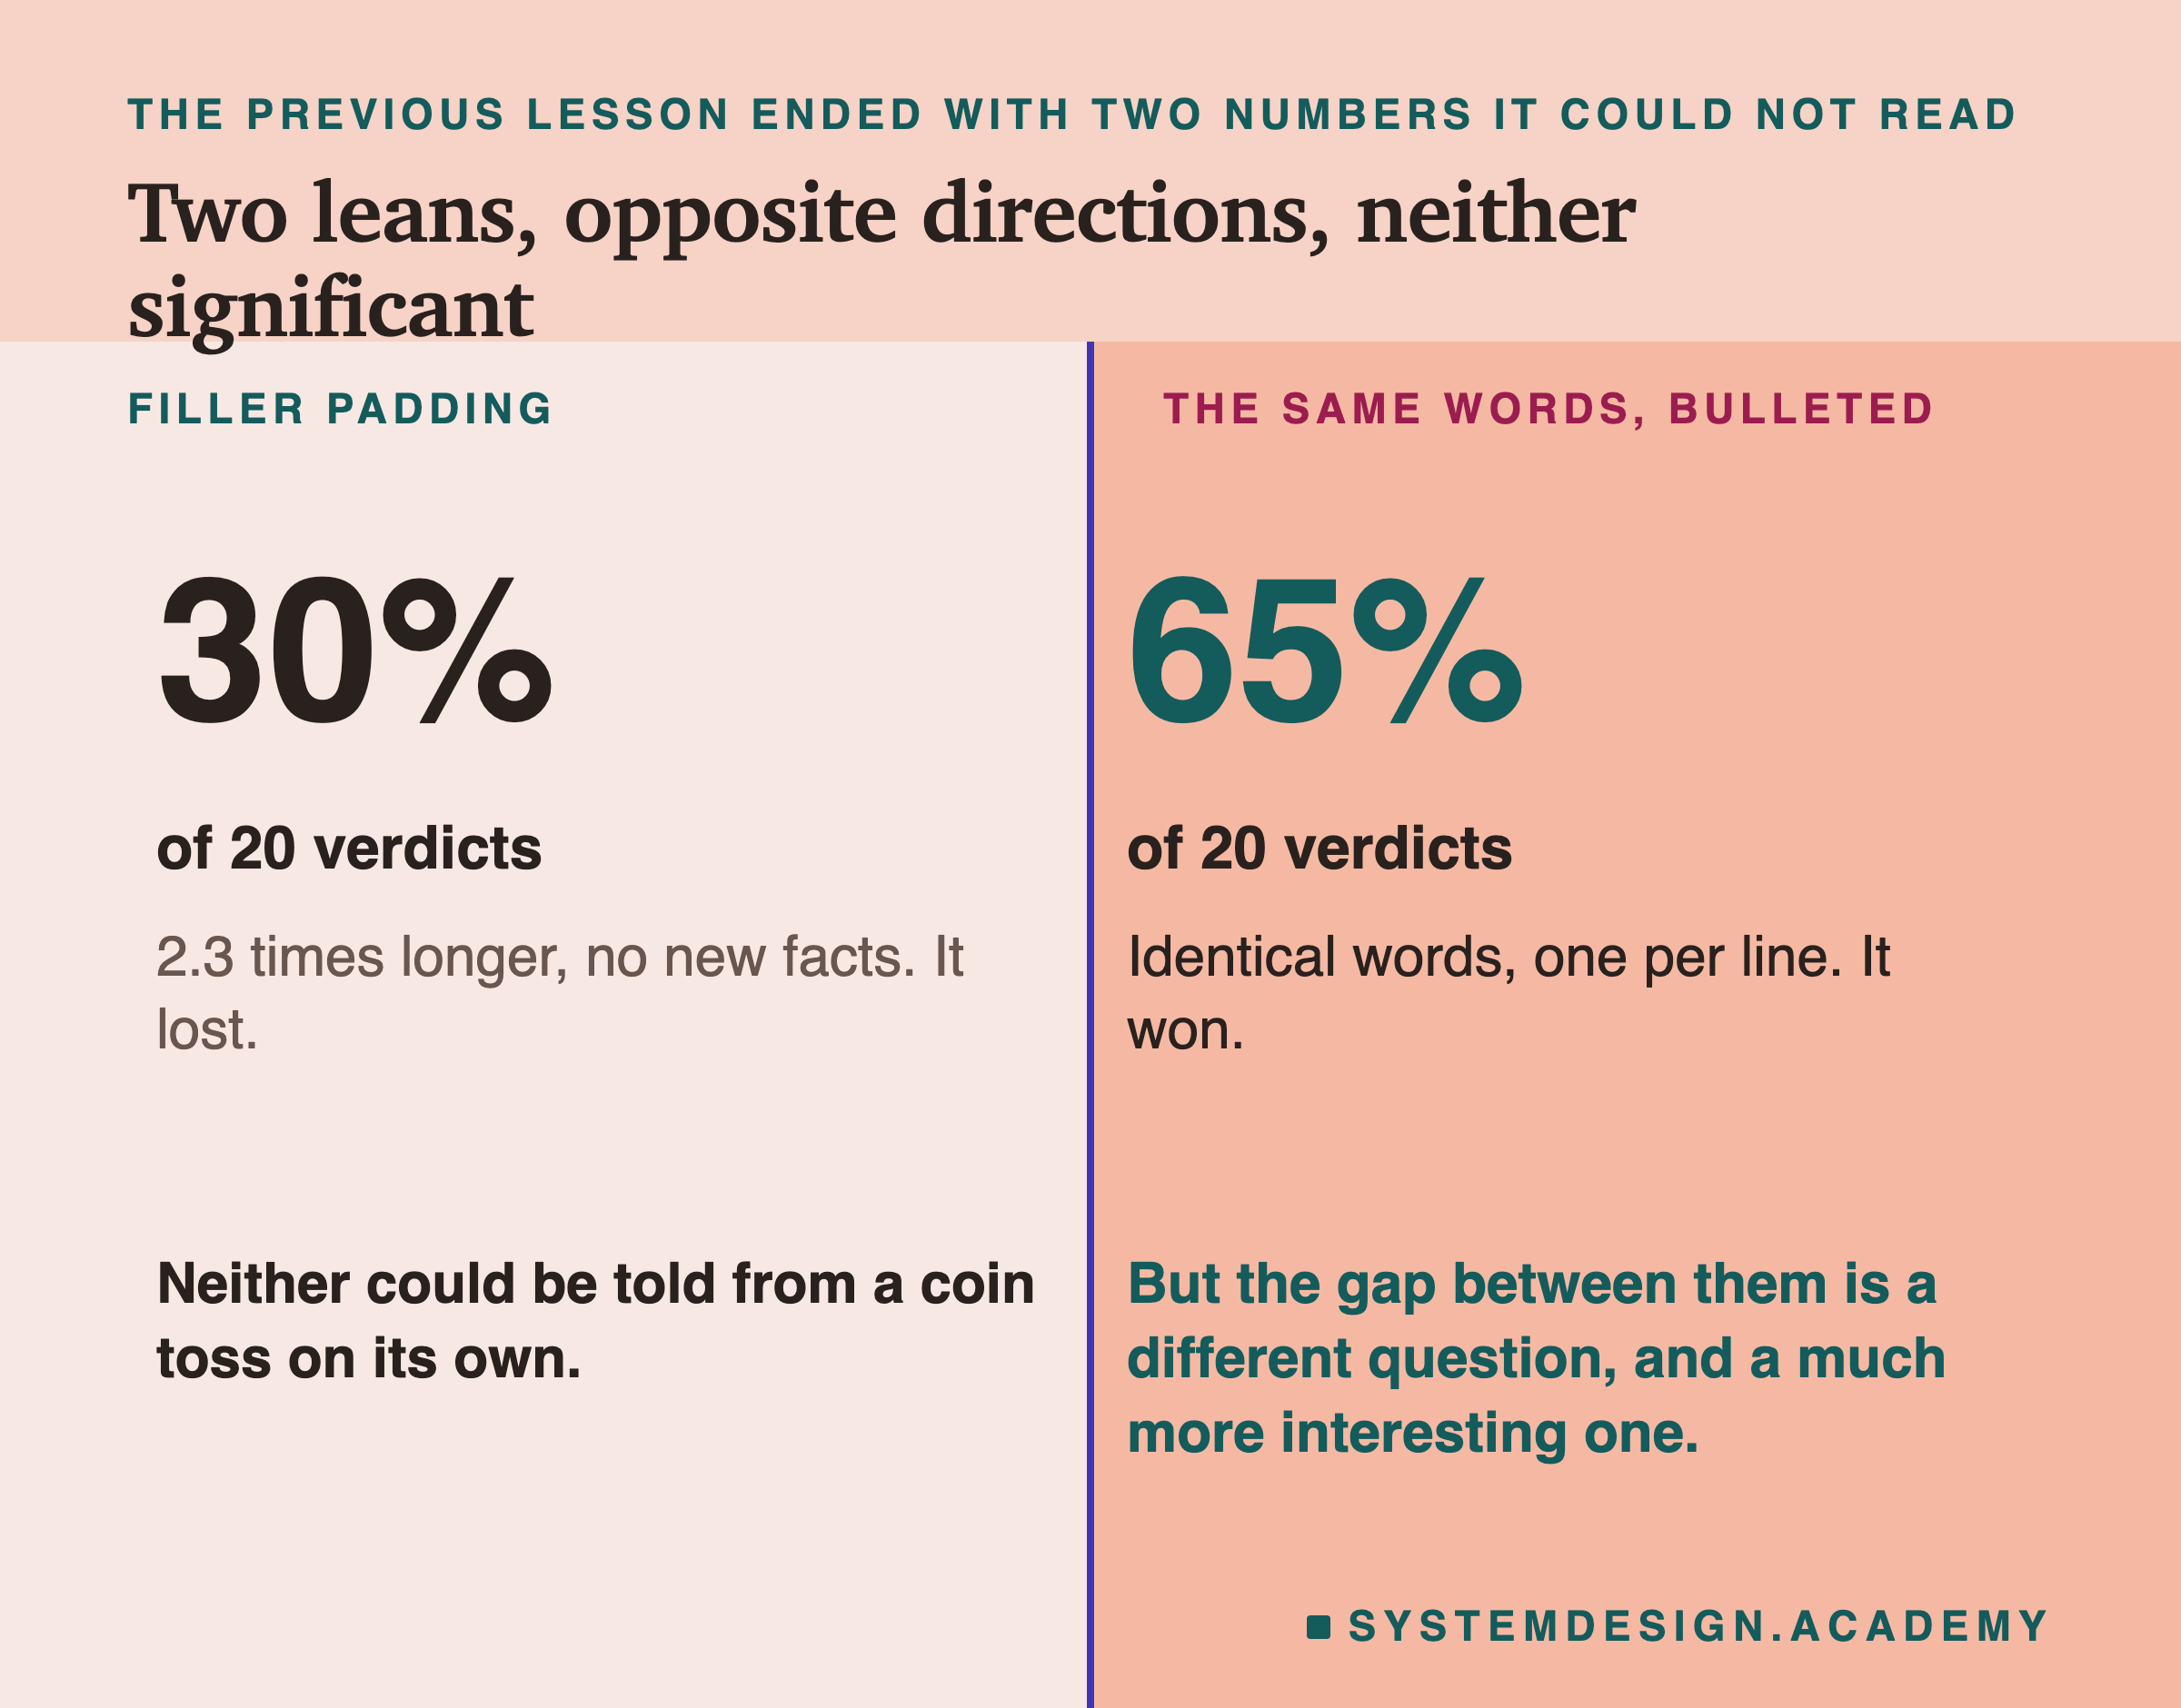
Neither number on its own says anything. Twenty verdicts landing at 30% or at 65% is well inside what a fair coin does.
The interesting quantity is the difference between them, because the two treatments differ in a way that maps onto a real question.
Length and Structure Are Two Different Things
Most writing about verbosity bias treats "longer" as one variable. It is not. An elaborated answer is longer and better organised at the same time, so a judge that prefers it could be responding to either.
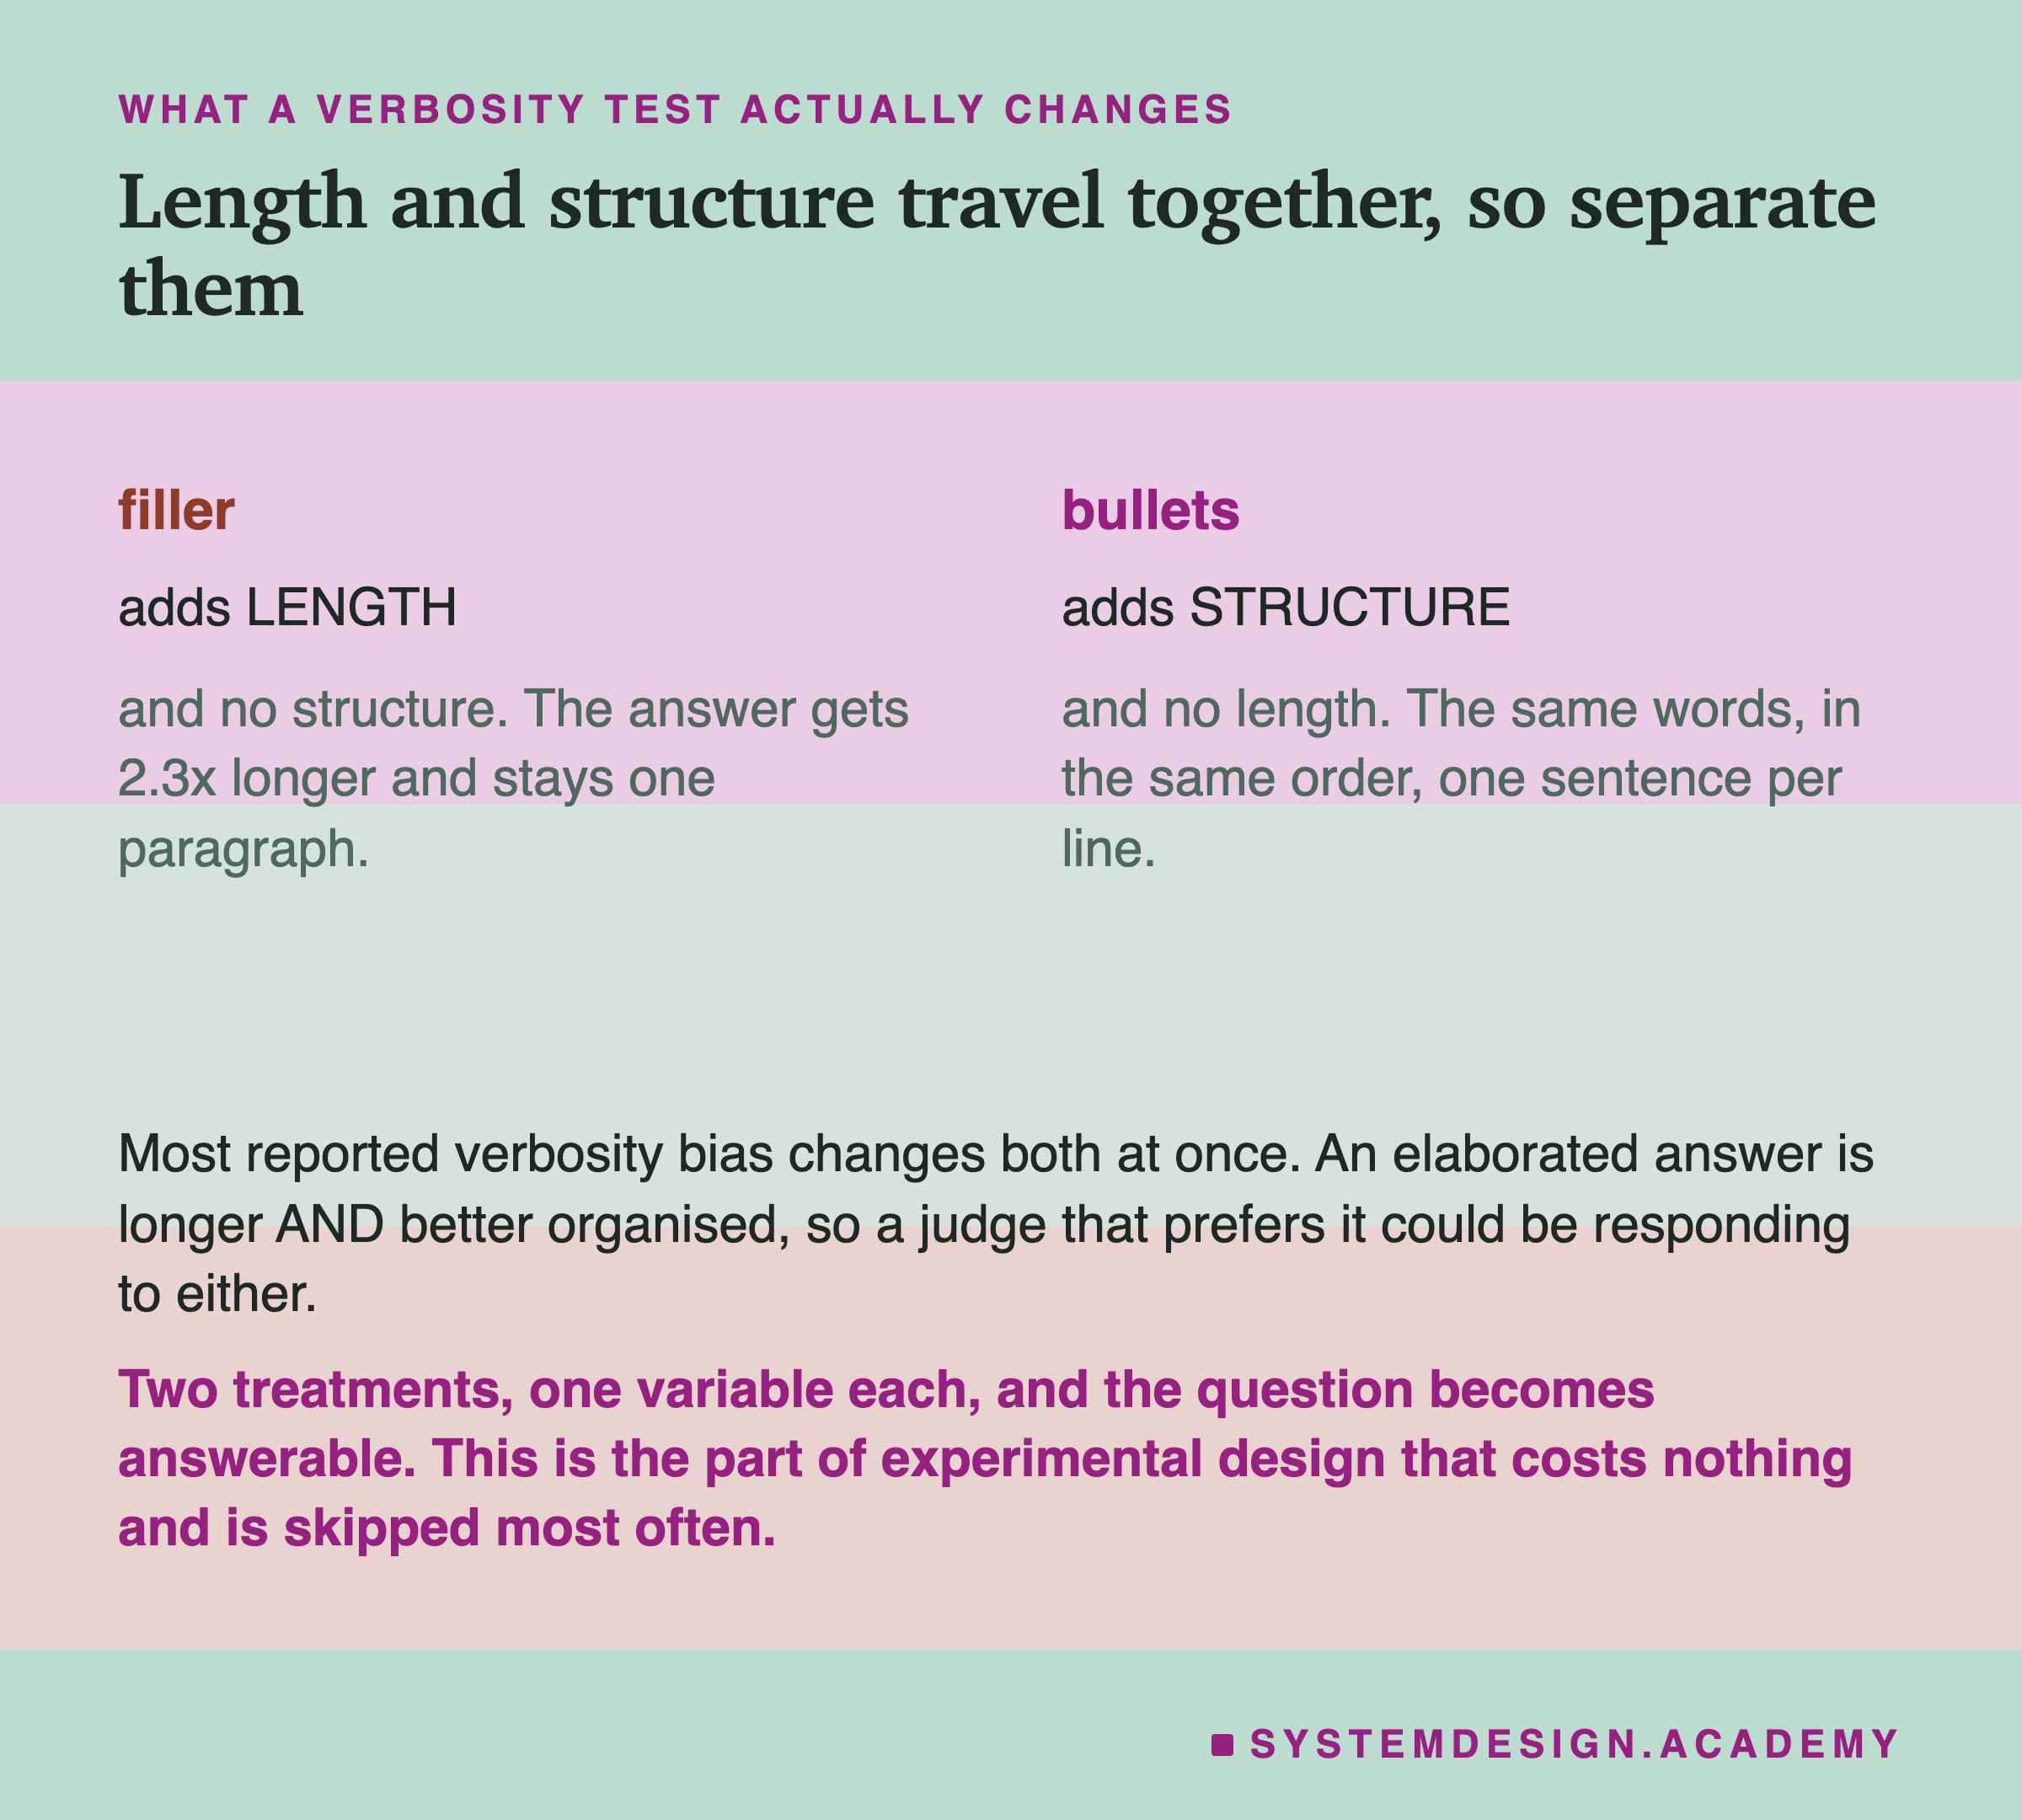
Filler moves length and holds structure fixed. Bulleting moves structure and holds length fixed, exactly, because it adds no words at all.
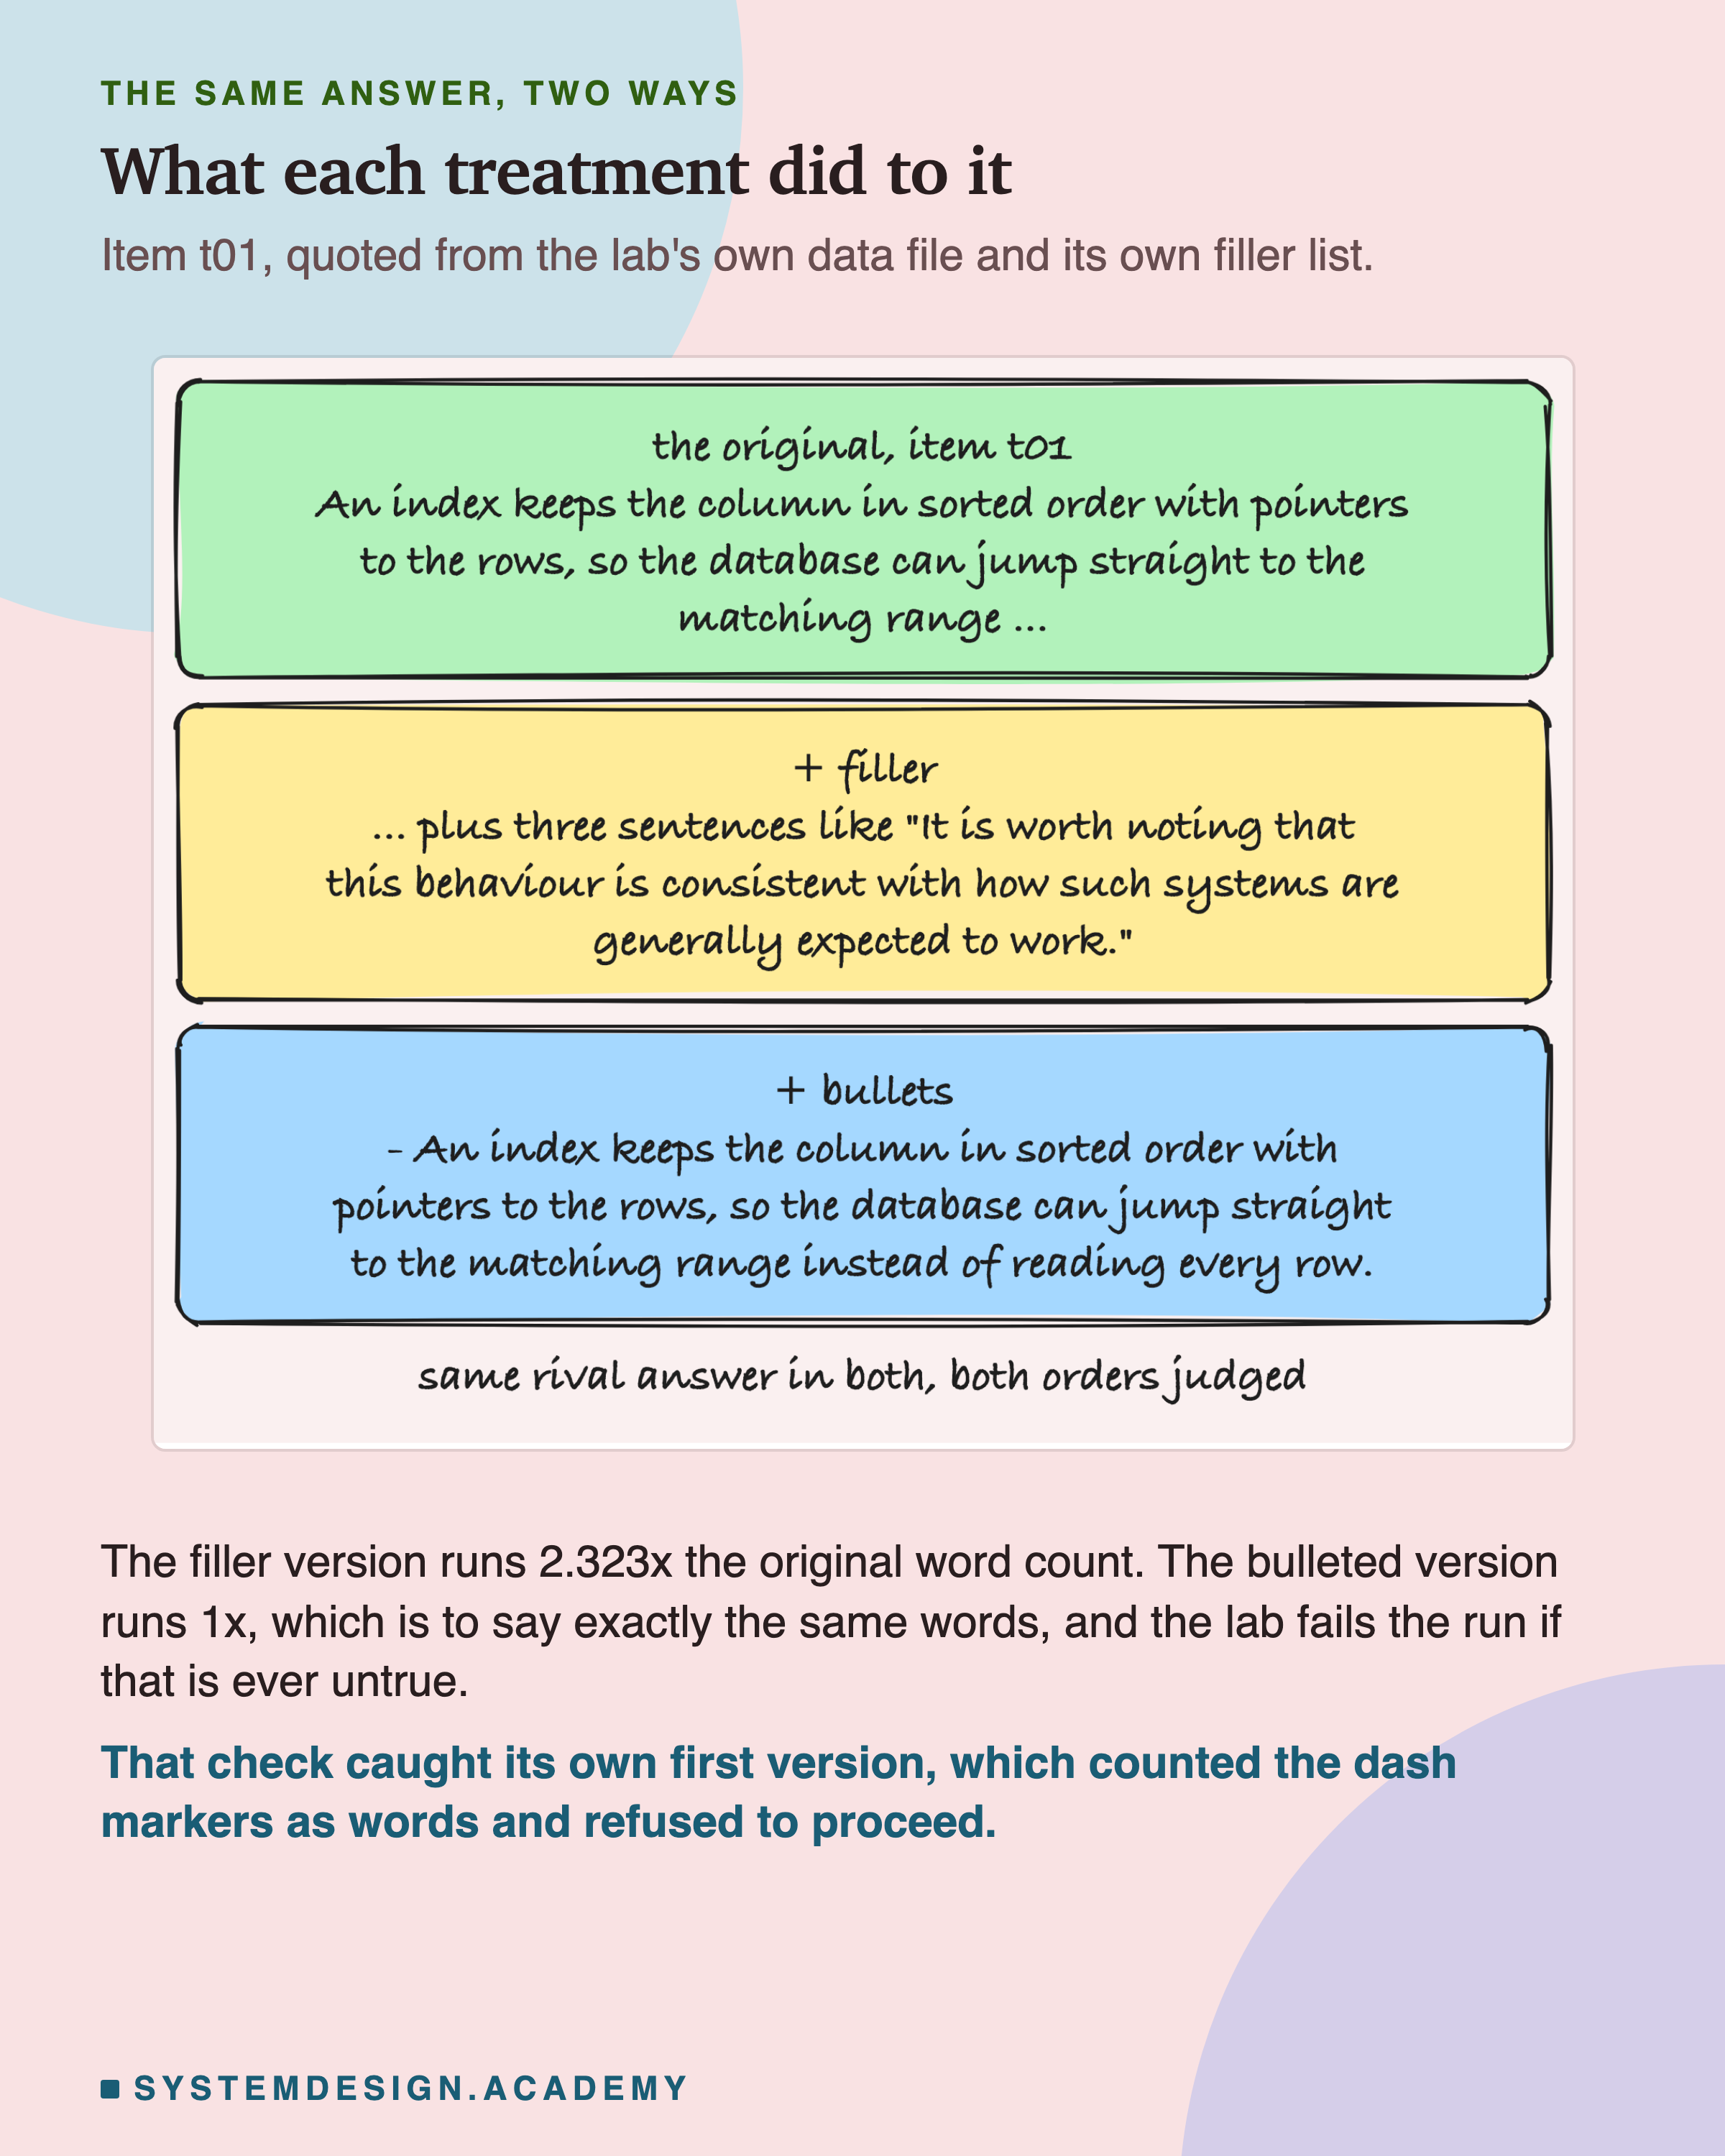
The equality check is worth copying. The lab compares the word lists before and after bulleting and refuses to run if a single content word changed. Without it, "structure only" is an assumption rather than a fact.
Twenty More Items
Collecting more data on this question is cheap. A tie item is one question and two answers that make the same claim, and writing twenty of them is an afternoon.
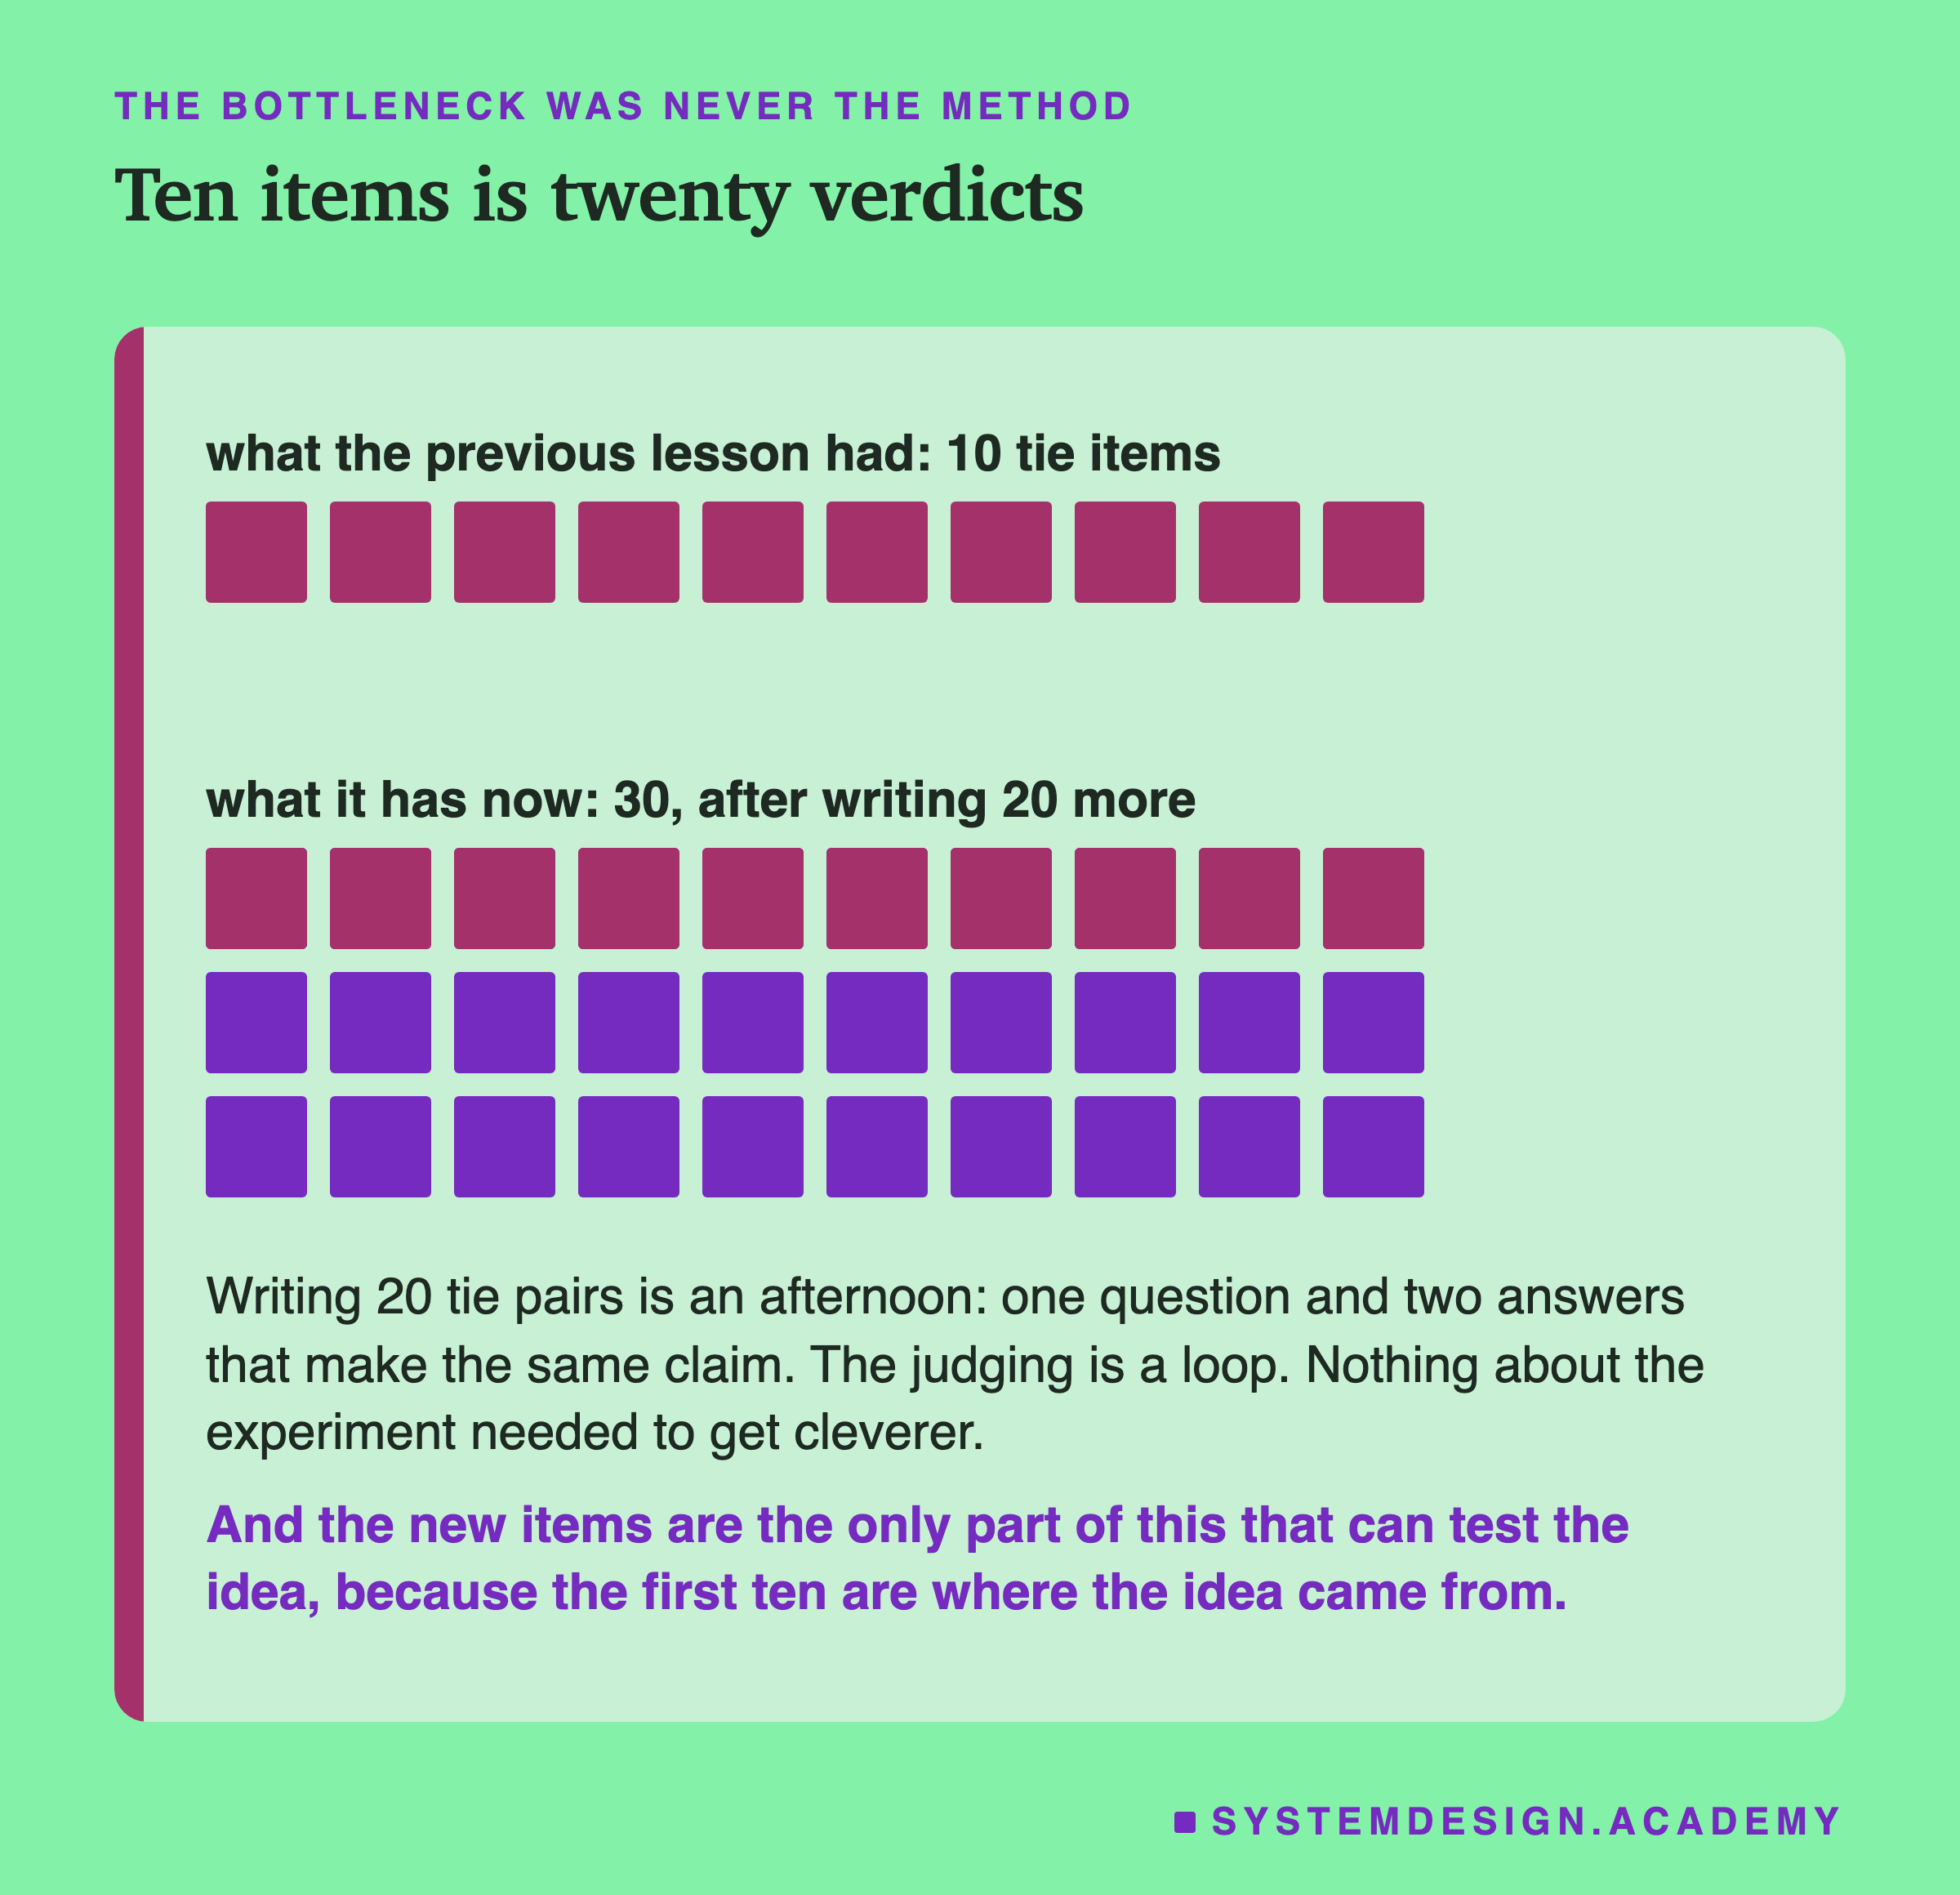
The last sentence there is the whole lesson in one line, so it is worth slowing down on.
The first ten items are the reason the hypothesis exists. They cannot also be the test of it. The twenty new ones can, because nothing about them was chosen knowing what they would say.
That last sentence is doing a lot of work, so here is what is actually true of the new items.
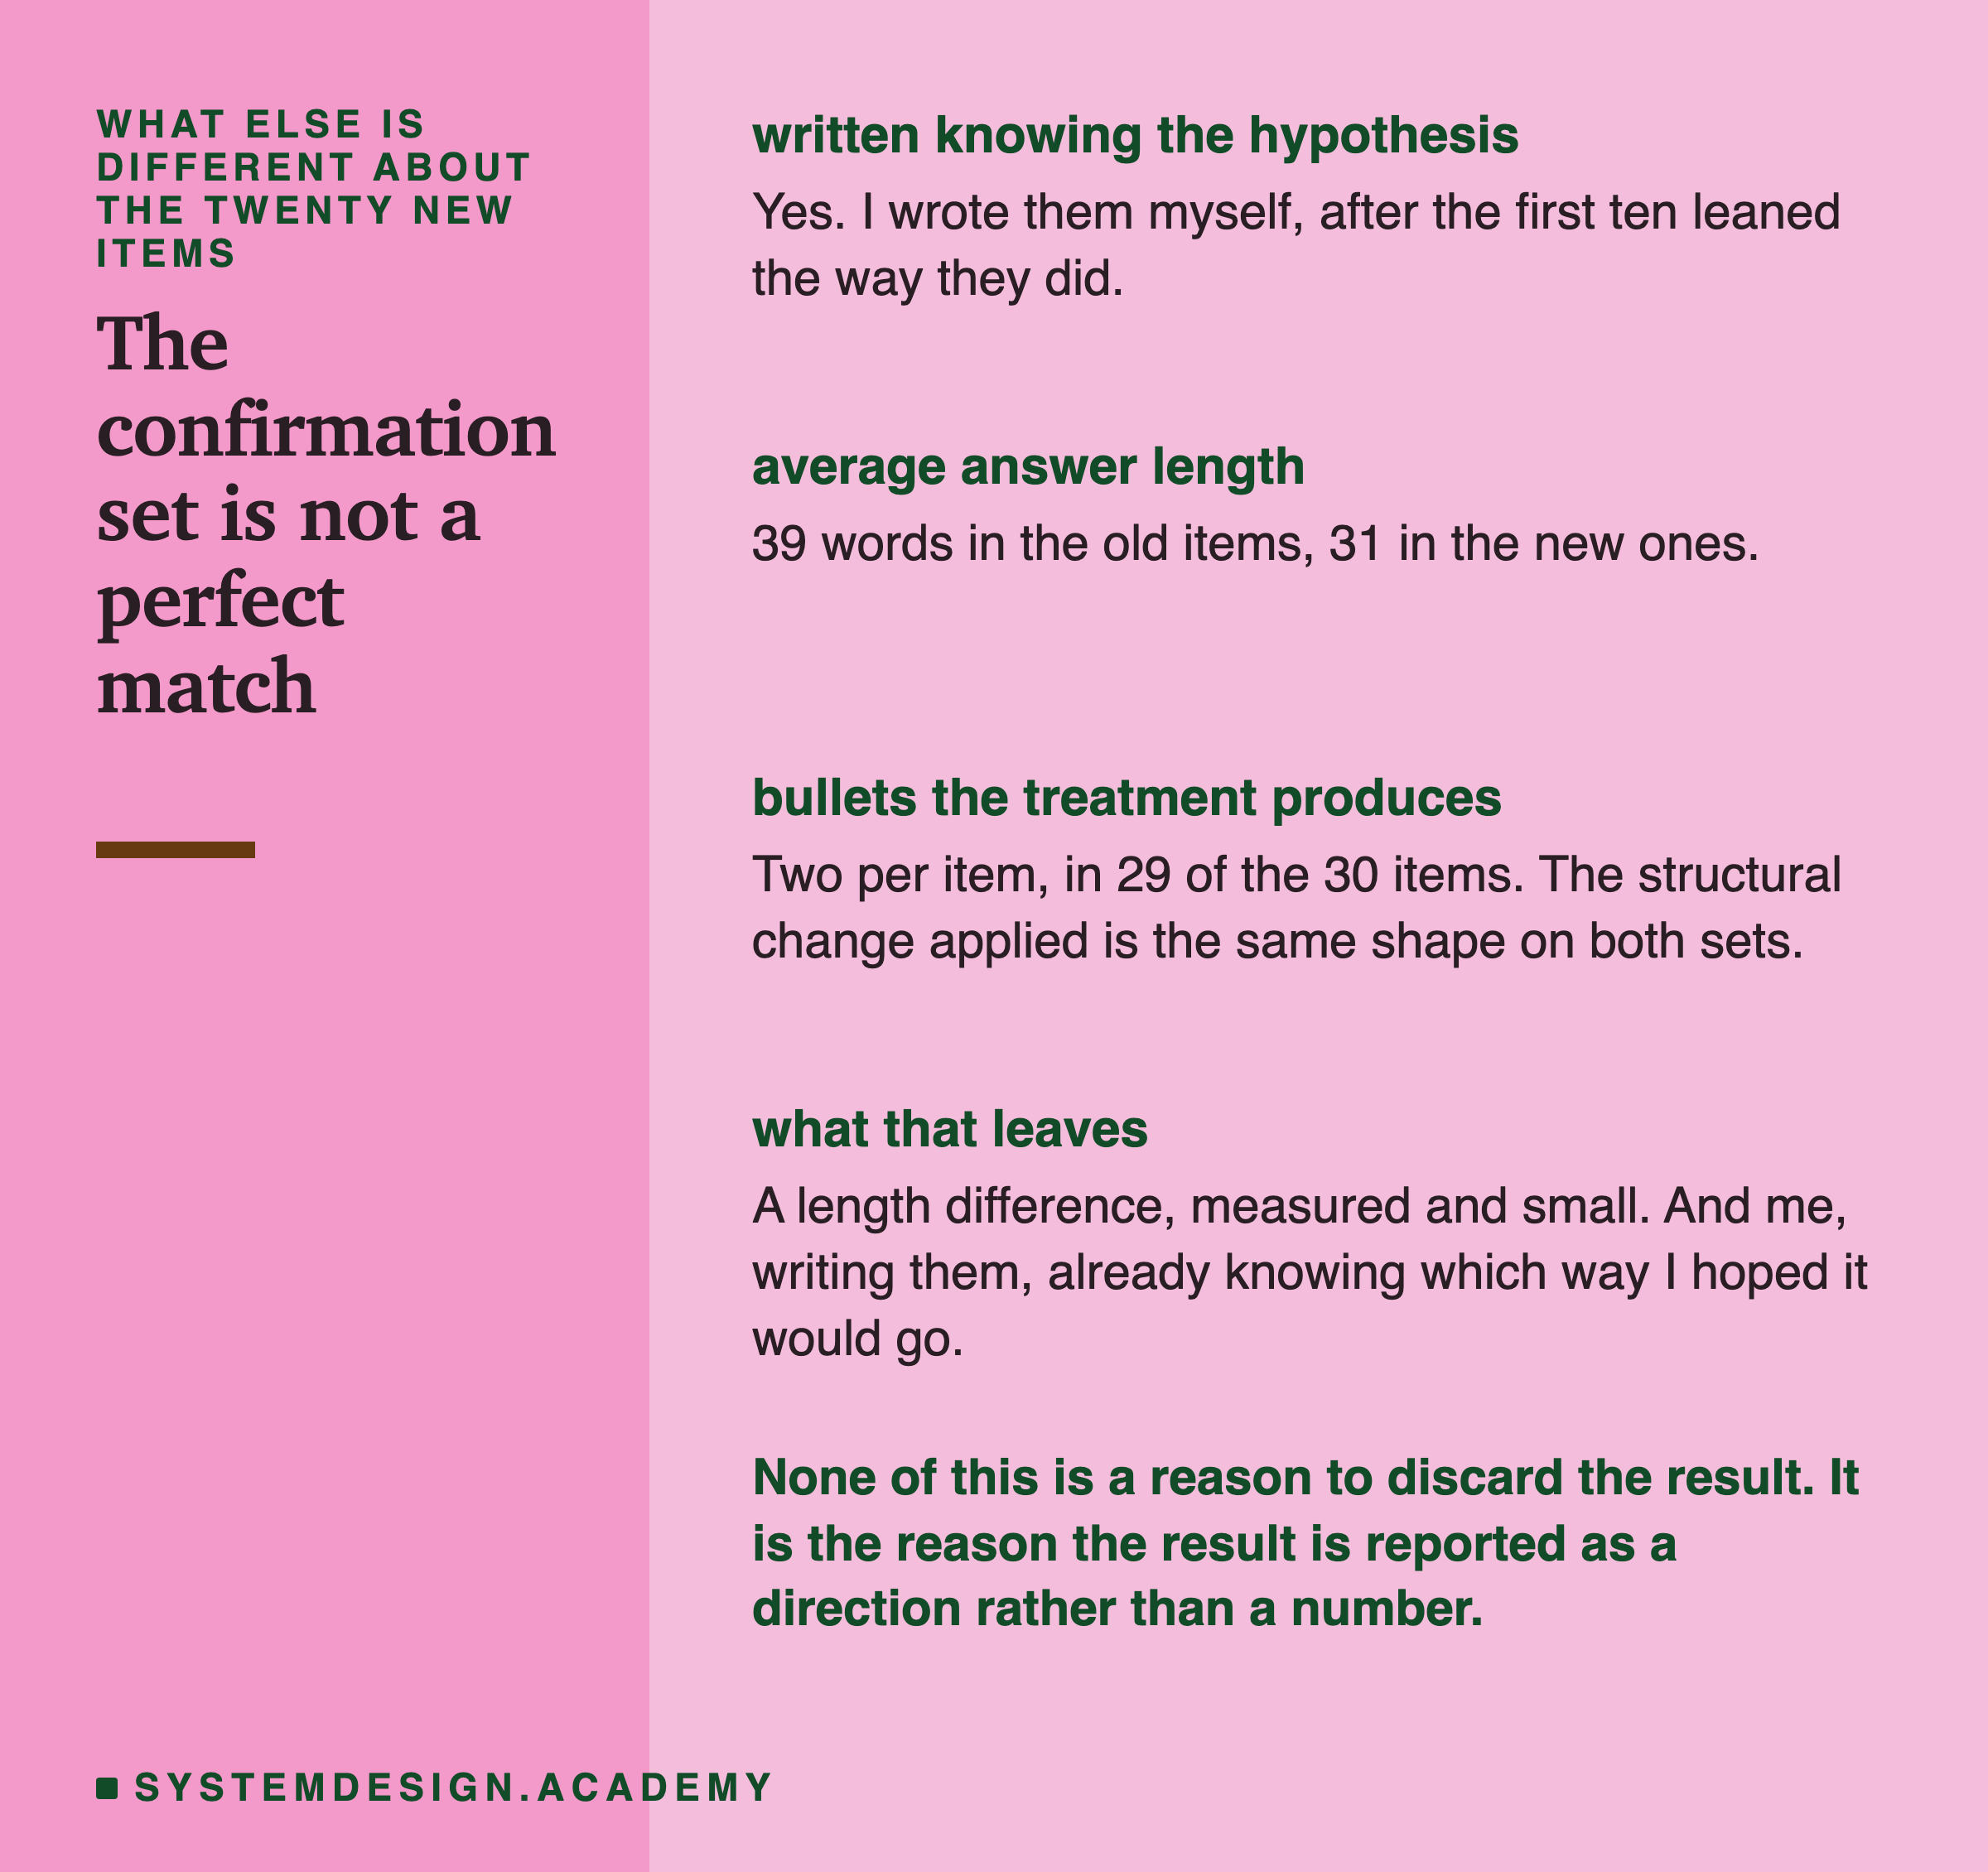
I wrote the new items myself, knowing what I hoped they would show. That is a real threat to the test and it deserves saying out loud rather than leaving for a reader to work out.
Two things reduce it. The treatments are applied by code, not by hand, so I never chose how any individual item would be padded or bulleted. And the structural change comes out the same shape on both sets. Bulleting produces exactly two lines in 29 of the 30 items, so the new items are not getting a weaker version of the treatment.
What is left is that the new answers are shorter, 31 words against 39. That is a difference and I cannot rule out that it matters. The right response is not to hide it, it is to report the result as a direction that held rather than as a number worth quoting.
The Number It Is Tempting To Report
Run all thirty items through both treatments in both orders and you get 120 judging calls, 60 verdicts per treatment.
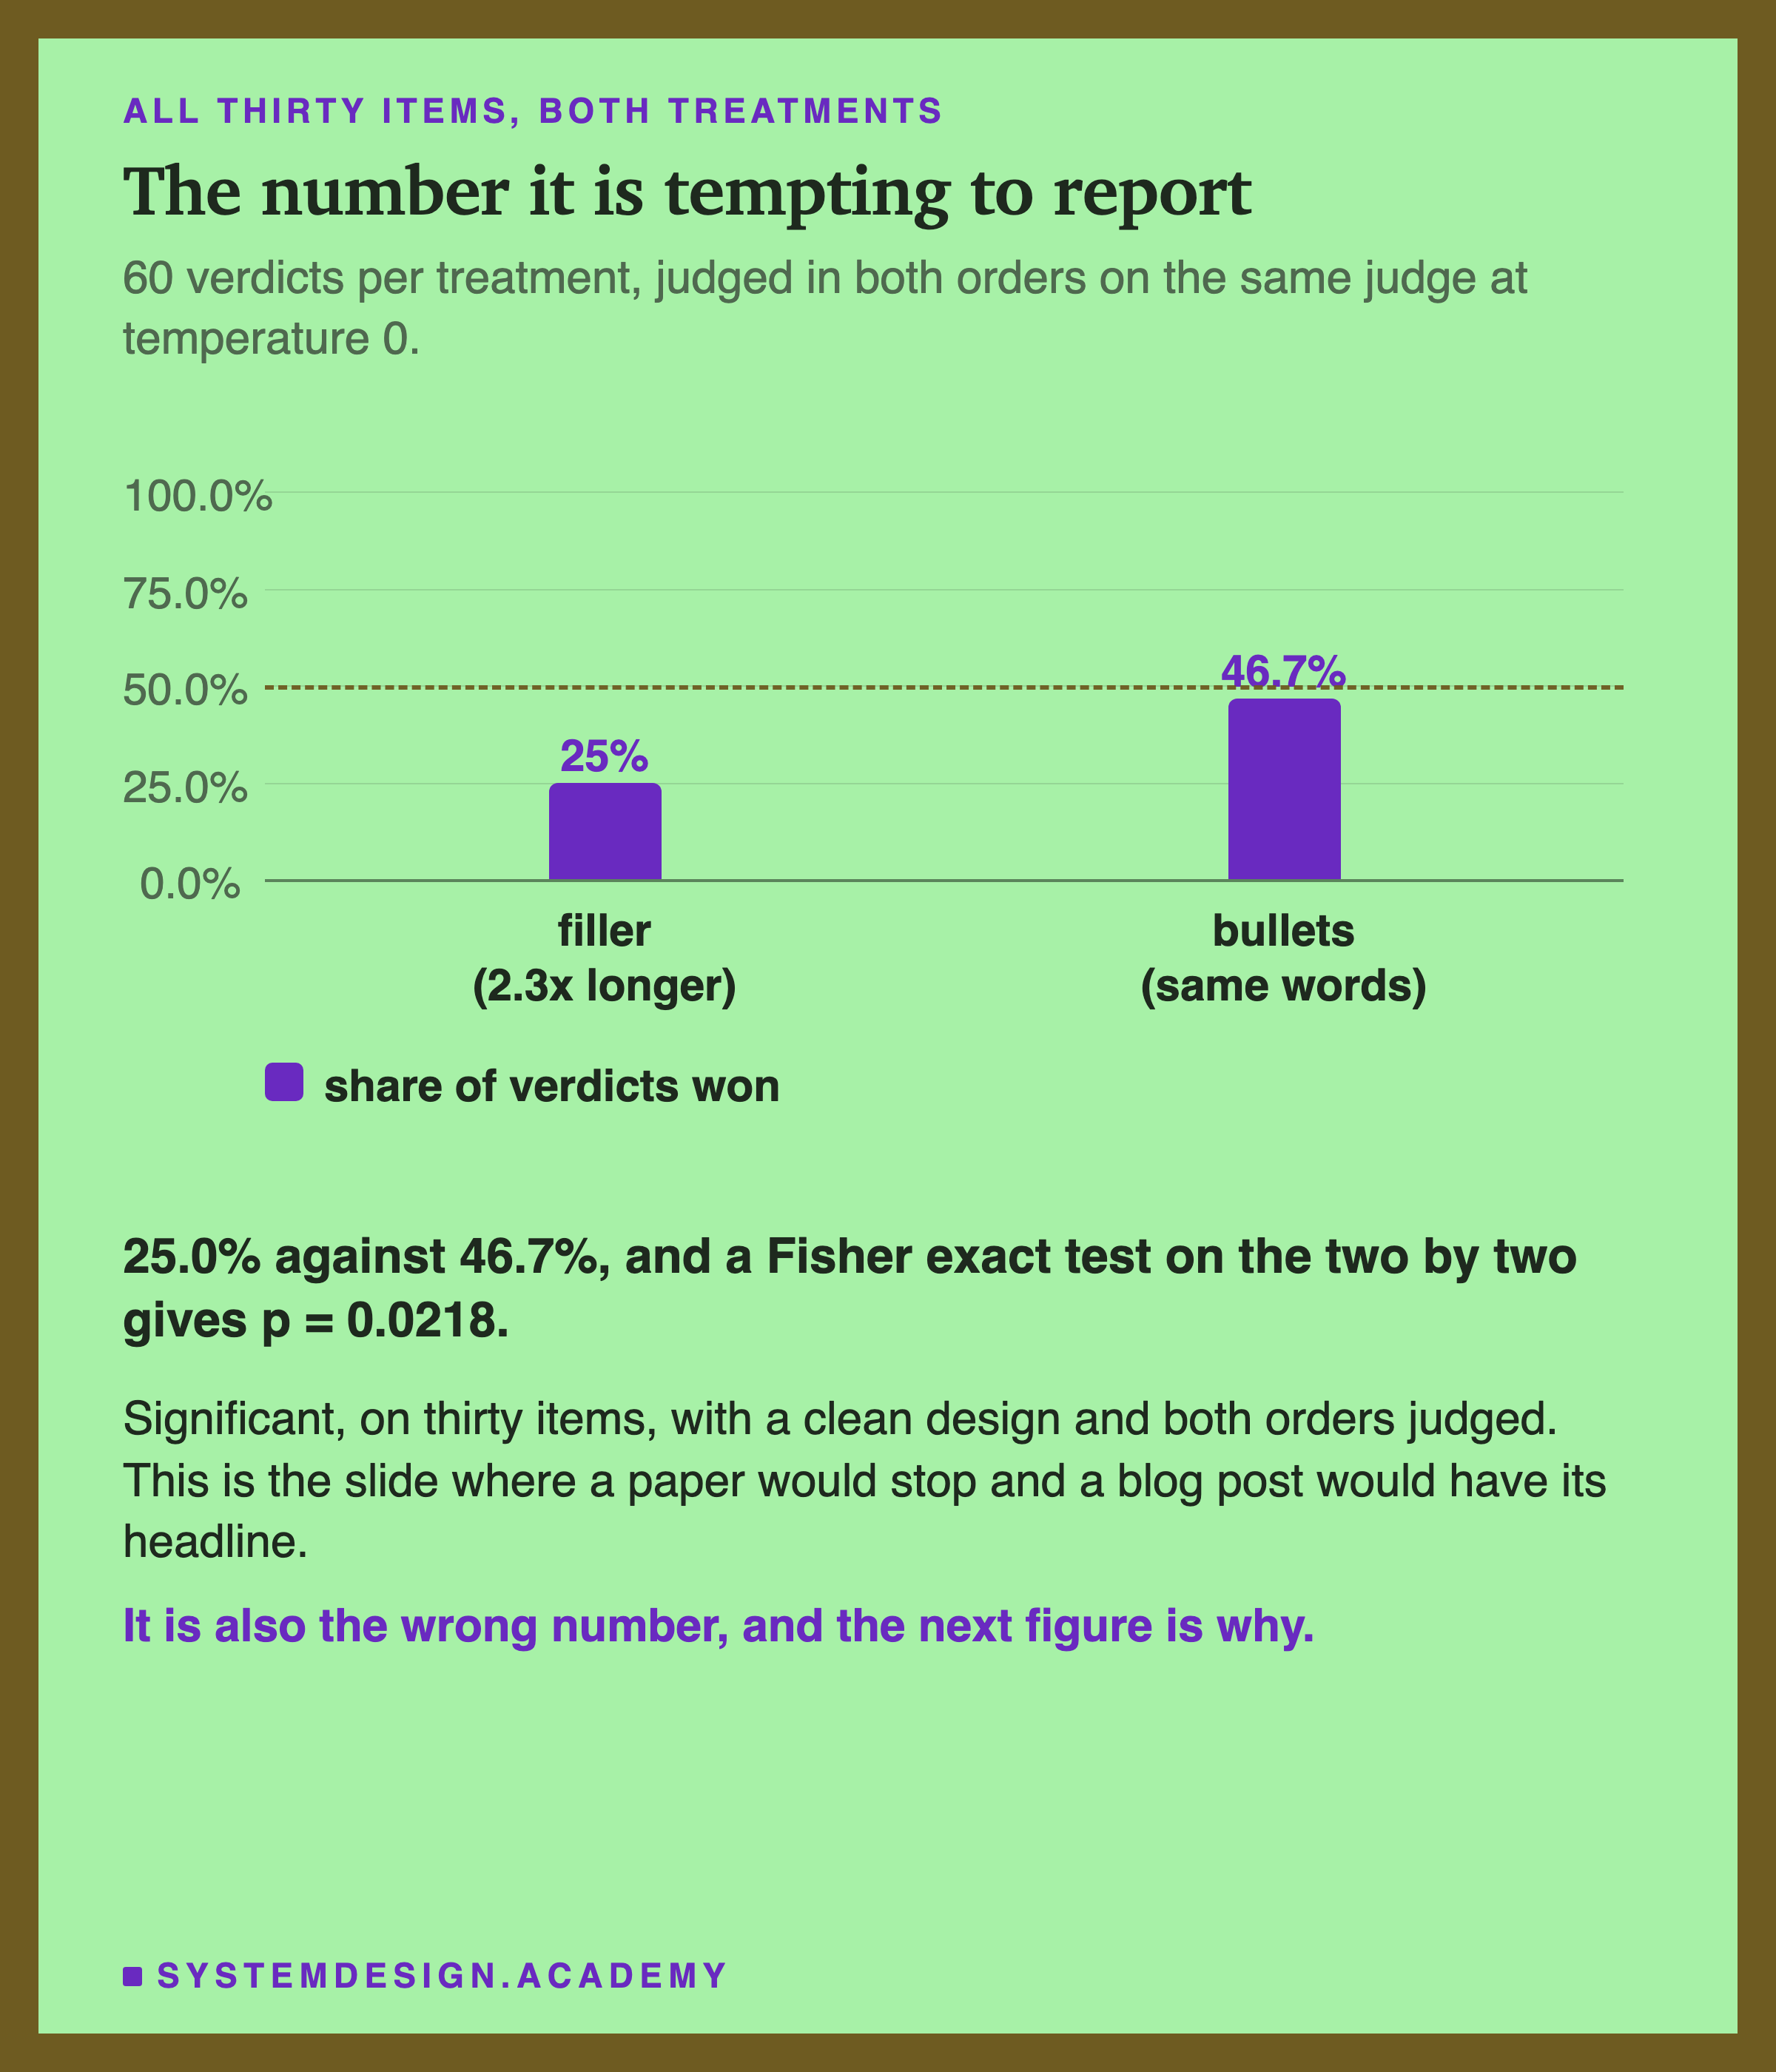
There is nothing wrong with that arithmetic. Thirty items, both orders, temperature zero, one variable per treatment, a test that is exact rather than approximate. It would survive a review.
It is still the wrong number, and the reason has nothing to do with the statistics.
Split By Where The Idea Came From
The thirty items are not one sample. They are ten items that produced a hypothesis and twenty that were collected to test it.
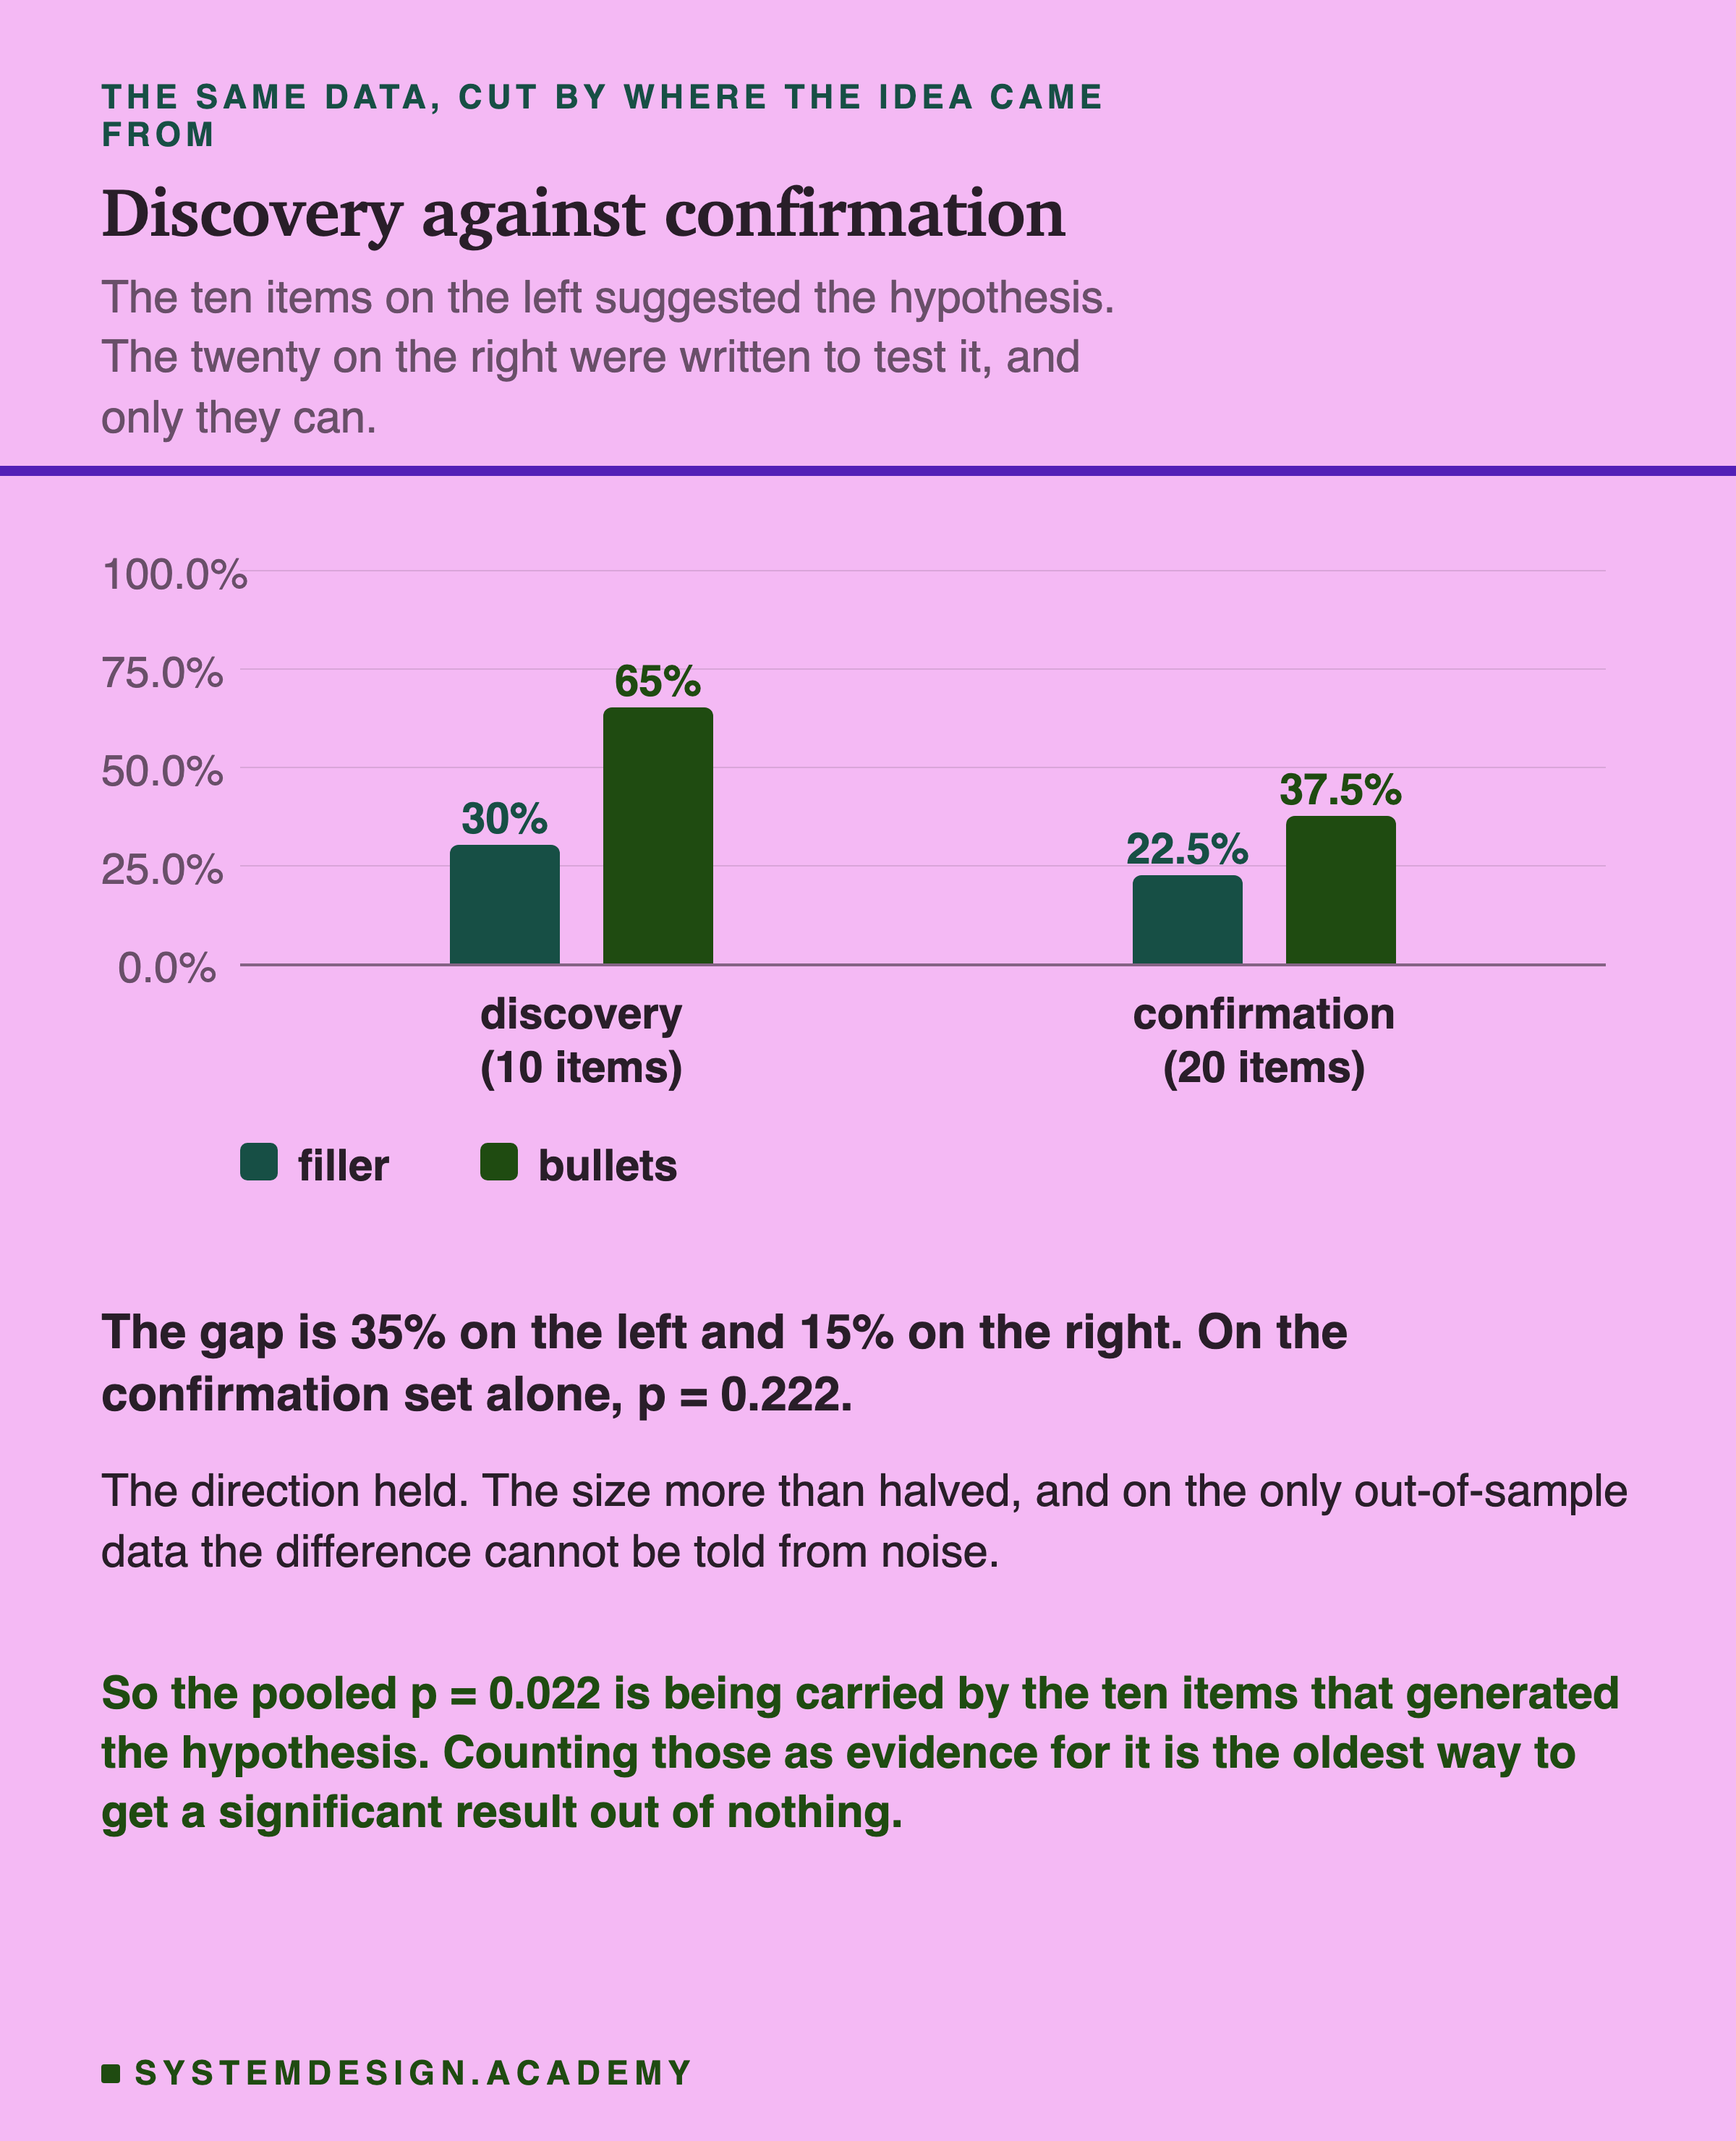
Read those two groups as two separate experiments, because that is what they are.
The first one is exploratory. It looked at several comparisons and reported the one that stood out. The second one is confirmatory. It ran one pre-chosen comparison on data that had never been looked at.
Only the second is a test, and the second came back undecided.
The Lab
The whole experiment is 120 calls to a 4B model running on a laptop. The lab computes the split itself and refuses to headline the pooled number.
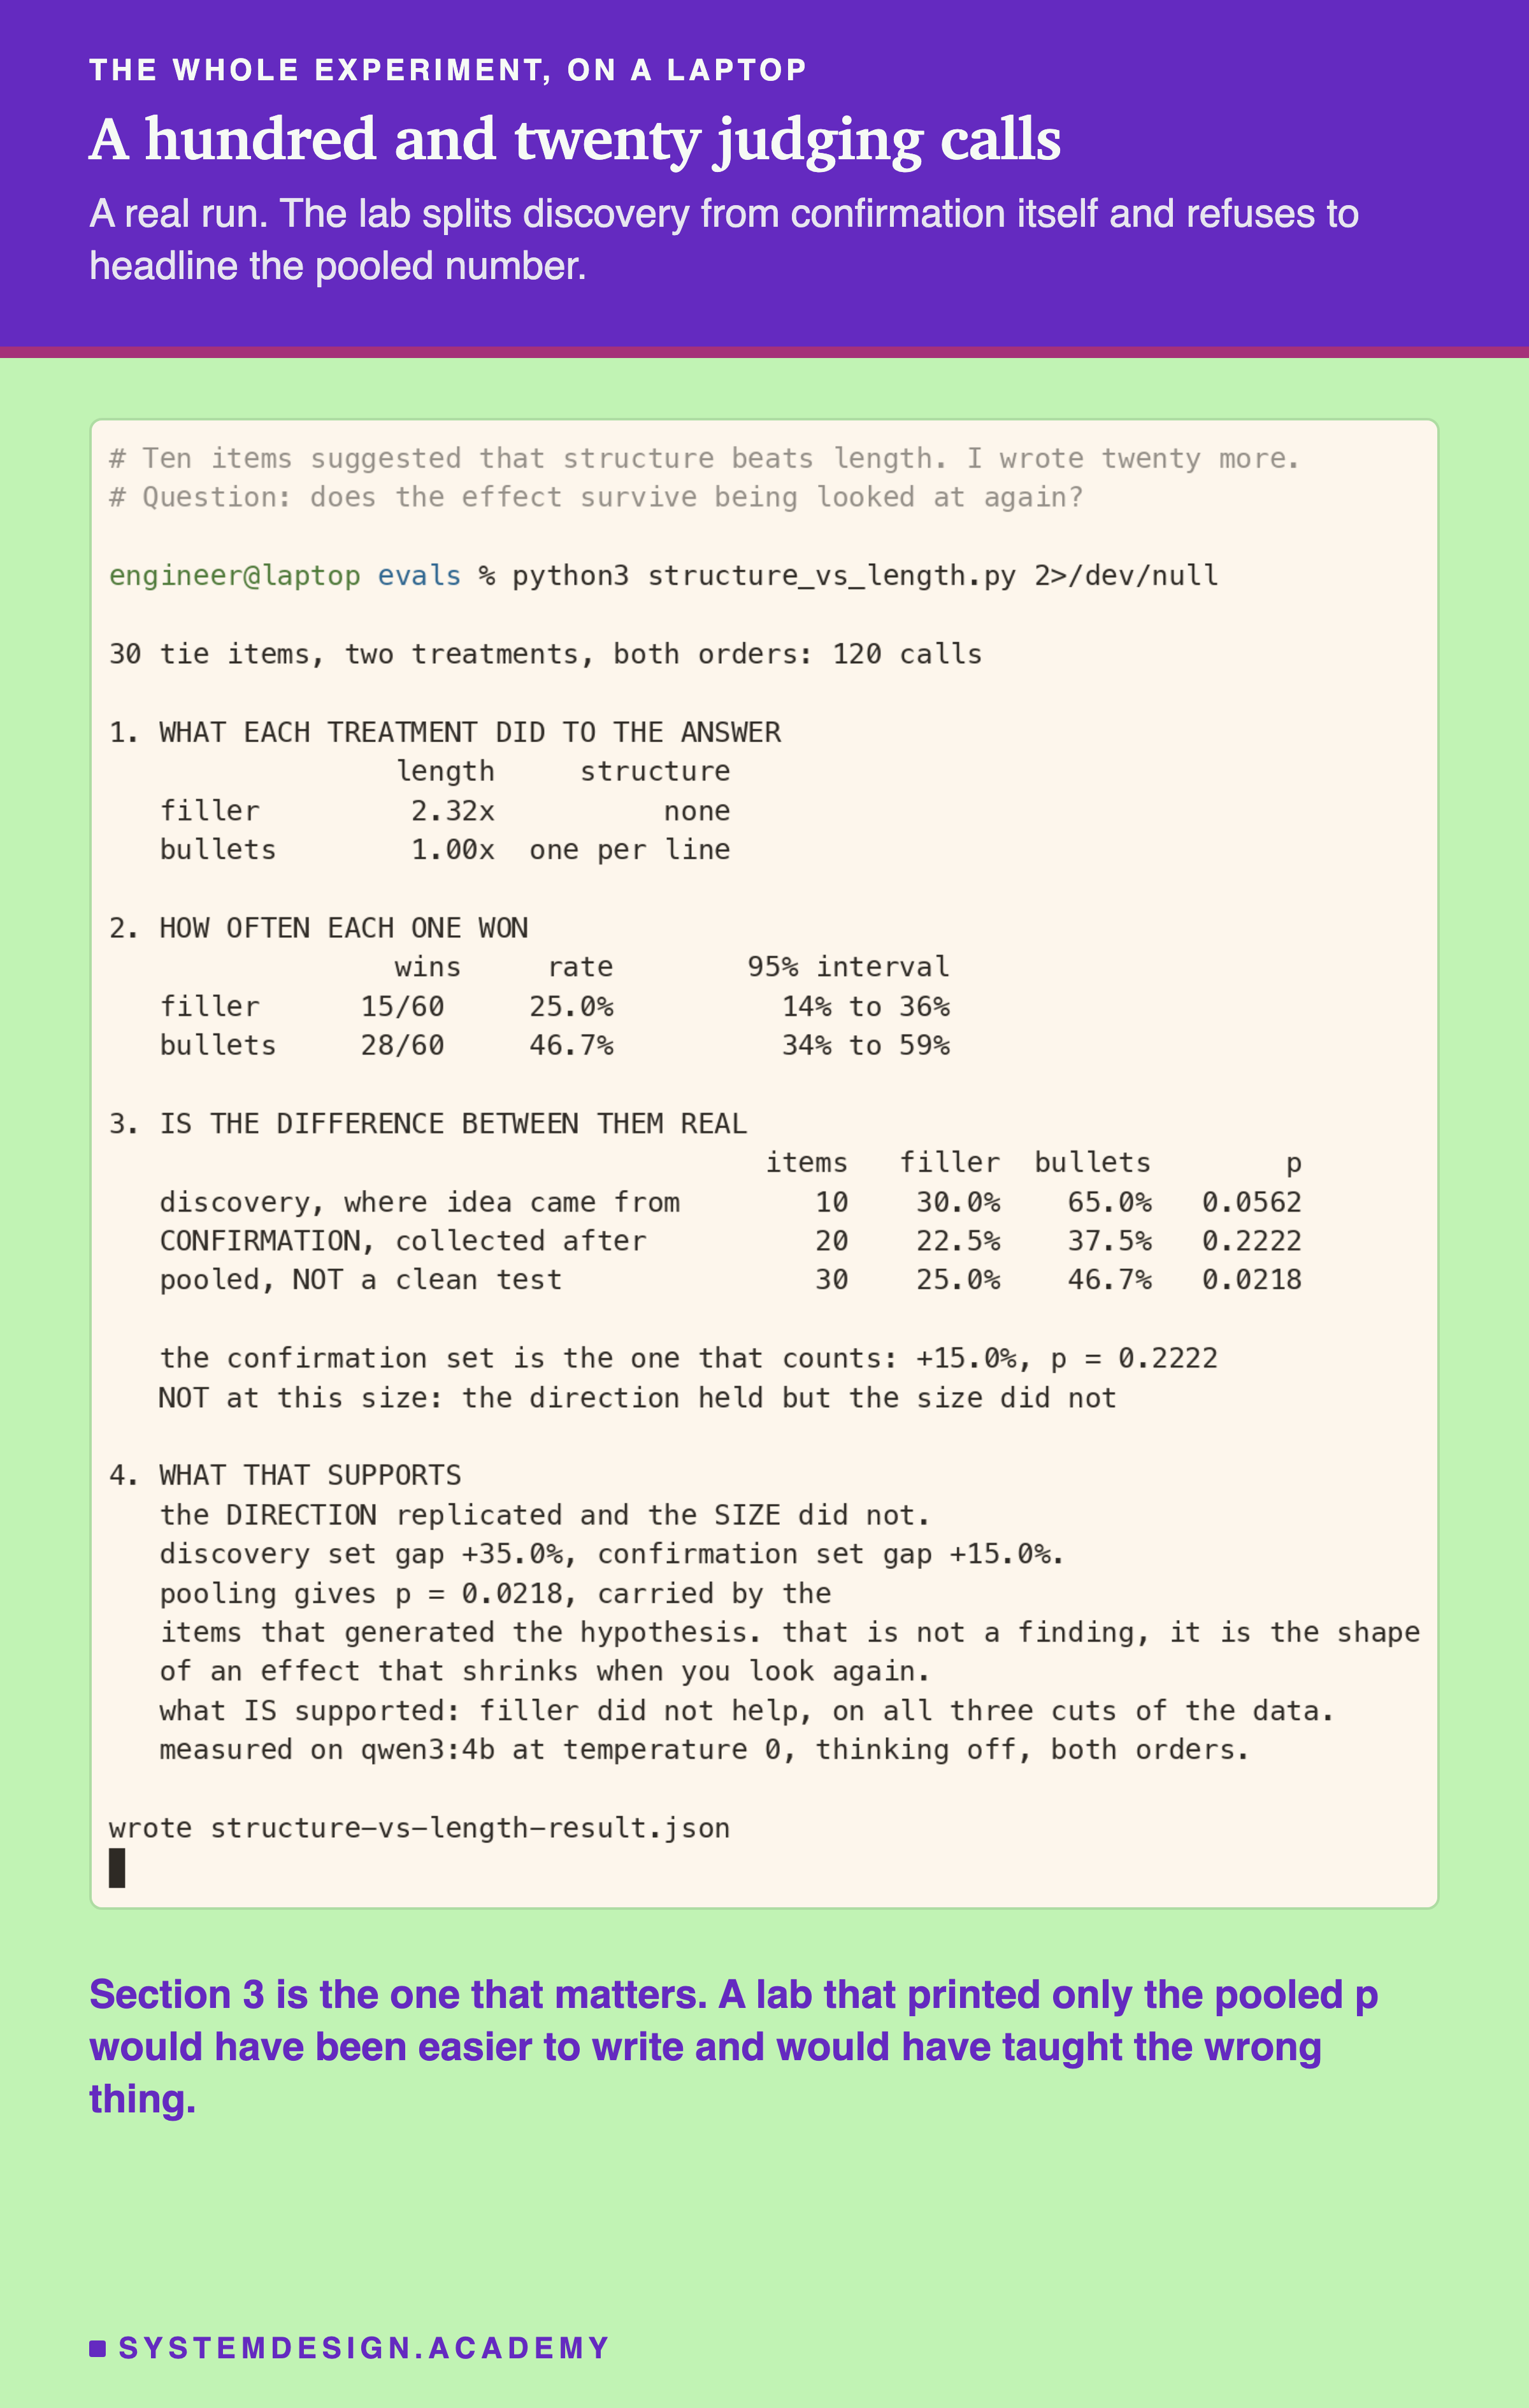
The verdict line at the end of section 3 is computed, not written. If a future run makes the confirmation set significant, the lab says so. The figures that draw this lesson then refuse to render, because every one of them is built around a that did not hold.
That is worth building into any lab whose conclusion is a null. A script that prints a fixed sentence about its own result is not reporting, it is asserting.
How Much Survived
Here are the two gaps with their uncertainty rather than as bare numbers.
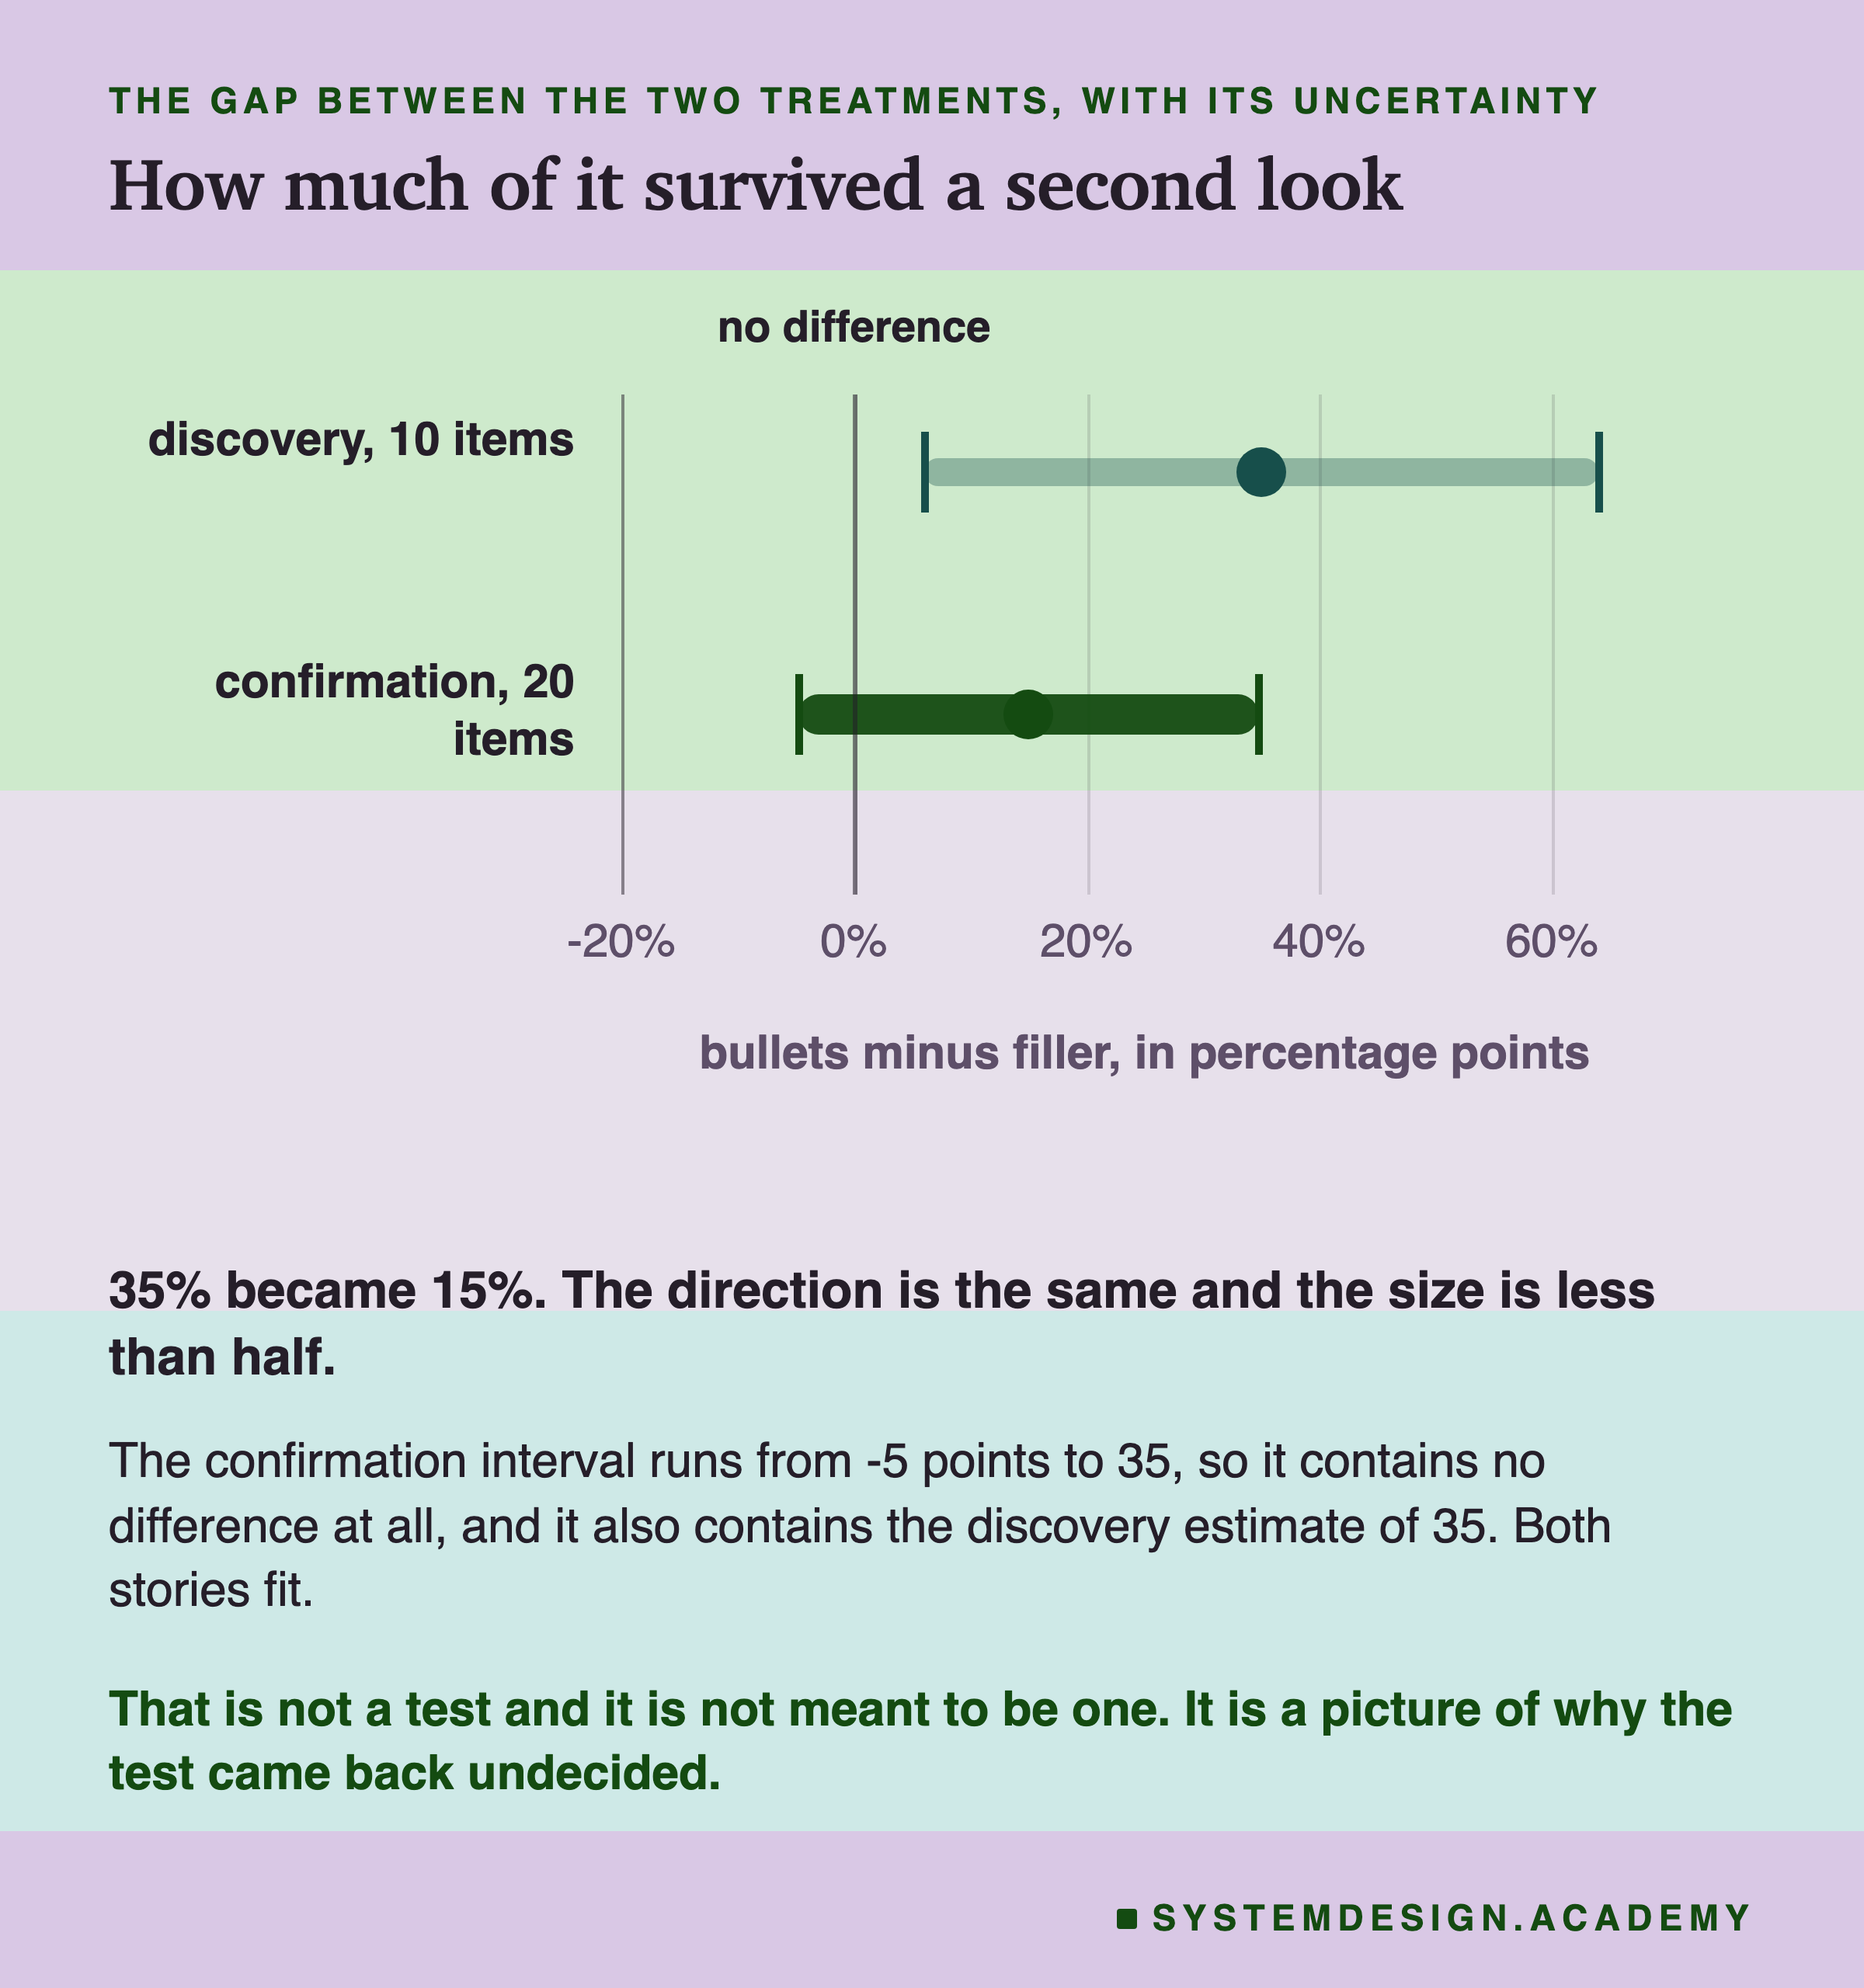
Those intervals are drawn as if the verdicts were independent, and they are not quite: each item is judged in both orders, so its two verdicts are related. That makes the bars narrower than the truth, which means the honest version of this picture is even less decisive than the one drawn.
Do not read the overlap between the two bars as a test. An earlier lesson in this chapter made the same point, and it still holds here. The bars are here to show the shape of the uncertainty, and the test is the p value from the confirmation set alone.
Why The First Number Was Always Going To Be The Biggest
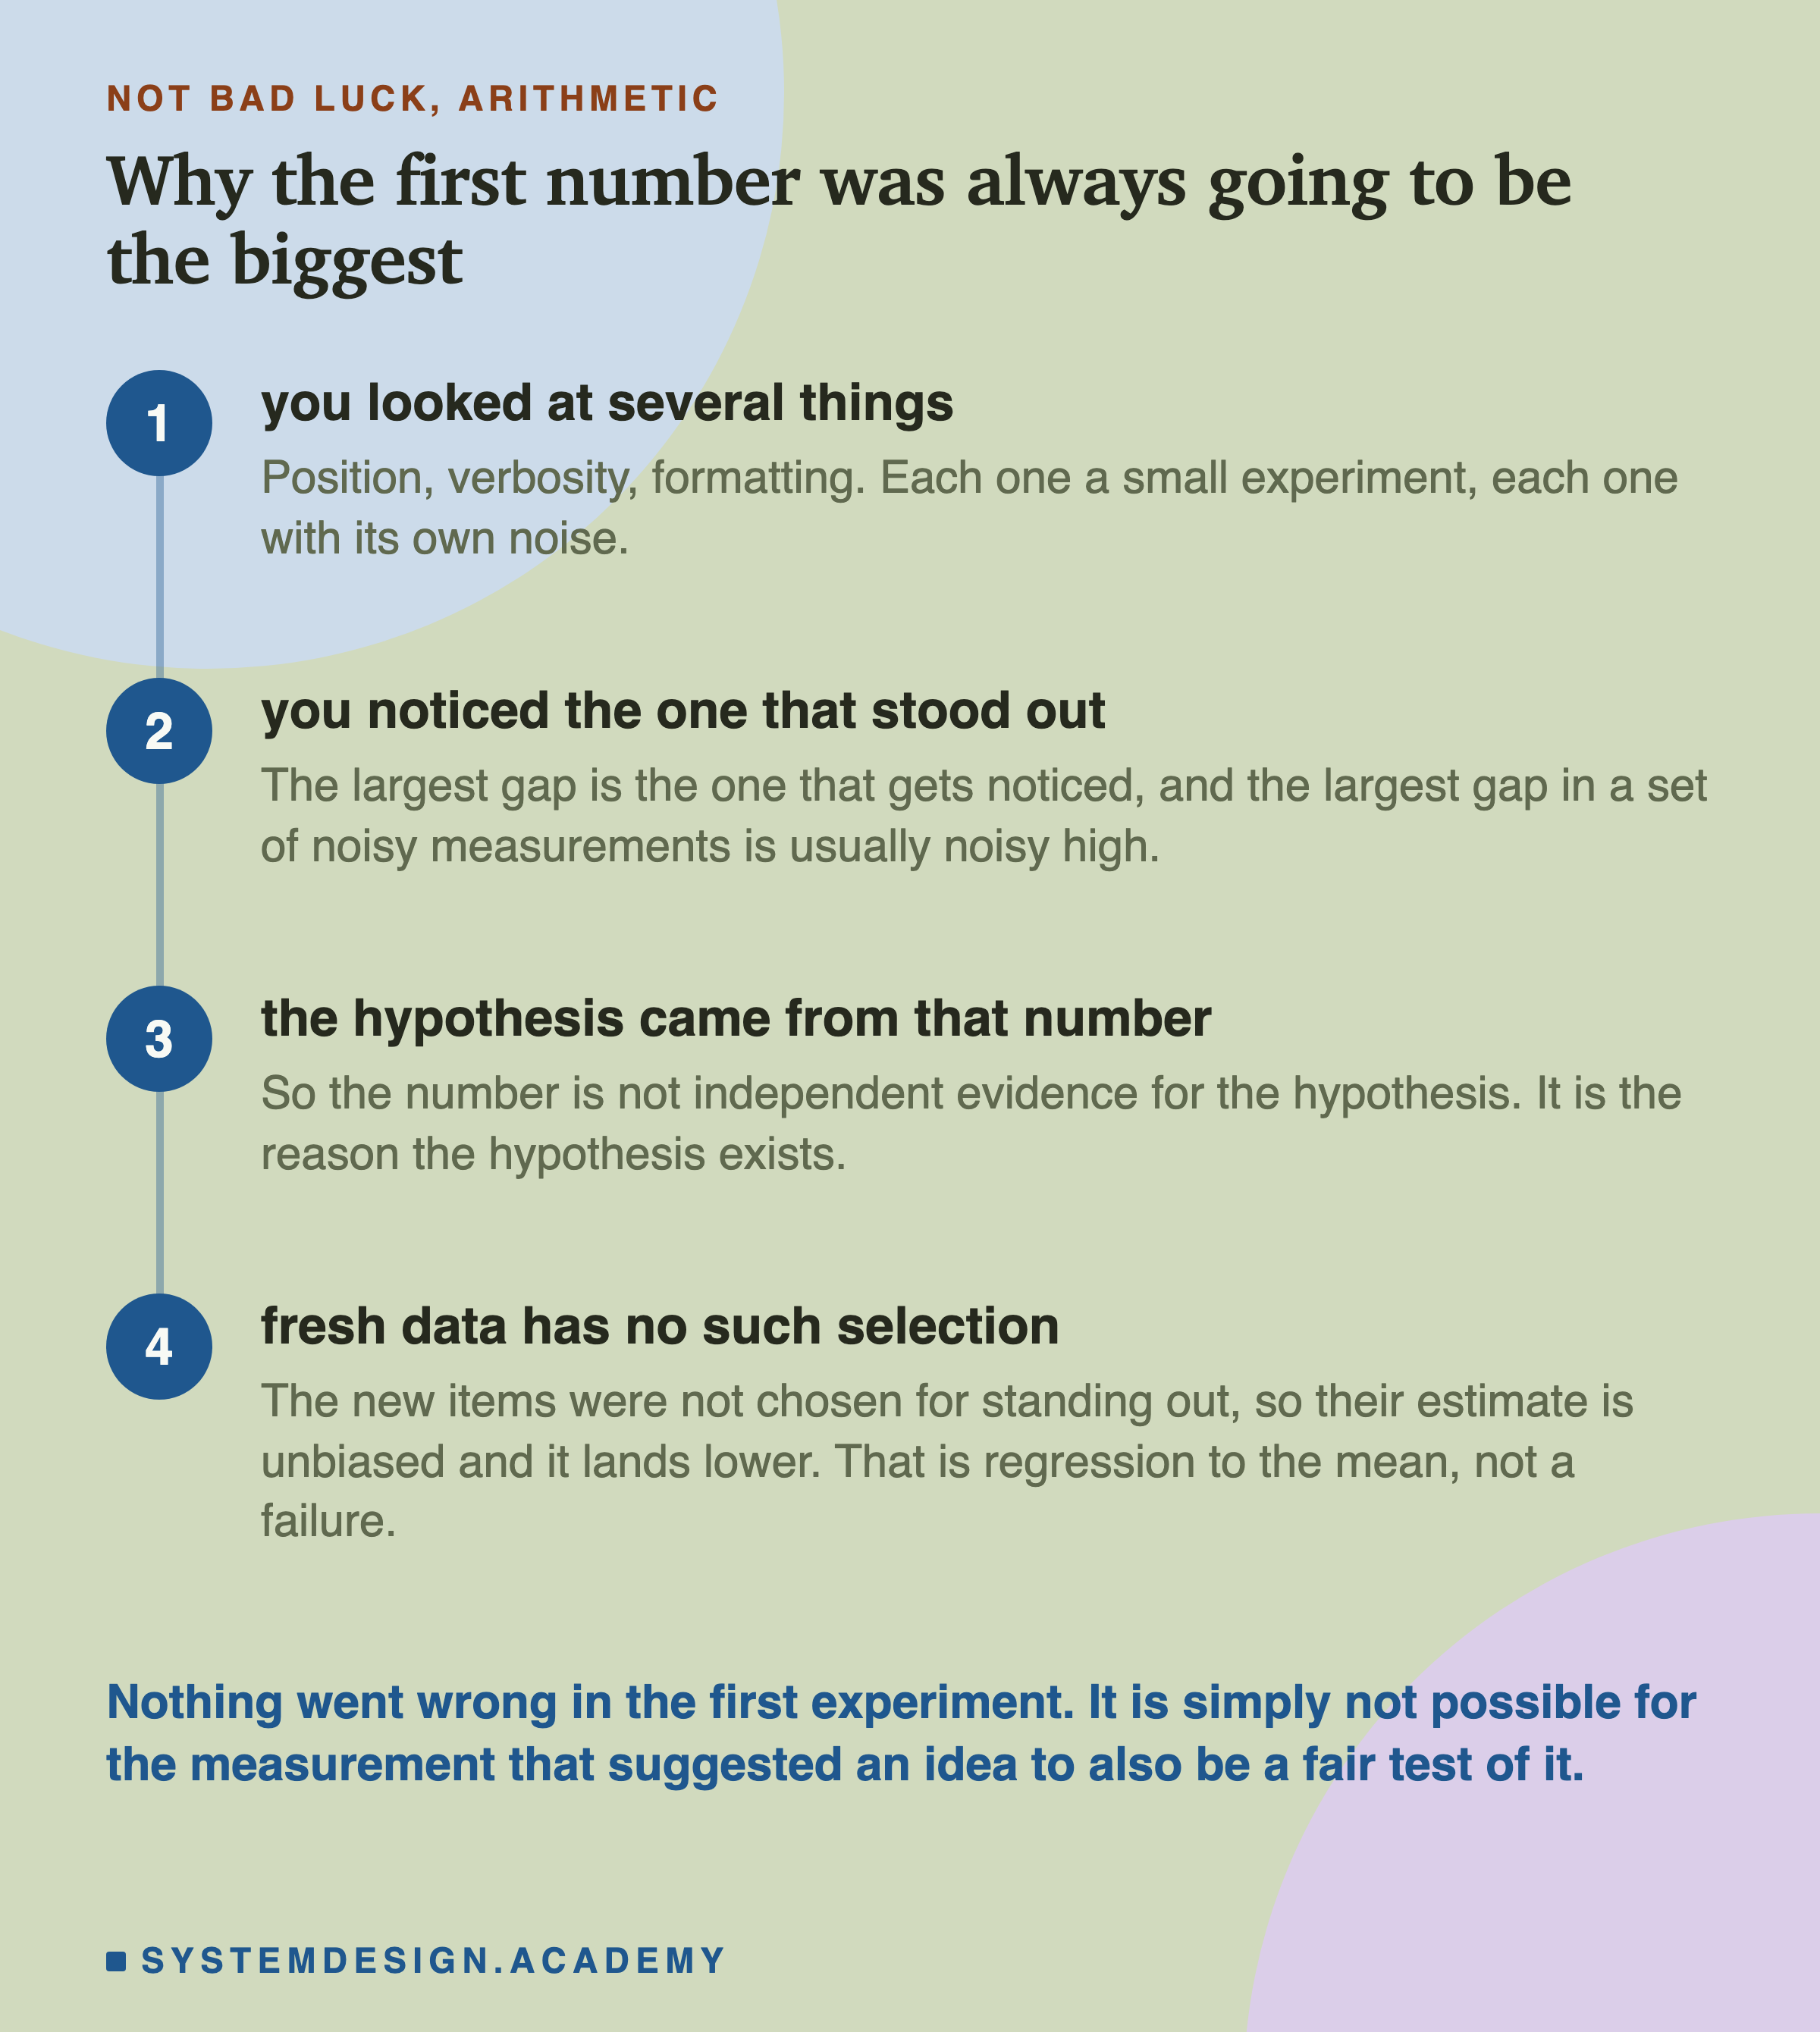
This is not bad luck and it is not a sign that the first run was done badly. It is arithmetic, and it happens to careful people.
The mechanism is easy to see without any of this lesson's data, because it does not need a real effect to produce a fake one. Run this.
The first half draws every comparison from the same fair coin, so the true gap is zero every time. Look at five of them, report the biggest, and the number you report averages 13.0 points. Run that same comparison again on fresh data and it averages 0.3.
Selection alone manufactured 12.7 points out of nothing. No bug, no bad faith, no p-hacking in the sense anyone would recognise. Just picking the one that stood out.
The second half recomputes this lesson's three cuts from the real win counts, so you can check the headline yourself rather than take it from me.
Step two is the one to sit with. If you run five small comparisons and report the biggest, the biggest one is not a random draw from the five. It is the maximum of five draws, and the maximum of a set of noisy numbers sits above the average of what those numbers are measuring.
So the estimate that made you interested is, on average, too big. Fresh data has no such selection in it and comes back lower. That is what happened here.
Pool It And Stop
The move that would have made this a much better story takes one line of code and no dishonesty at all.
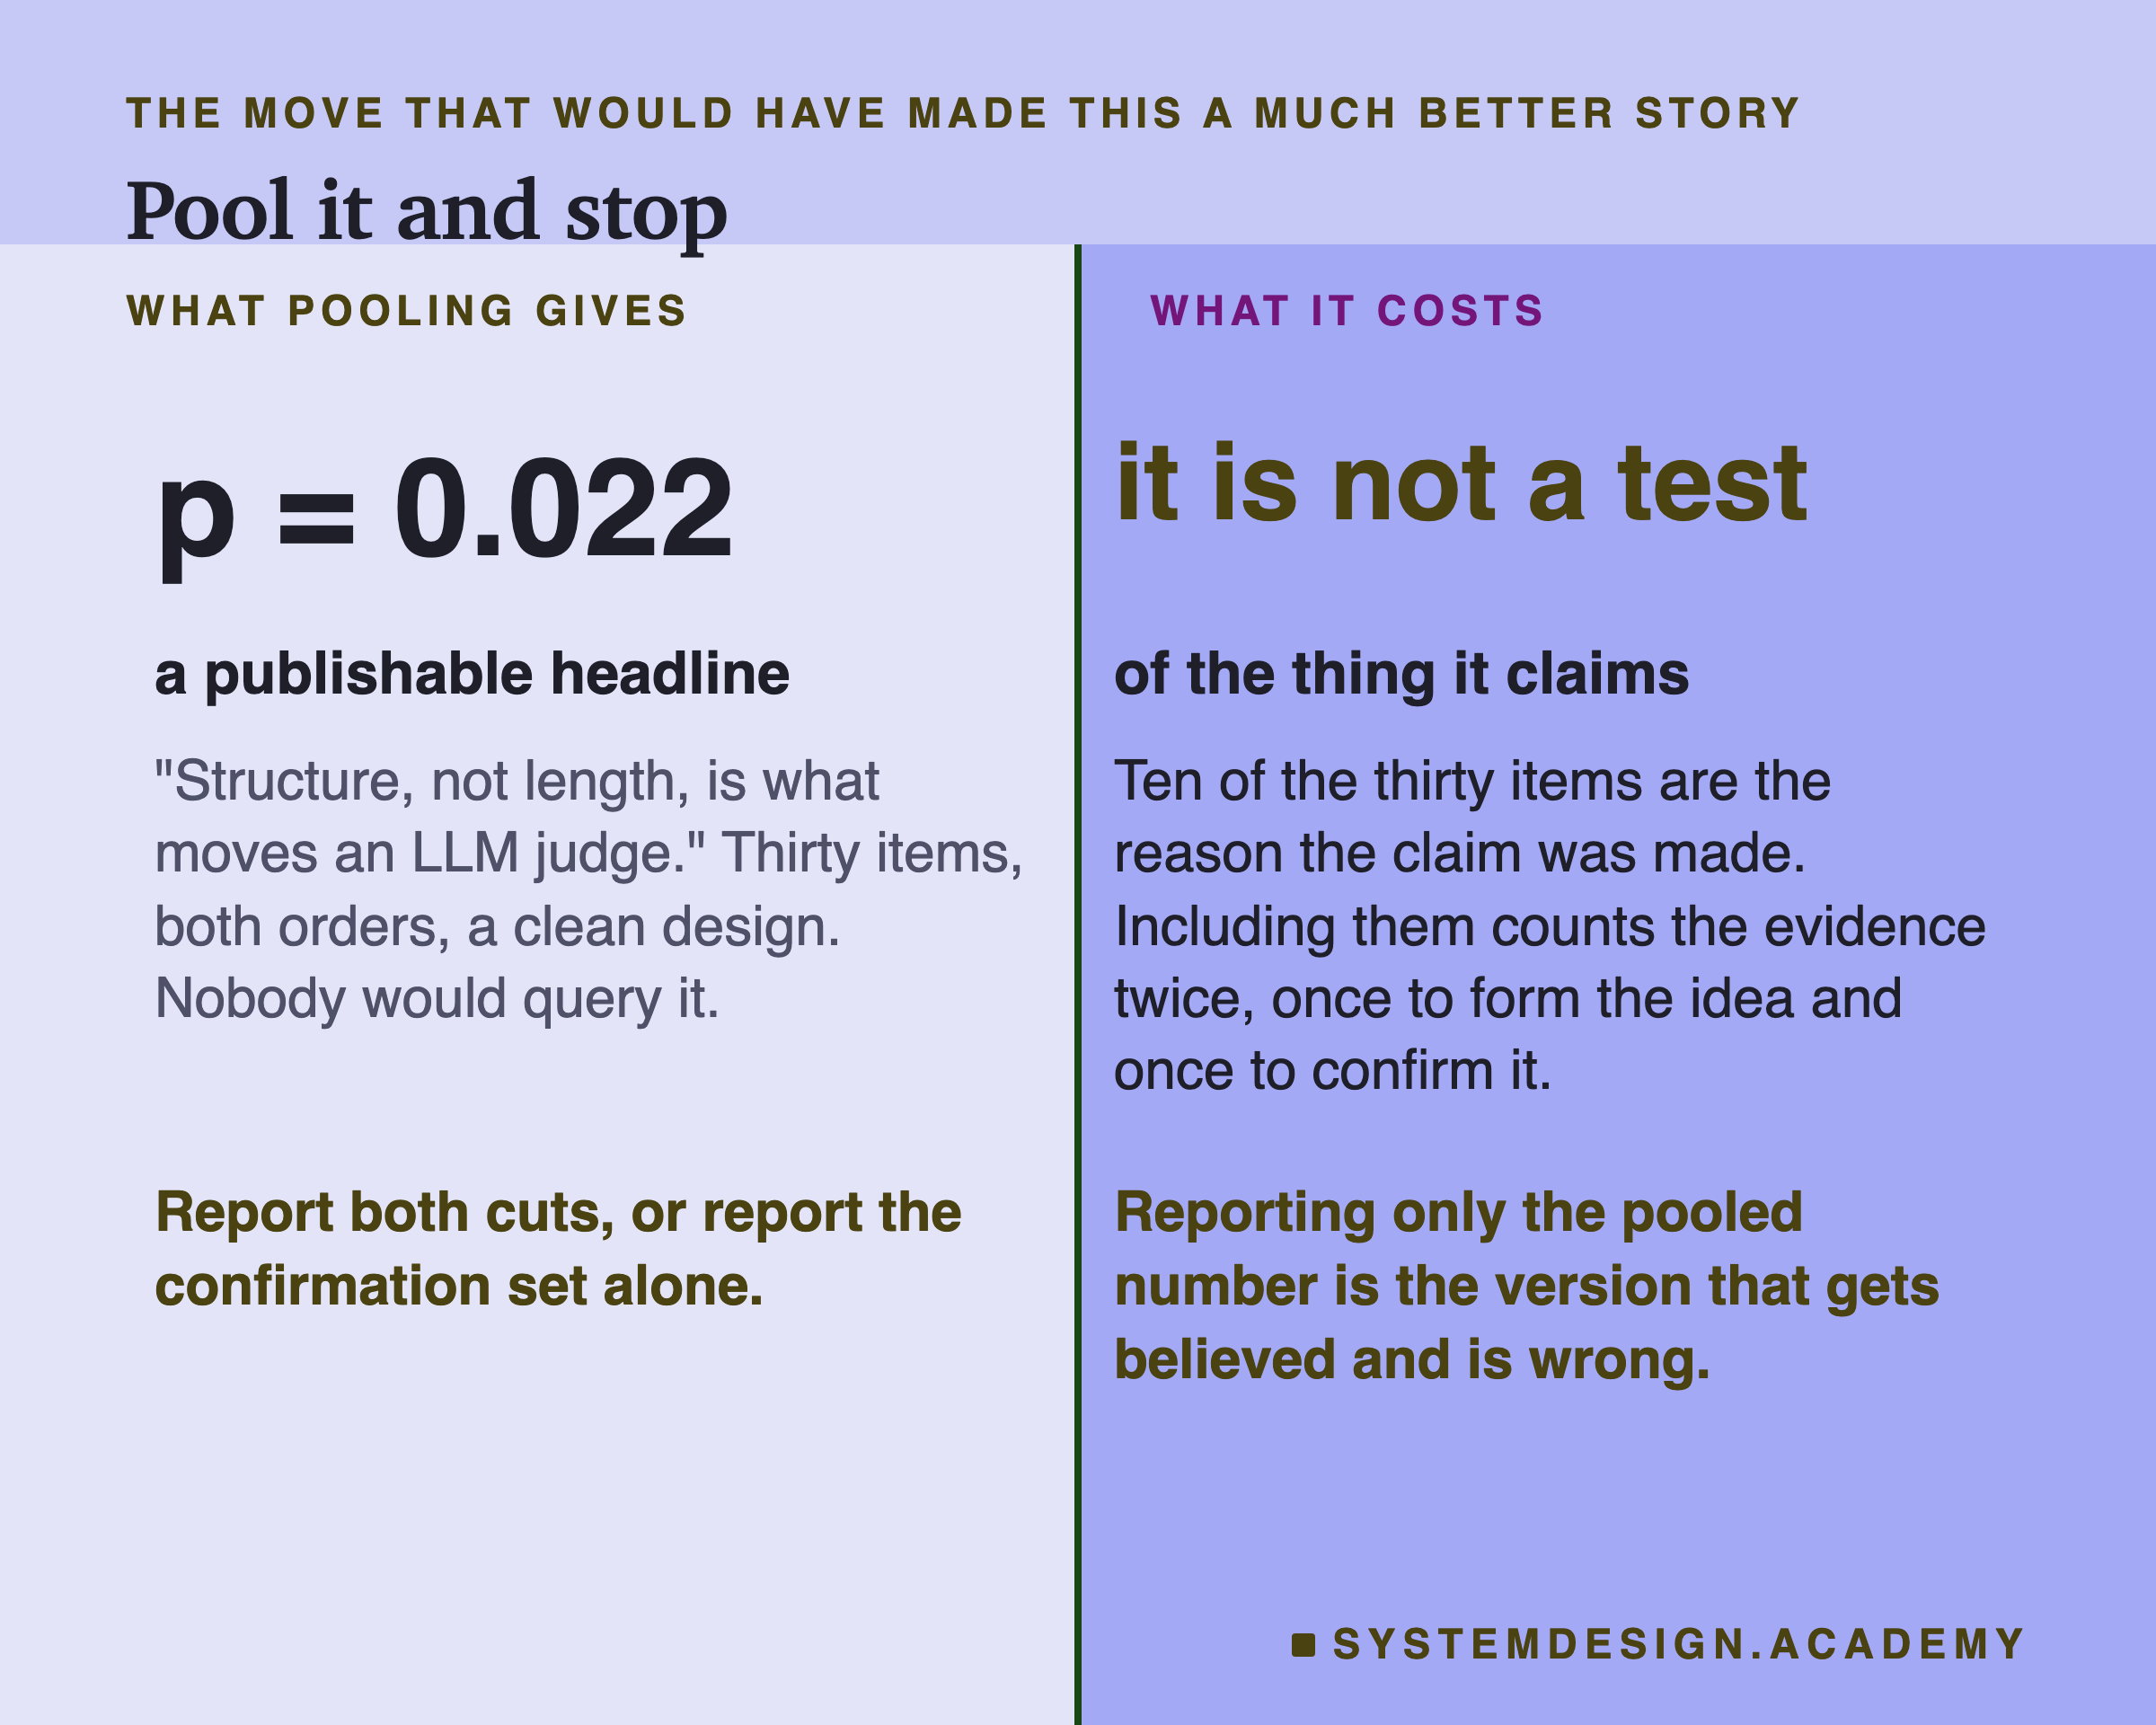
Nobody reading a write-up that quoted p = 0.022 would object. The design is clean, the sample is bigger than most published judge experiments, and the number is arithmetically correct.
It just does not answer the question it appears to answer.
What Does Survive
A lesson that reports a shrinking effect owes you the part that did not shrink.
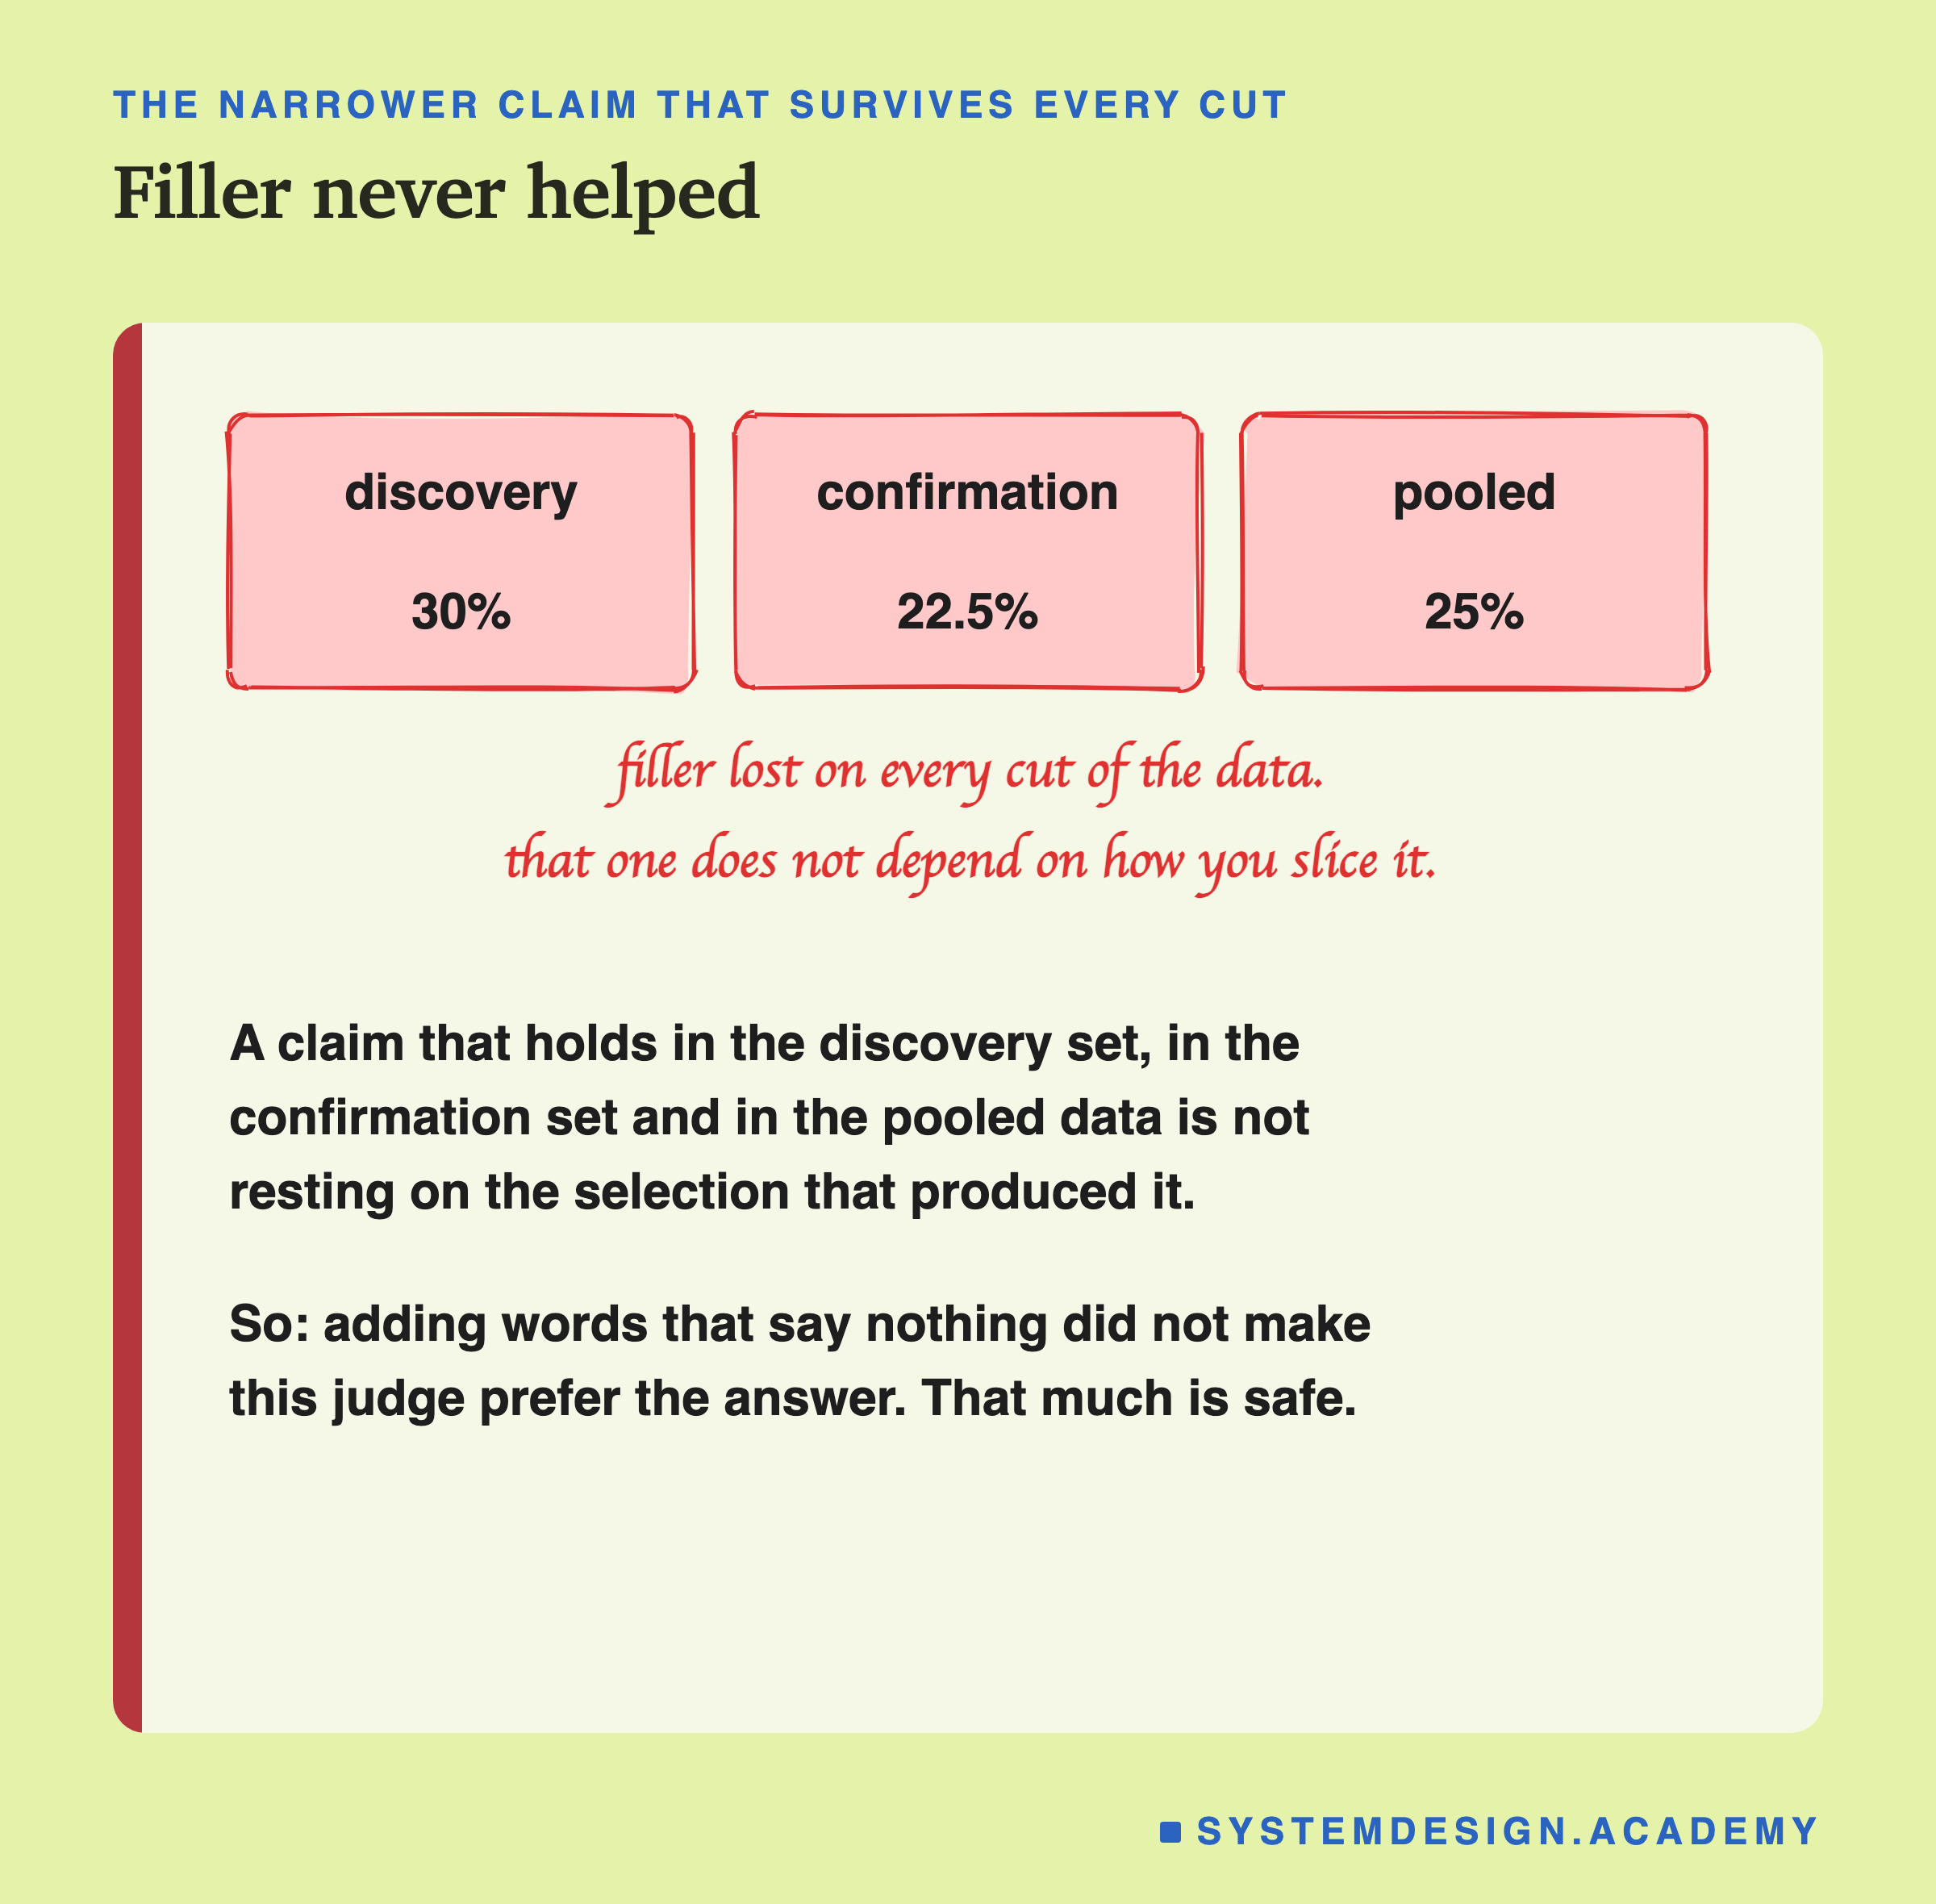
Filler lost everywhere. Every cut of the data, discovery and confirmation and pooled, has the padded answer below half. That claim does not depend on which items you include, so the selection problem does not touch it.
The direction of the structure effect also held: bullets beat filler on both cuts. That is a real thing to say, and it is a smaller claim than the one the pooled p value invites.
How This Becomes A Shipped Claim
Nobody has to behave badly for a pooled number to end up in a slide. Here is the sequence, and every step in it is something a careful person does.
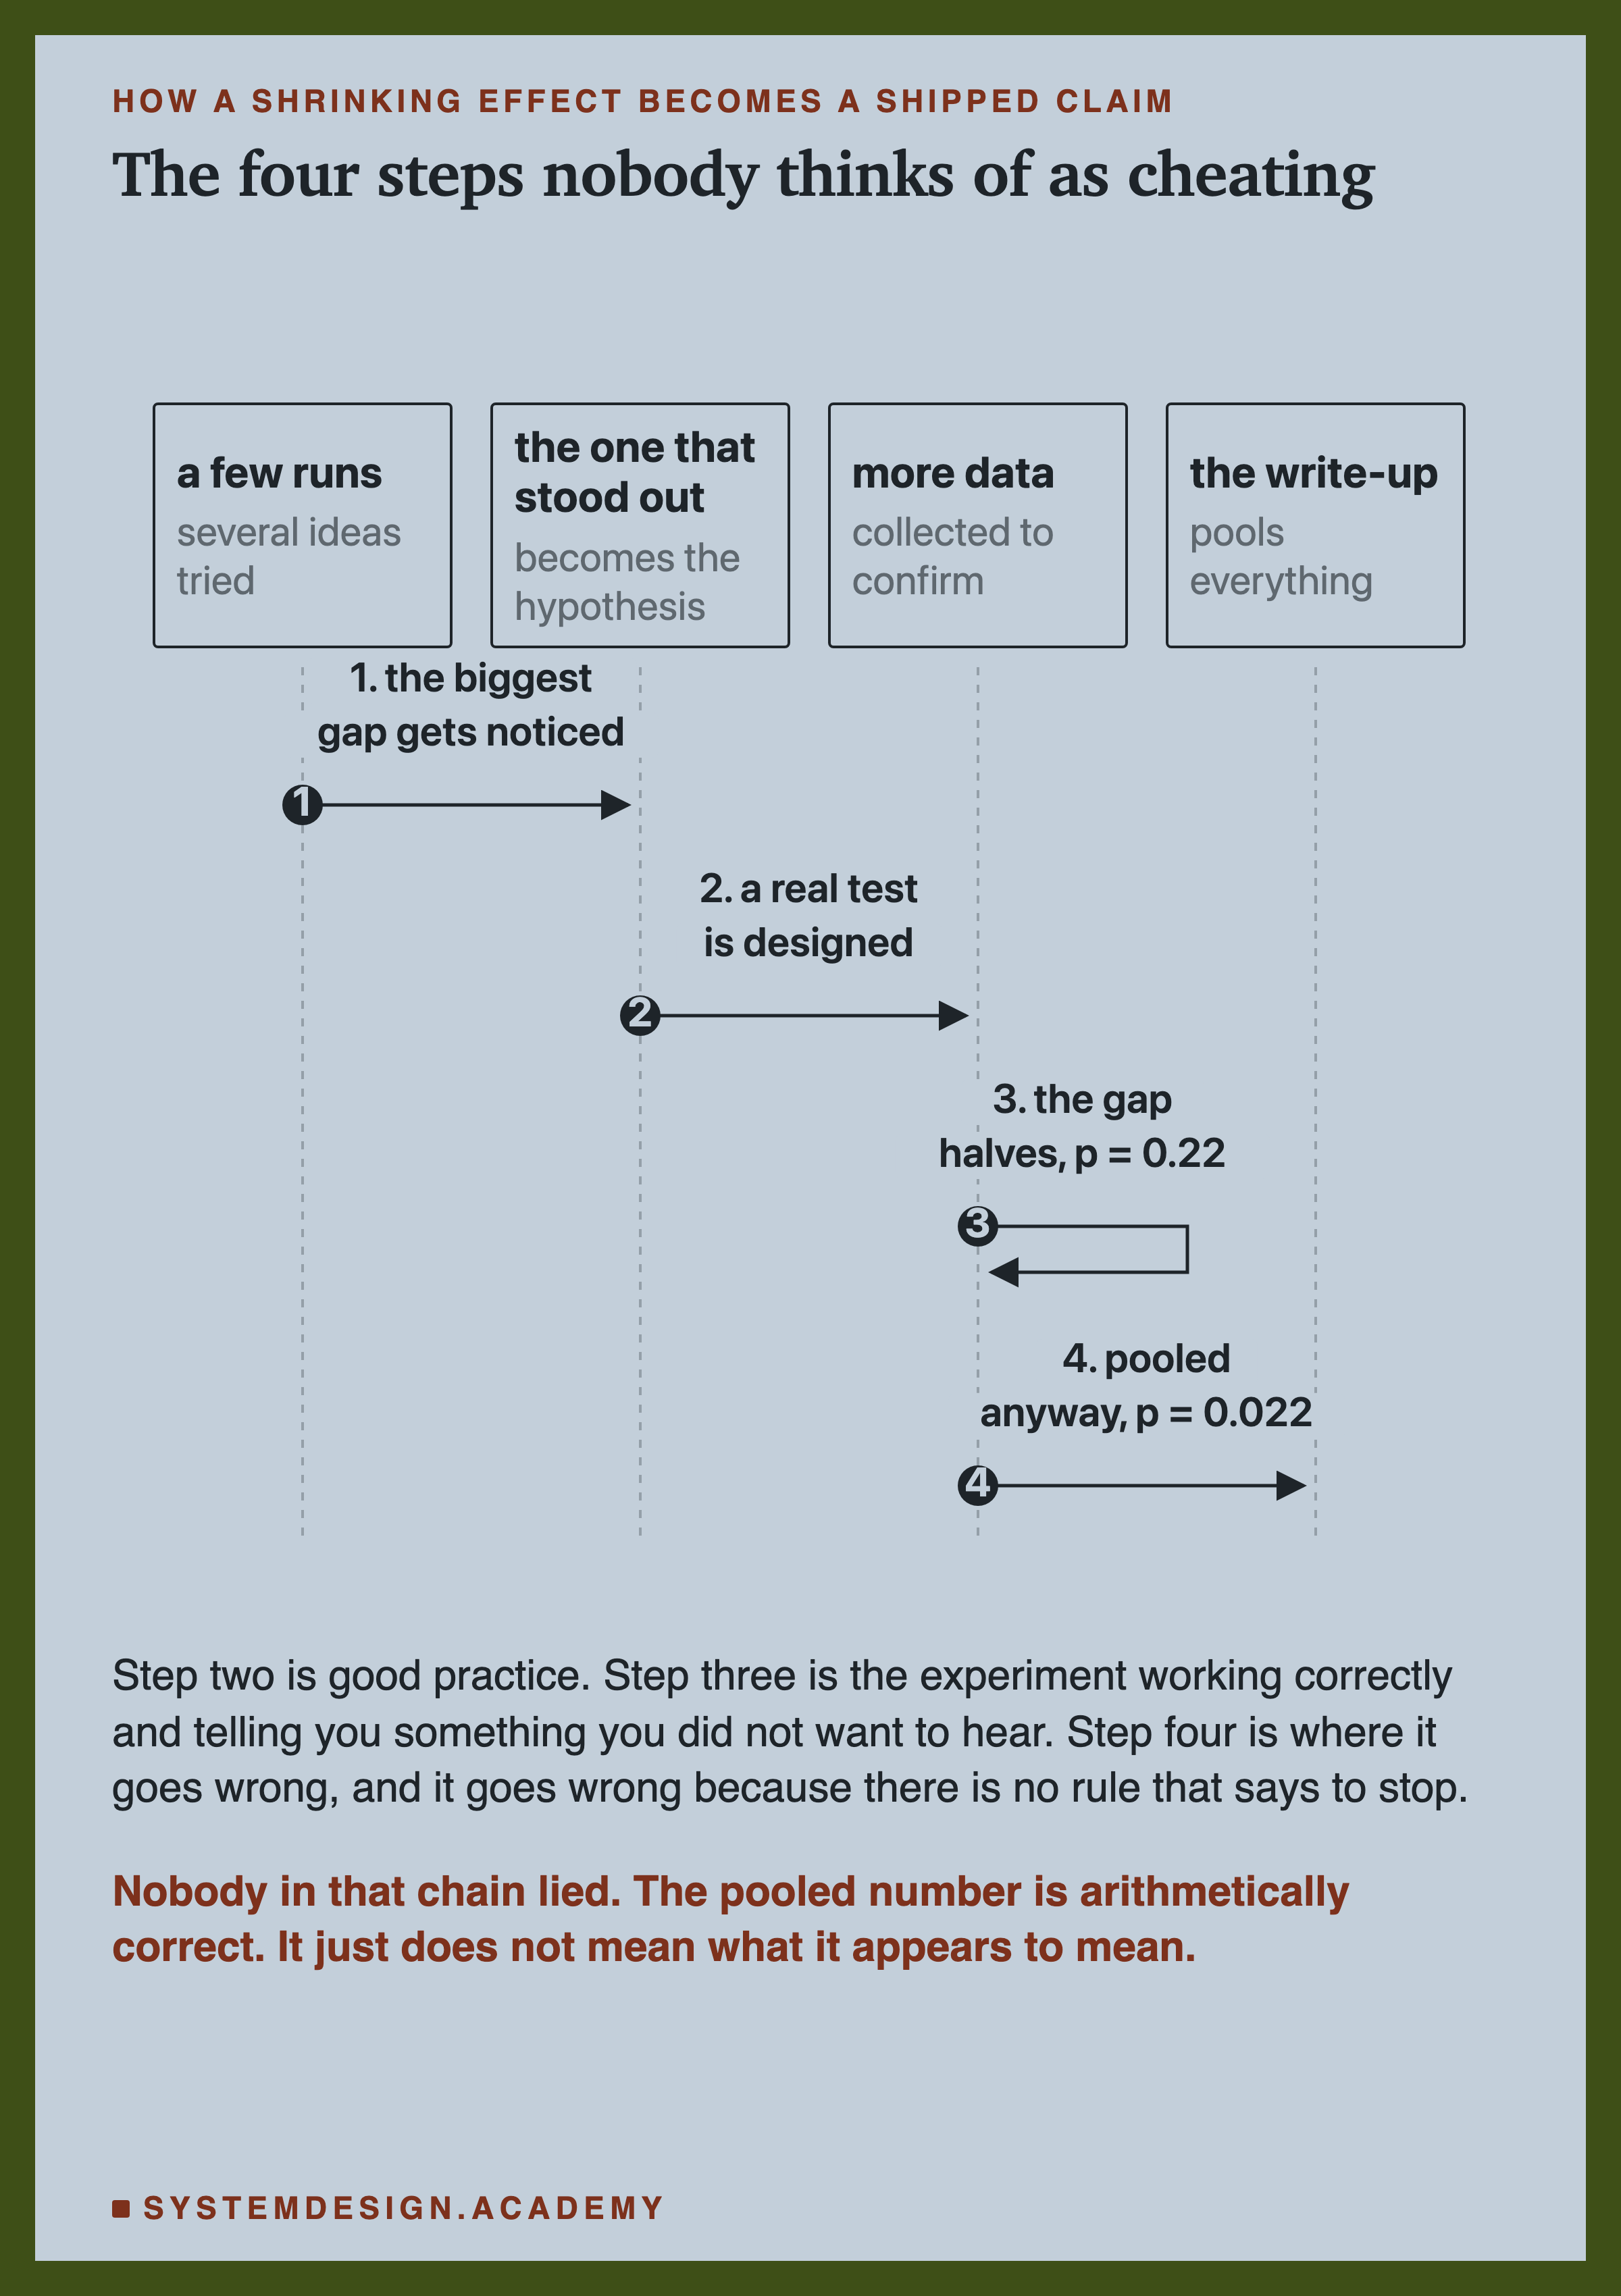
Step three is the honest part and it is also the discouraging part. You did the right thing, collected fresh data, and the answer came back weaker. At that moment the pooled number is sitting right there, it is correct, and nothing in your tooling objects.
Write It Down First
The fix is not statistical. It is a comment written before the run.
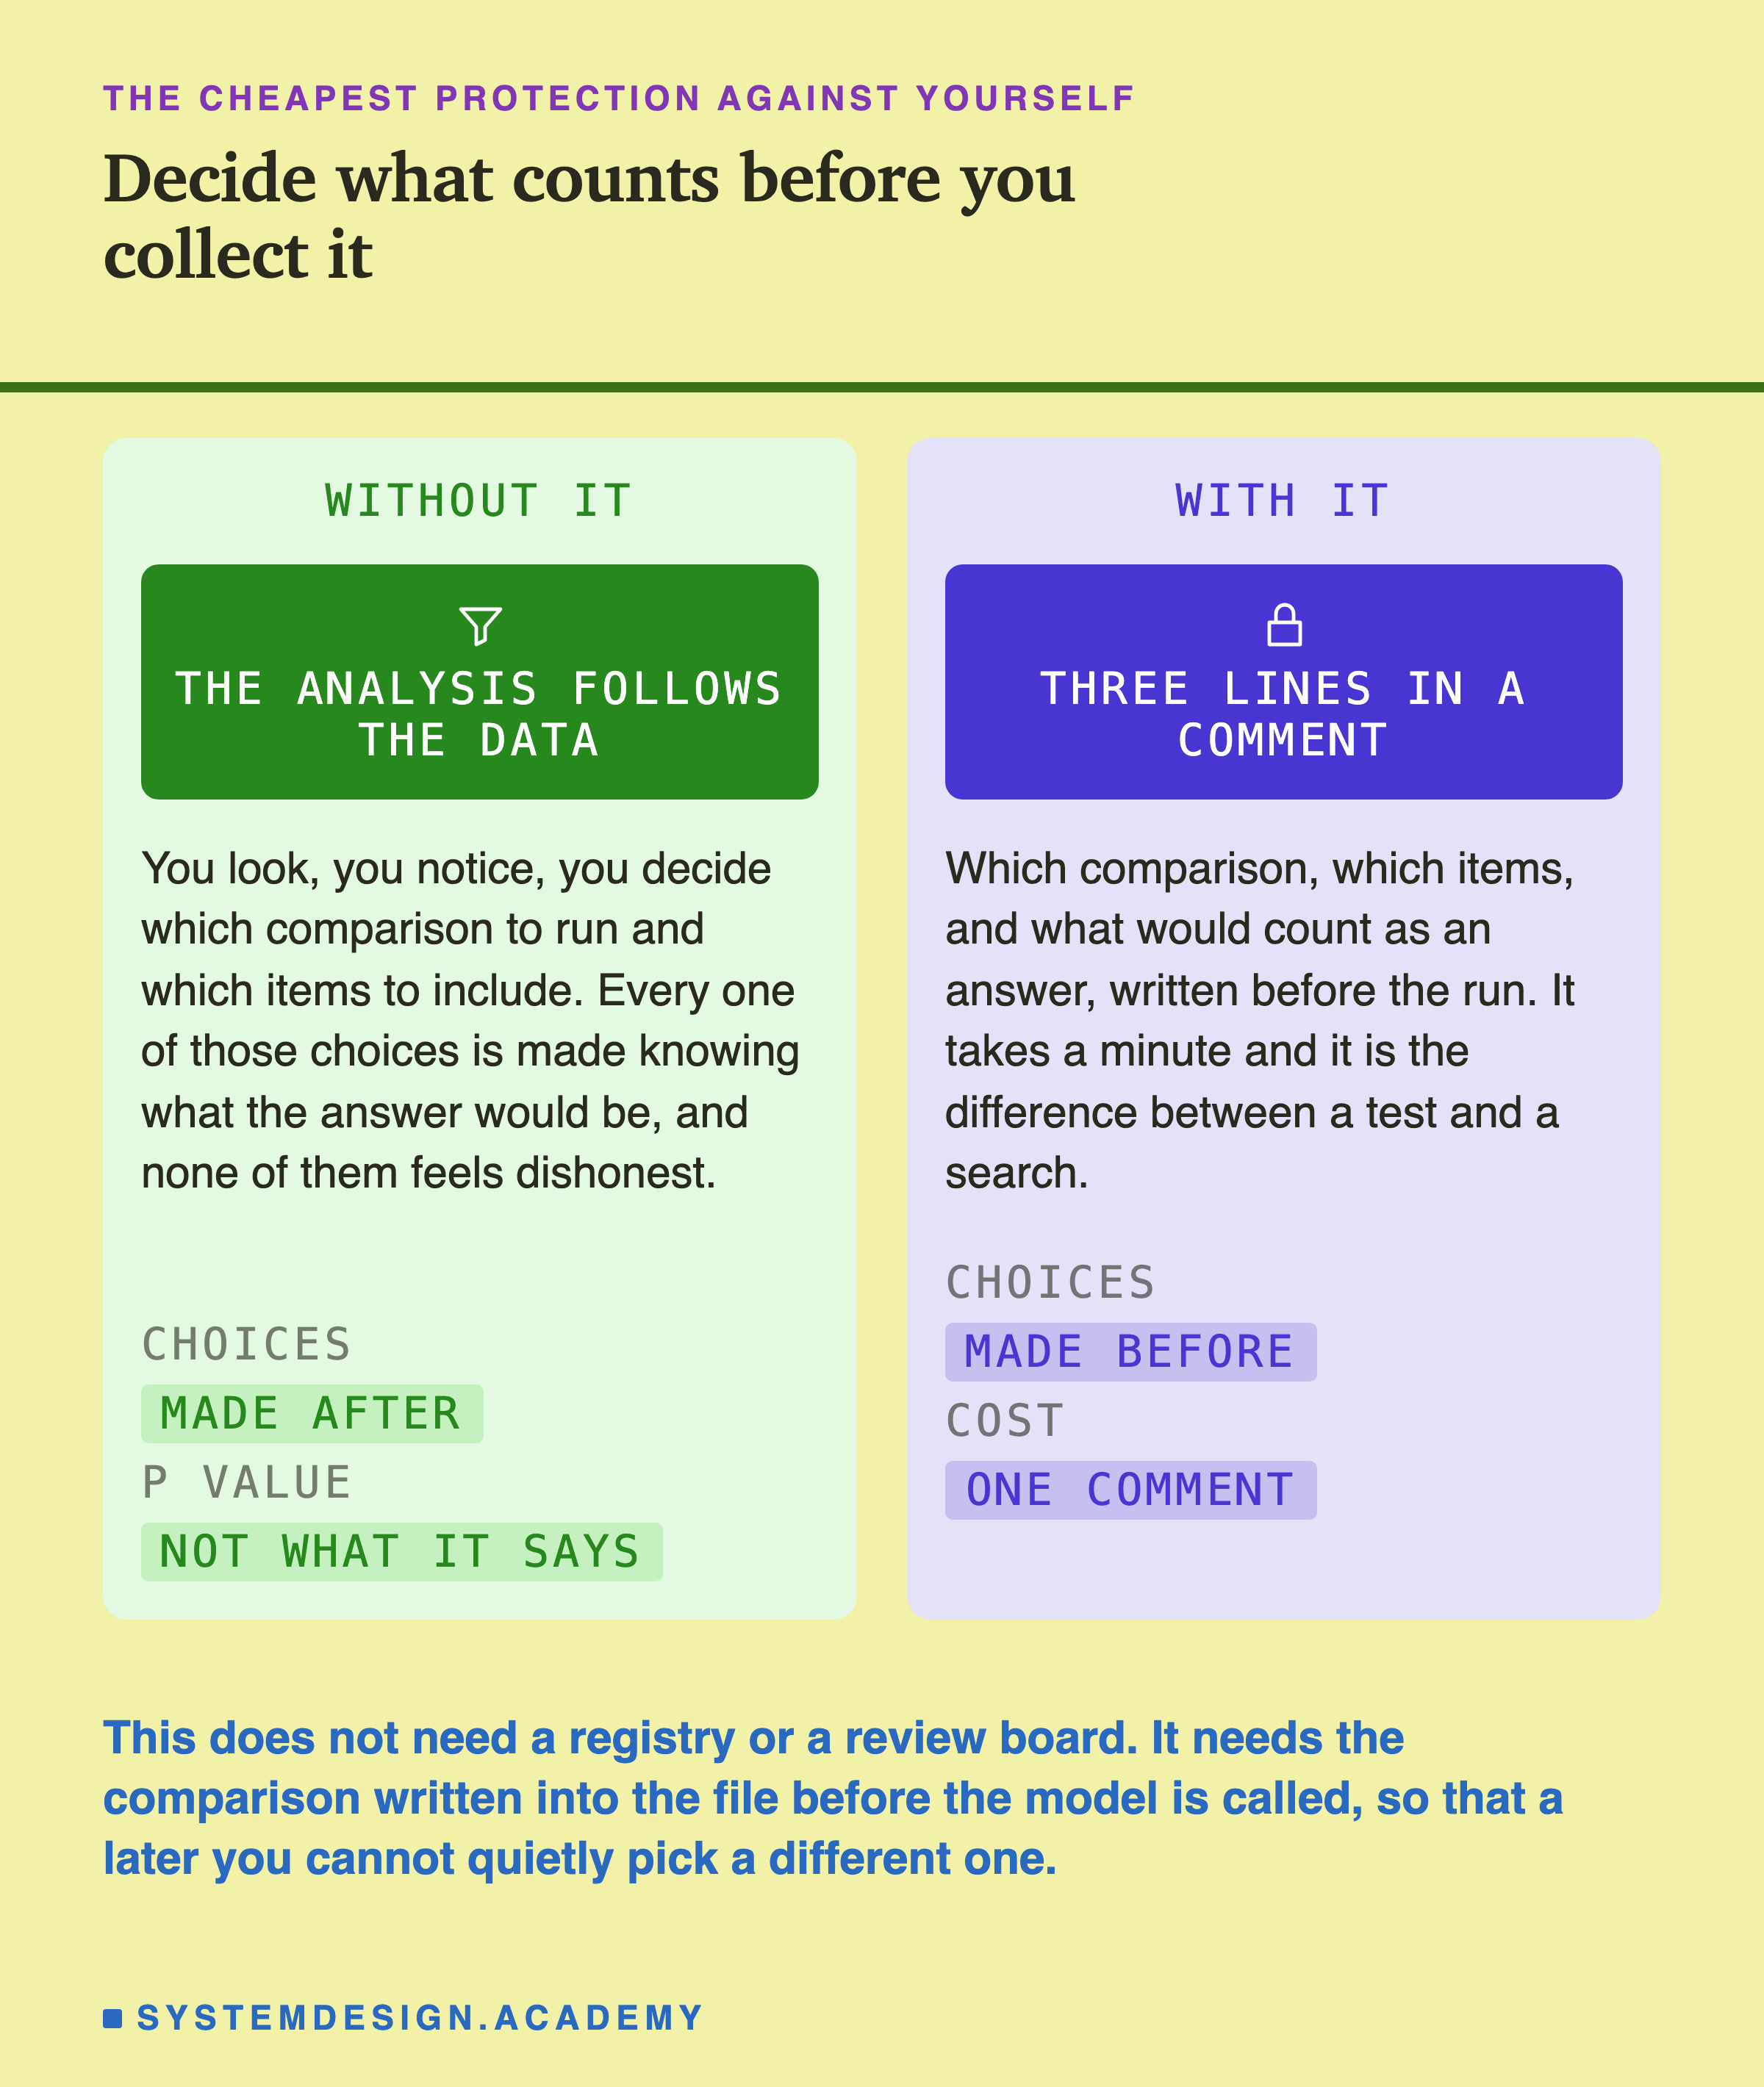
In a research setting this is called preregistration and it involves a registry. In your repo it is three lines above the loop:
# PRE-REGISTERED, before any of the x-items were judged:
#   comparison : filler win rate vs bullet win rate
#   items      : the 20 x-items only, which no analysis has seen
#   answer     : Fisher exact on the 2x2, alpha 0.05, two sided
That comment is in the lab in this lesson, and it is the only reason the confirmation set could be a test rather than another look. It costs a minute and it removes every degree of freedom you would otherwise spend after seeing the data.
How Many Would Be Enough
"We cannot tell" is a weak place to stop. The stronger version of the same finding is a number.
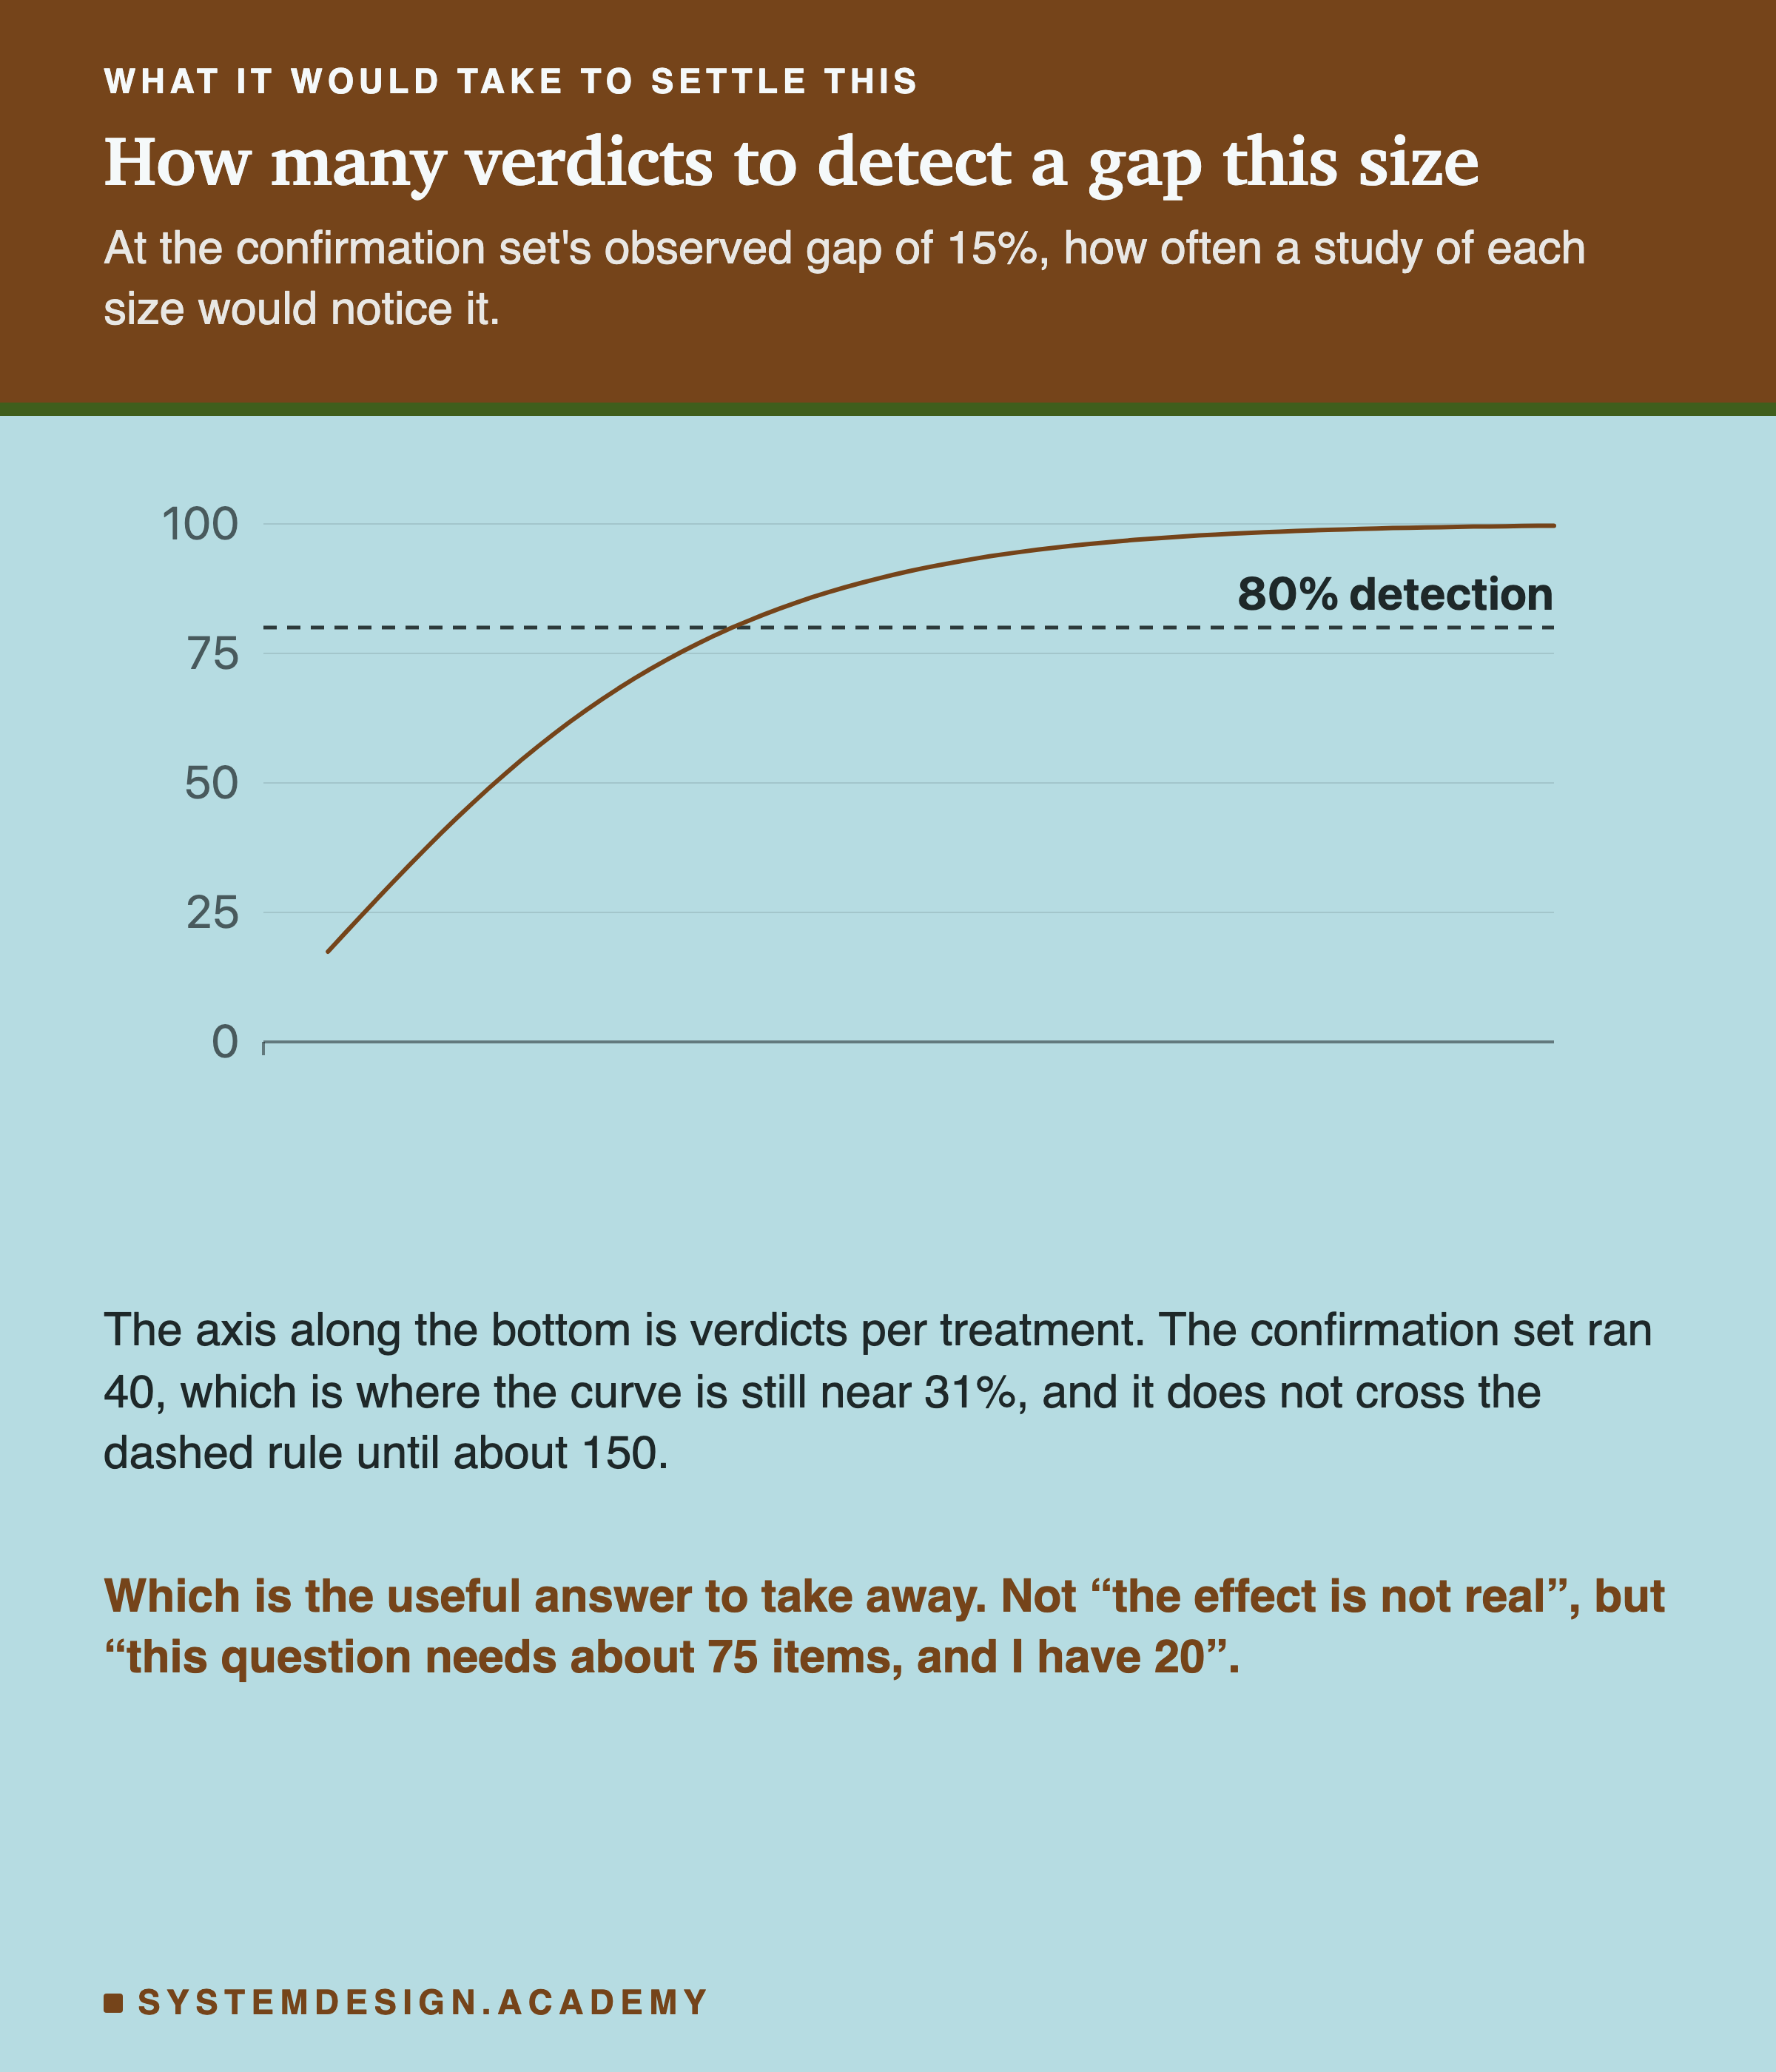
At 40 verdicts per treatment, a gap of 15 points is called significant less than a third of the time even when it is completely real. That is the reason the confirmation set came back undecided, and it was knowable before the run rather than after.
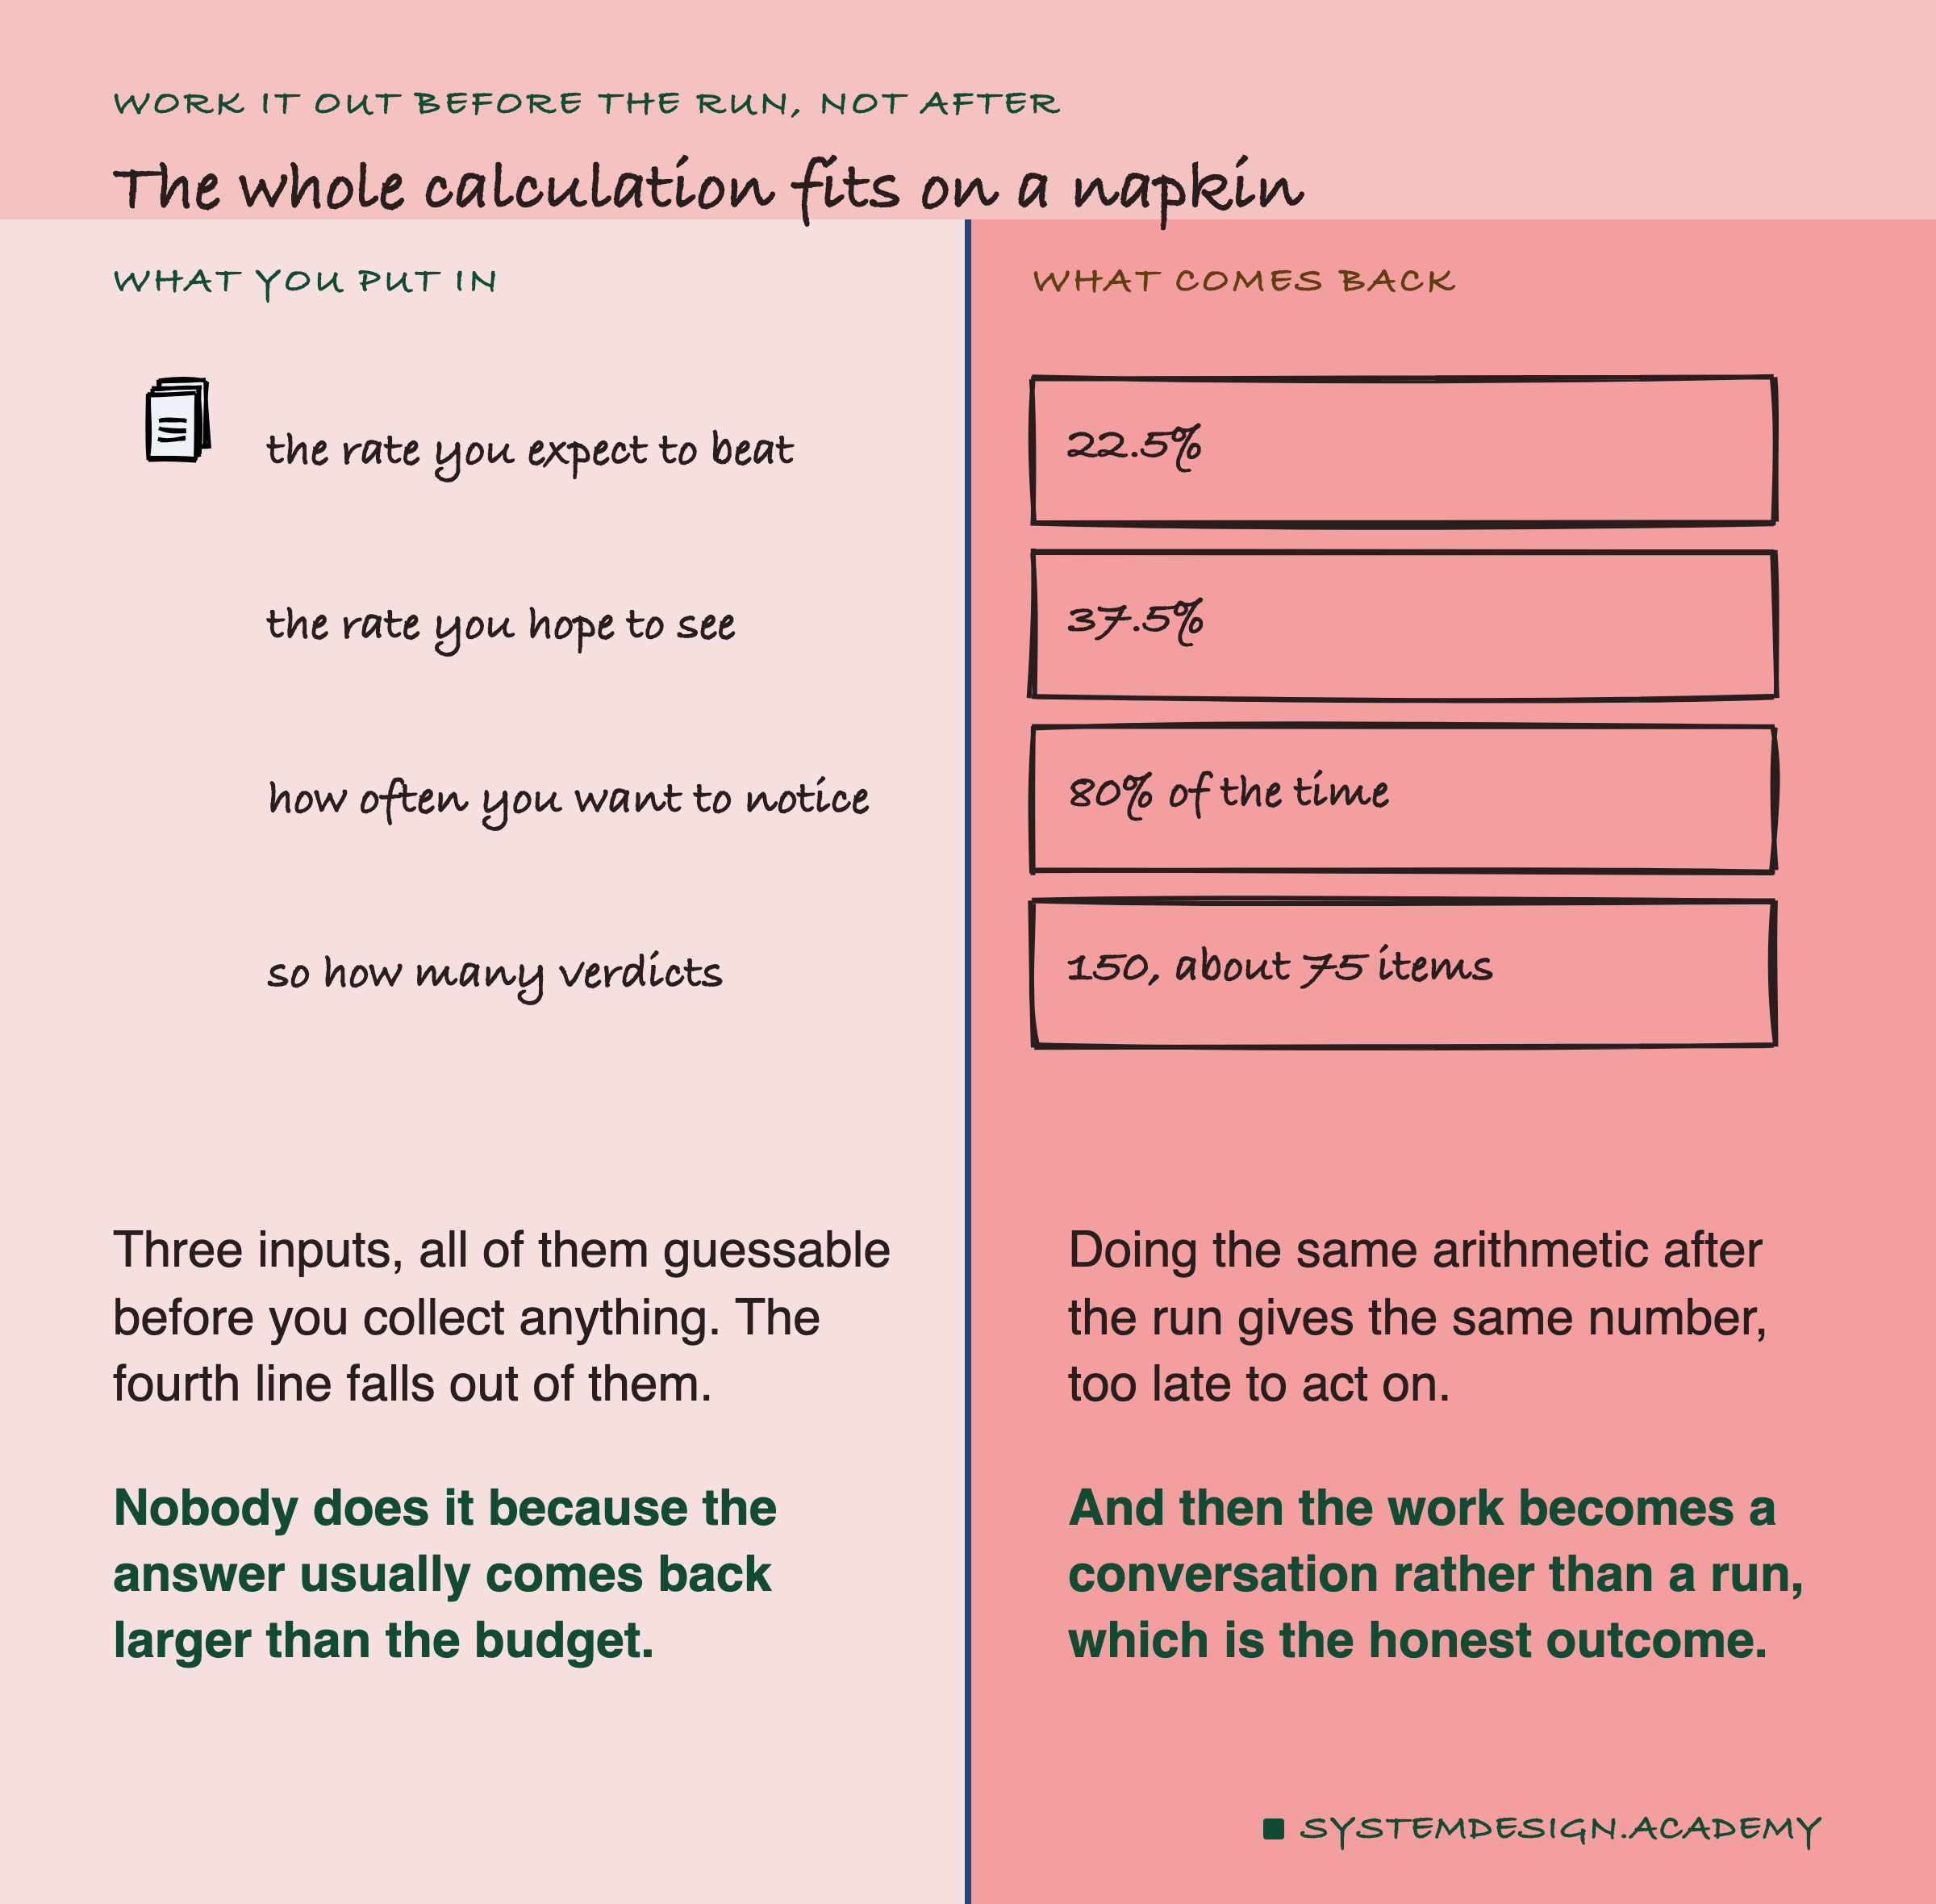
Three inputs and one output. You can guess all three before collecting anything. So you can know that a 20-item study will not settle this, before you spend the afternoon writing the items.
The reason this calculation is unpopular is that it usually returns a number bigger than the budget. That is not a reason to skip it. It is the information.
This Has A Name
What happened here is documented, it has a name, and the name is carefully chosen to not accuse anyone.
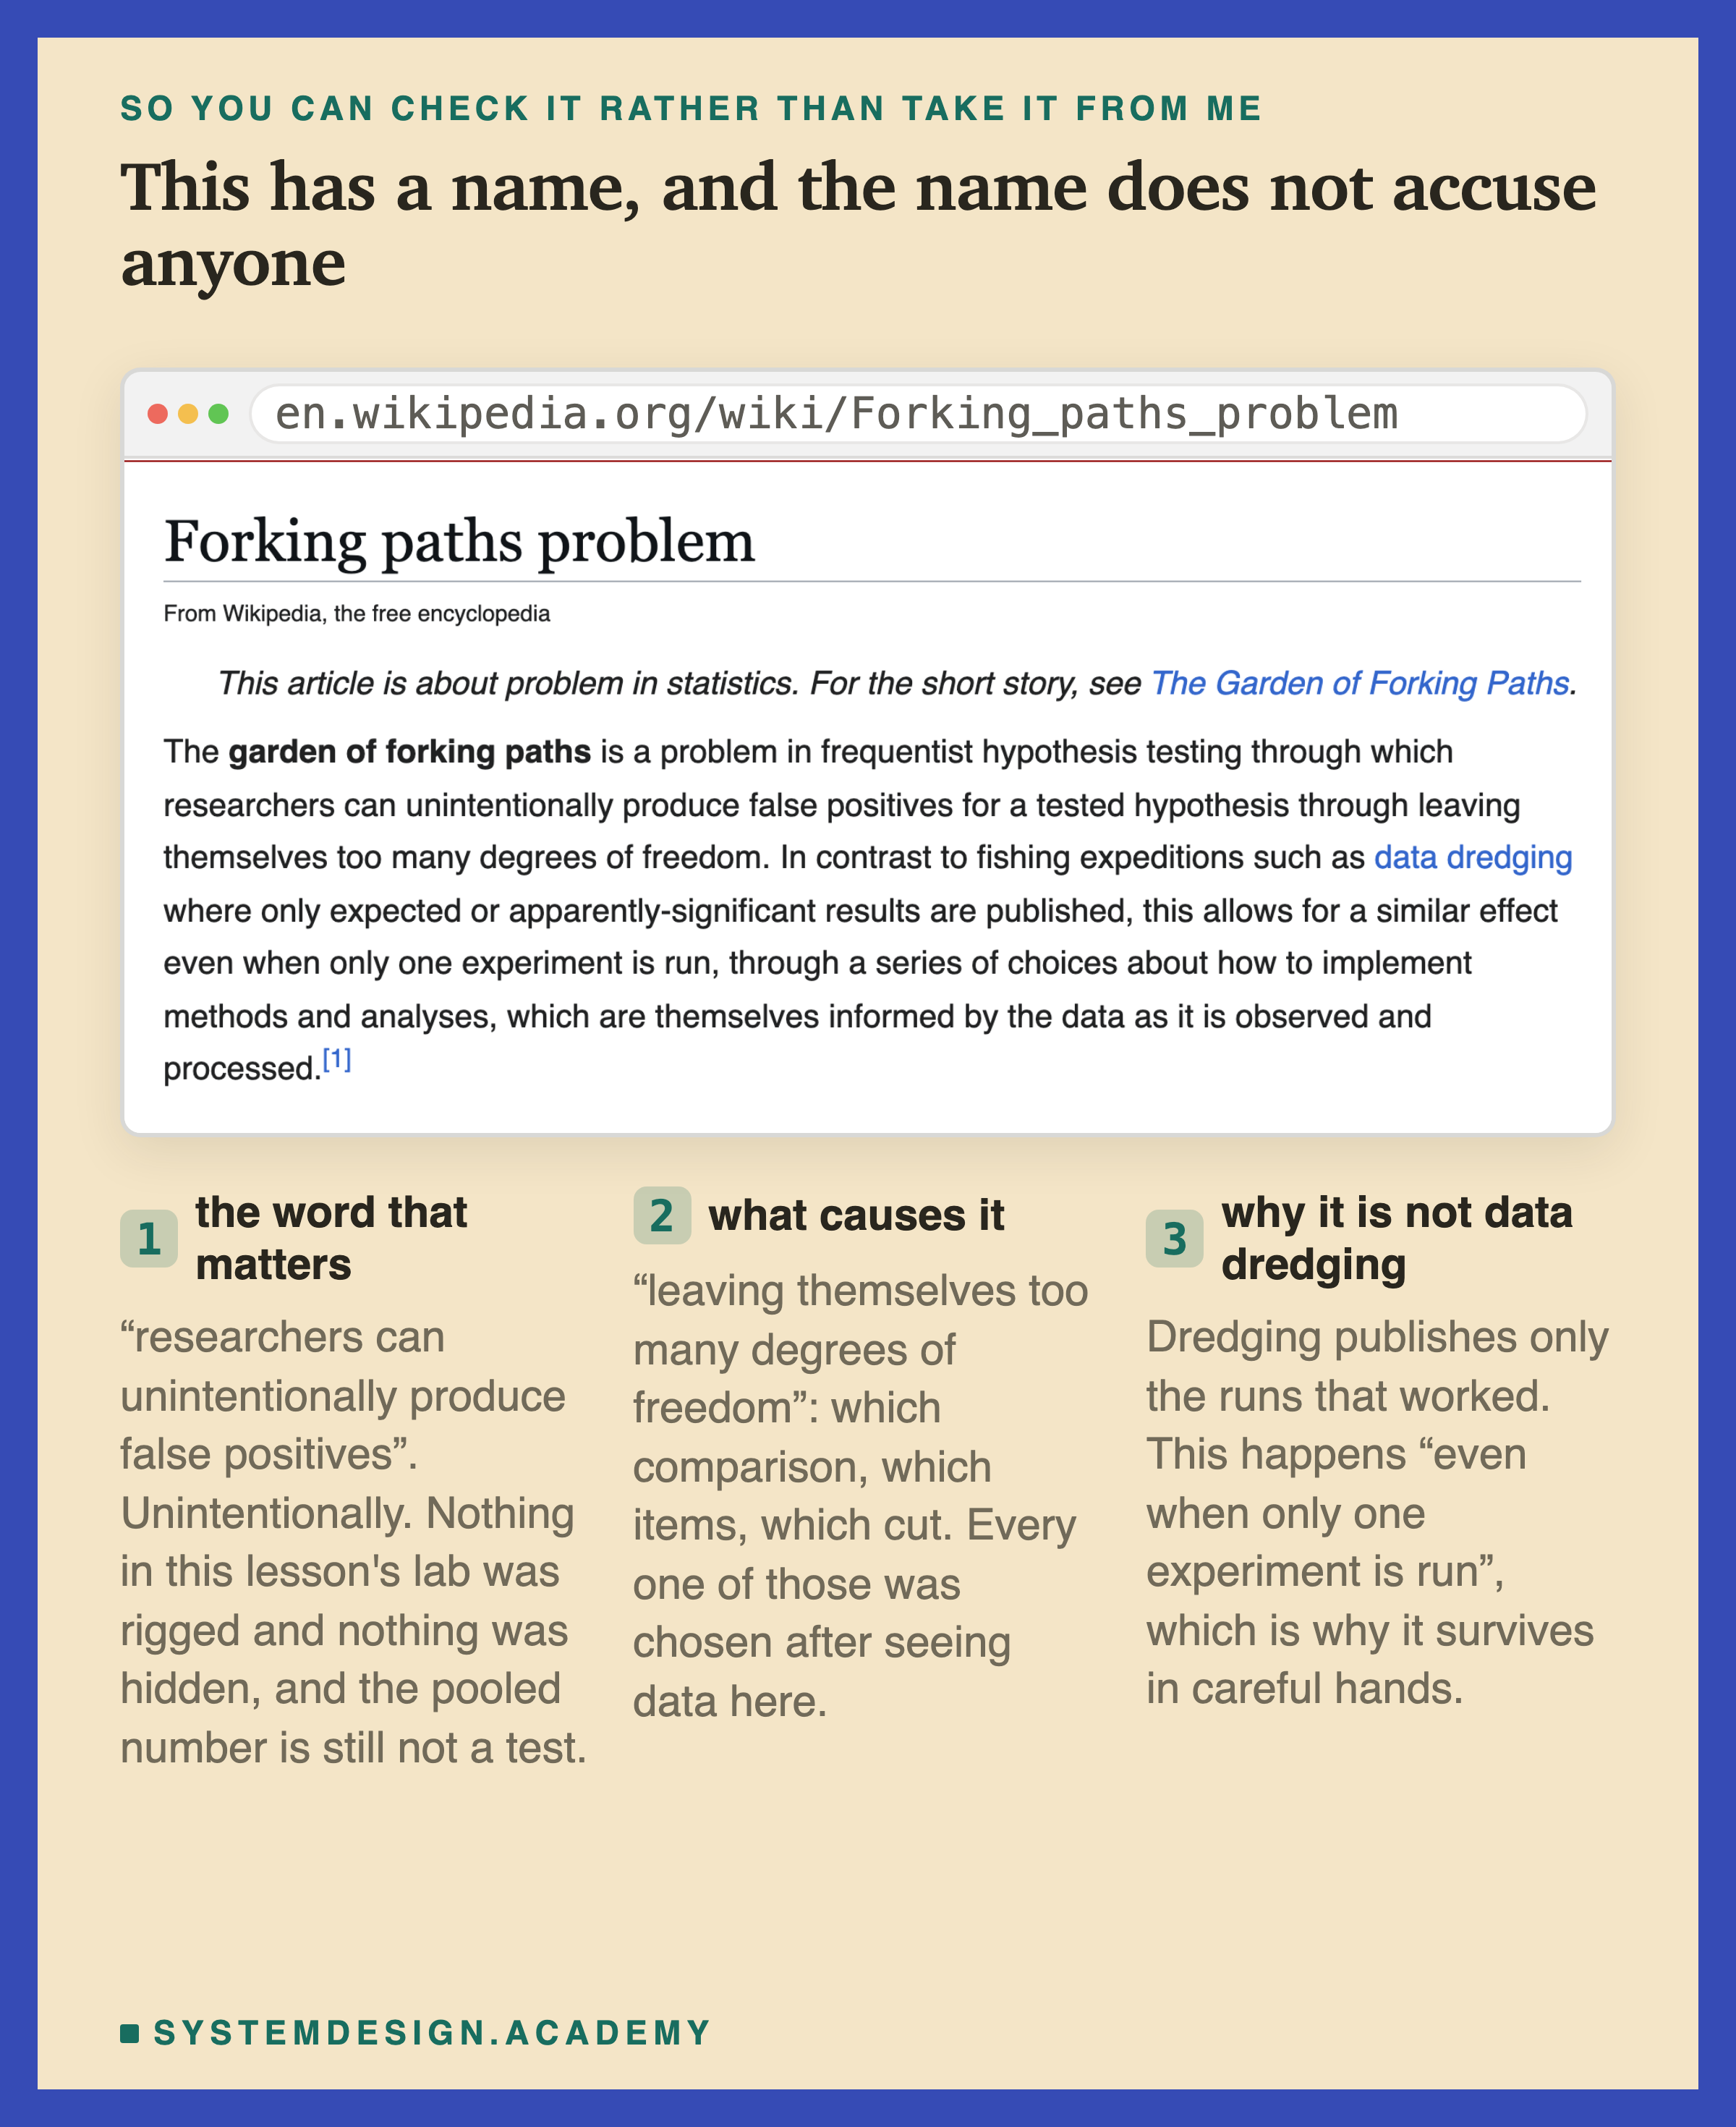
The word to notice is "unintentionally". Nothing was hidden here. The lab is in the repo, every run is in the output, and the pooled number is still not a test of the claim it appears to support.
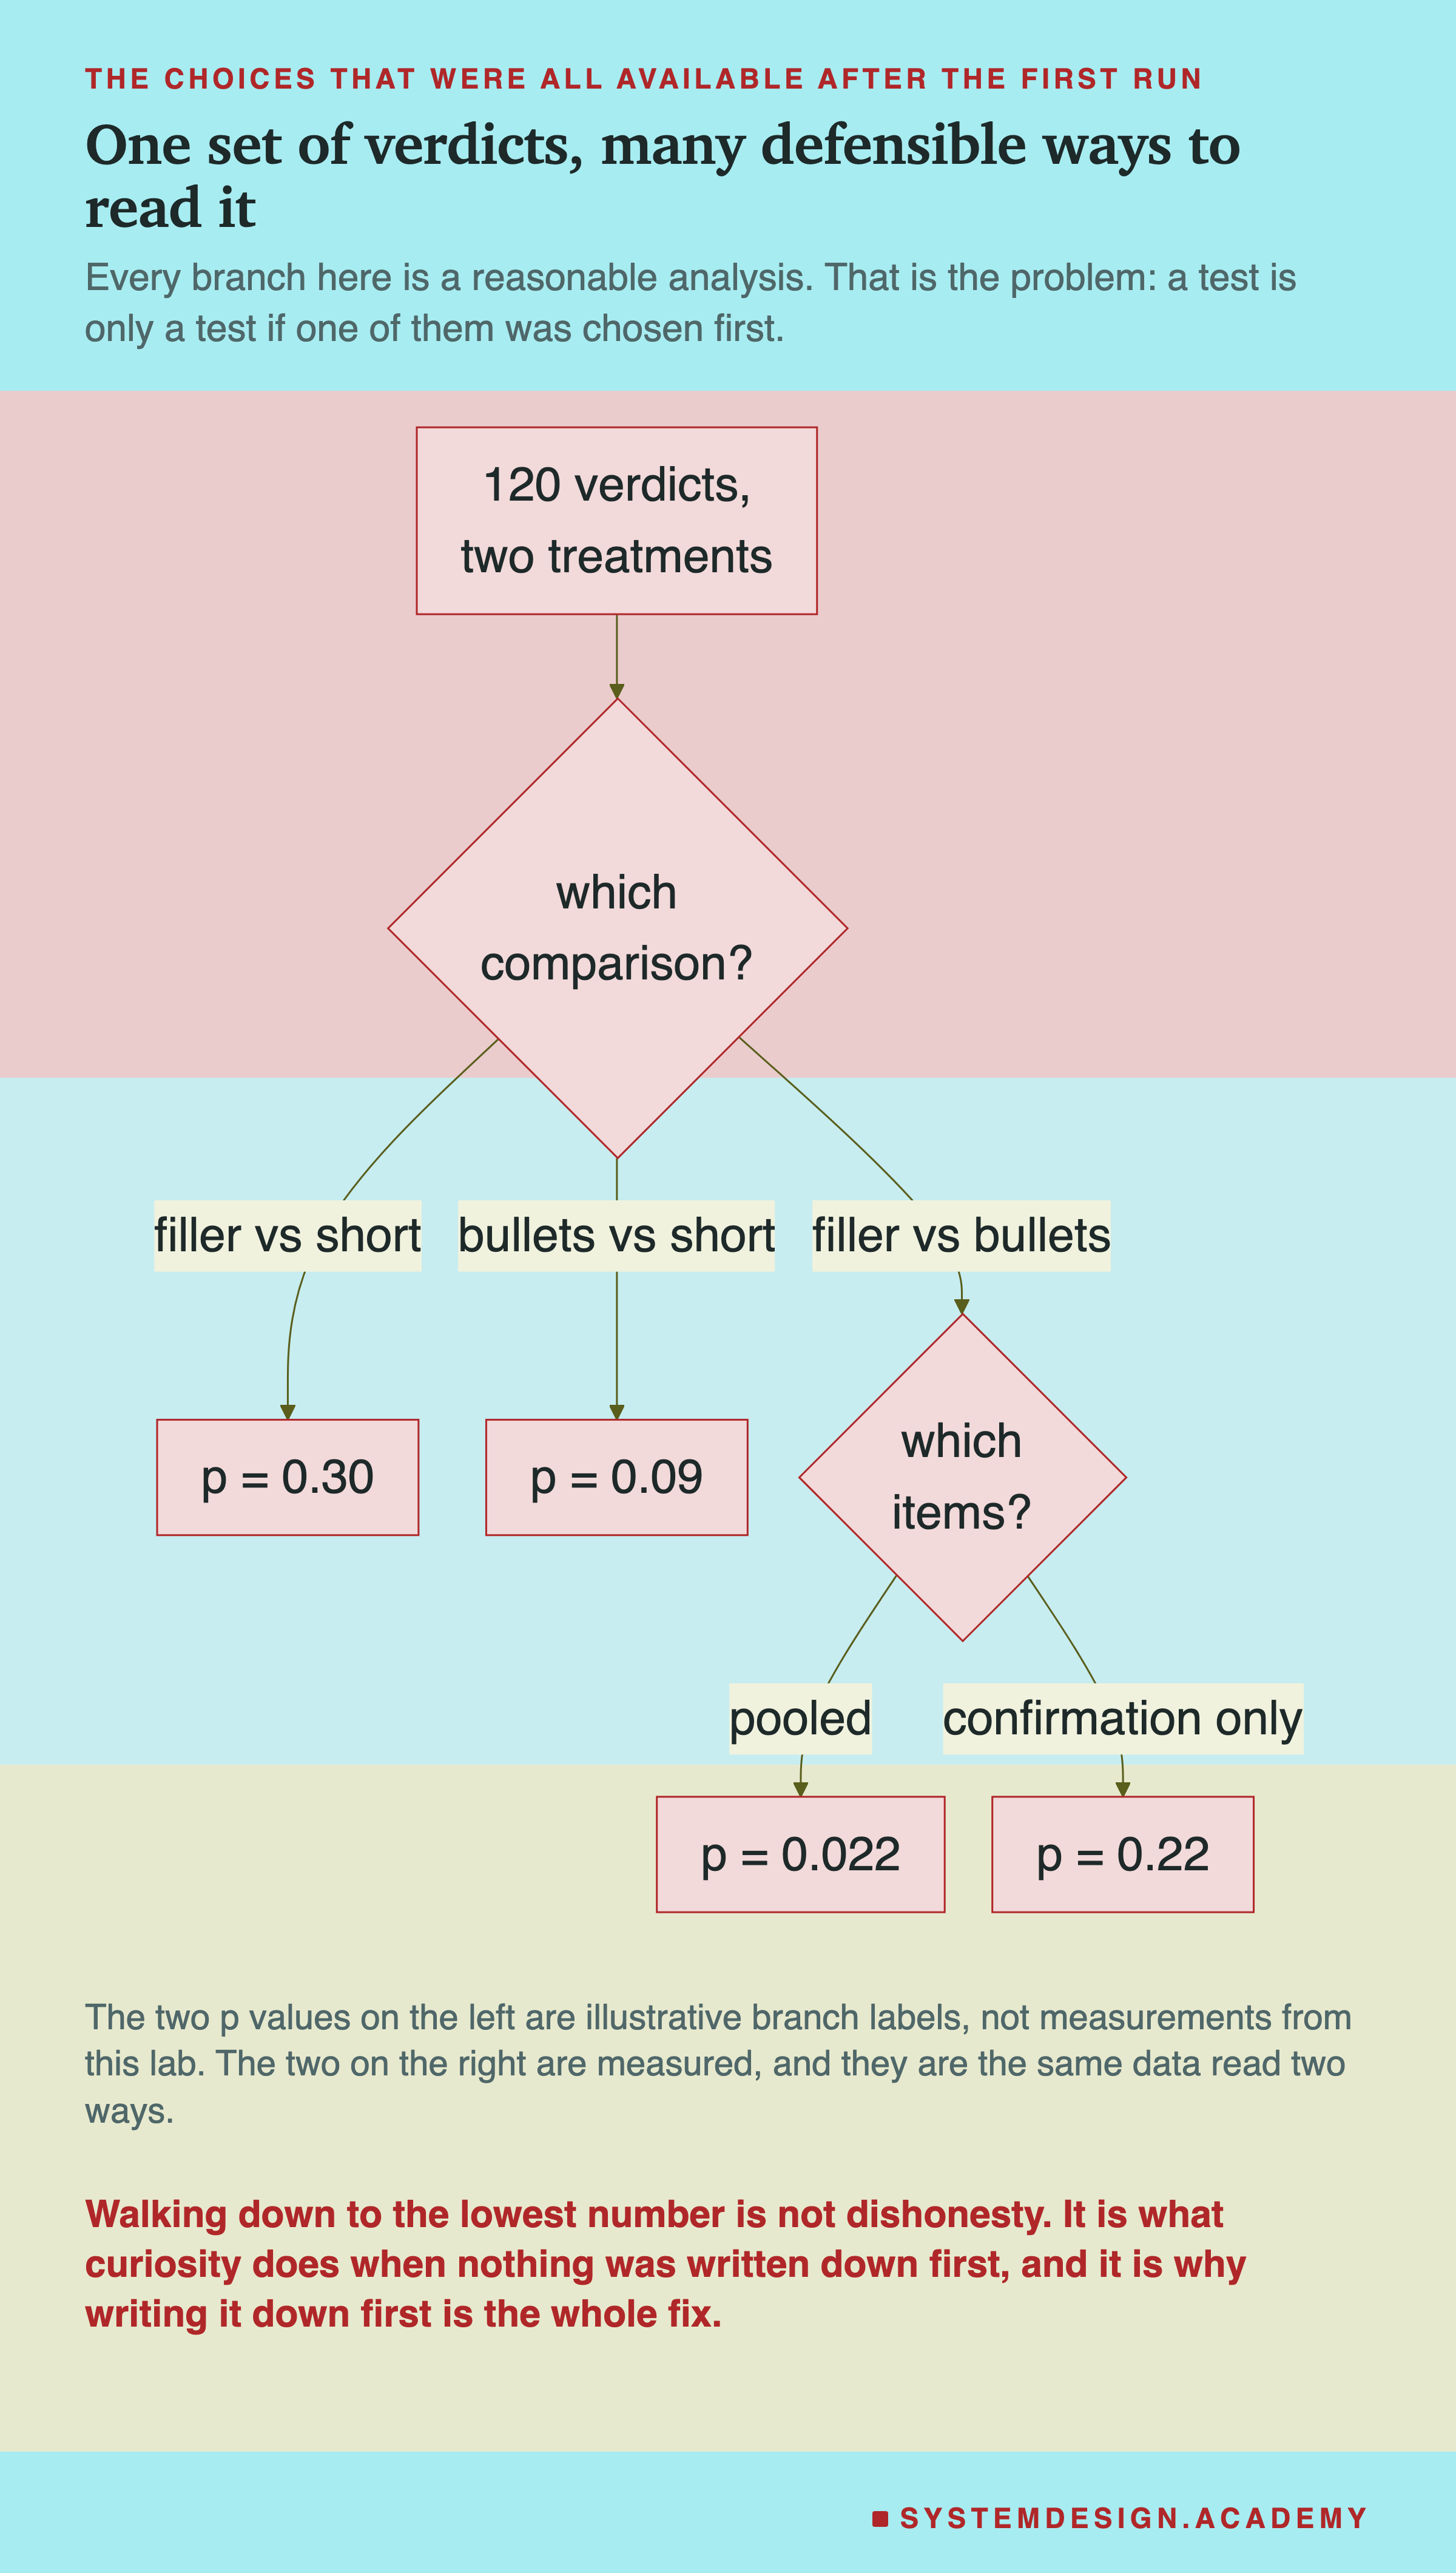
Every branch on that tree is a defensible analysis. That is exactly the problem. Several readings are all reasonable and none was chosen in advance. So the one you end up reporting is the one the data pointed at, and a p value computed on it does not mean what the symbol implies.
This Is Not An Argument For Doing Nothing
The conclusion here is not that small experiments are worthless. It is that a small experiment answers a smaller question than it looks like it answers, and the difference is measurable.
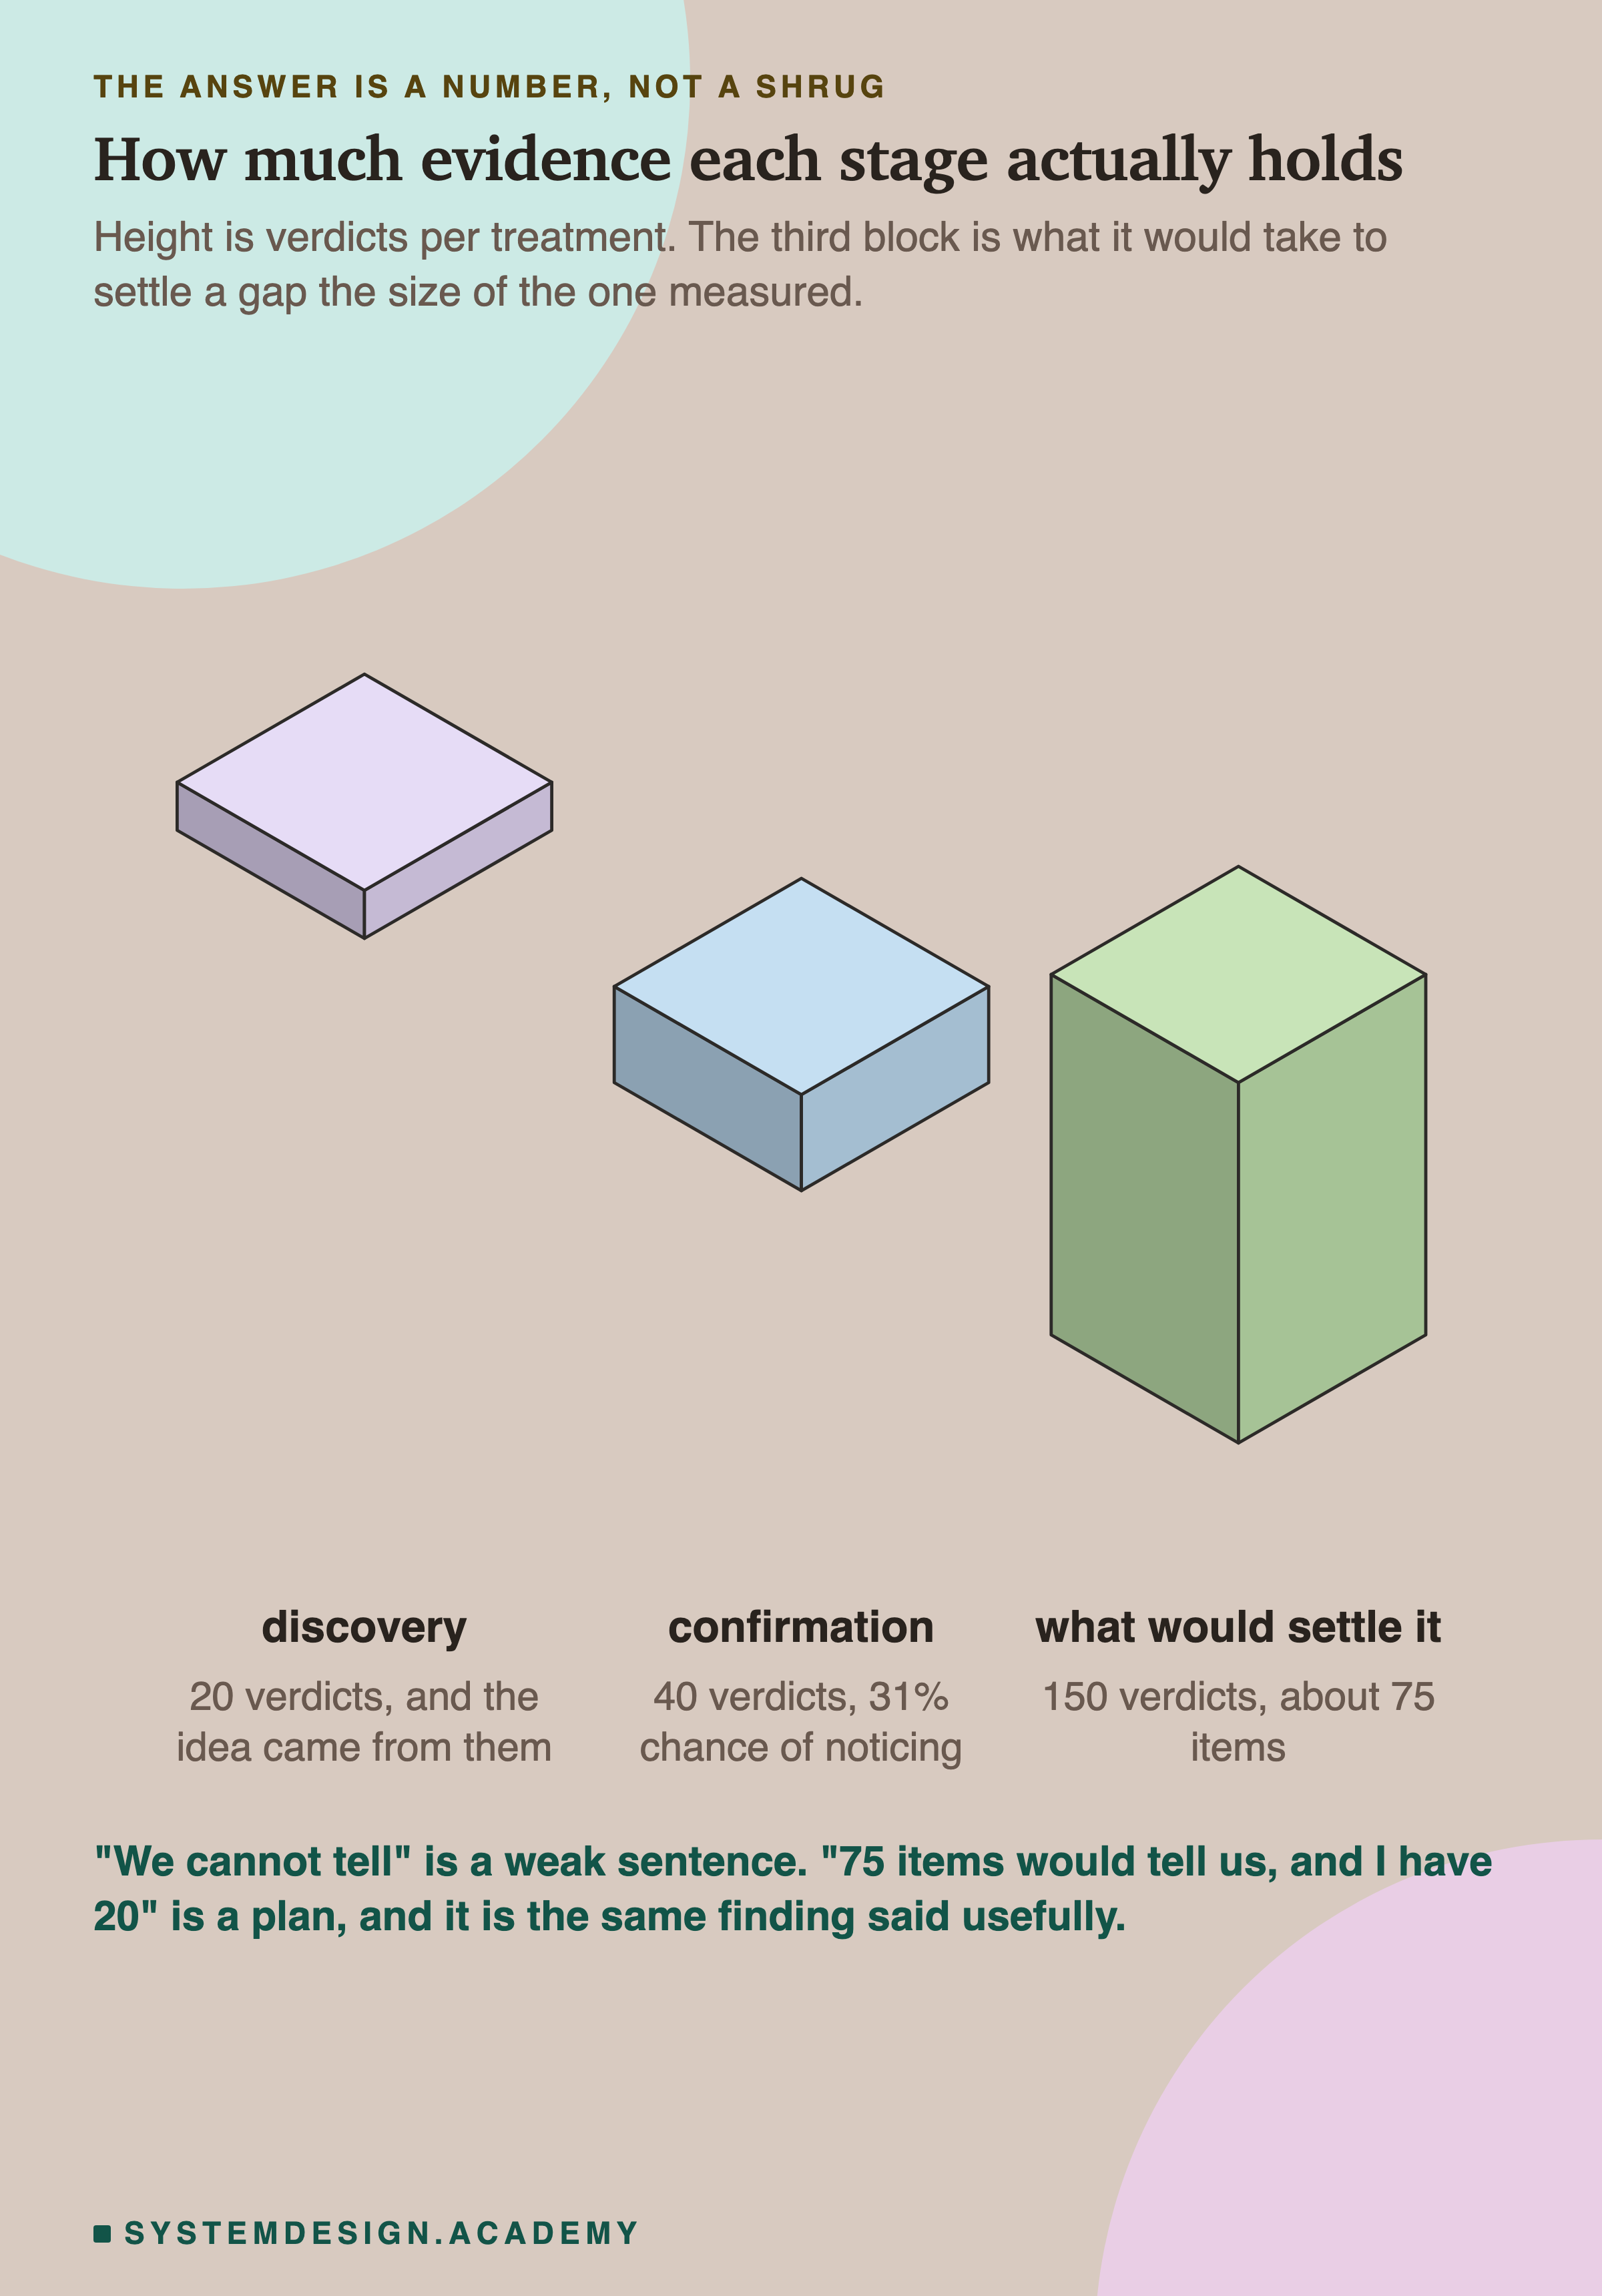
Both sentences describe the same result. Only one of them tells the next person what to do.
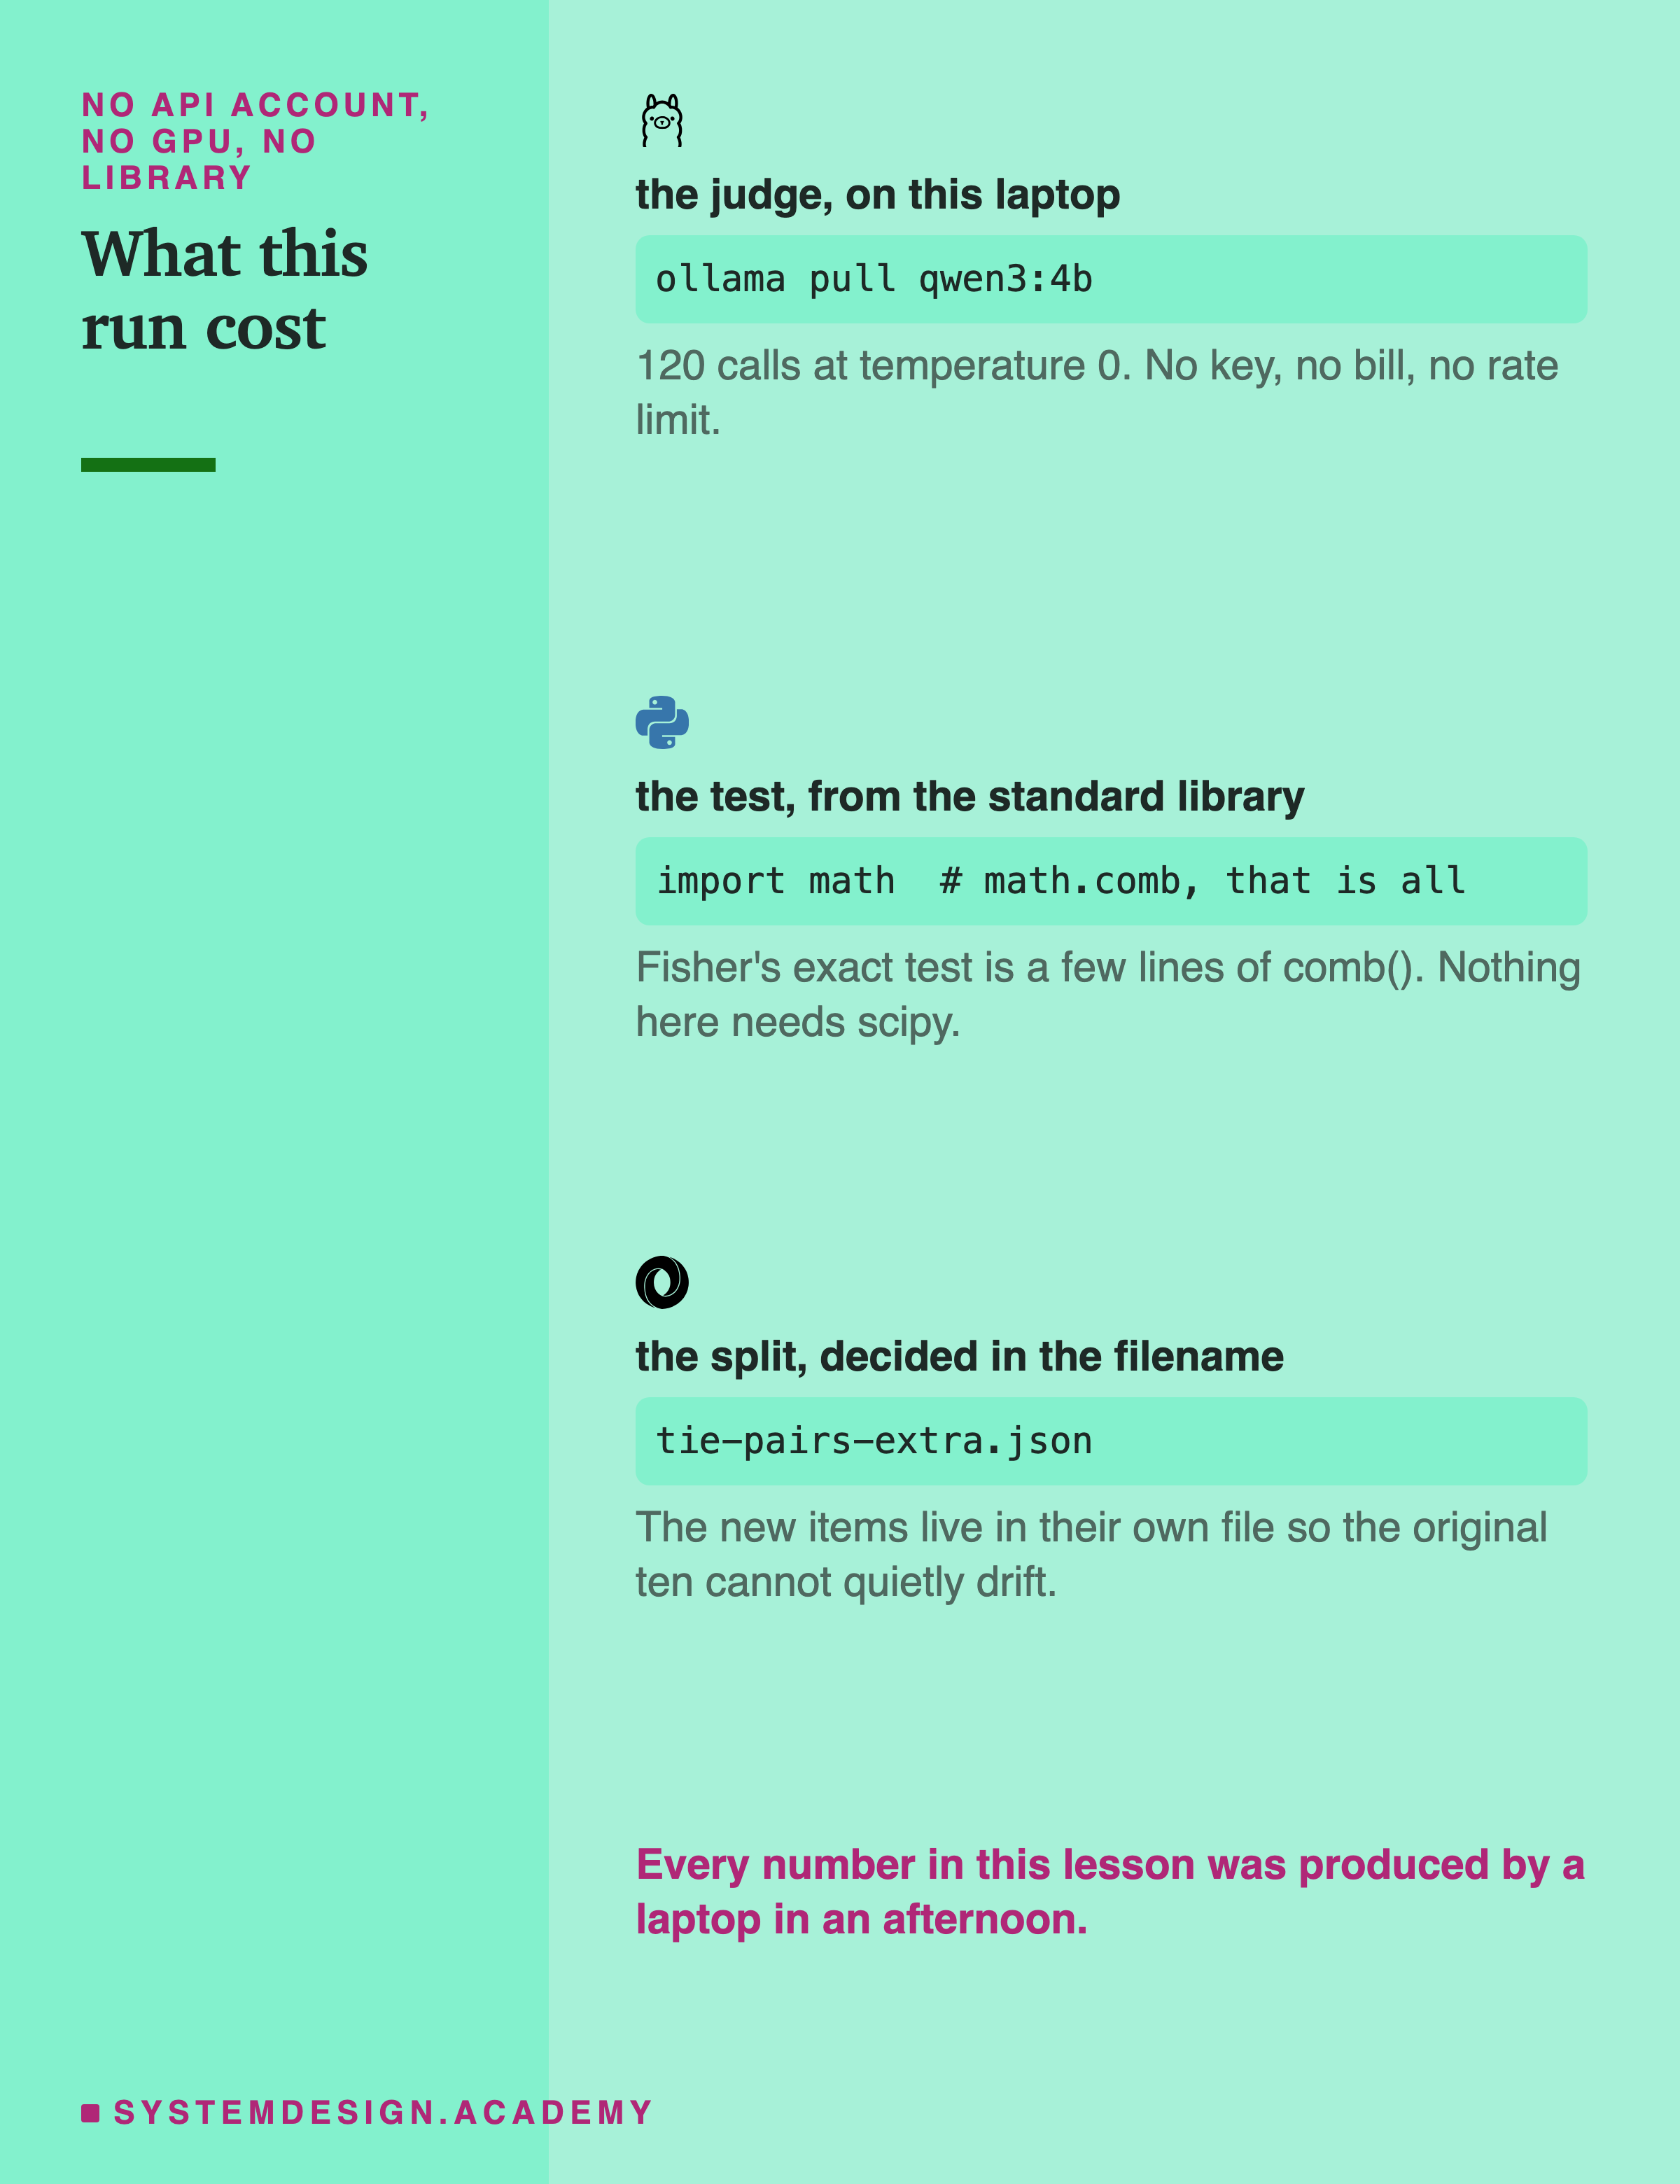
The third one is the cheapest protection in the list. The twenty new items live in a separate file. So the ten that produced the hypothesis cannot be quietly edited, reordered or filtered while the analysis is written. The split is visible in the directory listing.
What To Do Instead
There is nothing to give up here. Exploration stays exactly as free as it was. The only new rule is about which run counts.
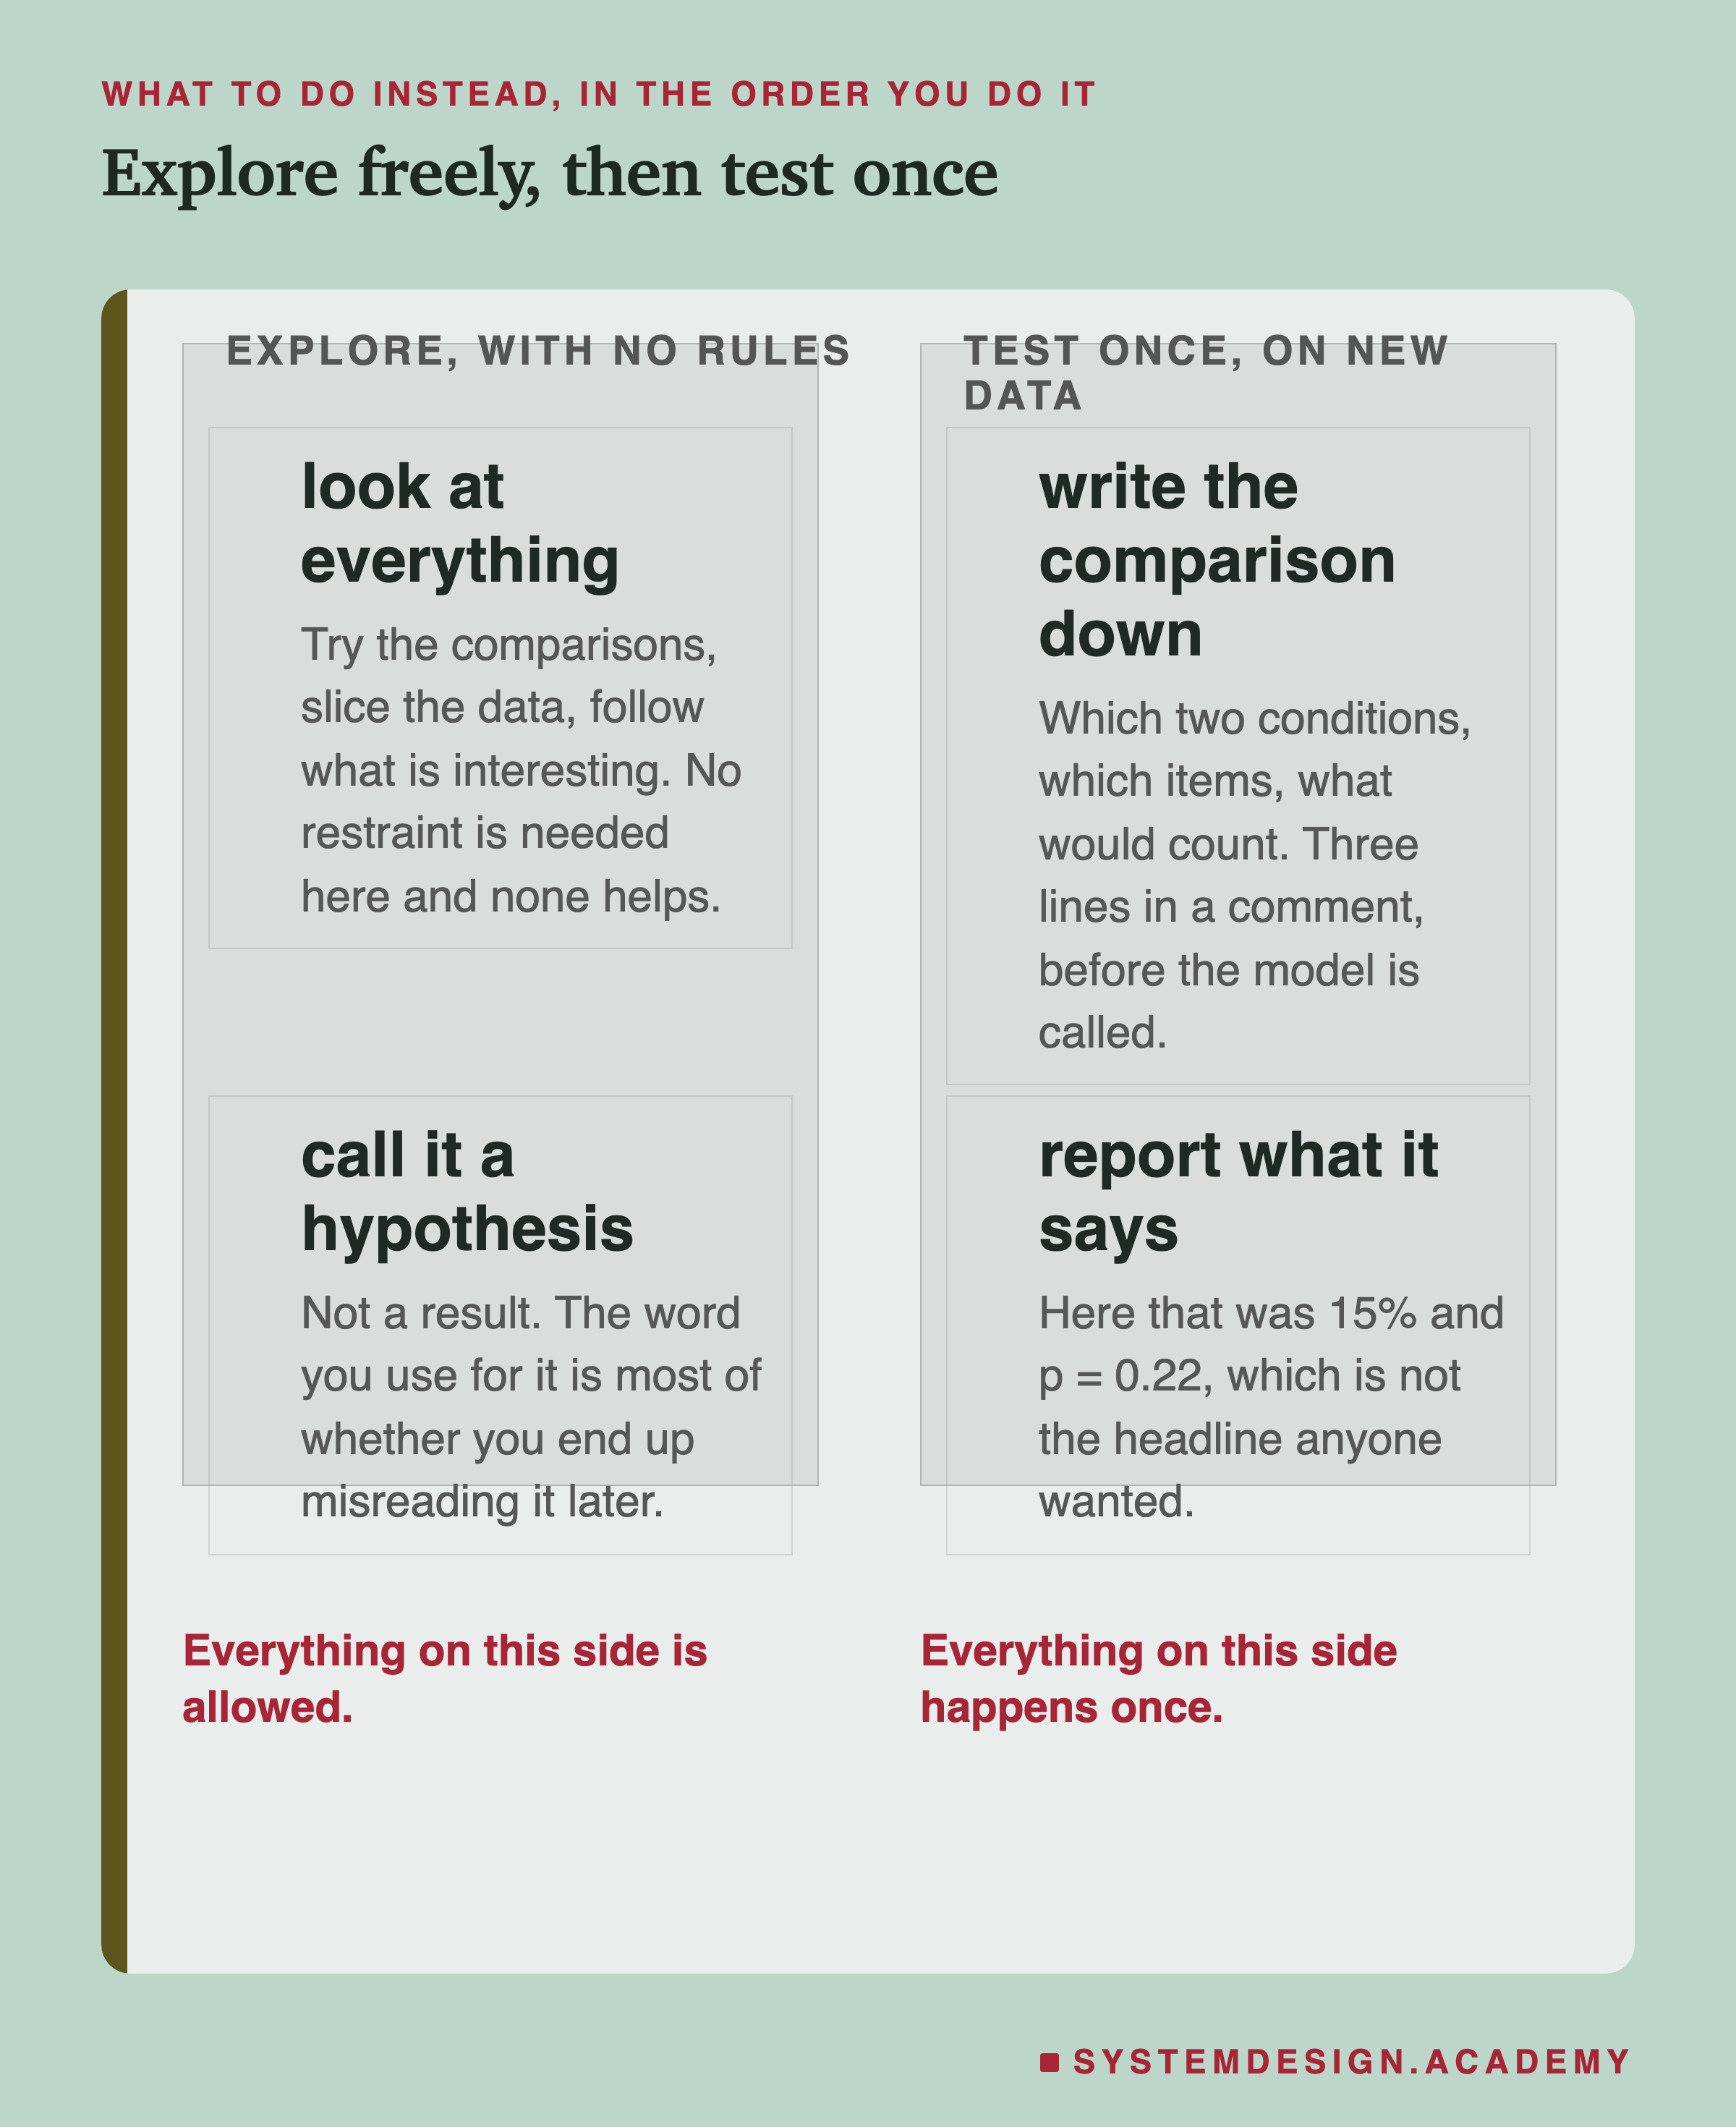
The left column is where almost all of the value is. Looking at data from every angle is how you find the questions worth asking, and nothing about that needs restraining.
The right column happens once per question, on data that the left column has never touched.
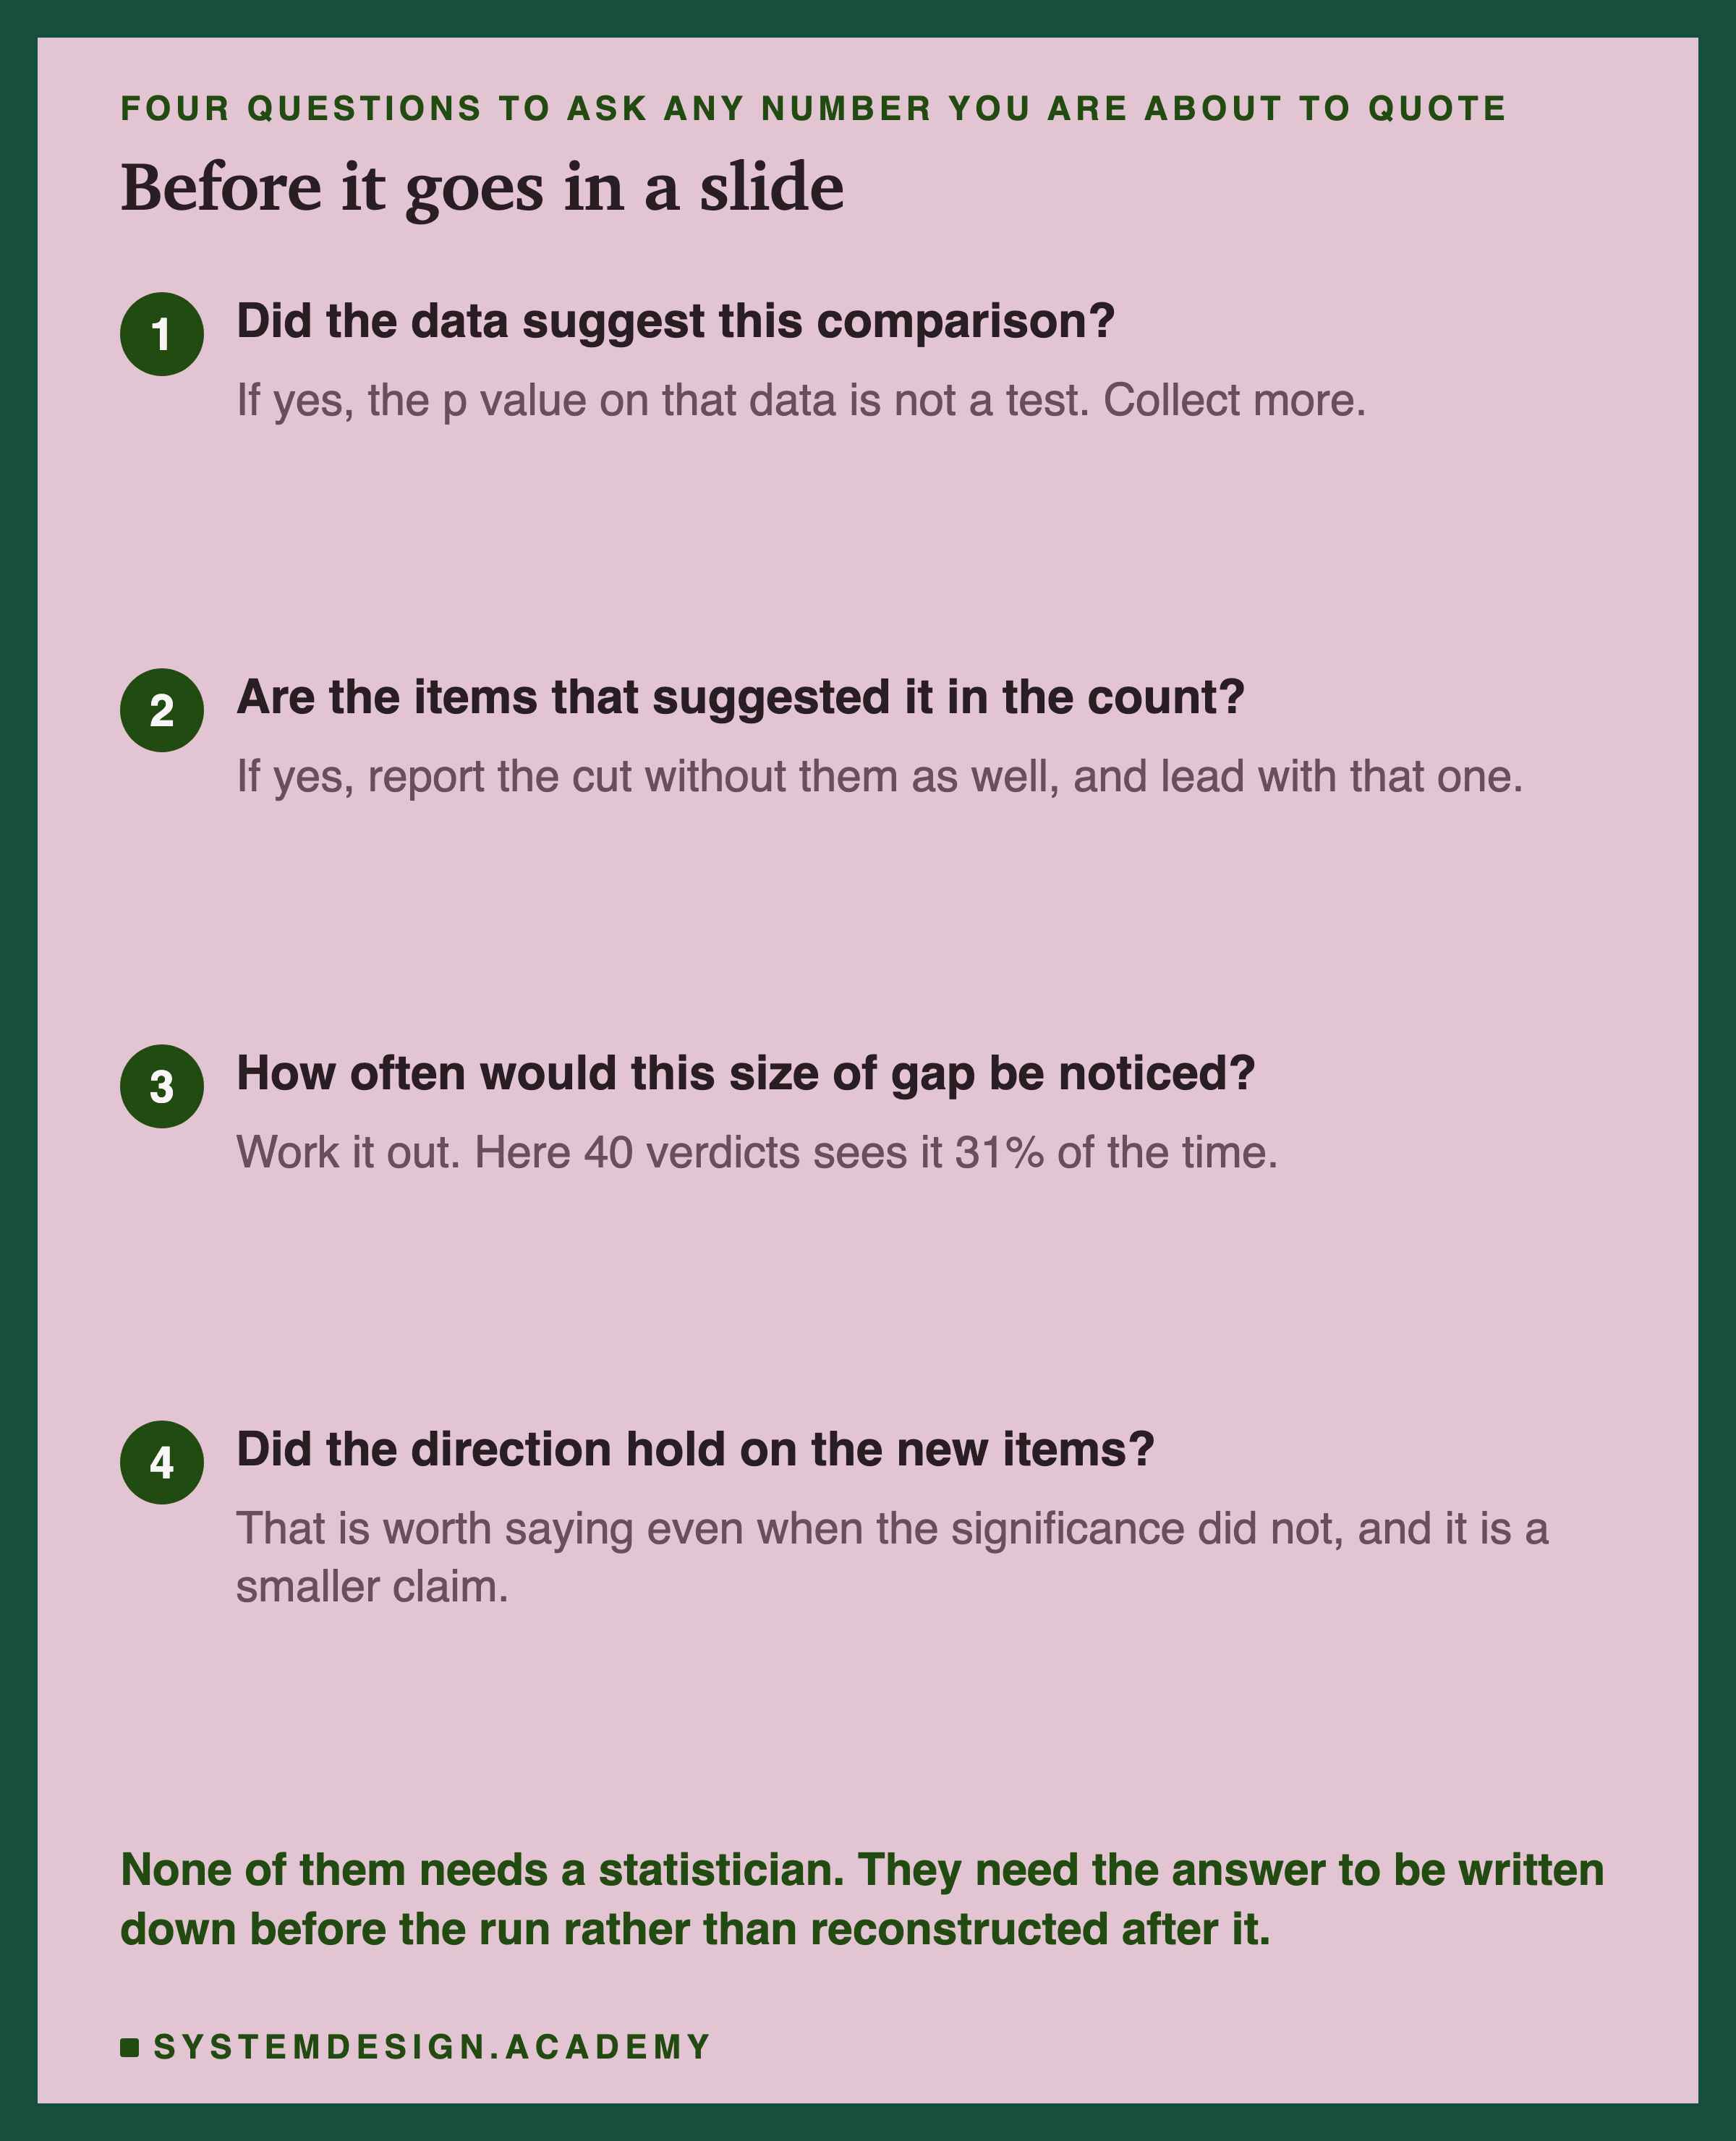
Those four questions take a minute against any number you are about to quote. Two of them are about where the number came from and the other two are about what it could have seen.
What To Keep
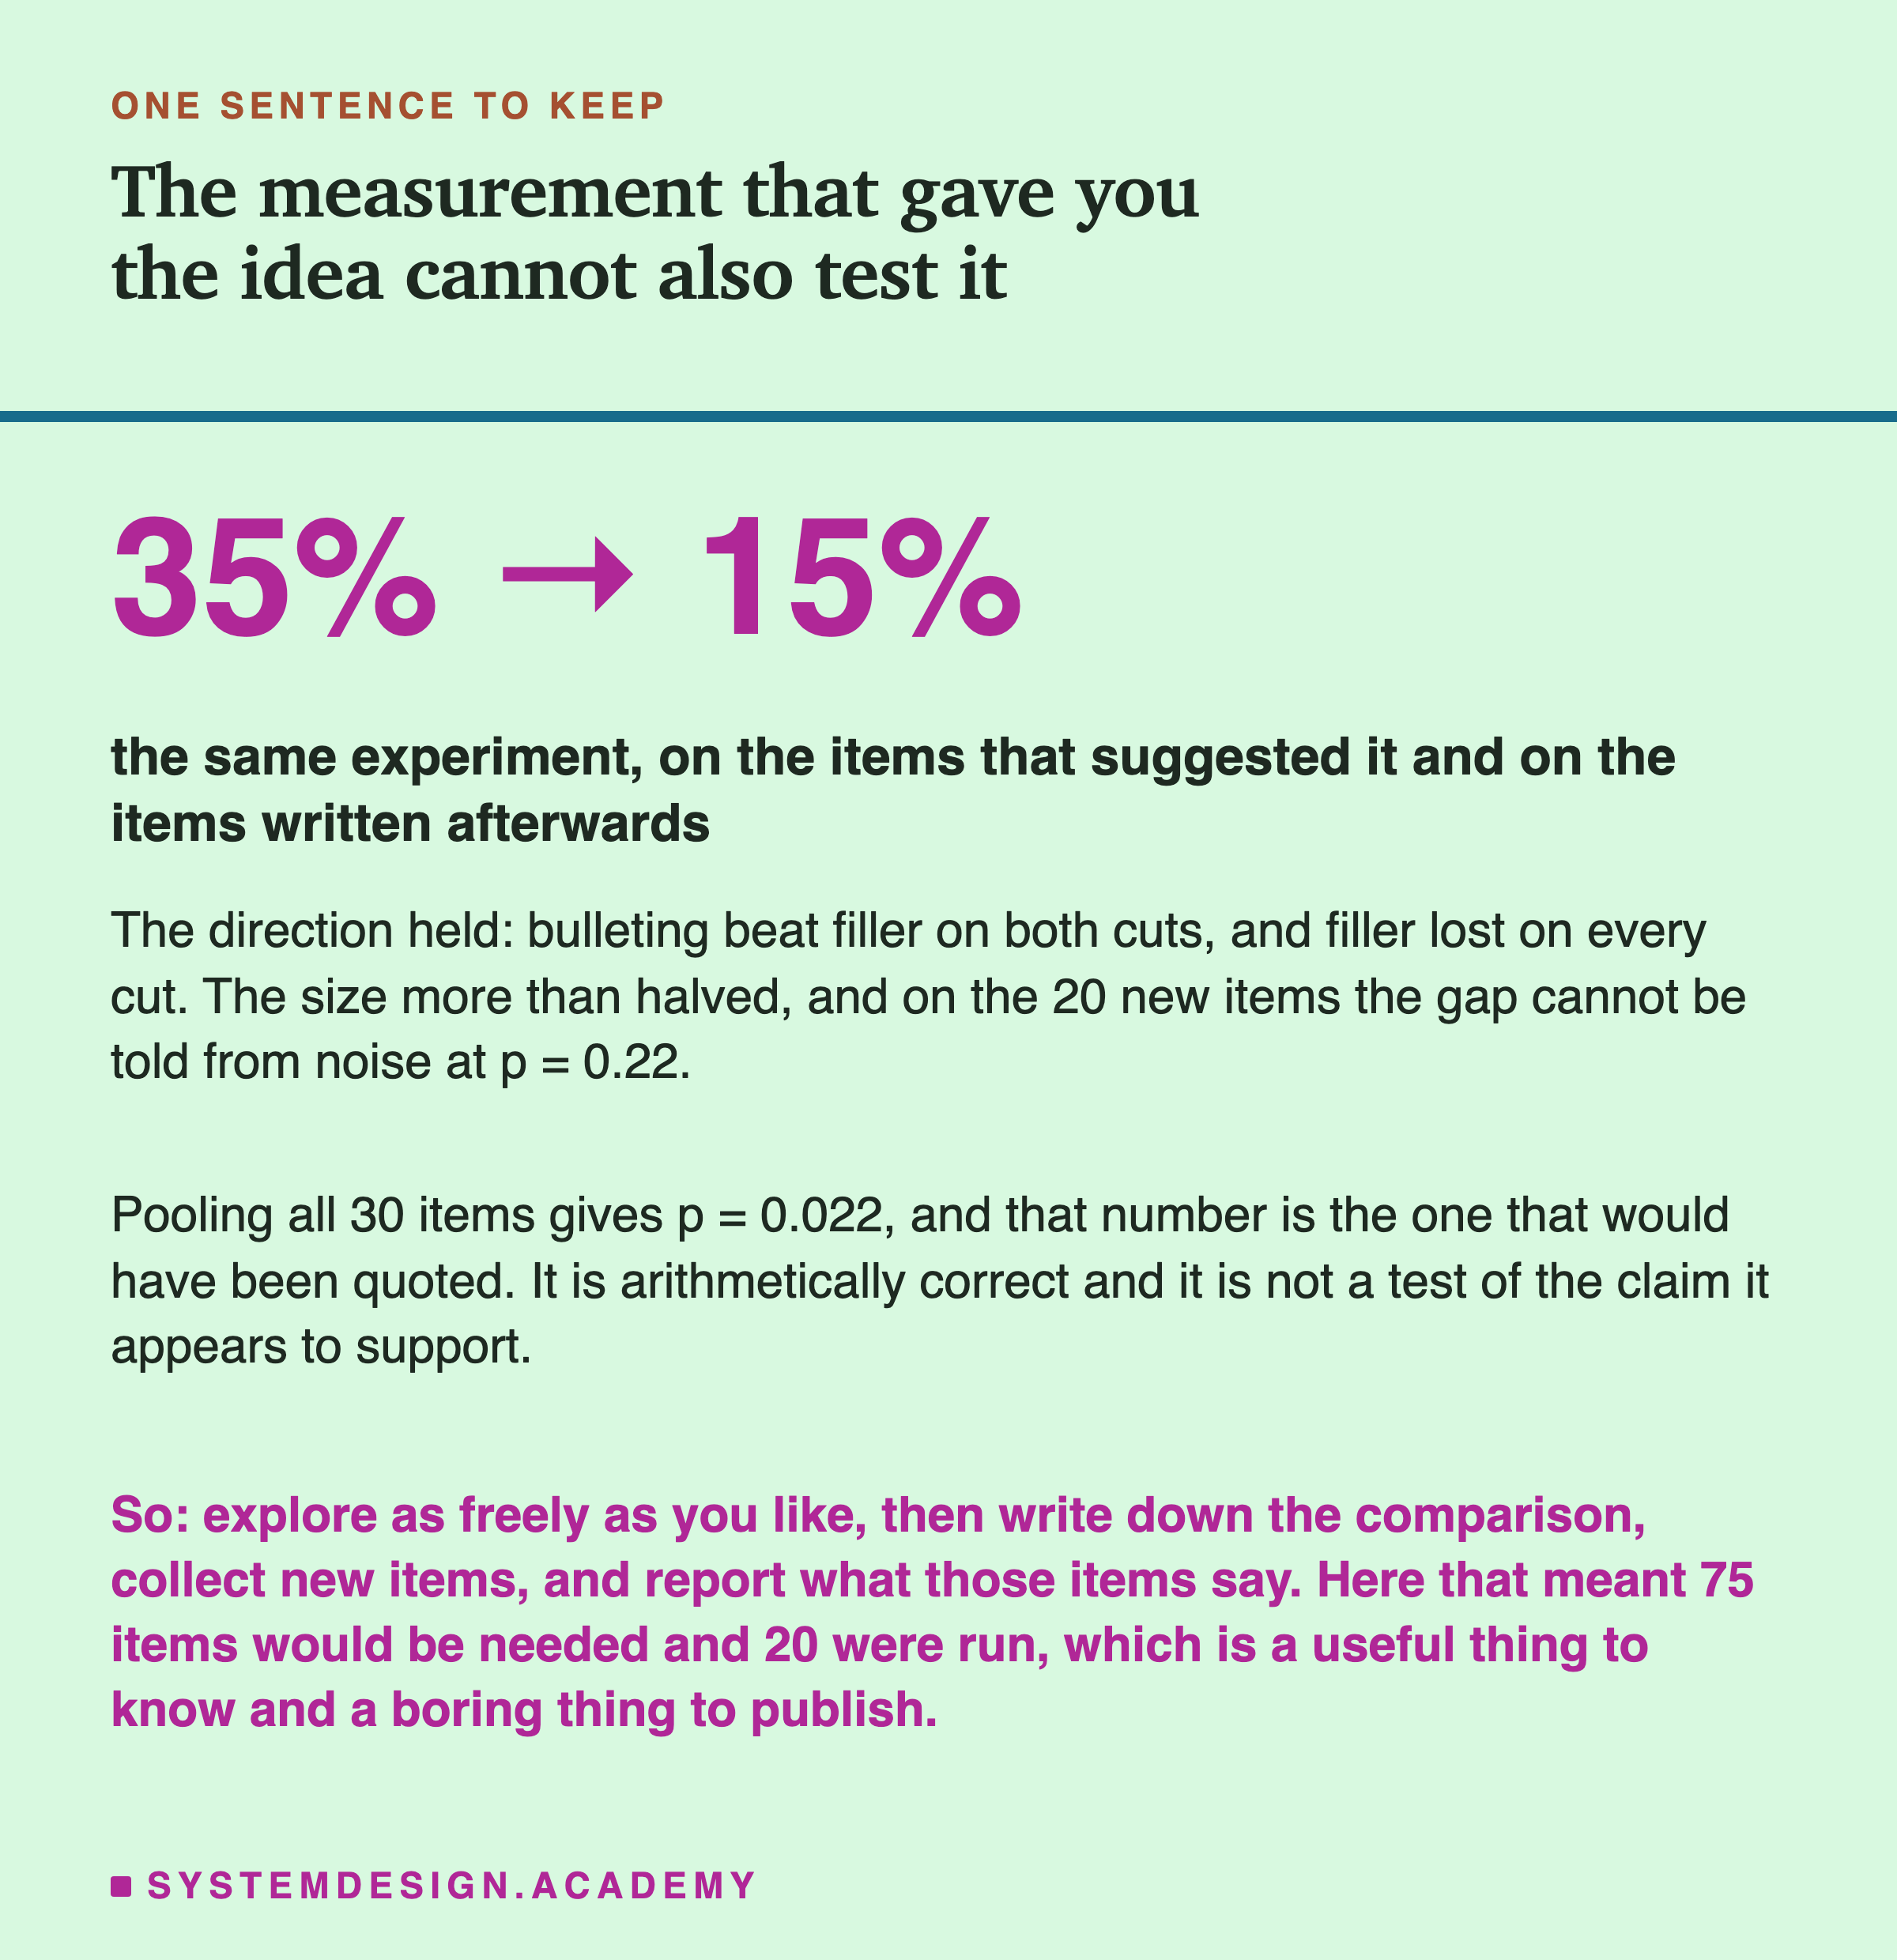
The sentence to keep is short: the measurement that gave you the idea cannot also test it.
Everything else follows from it. Split your items into the ones that produced the hypothesis and the ones that did not. Write the comparison down before the run. Report the out-of-sample cut even when it is the boring one. Work out beforehand how many verdicts the question needs, and say that number out loud when you do not have them.
None of this is hard and none of it costs money. It cost me a 15-point gap and a headline I liked, which is roughly what it always costs.
Knowledge Check
Knowledge Check
5 questions - Score 80% to pass
Ten items suggested a hypothesis and twenty new ones were collected to test it. Pooling all thirty gives p = 0.02. What is wrong with quoting that?
The discovery gap was 35 points and the confirmation gap was 15. What does the shrinkage tell you?
The confirmation set ran 40 verdicts per treatment and its 15-point gap gave p = 0.22. What is the most useful thing to report?
What does preregistering a comparison actually mean in a normal engineering repo?
In this experiment, which claim survives every cut of the data?