systemdesign.academyAI EngineeringFree lessonsSign inGet the course
  1. Home

Where this shows up in interviews

2 system design questions lean on this idea. Each walks through the full answer.

  • →Design a Multi-Agent System
  • →Design an AI Agent for Customer Support
Previous lessonMulti-Agent Systems, and When Not to Build OneNext lessonMCP in Production: What the Protocol Buys and Costs

System Design

  • Foundation
  • Intermediate
  • Advanced
  • Capstone

AI Engineering

  • Foundation
  • Data, RAG and Agents
  • Evaluation, LLM Ops and Security

systemdesign.academy

  • Home
  • Glossary
  • Interview prep
  • Reviews
  • About
  • Pricing
  • Privacy
  • Terms
  • Refunds
  • Delivery
  • Contact
AI Engineering: Data, RAG and Agents
  • Agents in Production
  • Agent Reliability Math: pass@k, pass^k, and Why 95 Percent Fails
  • AI Engineering · Agents In Production

    Agent Reliability Math: pass@k, pass^k, and Why 95 Percent Fails

    Free preview: the first part of this 15-part lesson.

    Already bought the course? Sign in to read the whole lesson.

    this lesson is part of

    AI Engineering

    Unlock this lesson and the 199 other paid lessons

    • 210 lessons in 16 chapters
    • 118 lessons built on a lab that really ran
    • An AI tutor beside every lesson that answers and draws
    • Lifetime access, every new lesson included

    $49 once, by PayPal

    See the AI Engineering course

    The rest of this lesson

    1. pass@k Is a Capability Number, and It Needs a Judge
    2. pass^k Is the SLA Number, and It Hides Nowhere
    3. Derive the Collapse: Why 95 Percent Becomes 36 Percent
    4. At 20 Steps, Only the Top Two Tiers Ship
    5. Run It Backwards: Turn an SLA Into a Per-Step Budget
    6. Per-Step Reliability, Read as a Task Horizon
    7. Cutting Steps Beats Raising Accuracy, and Here Is Why It Is Exact
    8. Verification Changes the Base, Not the Exponent
    9. The Failures Verification Cannot Catch Go Silent
    10. Retries Pay Off Only When Failures Are Independent
    11. tau-bench: What the pass^k Numbers Actually Measured
    12. Why pass^k Was 25 Percent, Not 1 Percent
    13. Every Lever Attacks a Named Term of p^n
    14. Knowledge Check

    read the rest of this lesson in

    AI Engineering

    Unlock this lesson and the 199 other paid lessons

    • 210 lessons in 16 chapters
    • 118 lessons built on a lab that really ran
    • An AI tutor beside every lesson that answers and draws
    • Lifetime access, every new lesson included

    $49 once, by PayPal

    See the AI Engineering course

    Continue this lesson

    in Agents In Production

    This lesson is part of the AI Engineering course. Unlock the full course, a separate one-time payment, for lifetime access.

    One-time payment. Lifetime access. No subscription.
    Global
    $49/lifetime

    One-time payment by card or PayPal

    Get Lifetime Access
    Foundation lessons free, try before you buy
    India Special
    India
    ₹999/lifetime

    One-time payment: UPI, card or netbanking

    Get Lifetime Access
    Foundation lessons free, try before you buy
    Every ML Platform lesson, Foundation to Advanced
    Real architecture diagrams with real tool logos
    MLOps, LLMOps, and data engineering in depth
    Quizzes with instant feedback
    Built and reviewed by senior engineers
    Lifetime access, all future content included

    Foundation lessons of this course are free, no payment needed. Try them now

    Two Numbers, One Character Apart, Pointing Opposite Ways

    A vendor benchmark reads 90 percent. A support automation that runs the same workflow every day fails one user in three. Both numbers can be true about the same agent, because they are measuring different things, and the difference is one character.

    pass@k is the probability that at least one of k attempts succeeds. pass^k is the probability that all k attempts succeed. The first rises as you add attempts, because you only need one winner. The second falls as you add attempts, because one loss is enough to spoil the set. A benchmark leaderboard usually quotes something close to the first. A user who depends on the agent lives inside the second. When the two get confused, a team ships against the wrong number and finds out in production.

    This lesson is the arithmetic the rest of the chapter rests on. The agent loop lesson showed that reliability compounds and named the levers; here we derive the formula both directions, turn it into a per-step engineering budget you can test against, and separate the interventions that move it from the ones that only feel like they do. No new mechanics beyond that. The whole subject is one equation and its consequences.
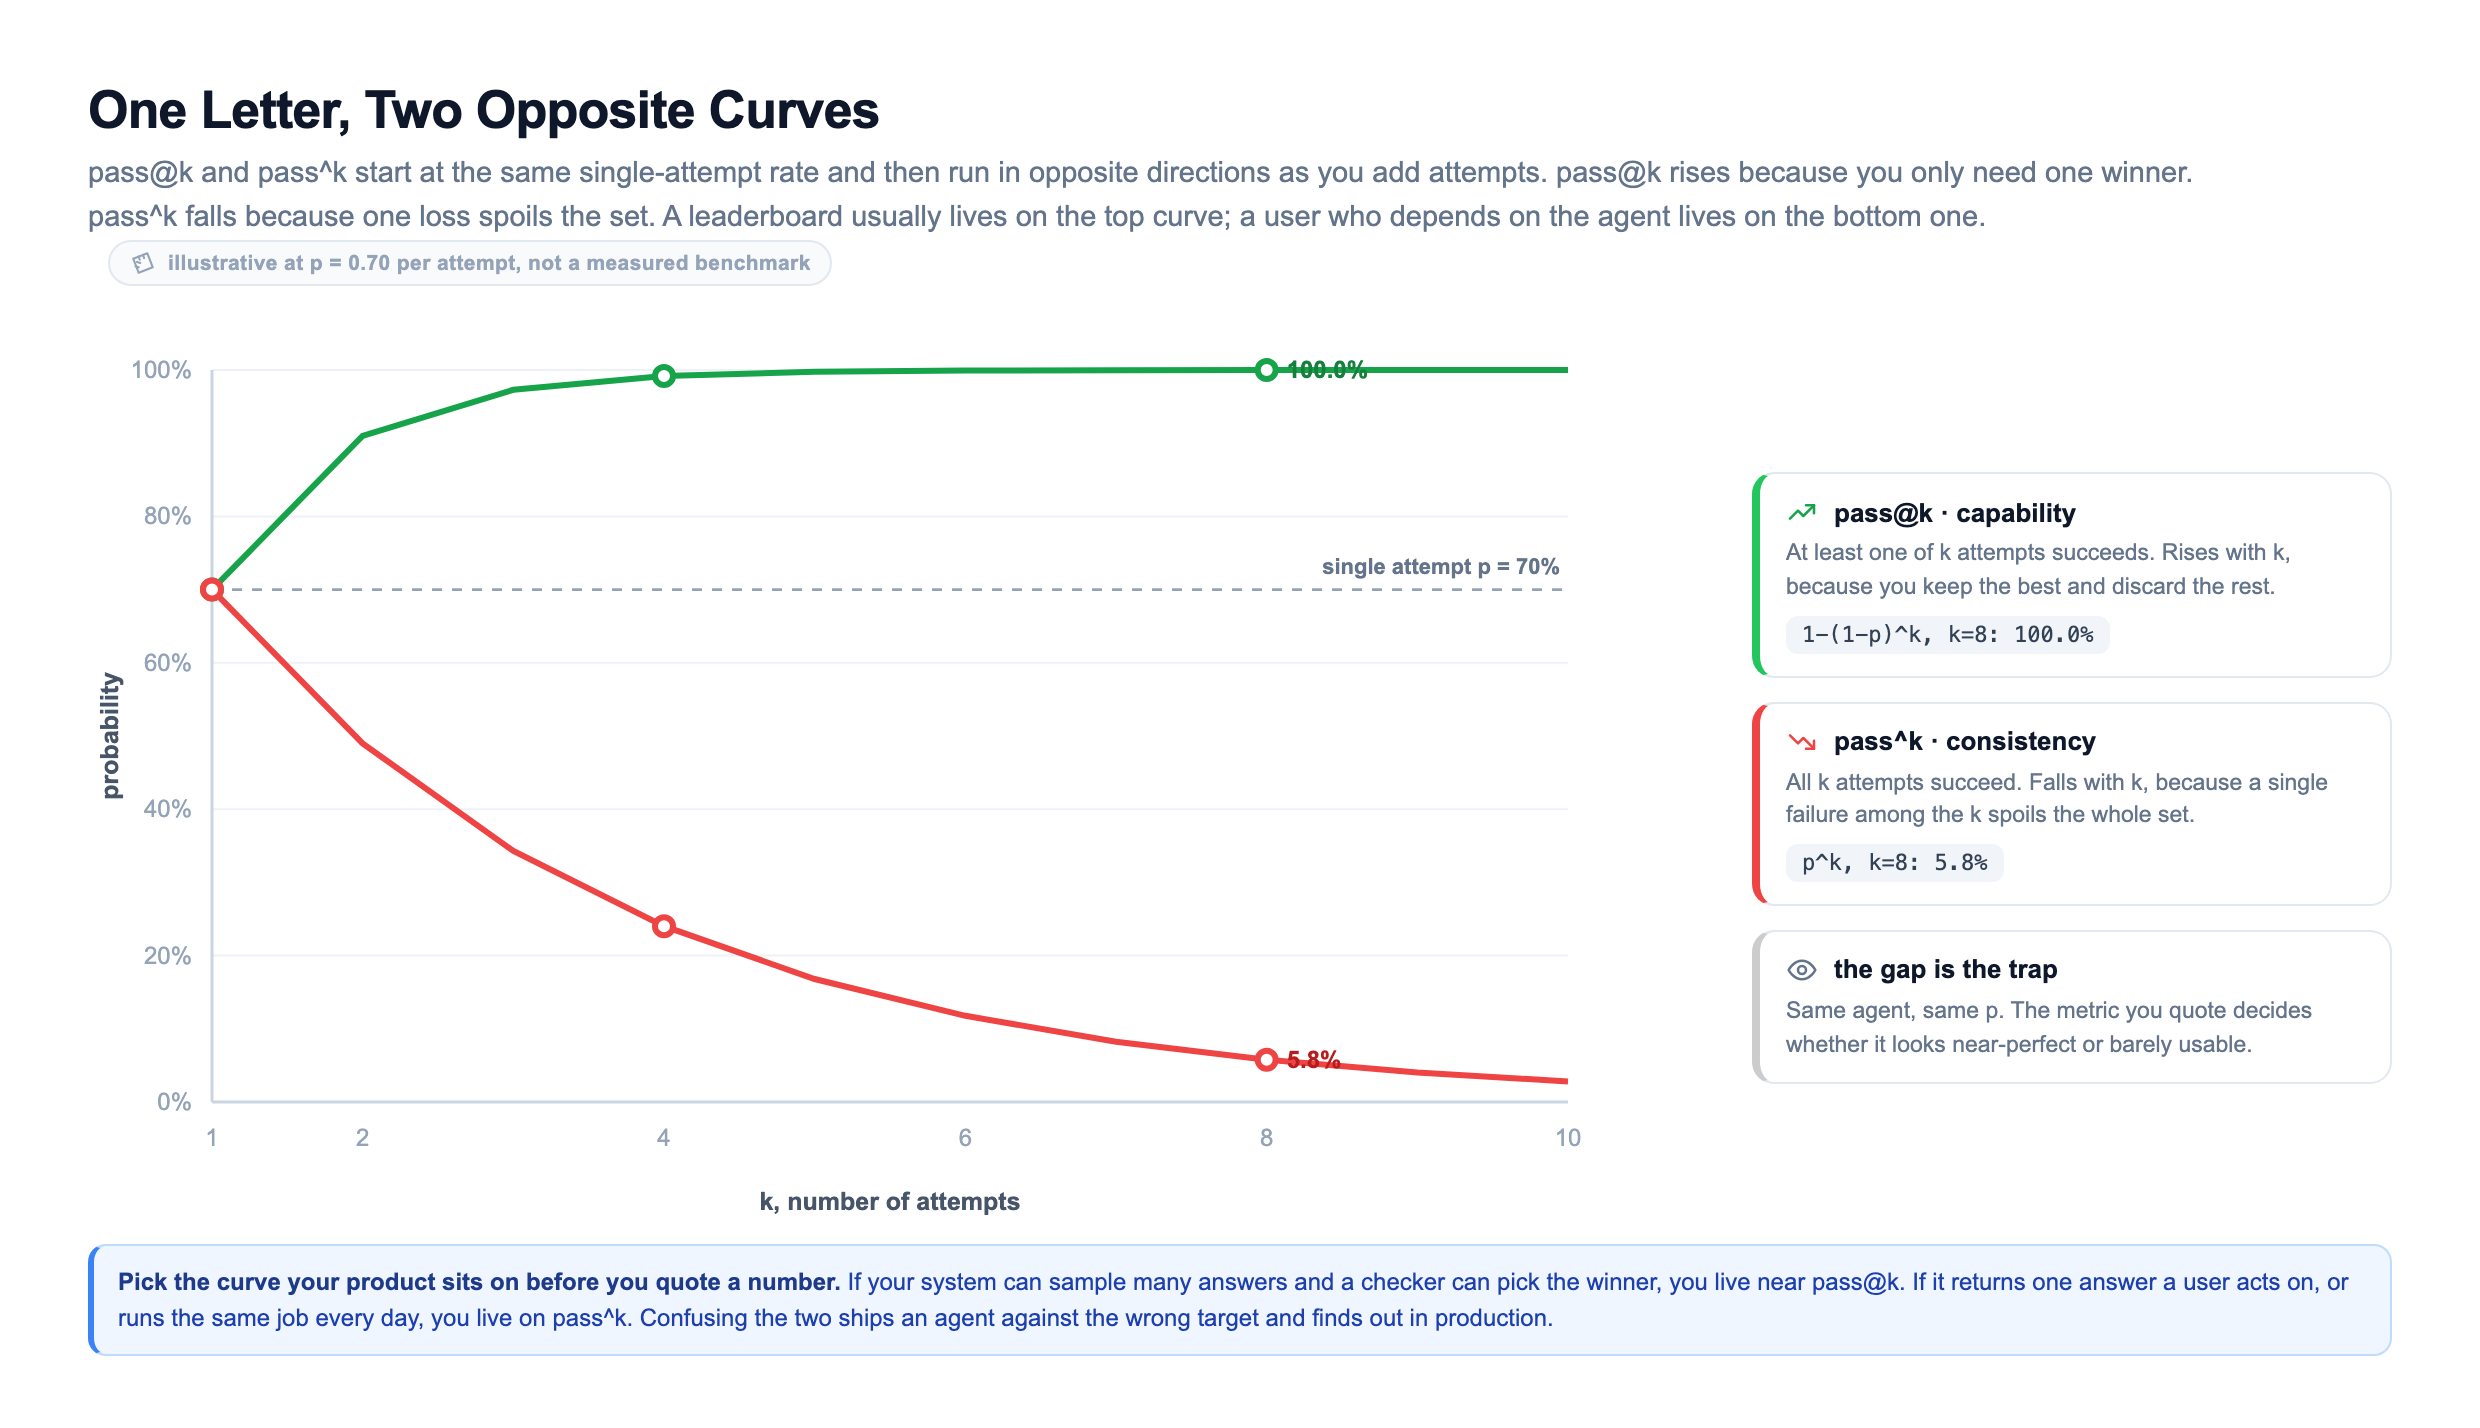
    Two probability curves that start at the same single-attempt rate of 70 percent and run in opposite directions as k grows: pass@k = 1-(1-p)^k rises toward 100 percent because you only need one winning attempt, pass^k = p^k falls toward zero because a single failure spoils the set, with a dashed reference line marking the shared single-attempt rate they diverge from

    Read the two definitions side by side and the shape of every later decision is already visible. pass@k measures whether the agent can do the task with enough tries: a capability question. pass^k measures whether it does the task every time: a consistency question. They bracket the single-attempt rate from opposite sides, and the right one to quote depends entirely on which question your product is actually asking. The divergence above is the whole lesson in one picture. A vendor sitting on the green curve and a user living on the red one can both describe the same agent honestly and disagree by fifty points, because they are reading the same p through two different exponents pointed in opposite directions.