Draw One Without Looking
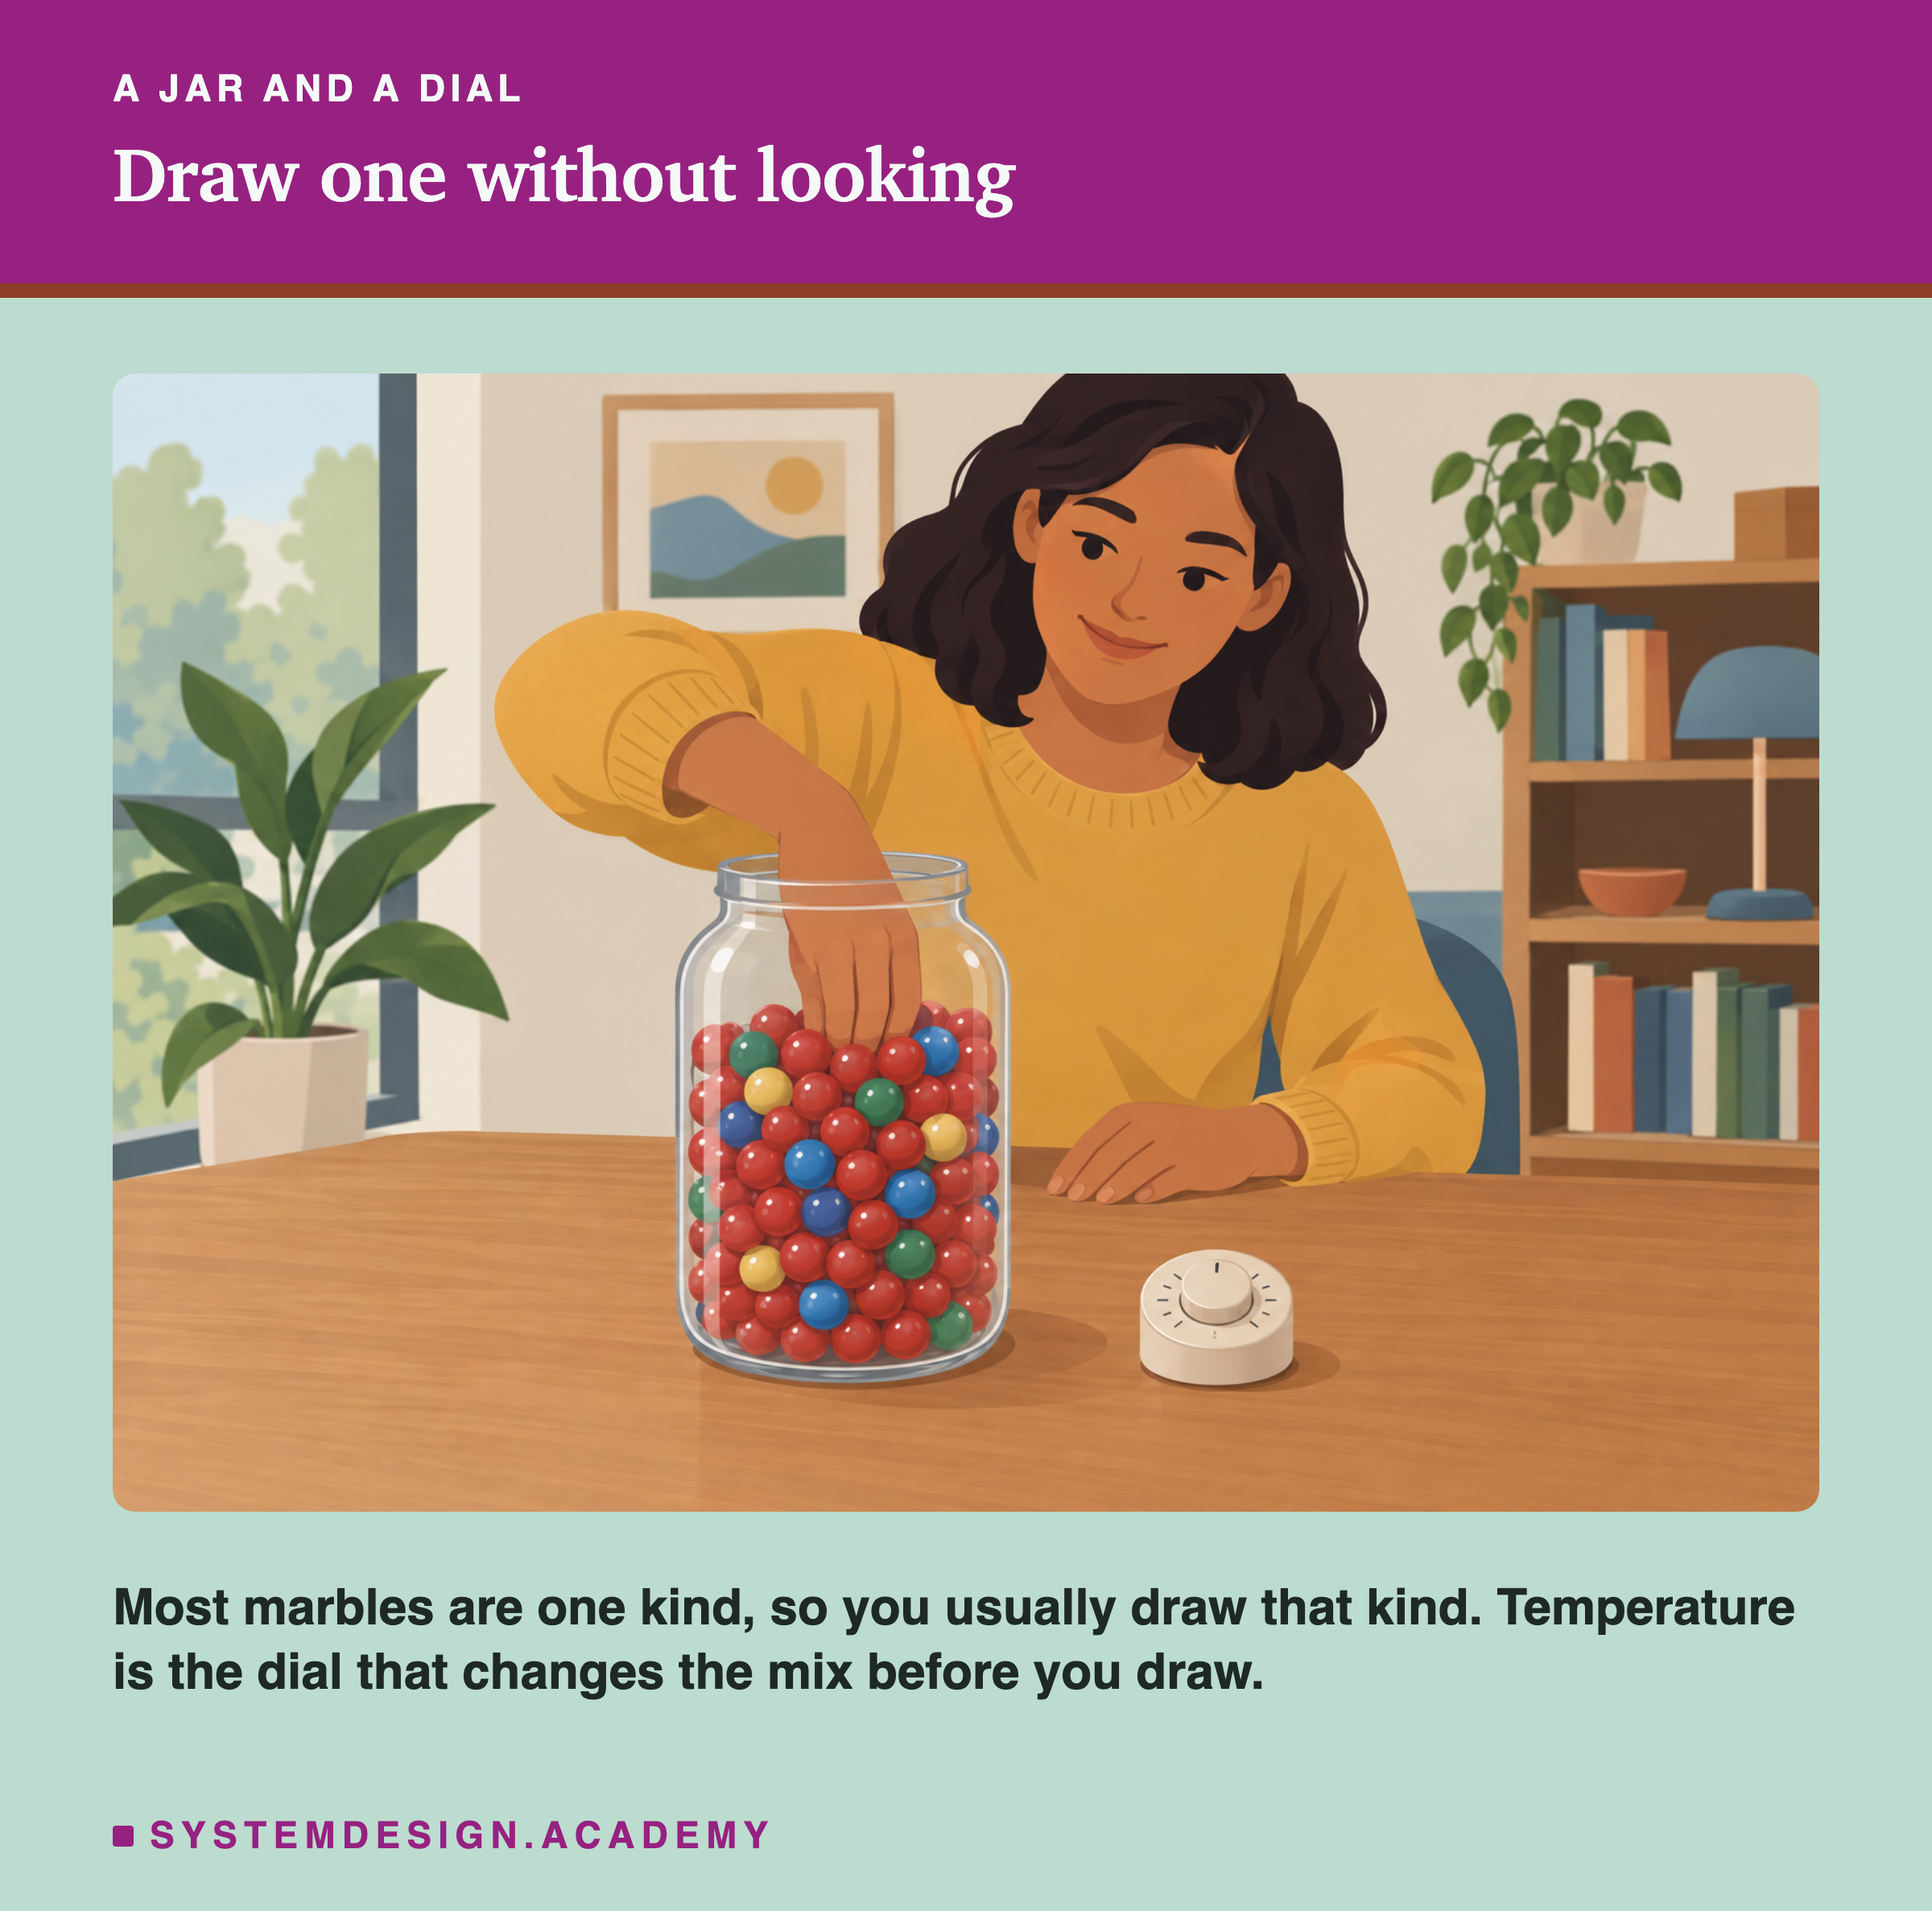
Picture a jar of marbles, mostly red, with a few blue, green and yellow. Reach in without looking and you will usually draw a red one. Now picture a dial that changes the mix before you draw: turn it one way and the jar becomes almost all red; turn it the other way and the colours even out.
Lesson 1 showed that a language model's output, at every step, is a list of odds for every possible next token. It never writes a word on its own. Something has to look at that list and choose one token, and then the model runs again on the text with that token added. The part that chooses is called the sampler, and it has settings. You have almost certainly met them already: the "temperature" slider in a chat playground, or a temperature field in an API request.
Those settings decide whether the same question gets the same answer every time or a different one, whether a reply stays sensible or turns into nonsense, and whether you can repeat a result later to check it. Many people copy a setting from an example, or leave it at a default they have never looked at. In this lesson I measure what each setting really does to the text a small model writes, and I work through the arithmetic by hand so that you can predict the effect before you touch the dial.
The Words You Need First
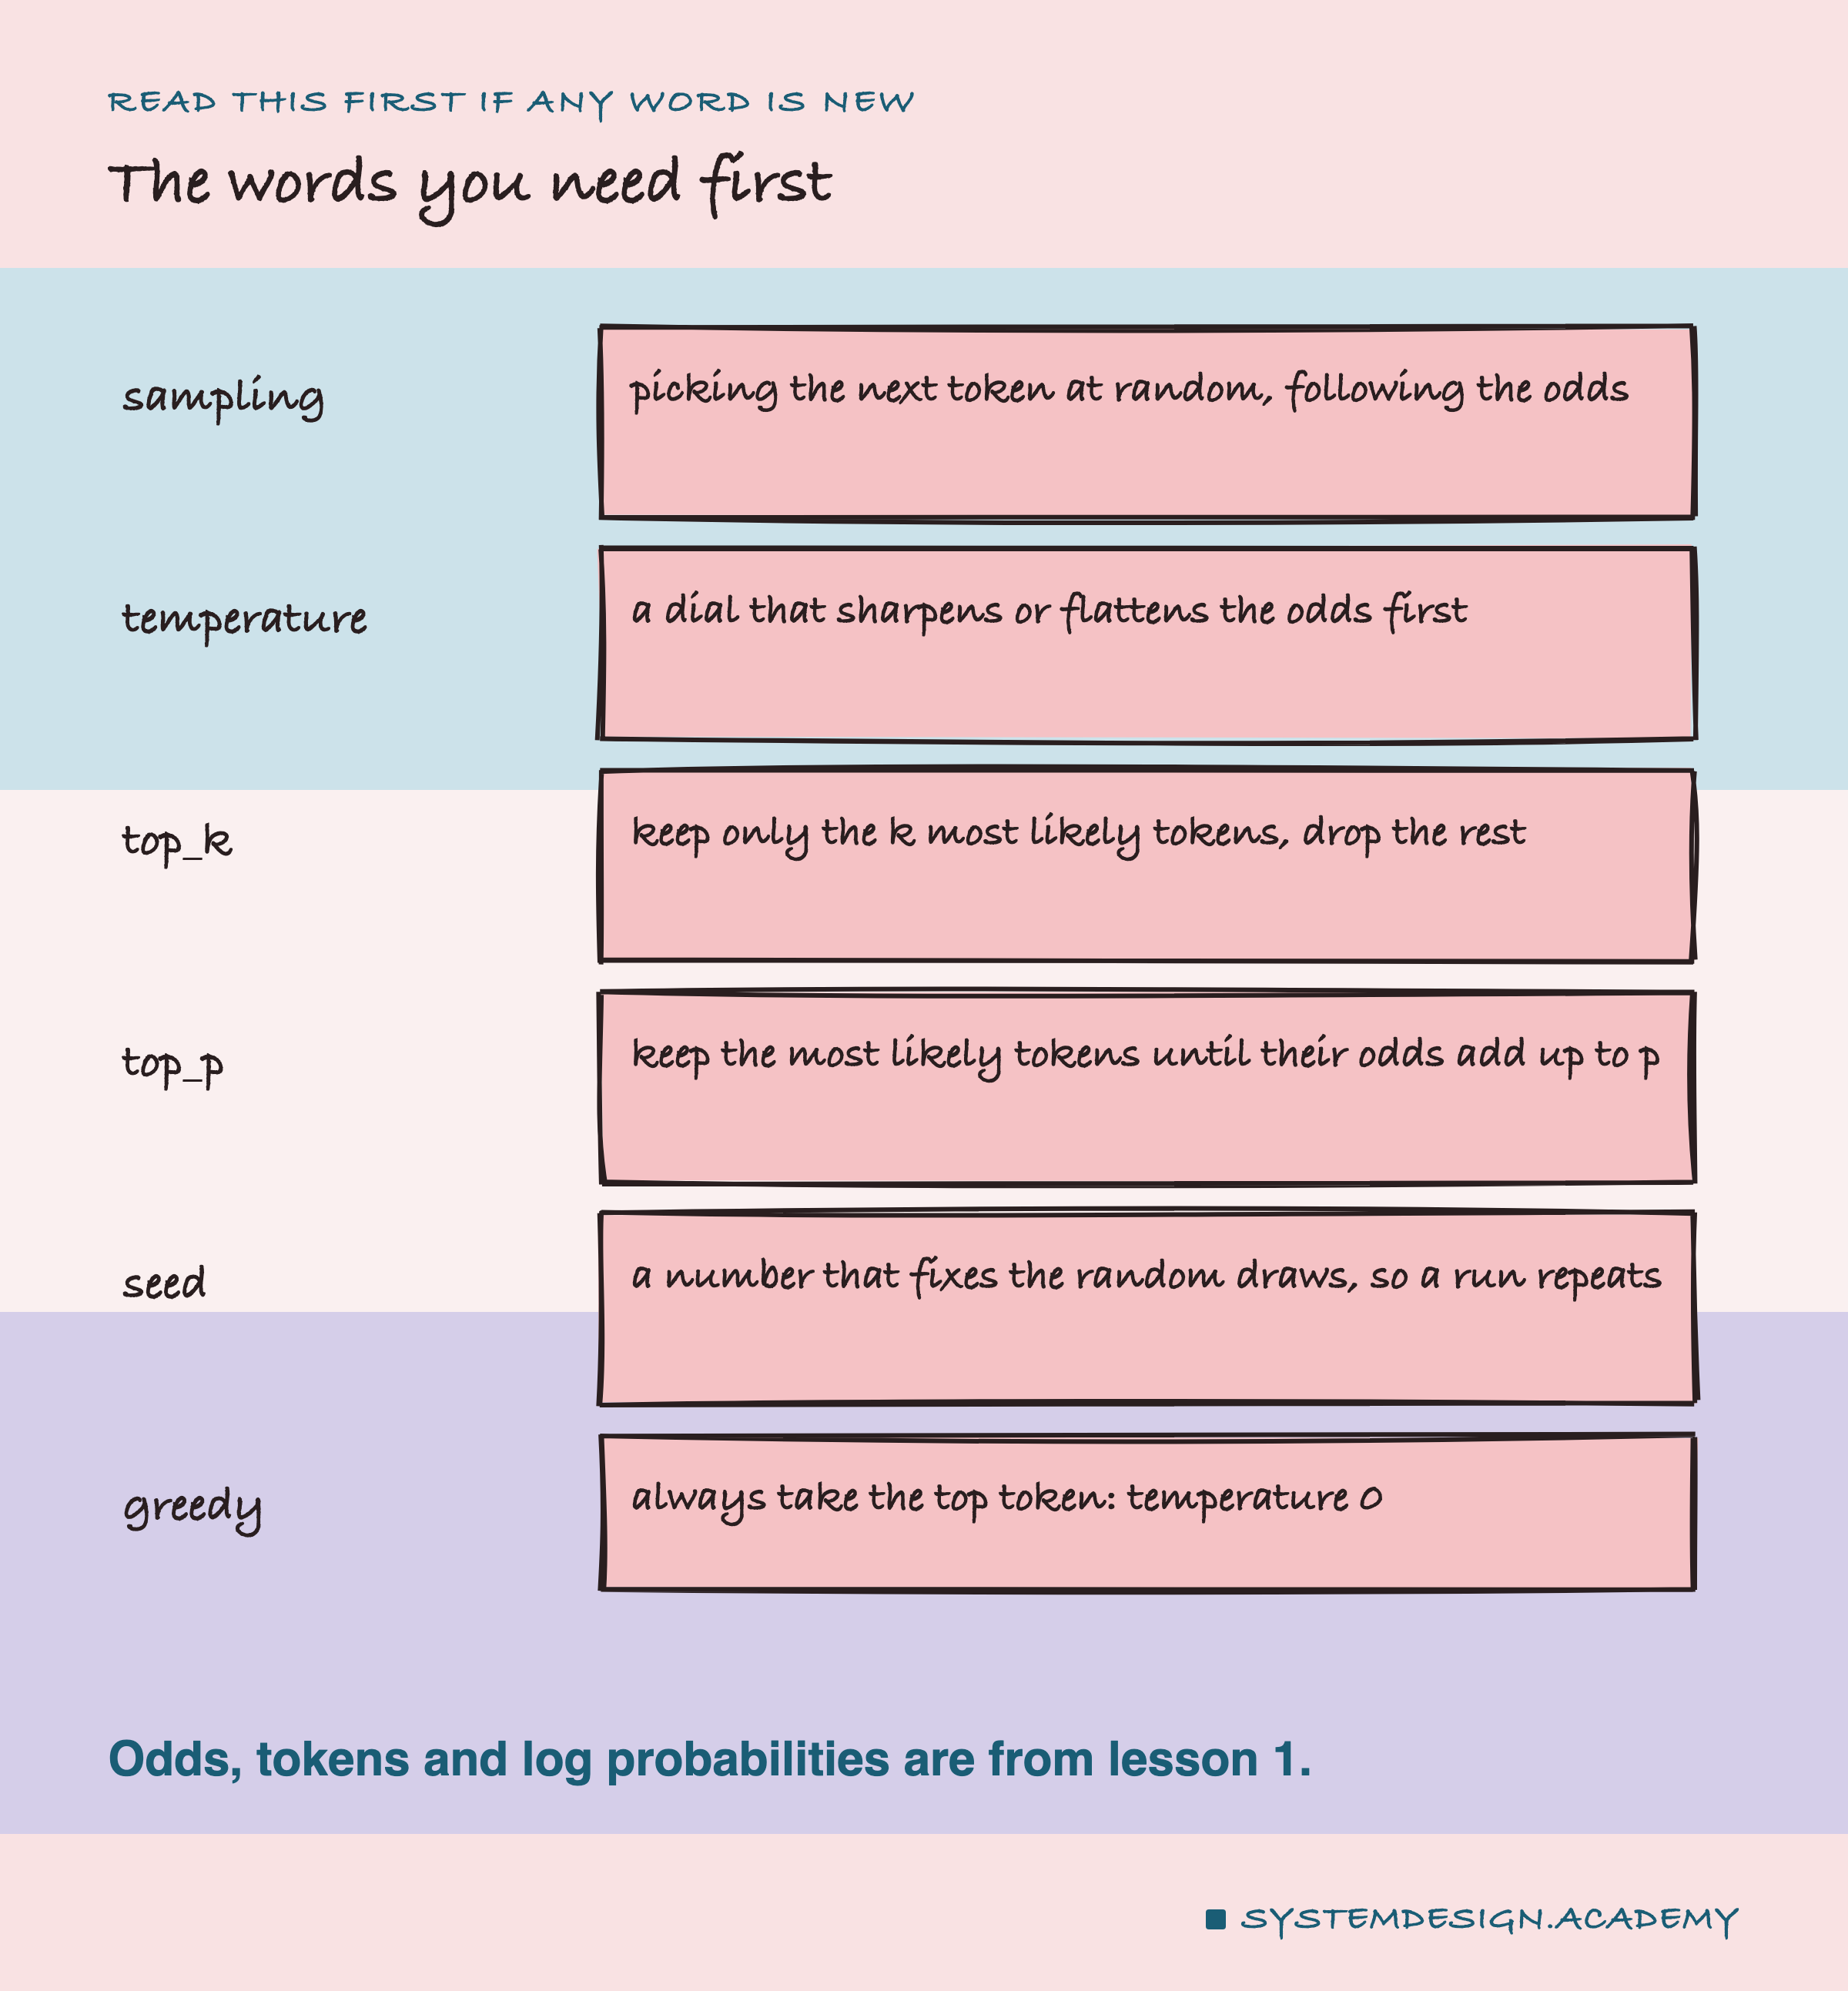
Sampling. Picking the next token at random, but following the odds, so likely tokens are picked more often. If a token has odds of 0.62, it is picked about 62 times in every 100 draws.
Temperature. A dial that sharpens or flattens the odds before the pick.
top_k. Keep only the k most likely tokens and drop the rest before the pick. k is a whole number, such as 5 or 40.
top_p. Keep the most likely tokens, in order, until their odds add up to p, and drop the rest. p is a number between 0 and 1.
Seed. A number that fixes the random draws, so the same run can be repeated exactly.
Greedy. Always take the single most likely token. Temperature 0 does this.
Log probability and odds mean the same as in lesson 1: odds are numbers from 0 to 1 that add up to 1 at each step, and a log probability is the same value written as its natural logarithm. Python's math.exp turns a log probability back into odds.
Filter. A step that removes some tokens before the draw, so they cannot be picked. top_k and top_p are the two filters in this lesson.
Rescale. Divide every number by their total, so that together they add up to 1 again.
␣ marks a space at the start of a token, as in lesson 1. "␣Paris" is the token " Paris".
Why a Sampler Is Needed at All
The simplest way to choose is to always take the top token. That is called greedy choosing, and it has two useful properties: it is fast, and it gives the same answer every time you ask the same question. For a fact, a classification or a number, that is exactly what you want.
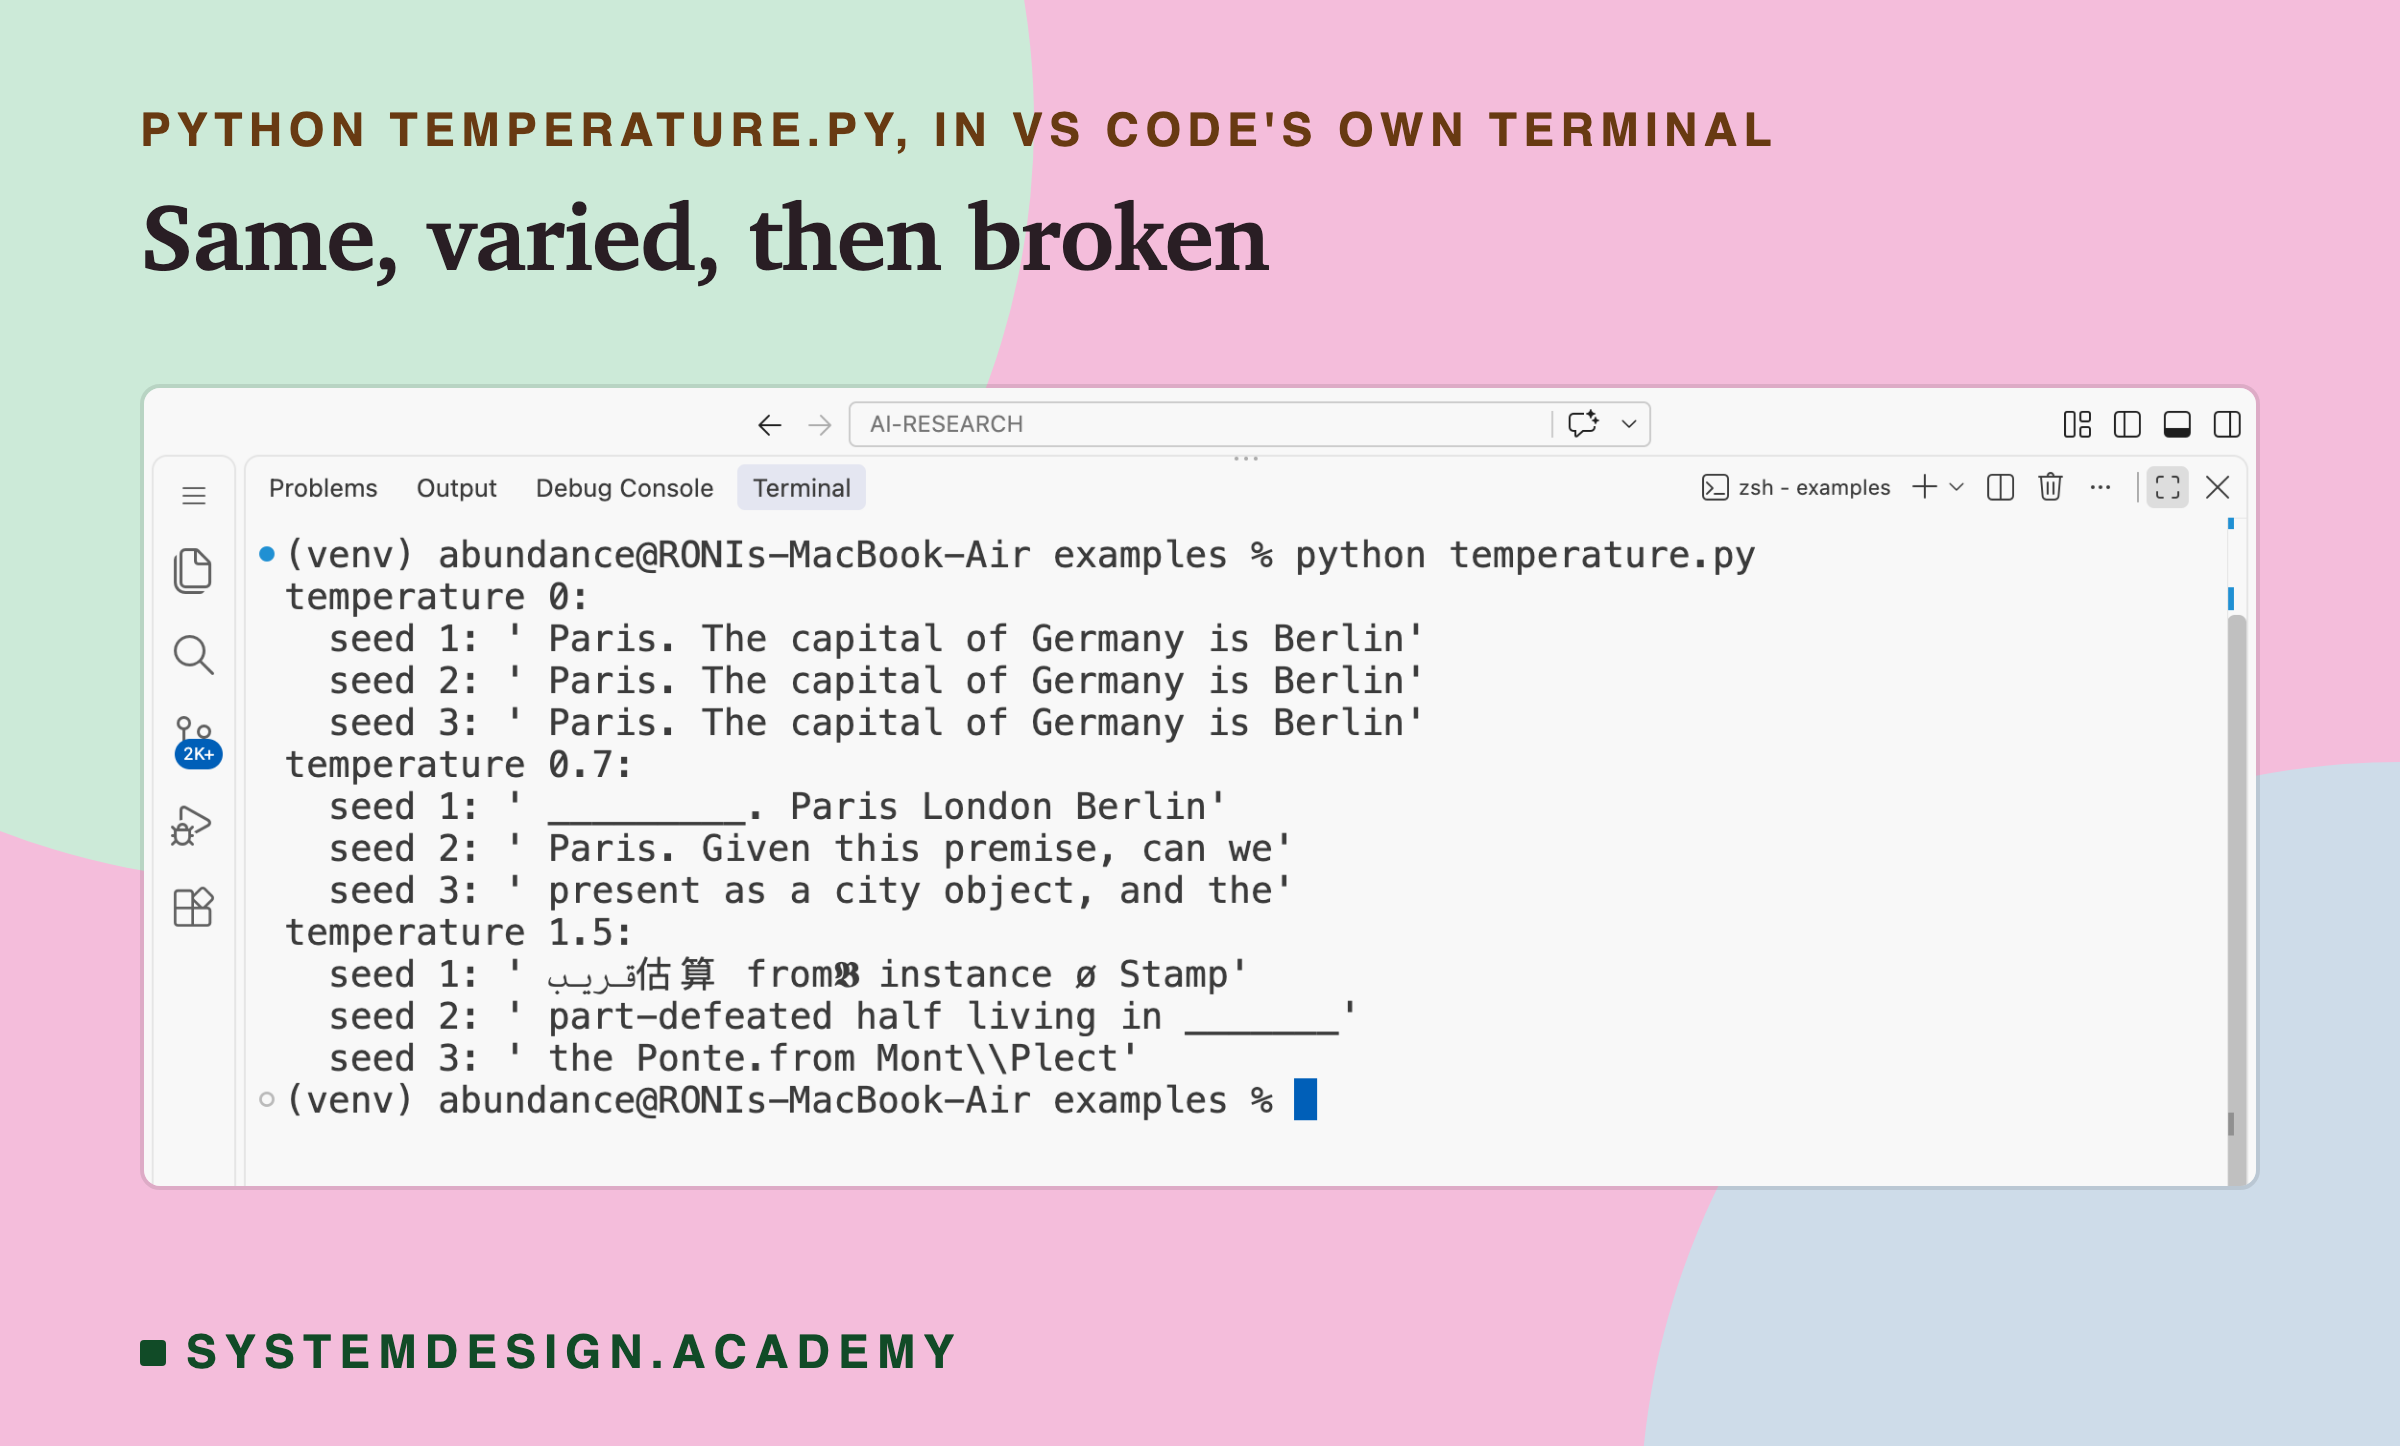
It also has a cost. A model that always takes its top token can only ever write one text for a given prompt. Ask it for five different product names, and it gives the same name five times. Ask it to write a story, and every story starts the same way. You will see this below: at temperature 0, all 40 runs of every prompt wrote exactly the same 12 tokens, even though each run had a different seed.
Greedy text can also drift in its own predictable way. Continuing "The capital of France is", the model wrote "Paris. The capital of Germany is Berlin". That is not wrong, but it is not what anyone asked for. The model took the likeliest token each time. In the text the model learned from, one capital city is often followed by another, so that is where the likeliest path led.
So the sampler draws at random instead, following the odds. Most of the time it still picks a likely token, but now and then it picks a less likely one, and the text branches. The settings in this lesson control how often it does that, and how far down the list it is allowed to reach.
Try It: One Prompt, Three Temperatures
This file asks the same model to continue "The capital of France is" at three temperatures, with three different seeds each. Here it is, open in my VS Code.
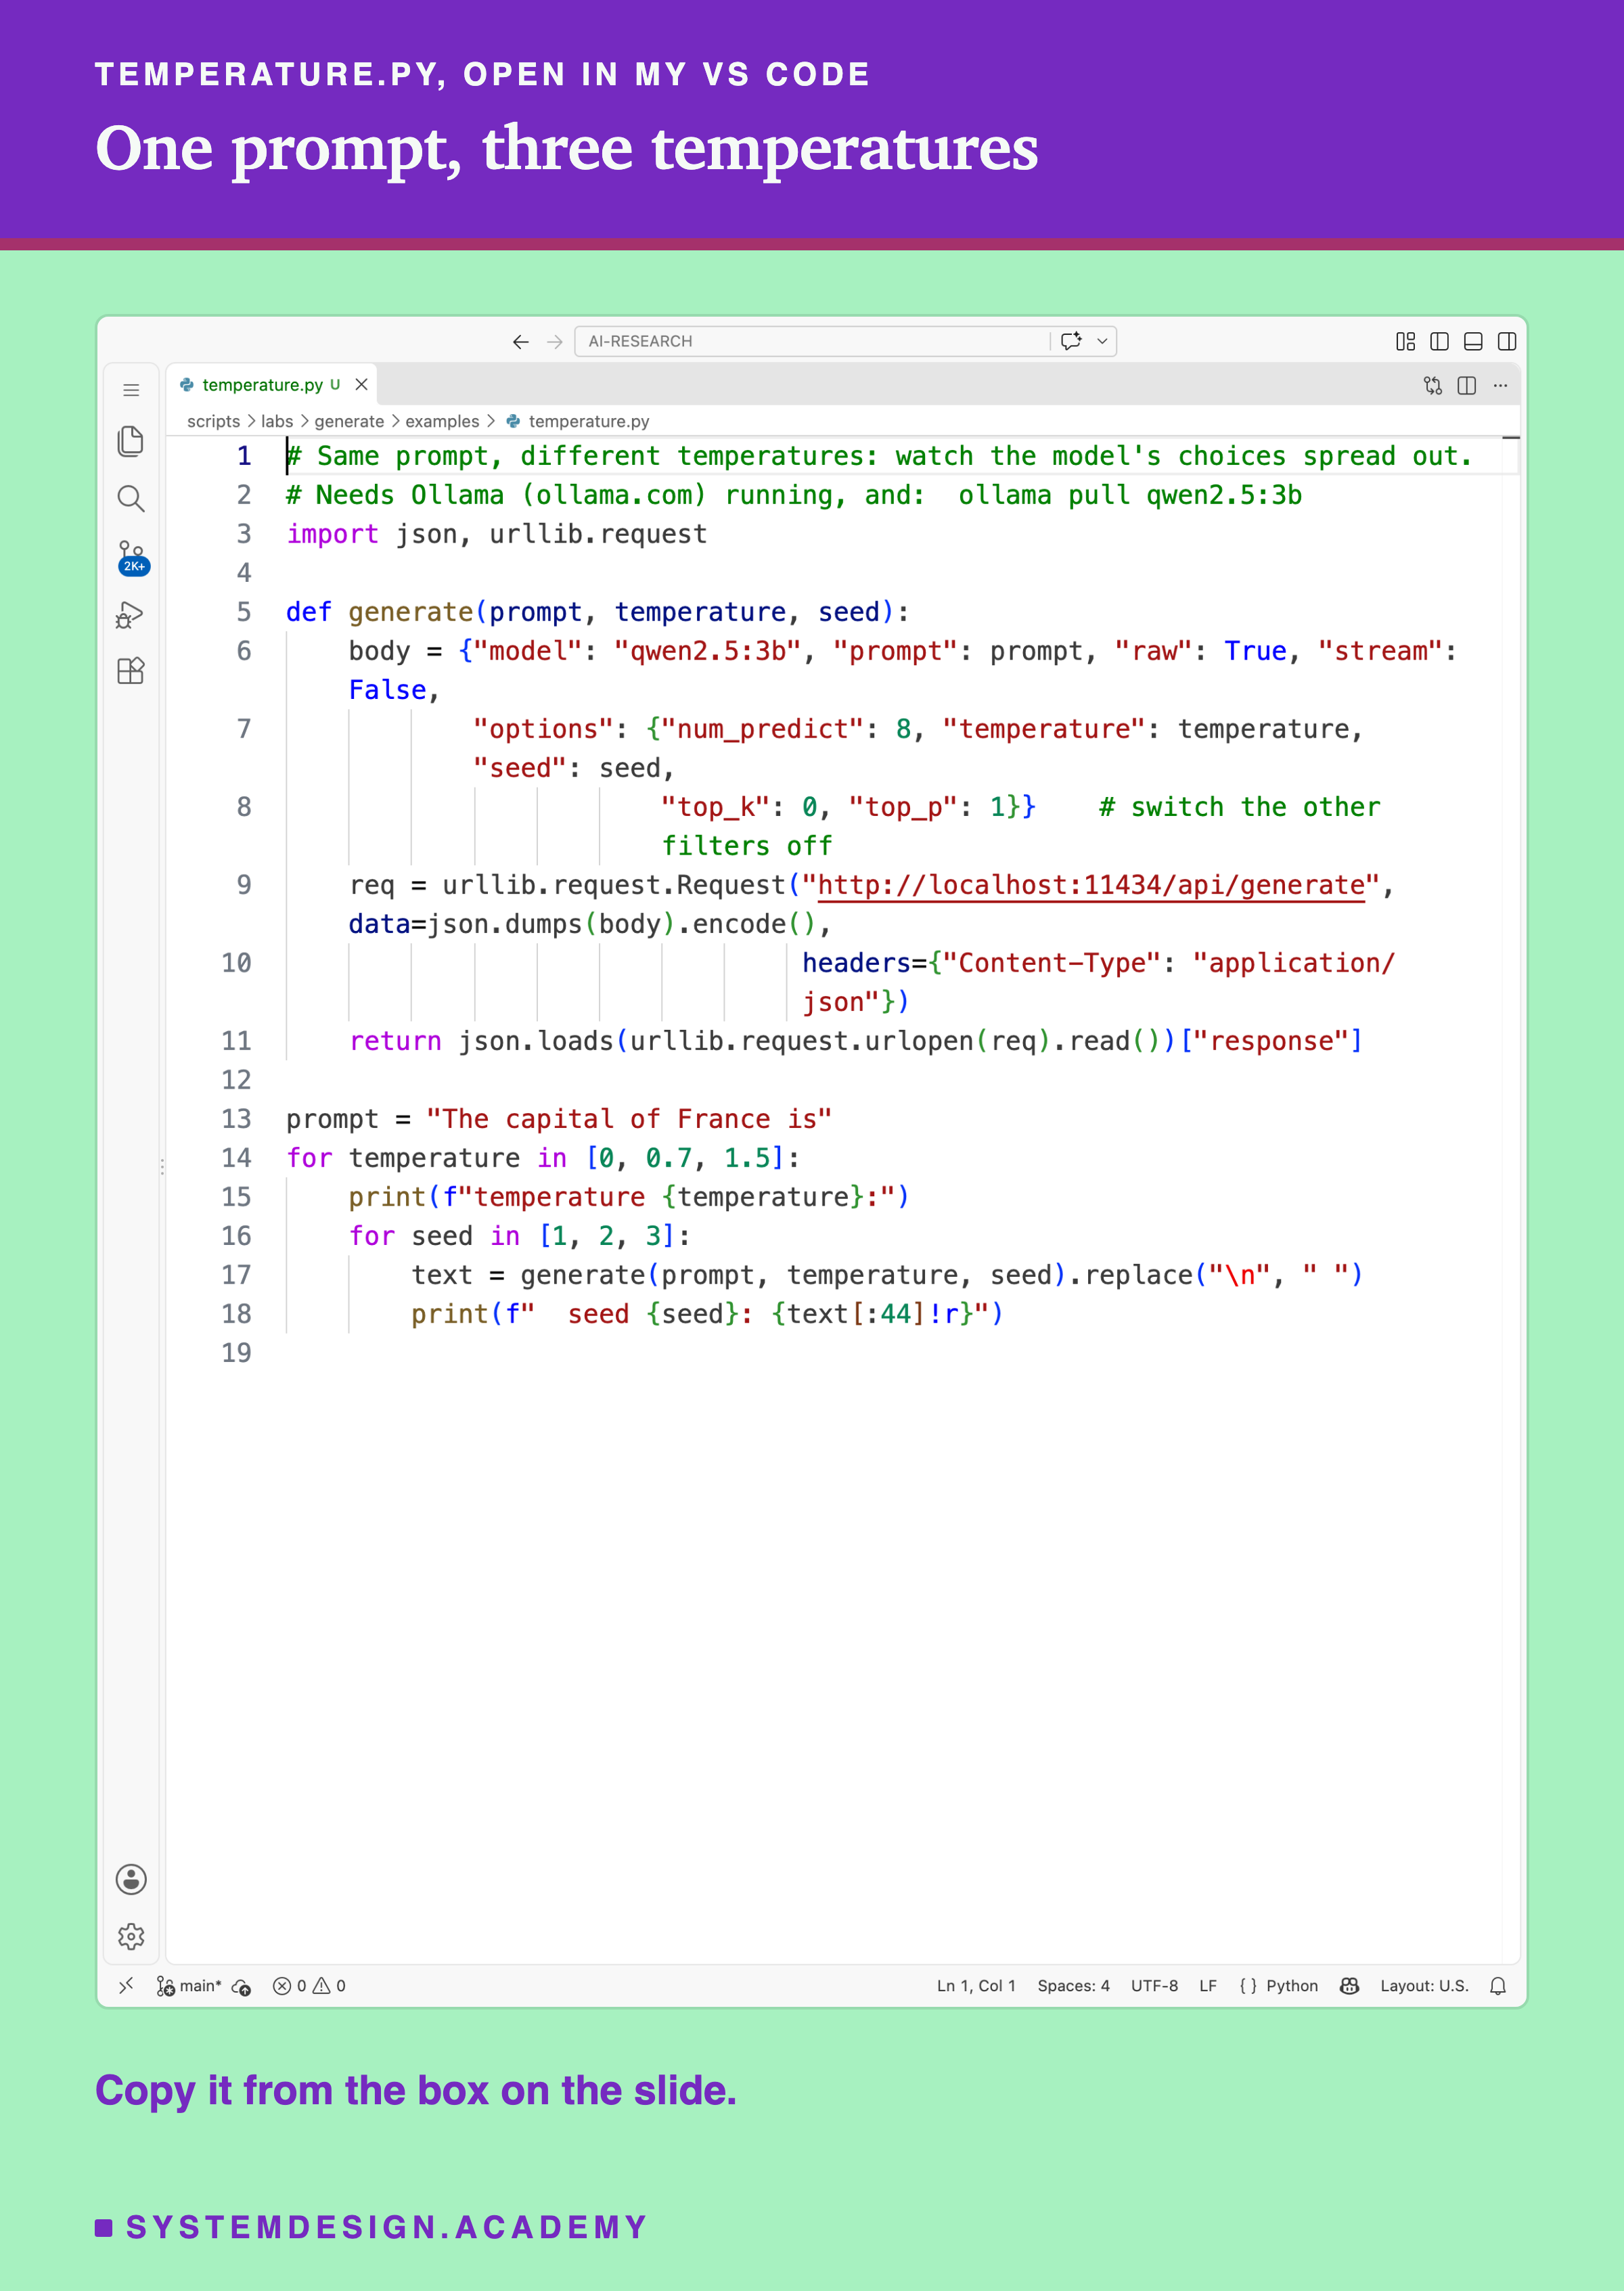
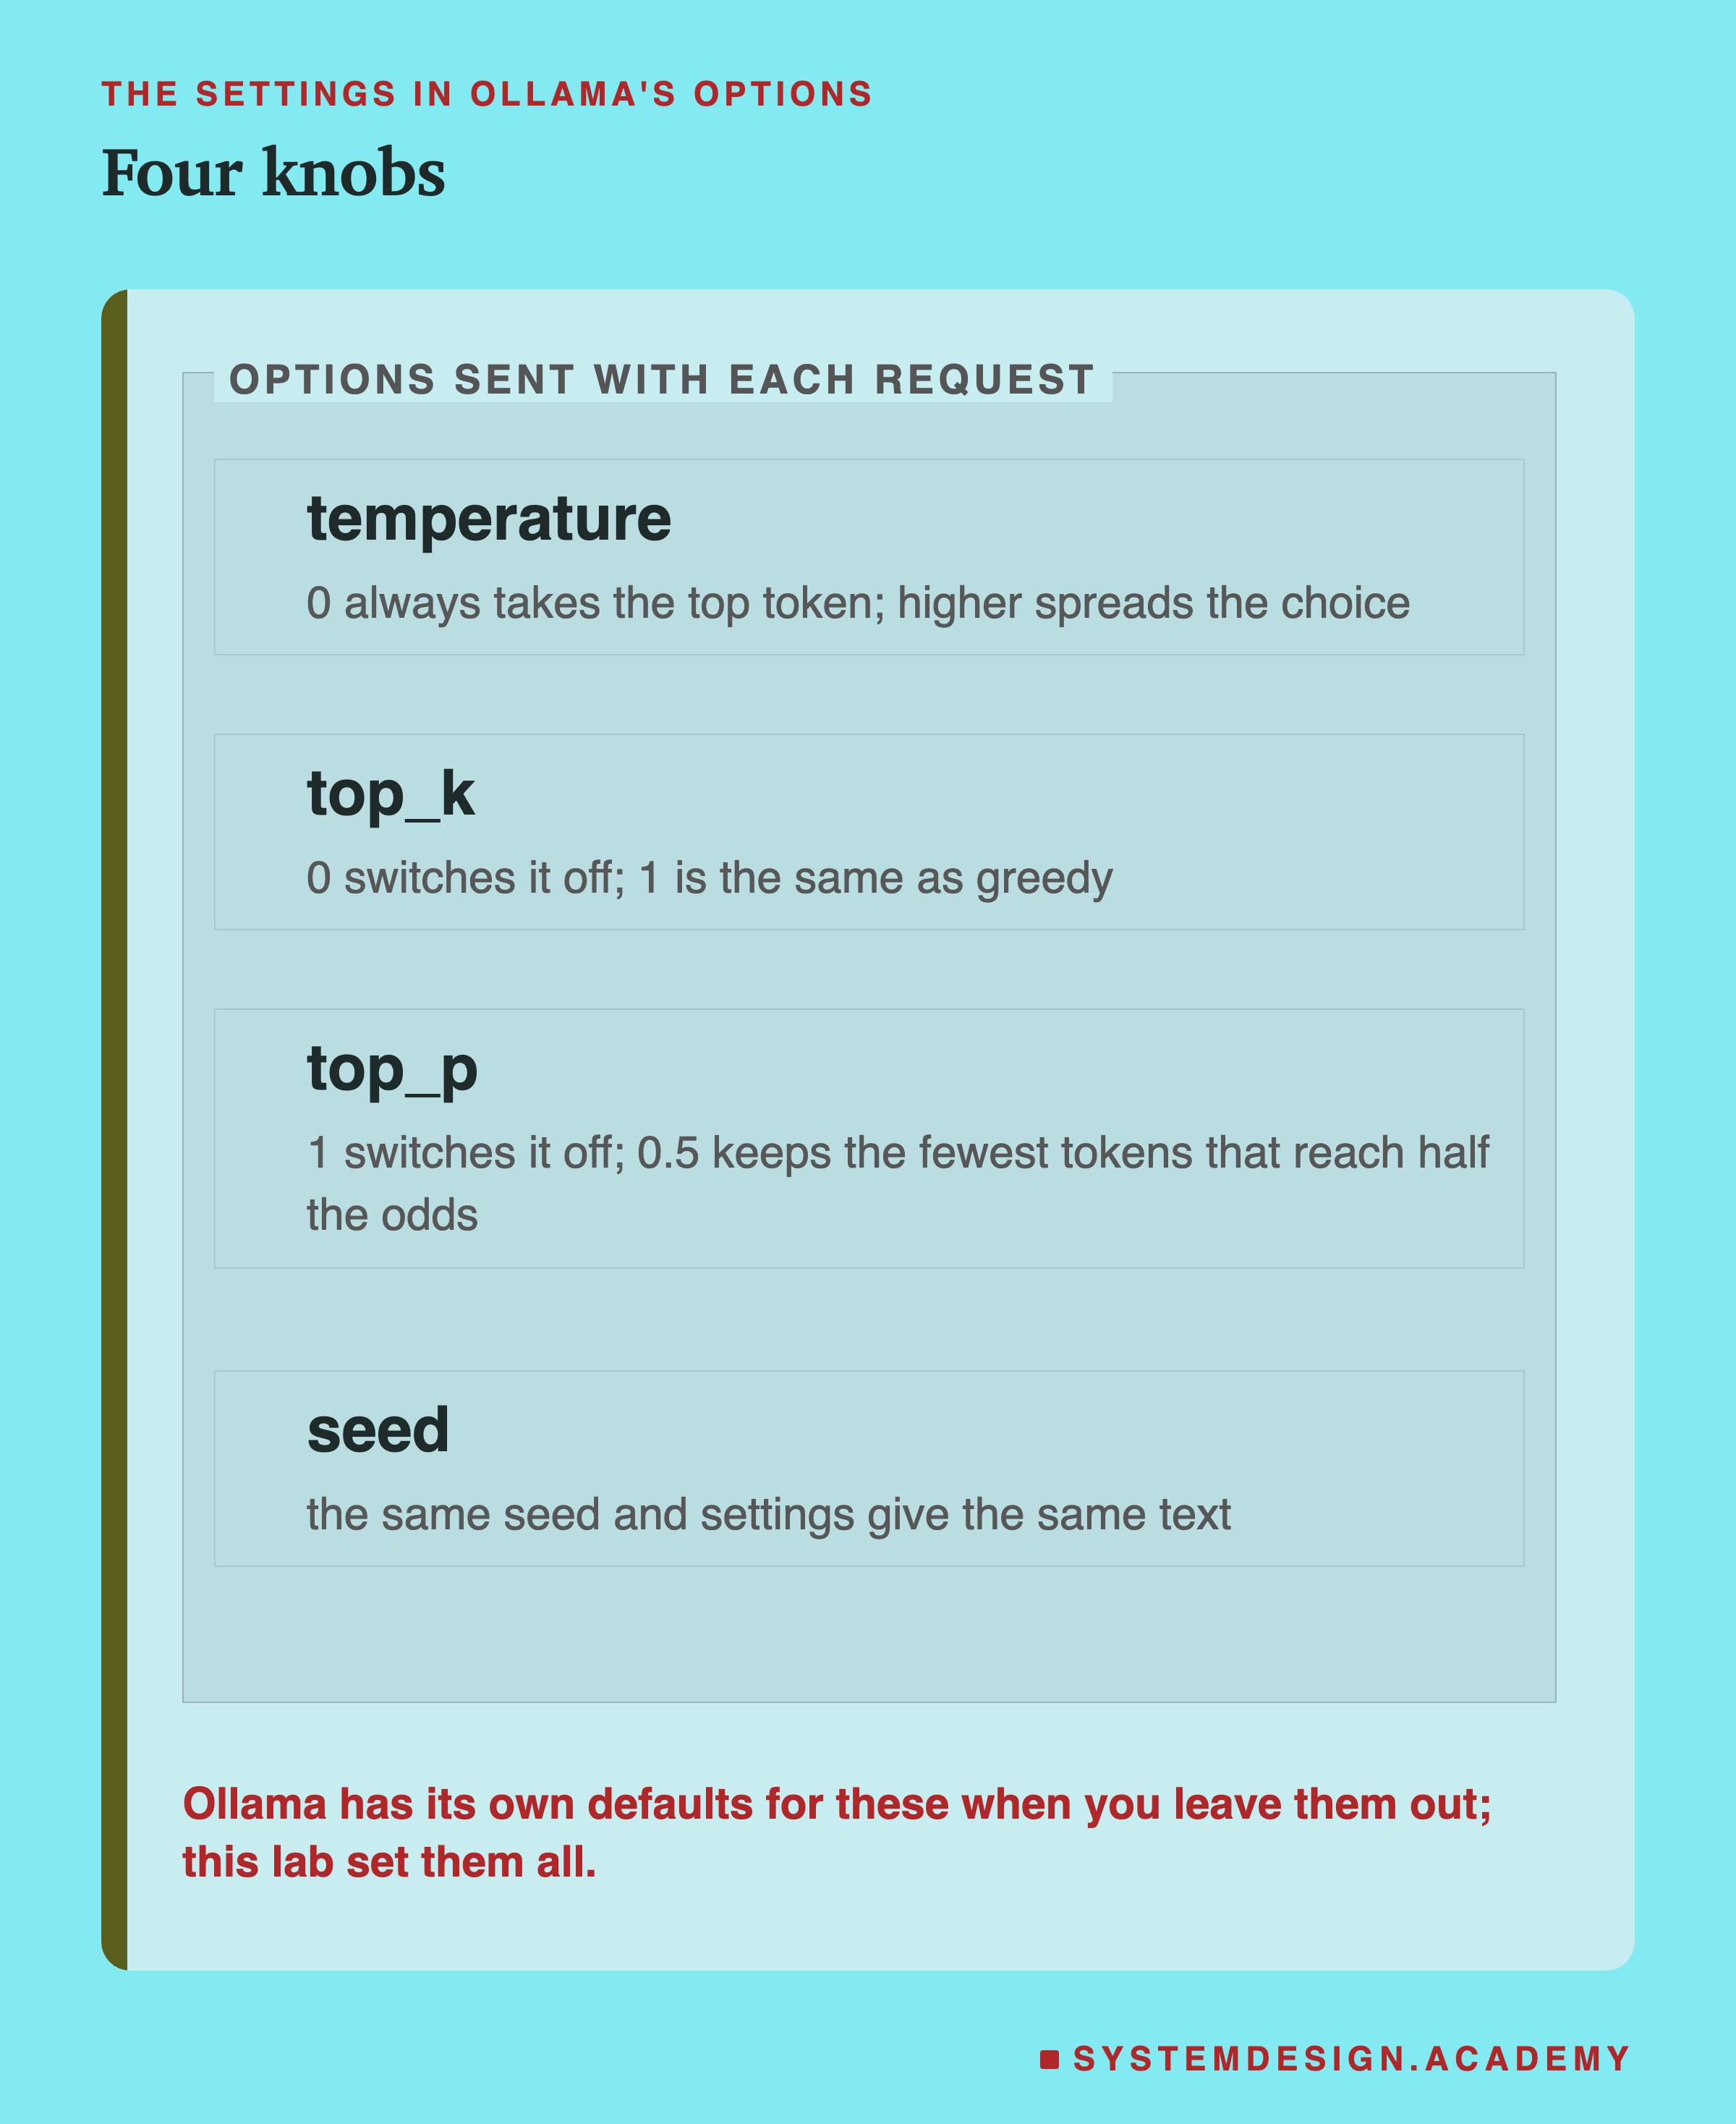
The file has three parts. The generate function sends one request to Ollama. Its options carry the sampler settings: num_predict is how many tokens to write (8 here), temperature and seed come from the loop, and top_k 0 and top_p 1 switch the two filters off, so that temperature is the only thing changing. "raw": True sends the text as it is, without a chat template, as in lesson 1. The two loops at the bottom run every temperature with seeds 1, 2 and 3, and print the first 44 characters of each reply.
And this is what it printed:
What Temperature Does to the Odds
Temperature changes the odds before the draw. The rule is short: divide each token's log probability by the temperature, turn the results back into ordinary numbers, and rescale them so they add up to 1 again.
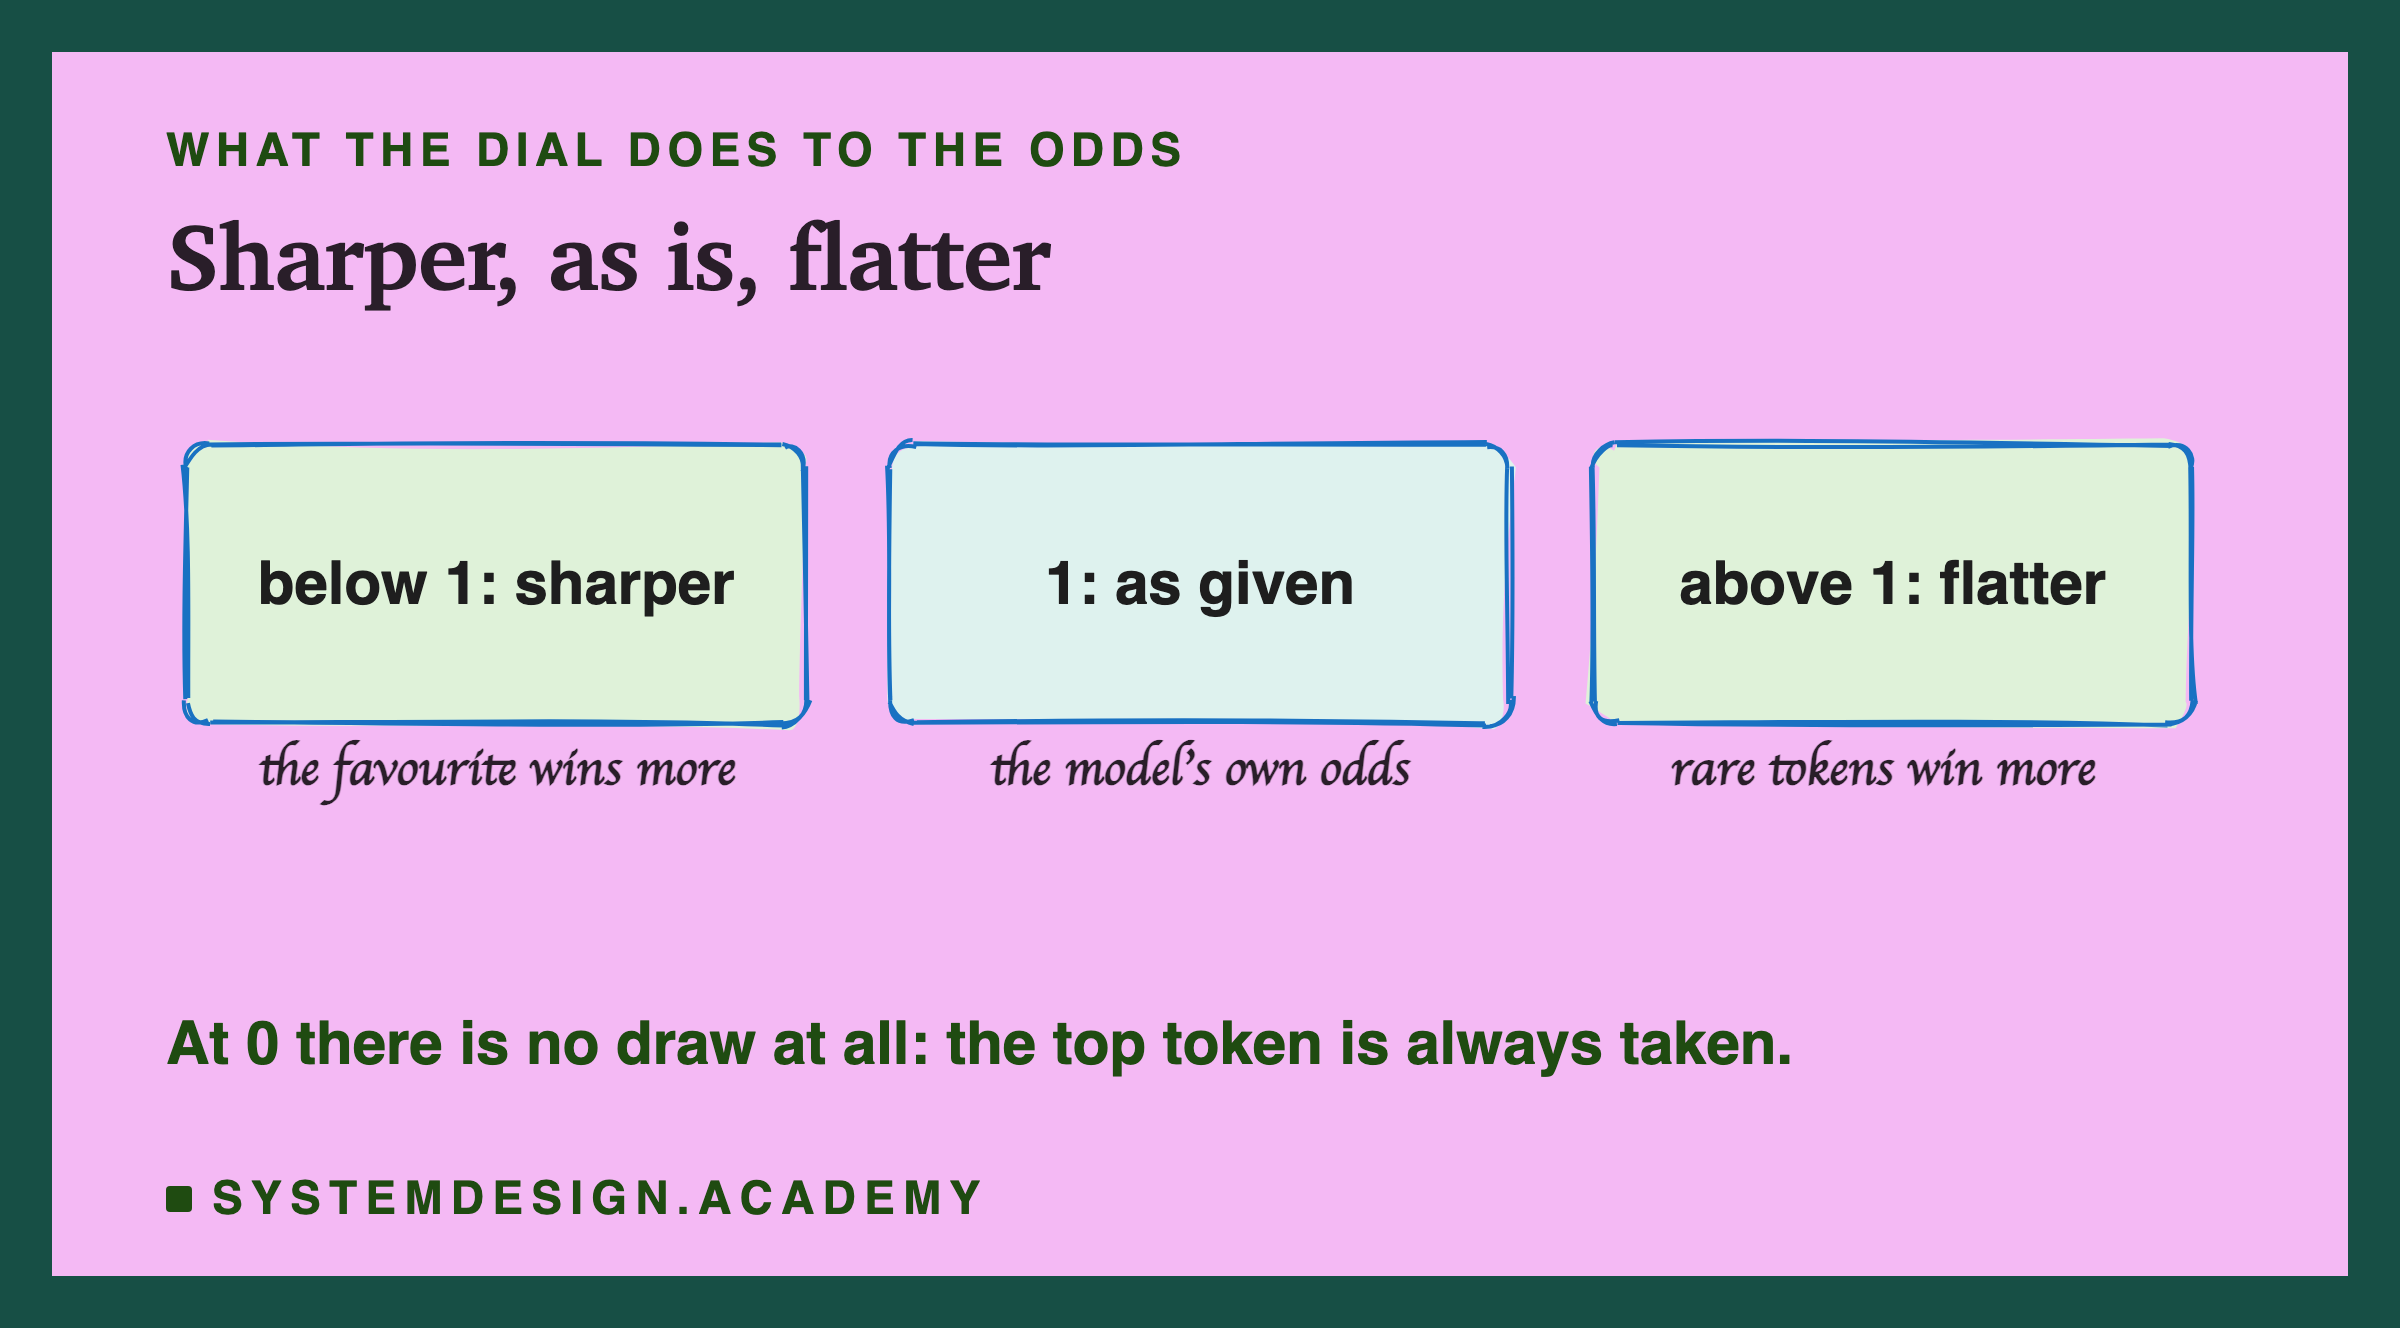
There is a simpler way to say the same thing, using one rule about logarithms: dividing a log by a number is the same as taking a root, and multiplying a log by a number is the same as taking a power. So dividing a log probability by T is the same as raising the probability to the power 1 ÷ T. At T = 0.5 that power is 1 ÷ 0.5 = 2, so every probability is squared. At T = 2 the power is 1 ÷ 2, so every probability is replaced by its square root. Squaring makes big numbers much bigger than small ones; square roots bring them closer together. That is all temperature is.
At exactly 1, dividing by 1 changes nothing: you draw from the model's own odds. At 0 you cannot divide by zero, so samplers treat 0 as a special case and simply take the top token. That is why temperature 0 and greedy choosing mean the same thing.
Here is that arithmetic applied to the real odds from lesson 1:
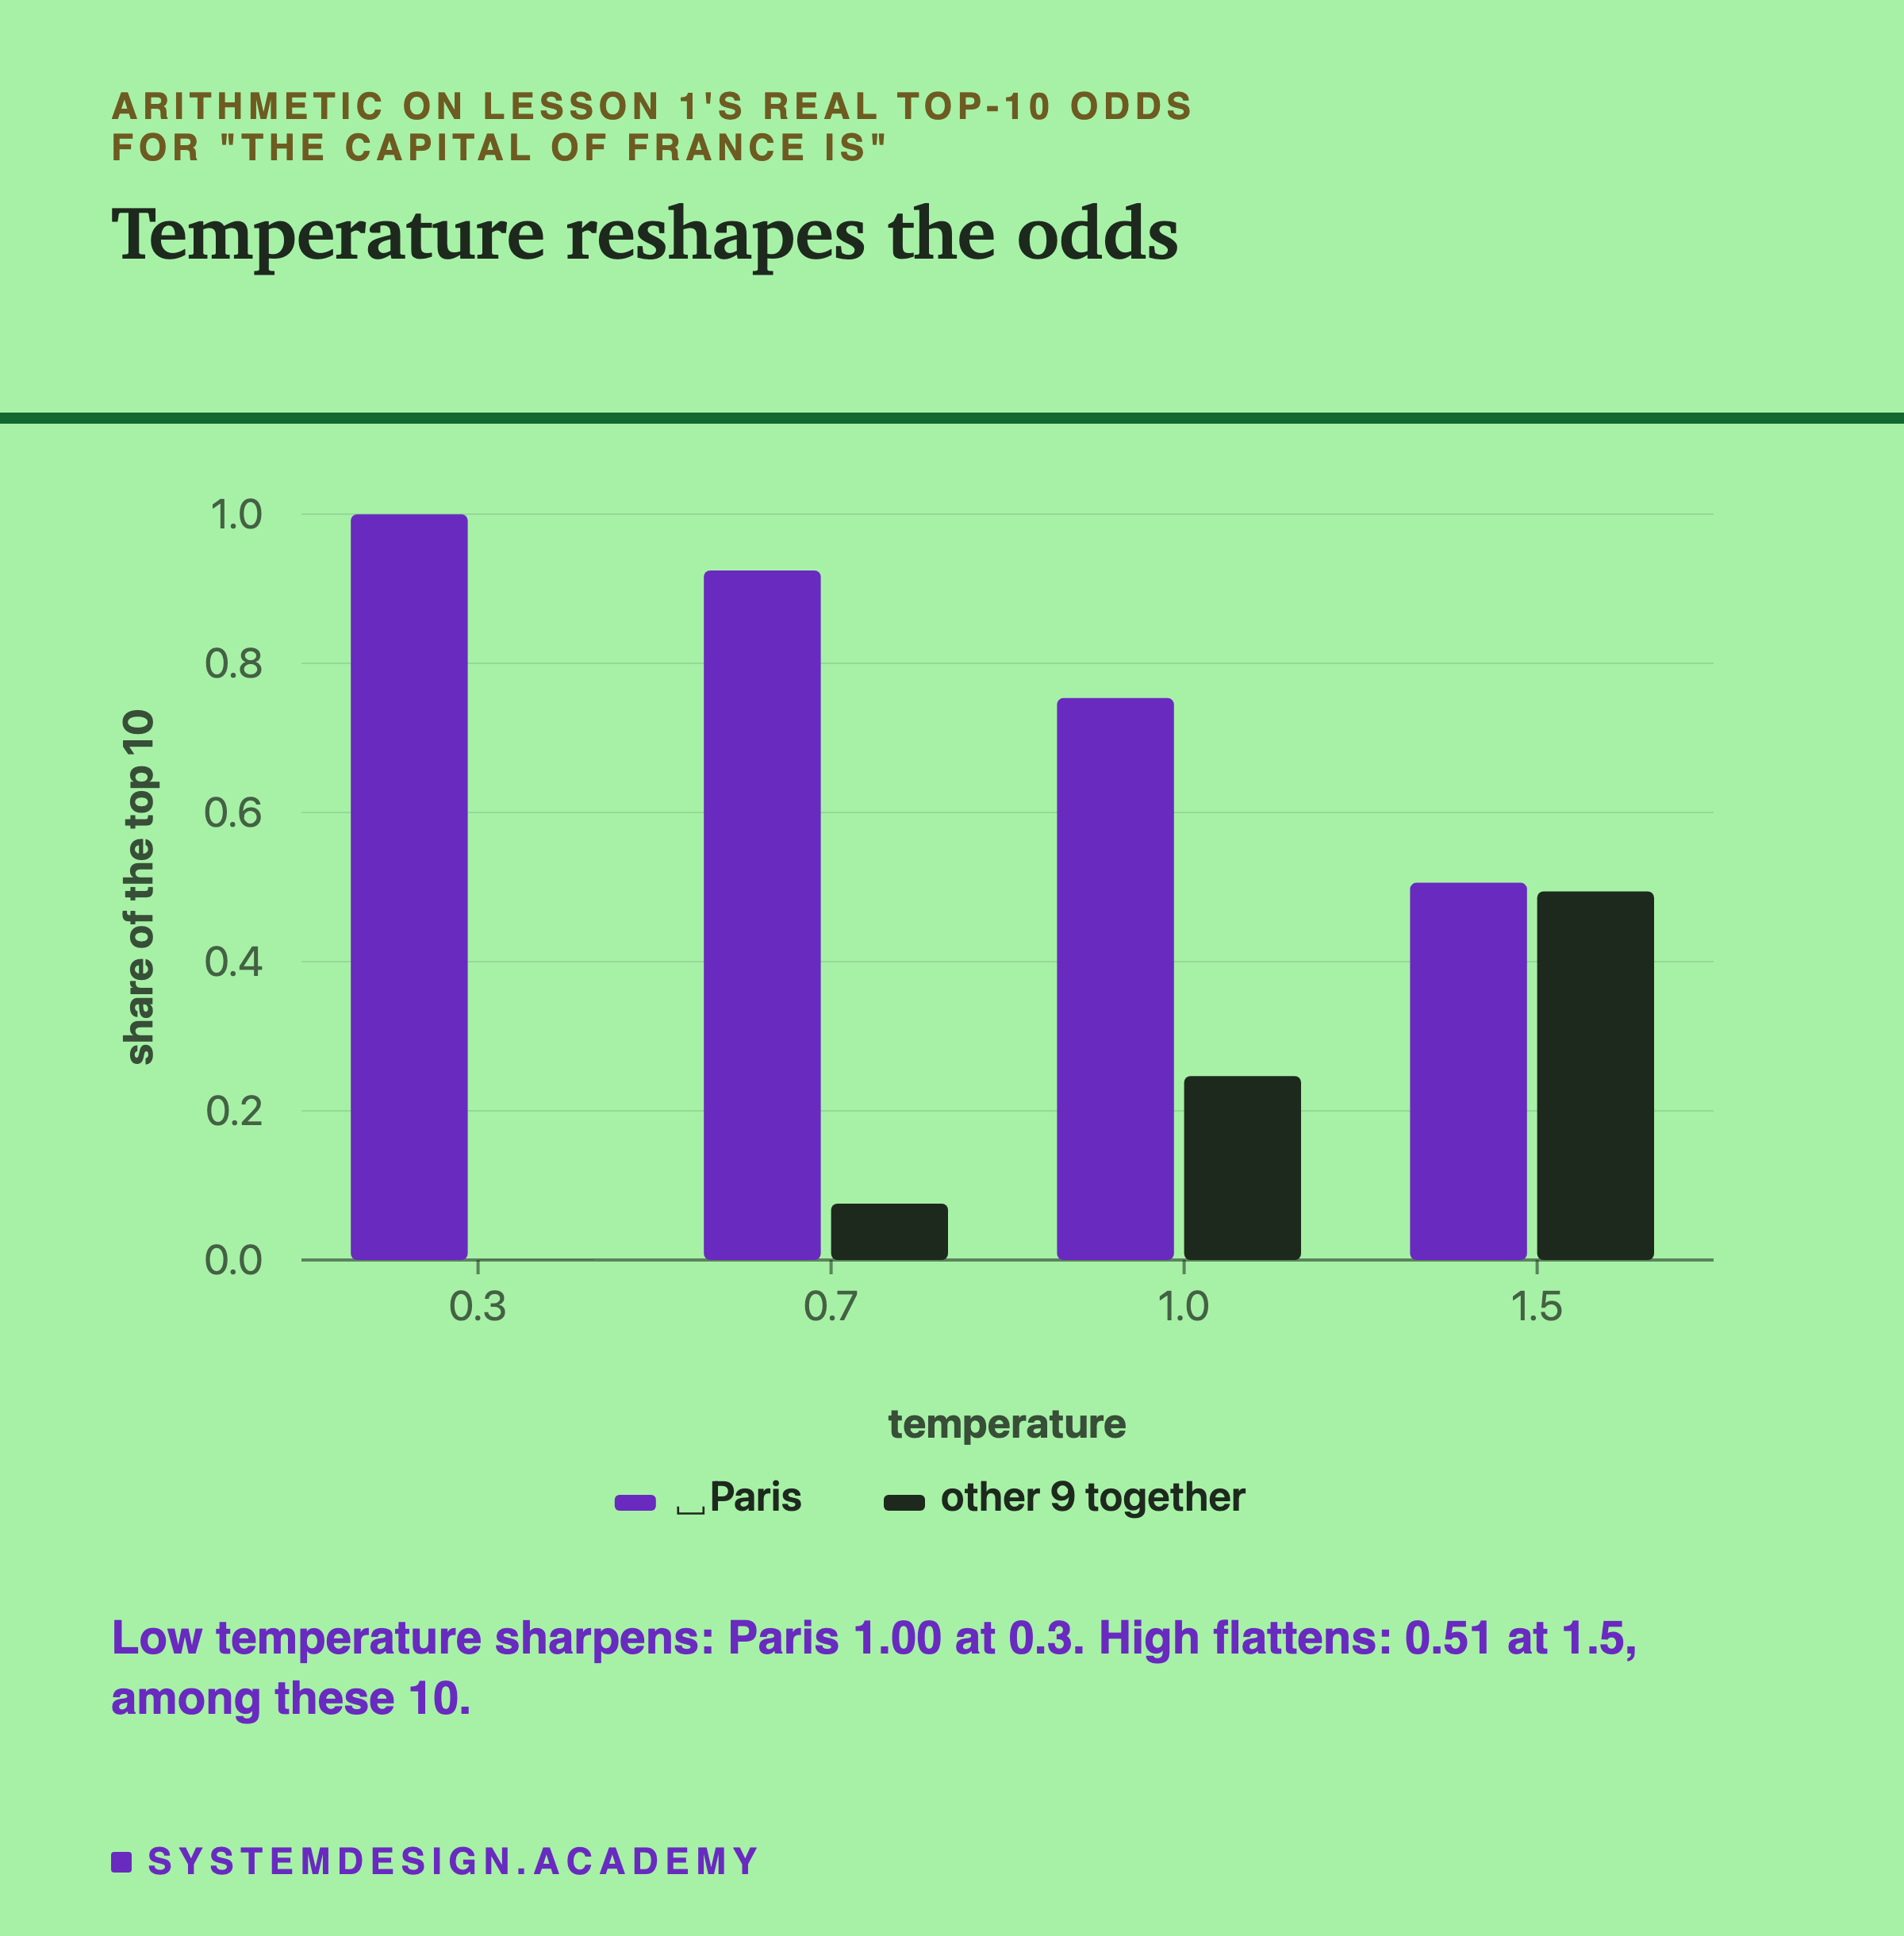
- At 0.3, Paris takes almost all of it.
- At 1.0, the odds are the model's own. Among these top 10, Paris has 0.75.
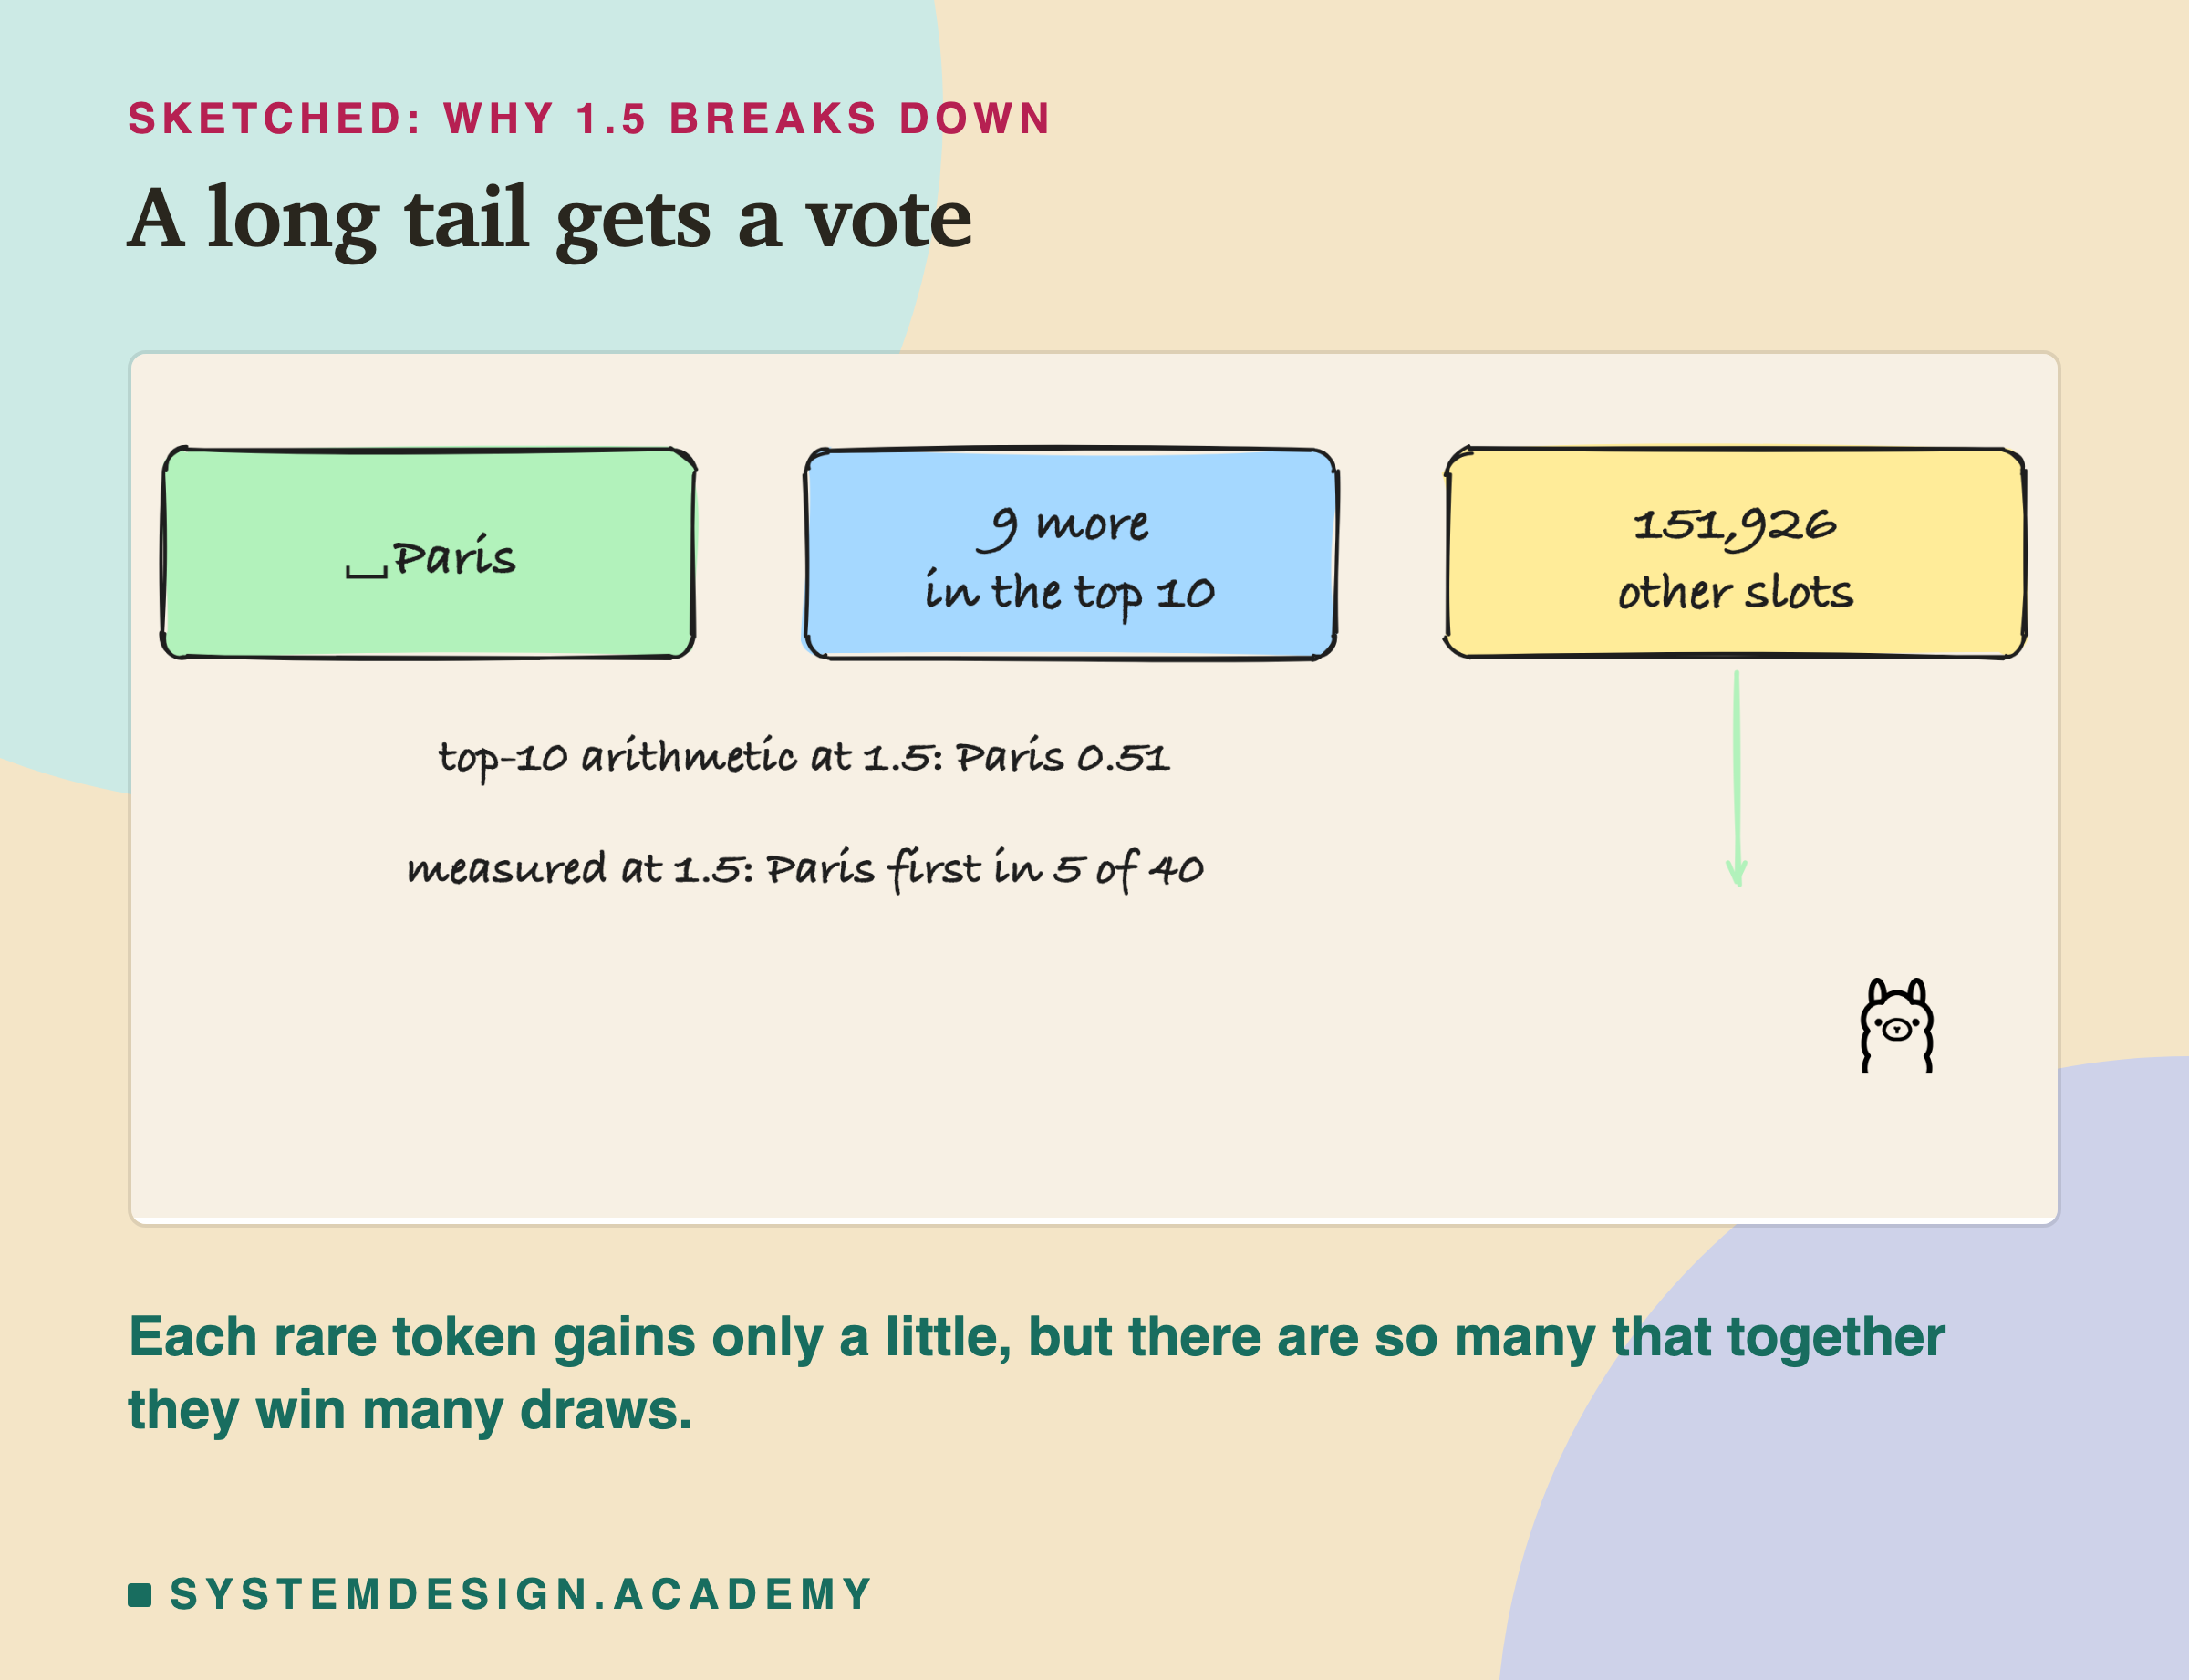
- At 1.5, Paris drops to about half, and the others share the rest.
Those shares come from doing exactly that: take each of the 10 probabilities, raise it to the power 1 ÷ T, add the ten results, and divide each one by that total. At 0.7 Paris ends up with 0.92 of the ten; at 1.5 with 0.51.
This is arithmetic on only the top 10 tokens. The model's full list has 151,936 slots, and almost all of them hold tokens with tiny odds. With all of them included, the effect at 1.5 is much stronger, as the measurements below show.
Temperature, Worked by Hand
Take just two of the tokens from lesson 1, after "The capital of France is": "␣Paris" with odds 0.6219, and a blank "␣__" with odds 0.0434. Paris is 0.6219 ÷ 0.0434 = 14.33 times as likely as the blank, about 14 times.
Temperature 0.5. Square both: 0.6219 × 0.6219 is about 0.387, and 0.0434 × 0.0434 is about 0.0019. Now Paris is 0.387 ÷ 0.0019, about 205 times as likely as the blank. That is the ratio squared: 14.33 × 14.33 is about 205. The favourite pulls far ahead.
Temperature 2. Take square roots: the square root of 0.6219 is about 0.789, and of 0.0434 about 0.208. Now Paris is only 0.789 ÷ 0.208, about 3.8 times as likely. That is the square root of 14.33. The two are much closer.
After this step the numbers are rescaled so that all of them add up to 1 again. With only these two tokens, at temperature 0.5 the total is 0.387 + 0.0019 = 0.389, so Paris becomes 0.387 ÷ 0.389, about 0.995, and the blank about 0.005. Rescaling divides every number by the same total, so the ratio between any two tokens stays as it was. The ratio is what matters when you draw.
This also explains the jump from 1.0 to 1.5 in the measurements. At a high temperature, every one of the many thousands of very unlikely tokens moves a little closer to the favourite. Each one alone is still unlikely, but there are so many of them that, together, they win a large share of the draws. The group of all these unlikely tokens is often called the long tail of the list.
If you prefer to see it with the log probabilities that Ollama returns: Paris has log probability −0.475 and the blank −3.137. At temperature 0.5 they become −0.95 and −6.27, twice as far apart as before, which is the same as squaring the ratio of the odds; at temperature 2 they become −0.24 and −1.57, half as far apart.
Where the Sampler Sits
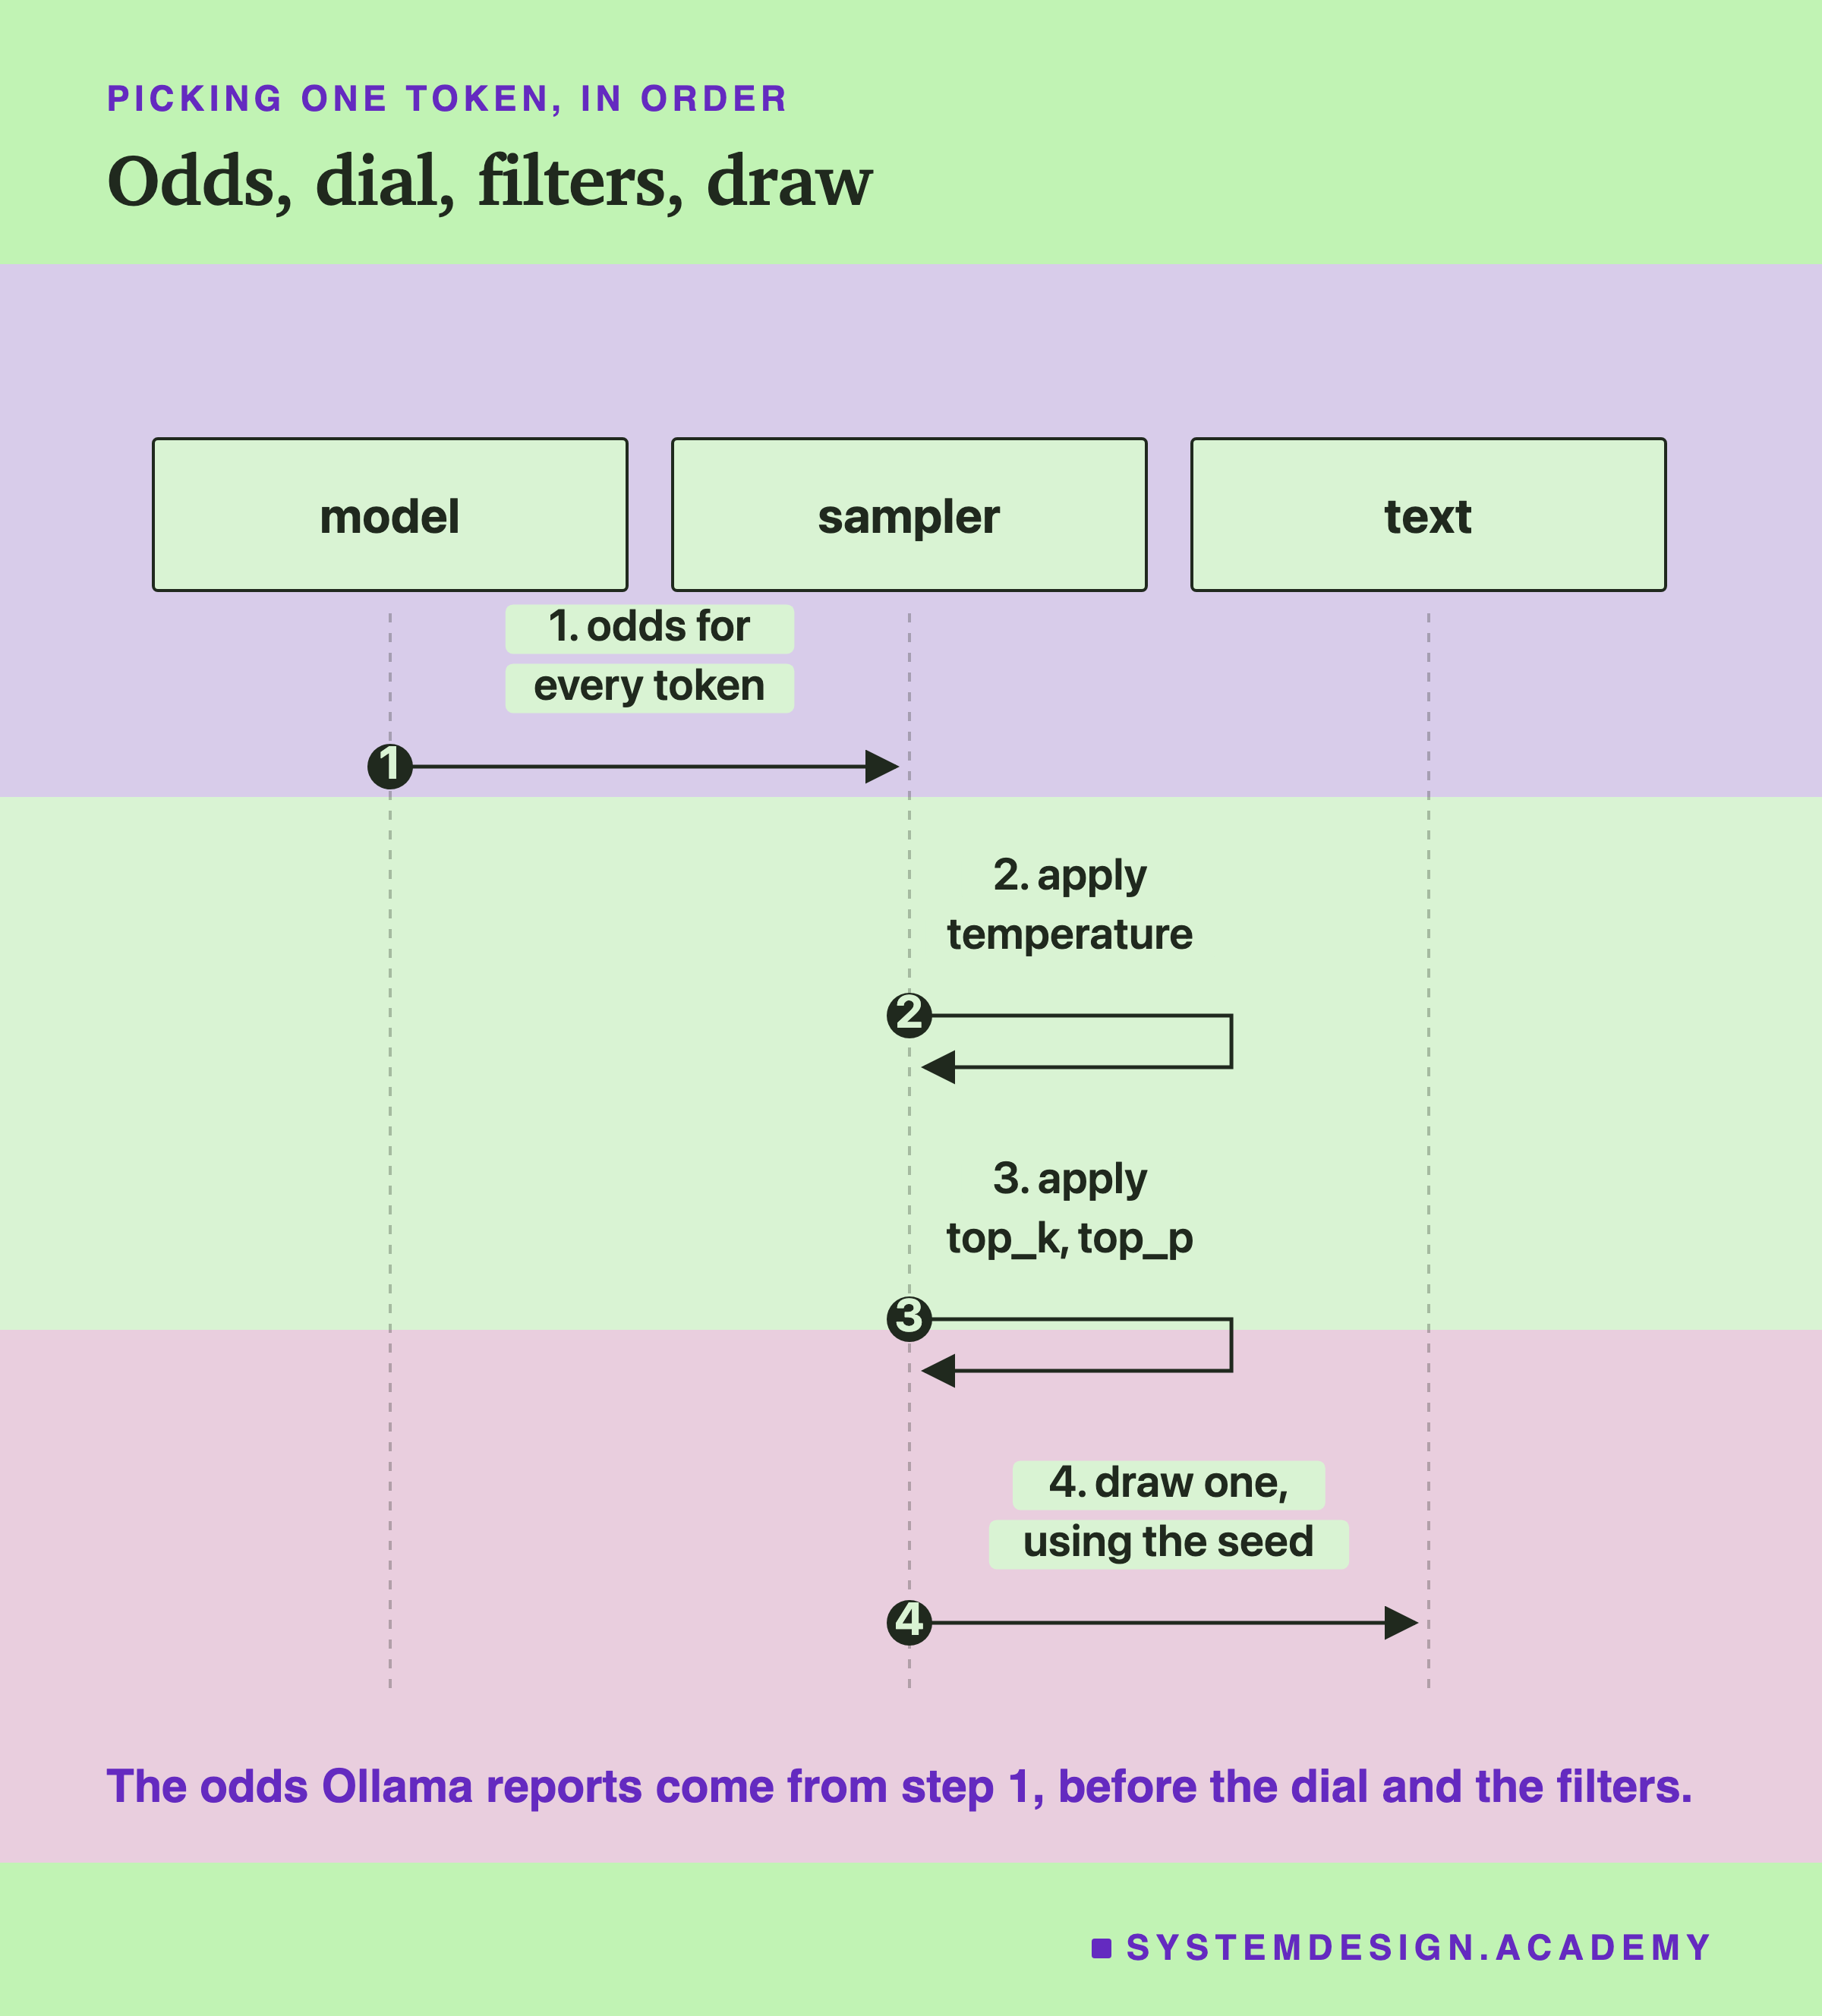
The model's job ends at step 1: it produces odds. Everything after that is the sampler, which is ordinary code, not part of the model. Temperature reshapes the odds; top_k and top_p cut off the unlikely end of the list; then one token is drawn at random, and the seed decides which random numbers are used. The diagram shows the steps as a simple list, but real tools run temperature and the filters in different orders, and I did not check which order Ollama uses. In this lab it did not matter: each filter was tested at temperature 1.0, which leaves the odds unchanged.
One practical detail matters when you debug. The odds Ollama reports with "logprobs": true, as in lesson 1, come from step 1, before temperature and the filters. They do not change when you change the temperature. So to see what temperature does, you have to look at what the model writes, which is what the test below does.
The Test
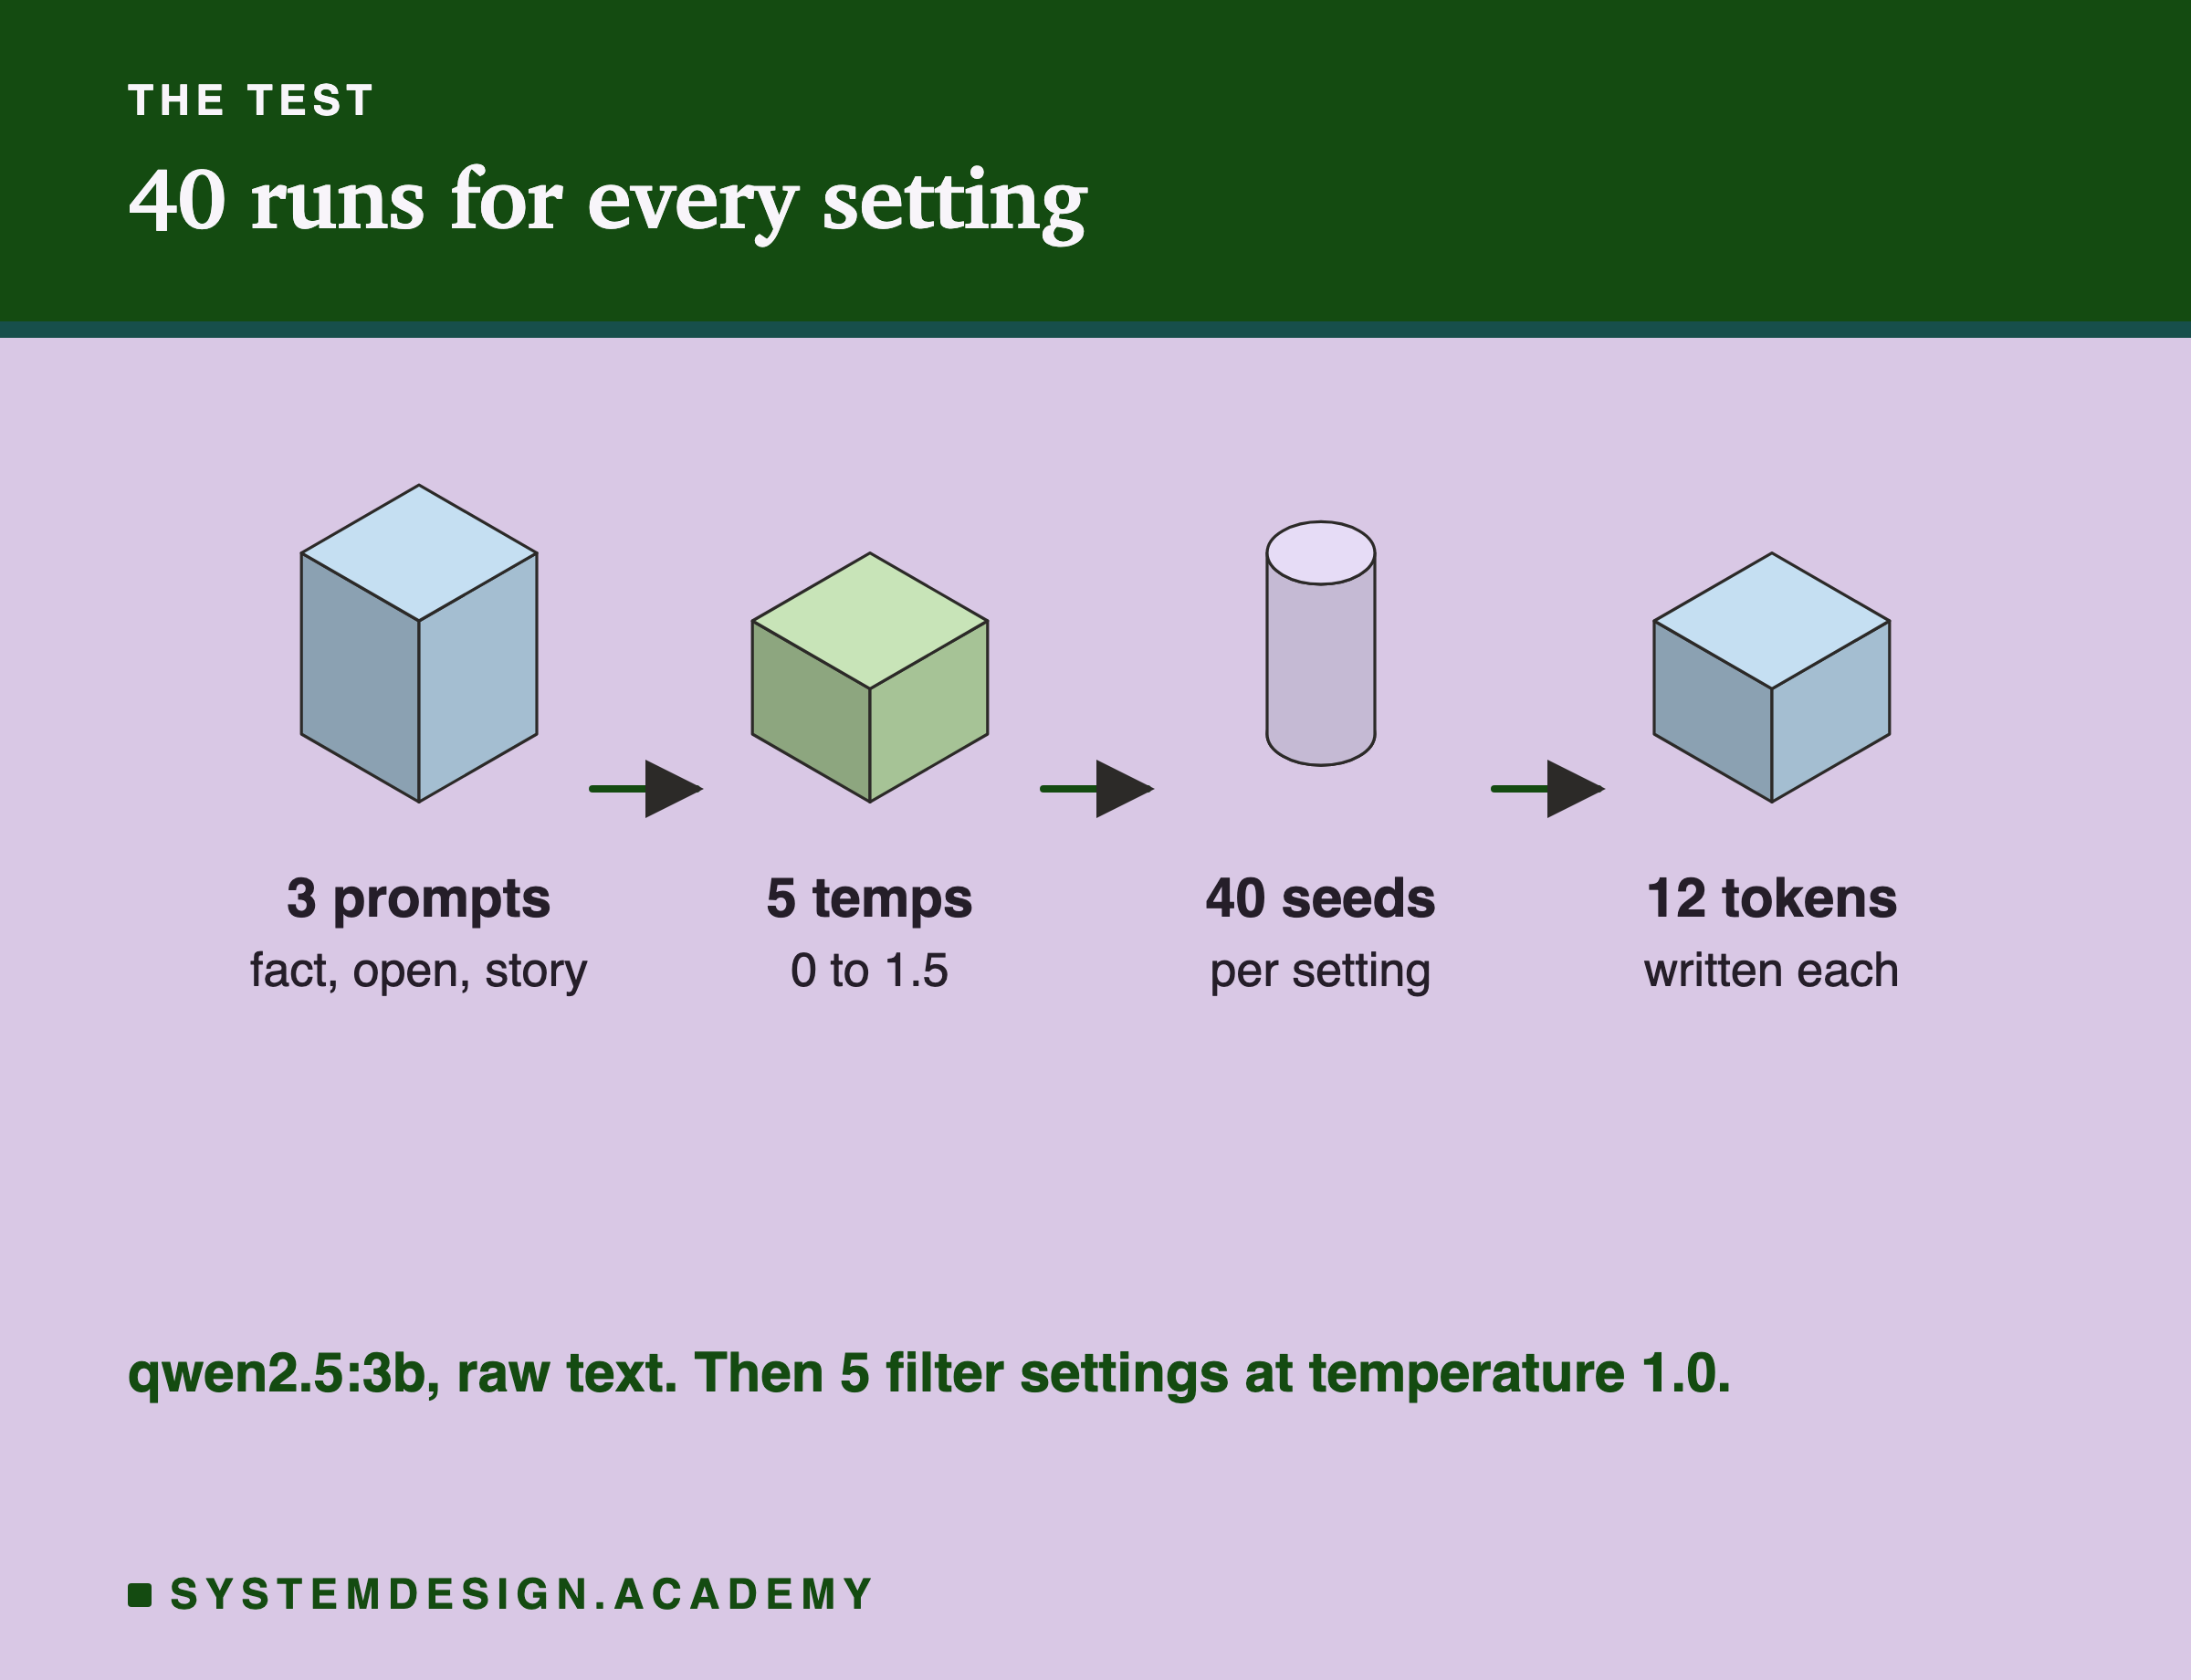
- Three prompts: a fact, "The capital of France is"; an open prompt, "My favourite food is"; and a story, "Once upon a time, a small robot". They were chosen to cover one right answer, many good answers, and a task where variety is the point.
- Five temperatures: 0, 0.3, 0.7, 1.0 and 1.5, with top_k and top_p switched off so that only temperature changes.
- 40 runs per setting, with seeds 1 to 40, each writing 12 tokens.
- Then five filter settings at temperature 1.0: top_k 1, 5 and 40, and top_p 0.5 and 0.9.
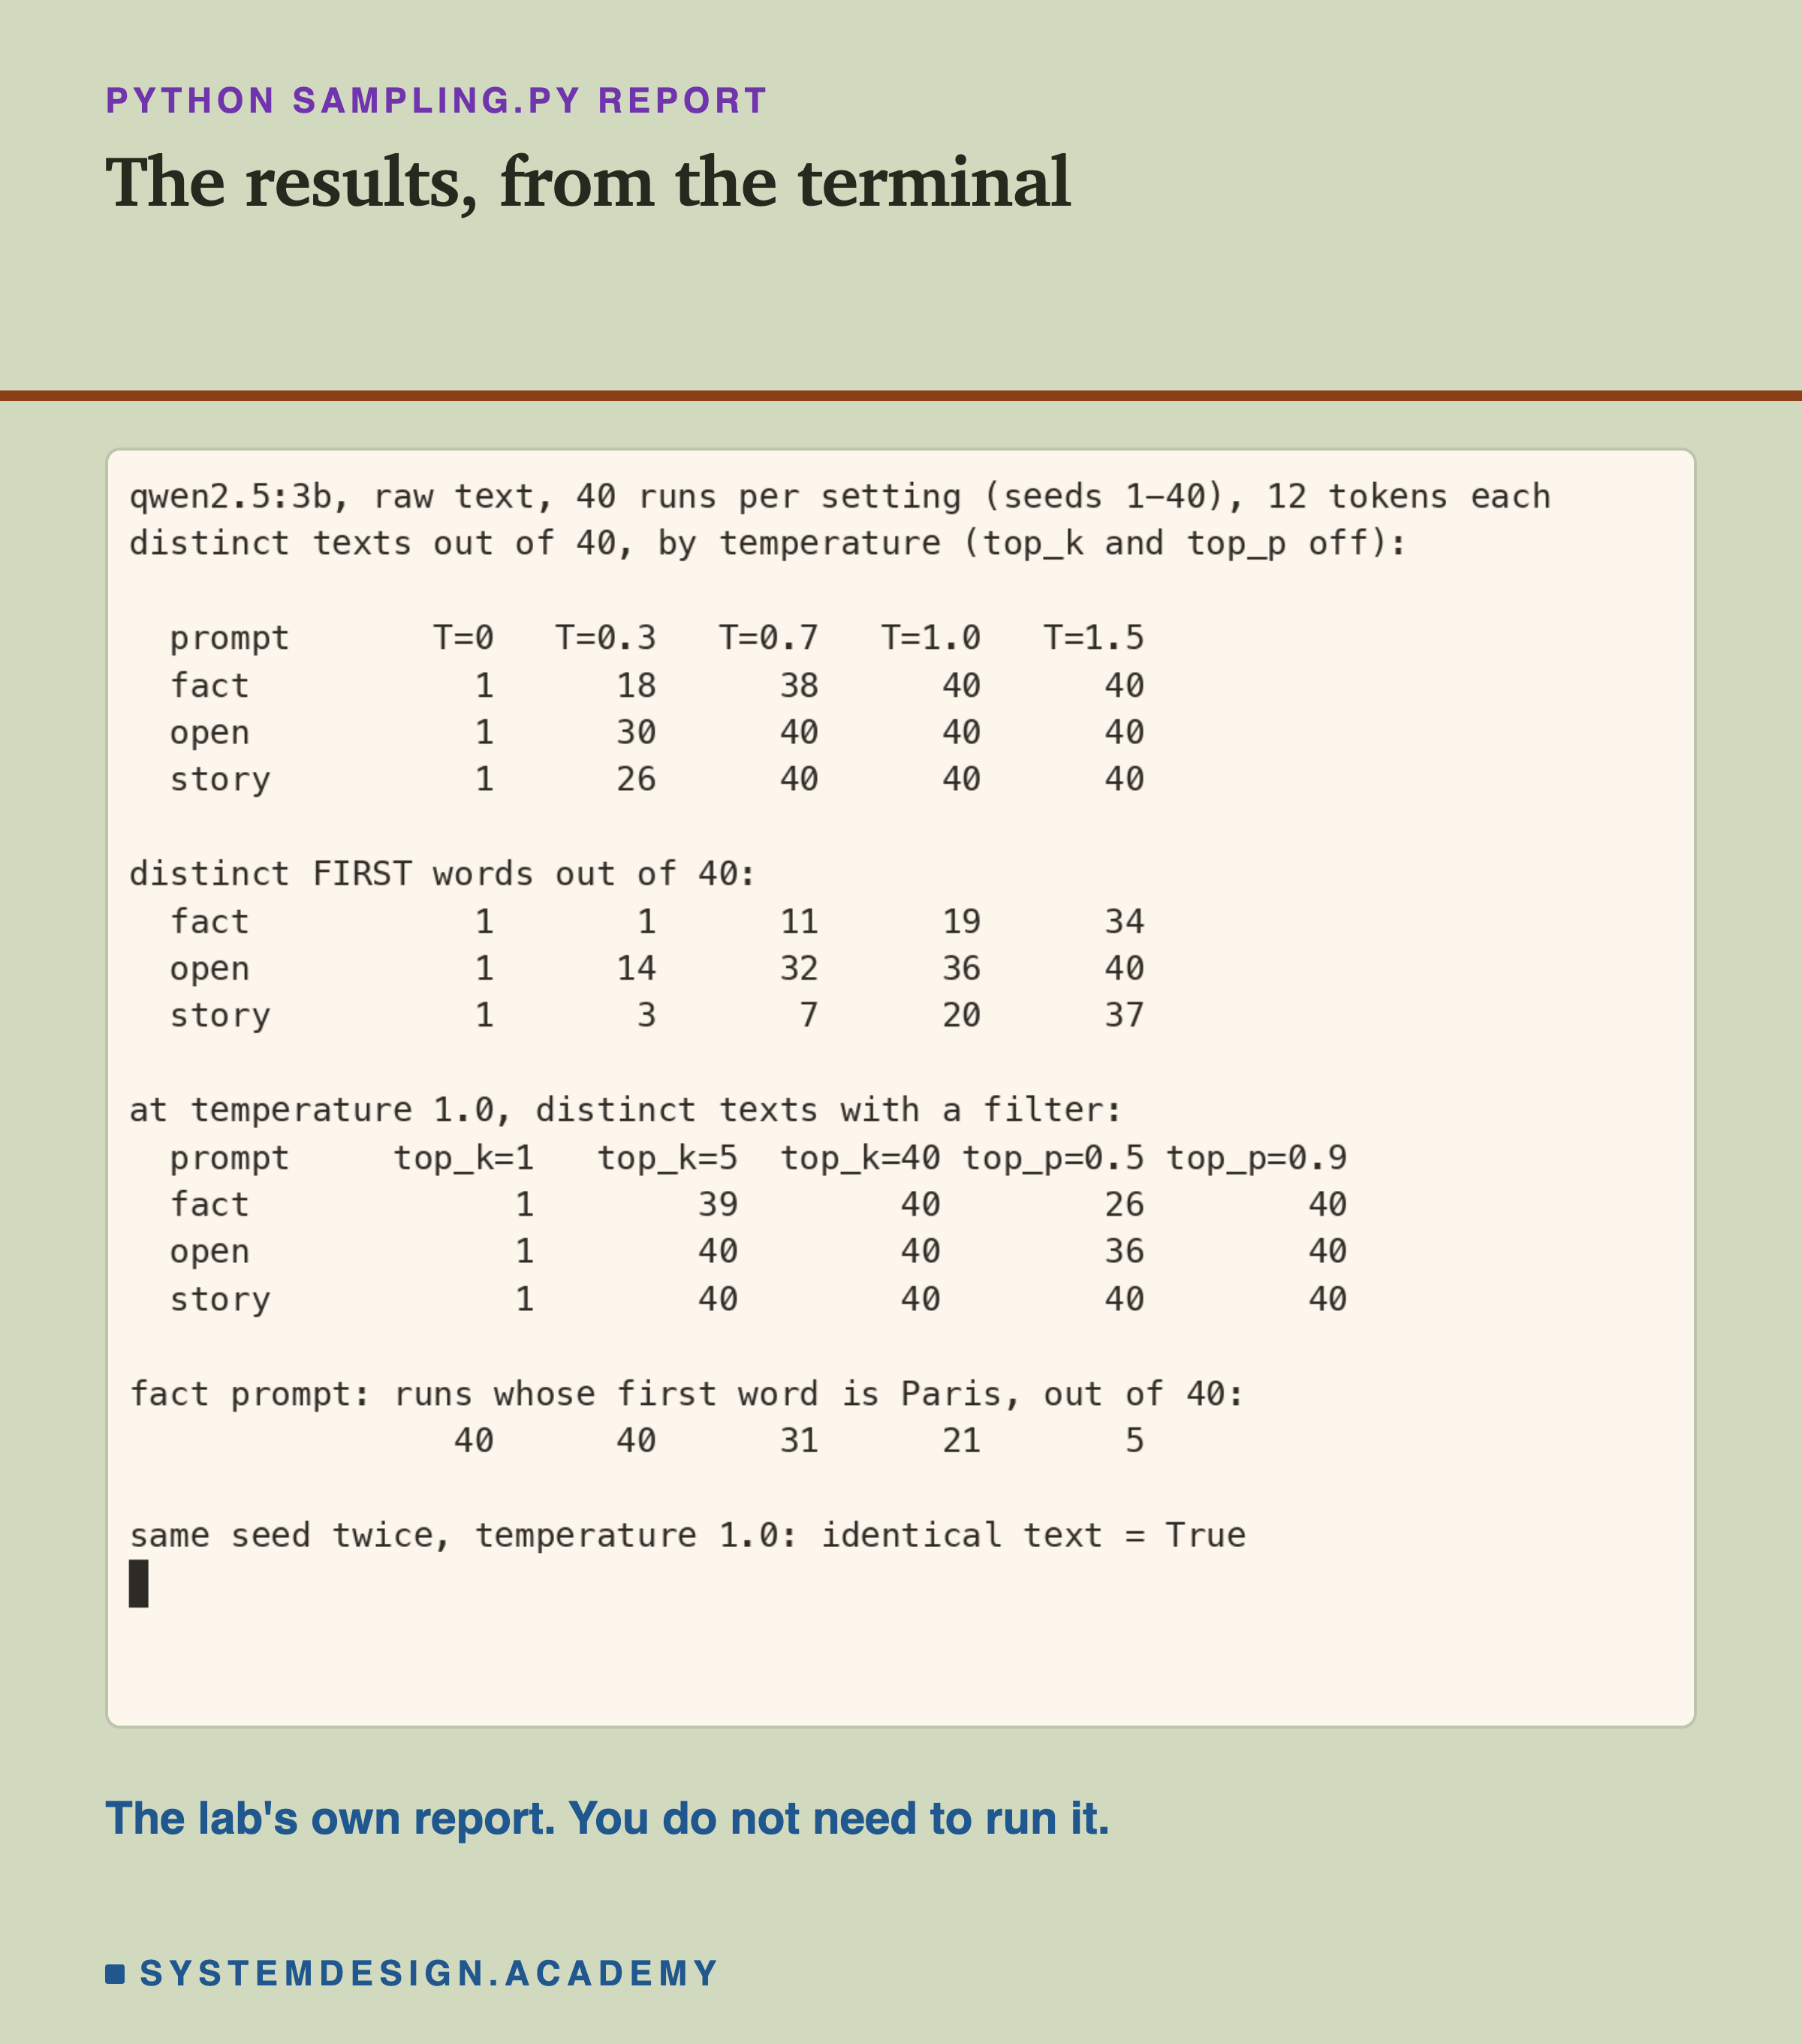
That is more than 1,000 short generations. For each setting I counted two things: how many of the 40 texts were different from each other, and how many different first words the 40 runs used. For the fact prompt I also counted how many runs began with Paris. Here is the lab's report, from the terminal.
How to read it: the first table has one row per prompt and one column per temperature, and each number says how many of the 40 texts were different. A 1 means all 40 runs wrote exactly the same text; a 40 means no two runs matched. The second table counts different first words in the same way. The third table does the same for the five filter settings, all at temperature 1.0. The last two lines give the Paris count and the result of running the same seed twice.
What Temperature Did
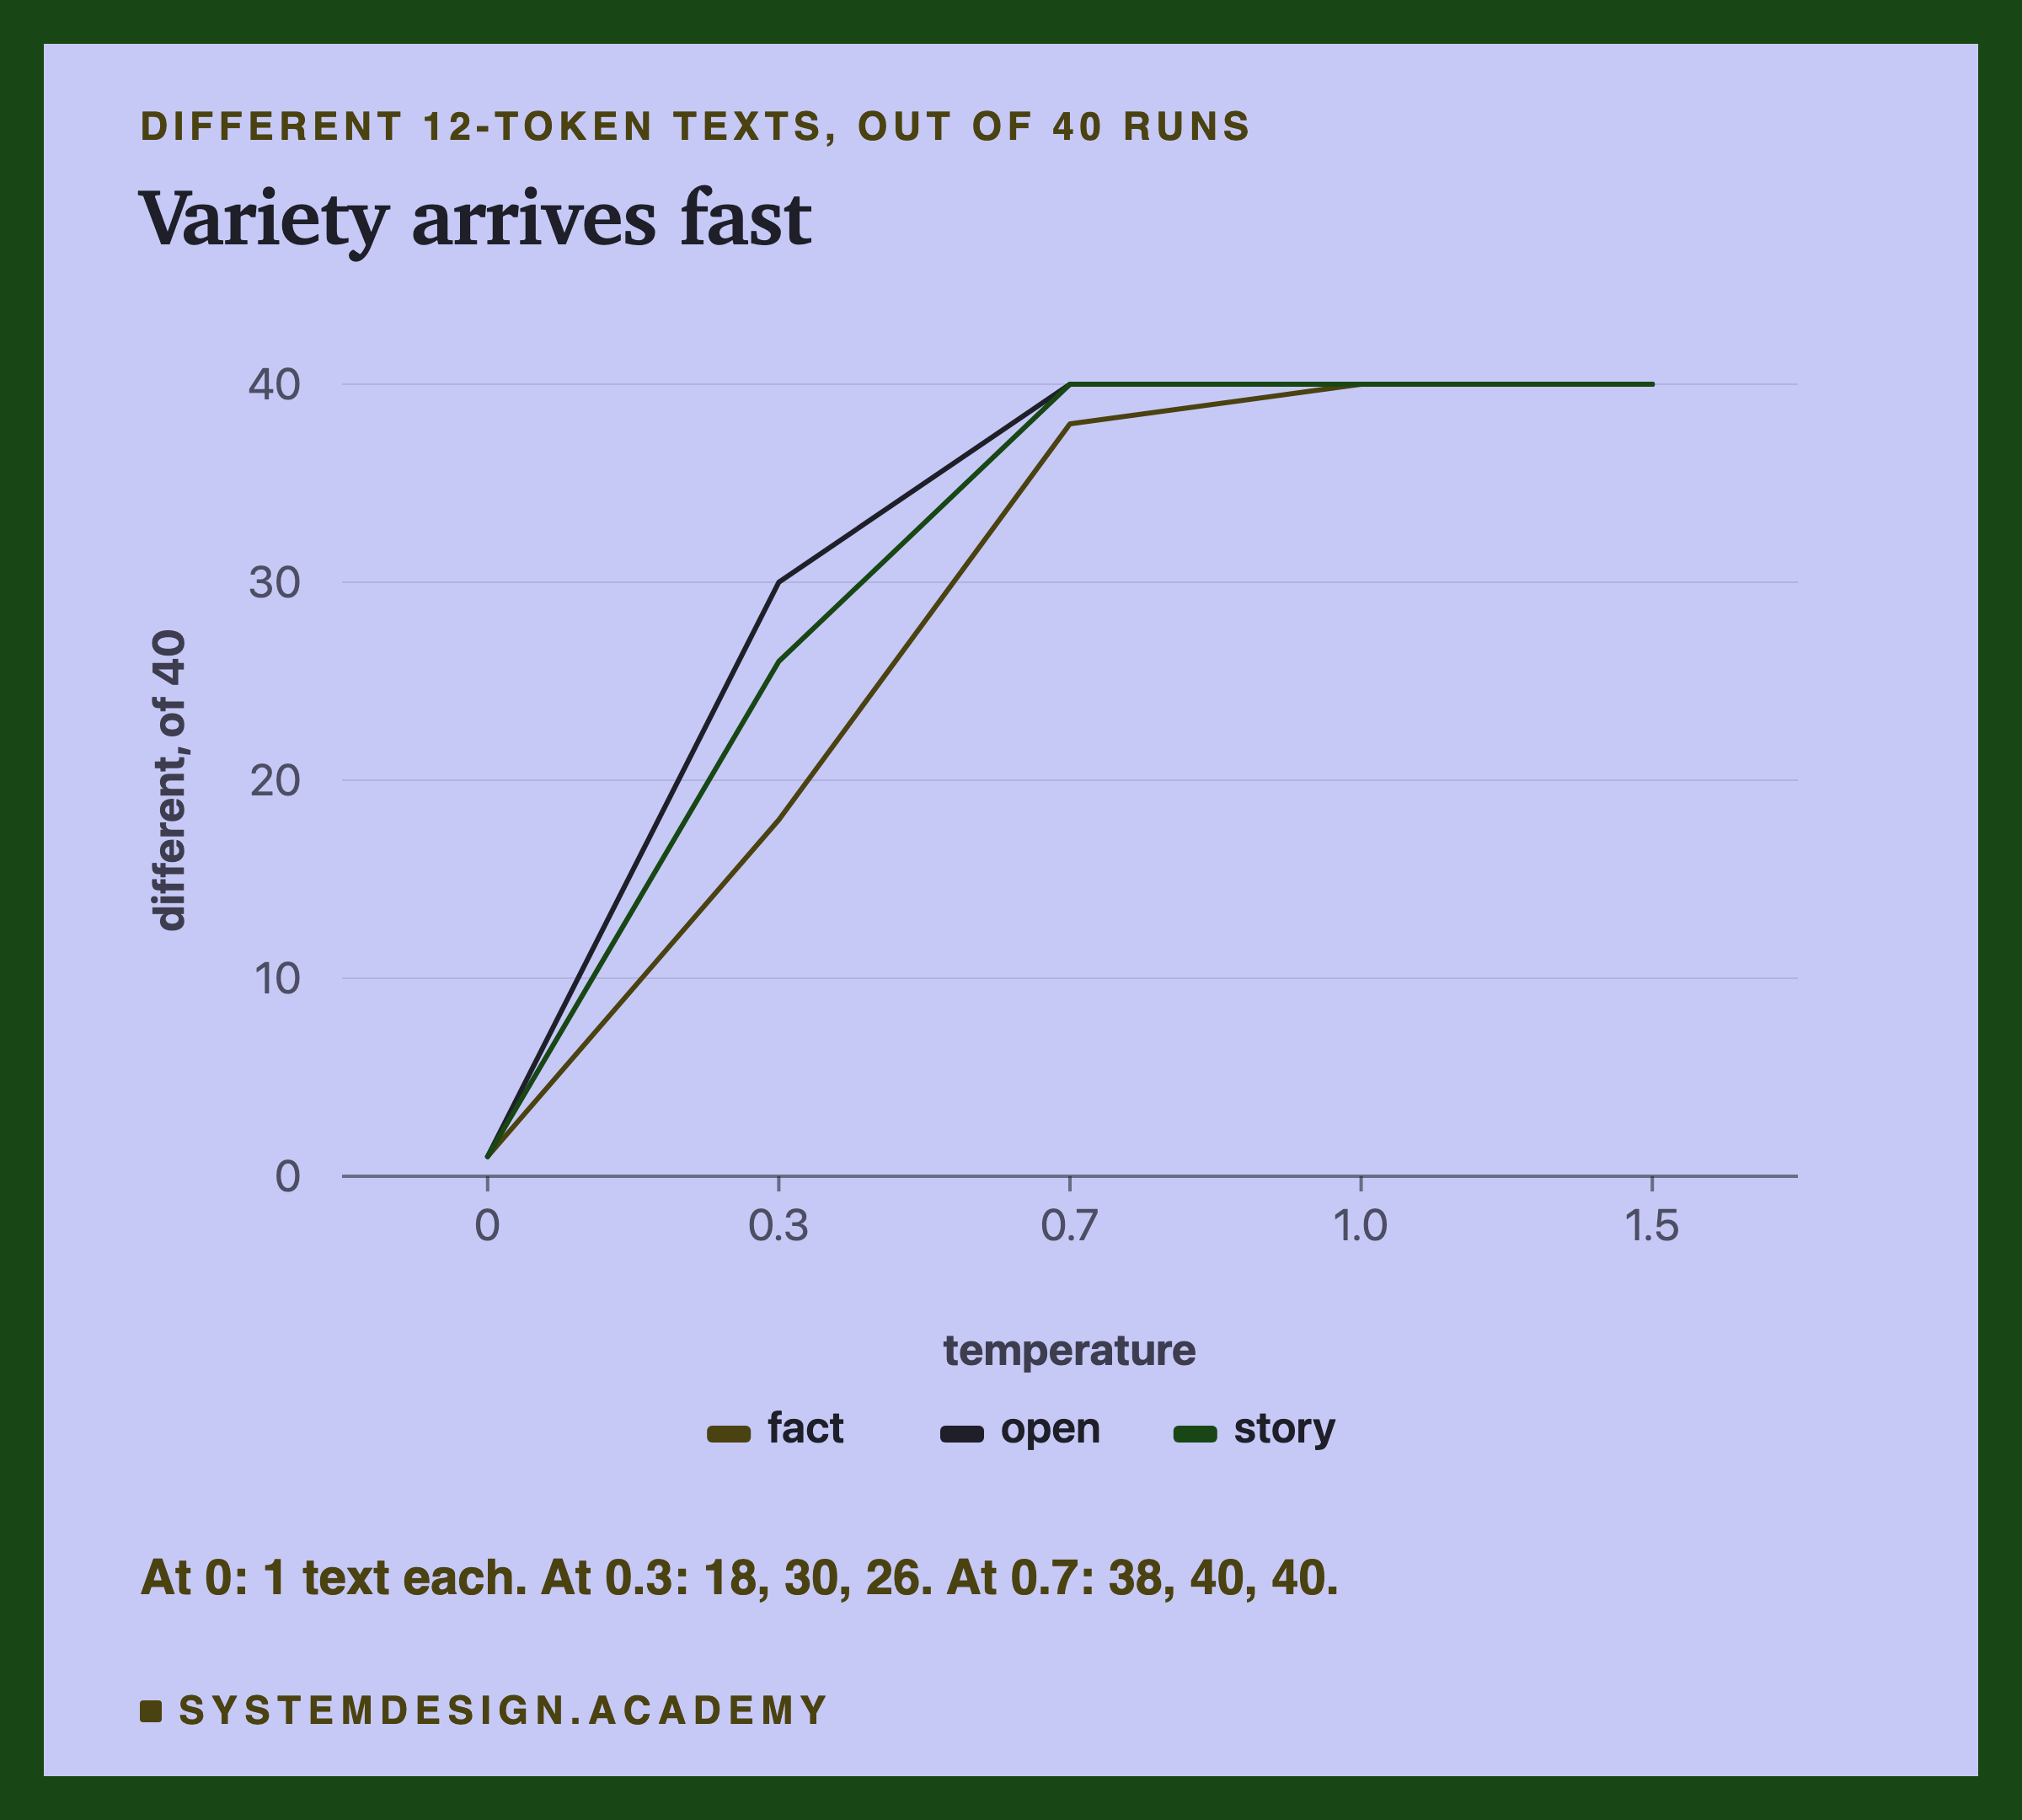
Variety arrives fast. At temperature 0, all 40 runs of each prompt were identical. At 0.3, already 18 to 30 of 40 were different. By 0.7, almost every run was different. Even a low temperature is enough to make answers vary, because a text of 12 tokens has 12 chances to branch, and one different token early on changes everything after it.
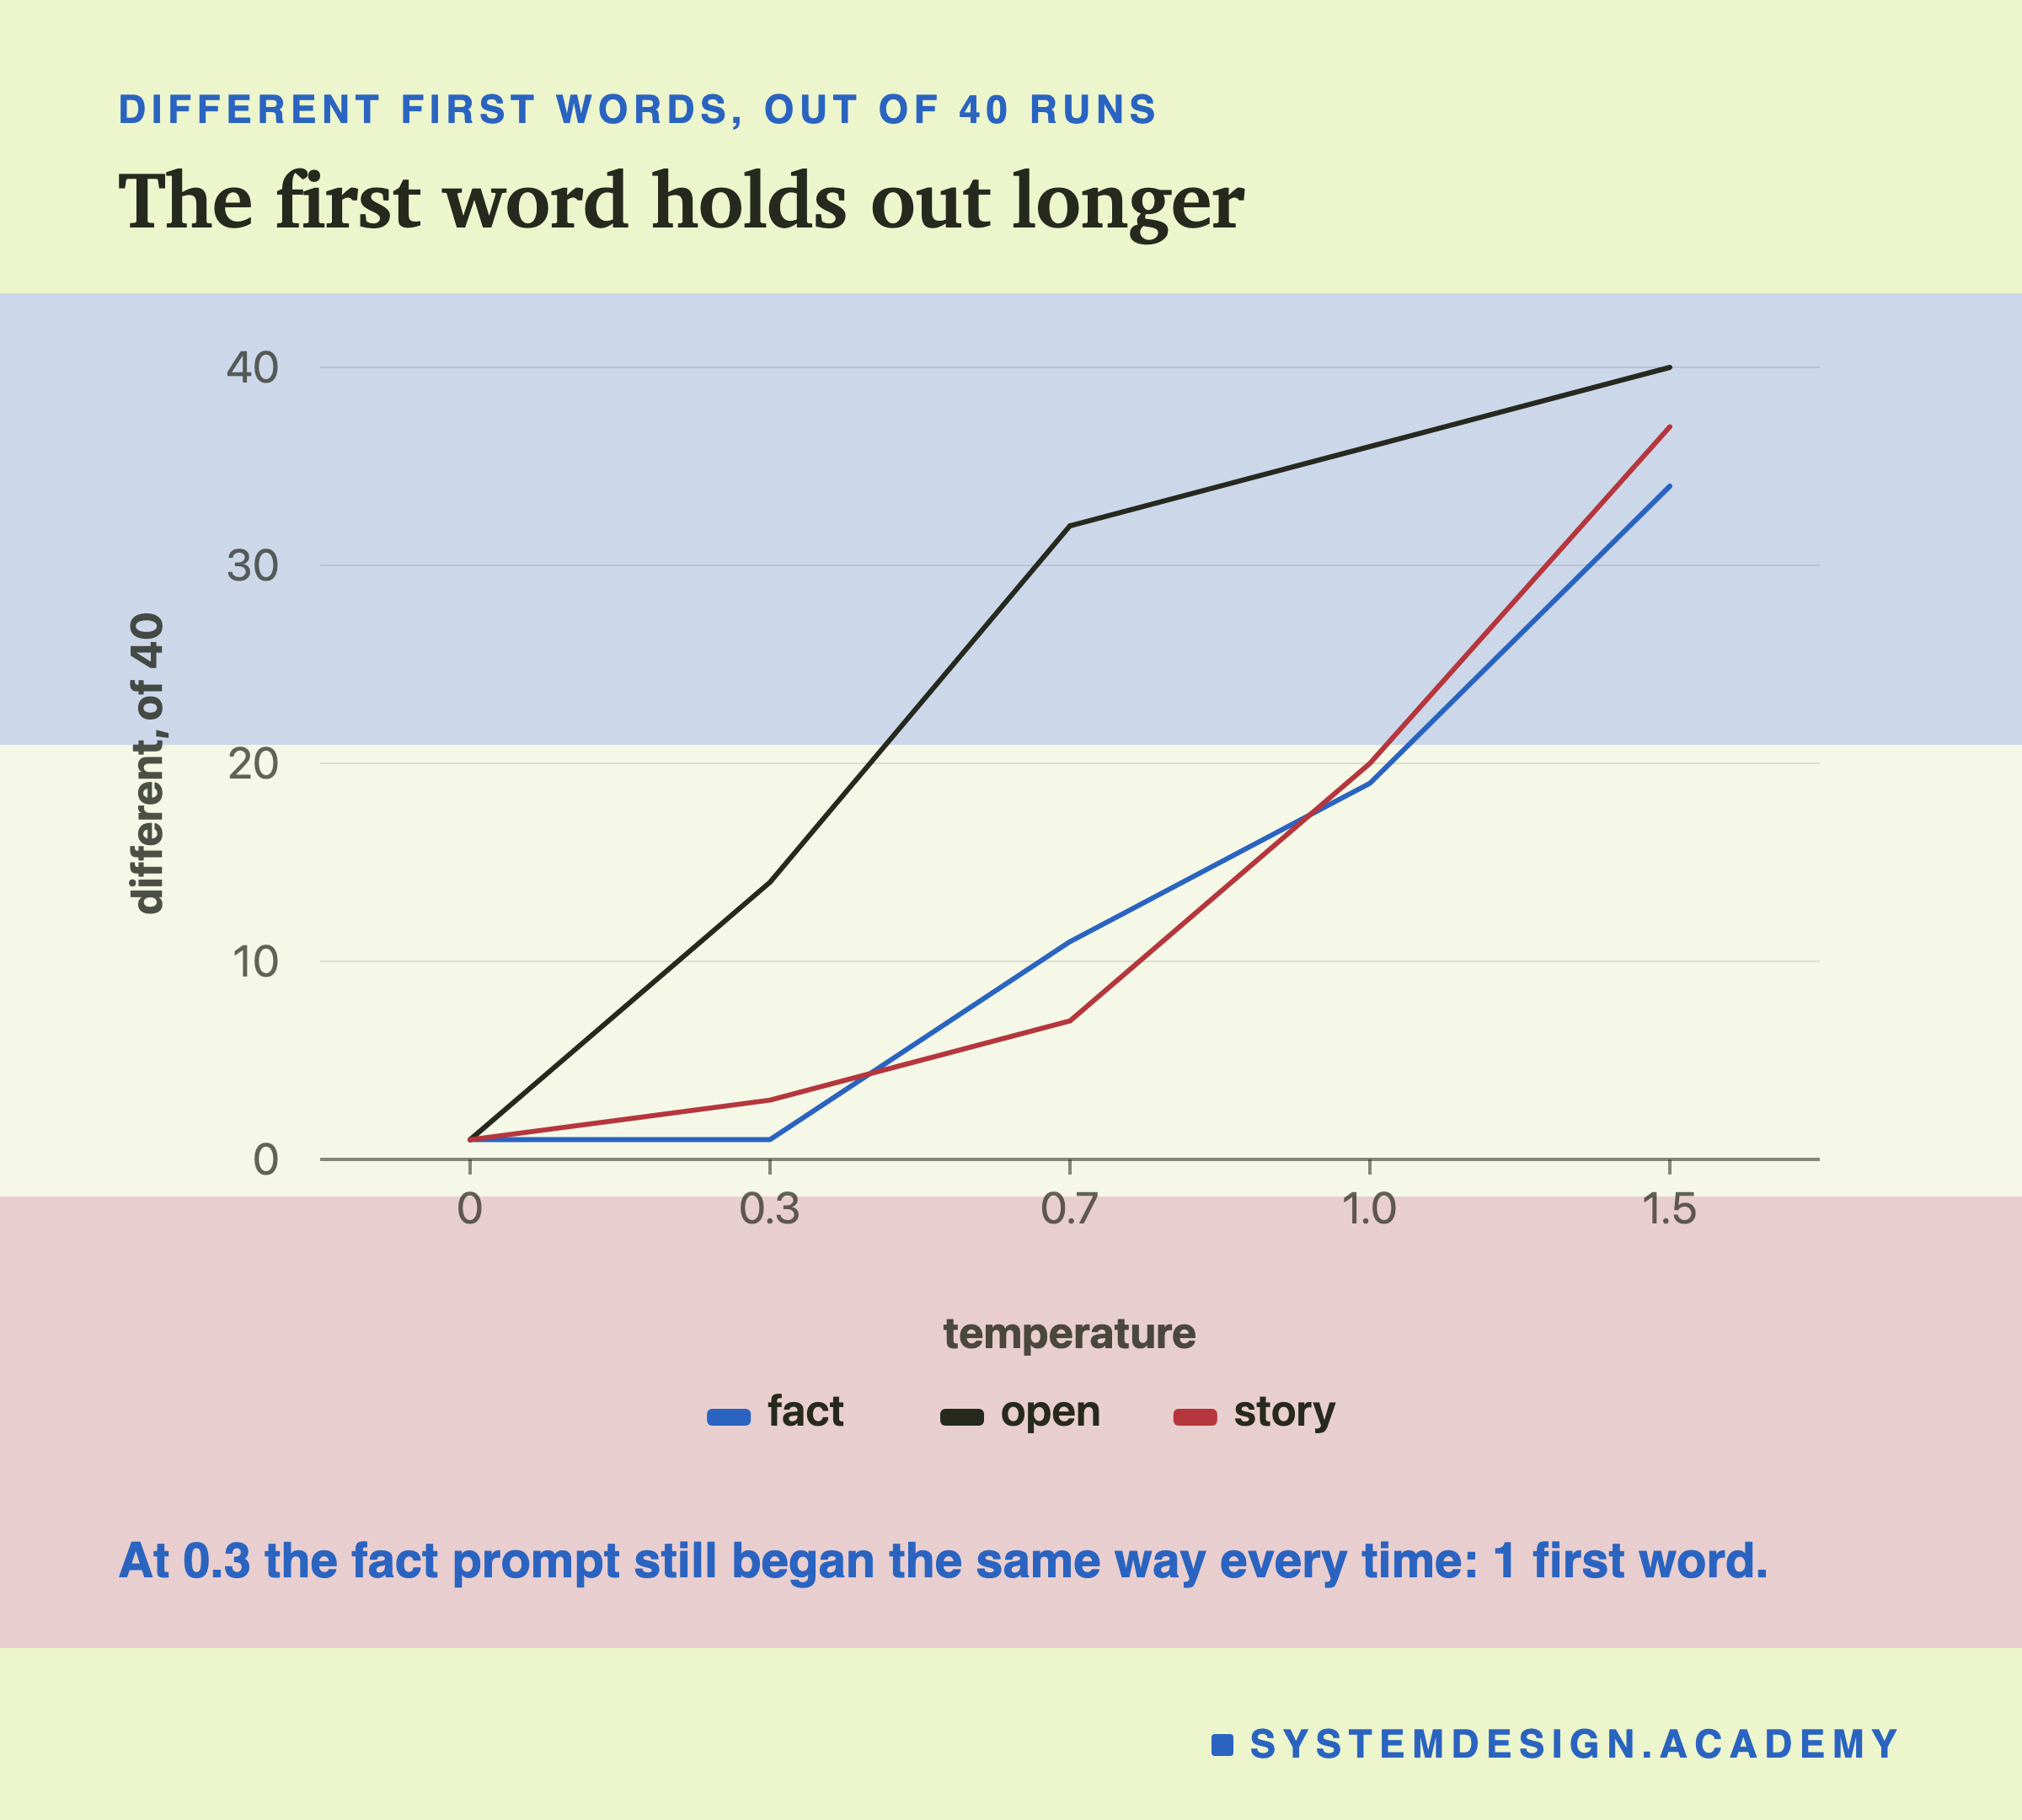
The first word changes later than the rest, because it is often the most certain token. At 0.3 the fact prompt still began with the same word in all 40 runs; the differences appeared later in the text. The open prompt, where no first word is much more likely than the others, used 14 different first words already at 0.3.
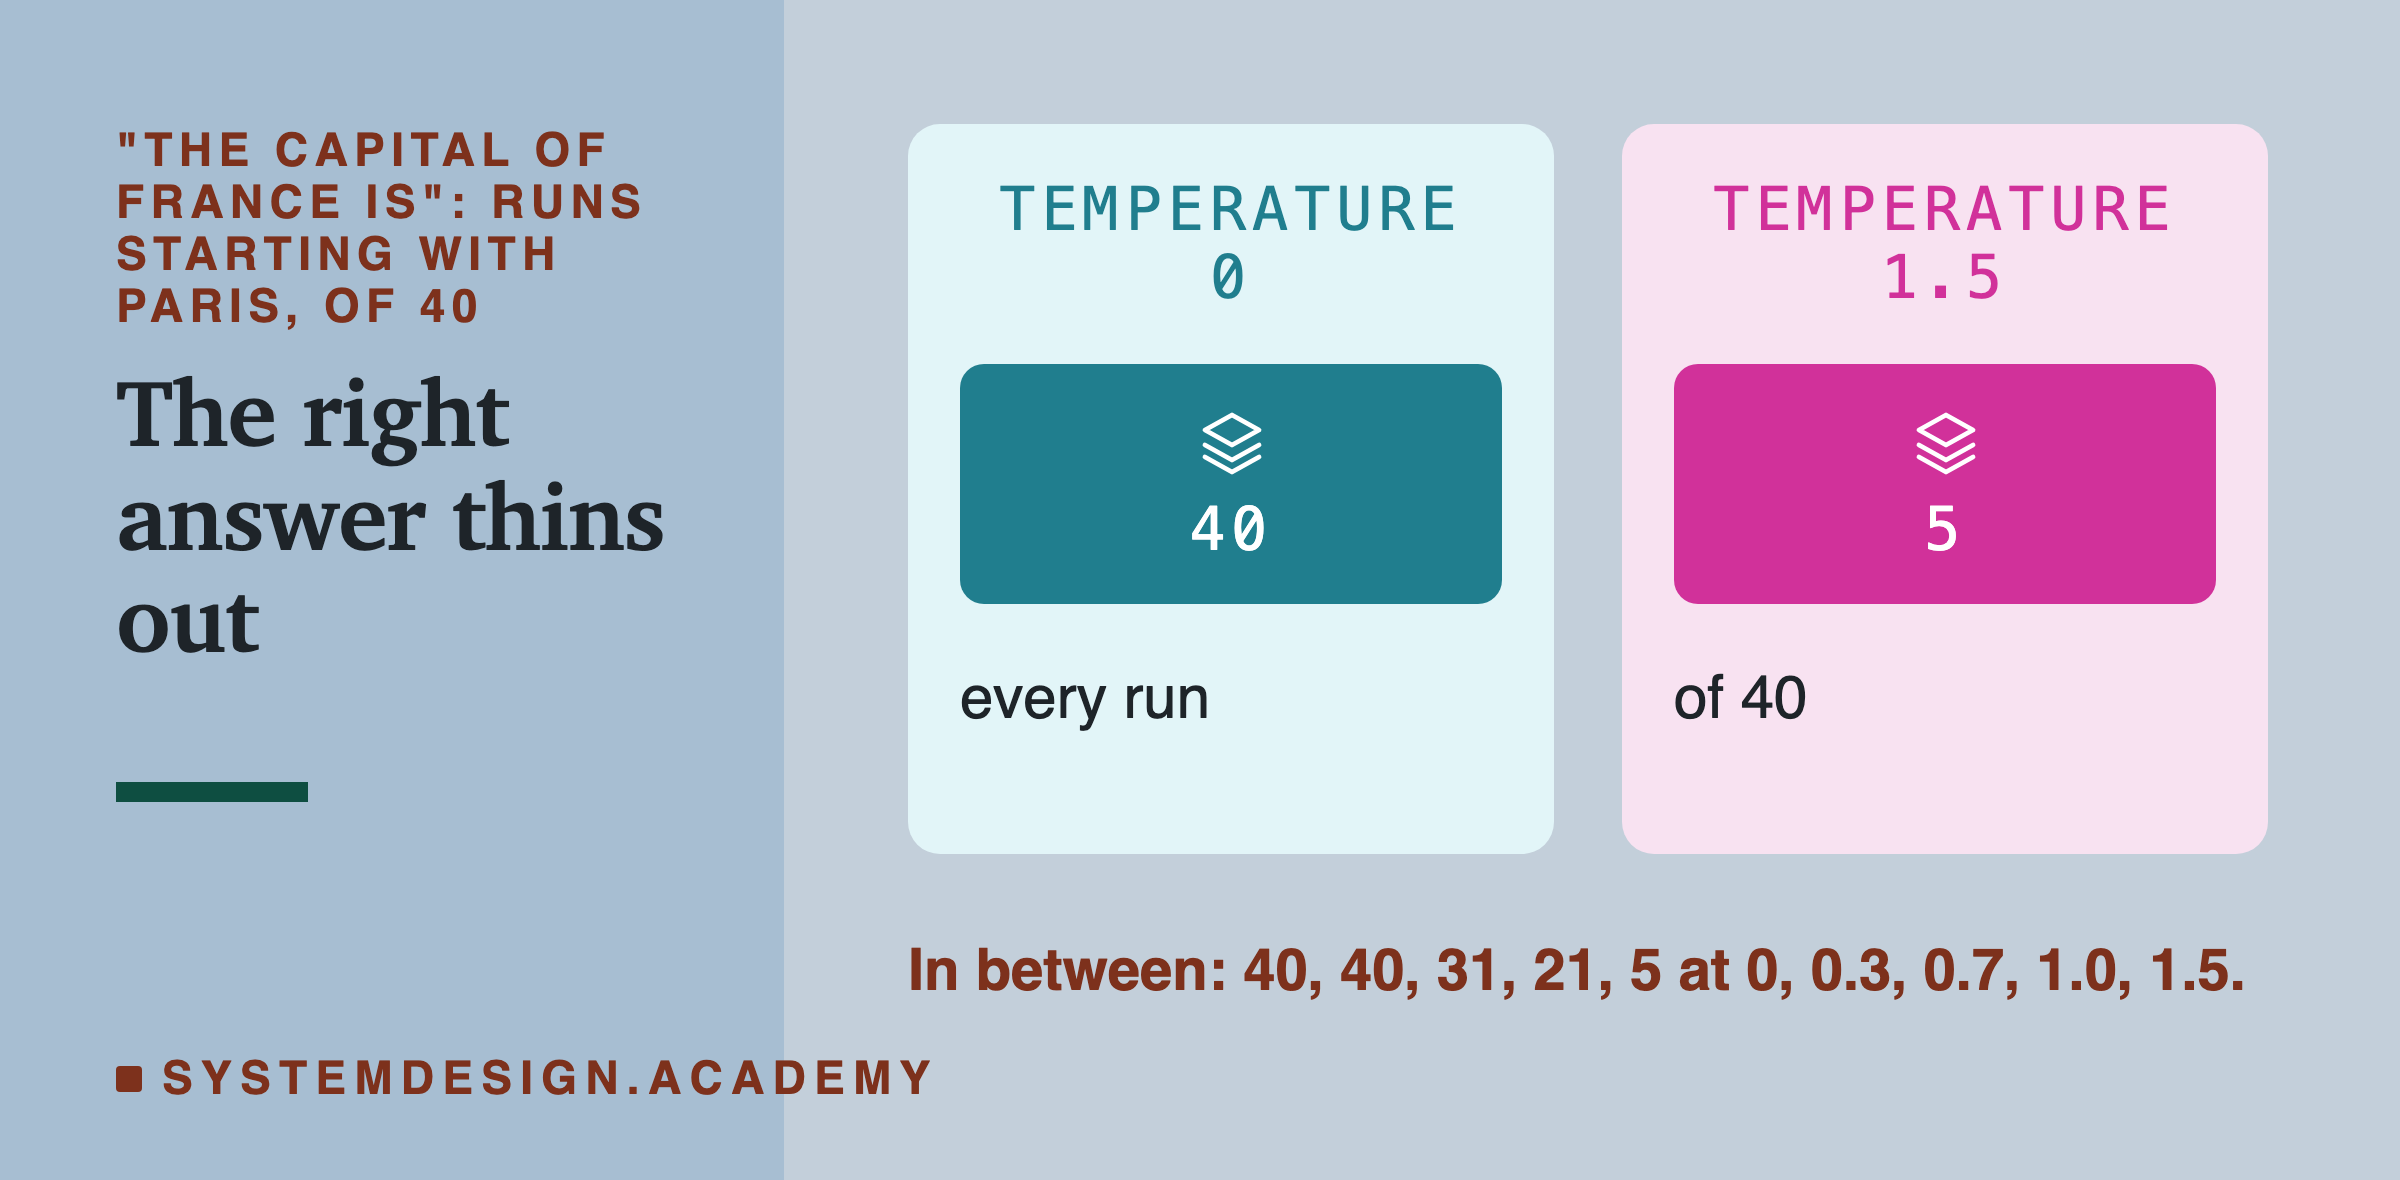
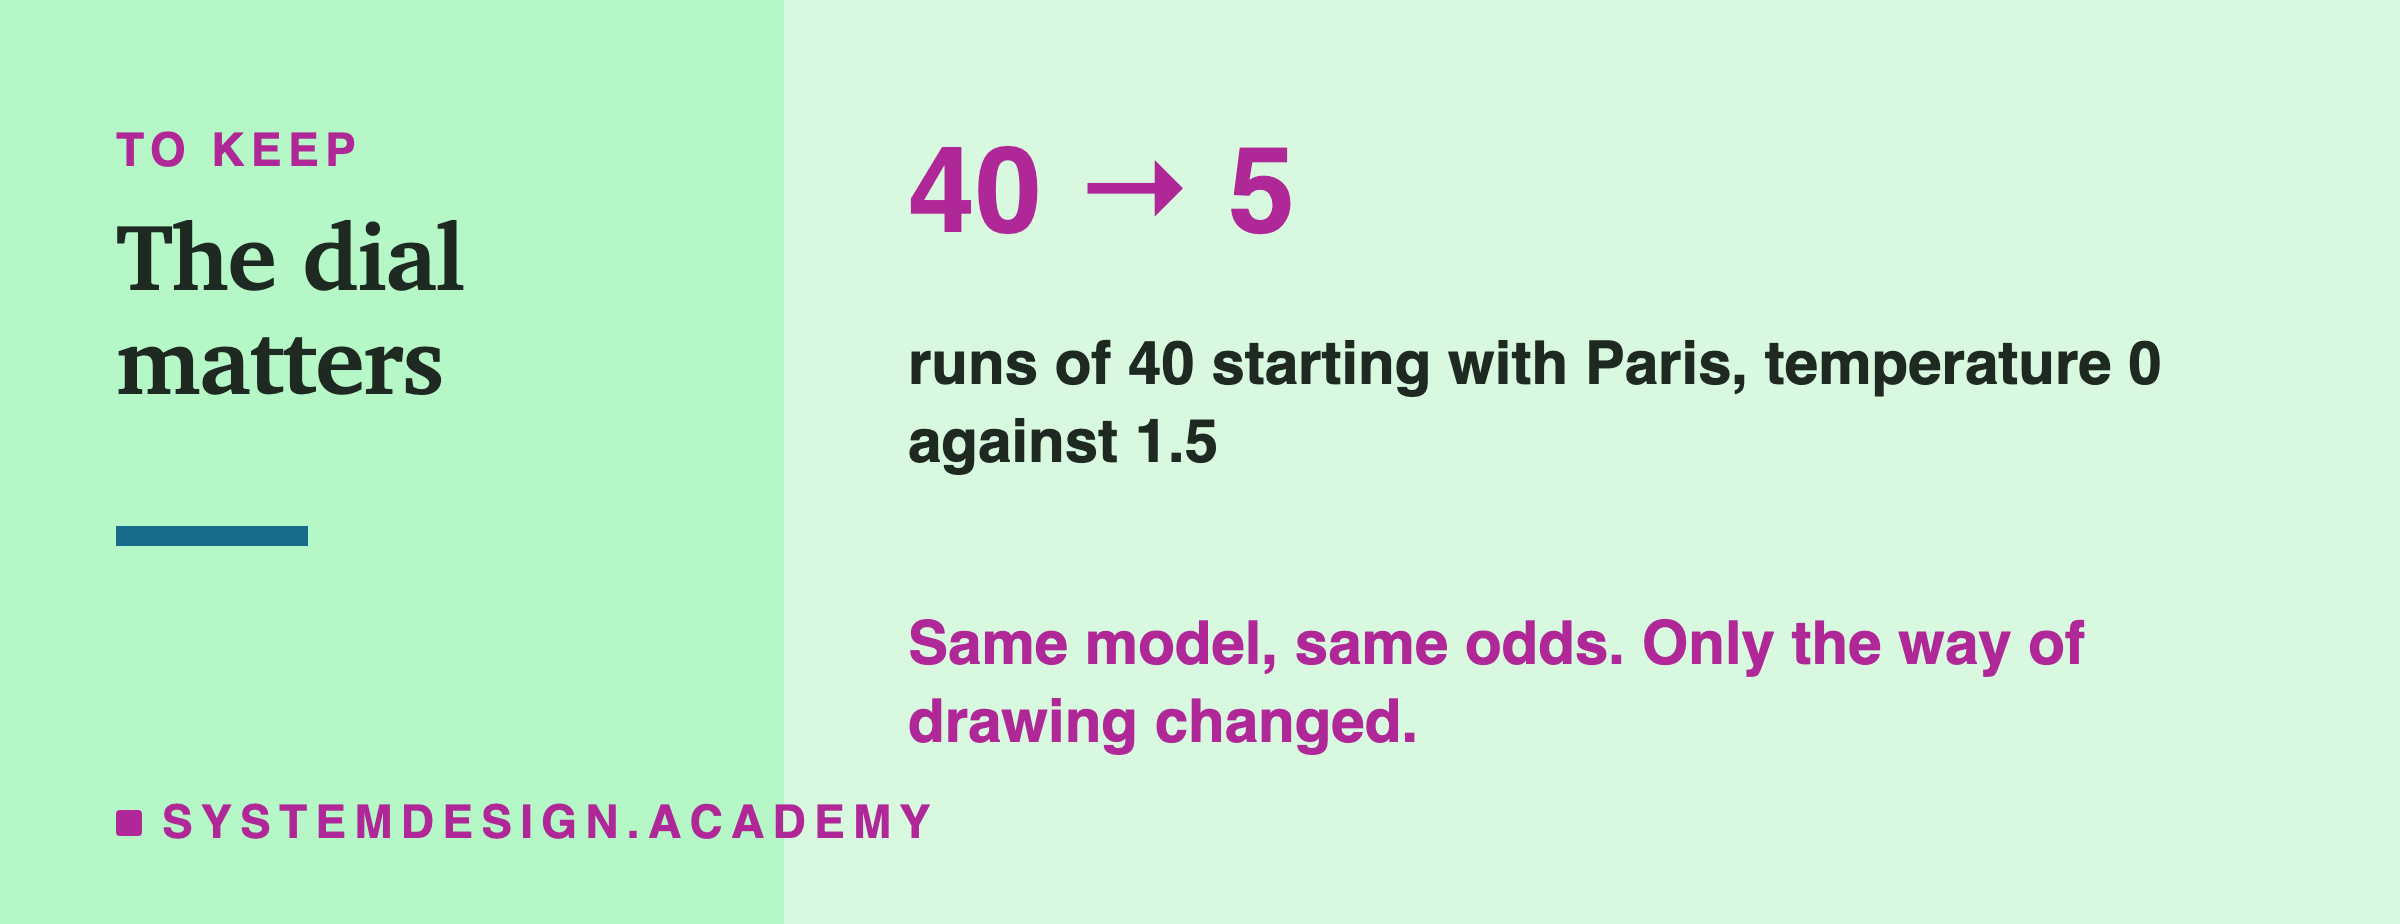
The fact prompt shows the cost plainly. Paris came first in 40 of 40 runs at temperature 0 and 0.3, 31 at 0.7, 21 at 1.0, and only 5 at 1.5. At 1.0, the model's own odds, Paris came first in only about half the runs, even though it was by far the most likely single token: the other half of the draws went to blanks, to "the", to "located" and to thousands of other tokens with small odds each.
Filters Cut Off the Long Tail
top_k and top_p exist to stop that: they remove the unlikely tokens before the draw, so a rare token can only win if it is among the few that are kept.
top_k by hand. With top_k 5 after "The capital of France is", only the five most likely tokens are kept: Paris 0.6219, three kinds of blank at 0.0434, 0.0245 and 0.0229, and "␣located" at 0.022. Together they add up to 0.7347. Rescaled to add up to 1, Paris becomes 0.6219 ÷ 0.7347, about 0.85, and the other four share the rest. The other 151,931 tokens can no longer be drawn at all.
top_p by hand. top_p keeps tokens in order of odds until the kept odds add up to at least p. With top_p 0.5, Paris alone already holds 0.6219, which is more than 0.5, so Paris is the only token kept, and it is drawn every time. That is exactly what the lab found: with top_p 0.5, all 40 runs of the fact prompt began with "Paris.". The texts still differed later, 26 different texts in 40. So at some later steps more than one token must have been kept, which means no single token held half the odds there; I did not record those later odds.
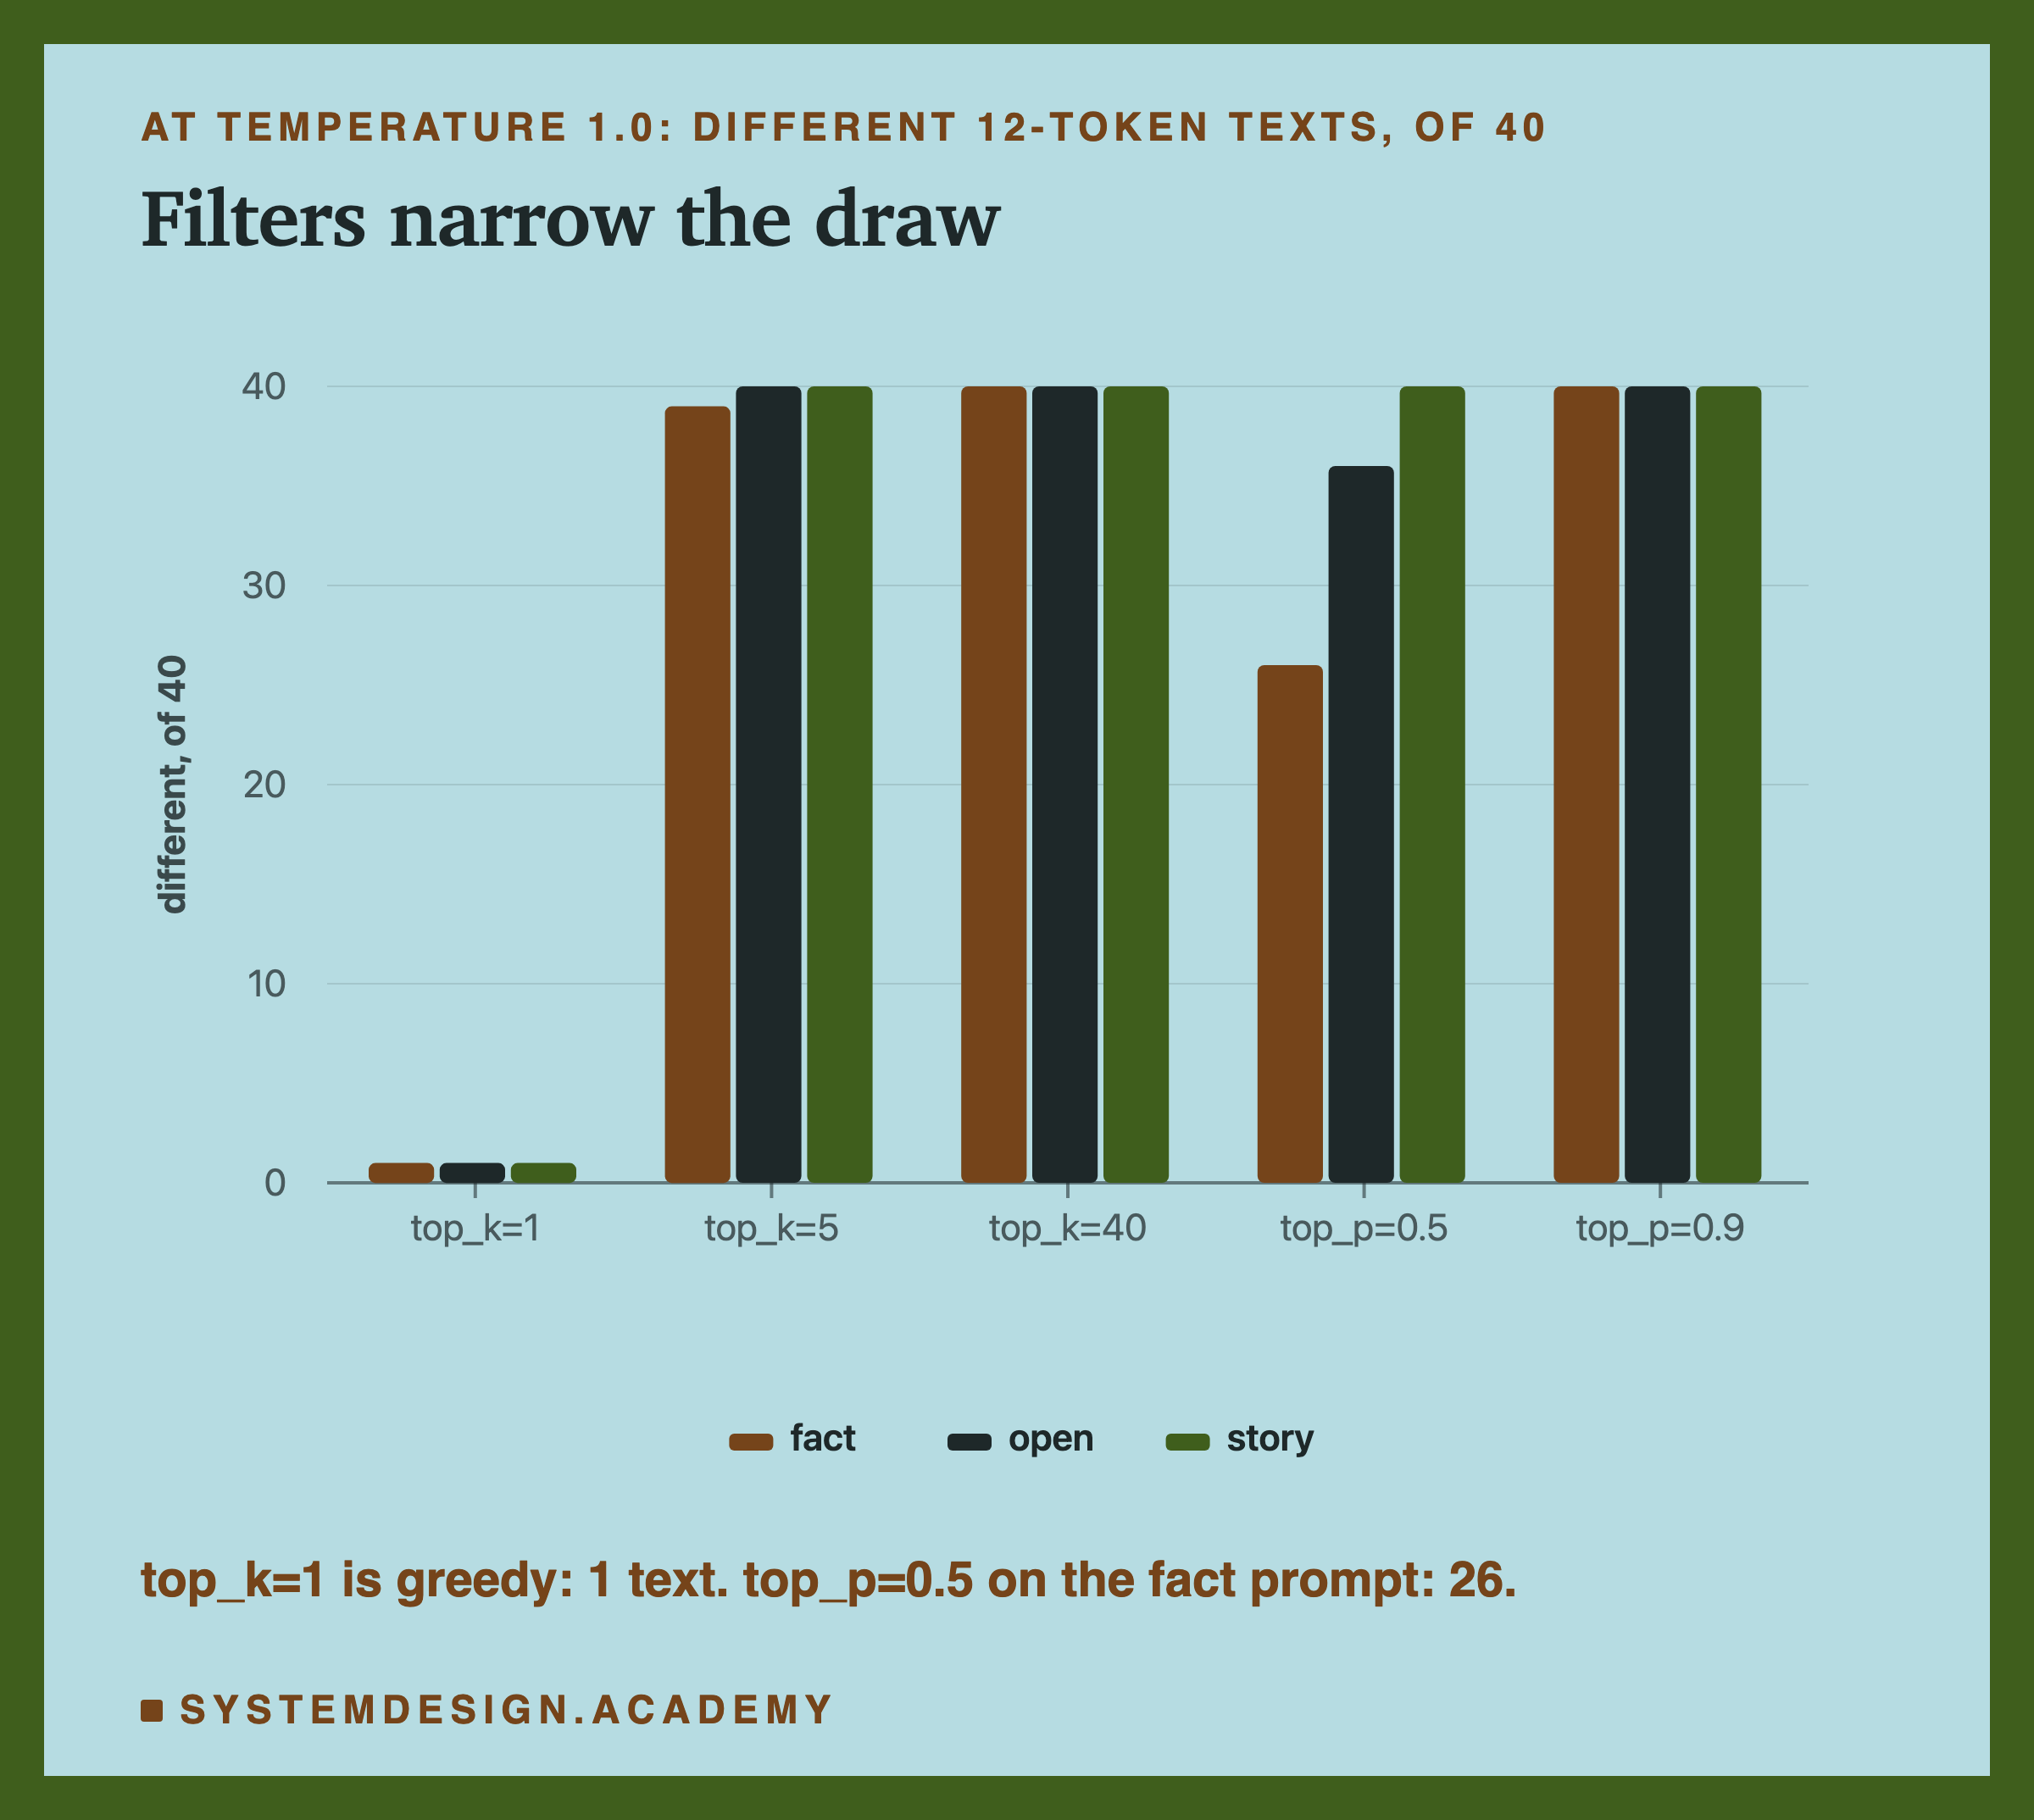
- top_k 1 keeps only the top token, so it is the same as temperature 0: 1 text out of 40.
- top_k 5 keeps five choices at each step. That was still enough for almost every run to differ, 39 or 40 of 40.
- top_p 0.5 adapts to the odds: it keeps one token when the model is sure, and several when it is not. On the fact prompt it cut the variety to 26 texts; on the story prompt, where the model is rarely sure, it left all 40 different.
The difference between the two filters is worth remembering. top_k always keeps the same number of tokens, whether the model is sure or not. top_p keeps as many as it takes to cover a share of the odds, so it keeps few when the odds are sharp and many when they are flat.
The Seed Makes Random Repeatable
Computers do not produce truly random numbers for this. They use a formula that produces a long sequence of numbers that look random, and the seed is where that sequence starts. The same seed gives the same sequence, so with the same odds, the same draws happen in the same order.
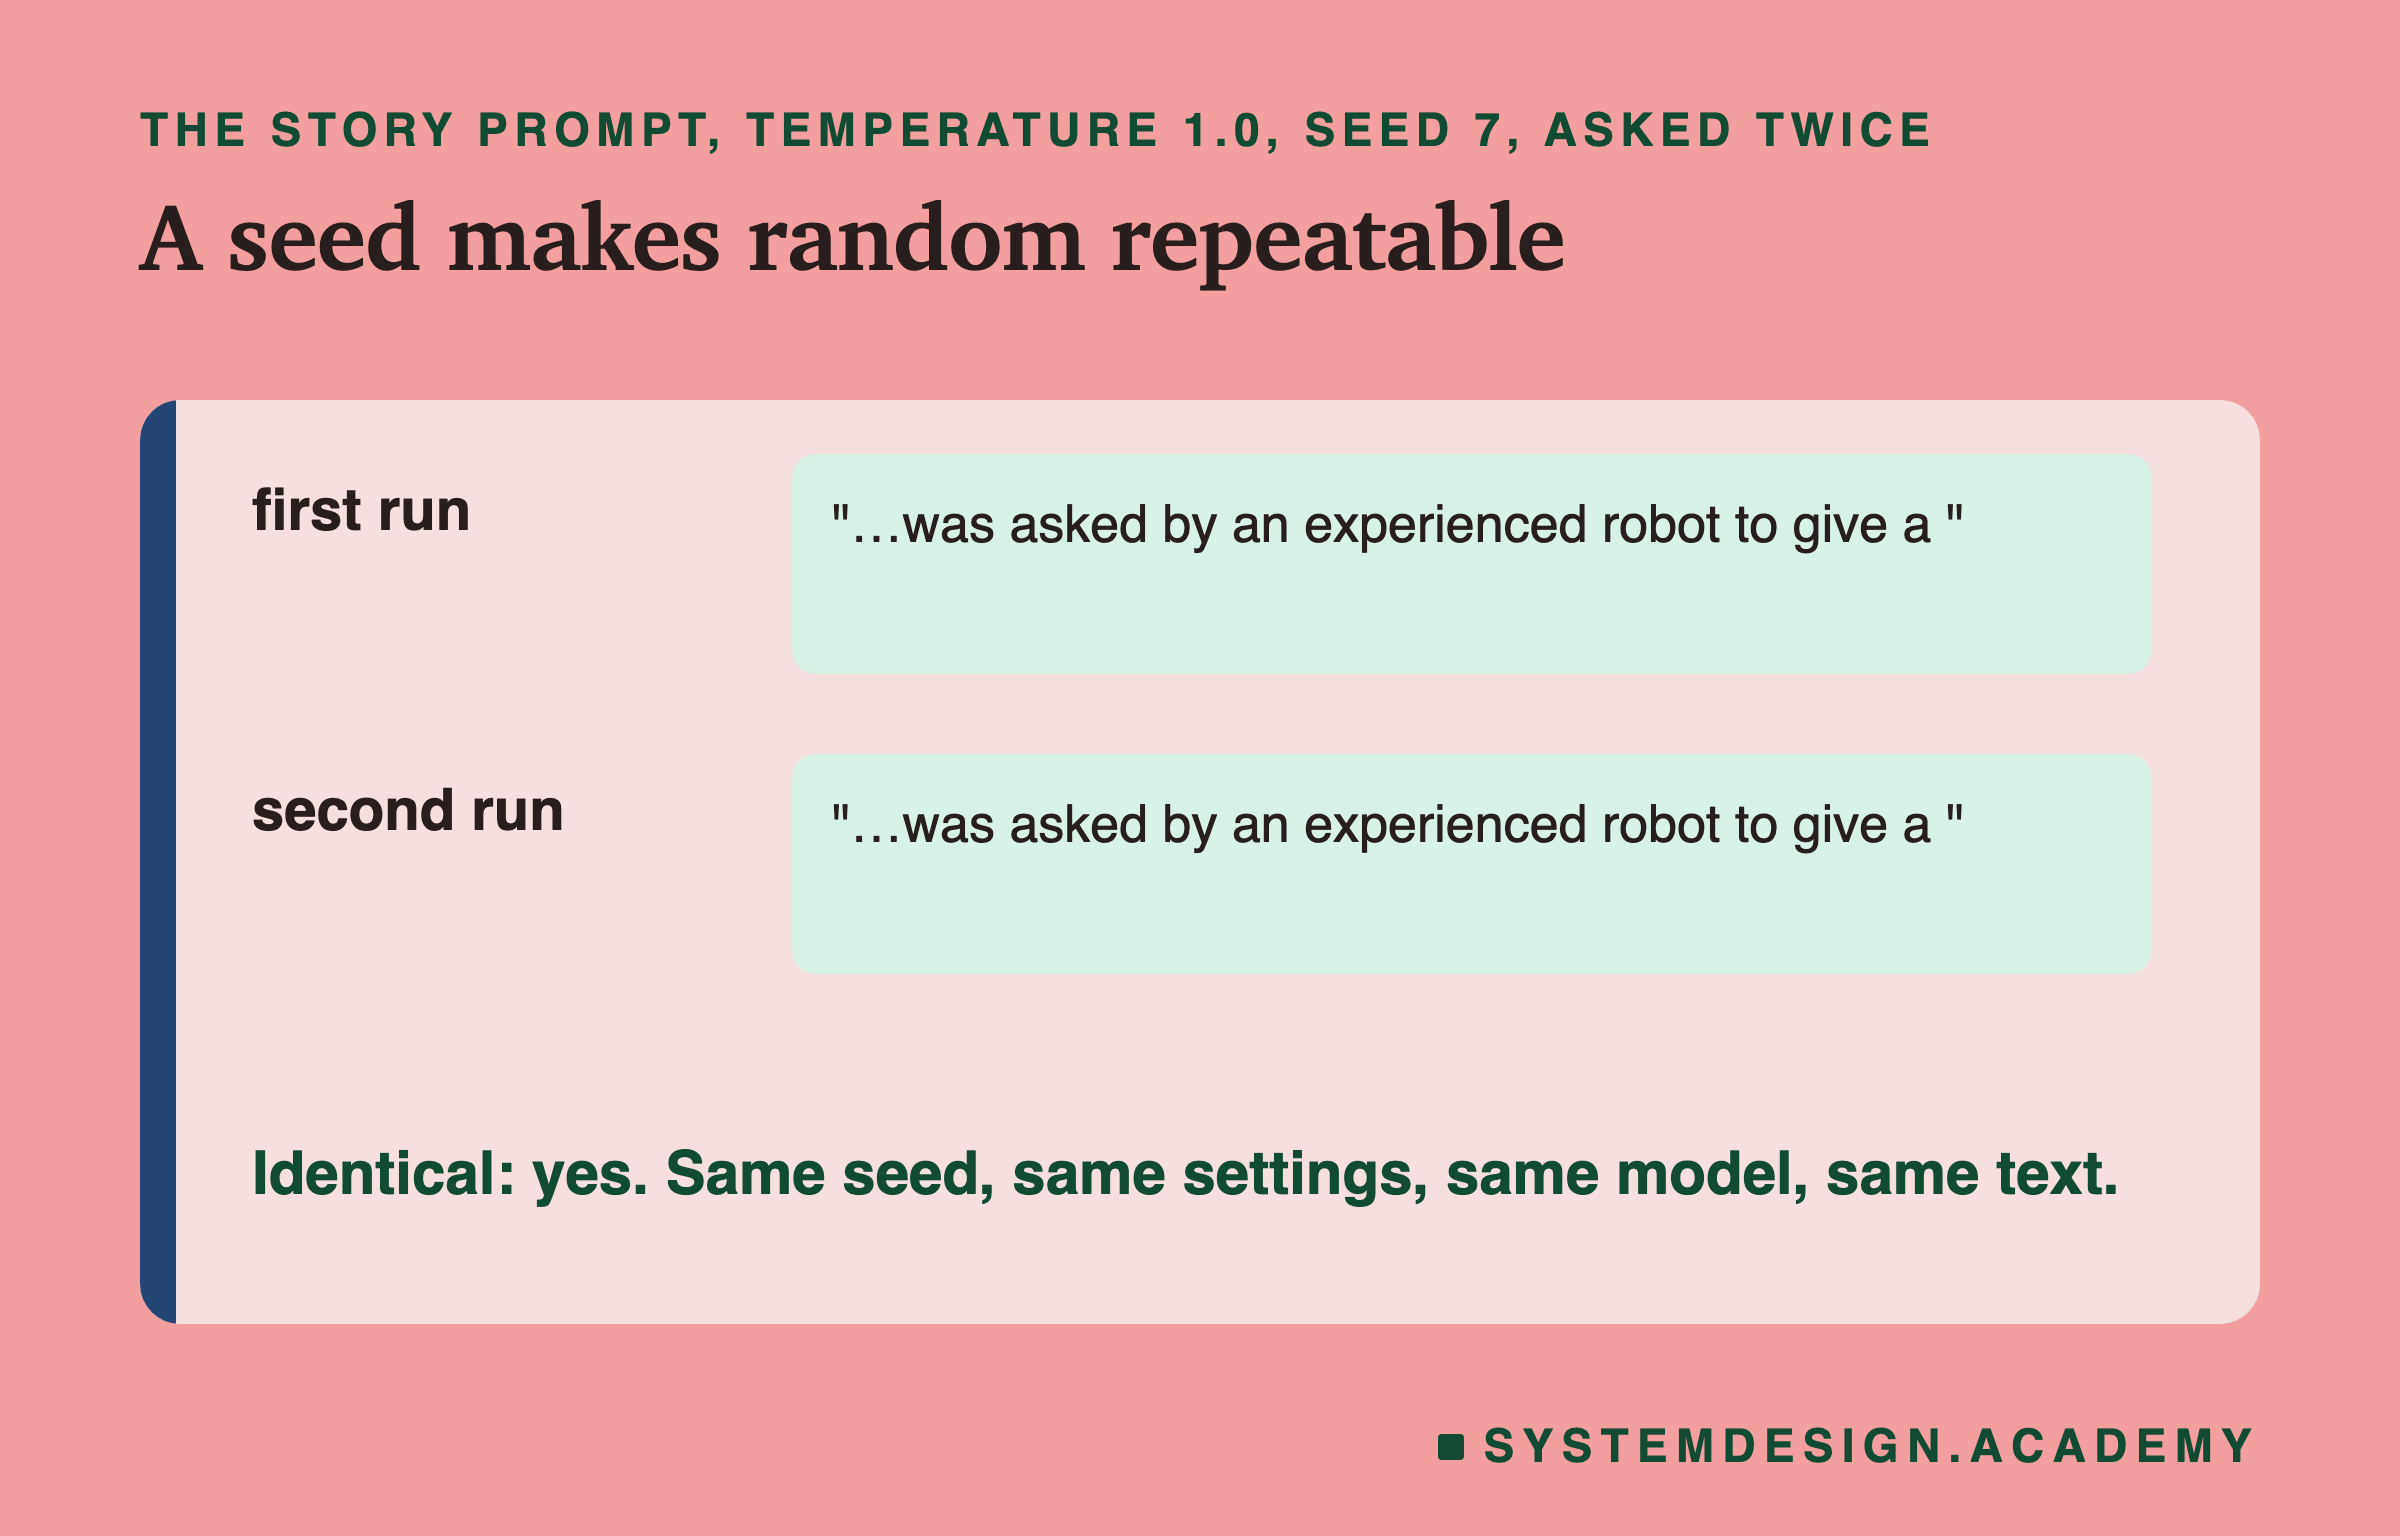
With the same seed, the same settings and the same model, the story prompt at temperature 1.0 gave exactly the same text twice. That is what makes a sampled result something you can report, test and debug. If a user shows you a strange answer, and you know the seed and settings, you can reproduce it. I only checked this on one computer and one Ollama version; other hardware or versions may give different text for the same seed.
Turn the Dial Yourself
This box holds lesson 1's real top-10 odds for "The capital of France is". It applies temperature by hand, exactly as described above, then draws 1,000 tokens. Press Run. Then change TEMPERATURE to 0.3, 0.7 or 1.5.
What you should see: at 1.0, Paris is drawn about three times in four (737 of 1,000 with the box's own seed). At 1.5 it drops to about half (481). At 0.7 it rises to about nine in ten, and at 0.3 almost every draw is Paris. Remember that this box knows only the top 10 tokens; the real model, with its full list, drifts much further, as the test showed.
Common Mistakes
Leaving the temperature unset. Most tools have a default, and it is usually not 0. Ollama's documented default is 0.8. If your application needs the same answer to the same question, such as a classification or an extracted number, and you never set the temperature, it will sometimes give a different answer, and the bug will look random.
Expecting temperature 0 to make the model correct. It makes the model consistent, not right. At temperature 0 the model wrote "Paris. The capital of Germany is Berlin" all 40 times: the same text, including the part nobody asked for.
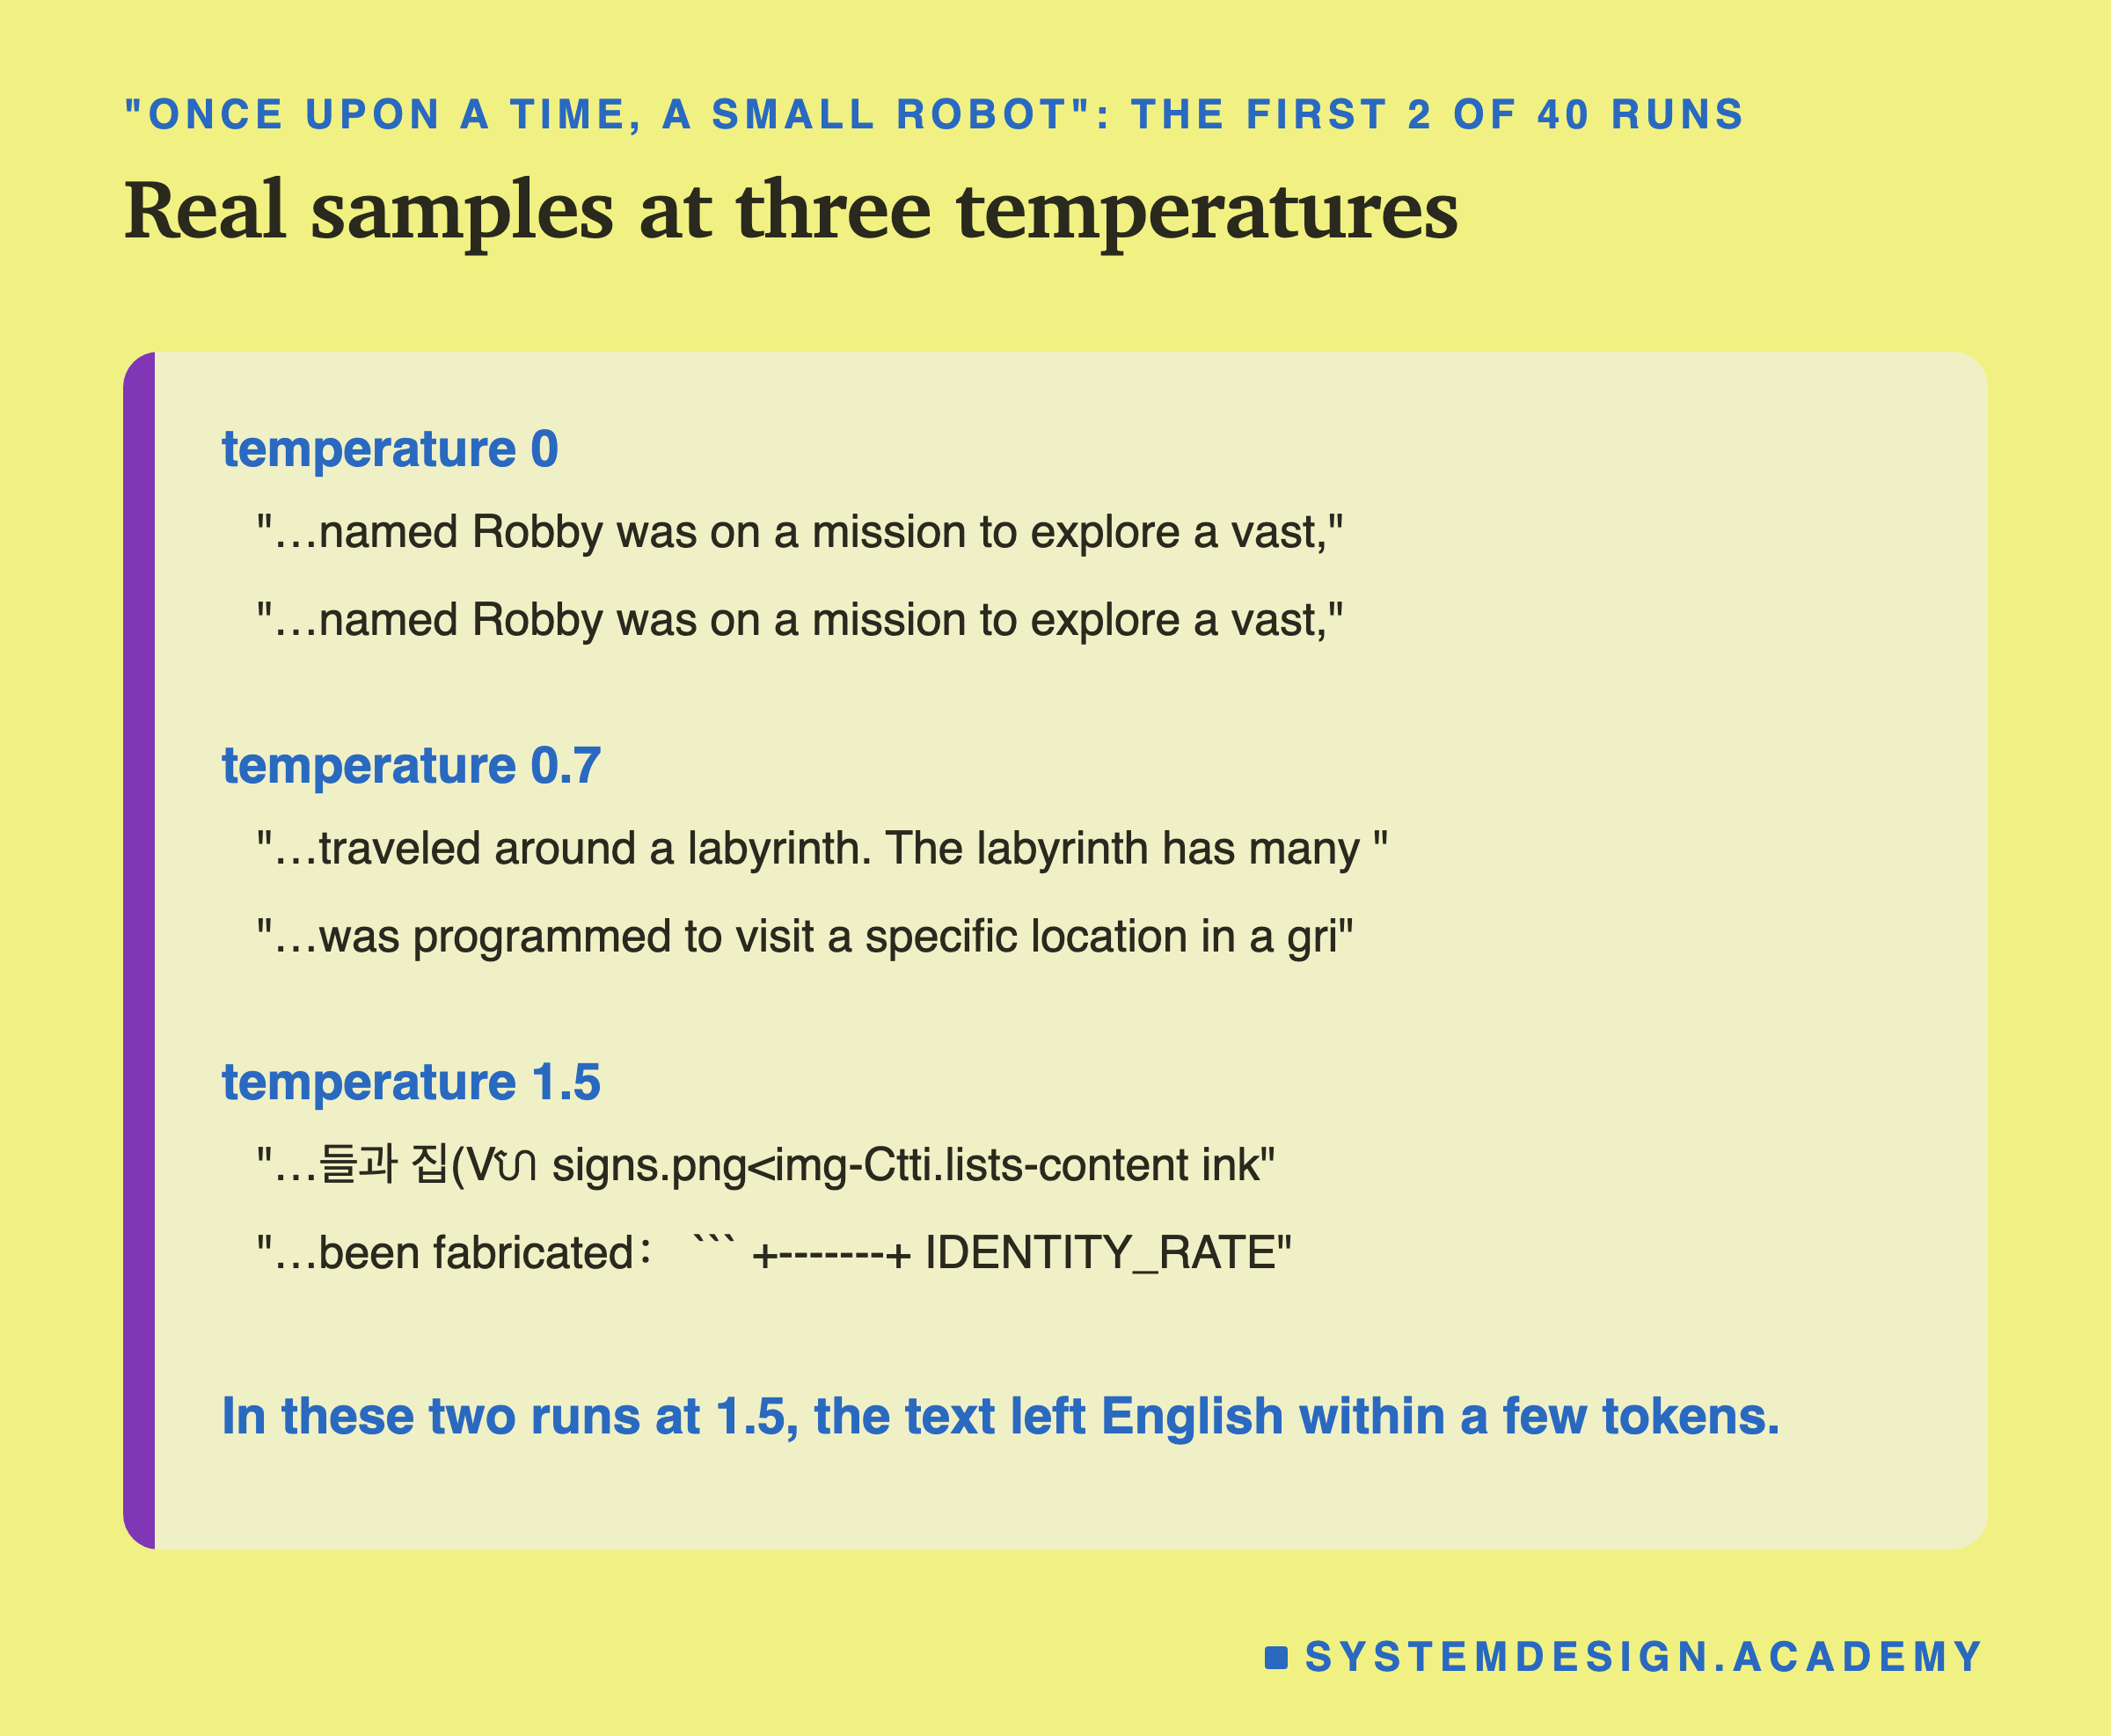
Turning the temperature up to get "creative" output. A little helps: at 0.7 the story openings were varied and still sensible. Too much does not make the text more creative; at 1.5 many runs stopped being sensible text.
Assuming variety only shows up at high temperature. On "My favourite food is", 18 of the 40 runs at temperature 0.3 already drifted into Chinese English-exam worksheets, such as "dumplings. (对划线部分提问)", which means "ask a question about the underlined part". The model has read many such worksheets, and sampling sometimes follows that path. At temperature 0 it never did. Read samples in the language and format you expect.
Reading the reported odds to see the effect of temperature. In Ollama they are the model's odds before the sampler, so they do not move when you change the dial. Look at the text.
Comparing results without a seed. Two sampled runs that differ may just be two different draws. Fix the seed when you compare settings, as this lab did.
Choosing a Temperature
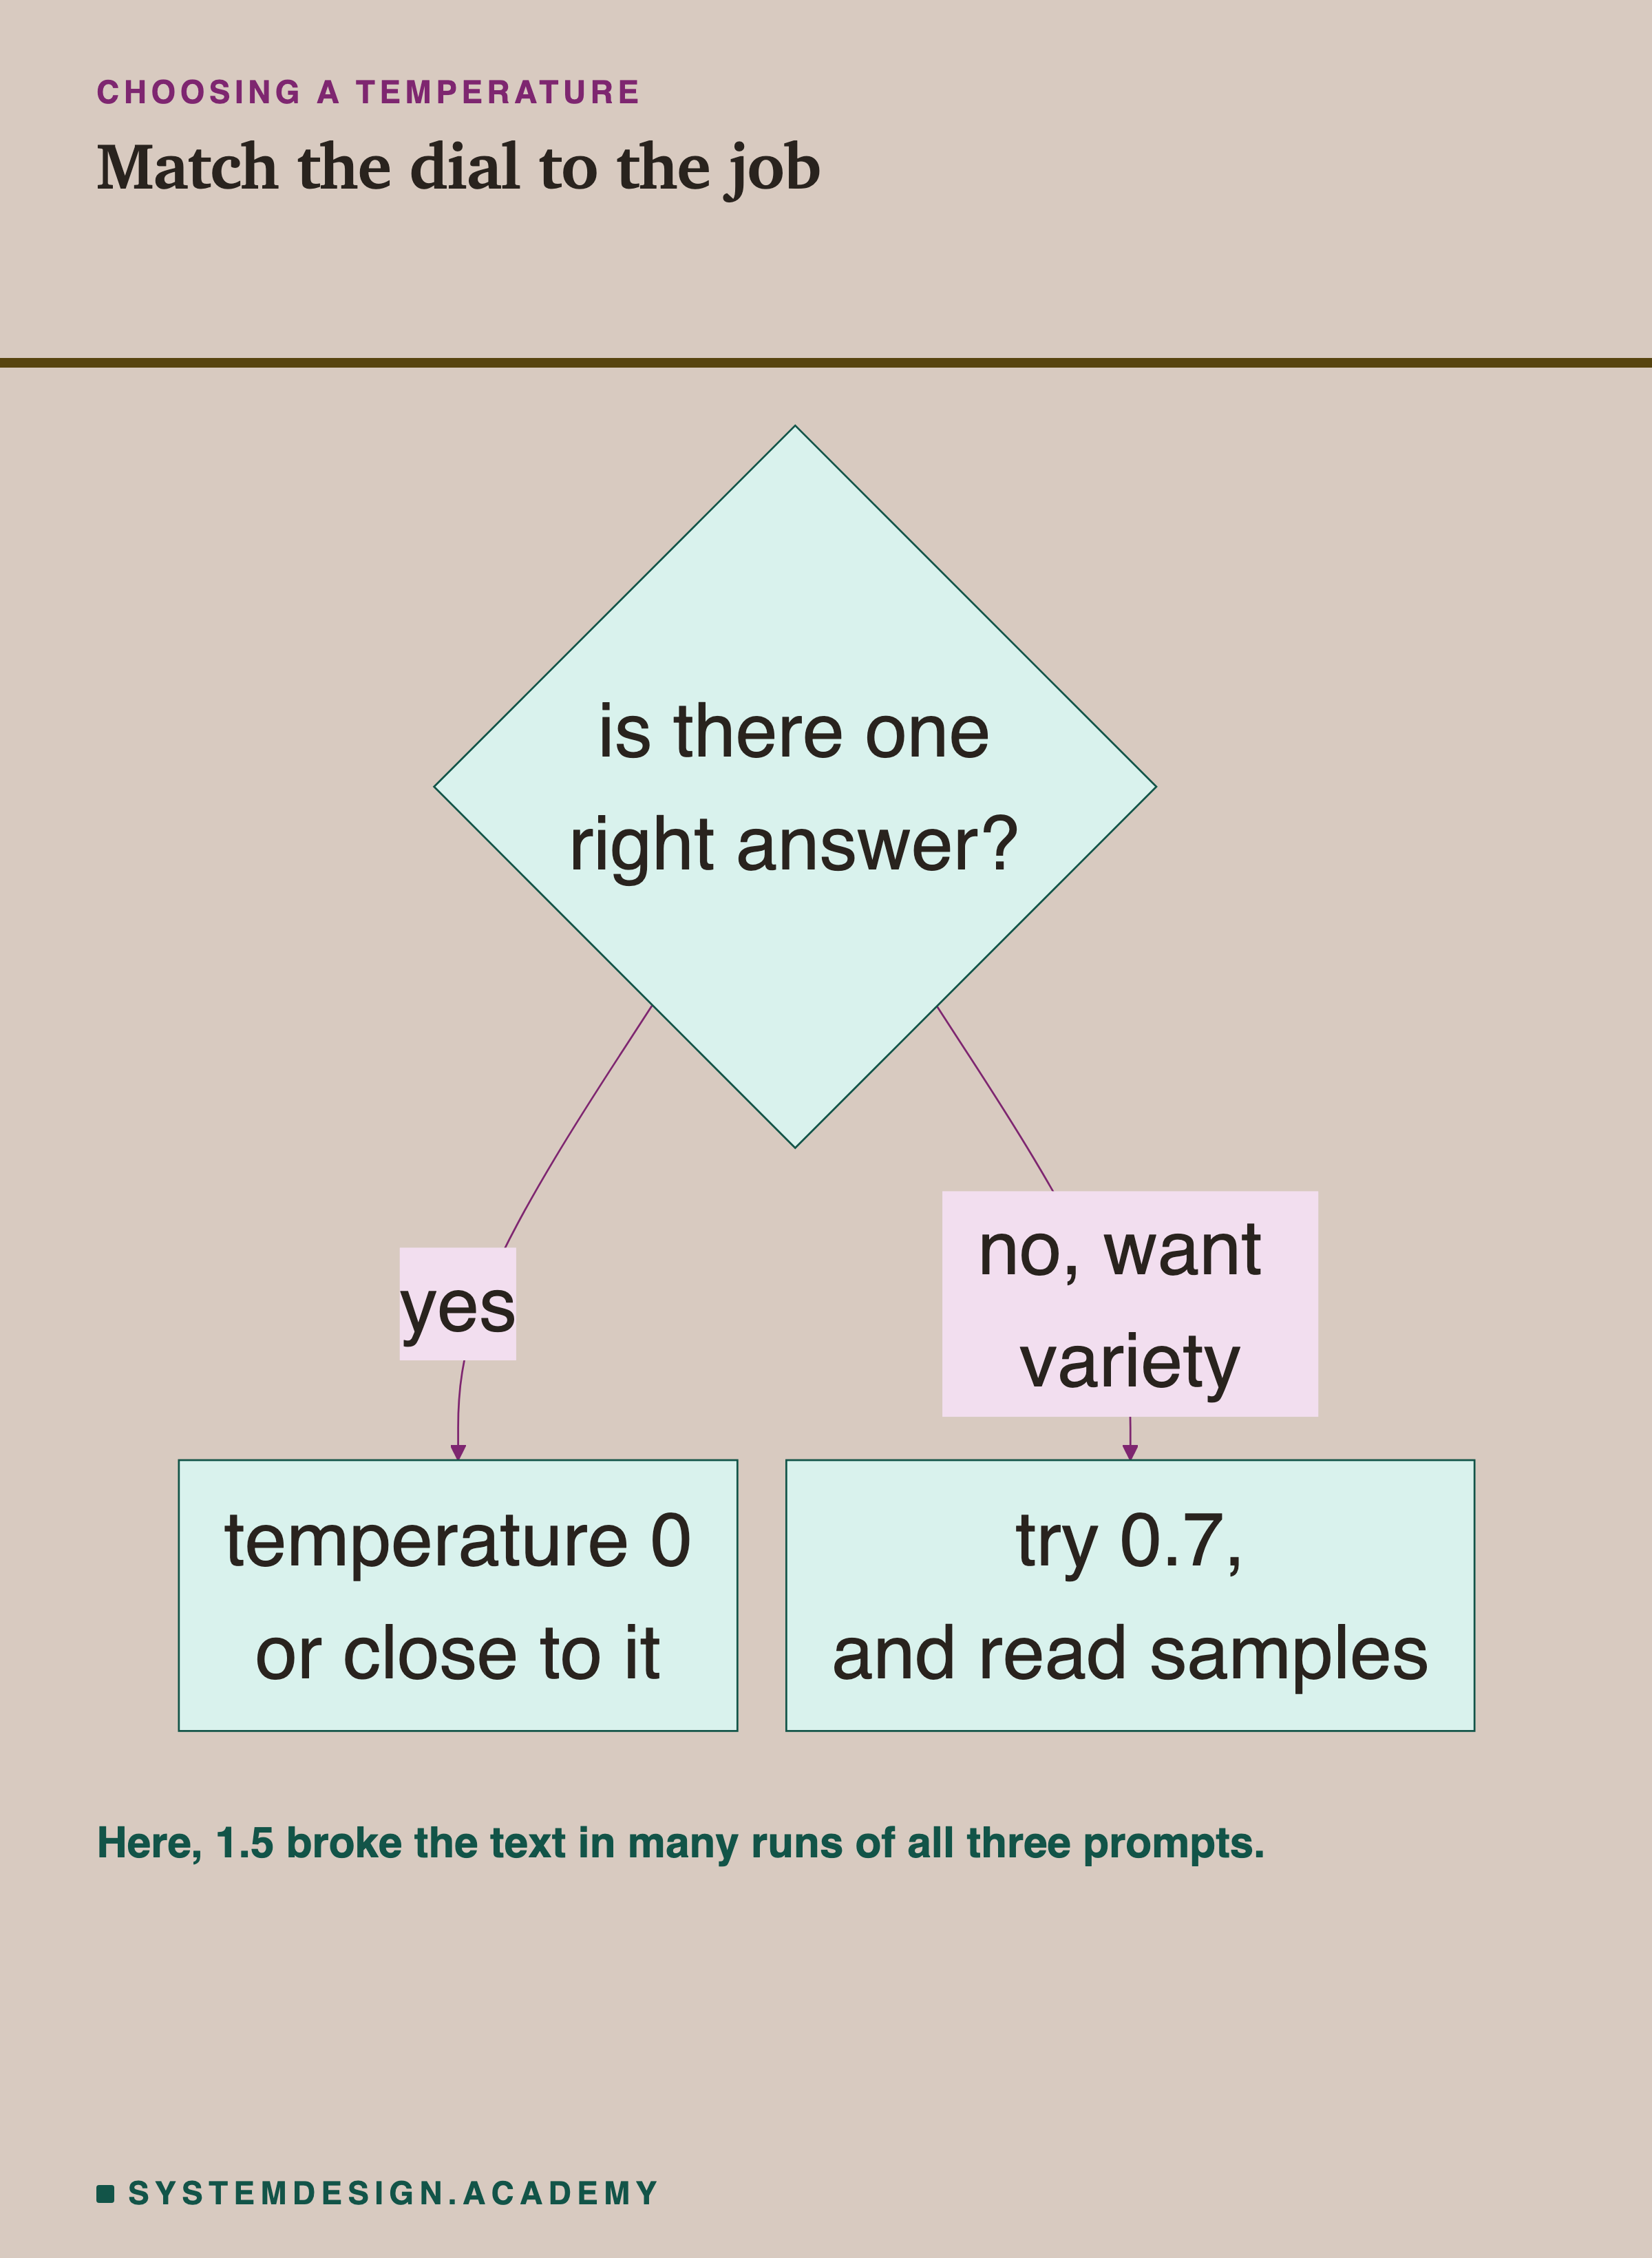
- One right answer (a fact, a number, a classification, such as JSON): use temperature 0, or close to it. Variety is only a source of mistakes here.
- Variety wanted (brainstorming, several drafts, varied wording for the same message): try around 0.7, and read ten samples before deciding. On the fact and story prompts, 0.7 gave 38 and 40 different texts out of 40, all readable. On the open prompt it also gave 40, but 30 of them drifted into Chinese worksheet text, so read before you trust.
- A filter to cut off rare tokens: Ollama's defaults already use top_k 40 and top_p 0.9. They remove the long tail of the list, which is what broke the text at 1.5 here. I did not test them at 1.5, so measure before relying on them.
- Always set it yourself, with a seed when you need to repeat a result. Never rely on a default you have not checked.
What This Lesson Measured, and What It Did Not
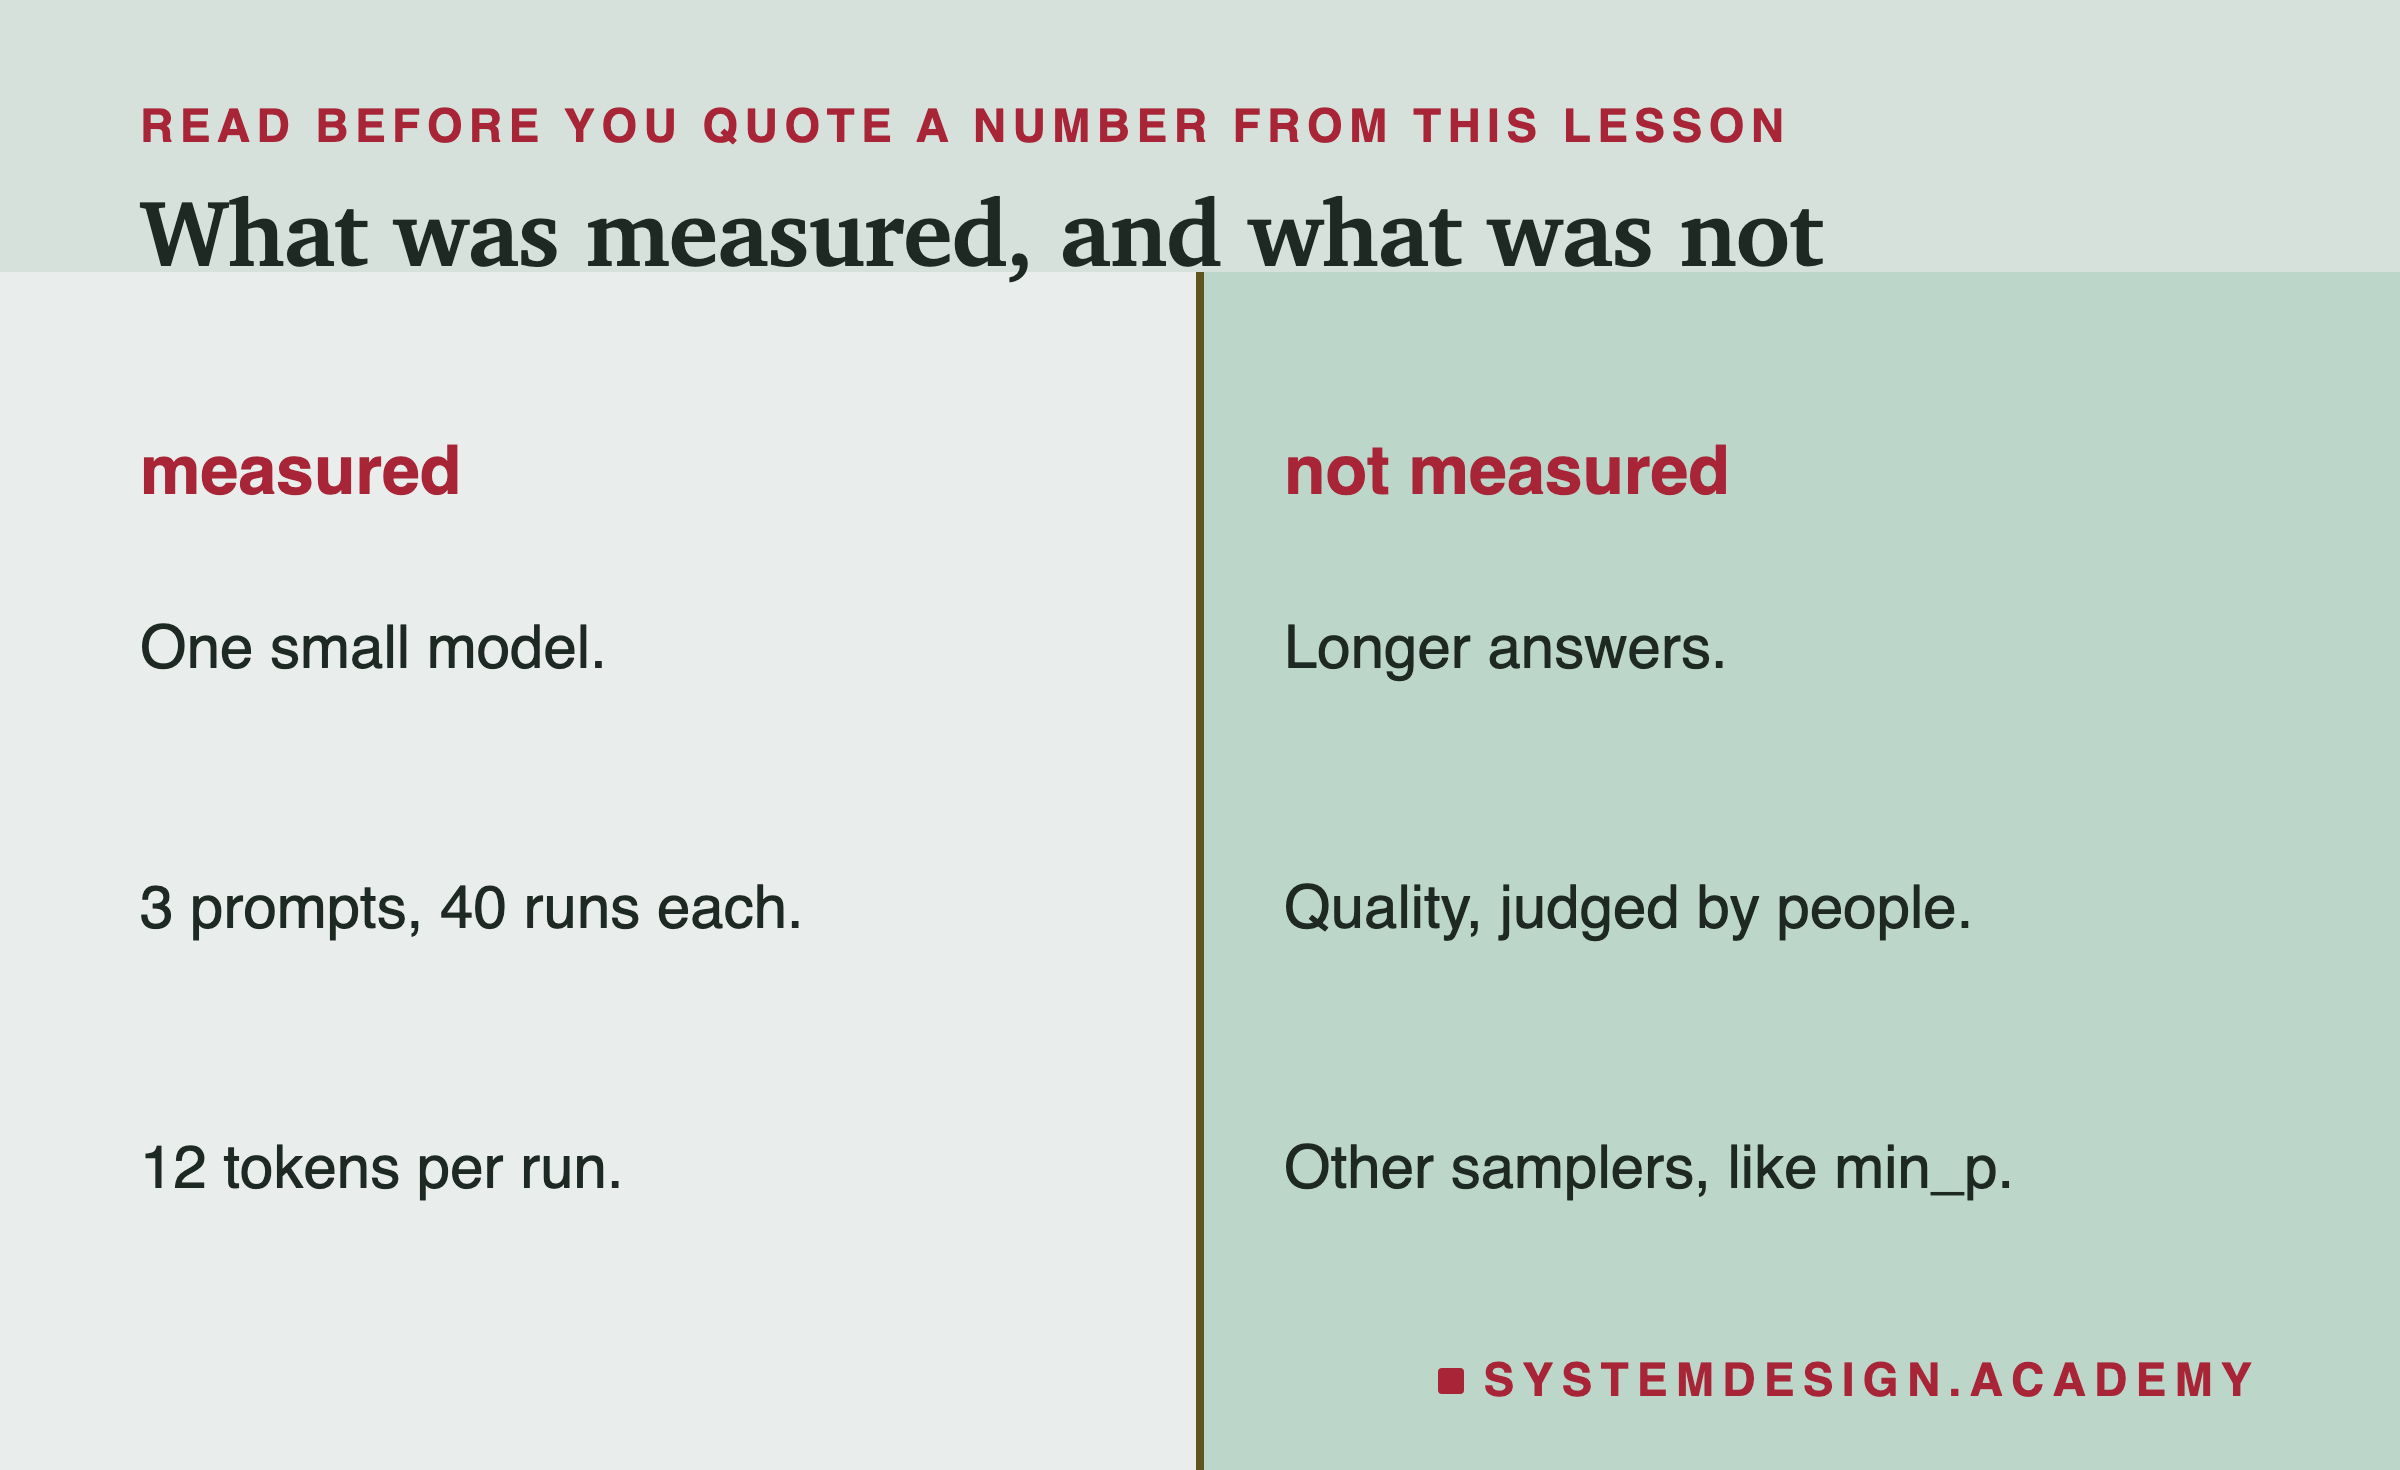
Measured: one small model, qwen2.5:3b; 3 prompts; 5 temperatures and 5 filter settings; 40 runs per setting with fixed seeds; 12 tokens per run. For each setting, how many texts and first words differed, and for the fact prompt, how often the answer began with Paris.
Not measured: longer answers, where small differences grow further; whether a varied answer was a better answer, which needs people to judge; larger models, whose odds may be sharper or flatter; and other ways of picking tokens, such as min_p, which Ollama also offers. The seed check ran on one computer only.
What to Do Next
- Run
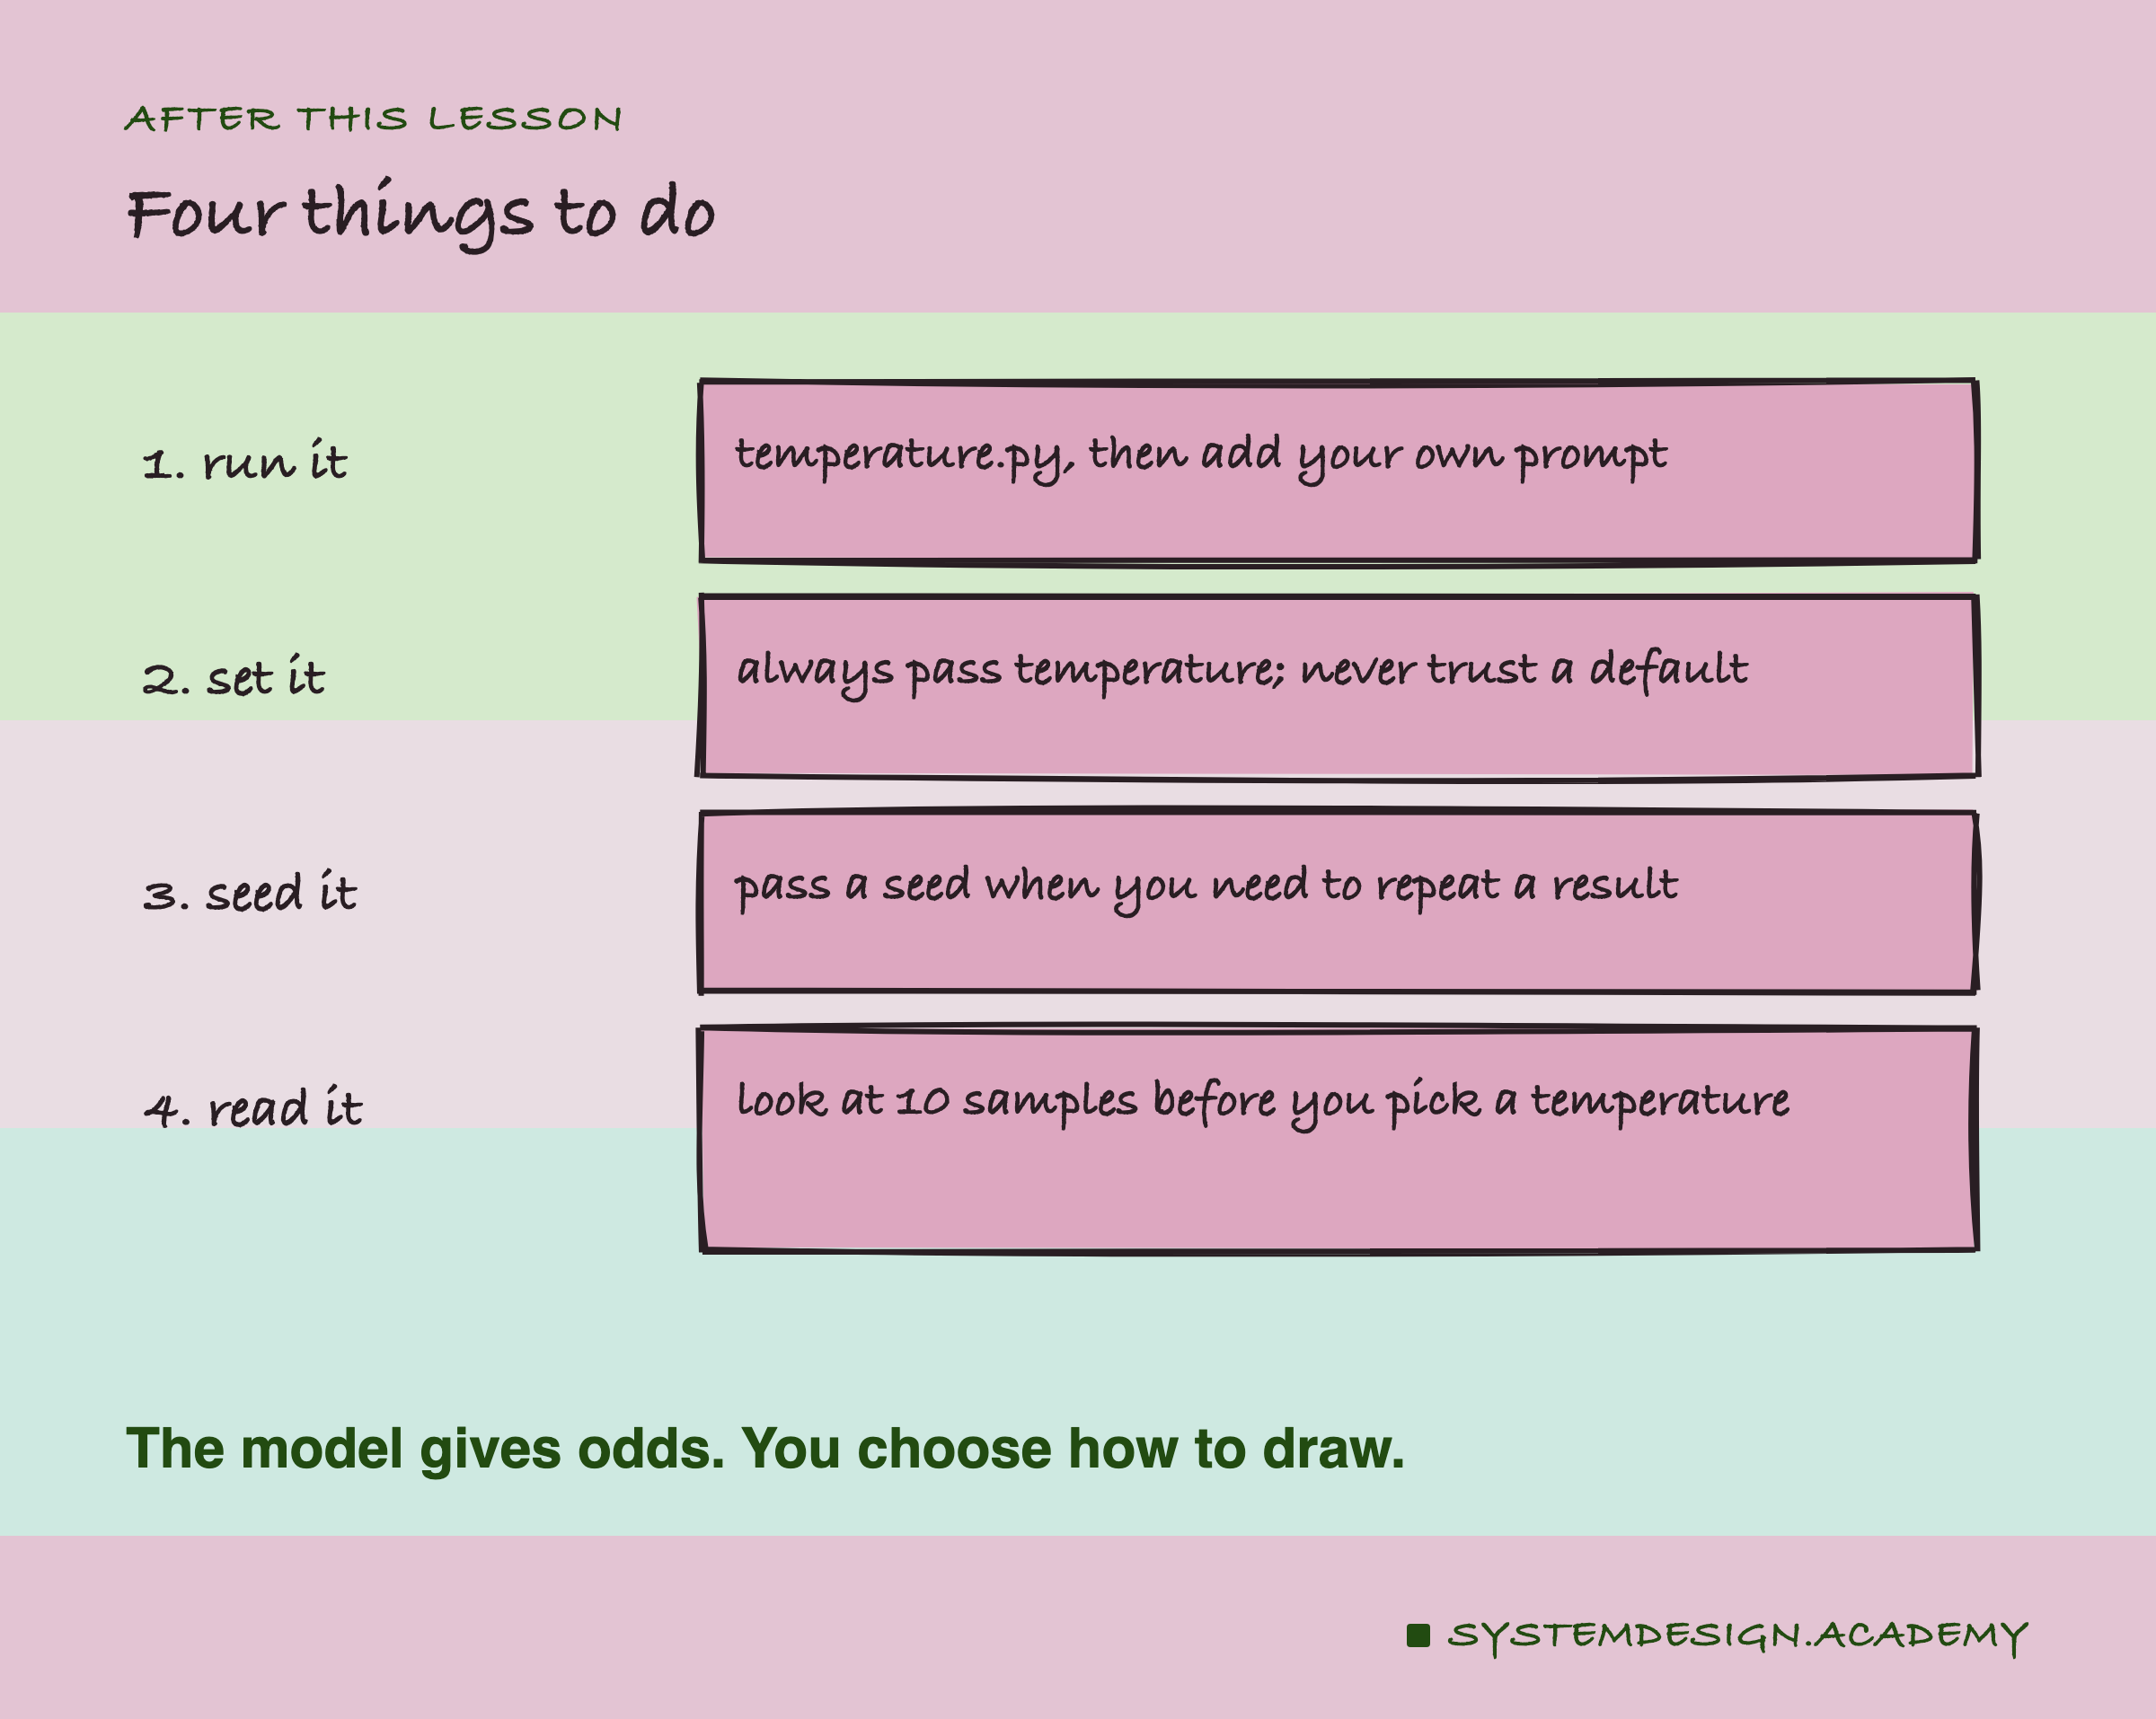
temperature.py, then try a prompt of your own, such as a question from your own work. Change the list of temperatures to[0, 0.3, 0.7, 1.0]and watch where your prompt starts to vary. - Always pass a temperature in your requests, and write down why you chose it. A classification or an extracted number wants 0; a list of ideas wants more.
- Pass a seed when you need to repeat a result, for a test or a bug report, and record the seed with the result.
- Read ten samples before you settle on a temperature. Look for drift into other languages or formats, as the open prompt did here.
The model only gives odds. How you draw from them is your choice, and now you can predict what each choice does. The next lesson looks at time: why a model reads a long prompt quickly but writes its answer one slow token at a time.
Knowledge Check
Knowledge Check
5 questions - Score 80% to pass
At temperature 0, all 40 runs of each prompt wrote the same text. Why?
Paris is 14.33 times as likely as a blank. At temperature 0.5, about how many times as likely is it?
The top-10 arithmetic gave Paris 0.51 at temperature 1.5, but Paris came first in only 5 of 40 real runs. Why the gap?
With top_p 0.5 at temperature 1.0, all 40 runs of the fact prompt began with "Paris." but 26 different texts followed. Why?
You need to repeat a sampled result exactly for a test. What do you set?