Marking Papers at Midnight
Picture a teacher marking a tall pile of worksheets late at night. Most of the marks are right. A few are wrong: a 3 marked as an 8, a correct answer crossed out. By the bottom of the pile, tired eyes make more of these slips.
Now imagine a student who learns only from those marked sheets. Every wrong mark teaches them something false.
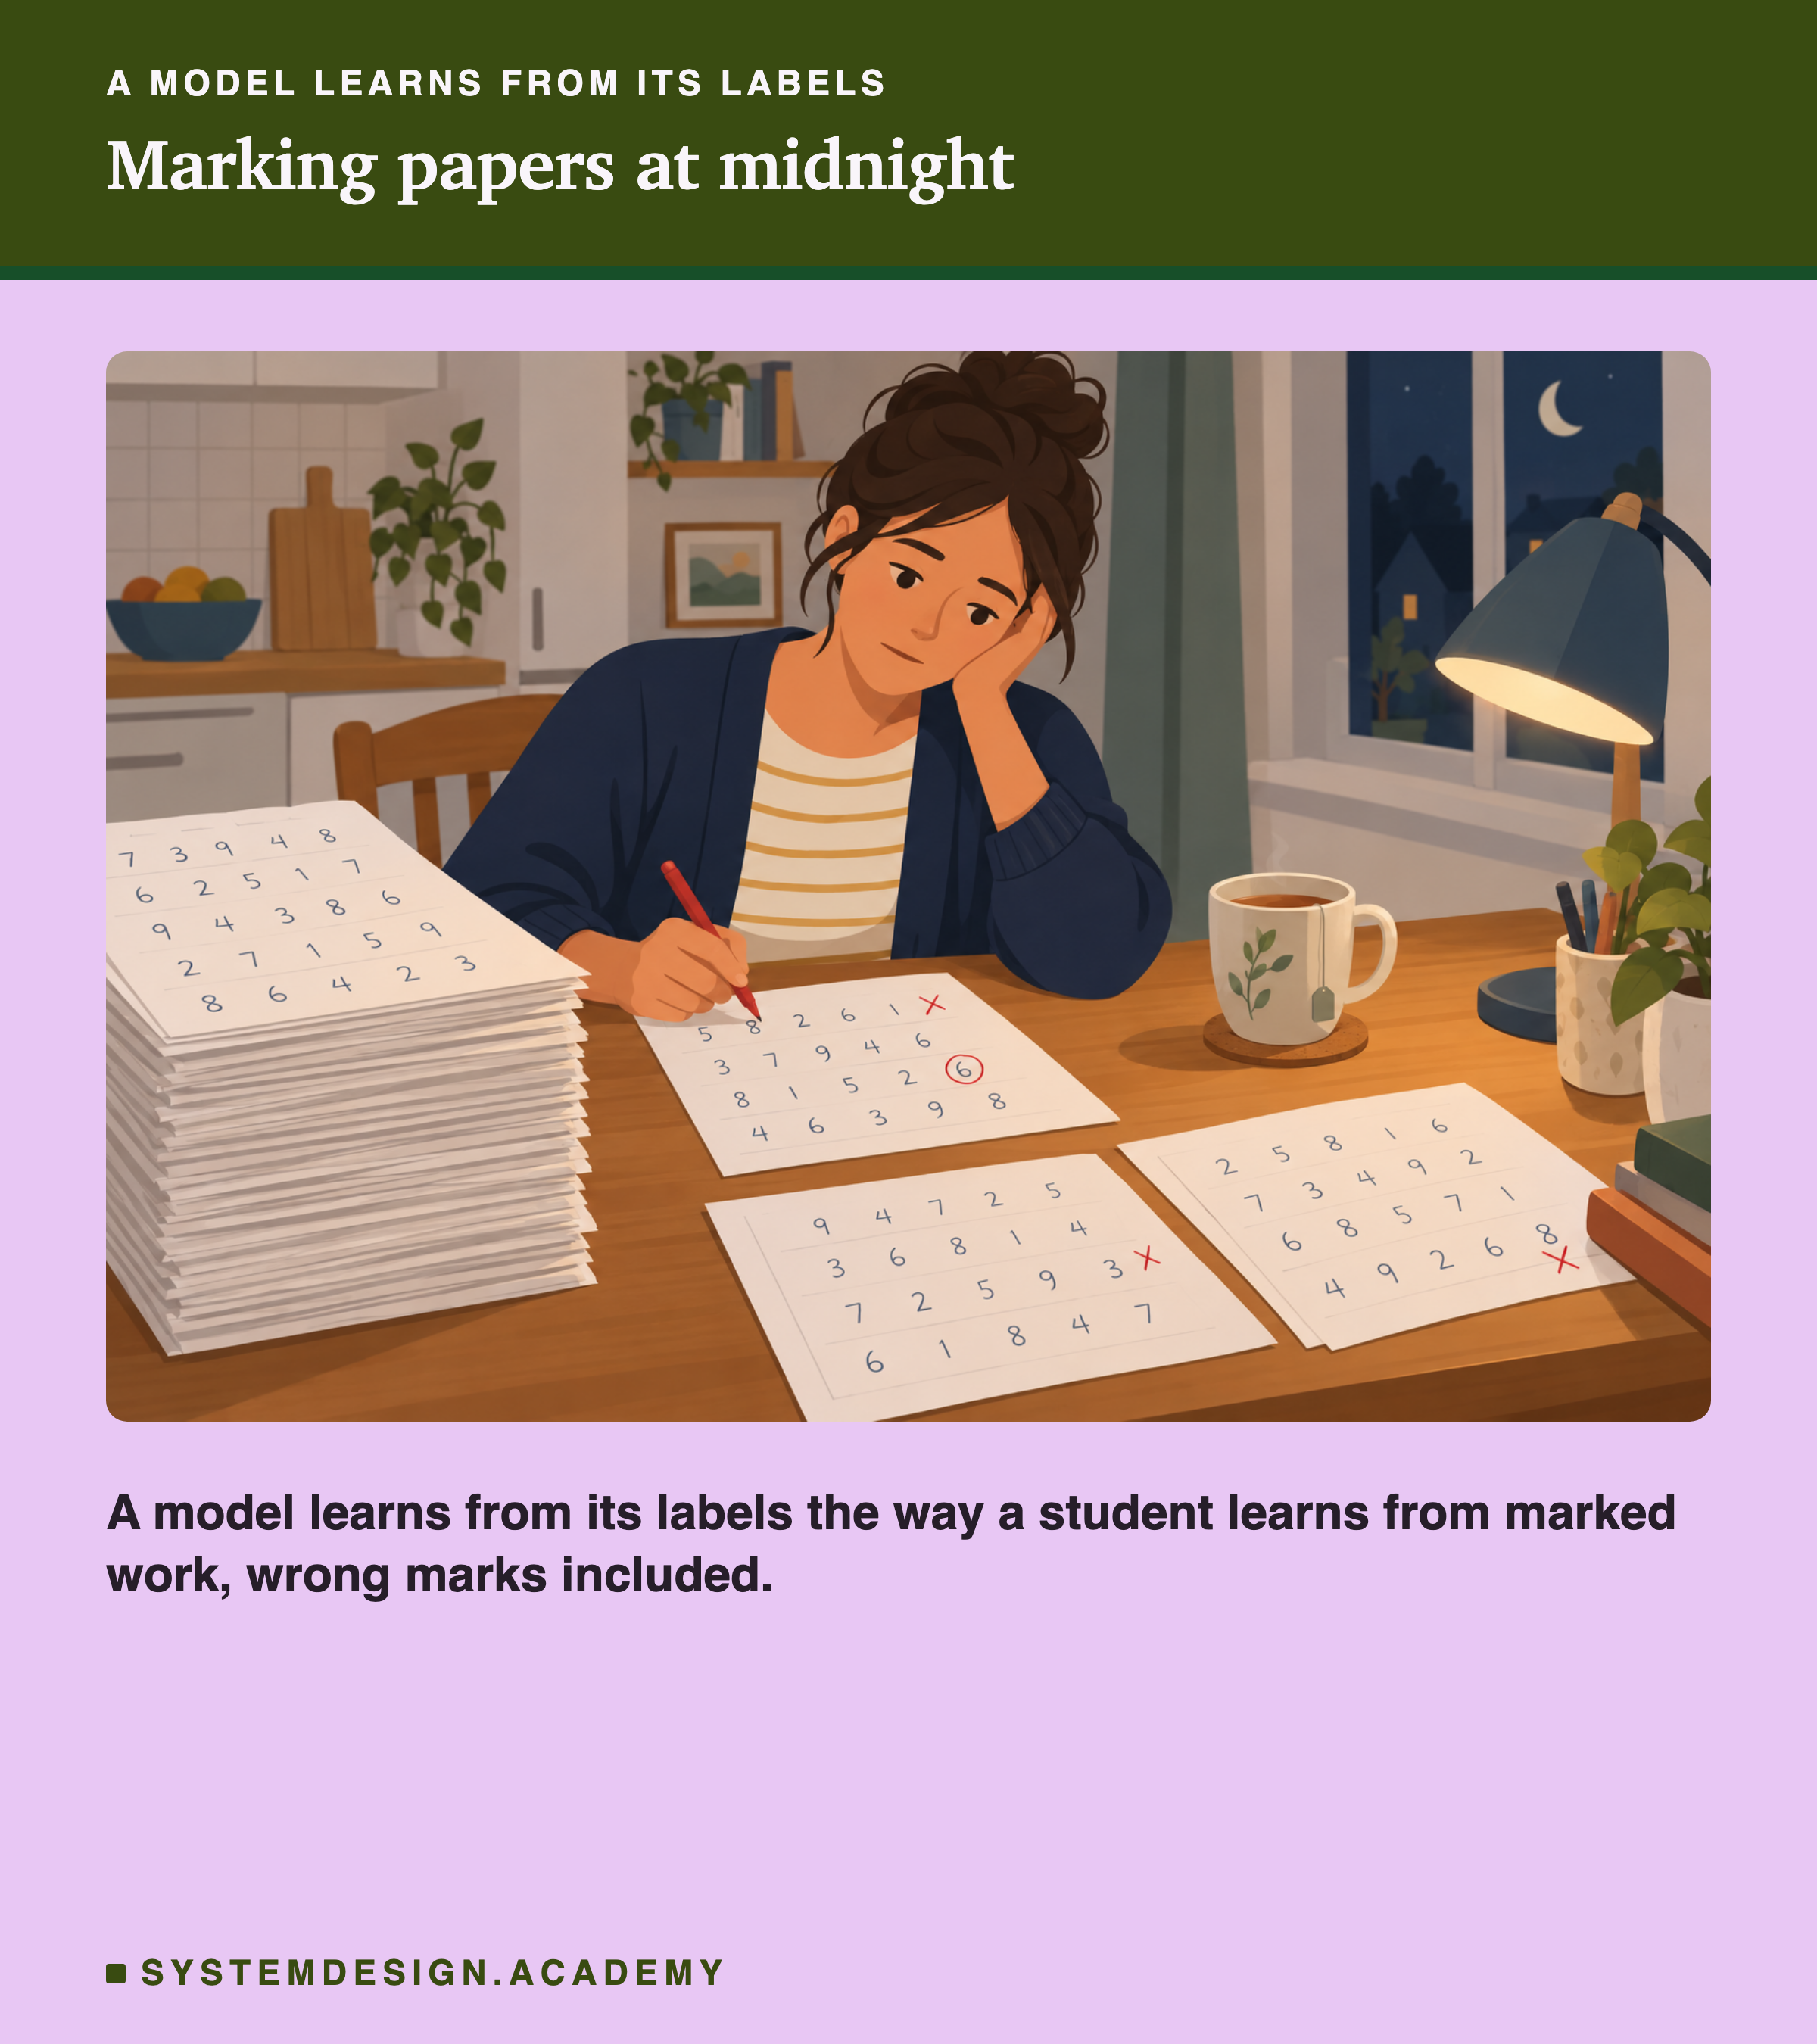
A machine learning model is that student. It learns from examples that people have labelled, and some of those labels are always wrong. In this lesson I measure how many wrong labels a model can survive, whether it matters which labels are wrong, and whether you can find them without re-checking every row by hand.
The Words You Need First
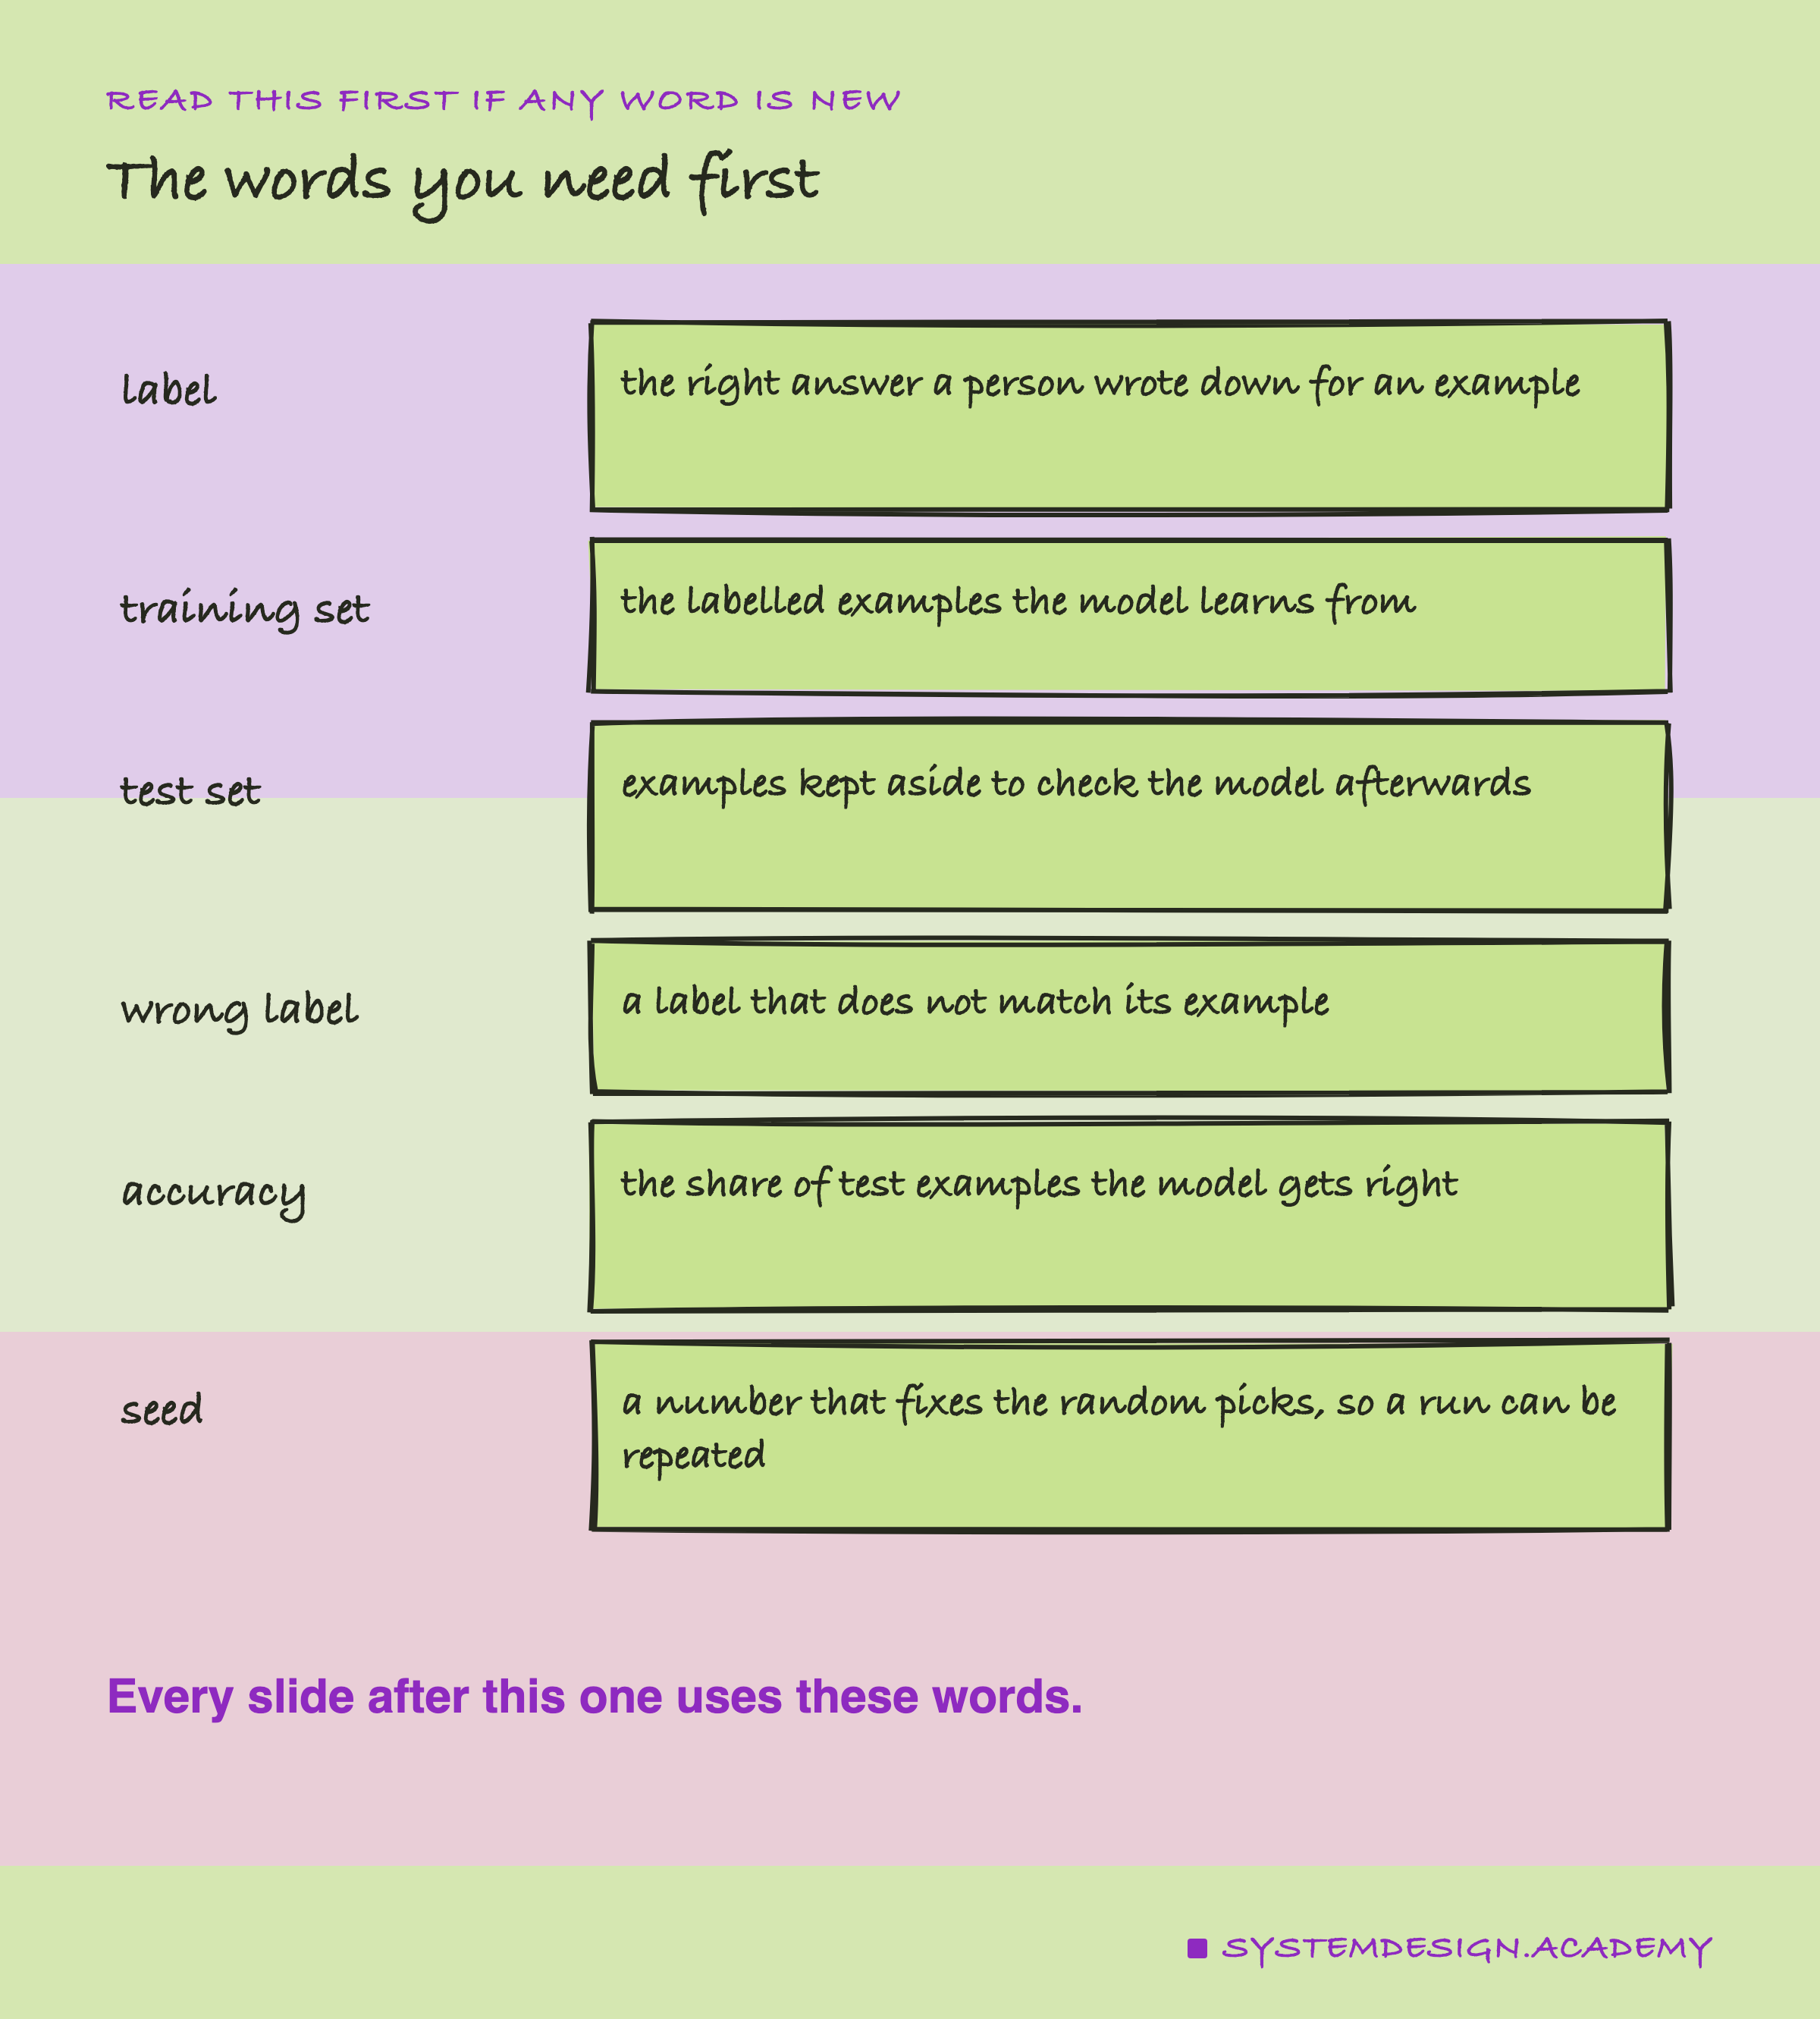
Label. The answer a person attached to an example. For a picture of a handwritten 7, the label should be "7". Usually it is right, sometimes not.
Training set. The labelled examples the model learns from.
Test set. Separate labelled examples, kept aside, used only to check the model afterwards. The model never learns from them.
Wrong label. A label that does not match the example. Engineers also call these noisy labels, or label noise.
Model. Here, a program that learns to tell the digits apart from the training set.
Accuracy. The share of test examples the model gets right. When I say a model "lost 3 points", I mean its accuracy fell by 3 percentage points, say from 97% to 94%.
Seed. A number that fixes which rows are picked at random, so a run can be repeated exactly. Using many seeds shows how much a result moves just from the luck of which rows were picked.
Two Kinds of Wrong Label
Not all wrong labels are alike, and the lab tests two kinds.
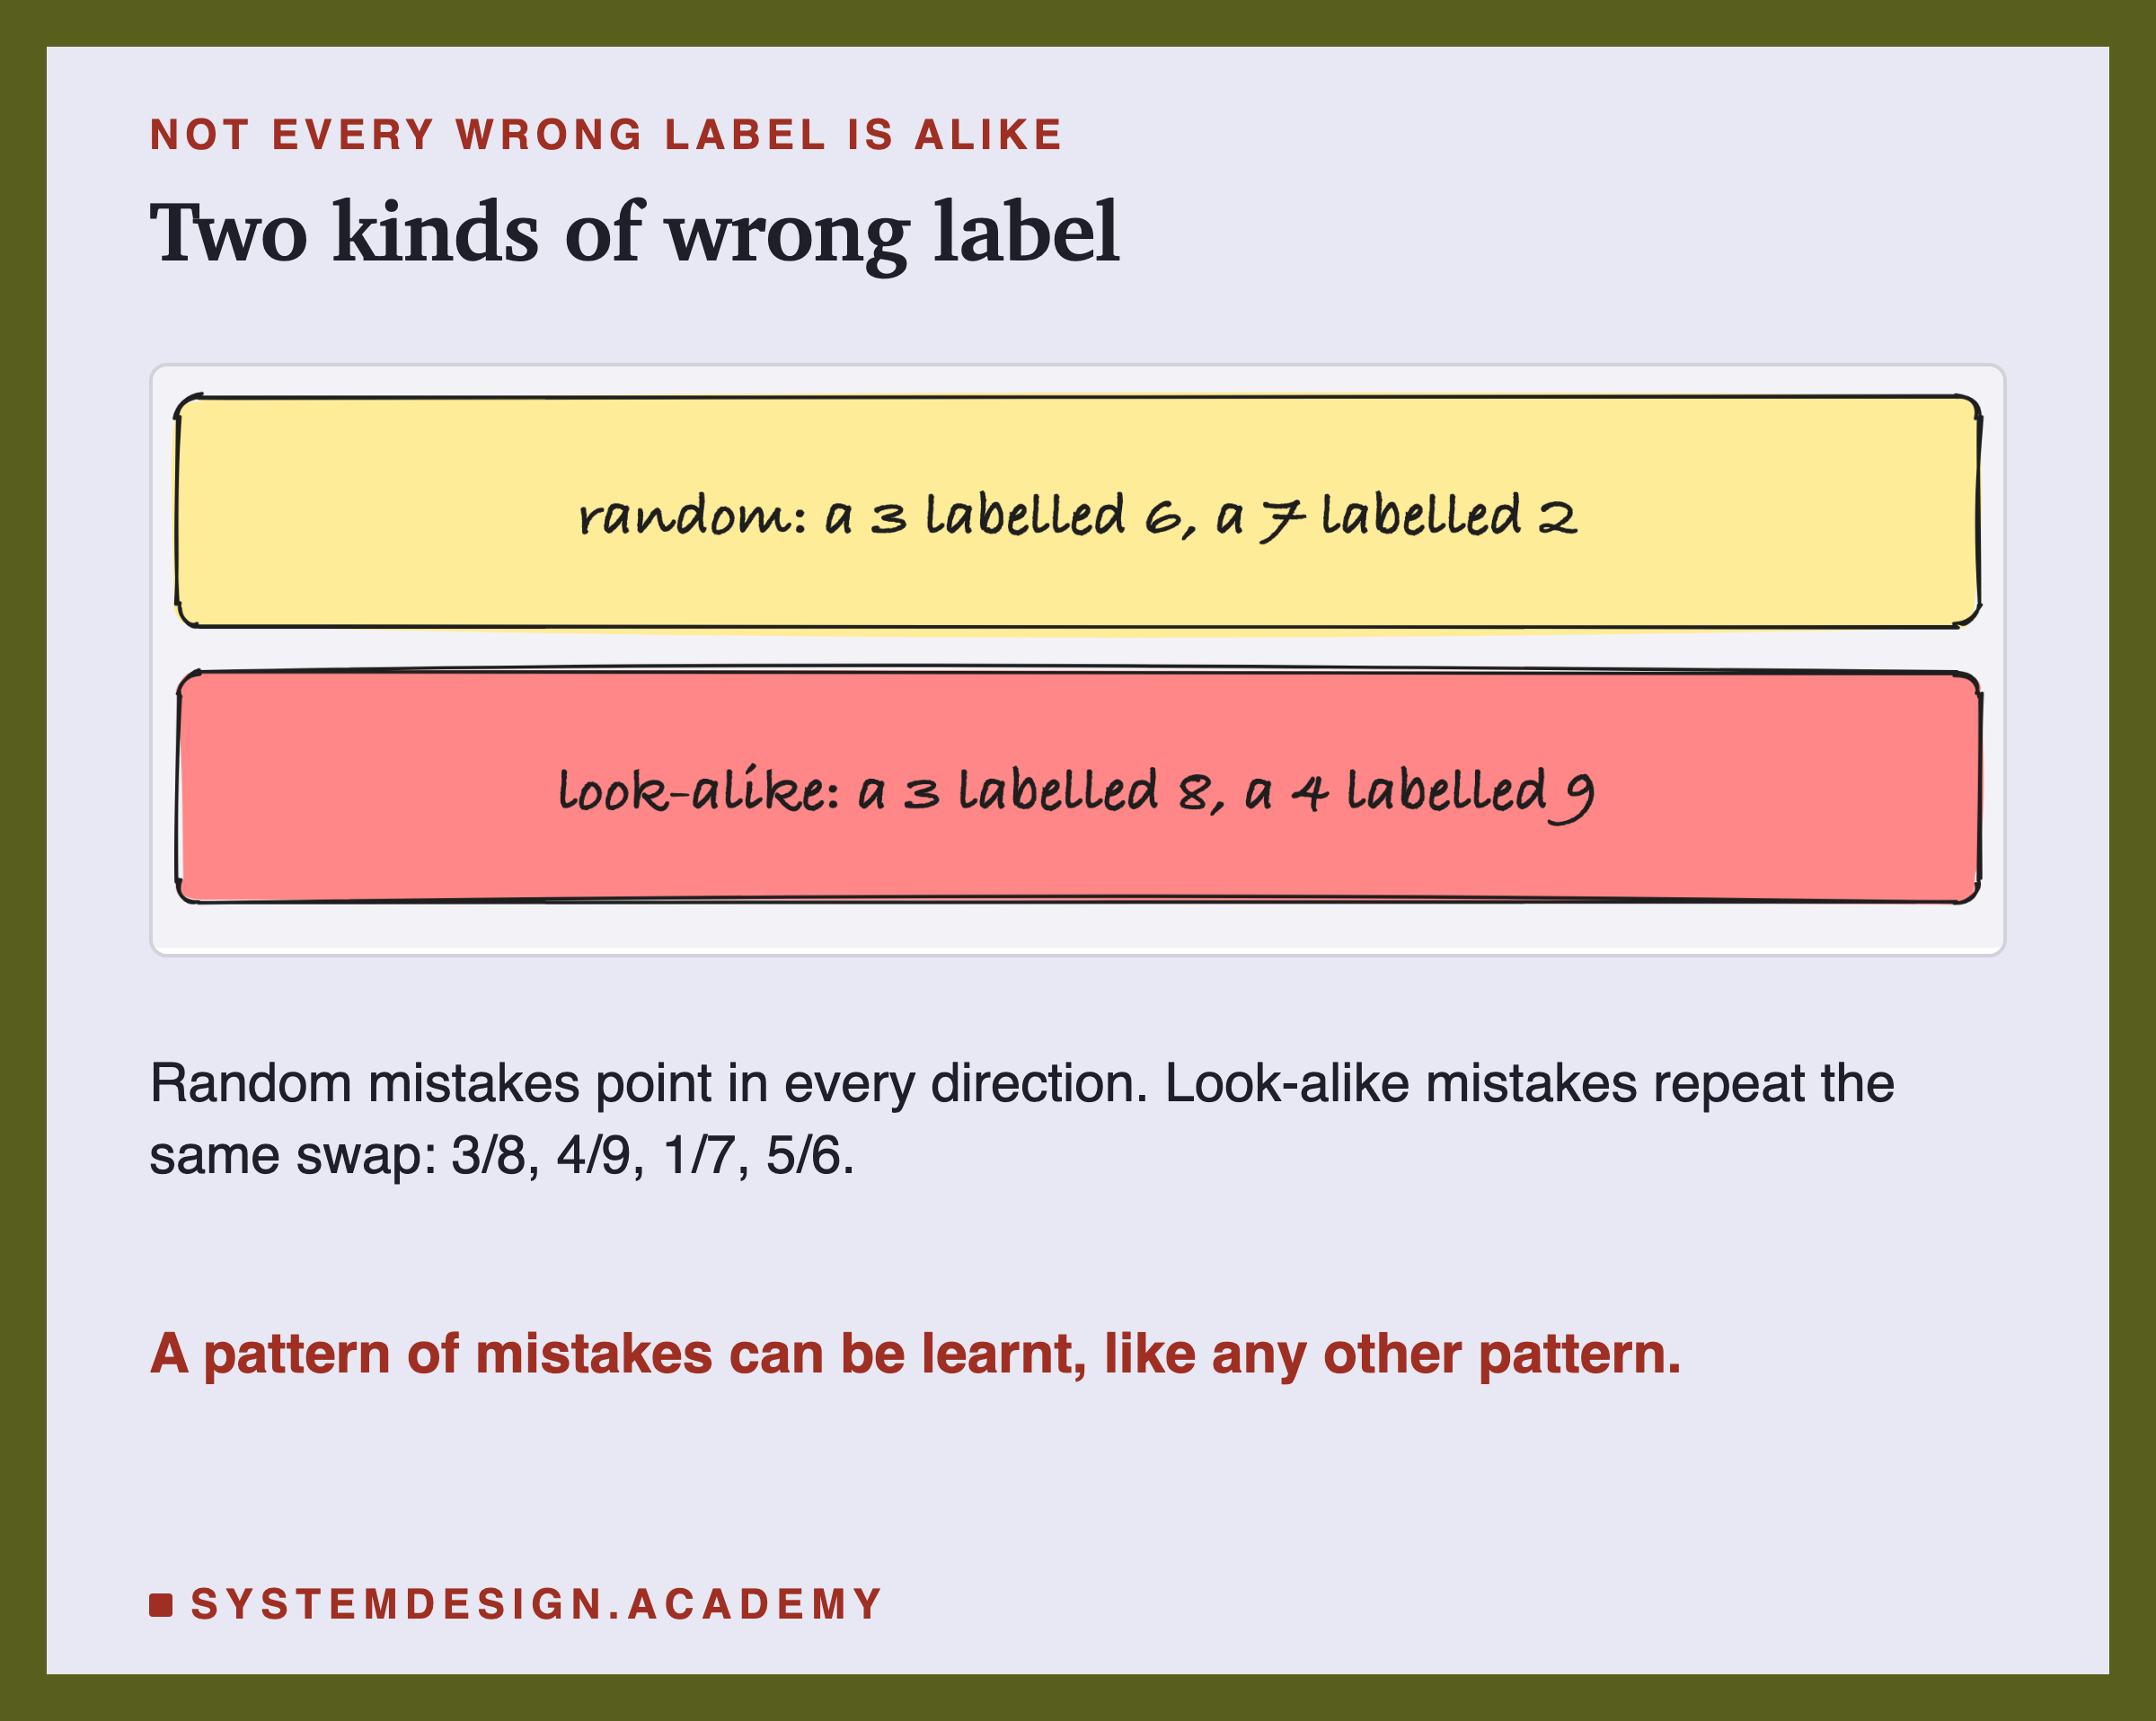
Random. Each wrong label is a different digit picked at random. A spilled drink or a slipped finger makes these: mistakes with no pattern.
Look-alike. Each wrong label swaps a digit for its look-alike partner: 3 and 8, 4 and 9, 1 and 7, 5 and 6. A tired person makes these: the same confusions, again and again. The digits 0 and 2 have no partner here, so they are never swapped.
Why should the kind matter? Take random mistakes at 40 percent. Of all the 3s, 60 percent are still labelled 3, and the wrong ones are spread over the other nine digits, about 4 percent each. The true label still wins any vote by a mile. Look-alike mistakes all point the same way, so a wrong answer can gather real support.
How the Lab Was Built
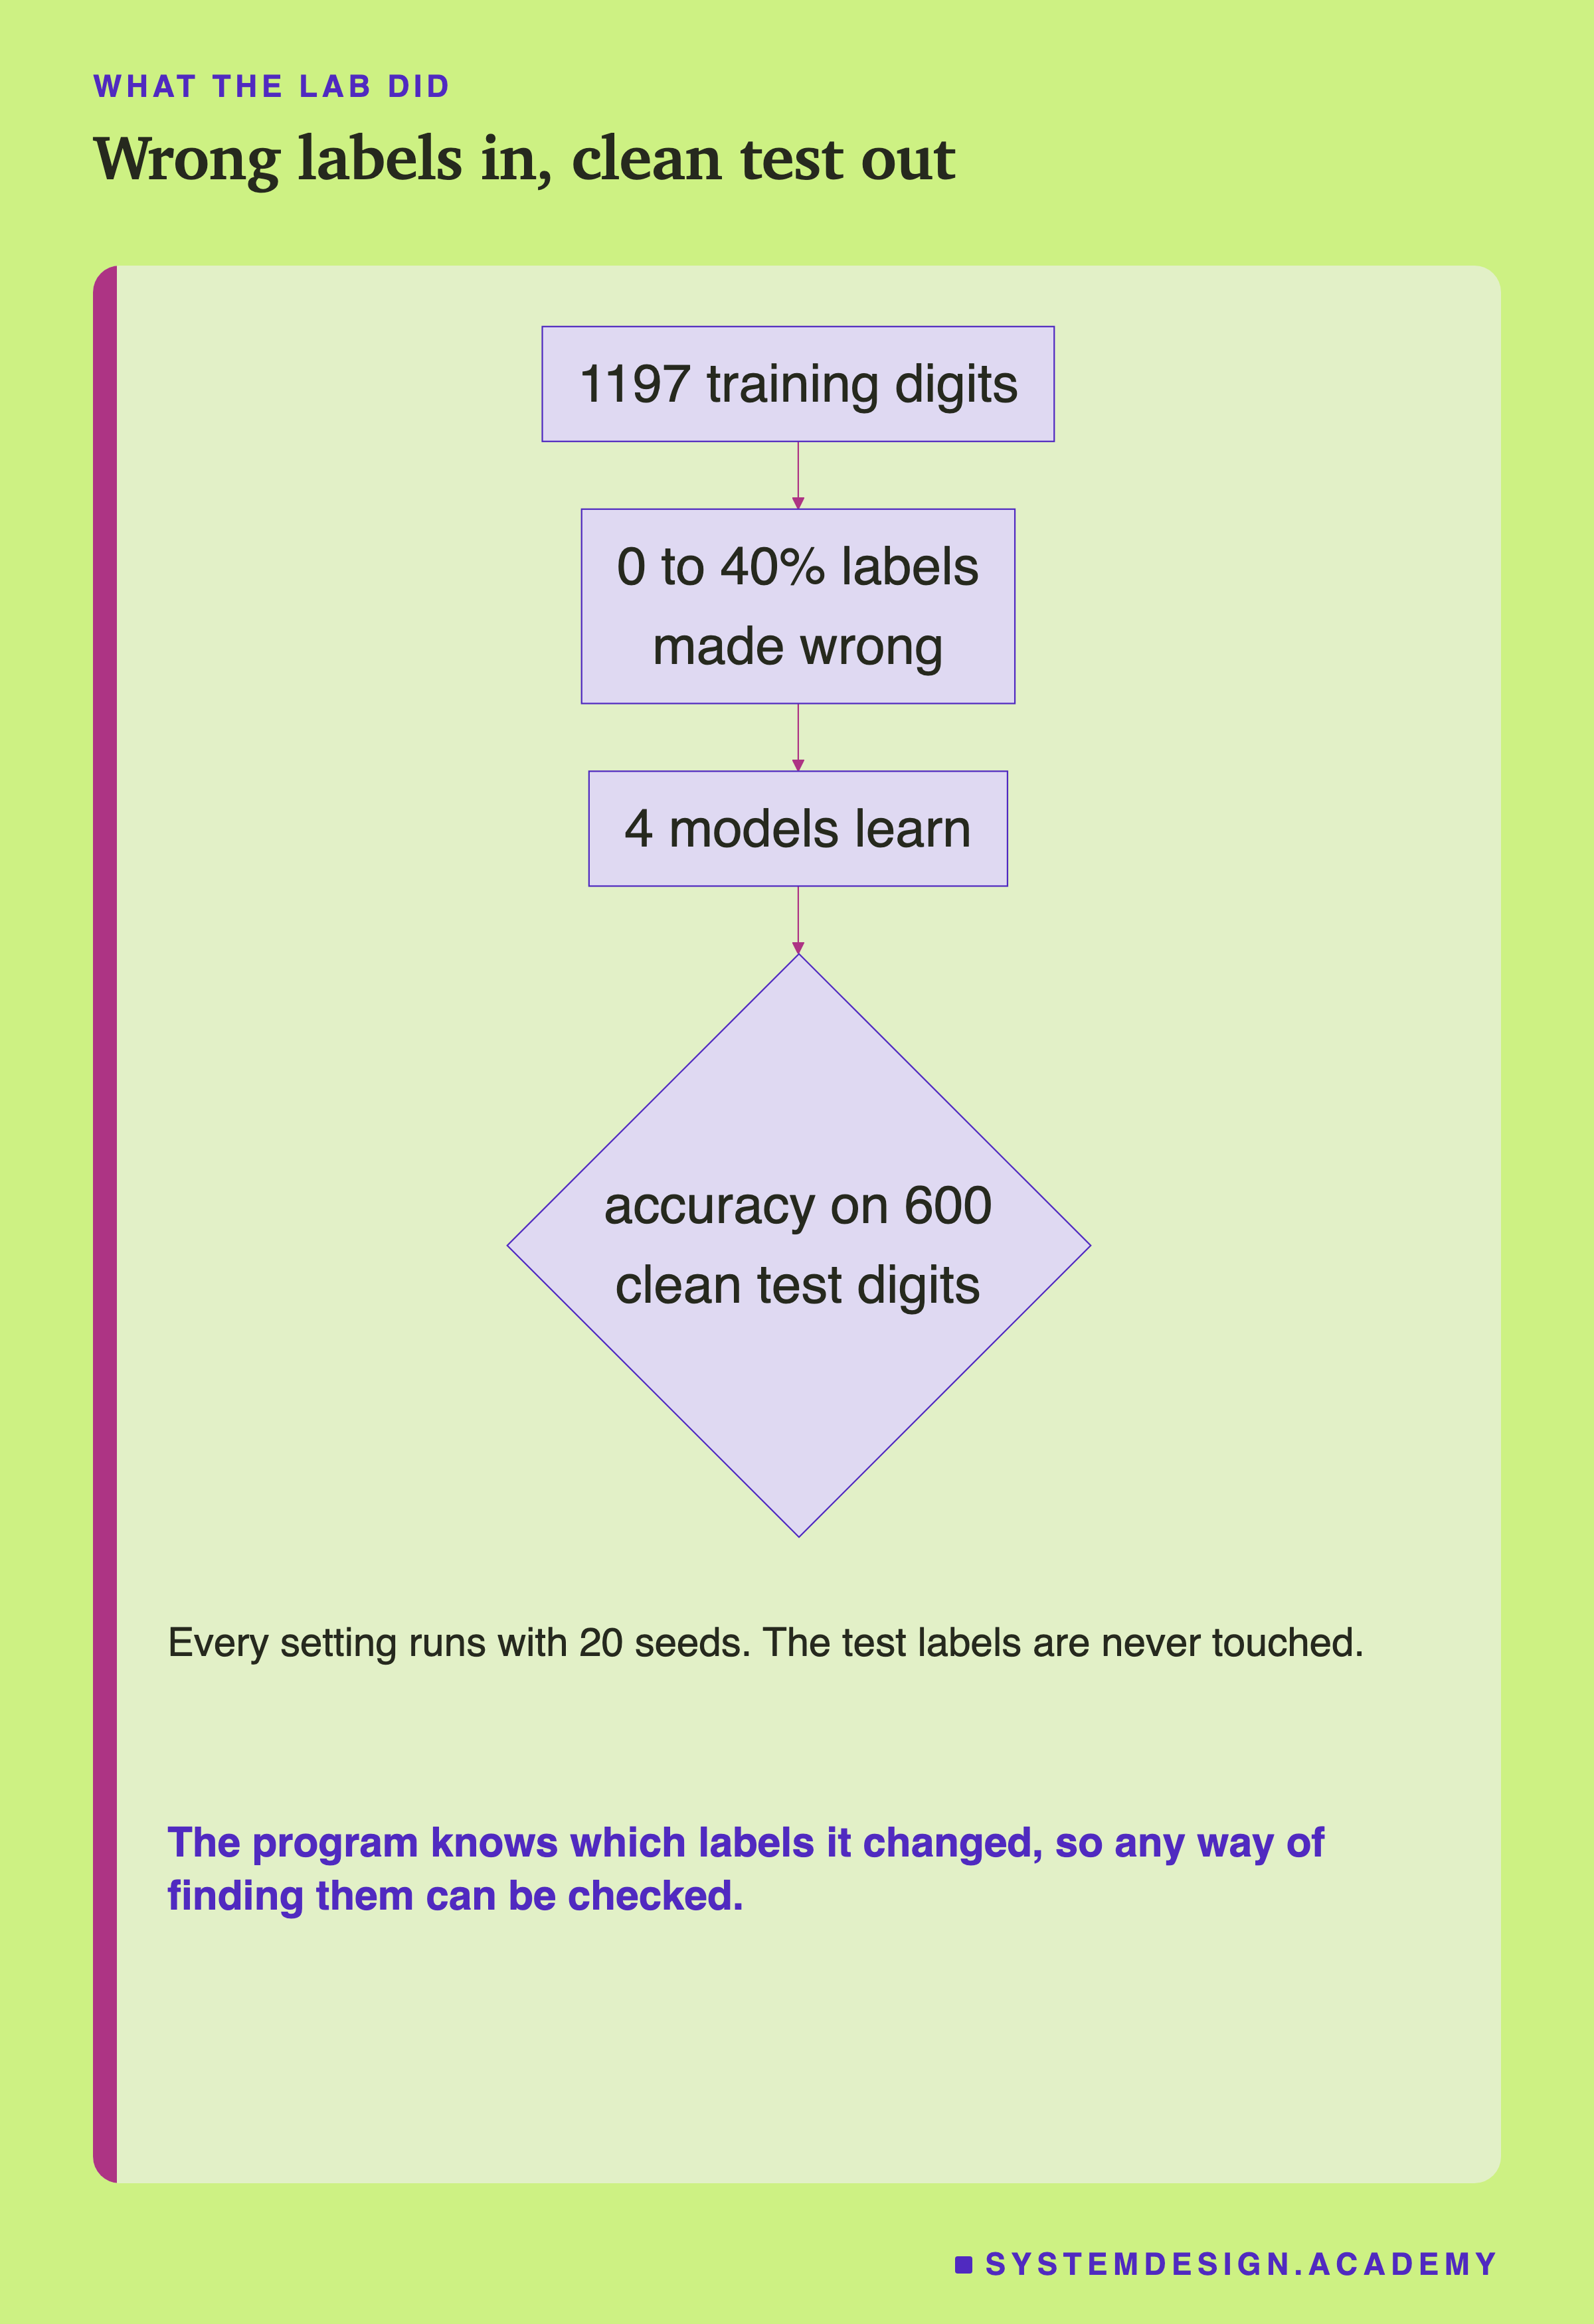
Only the training labels are changed here, so the test score shows what each model really learnt. A later slide changes the test labels on purpose, as a separate experiment.
-
The data. 1,797 real scans of handwritten digits, 8 by 8 pixels each, from scikit-learn, a free Python library. 1197 are the training set and 600 are the test set.
-
The wrong labels. A program changes a chosen share of the training labels: 0, 5, 10, 20, 30 or 40 percent, randomly or between look-alikes. The program knows exactly which labels it changed, so the lab can check any way of finding them.
-
The models. Four common kinds:
- logistic regression, which draws straight dividing lines between the digits;
- a random forest, which lets 300 small decision trees, each a chain of simple yes-or-no questions about the pixels, vote;
- nearest neighbour, which copies the label of the single most similar training digit;
- 15 nearest neighbours, which lets the 15 most similar training digits vote.
-
The score. Accuracy on the 600 test digits.
-
Repeats. Every setting runs with 20 seeds, so each result is an average of 20 runs.
The Lab, Running
This is a real recording of the lab's report, printed on the laptop where it ran. The whole lab takes about four minutes on a laptop, with no special hardware.
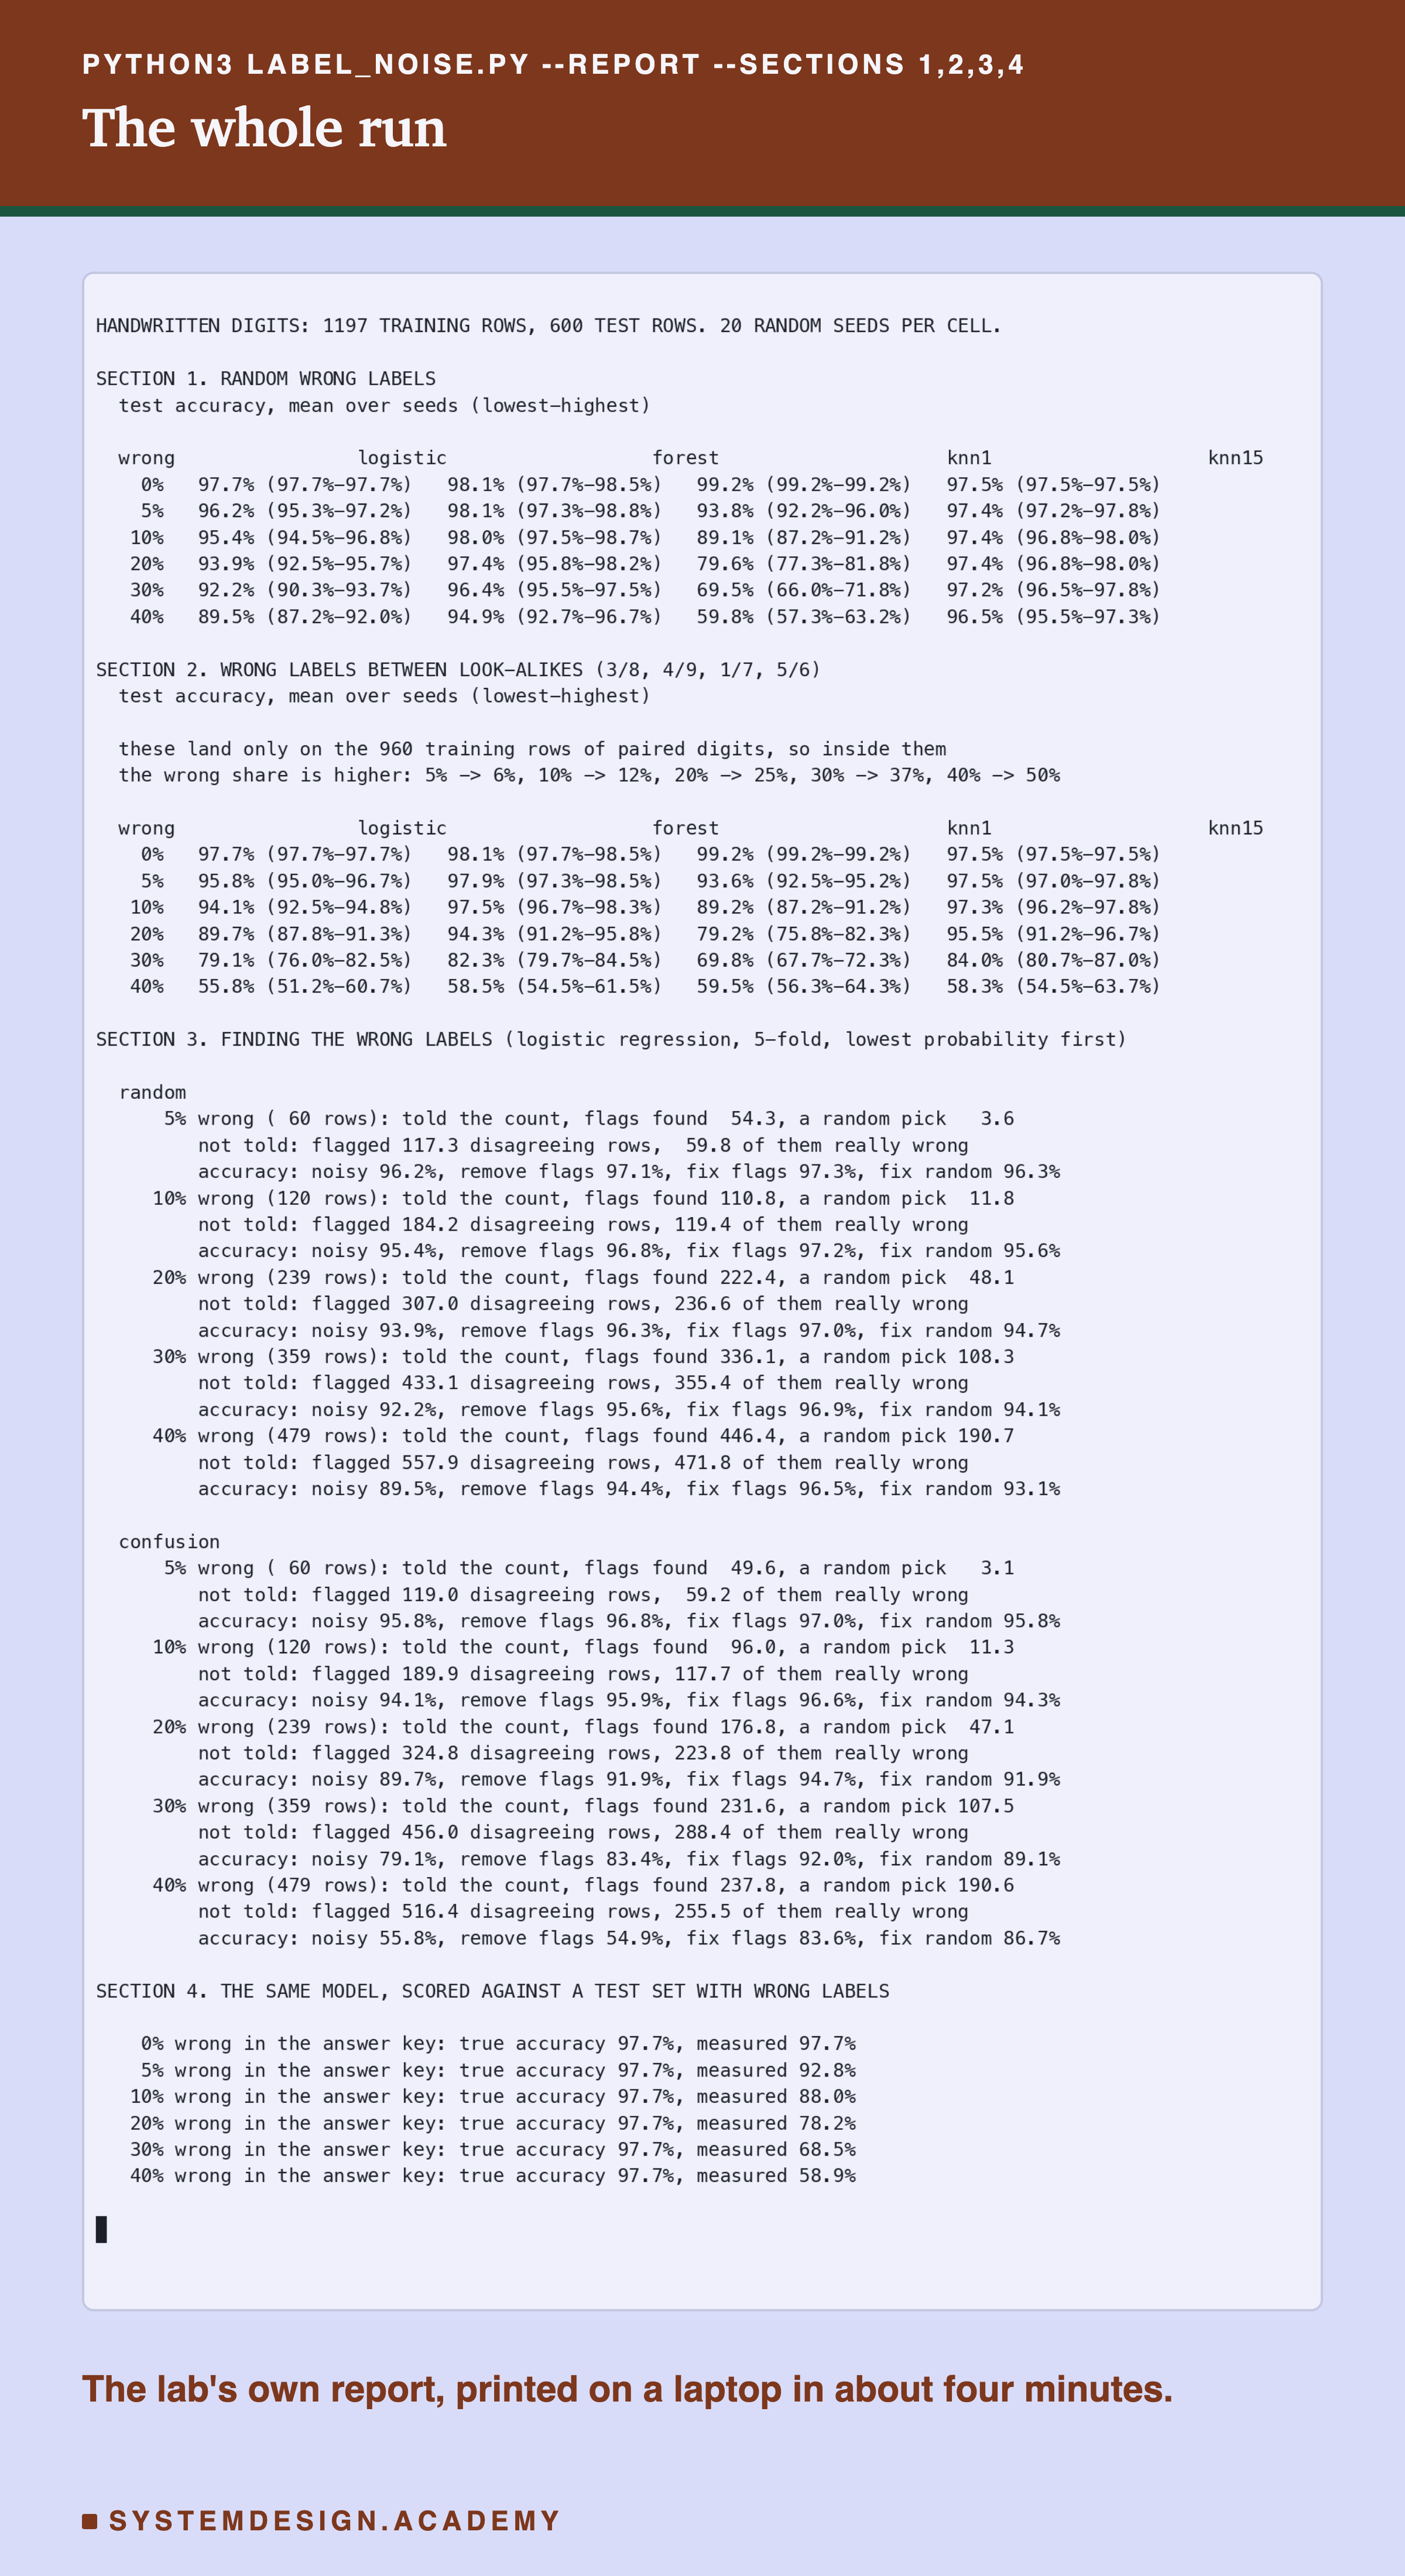
Each accuracy is the average over the seeds, with the lowest and highest in brackets. In the recording, "knn1" is nearest neighbour, "knn15" is 15 nearest neighbours, and "confusion" means look-alike mistakes.
One correction first. My first run of this lab made a mistake in how it prepared the pixels before training, and a reviewer caught it. Under that mistake, logistic regression lost 8.6 points at 20 percent wrong labels, which made it look far more fragile than it is. Every number here comes from the corrected run.
Random Wrong Labels
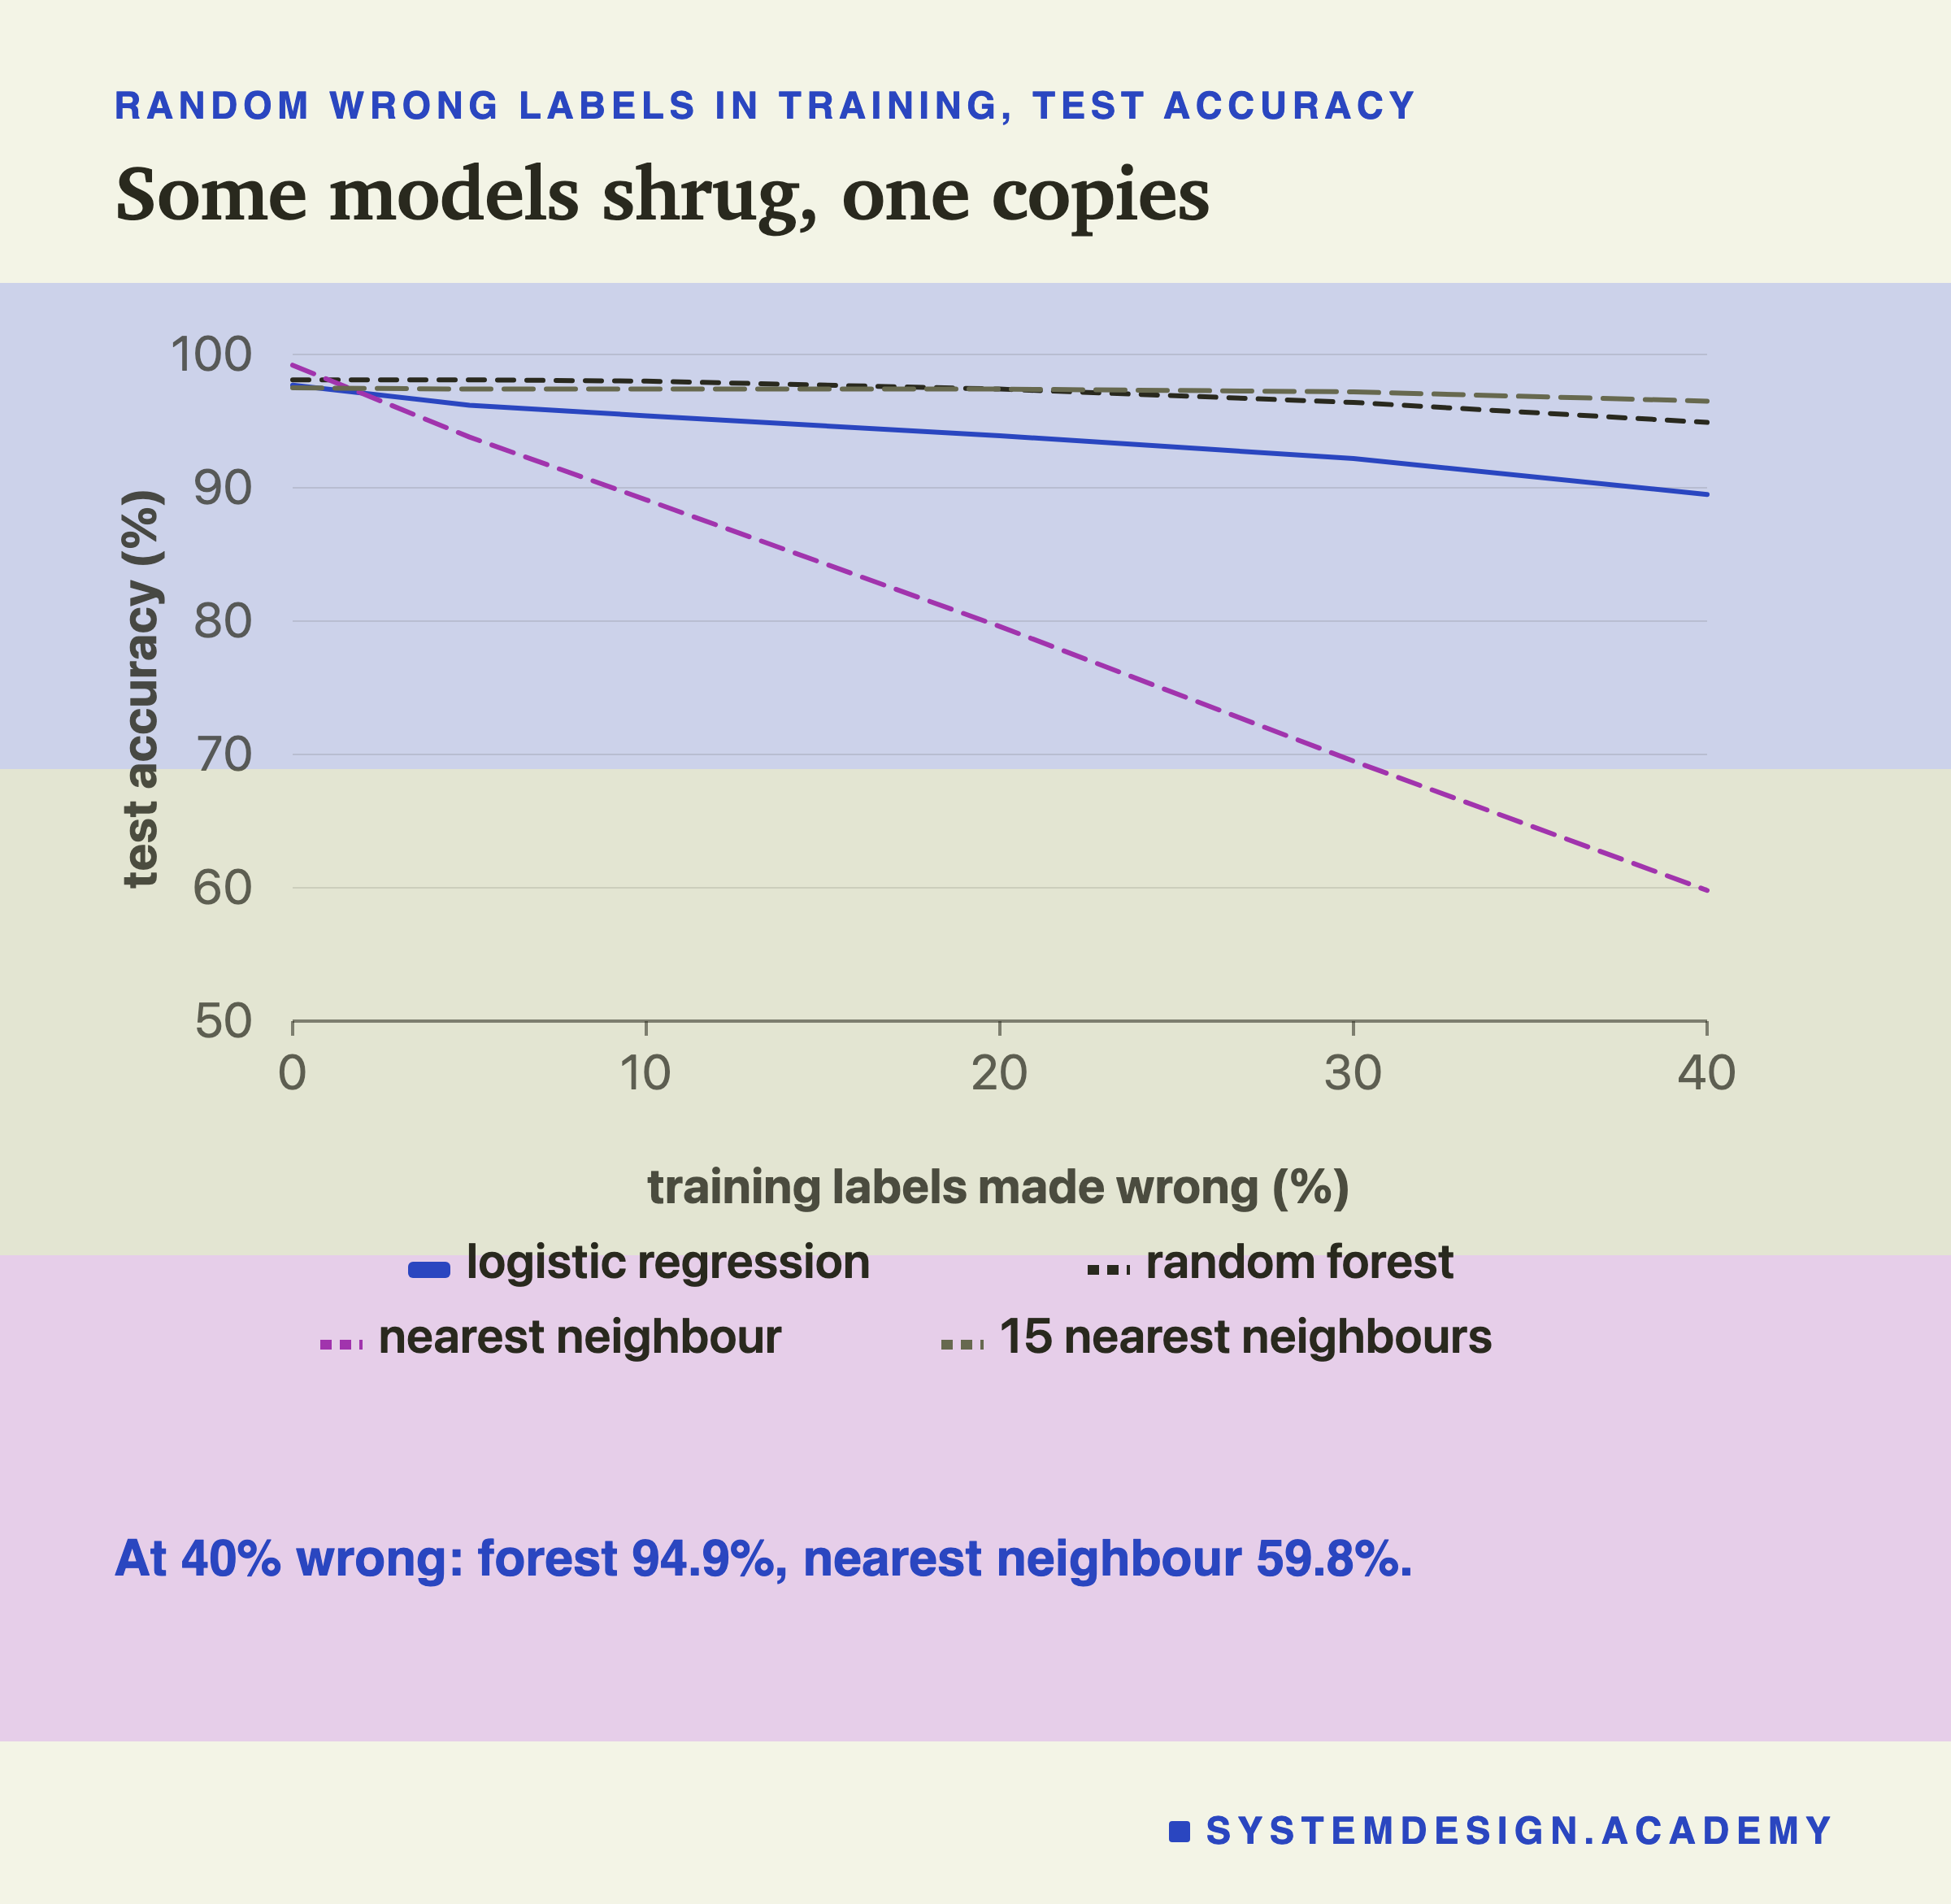
| wrong labels | logistic | forest | nearest 1 | nearest 15 |
|---|---|---|---|---|
| 0% | 97.7% | 98.1% | 99.2% | 97.5% |
| 5% | 96.2% | 98.1% | 93.8% | 97.4% |
| 10% | 95.4% | 98% | 89.1% | 97.4% |
| 20% | 93.9% | 97.4% | 79.6% | 97.4% |
| 30% | 92.2% | 96.4% | 69.5% | 97.2% |
Look-Alike Wrong Labels
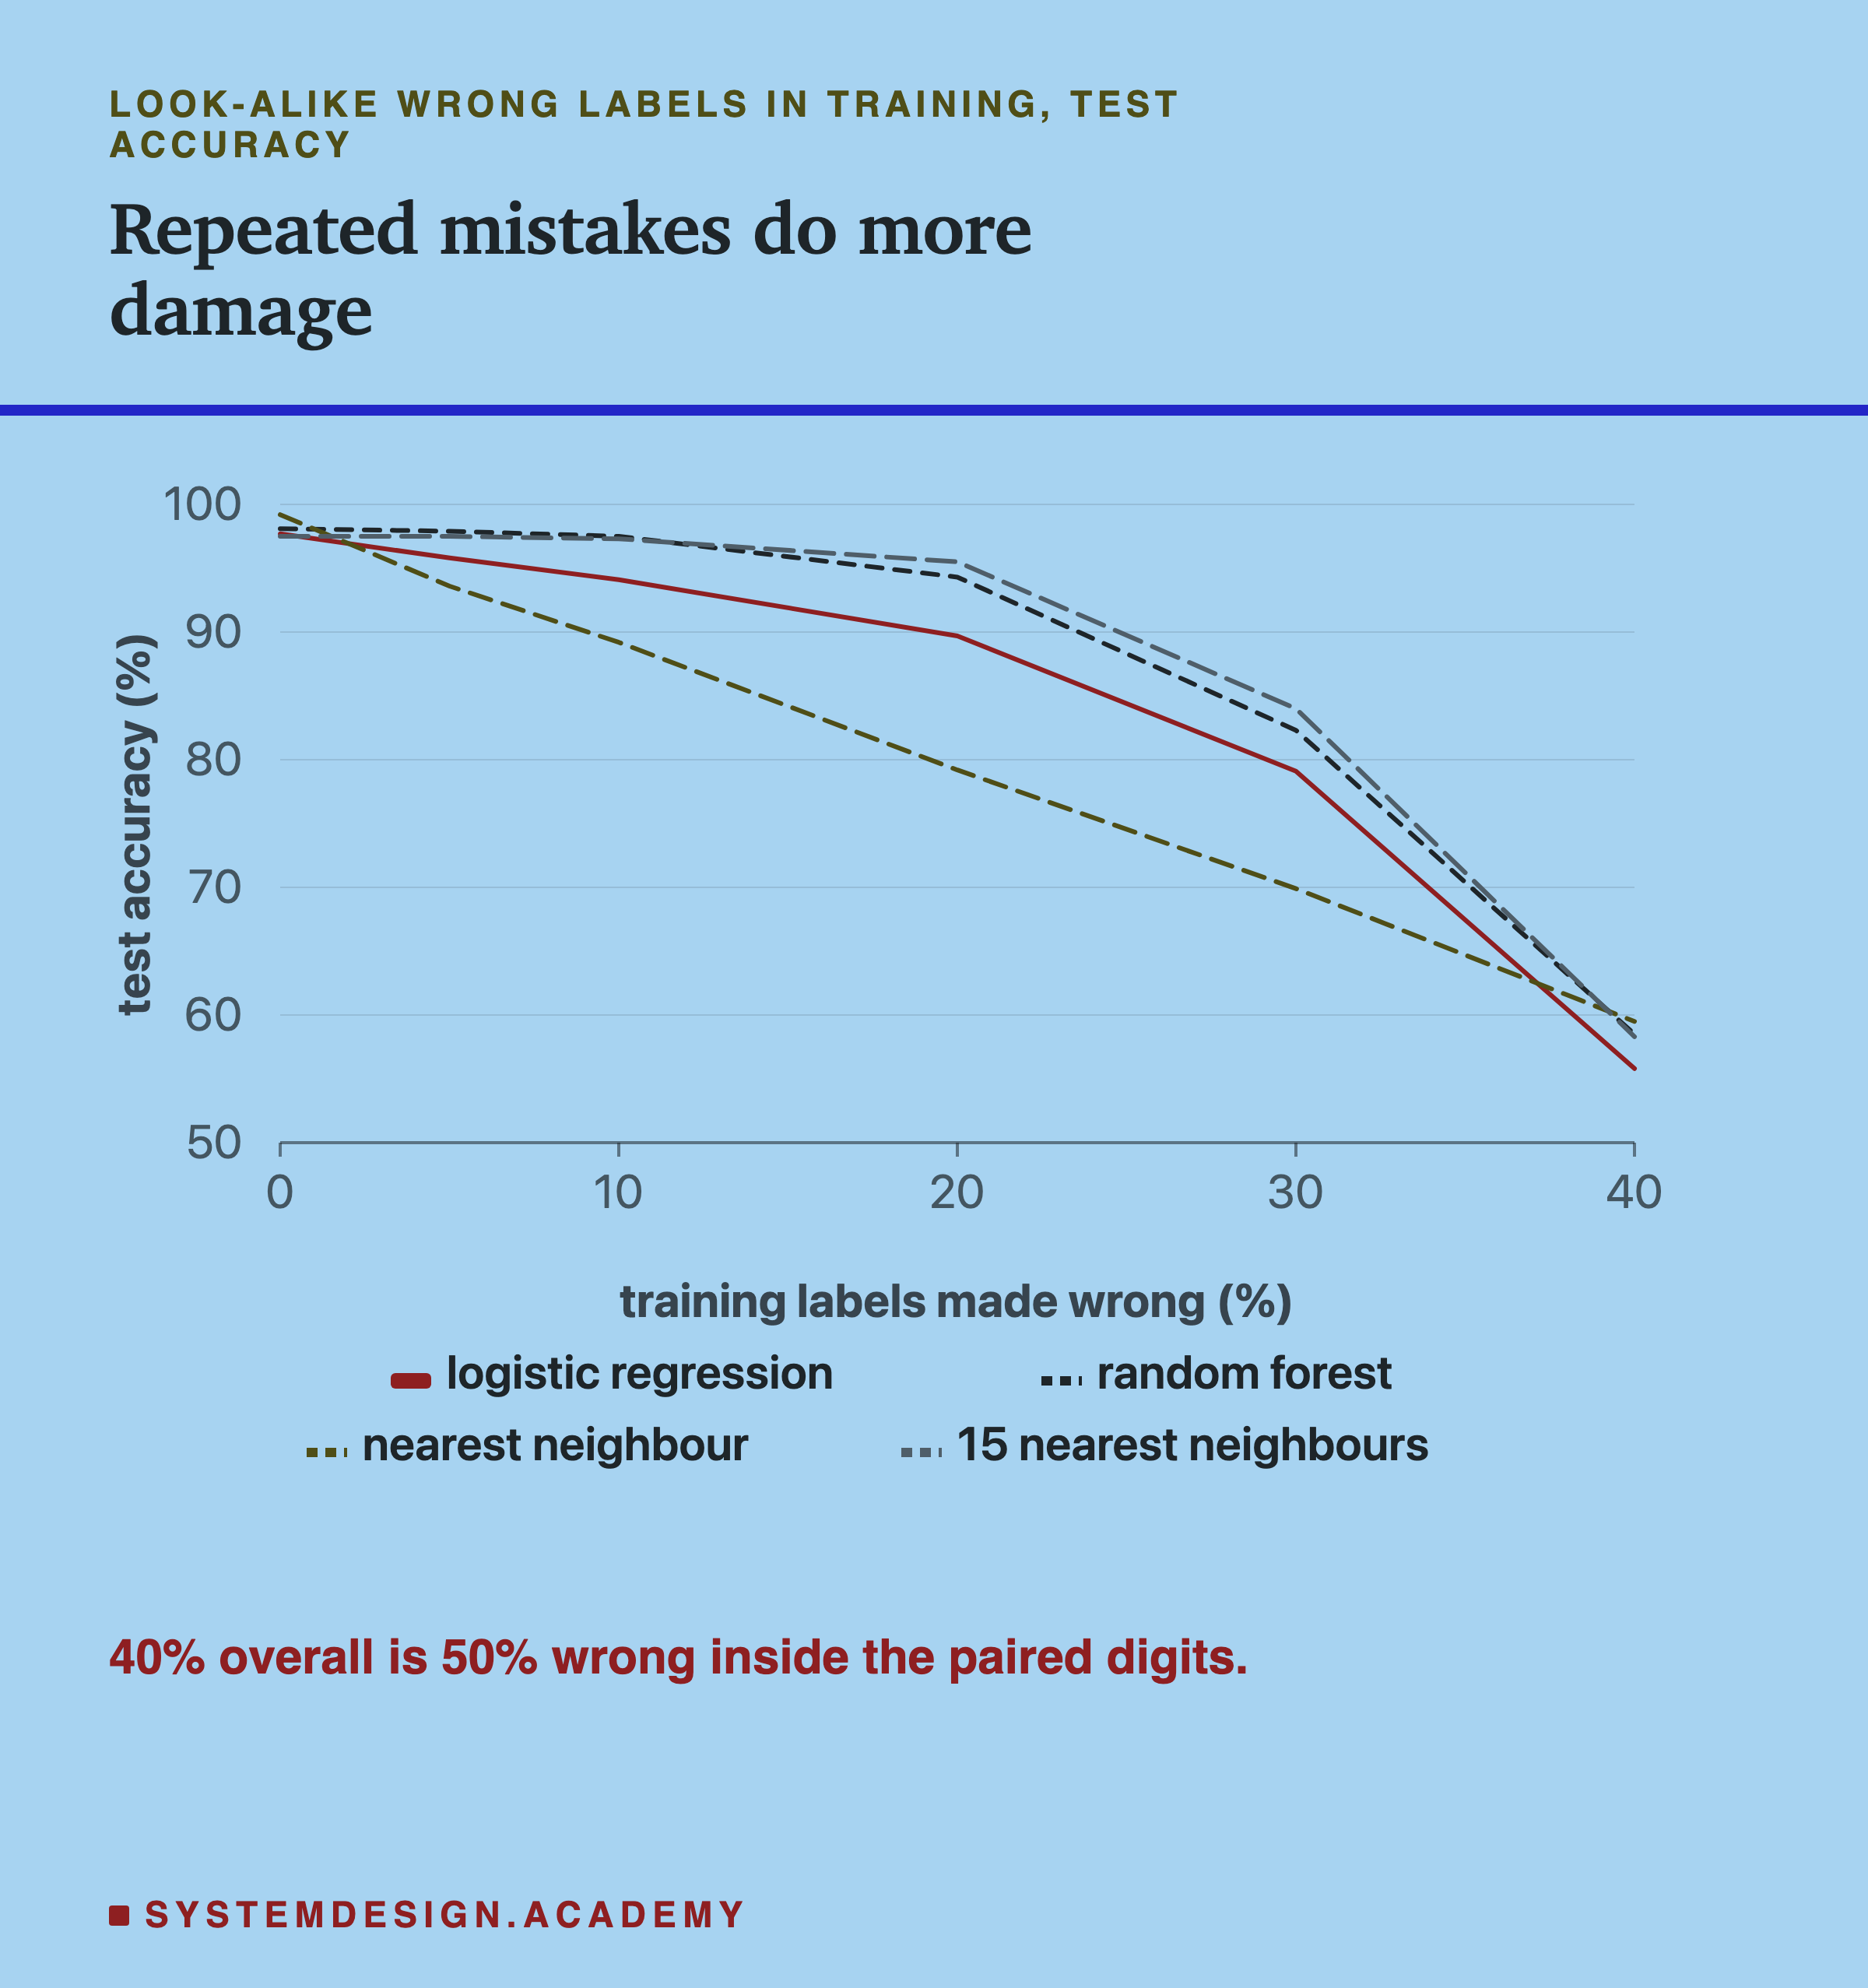
| wrong labels | logistic | forest | nearest 1 | nearest 15 |
|---|---|---|---|---|
| 5% | 95.8% | 97.9% | 93.6% | 97.5% |
| 10% | 94.1% | 97.5% | 89.2% | 97.3% |
| 20% | 89.7% | 94.3% | 79.2% | 95.5% |
| 30% | 79.1% | 82.3% | 69.9% | 84% |
| 40% | 55.8% | 58.5% | 59.5% | 58.3% |
From 20 percent up, the same share of wrong labels did much more damage when the mistakes shared a pattern. At 30 percent, the random forest scored 96.4% with random mistakes and 82.3% with look-alike ones. At 40 percent every model fell to between 55.8% and 59.5%.
Is the Difference Real?
For each model and each rate, the lab ran 20 seeds with random mistakes and 20 with look-alike ones. Line up run 1 with run 1, run 2 with run 2, and so on, and ask for each pair: which kind of mistake left the higher score? A pair where both scored exactly the same counts for neither side. The two runs in a pair do not have the same rows made wrong, because the two kinds of mistake pick their rows differently, so this is a rough comparison, but a very lopsided count still means something.
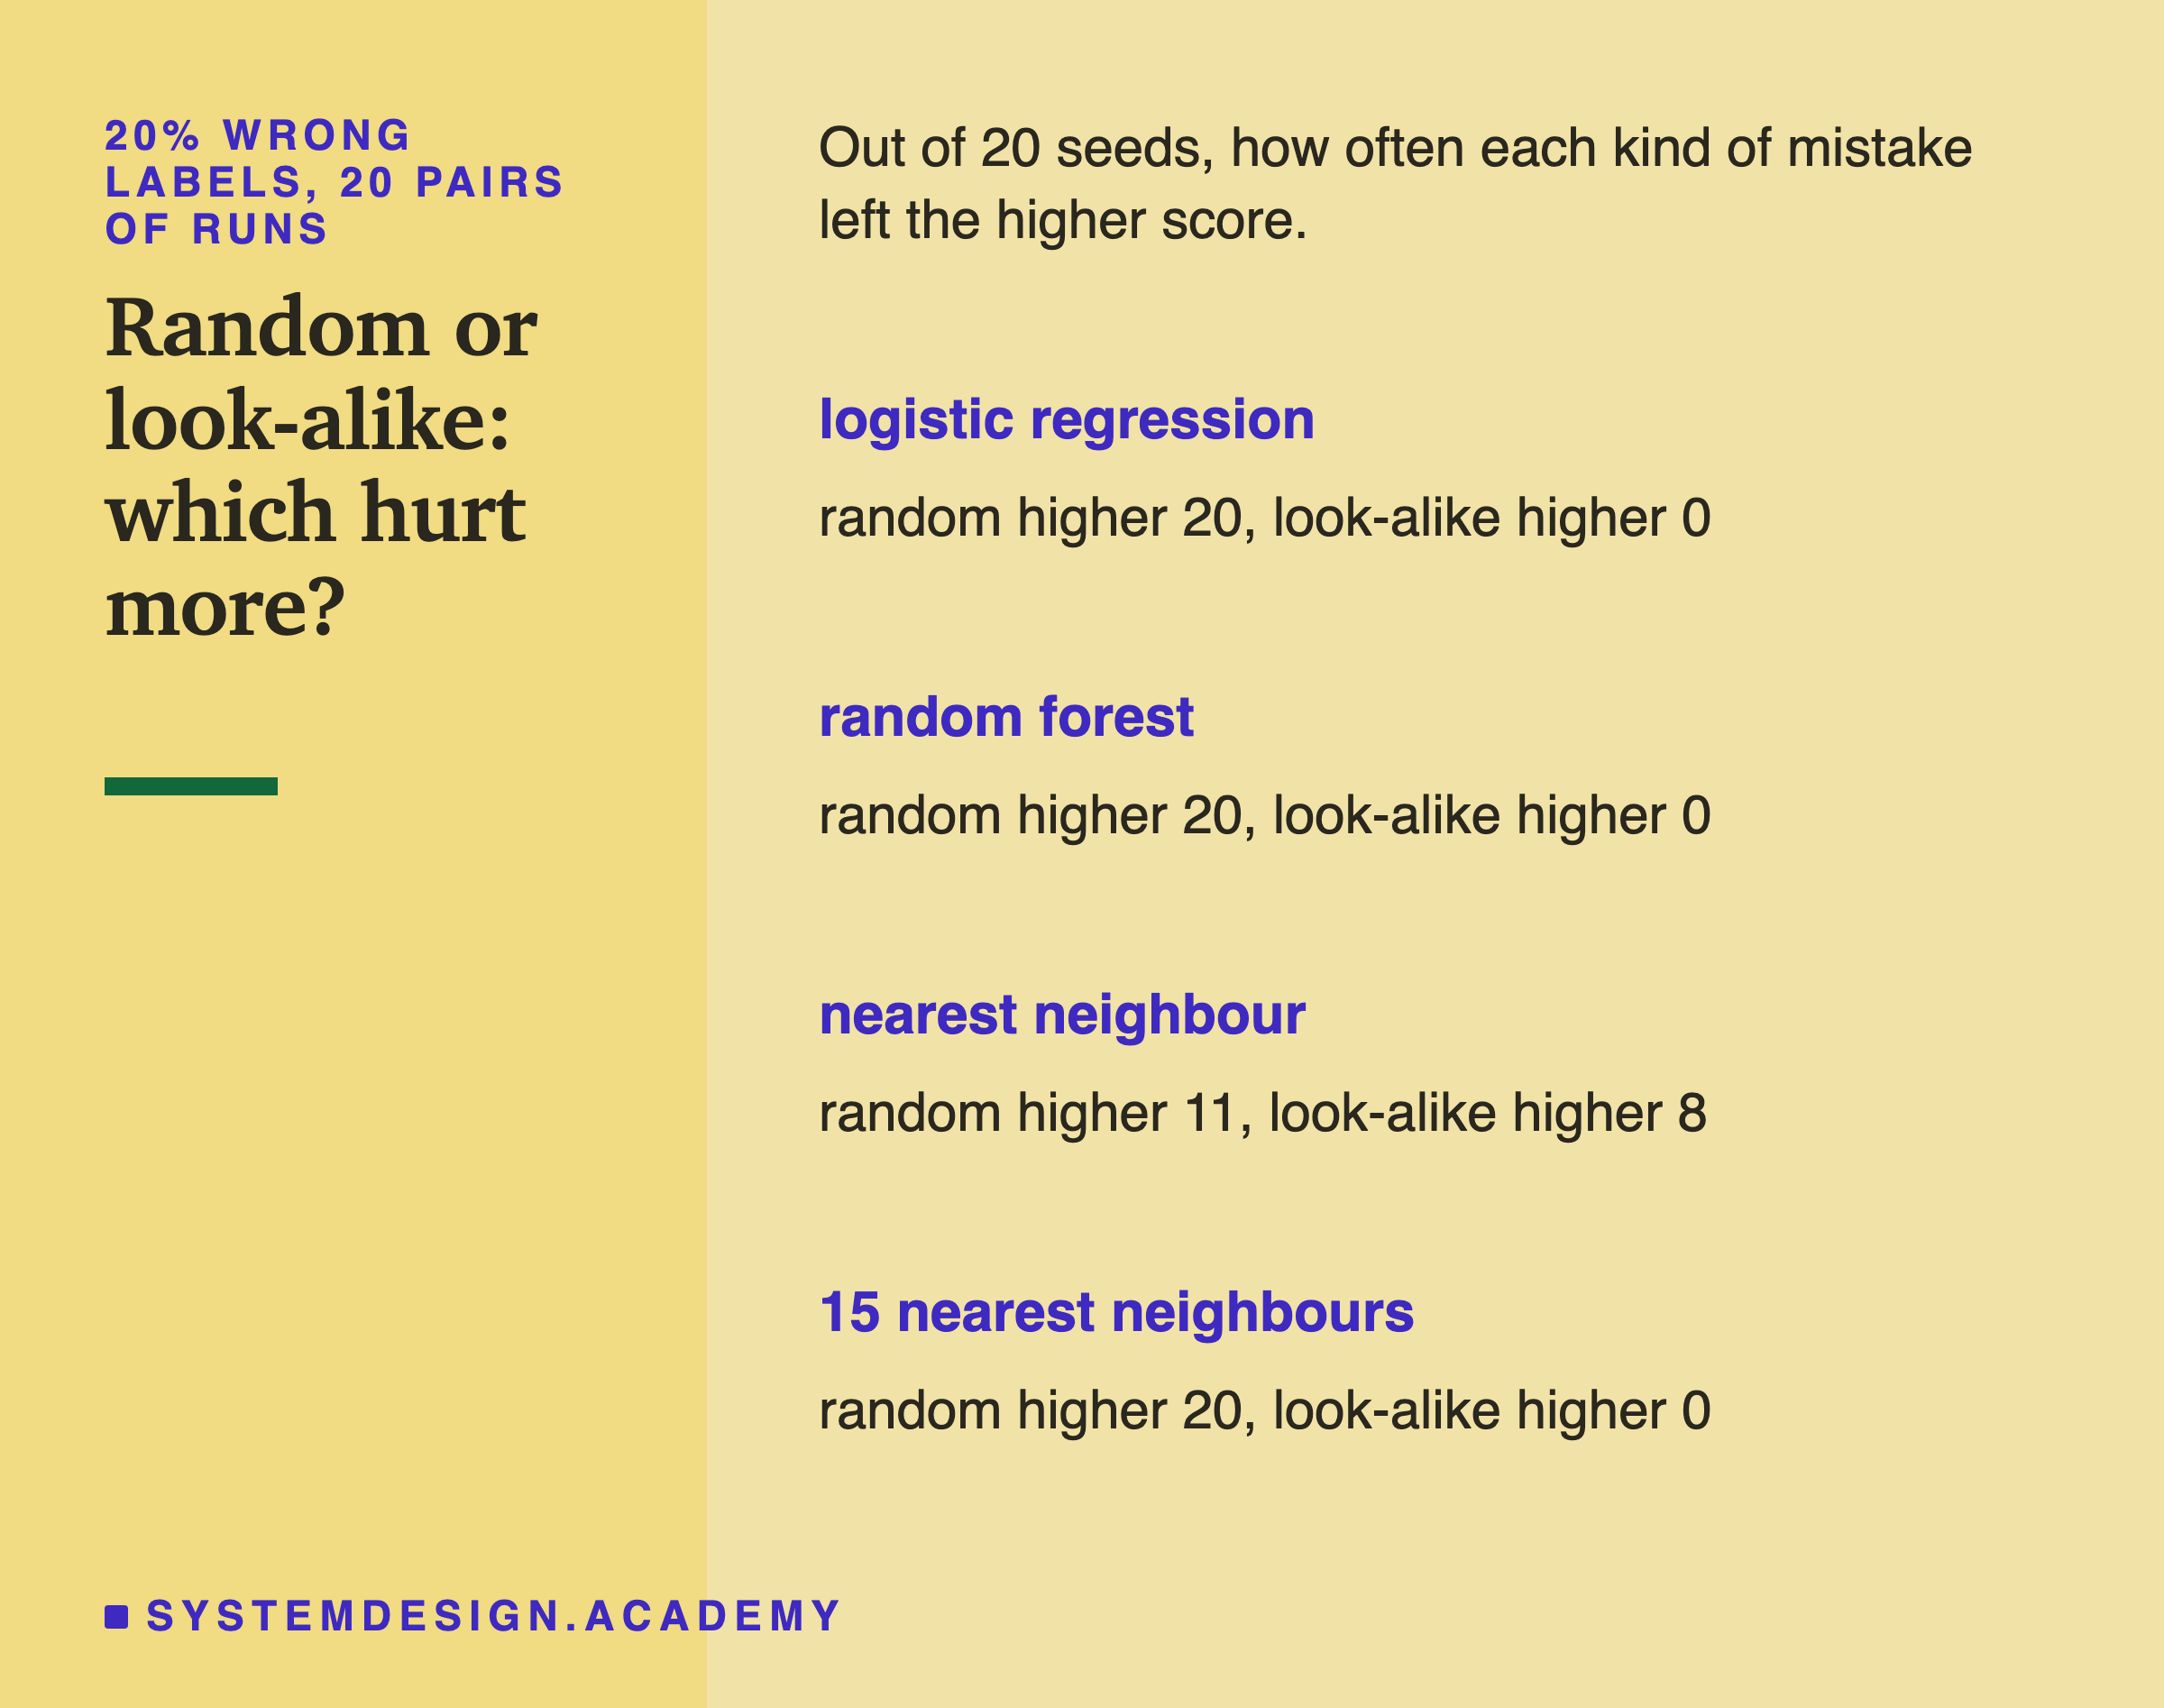
At 20 percent wrong, random mistakes scored higher in all 20 pairs for logistic regression, the forest, and 15 nearest neighbours. If the two kinds were equally harmful, that would be like 20 coin flips all landing the same way, which happens about twice in a million tries.
At 10 percent the gap was already clear for logistic regression, 17 pairs to 2, which luck would give about once in 1,372 tries. The forest leaned the same way, 14 to 4. At 5 percent the two kinds were too close to call for every model, and 15 nearest neighbours even leaned slightly towards doing better with look-alike mistakes.
Nearest neighbour never showed a clear difference at any rate. It copies whichever label is nearest, so it cannot learn a pattern from the mistakes, good or bad.
Can You Find the Wrong Labels?
Re-checking every label by hand is slow and costly. A common trick is to let a model point at the labels it finds suspicious.
Here is the trick. Split the training set into 5 parts. Train a model on 4 parts and ask it about the fifth, the part it has not seen. Do that 5 times, so every row gets a prediction from a model that never saw its label. Engineers call this an out-of-fold prediction.
Why not ask a model about rows it trained on? Because it has already learnt their labels, wrong ones included, and would vouch for them.
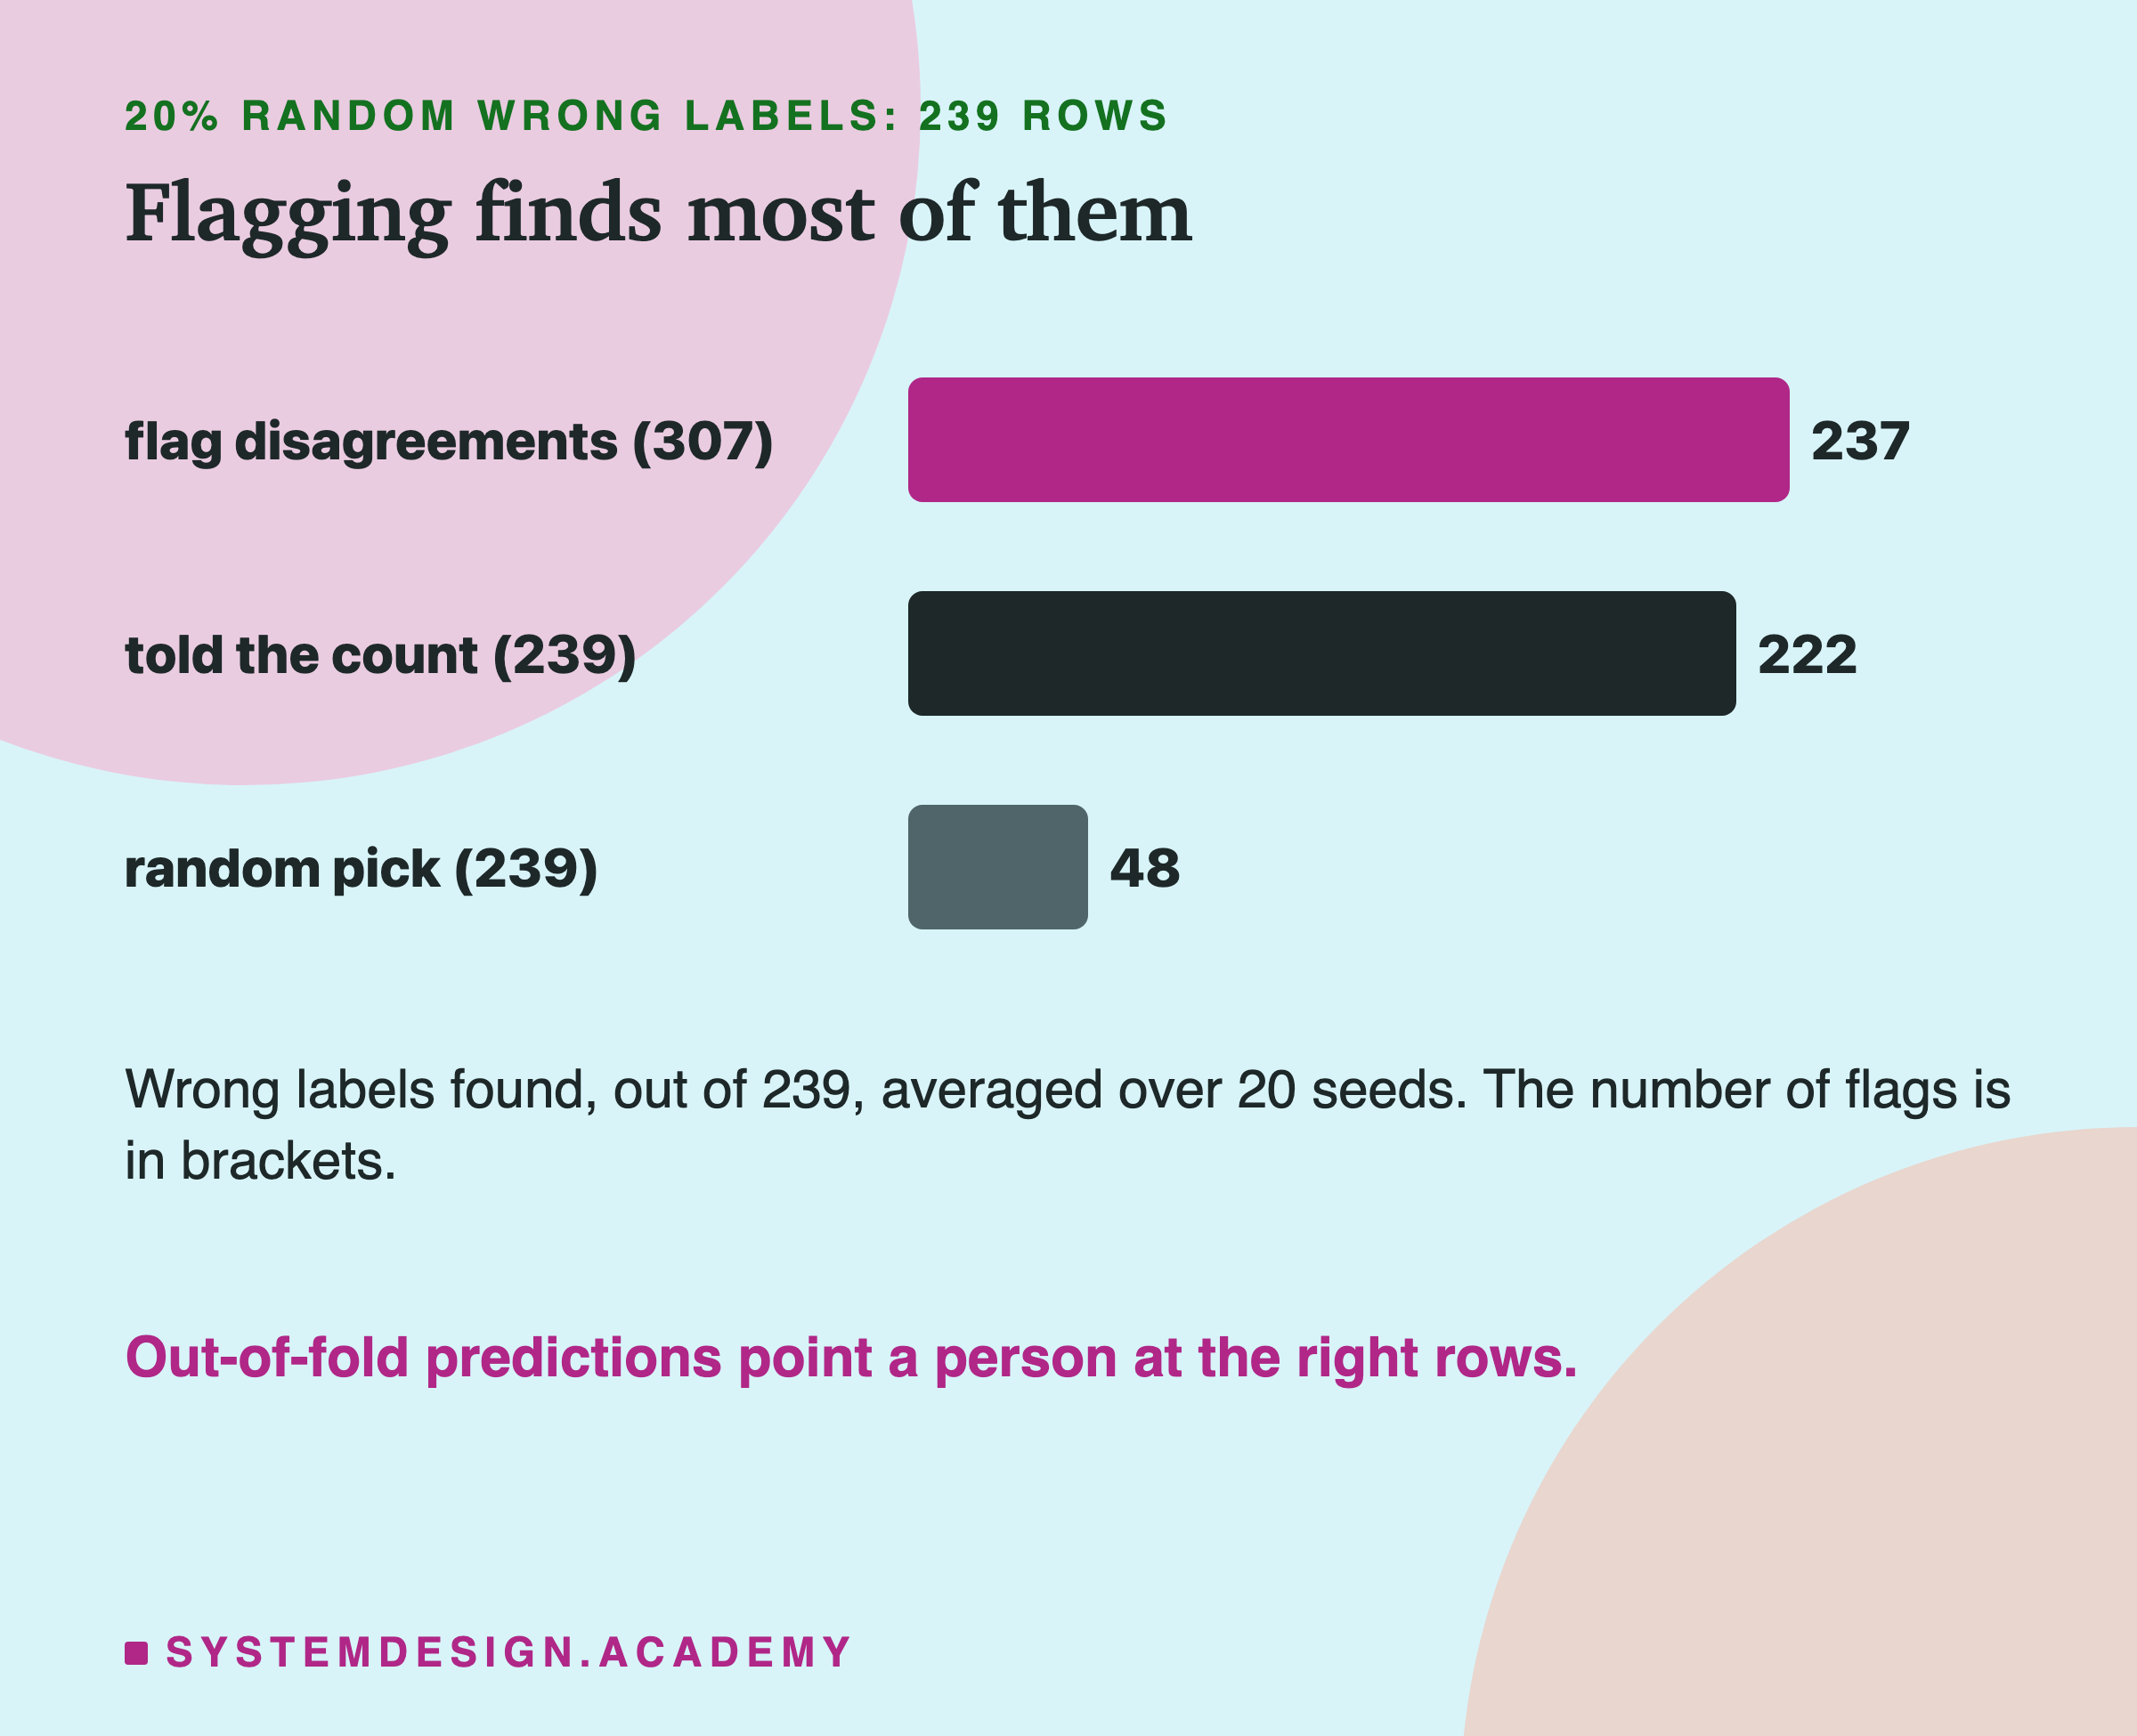
With 20 percent random wrong labels there were 239 wrong rows. The simplest flag is to mark every row where the out-of-fold prediction disagrees with the given label. That flagged 307 rows, and 237 of them really were wrong: it found 99 percent of the wrong labels, and 77 percent of its flags were real. Picking 307 rows at random would have found about 61.
The lab also tried a version that was told how many rows were wrong, 239, and flagged the 239 rows whose label looked least likely to the out-of-fold model. It found 222, against about 48 for a random pick of the same size. On your own data you are never told that number, so the first version is the one you can use. A free Python tool called cleanlab estimates that number for you. This lab uses only the simplest ranking, the first step of a technique called confident learning.
Fix Them, or Throw Them Away?
Once rows are flagged, you can remove them, or have a person check and correct them.
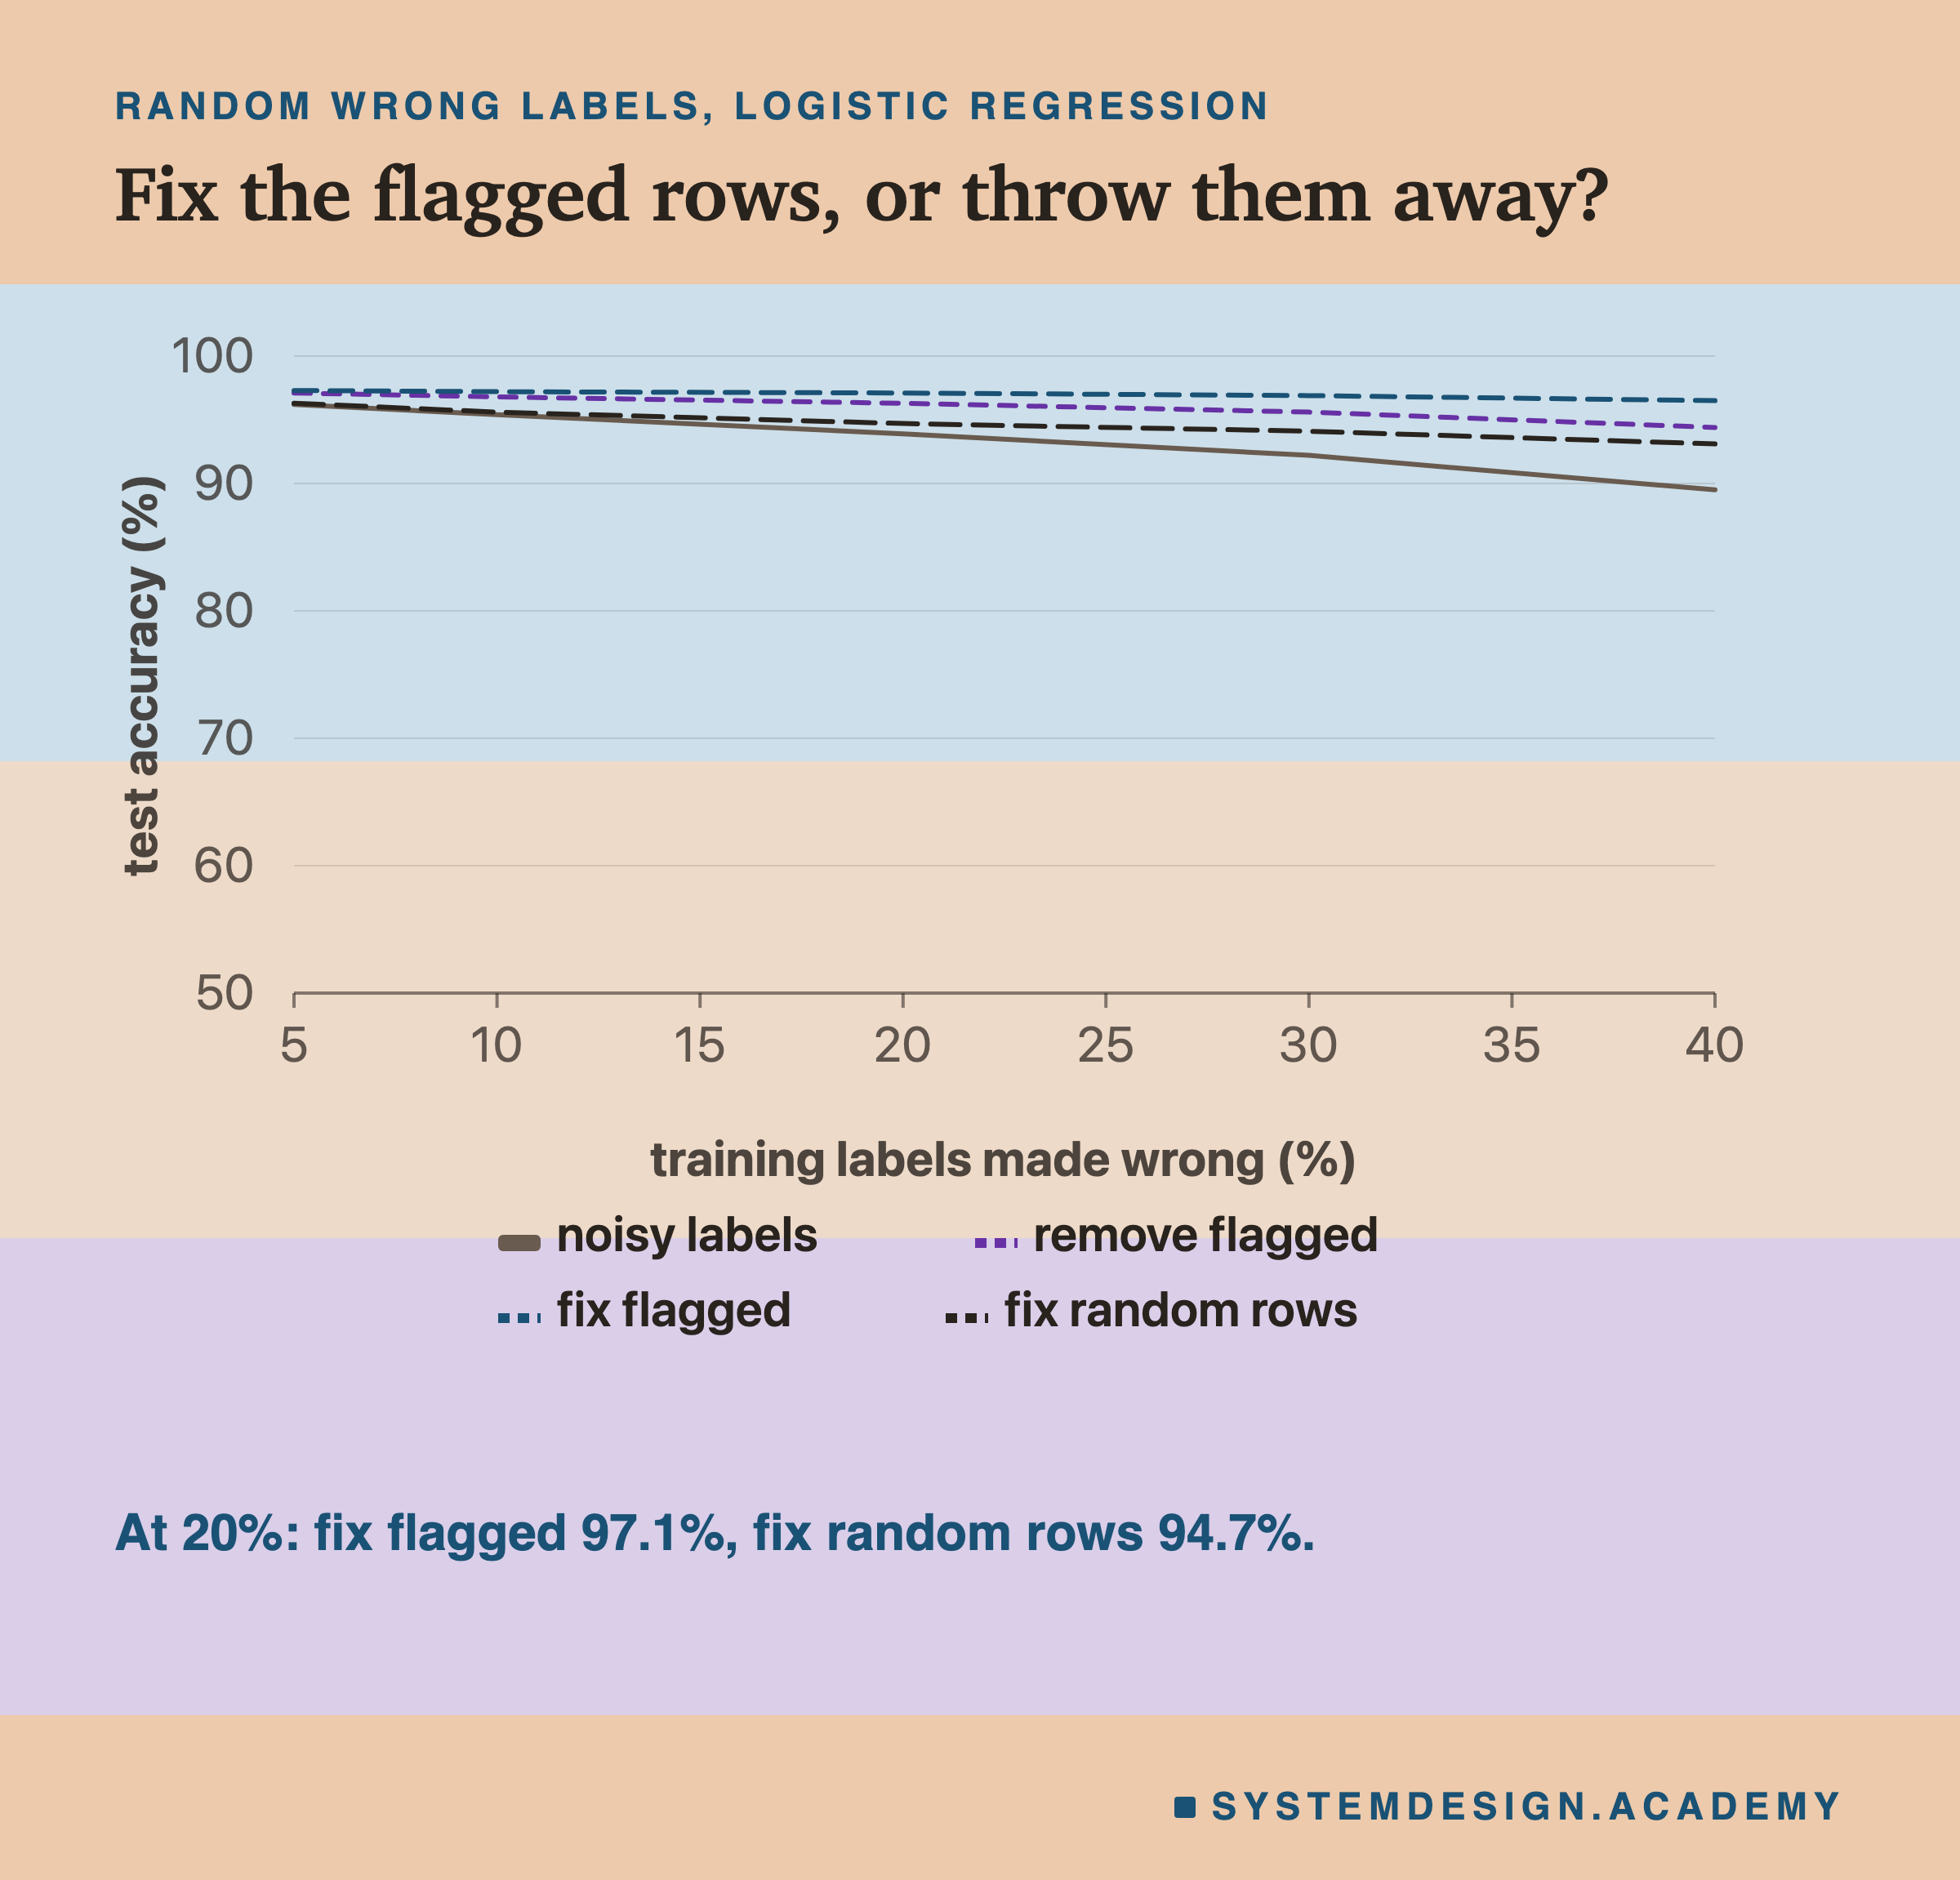
| random wrong labels | noisy | remove flagged | fix flagged | fix random rows |
|---|---|---|---|---|
| 10% | 95.4% | 96.8% | 97.2% | 95.6% |
| 20% | 93.9% | 96.3% | 97.1% | 94.7% |
| 40% | 89.5% | 94.4% | 96.5% | 93.1% |
These are logistic regression scores. To keep the comparison with random rows fair, both used the same number of rows, the true number of wrong ones. Clean labels scored 97.7%.
Checking the flagged rows beats checking the same number of rows at random: at 20 percent, 97.1% against 94.7%. Flagging sends a person's time to where the mistakes are.
Removing the flagged rows costs no one's time, and at low noise it comes close to fixing. It falls behind as the noise grows, because the rows it throws away are mostly the wrong-labelled images themselves, which fixing would have kept with the right label. My rule: remove when the noise is low and people's time is short, and send rows to a person when the noise is high. When the mistakes share a pattern, the next slide shows why flags alone are not enough.
When the Finder Is Fooled
The finding trick has a weak spot, and look-alike mistakes hit it.
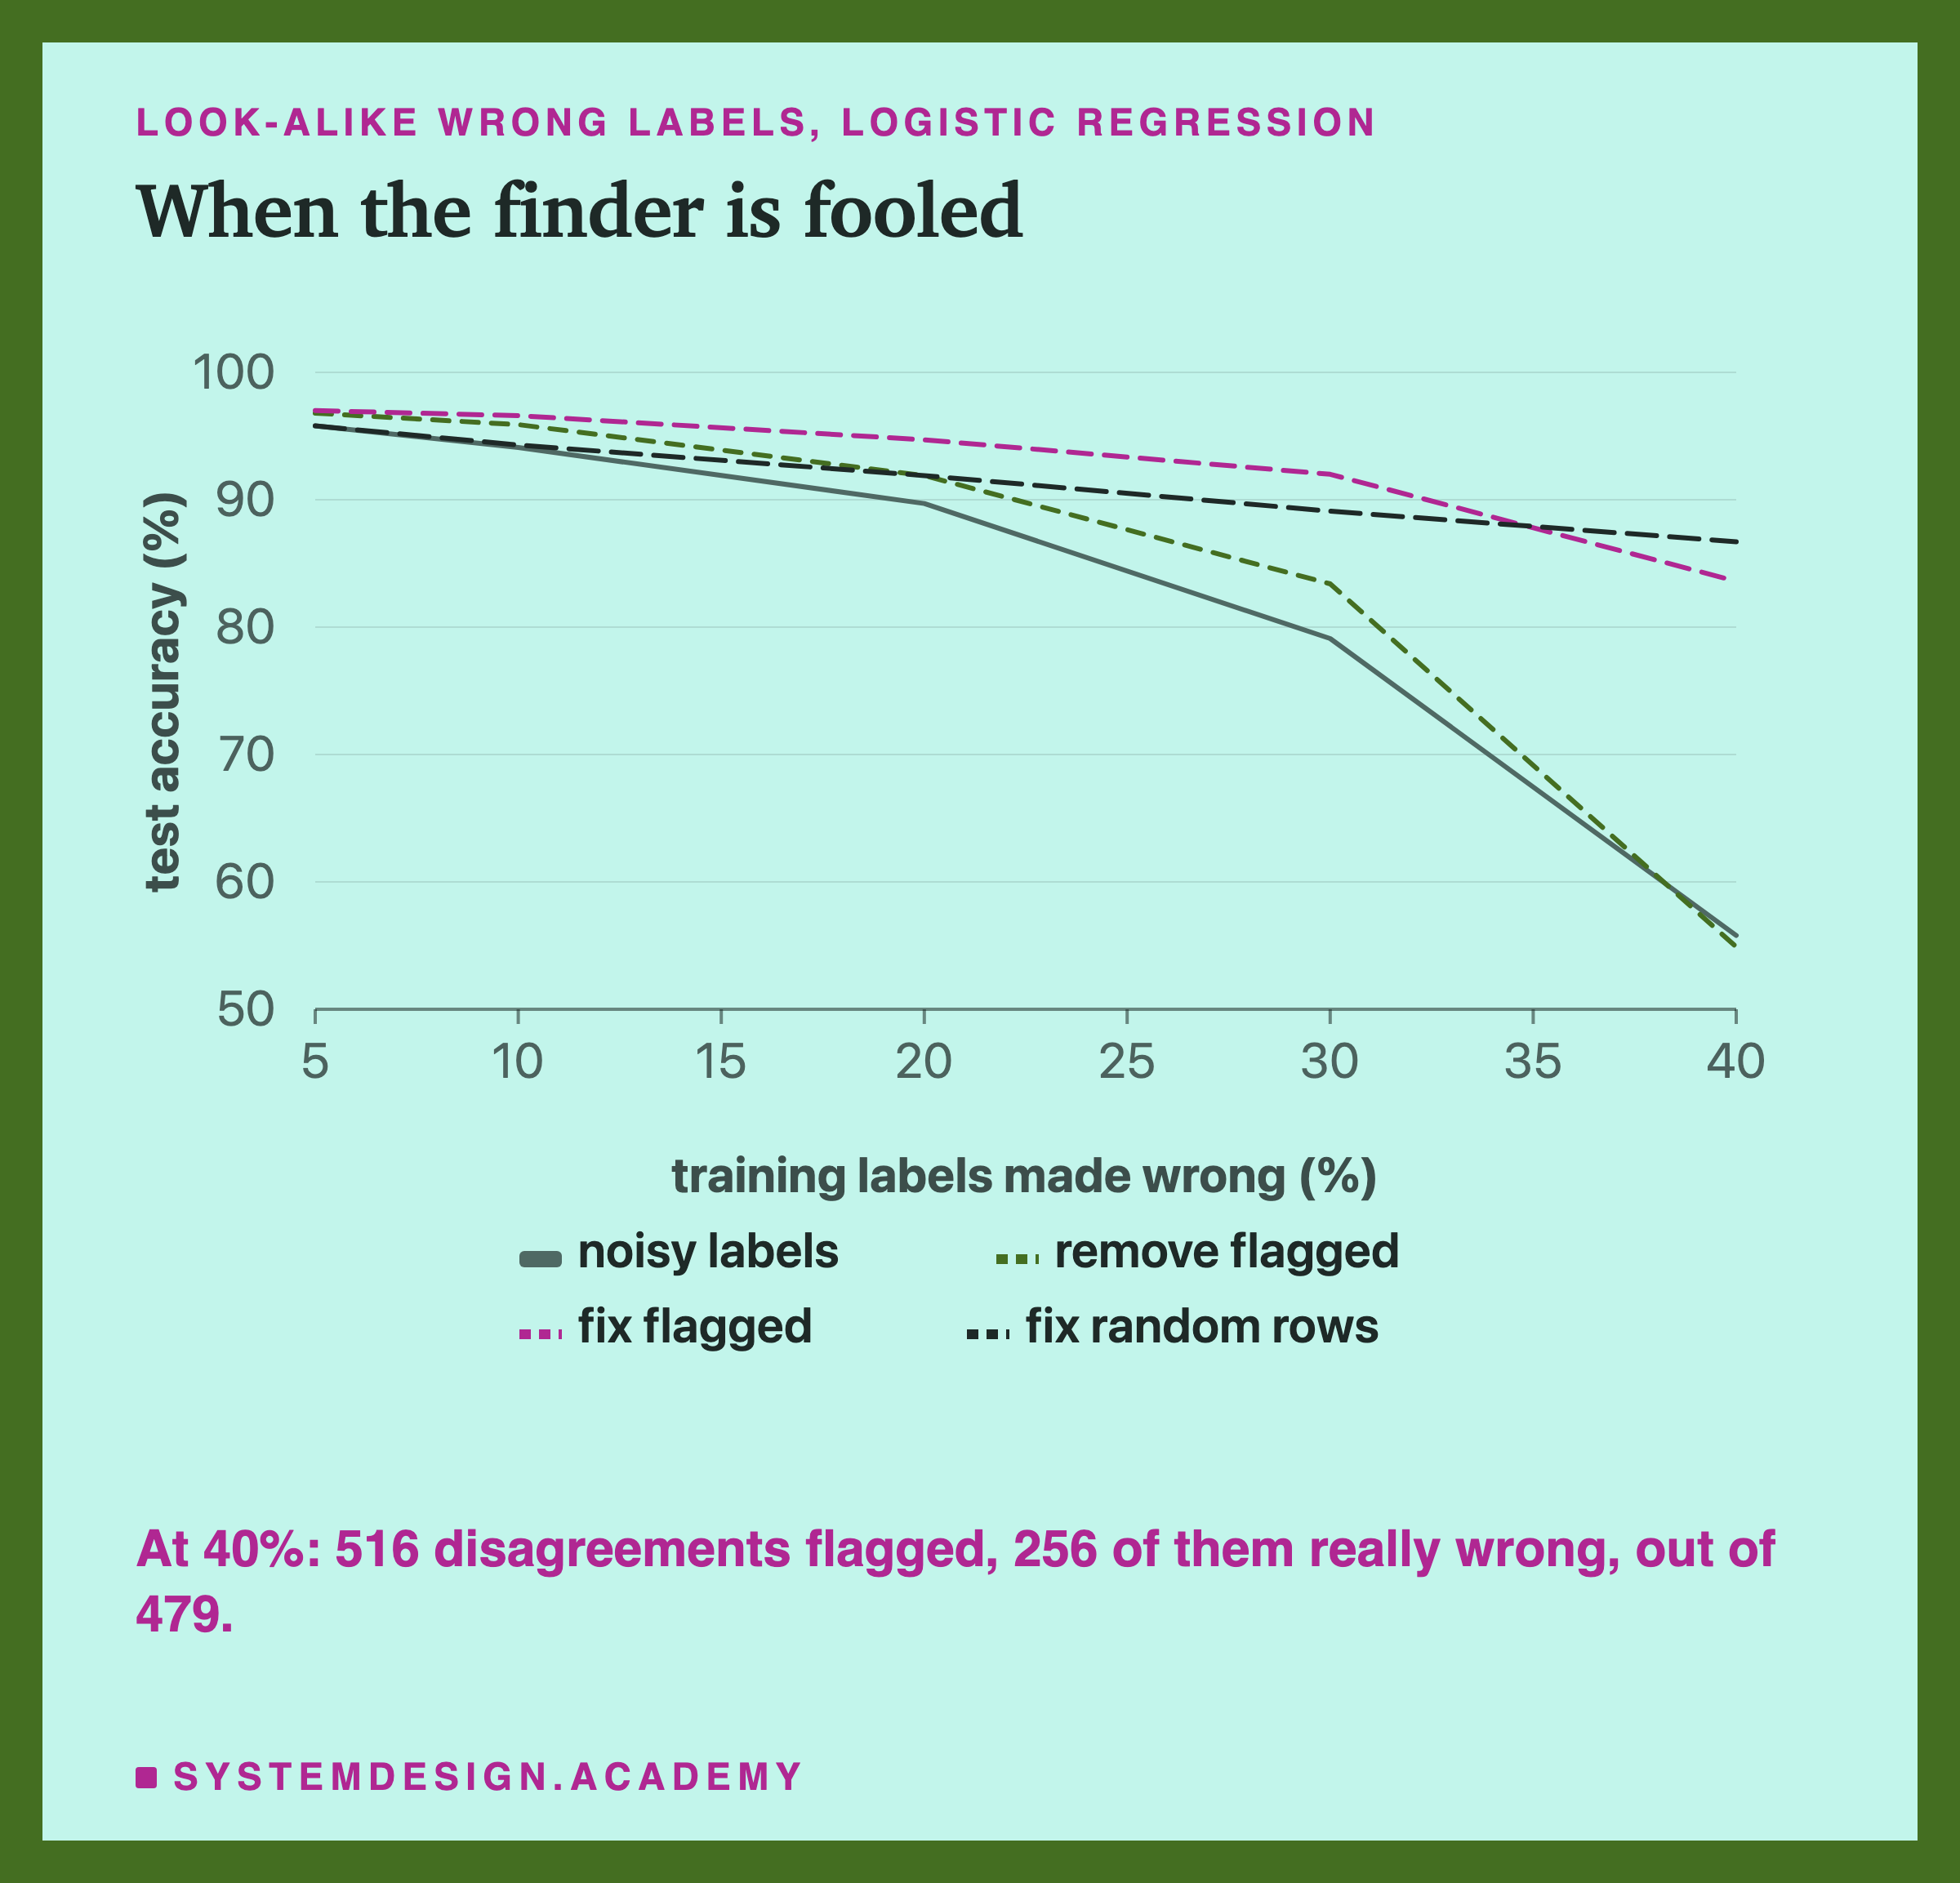
Take the version you can actually use, flagging every disagreement. At 20 percent look-alike mistakes it still found 94 percent of the wrong labels, close to the 99 percent it found with random ones. But it needed more flags to do it: 325 against 307, so only 69 percent of its flags were real, against 77 percent.
At 40 percent it broke down. It flagged 516 rows and only 256 of them were wrong, about half of the 479 wrong labels. Fixing the most suspicious rows even scored 83.6%, lower than fixing random rows at 86.7%, because the flags piled onto some digits and left others, while random fixing spread the corrections evenly.
The reason: the finder is itself a model trained on the noisy labels. When the mistakes share a pattern, it learns some of the pattern too, and those wrong labels start to look normal to it. At 40 percent, about half of each pair is wrong, so no method could tell the true label. A finder can only spot mistakes that disagree with the rest of the data, which is why patterned mistakes need a better labelling guide as well as checking.
Wrong Labels in the Test Set
So far only the training labels were wrong. What if the test set, your answer key, has wrong labels too?
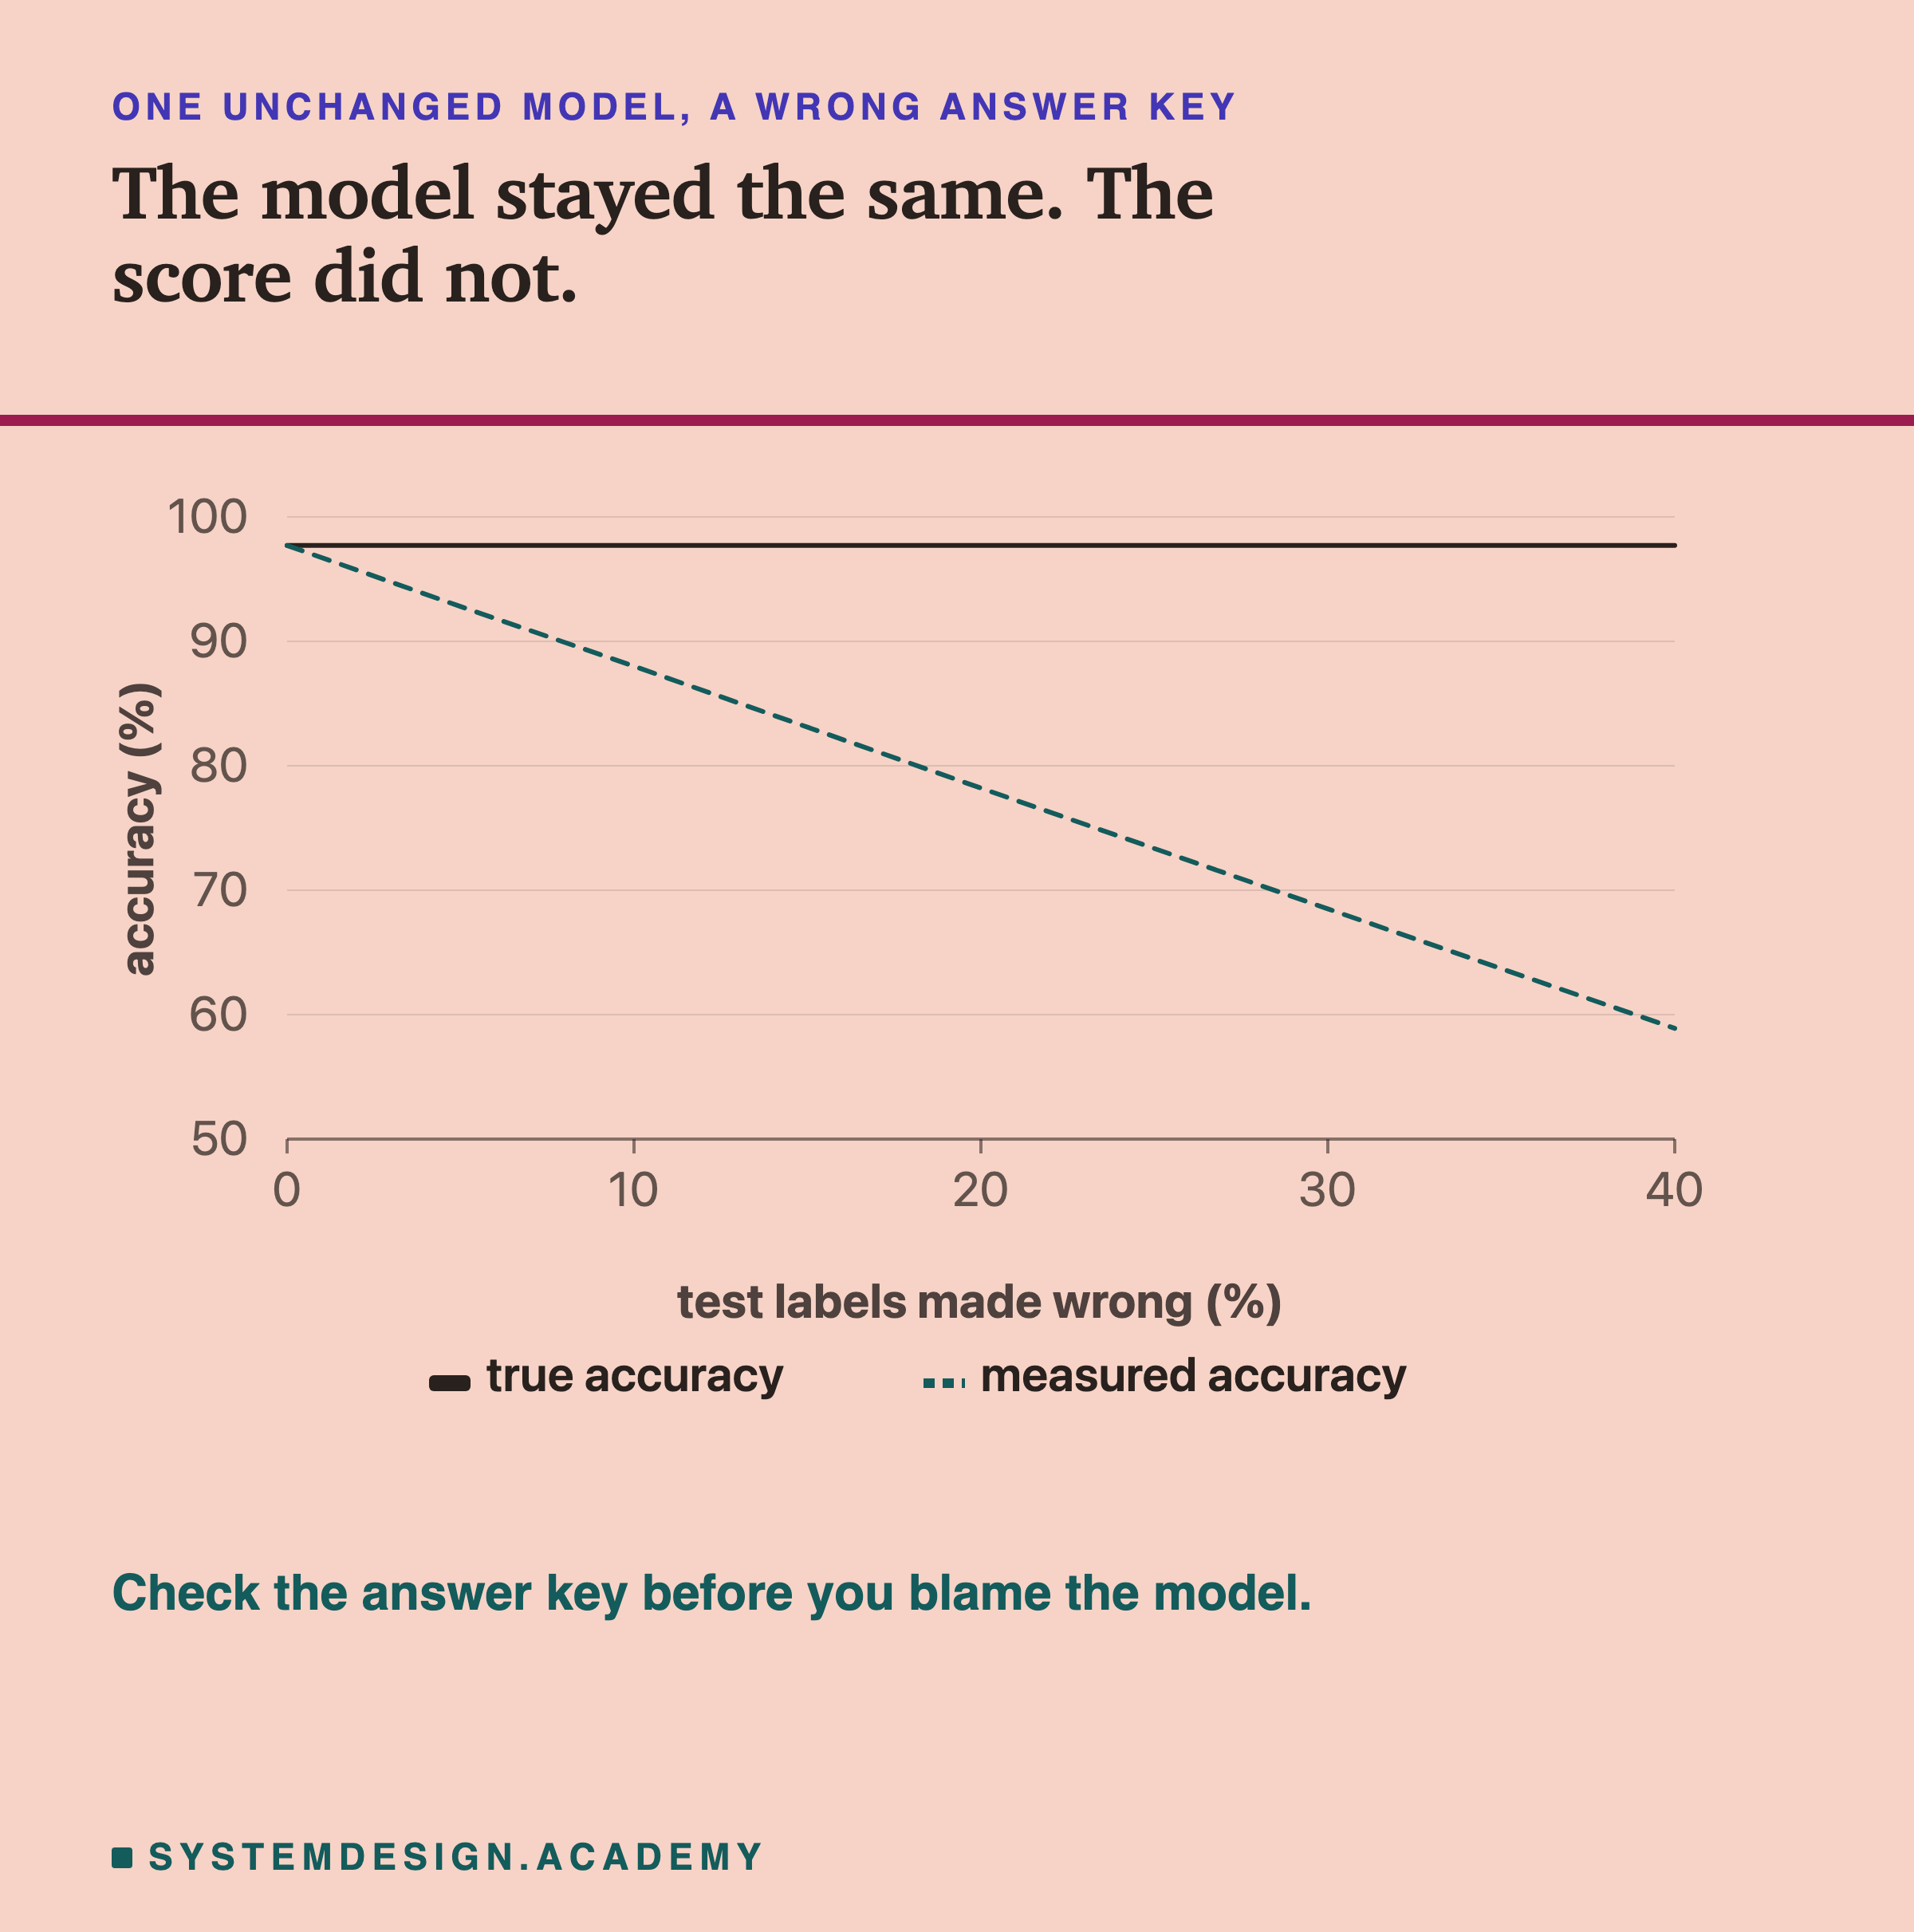
The lab took one logistic regression model trained on clean labels, and scored it against copies of the test set with random wrong labels. The model never changed. Its true accuracy stayed at 97.7%. Its measured accuracy fell: 88% with 10 percent wrong labels in the test set, 78.2% with 20 percent, 58.9% with 40 percent.
A wrong answer key punishes the model for being right. It also caps your score: with 20 percent of the answer key wrong, even a perfect model could only score about 80 percent.
These were random mistakes, which lower every model by about the same amount. If your test labels come from the same tired labellers as your training labels, their mistakes match, and the answer key rewards the model that learnt those mistakes. That can change which model looks best. When a model seems stuck, check the test labels before you blame the model.
Compare the Two Kinds Yourself
This box holds the real per-run accuracies from the lab: for three models and each share of wrong labels, 20 runs with random mistakes and 20 with look-alike ones. Press Run to compare them pair by pair.
Then change MODEL and RATE. Try "knn15" at 5, then "forest" at 30. In the code, knn15 means 15 nearest neighbours.
The last line is a chance written as a decimal. 1.9e-06 means about 2 in a million, and 0.3 means 3 times in 10, which is easily luck.
What This Lab Cannot Tell You
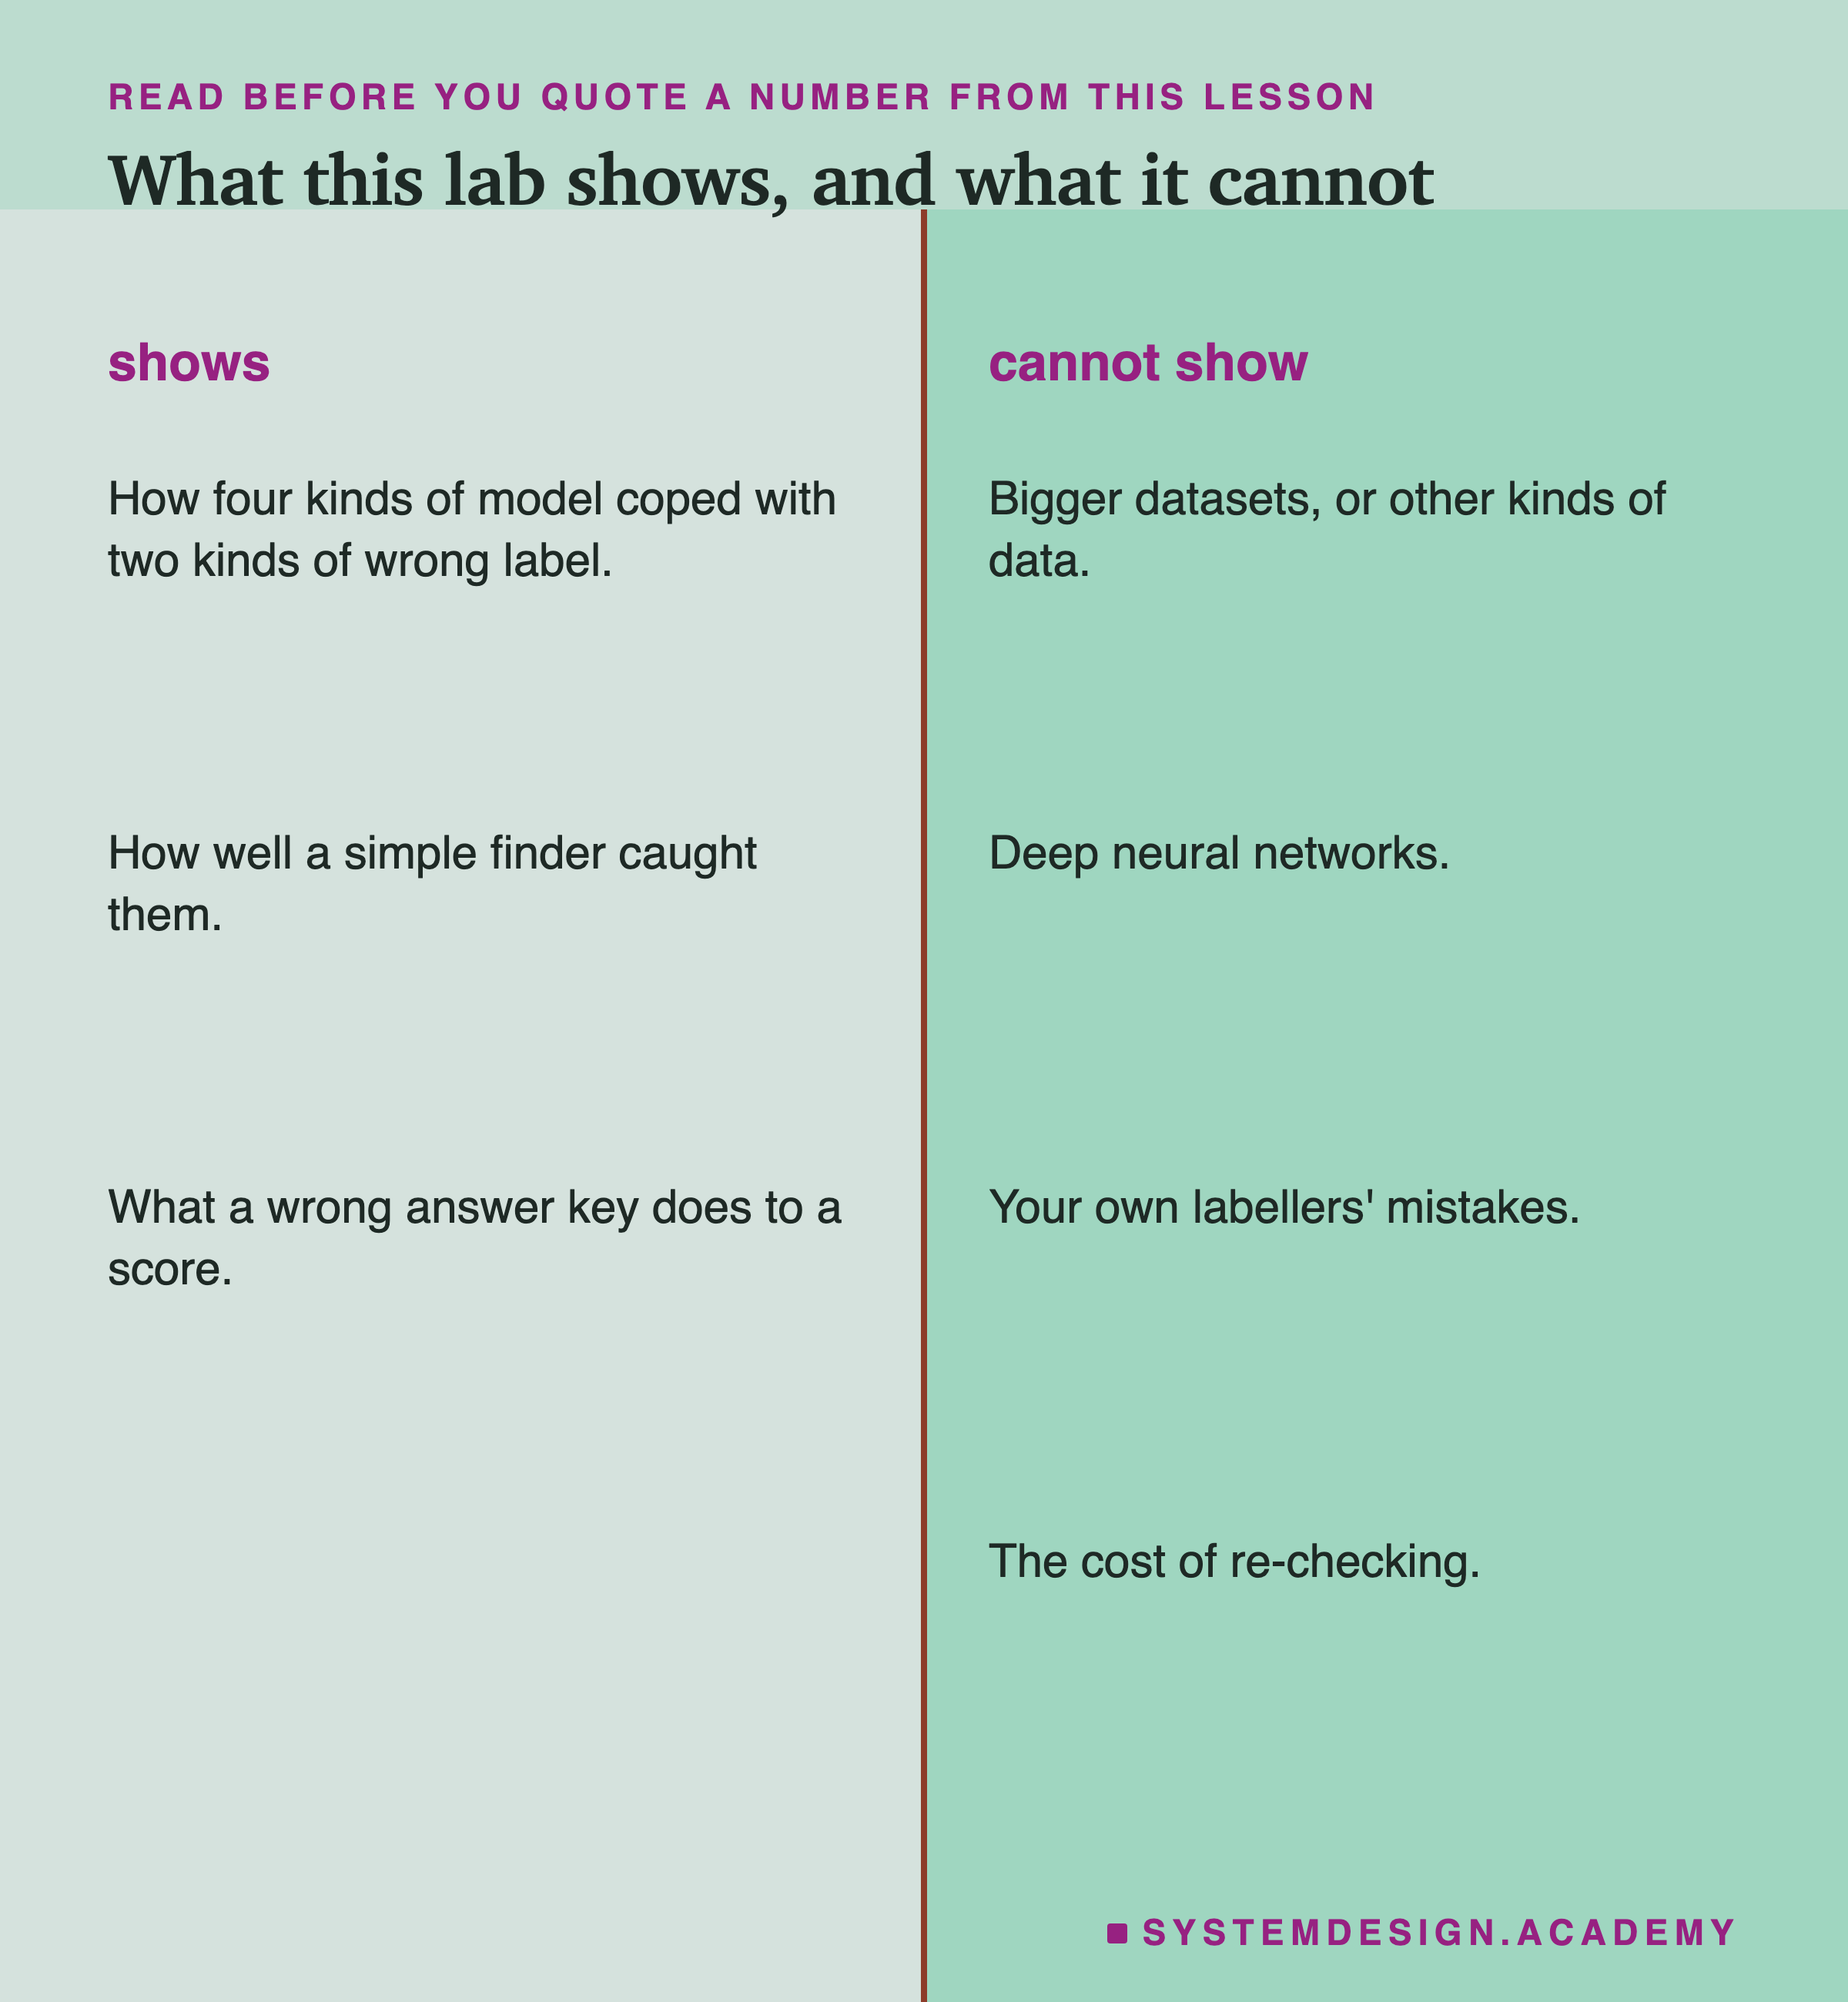
One small dataset. 1,797 small images of digits. Bigger datasets, text, or images of the real world may behave differently.
No deep networks. Large neural networks, the kind of model behind image and speech tools, can also learn wrong labels by heart if trained long enough. They tend to learn the clean patterns first, which is why stopping their training early helps. This lab did not test them.
Made-up mistakes. A program chose the wrong labels, so the lab knows exactly which they are. Your labellers make their own kinds of mistake, probably a mix of both kinds here, and you never have the full list.
A perfect re-checker. When the lab "fixed" a flagged row, it used the true label. A real person re-checking will make some mistakes too.
One division, one finder. The same 600 test digits were kept aside in every run, so the seeds show how results move with the mistakes, not with which digits were kept aside. The finder and the model retrained after fixing were both logistic regression.
What to Do on Monday
-
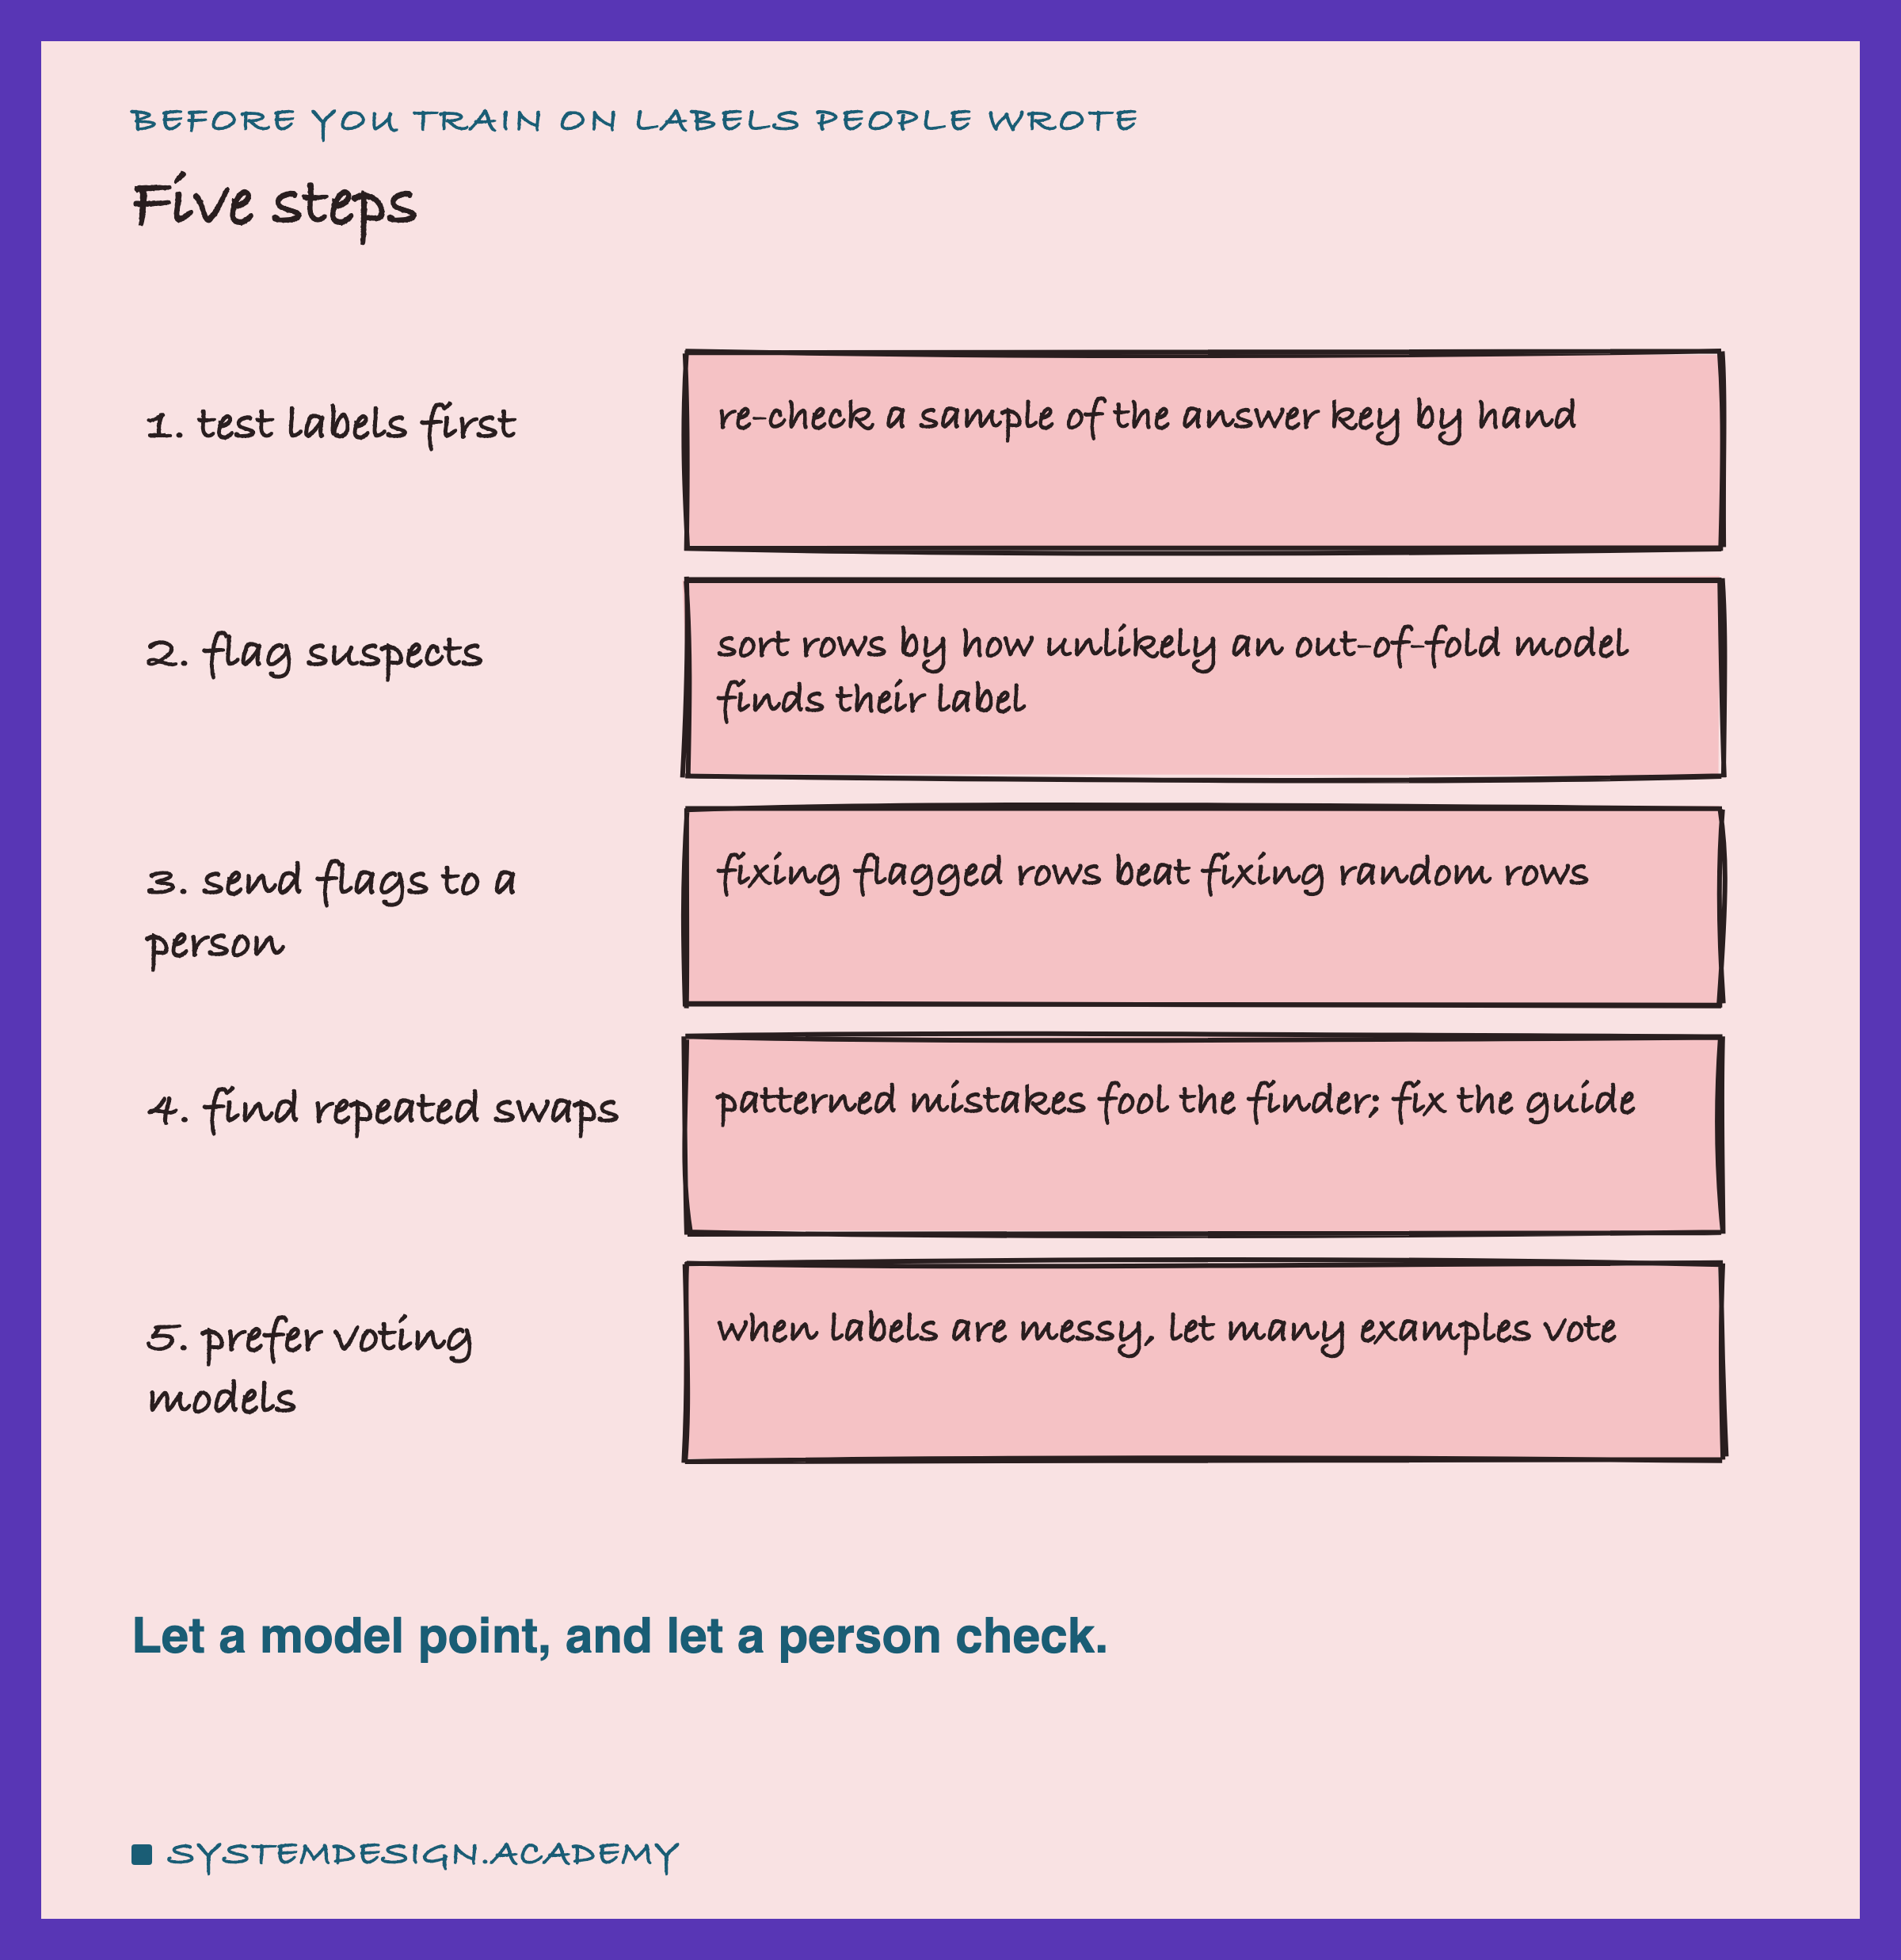
Check the test labels first. Have two people re-label about 200 random test rows without seeing the old labels, and see how often they agree with each other and with the old label. The labelling lesson shows how to measure agreement. Every wrong label in your test set lowers your score and hides real progress.
-
Flag suspicious training labels. Use out-of-fold predictions, and flag the rows where the prediction disagrees with the given label.
-
Send the flagged rows to a person, when you can afford it. Fixing flagged rows beat fixing random rows at every rate of random mistakes here. When time is short and noise is low, removing them is a free second best.
-
Look for repeated confusions. Count which pairs of labels get swapped. A finder is fooled by mistakes that share a pattern, so those need a clearer labelling guide, not just more checking.
-
Try a model that lets many examples vote when your labels are messy. Here the forest and 15 nearest neighbours shrugged off random mistakes that sank nearest neighbour.
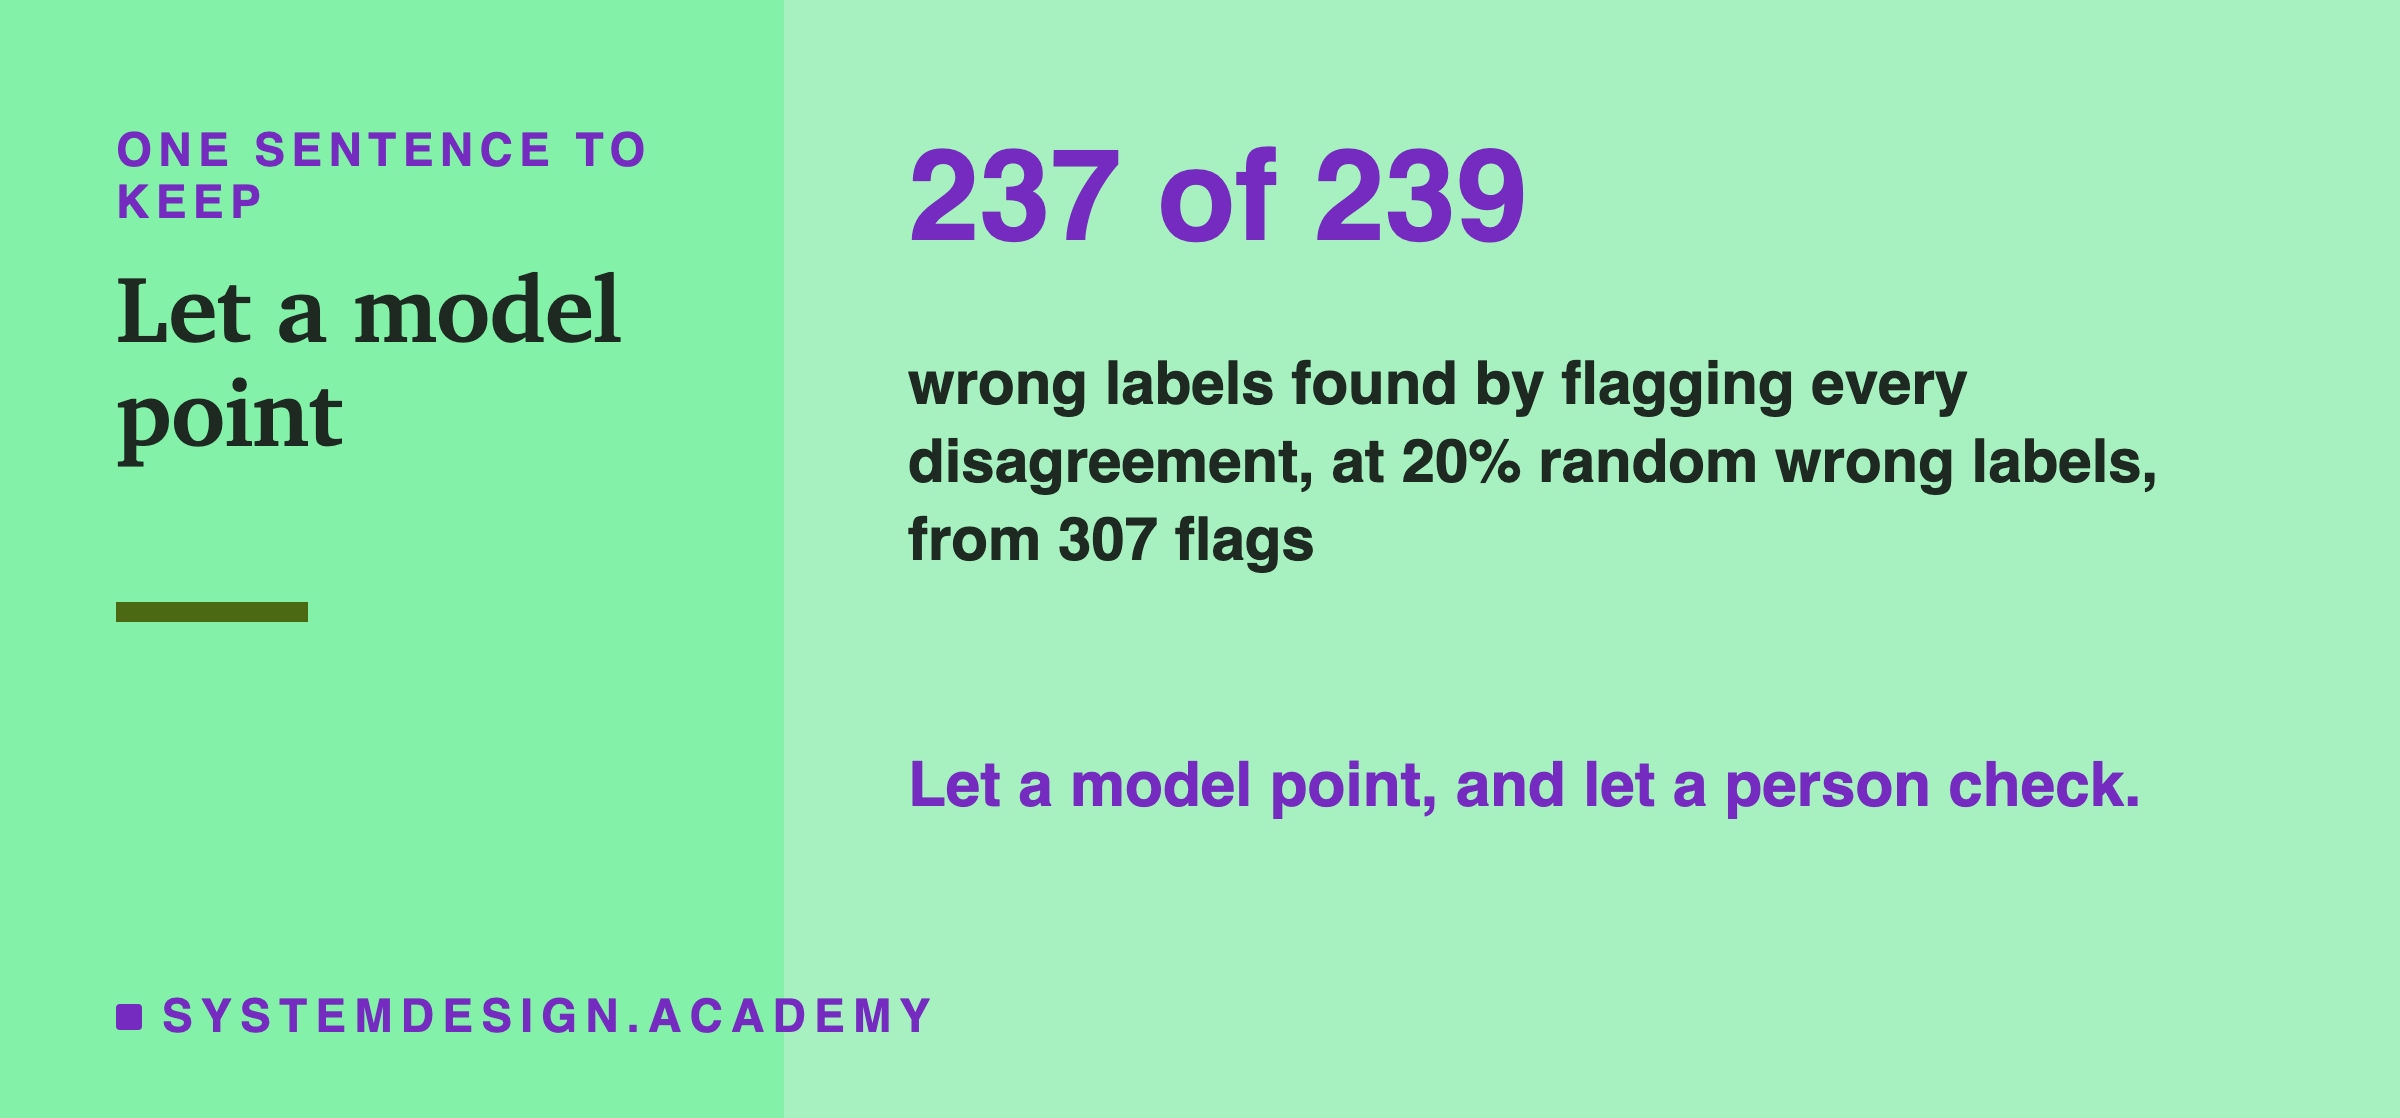
A model can point you to most of your wrong labels, as long as the mistakes do not share a pattern, and a person's time is best spent where it points.
Knowledge Check
Knowledge Check
4 questions - Score 80% to pass
Why did nearest neighbour lose accuracy about as fast as the labels went wrong?
From 20 percent up, why did look-alike mistakes hurt more than random ones?
Why does the finder use out-of-fold predictions?
An unchanged model's measured accuracy dropped from 97.7 percent to about 78.2 percent. What changed?