Caching Strategies

Time To Live (TTL)

0 of 8 complete

0%

Contents

Back|Caching StrategiesTime To Live (TTL)
1/8
21 min left
  1. Home
  2. System Design: Foundation
  3. Caching Strategies
  4. Time To Live (TTL)
Prerequisites
Client-Side Cachingrequired
Related Topics
Caching Predictions: Every Real Hit Was Stale, and Dropping Old Entries Did Not HelpServing and Inference Basics
Previous lessonClient-Side CachingNext lessonMemoization

System Design

  • Foundation
1 of 8
  • Intermediate
  • Advanced
  • Capstone
  • AI Engineering

    • Foundation
    • Data, RAG and Agents
    • Evaluation, LLM Ops and Security

    systemdesign.academy

    • Home
    • Glossary
    • Interview prep
    • Reviews
    • About
    • Privacy
    • Terms

    this free lesson is part of

    System Design Masterclass

    • 770 lessons, beginner to principal
    • 90 real interview systems taken apart step by step
    • An AI tutor beside every lesson that answers and draws
    • Lifetime access, every new lesson included

    $49 once, by PayPal

    See the System Design course

    Save your progress and get the interview checklist PDF

    System Design Interview Cheat Sheet: the 7 interview stages, the 10 points a scorecard grades, 12 classic systems. 18 pages. Free with an account.

    Where this shows up in interviews

    2 system design questions lean on this idea. Each walks through the full answer.

    • →Design a Distributed Cache
    • →Design a News Aggregator

    you just read a free lesson from

    System Design Masterclass

    • 770 lessons, beginner to principal
    • 90 real interview systems taken apart step by step
    • An AI tutor beside every lesson that answers and draws
    • Lifetime access, every new lesson included

    $49 once, by PayPal

    See the System Design course

    What a TTL Is Actually Betting On

    Every cache in this chapter has had a in it somewhere, and every team that has one has had the same argument: is five minutes too long, or not long enough?
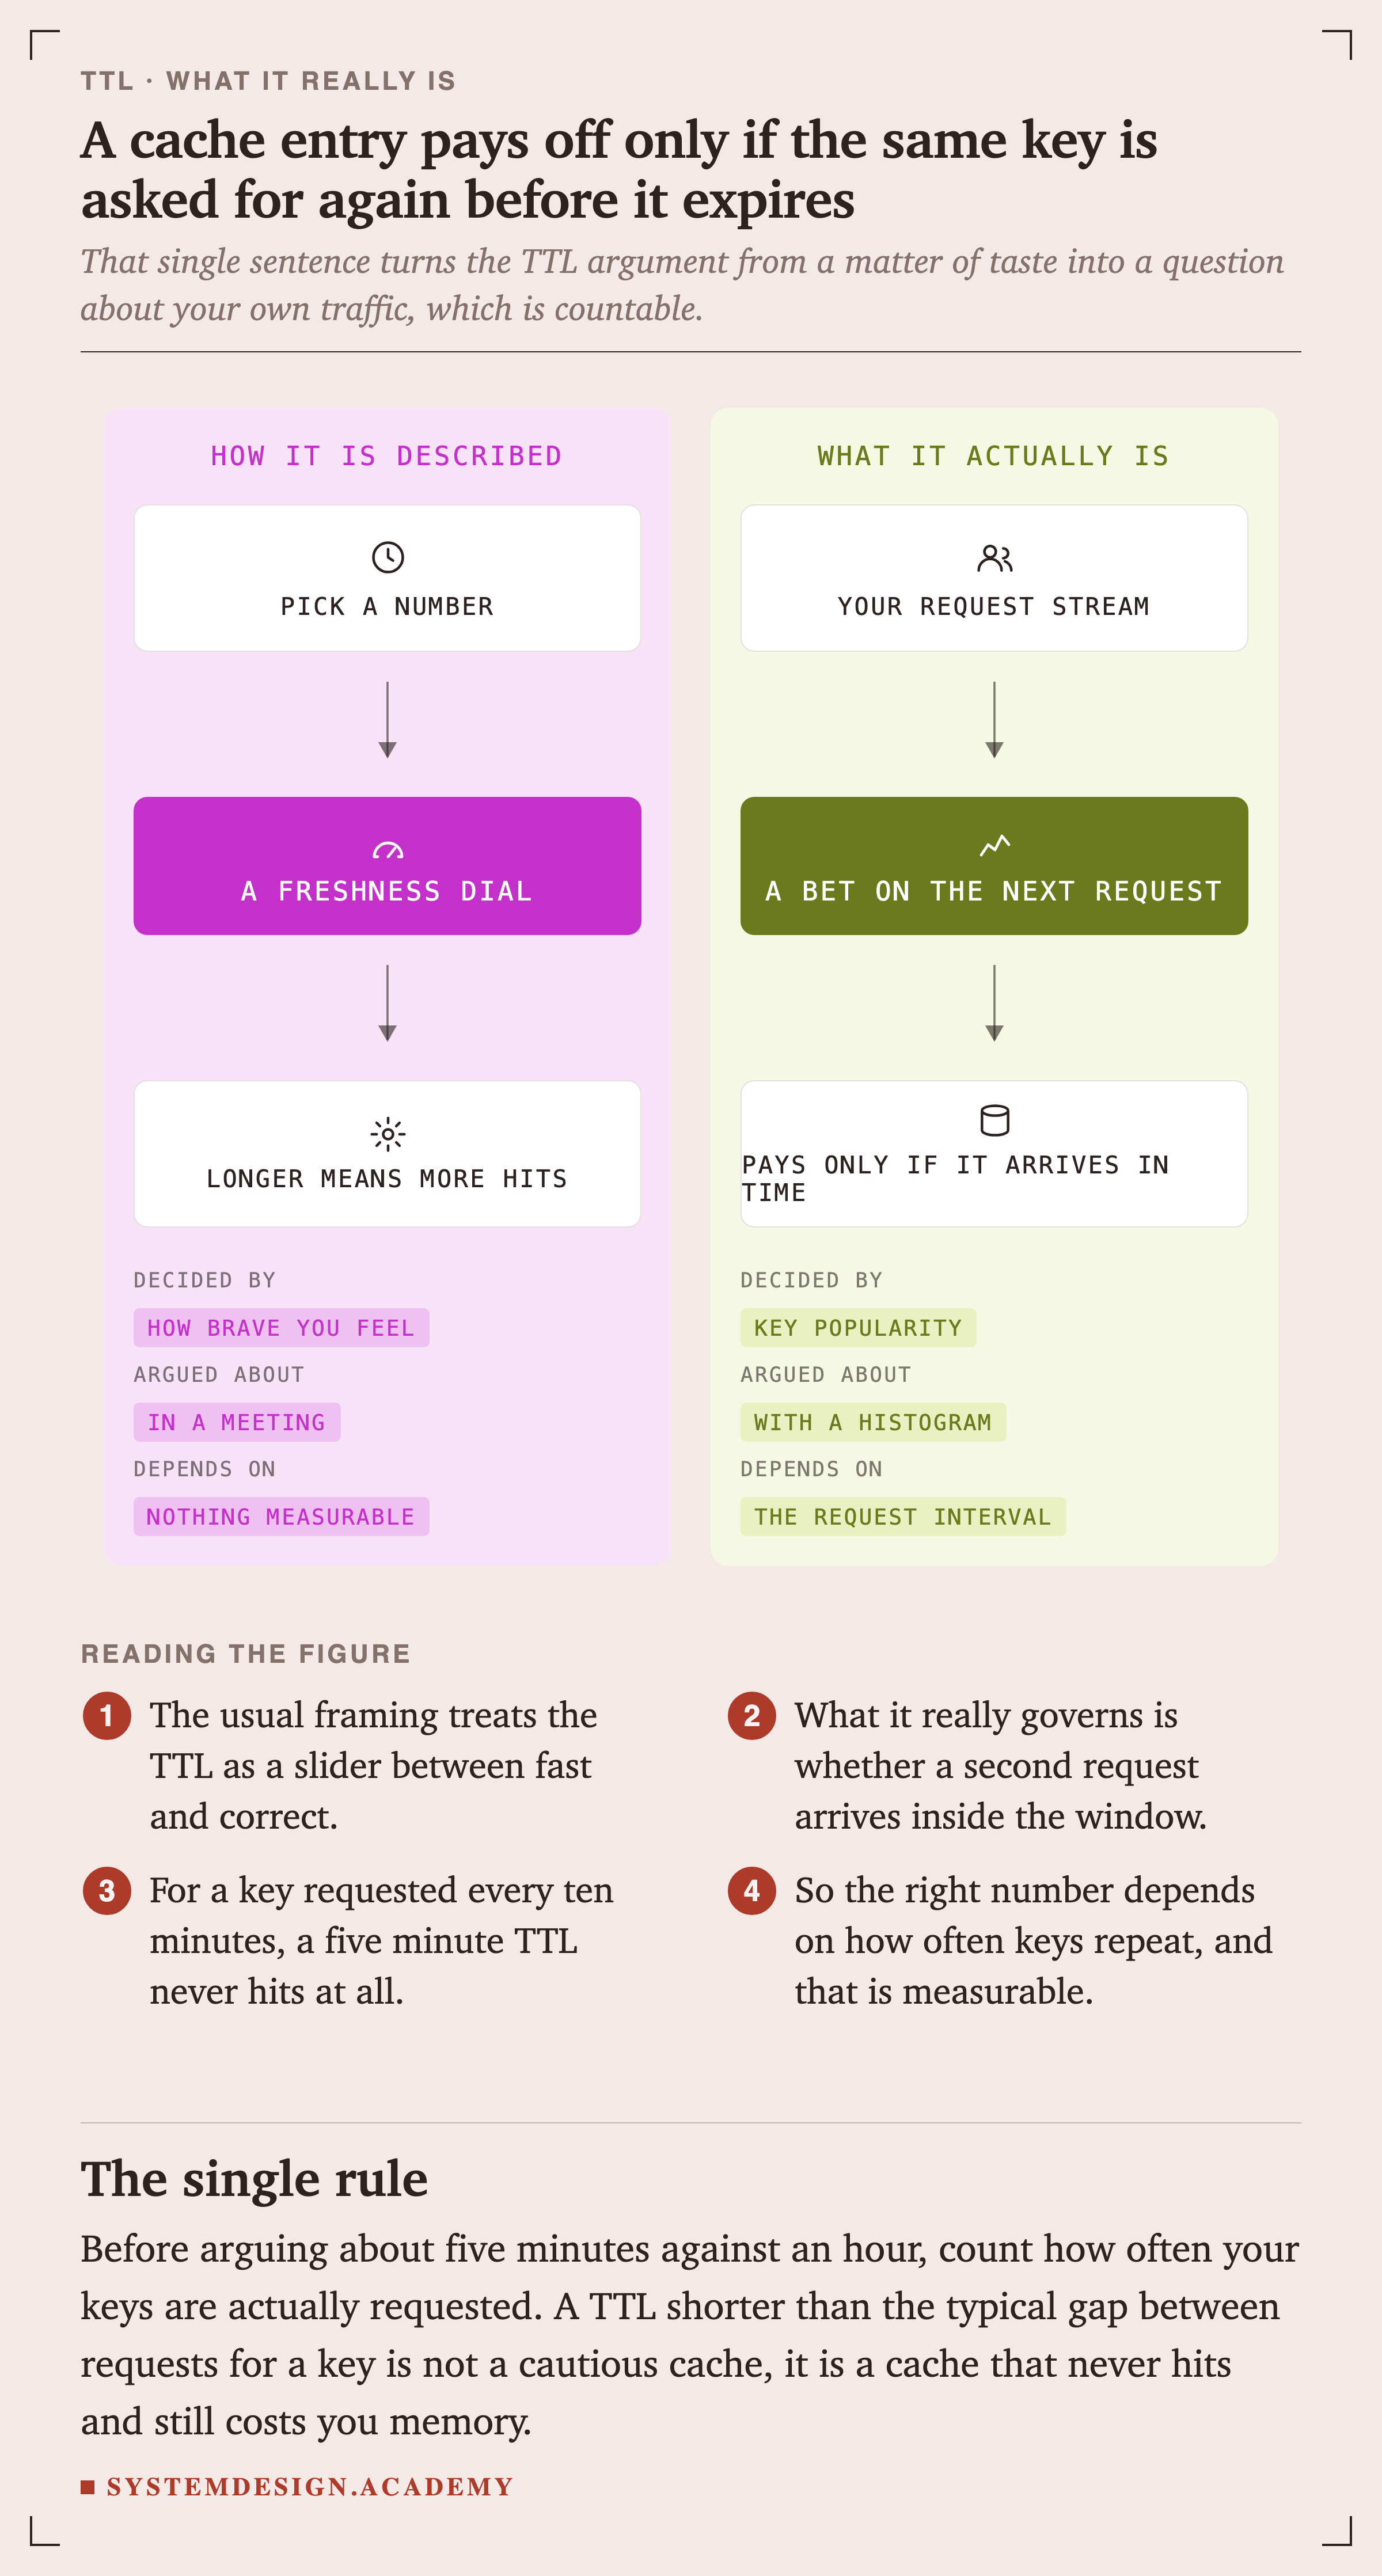
    Two panels. The left, how it is described, shows picking a number, feeding a freshness dial, ending in longer means more hits. Its key reads: decided by how brave you feel, argued about in a meeting, depends on nothing measurable. The right, what it actually is, shows your request stream feeding a bet on the next request, ending in pays only if it arrives in time. Its key reads: decided by key popularity, argued about with a histogram, depends on the request interval.
    ComparisonFigure 1. A cache entry pays off only if the same key is asked for again before it expires

    That single sentence turns the argument from a matter of taste into a question about your own traffic, which is countable. For a key requested every ten minutes, a five minute TTL never hits at all, however careful the reasoning behind it was.

    So the right number depends on how often keys repeat. The next thing to establish is what that actually looks like.

    Real Traffic Is Not Uniform
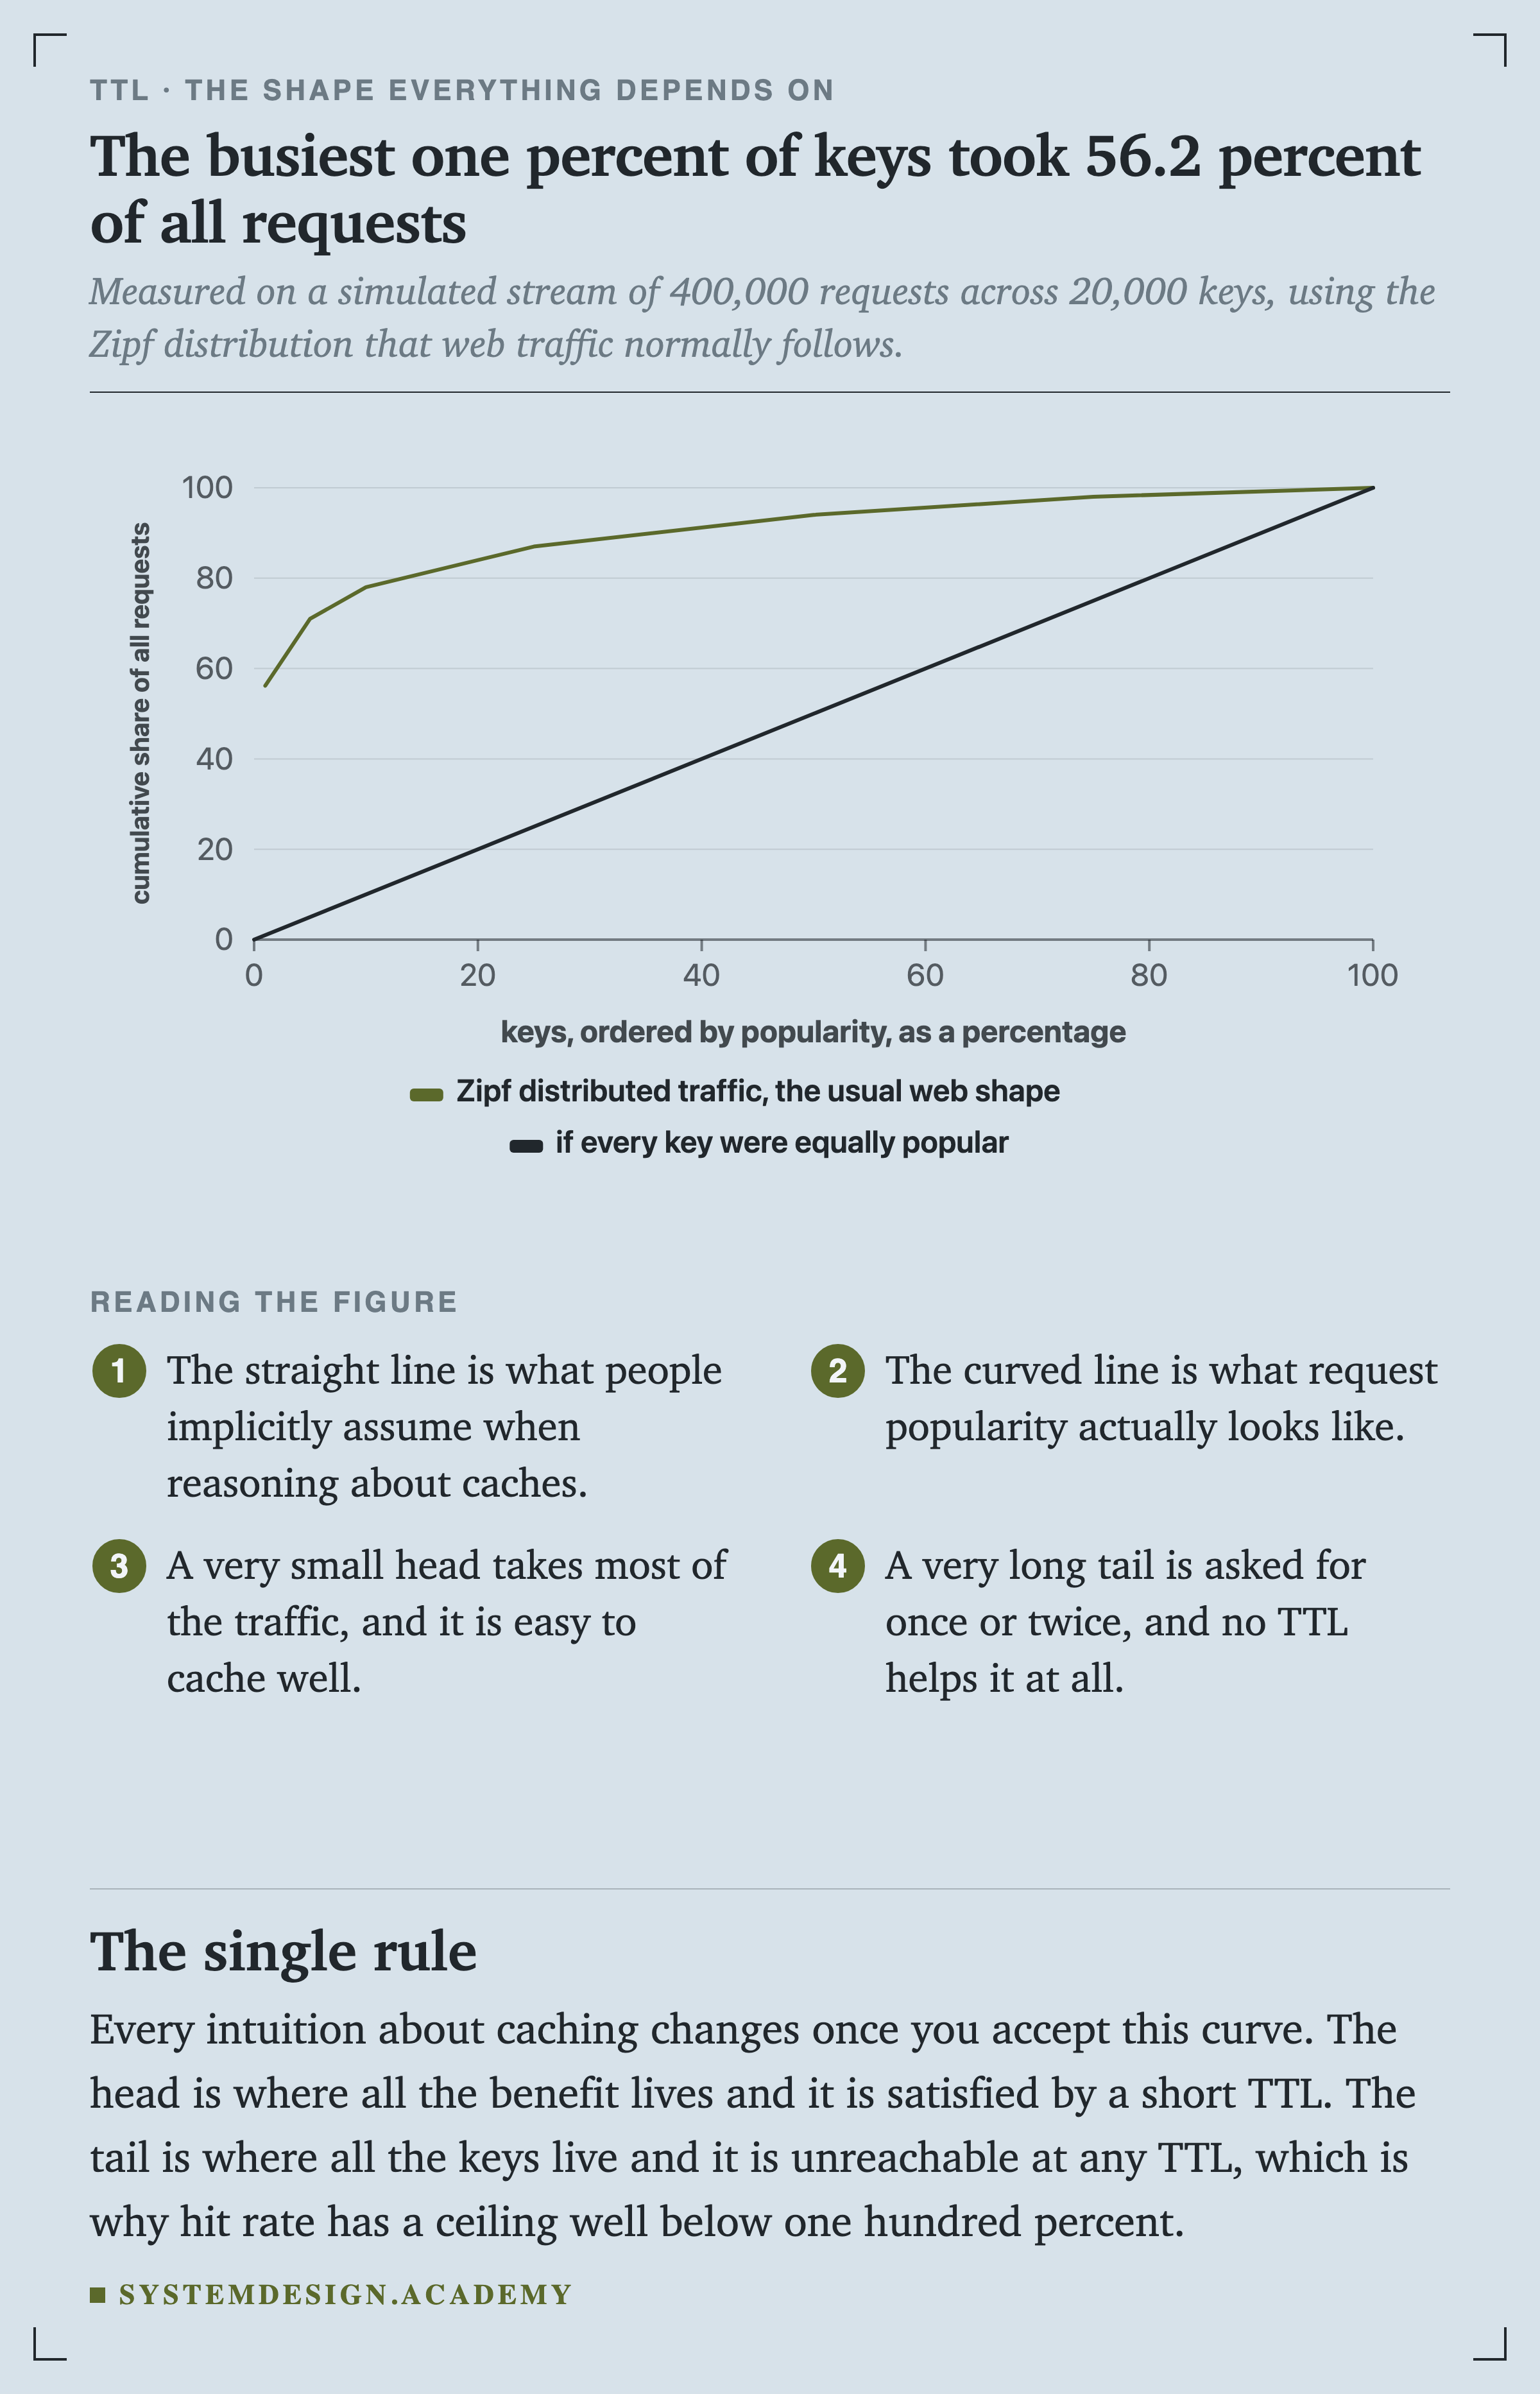
    A line chart of the cumulative share of all requests against keys ordered by popularity as a percentage. The Zipf line rises steeply, reaching 56.2 percent at the first 1 percent of keys, 78 percent at 10 percent, and 94 percent at half. A straight diagonal line shows what equal popularity would look like.
    ChartFigure 2. The busiest one percent of keys took 56.2 percent of all requests

    The straight line is what people implicitly assume when reasoning about caches. The curved line is what request popularity actually looks like, and every intuition about changes once you accept it.

    A very small head takes most of the traffic and is easy to cache well. A very long tail is asked for once or twice, and no helps it.

    after “Real Traffic Is Not Uniform”

    Want to go one level deeper on this?

    Pick it up in Write-Through Cache, from the System Design course.

    Plain English first, then the detail, then a quick check that you got it.

    See what the course covers

    Sweeping the TTL

    The script is at scripts/labs/ttl/sweep.py. It generates 400,000 requests across 20,000 keys over an hour, Zipf distributed, and reports hit rate, origin load and staleness at seven different TTLs.
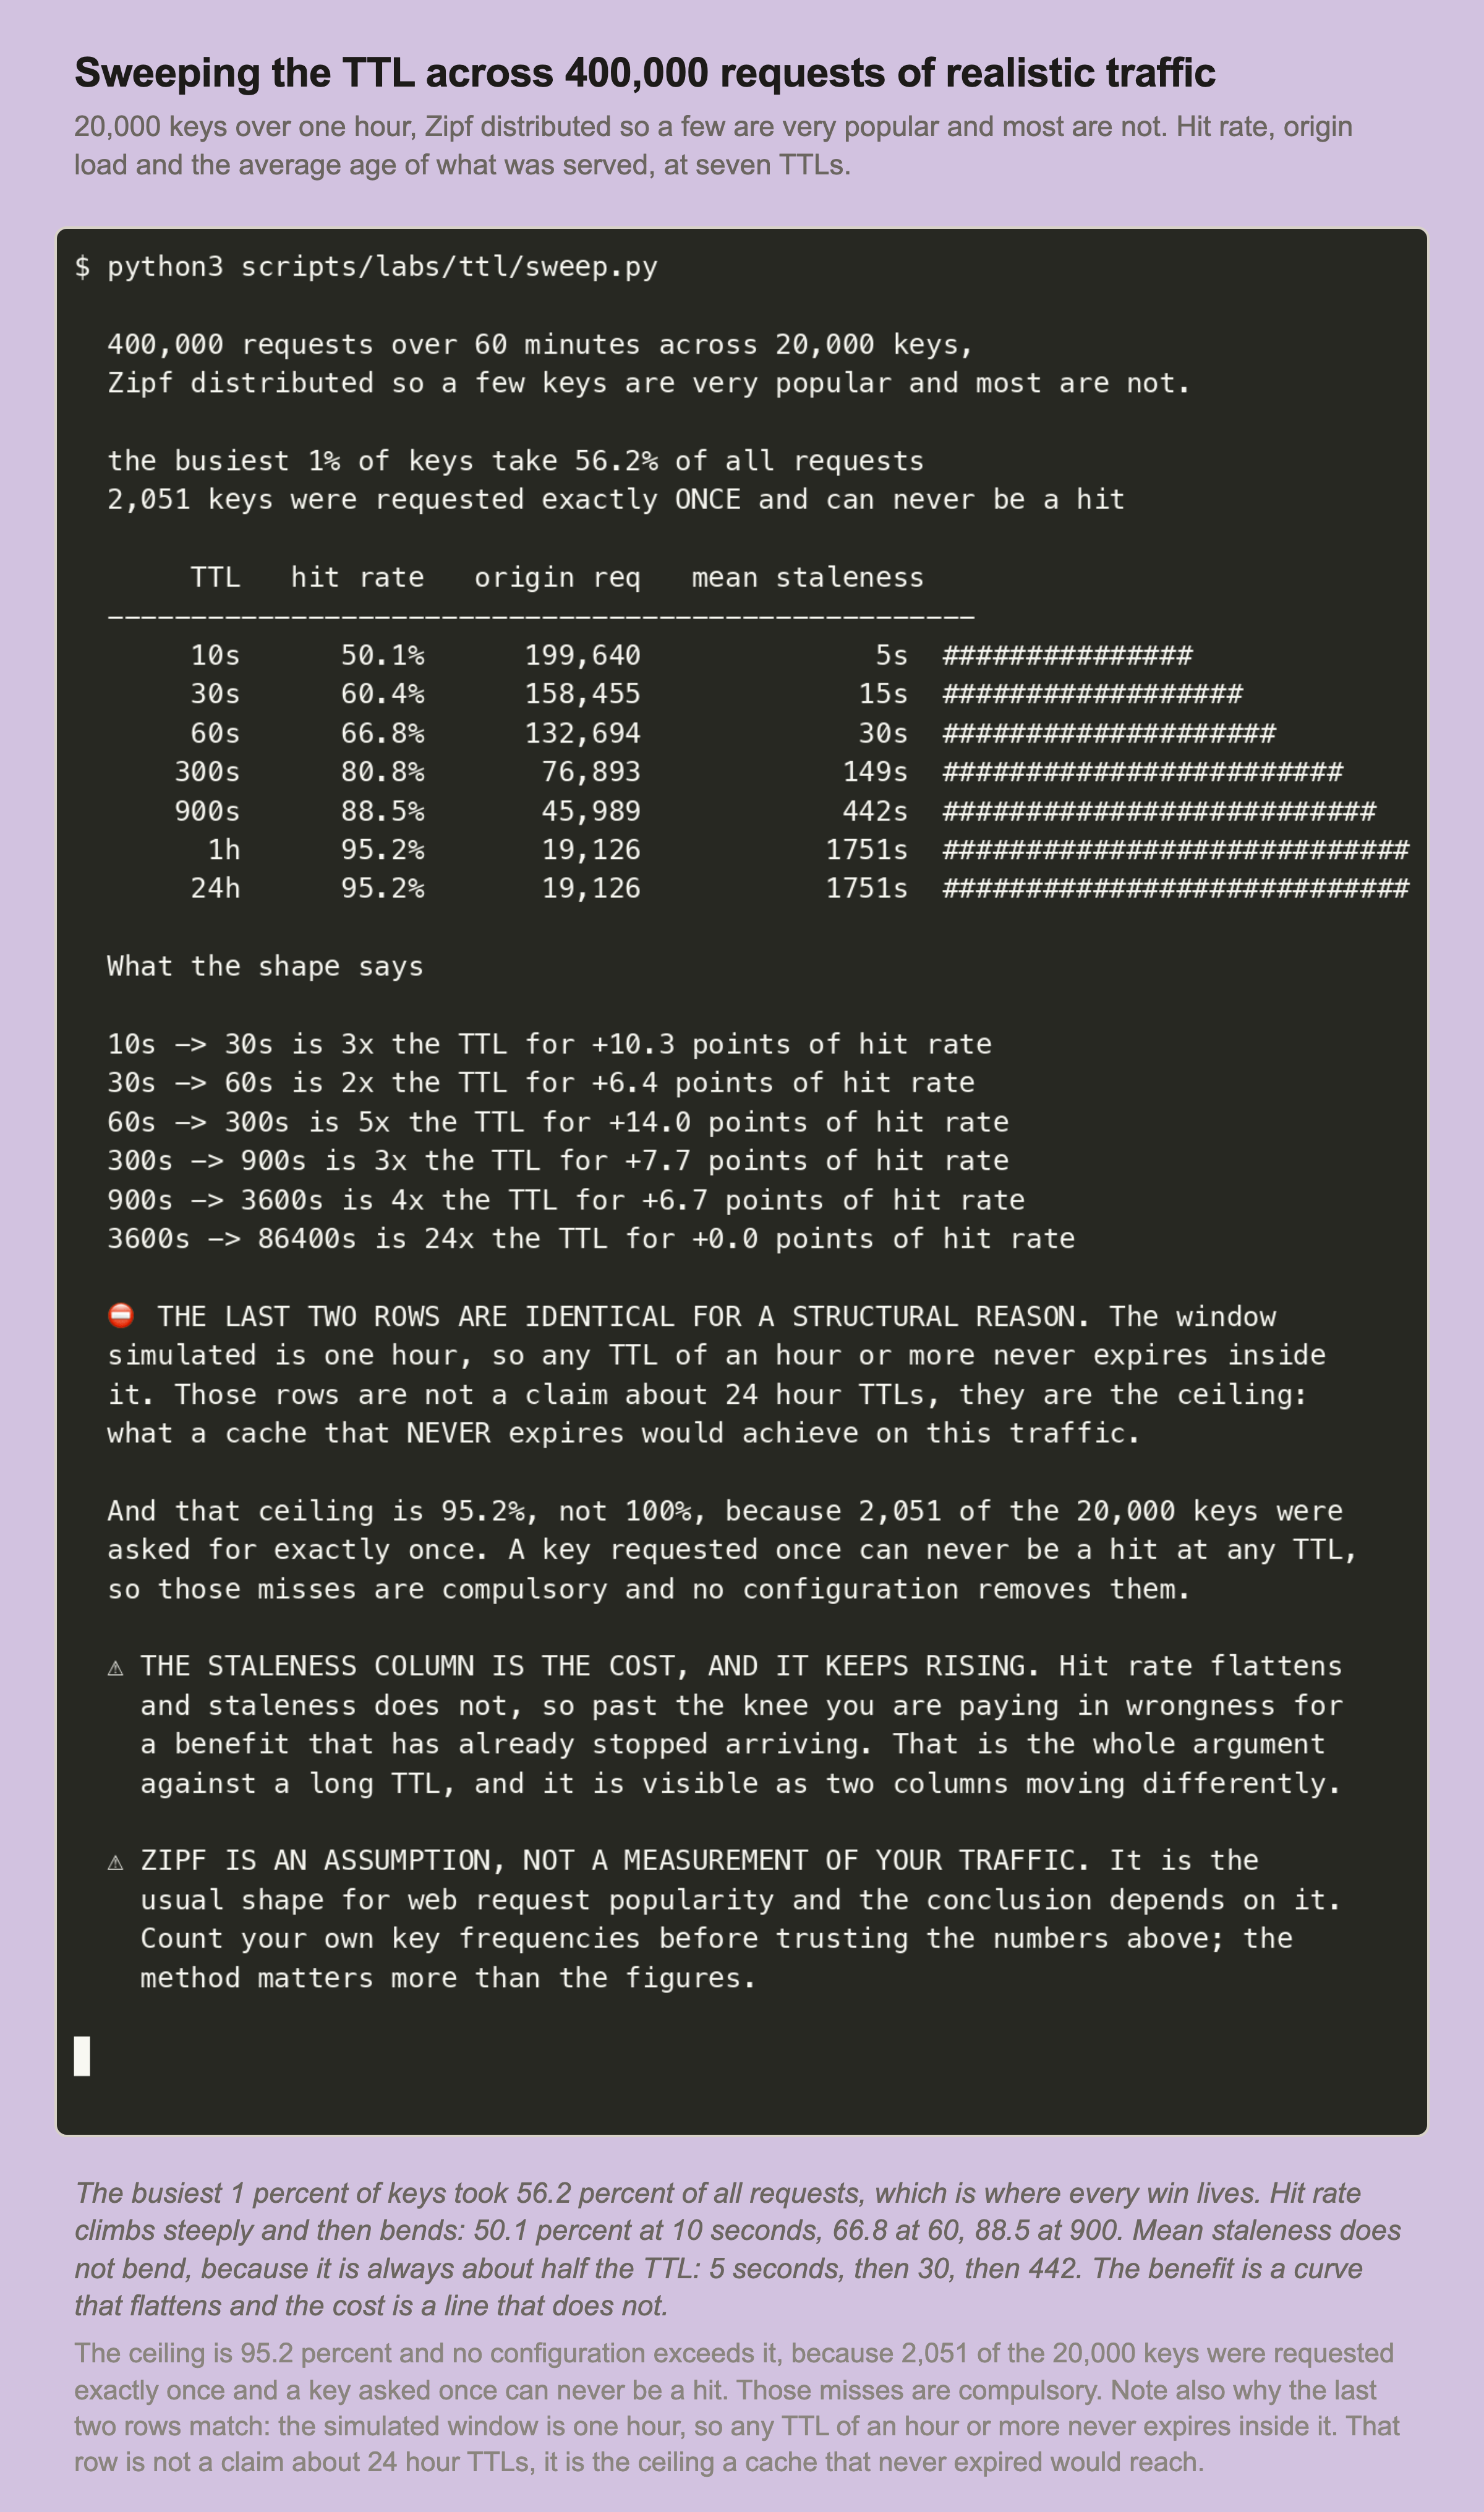
    A recorded terminal session. The busiest 1 percent of keys take 56.2 percent of requests, and 2,051 keys were requested exactly once. A table shows TTL against hit rate, origin requests and mean staleness: 10 seconds gives 50.1 percent, 199,640 origin requests and 5 seconds staleness; 60 seconds gives 66.8 percent, 132,694 and 30 seconds; 900 seconds gives 88.5 percent, 45,989 and 442 seconds; one hour gives 95.2 percent, 19,126 and 1,751 seconds. A note explains that the last two rows match because the window is one hour.
    RecordedFigure 3. Seven TTLs against 400,000 requests of realistic traffic

    The benefit is a curve that flattens. The cost is a line that does not, because mean staleness is always about half the . Those two columns moving differently is the whole argument.
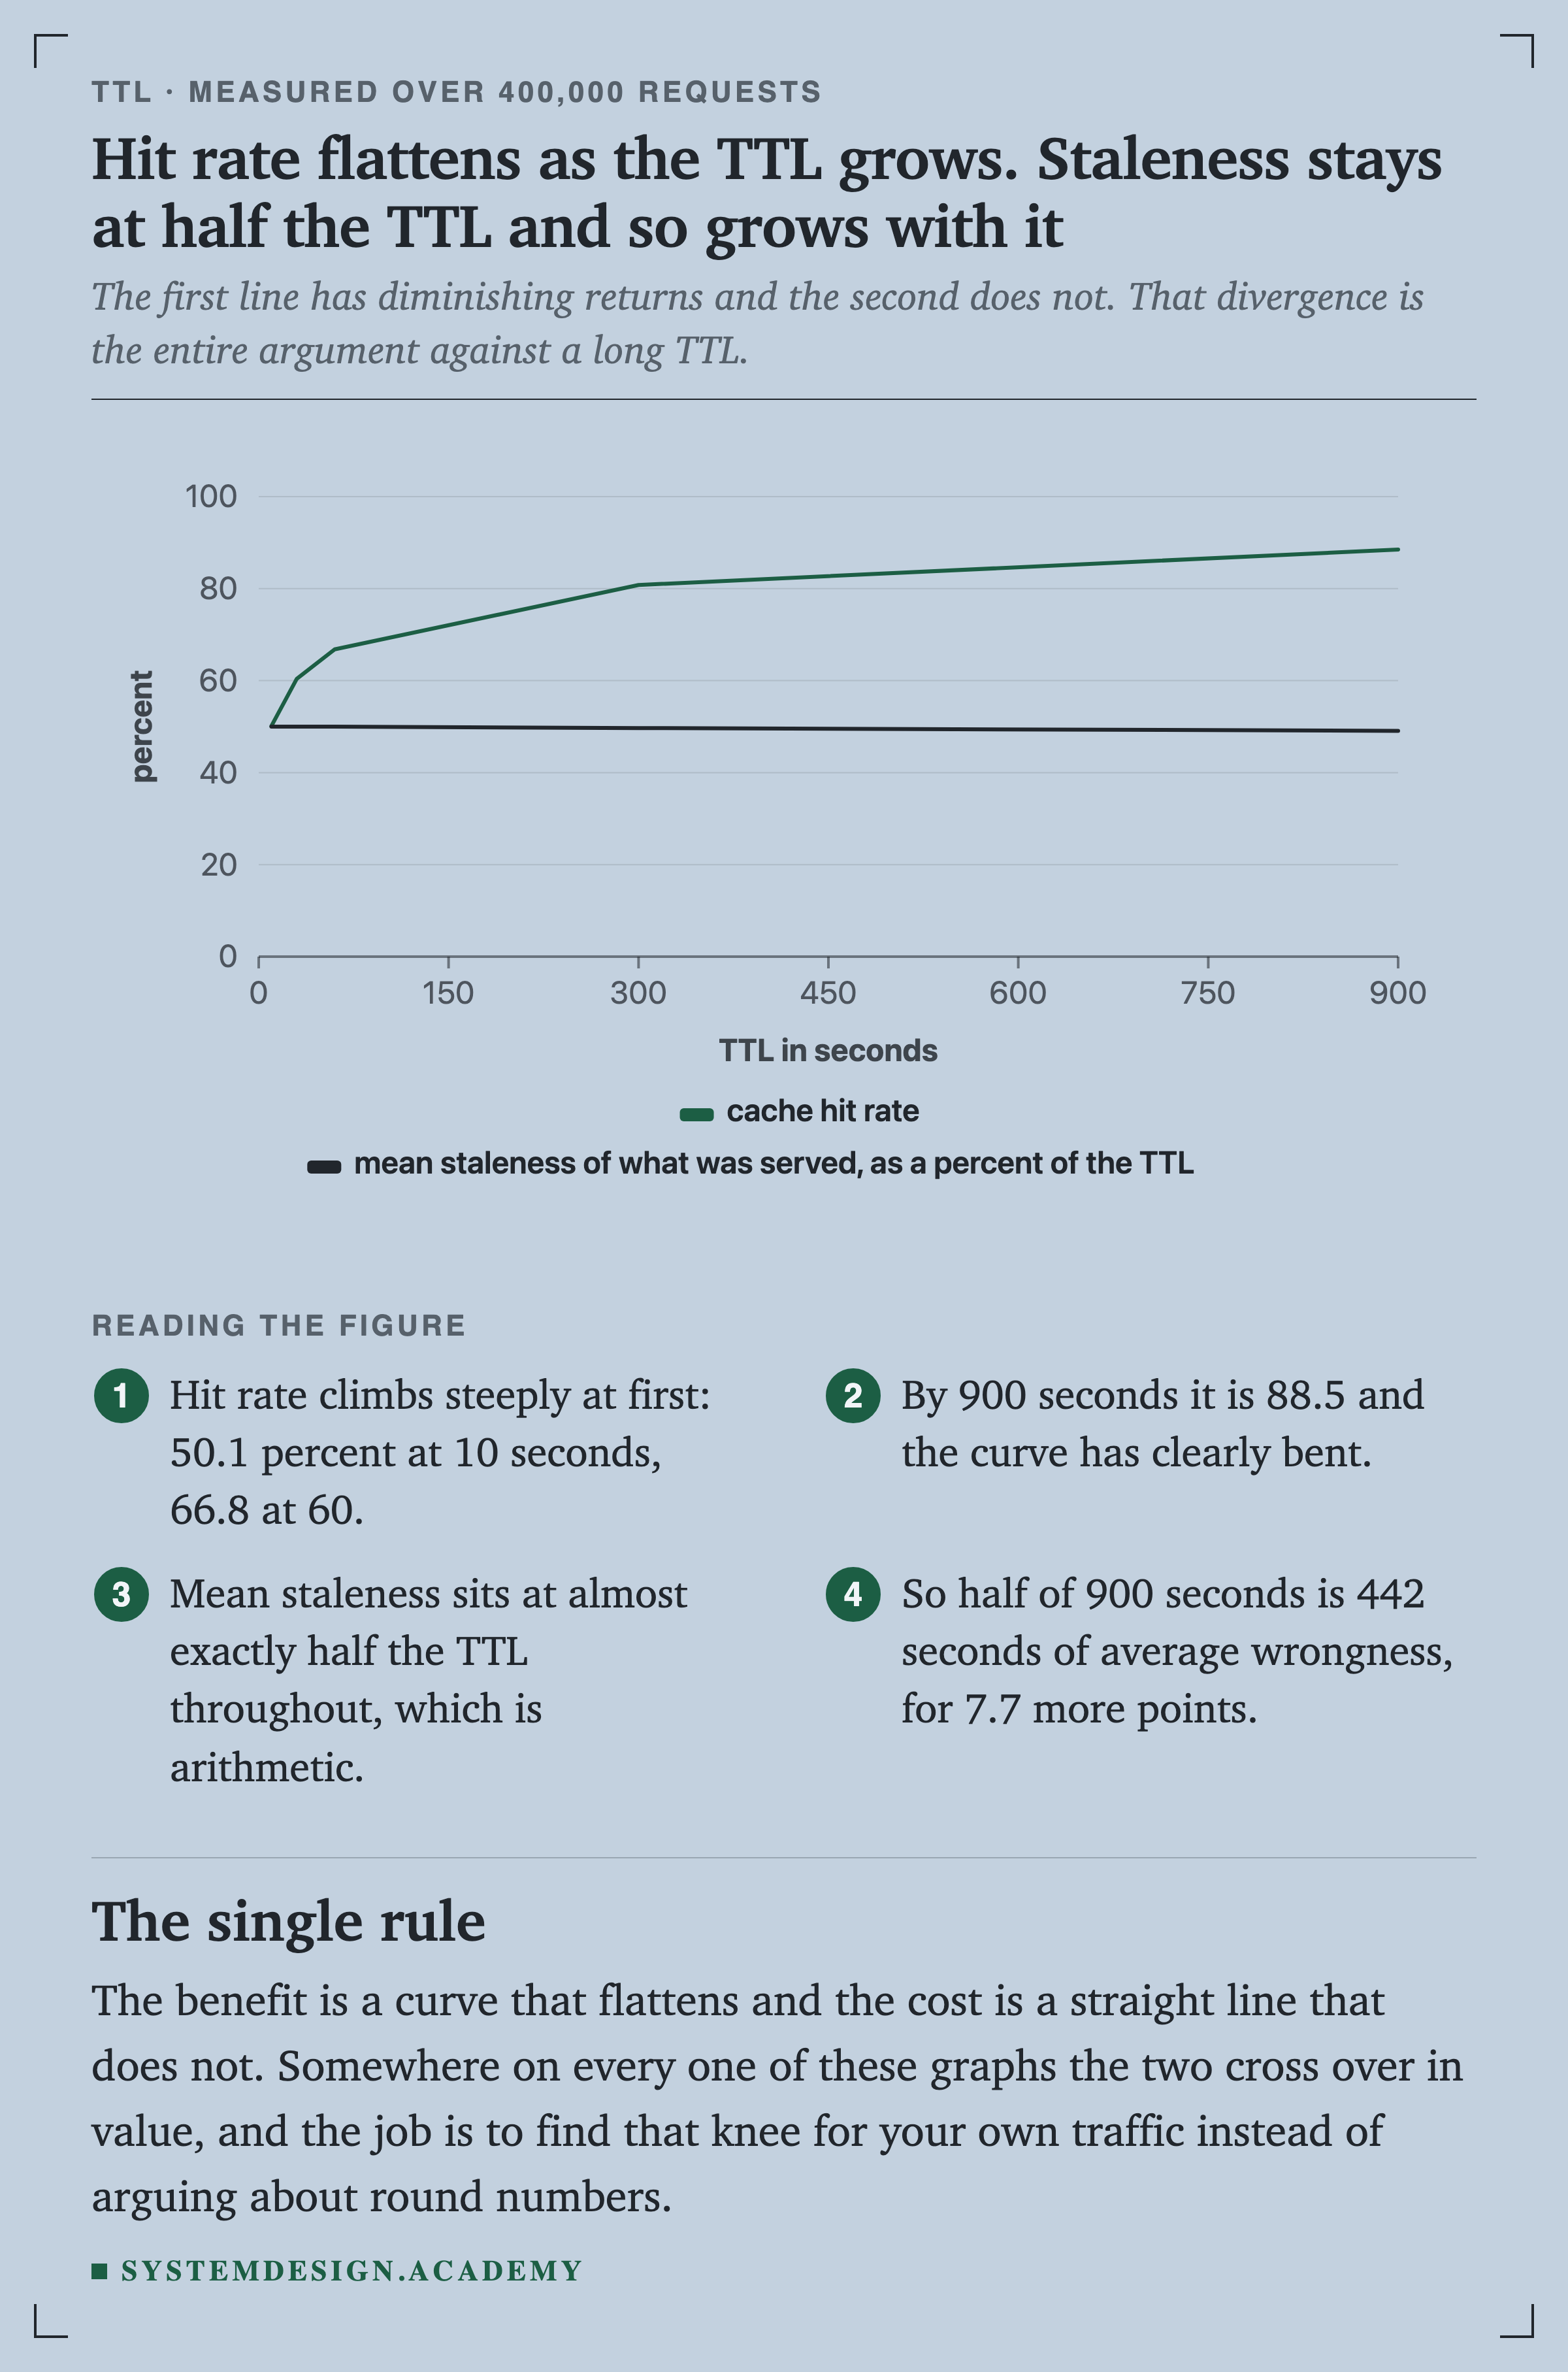
    A line chart with TTL in seconds on the x axis. The cache hit rate line rises from 50.1 percent at 10 seconds to 60.4 at 30, 66.8 at 60, 80.8 at 300 and 88.5 at 900, clearly flattening. A second line showing mean staleness as a percentage of the TTL stays flat at almost exactly 50 percent throughout.
    ChartFigure 4. Hit rate flattens. Staleness stays at half the TTL, so it grows with it

    Half of 900 seconds is 442 seconds of average wrongness, bought for 7.7 more points of hit rate than 300 seconds gave. Somewhere on every one of these graphs the two lines cross over in value.

    The Ceiling Nobody Expects
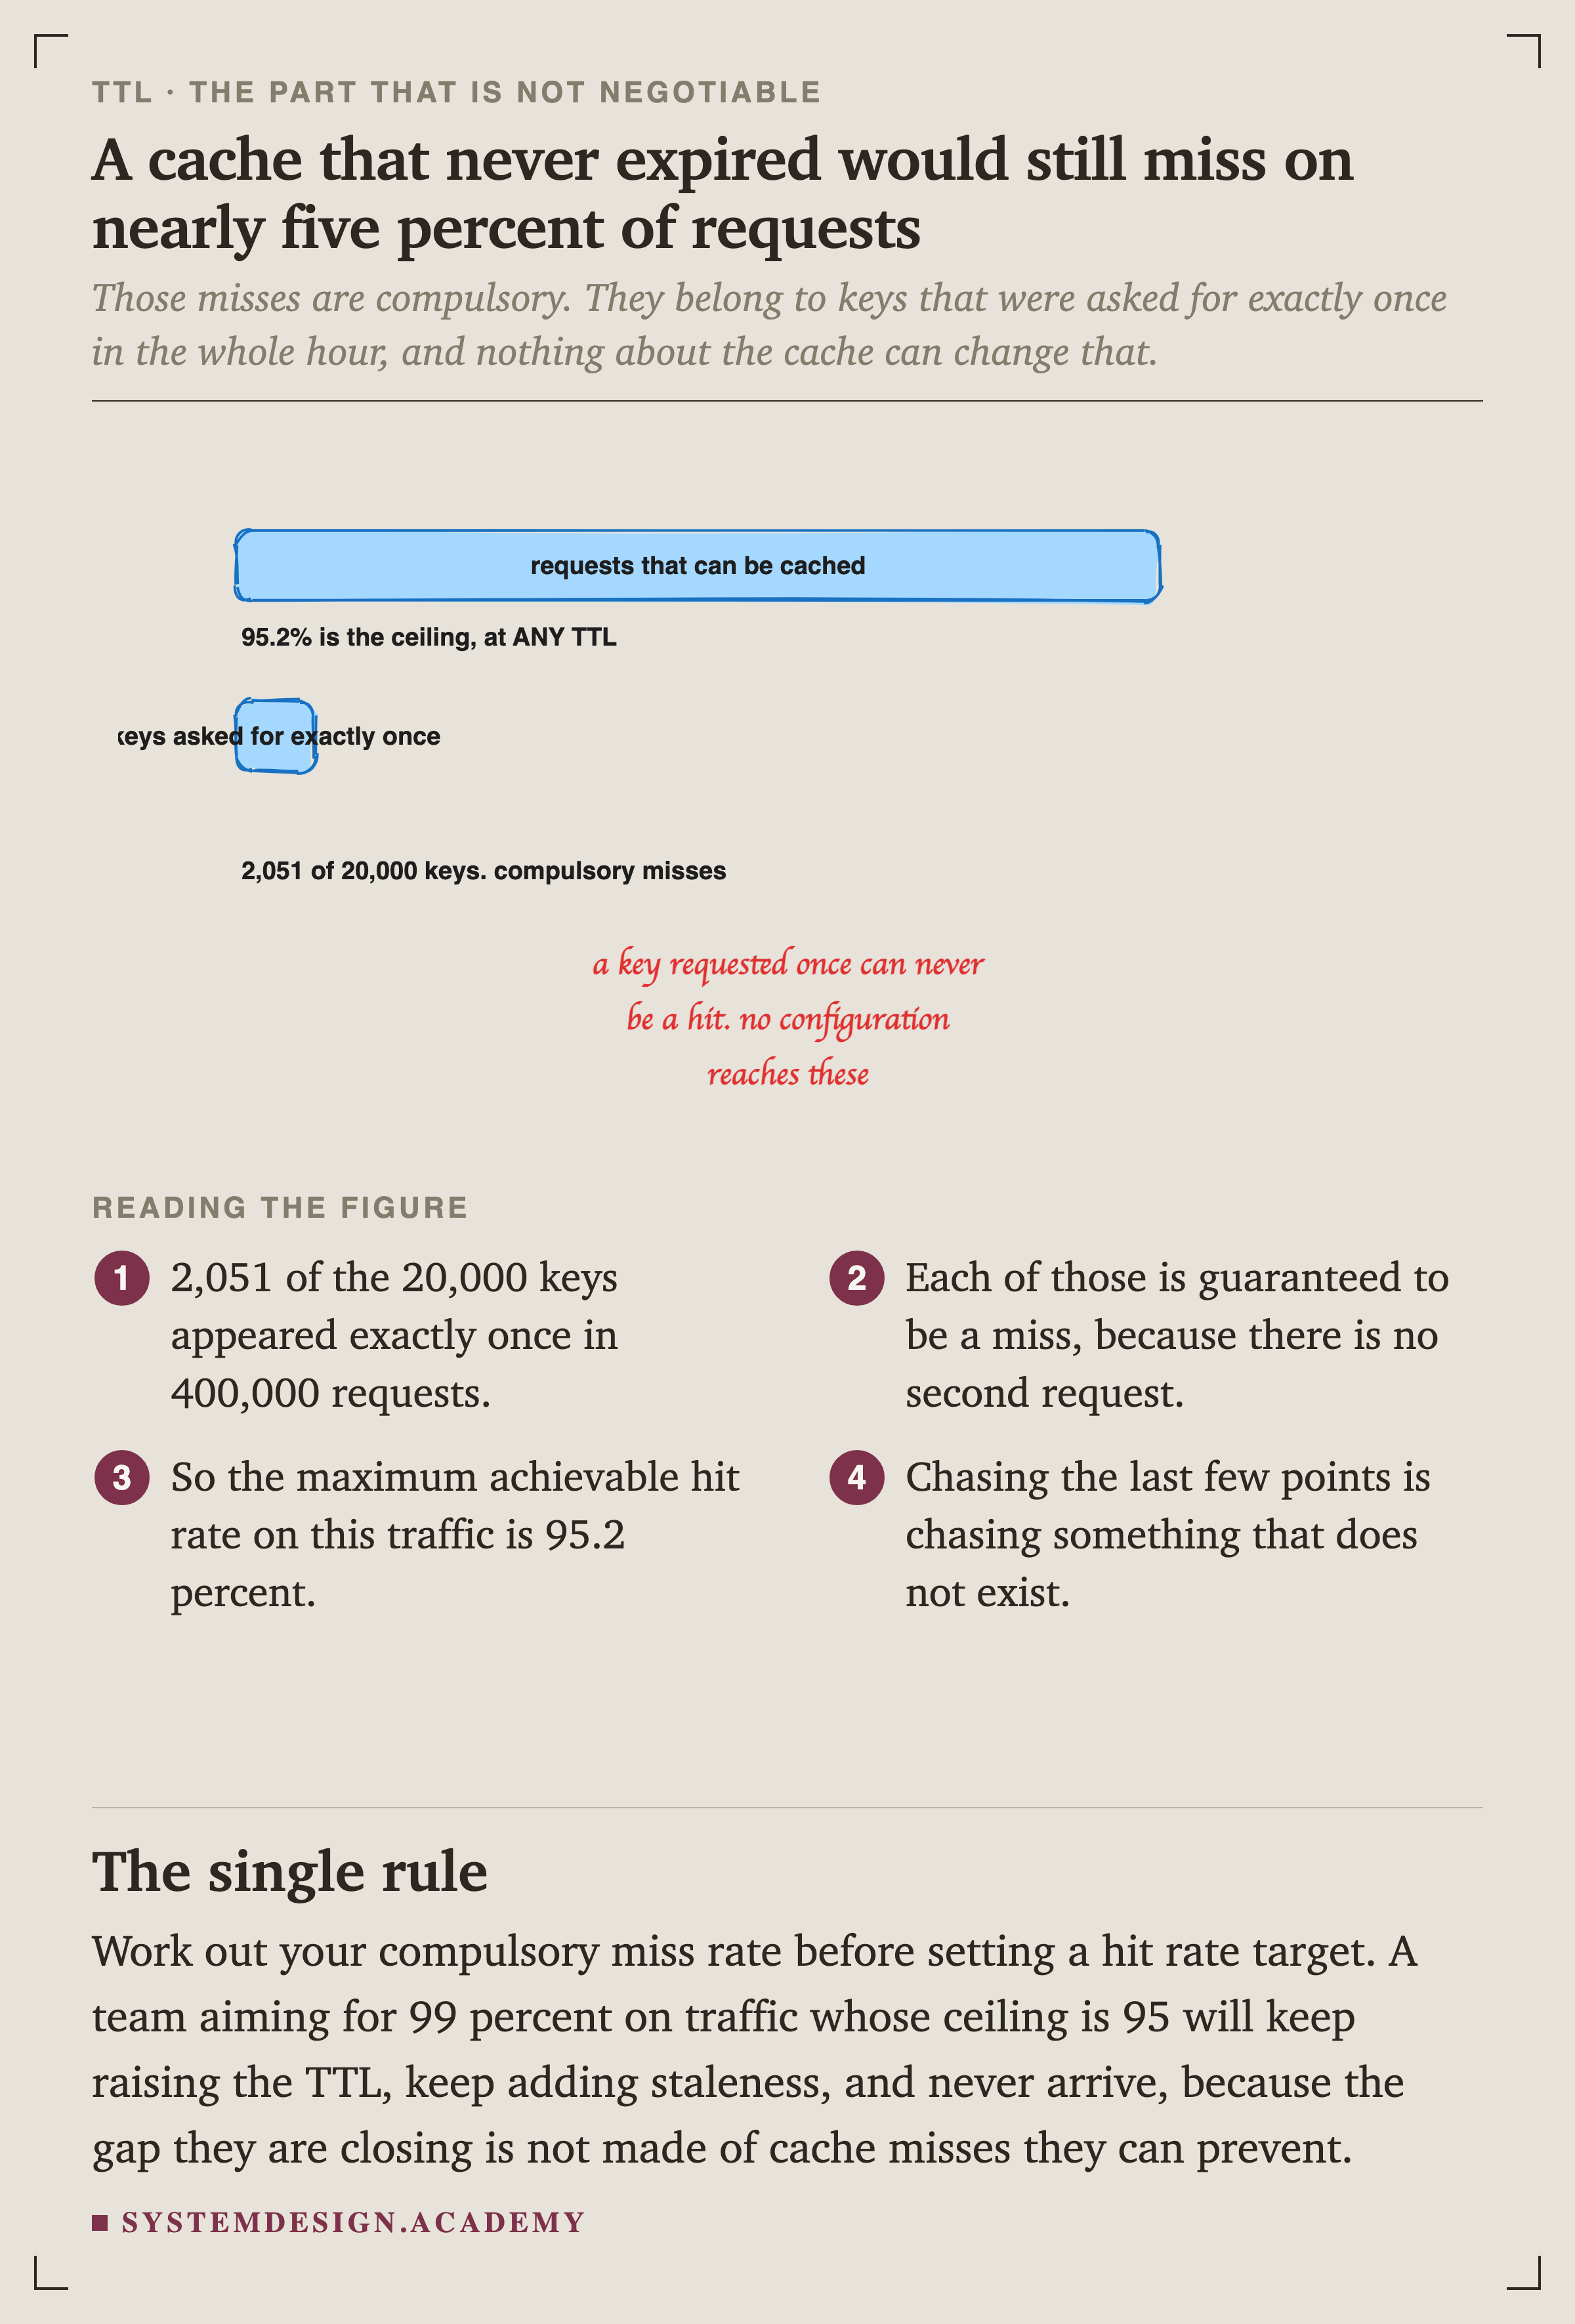
    Two hand-drawn bars. A long one labelled requests that can be cached, annotated as 95.2 percent being the ceiling at any TTL. A short highlighted one labelled keys asked for exactly once, annotated as 2,051 of 20,000 keys and compulsory misses. A handwritten note reads: a key requested once can never be a hit, no configuration reaches these.
    SketchFigure 6. A cache that never expired would still miss on nearly five percent of requests

    2,051 of the 20,000 keys appeared exactly once in 400,000 requests. Each one is guaranteed to be a miss, because there is no second request. Chasing the last few points is chasing something that does not exist.

    Work out your compulsory miss rate before setting a hit rate target. A team aiming for 99 percent on traffic whose ceiling is 95 will keep raising the , keep adding staleness, and never arrive.
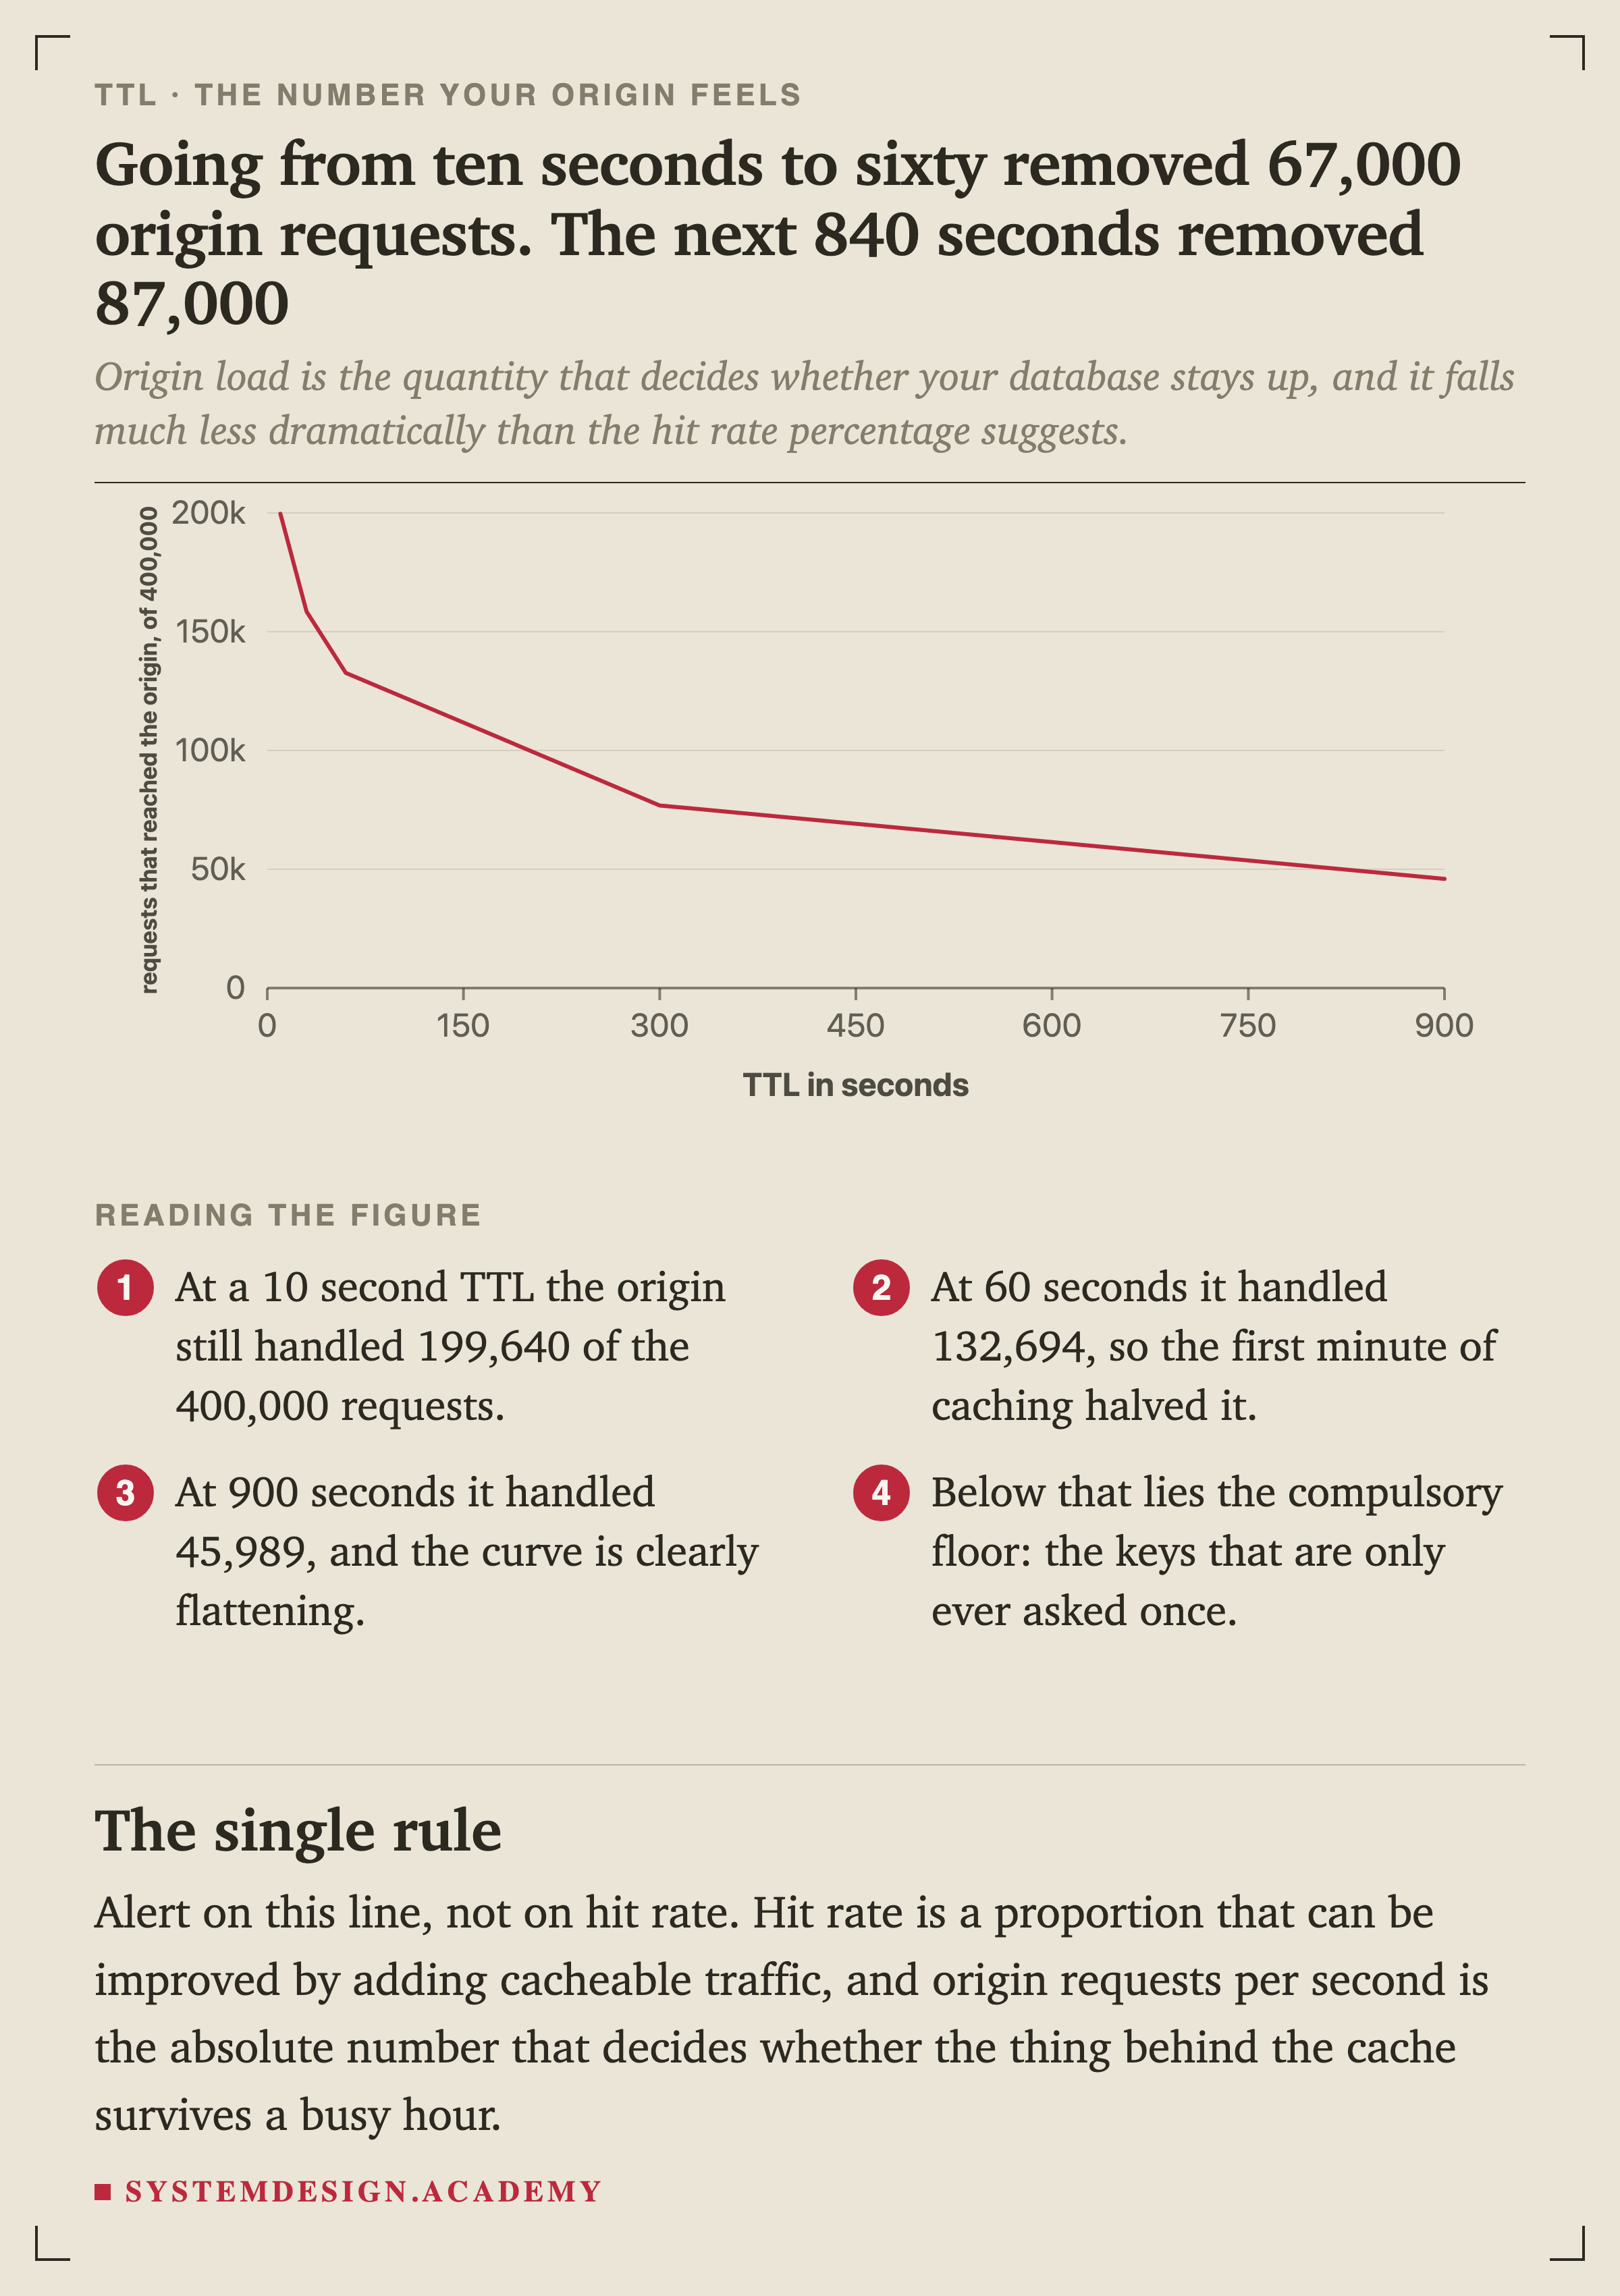
    A line chart of requests reaching the origin out of 400,000, against TTL in seconds. It falls from 199,640 at 10 seconds to 158,455 at 30, 132,694 at 60, 76,893 at 300 and 45,989 at 900.
    ChartFigure 7. Origin load is the number your database actually feels

    Alert on this line, not on hit rate. Hit rate is a proportion that can be improved by adding cacheable traffic. Origin requests per second is the absolute number that decides whether the thing behind the cache survives a busy hour.

    One Number for Very Different Keys
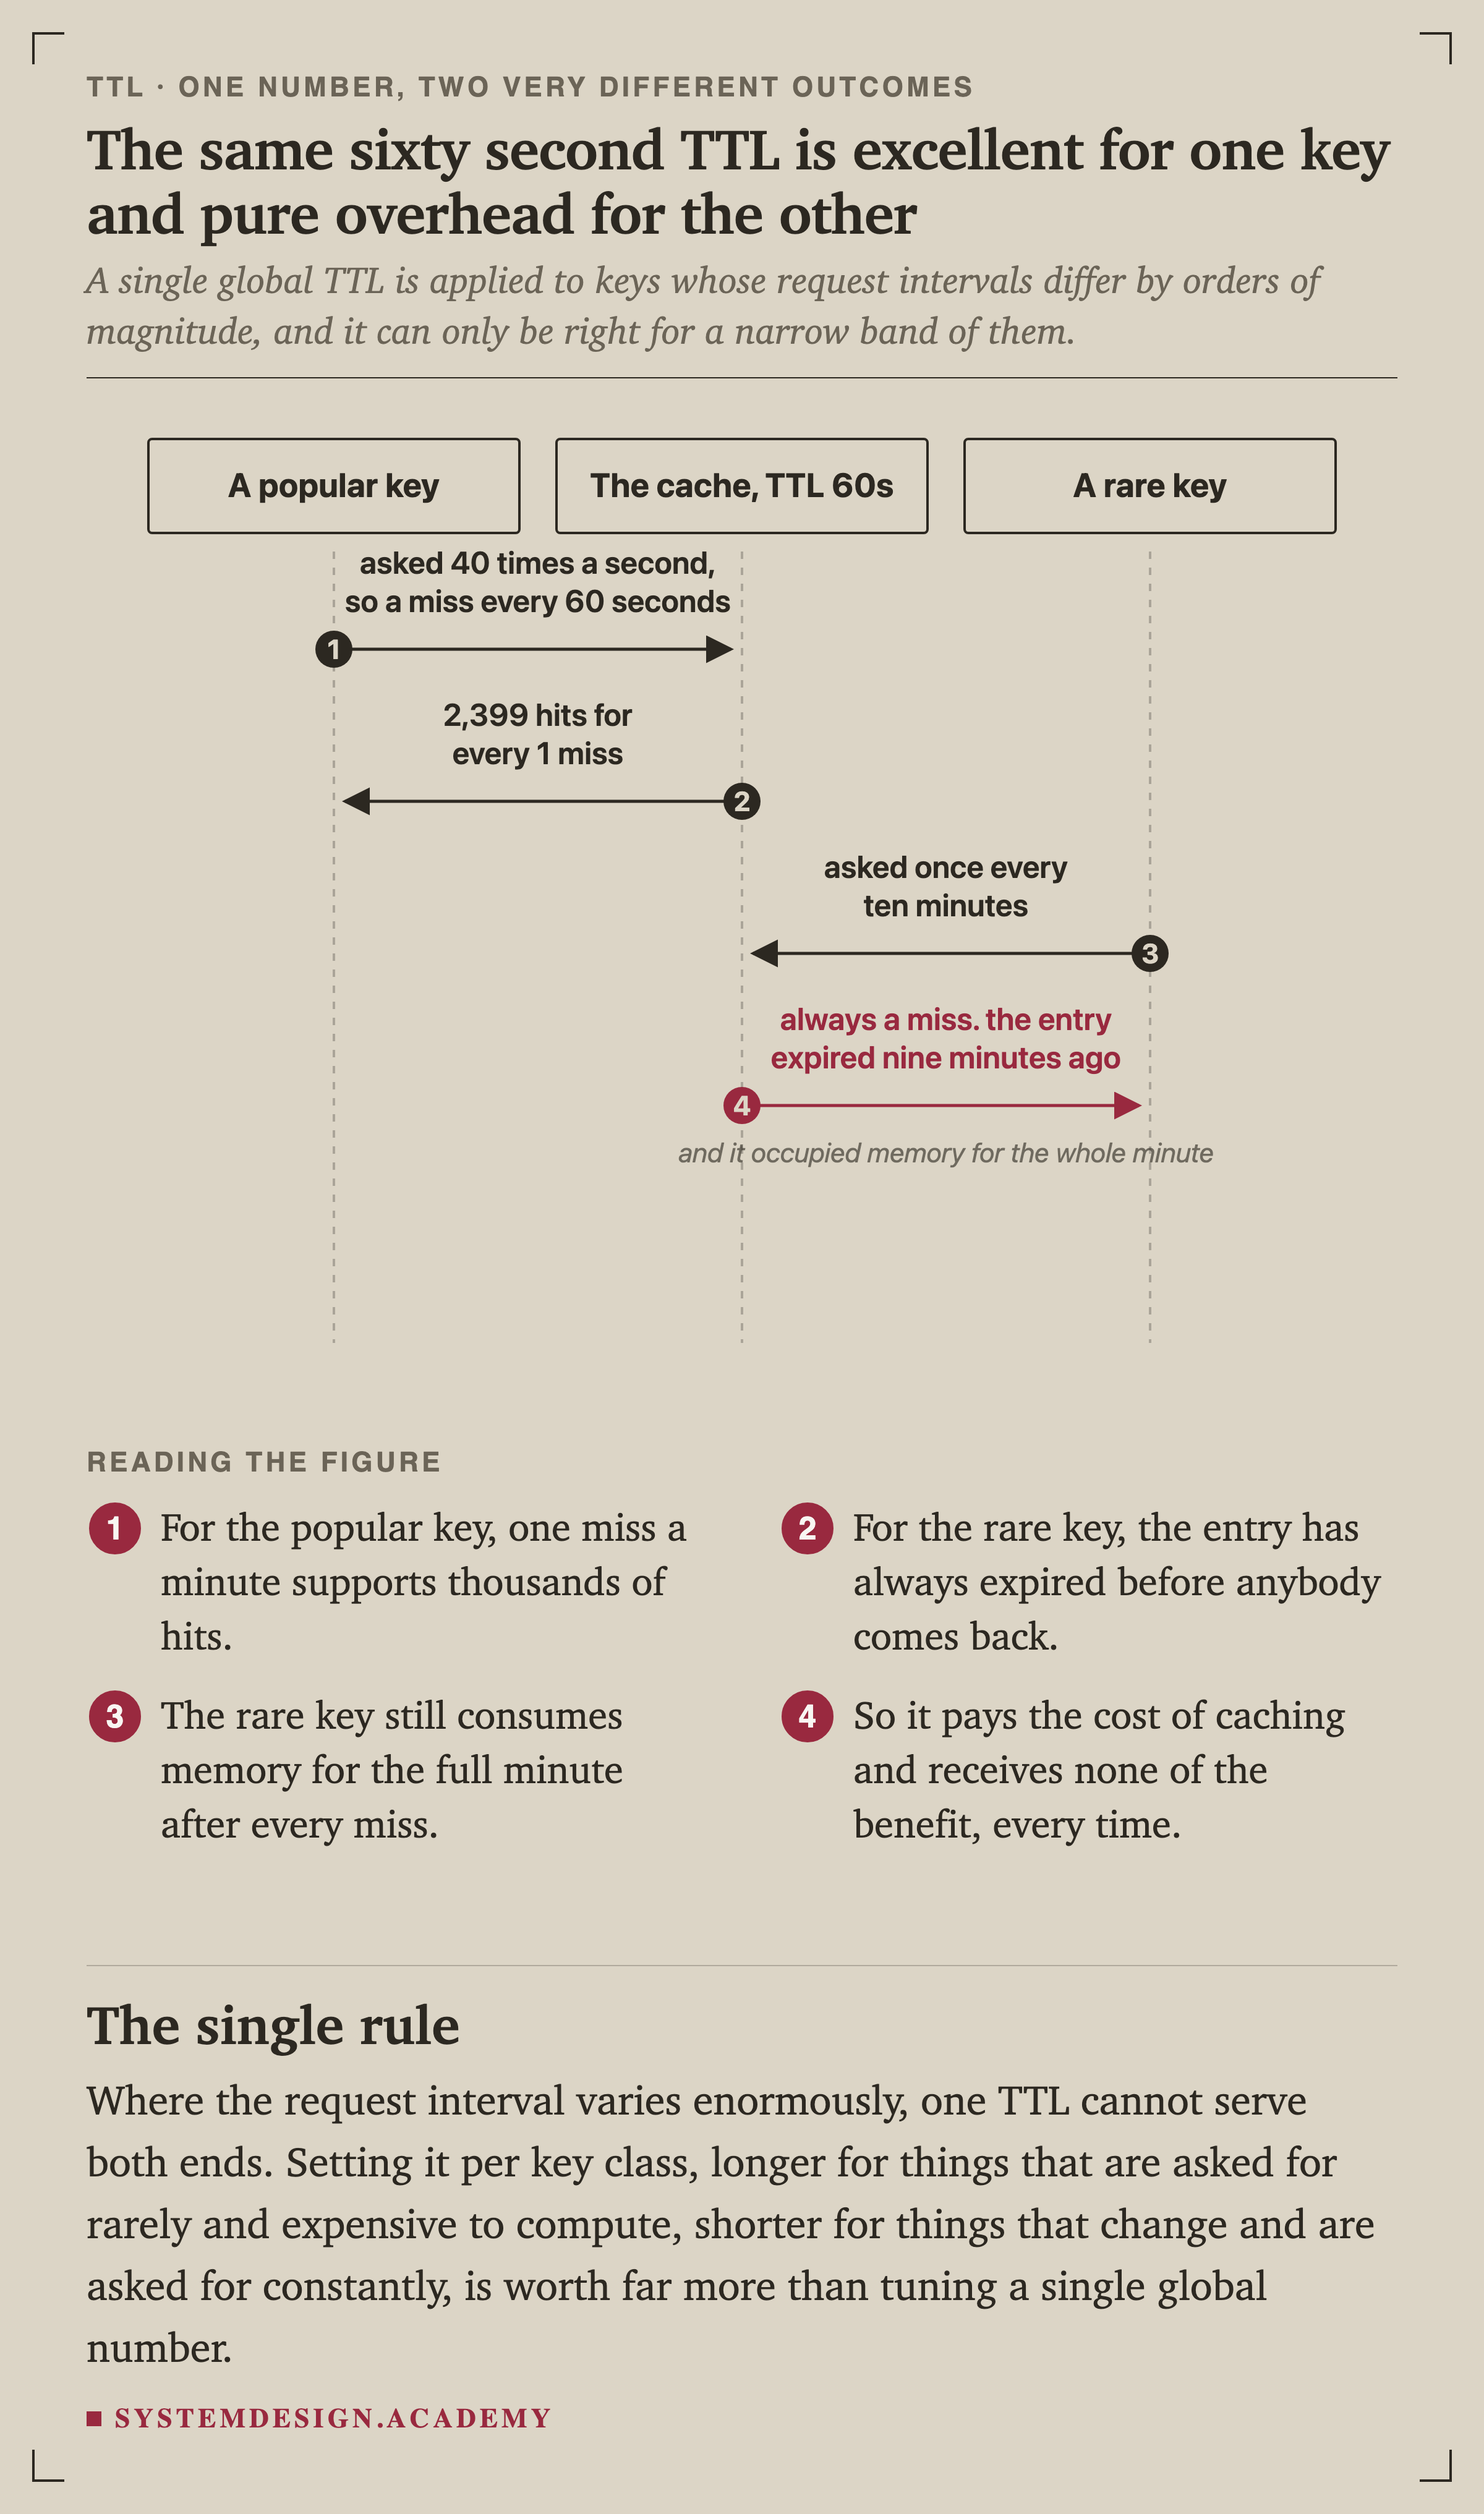
    A sequence diagram with three lifelines: a popular key, the cache with a 60 second TTL, and a rare key. The popular key is asked 40 times a second, so it misses once every 60 seconds, giving 2,399 hits for every miss. The rare key is asked once every ten minutes and is always a miss, because the entry expired nine minutes ago, noted as it occupied memory for the whole minute.
    SequenceFigure 8. The same sixty second TTL is excellent for one key and pure overhead for the other

    A single global is applied to keys whose request intervals differ by orders of magnitude, and it can only be right for a narrow band of them.
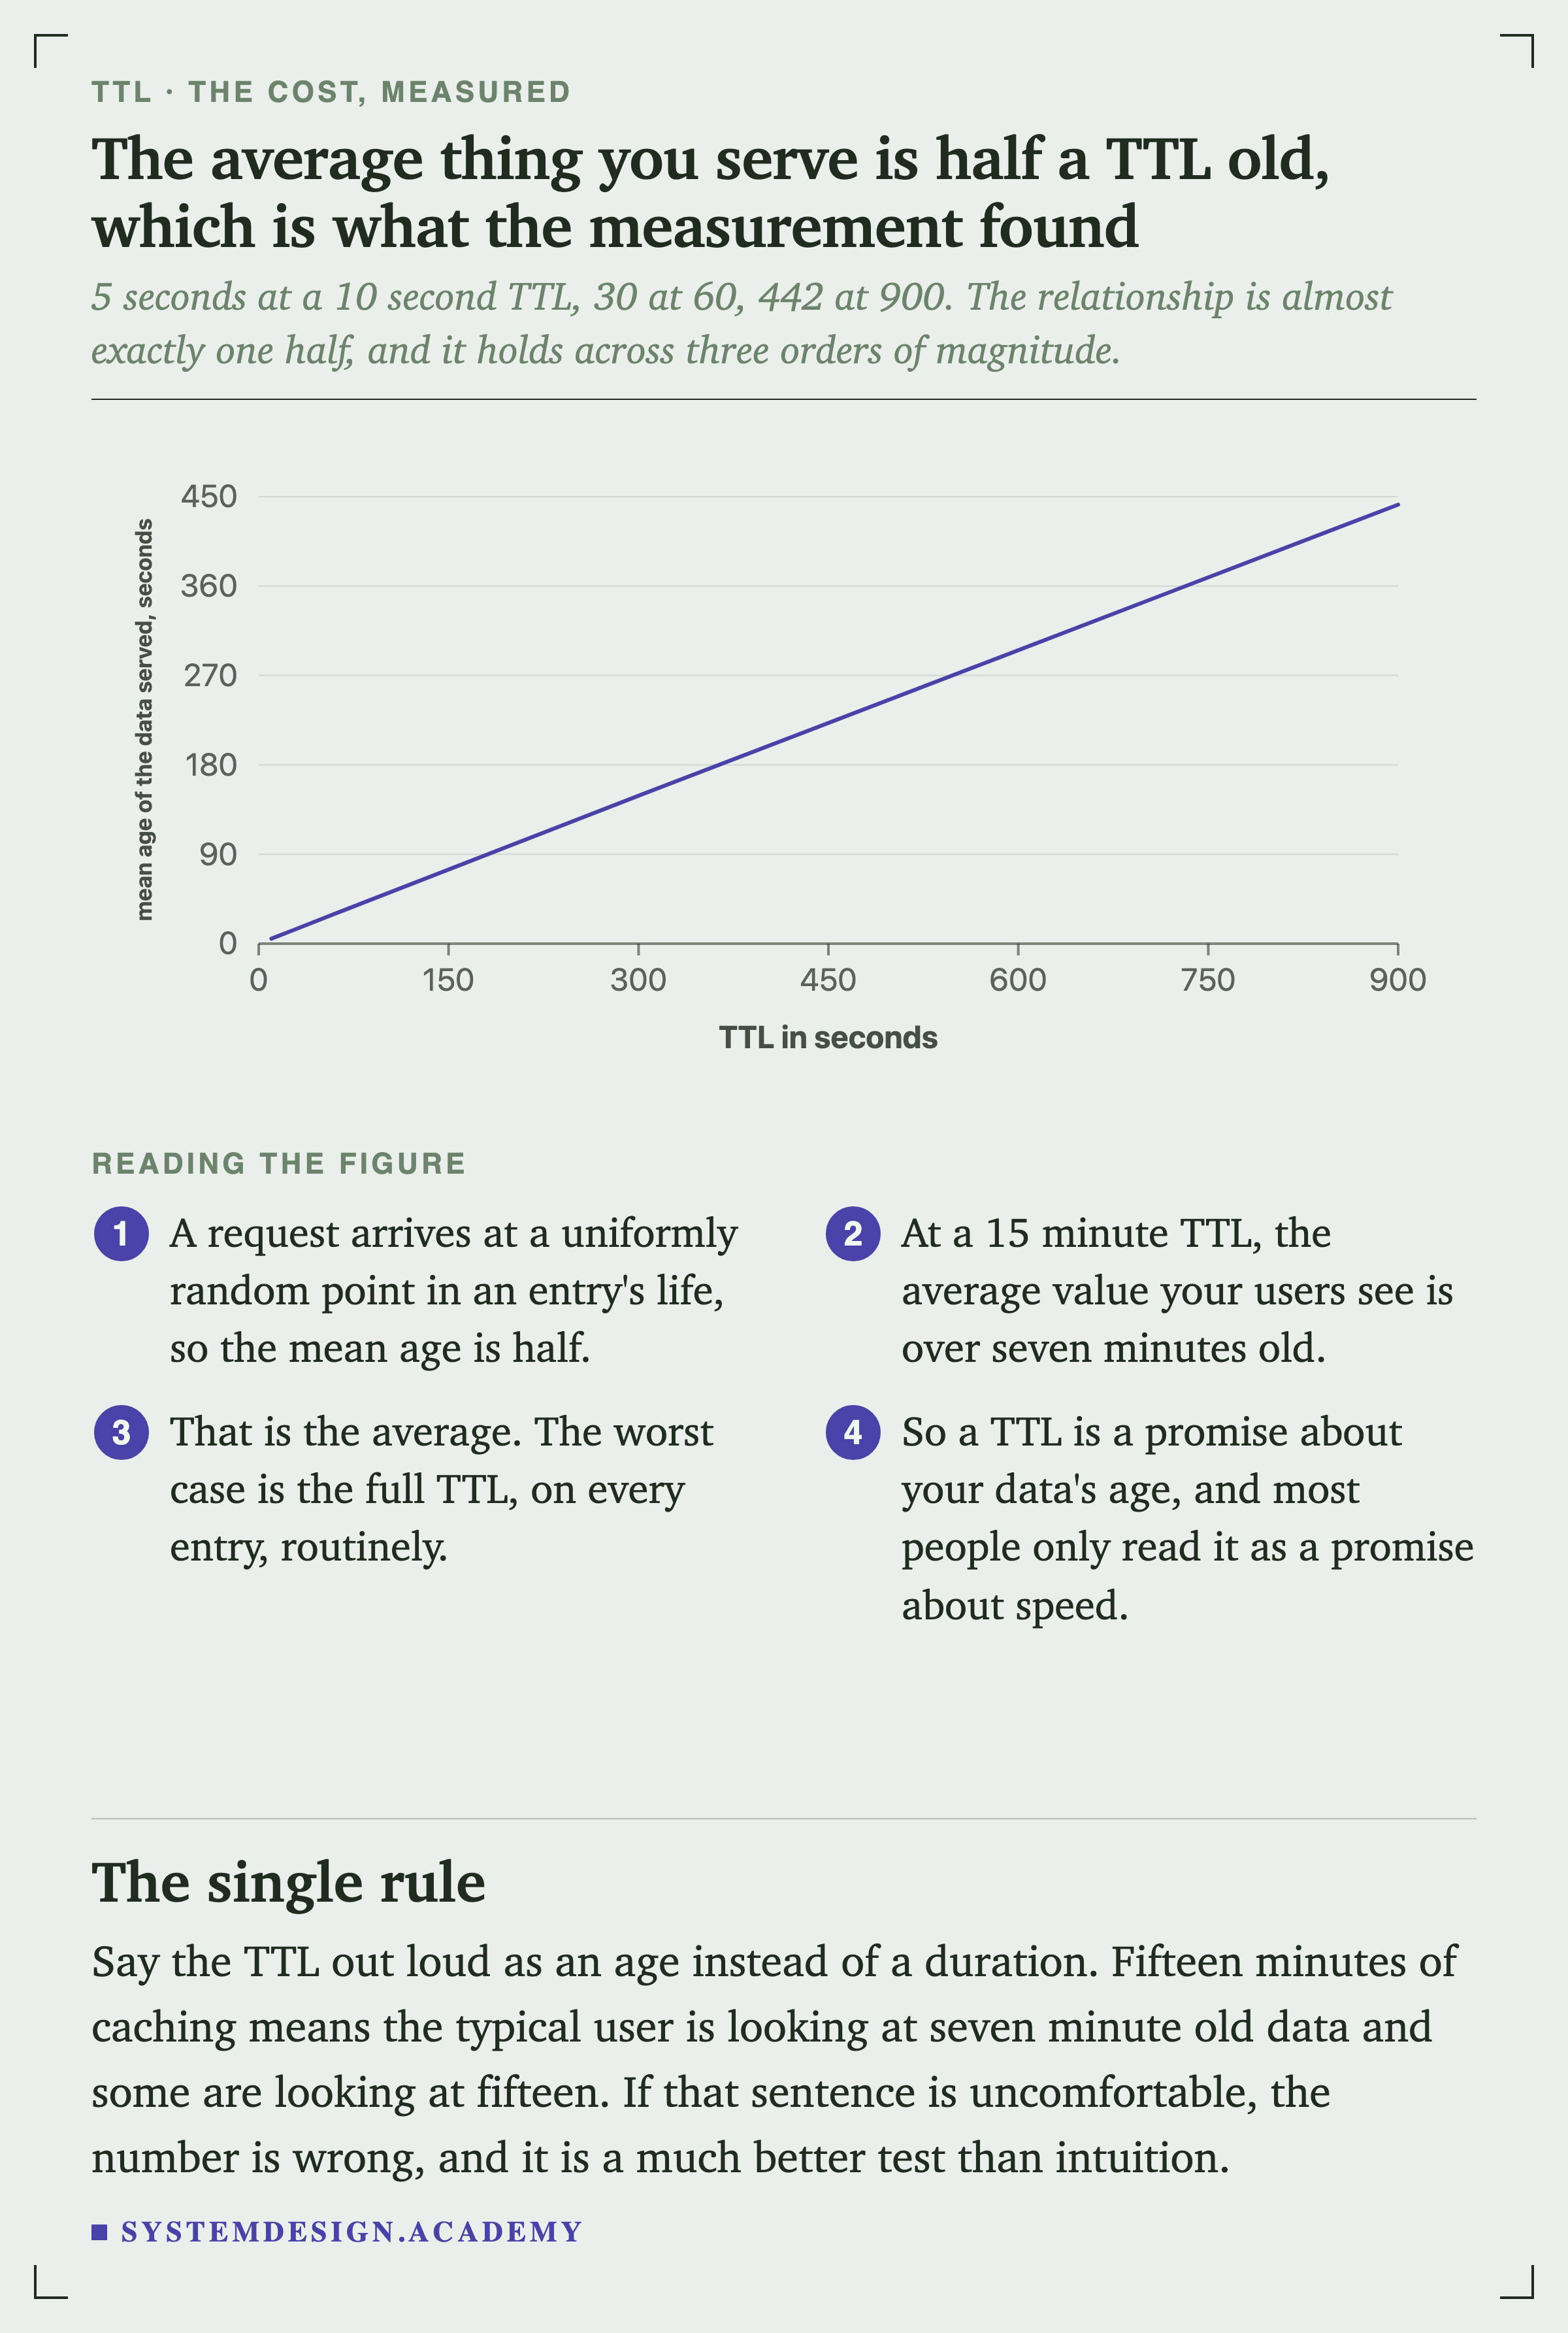
    A line chart of the mean age of the data served in seconds, against TTL in seconds. It rises from 5 seconds at a 10 second TTL to 15 at 30, 30 at 60, 149 at 300 and 442 at 900.
    ChartFigure 9. The average thing you serve is half a TTL old

    A request arrives at a uniformly random point in an entry's life, so the mean age is half. At a 15 minute TTL the average user is looking at seven minute old data and the worst case is fifteen, routinely.

    Say the TTL out loud as an age instead of a duration. If that sentence is uncomfortable, the number is wrong, and it is a much better test than intuition.

    The Expiry Moment
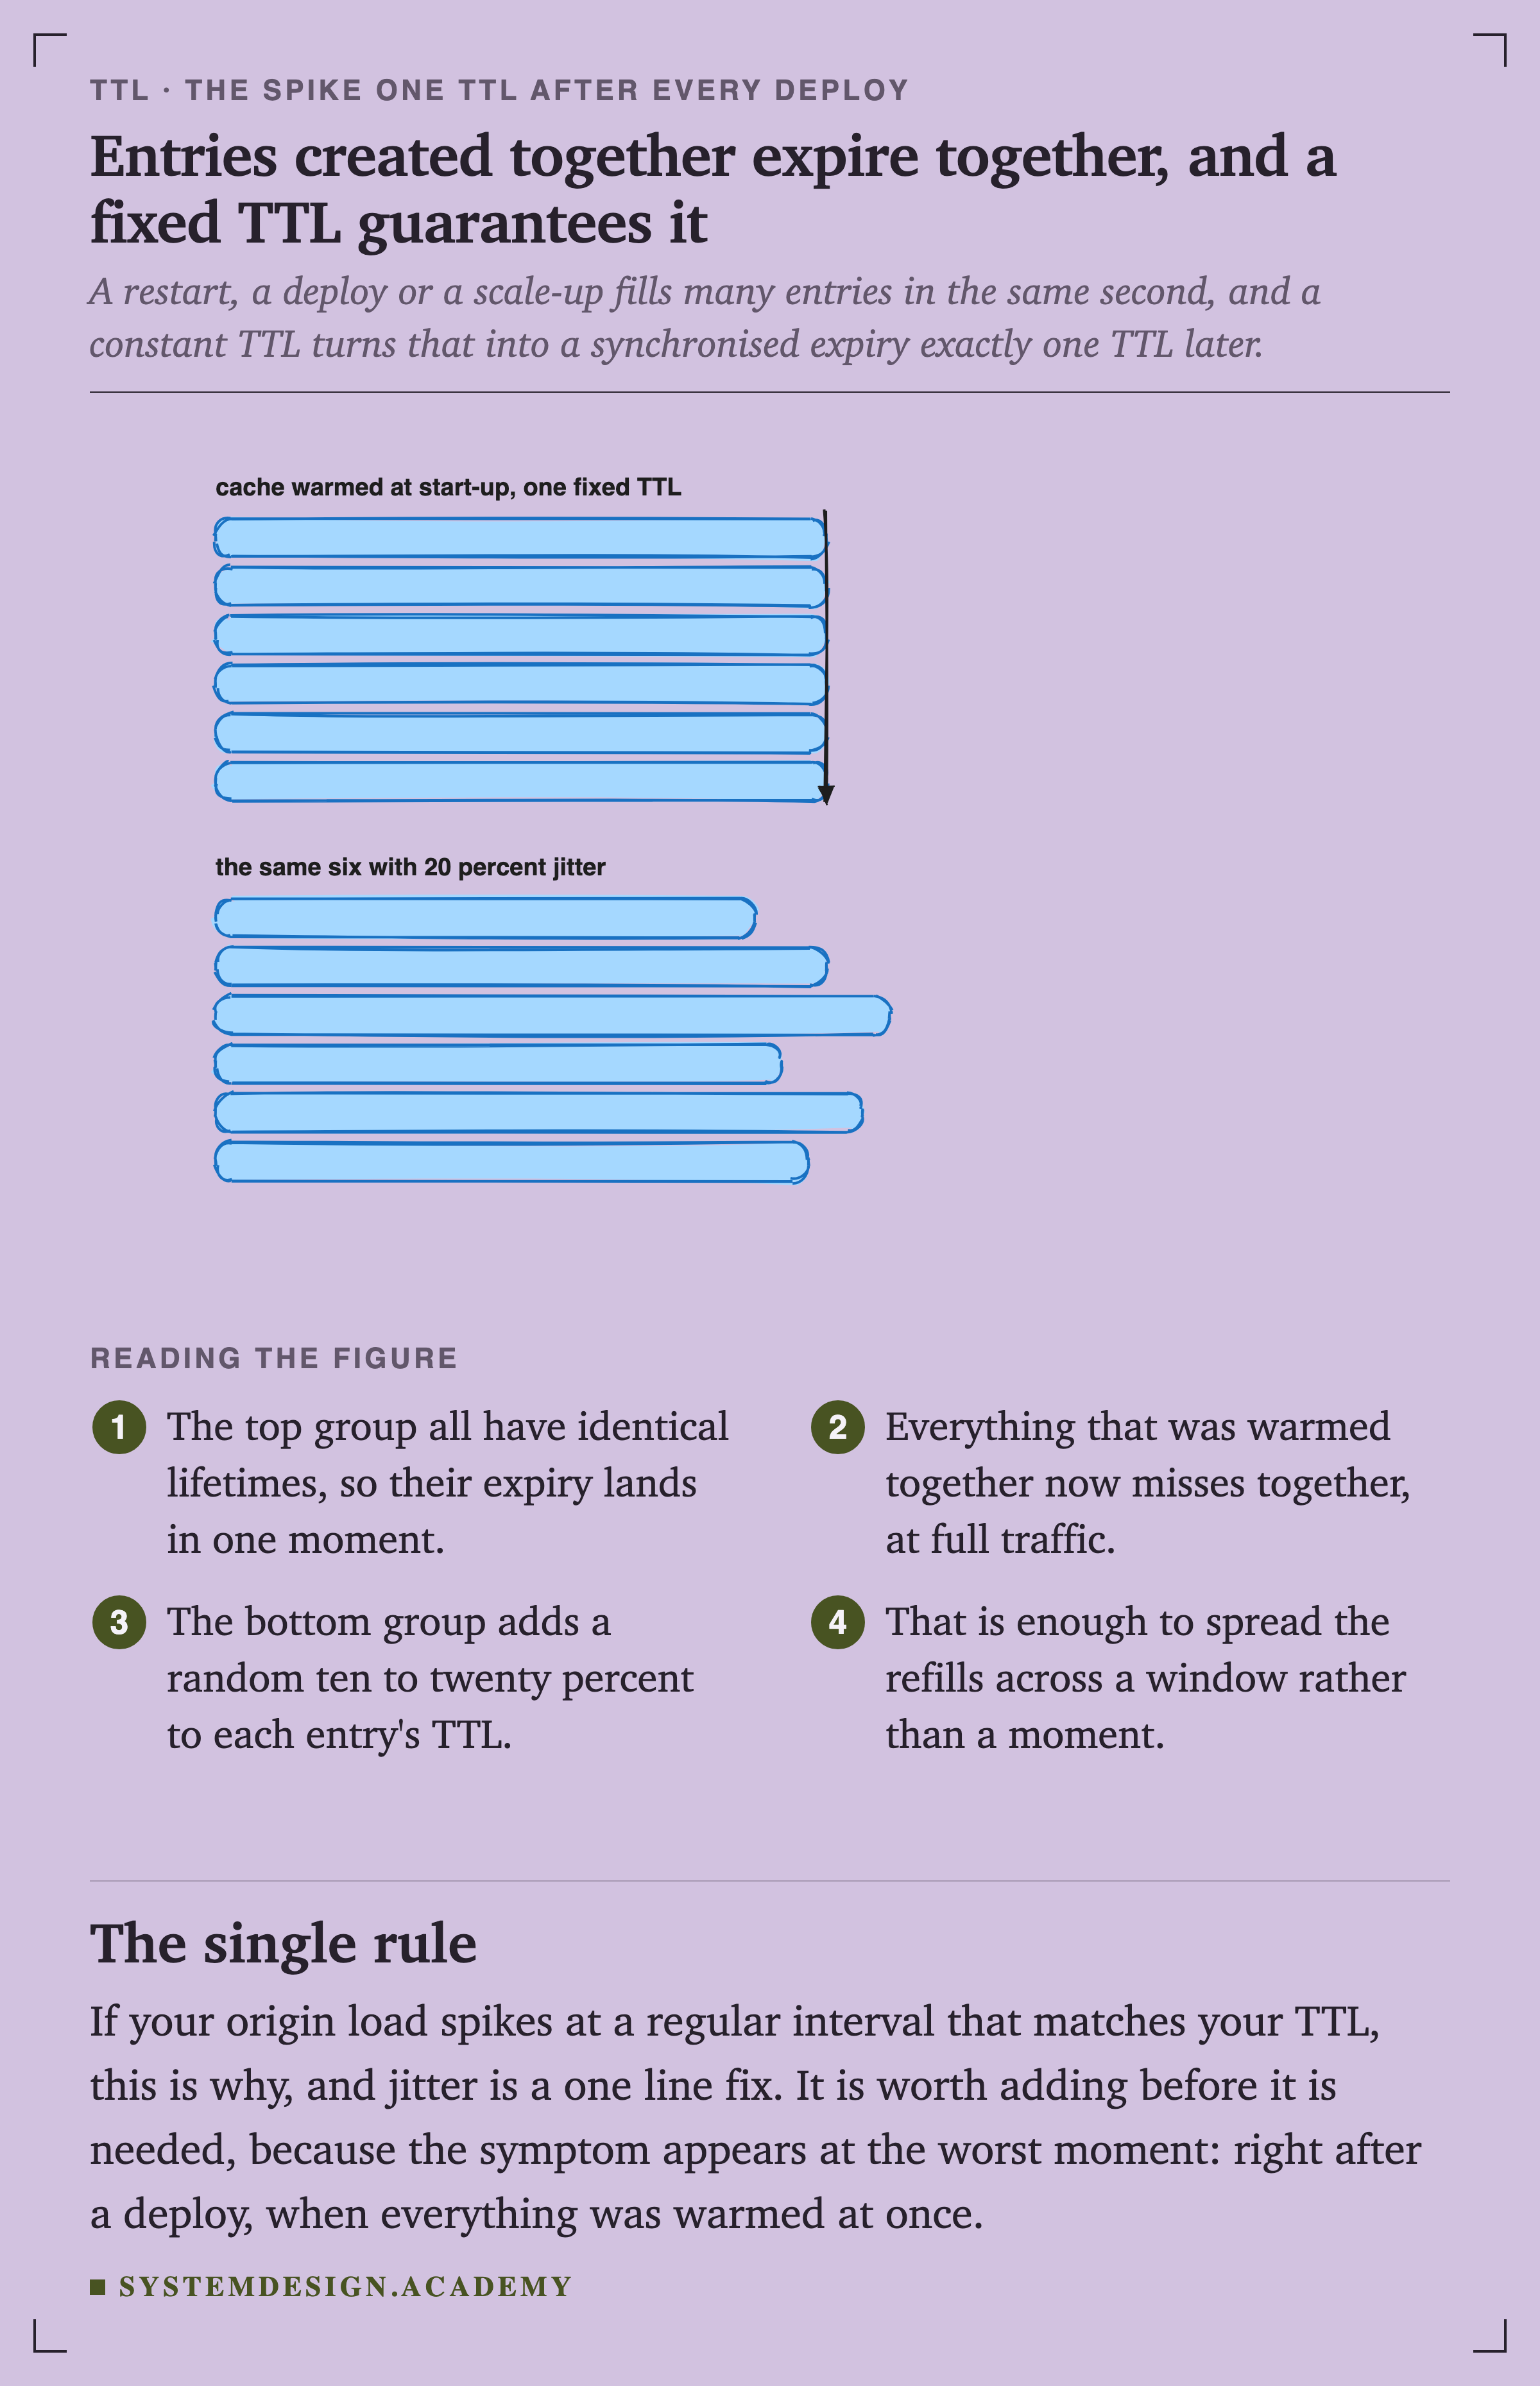
    Two hand-drawn groups of six horizontal bars. The top group, labelled cache warmed at start-up with one fixed TTL, has six bars of identical length with a vertical arrow at their shared end. The bottom group, labelled the same six with 20 percent jitter, has six bars of slightly different lengths.
    SketchFigure 10. Entries created together expire together, and a fixed TTL guarantees it

    A restart, a deploy or a scale-up fills many entries in the same second, and a constant turns that into a synchronised expiry exactly one TTL later. If your origin load spikes at an interval matching your TTL, this is why.
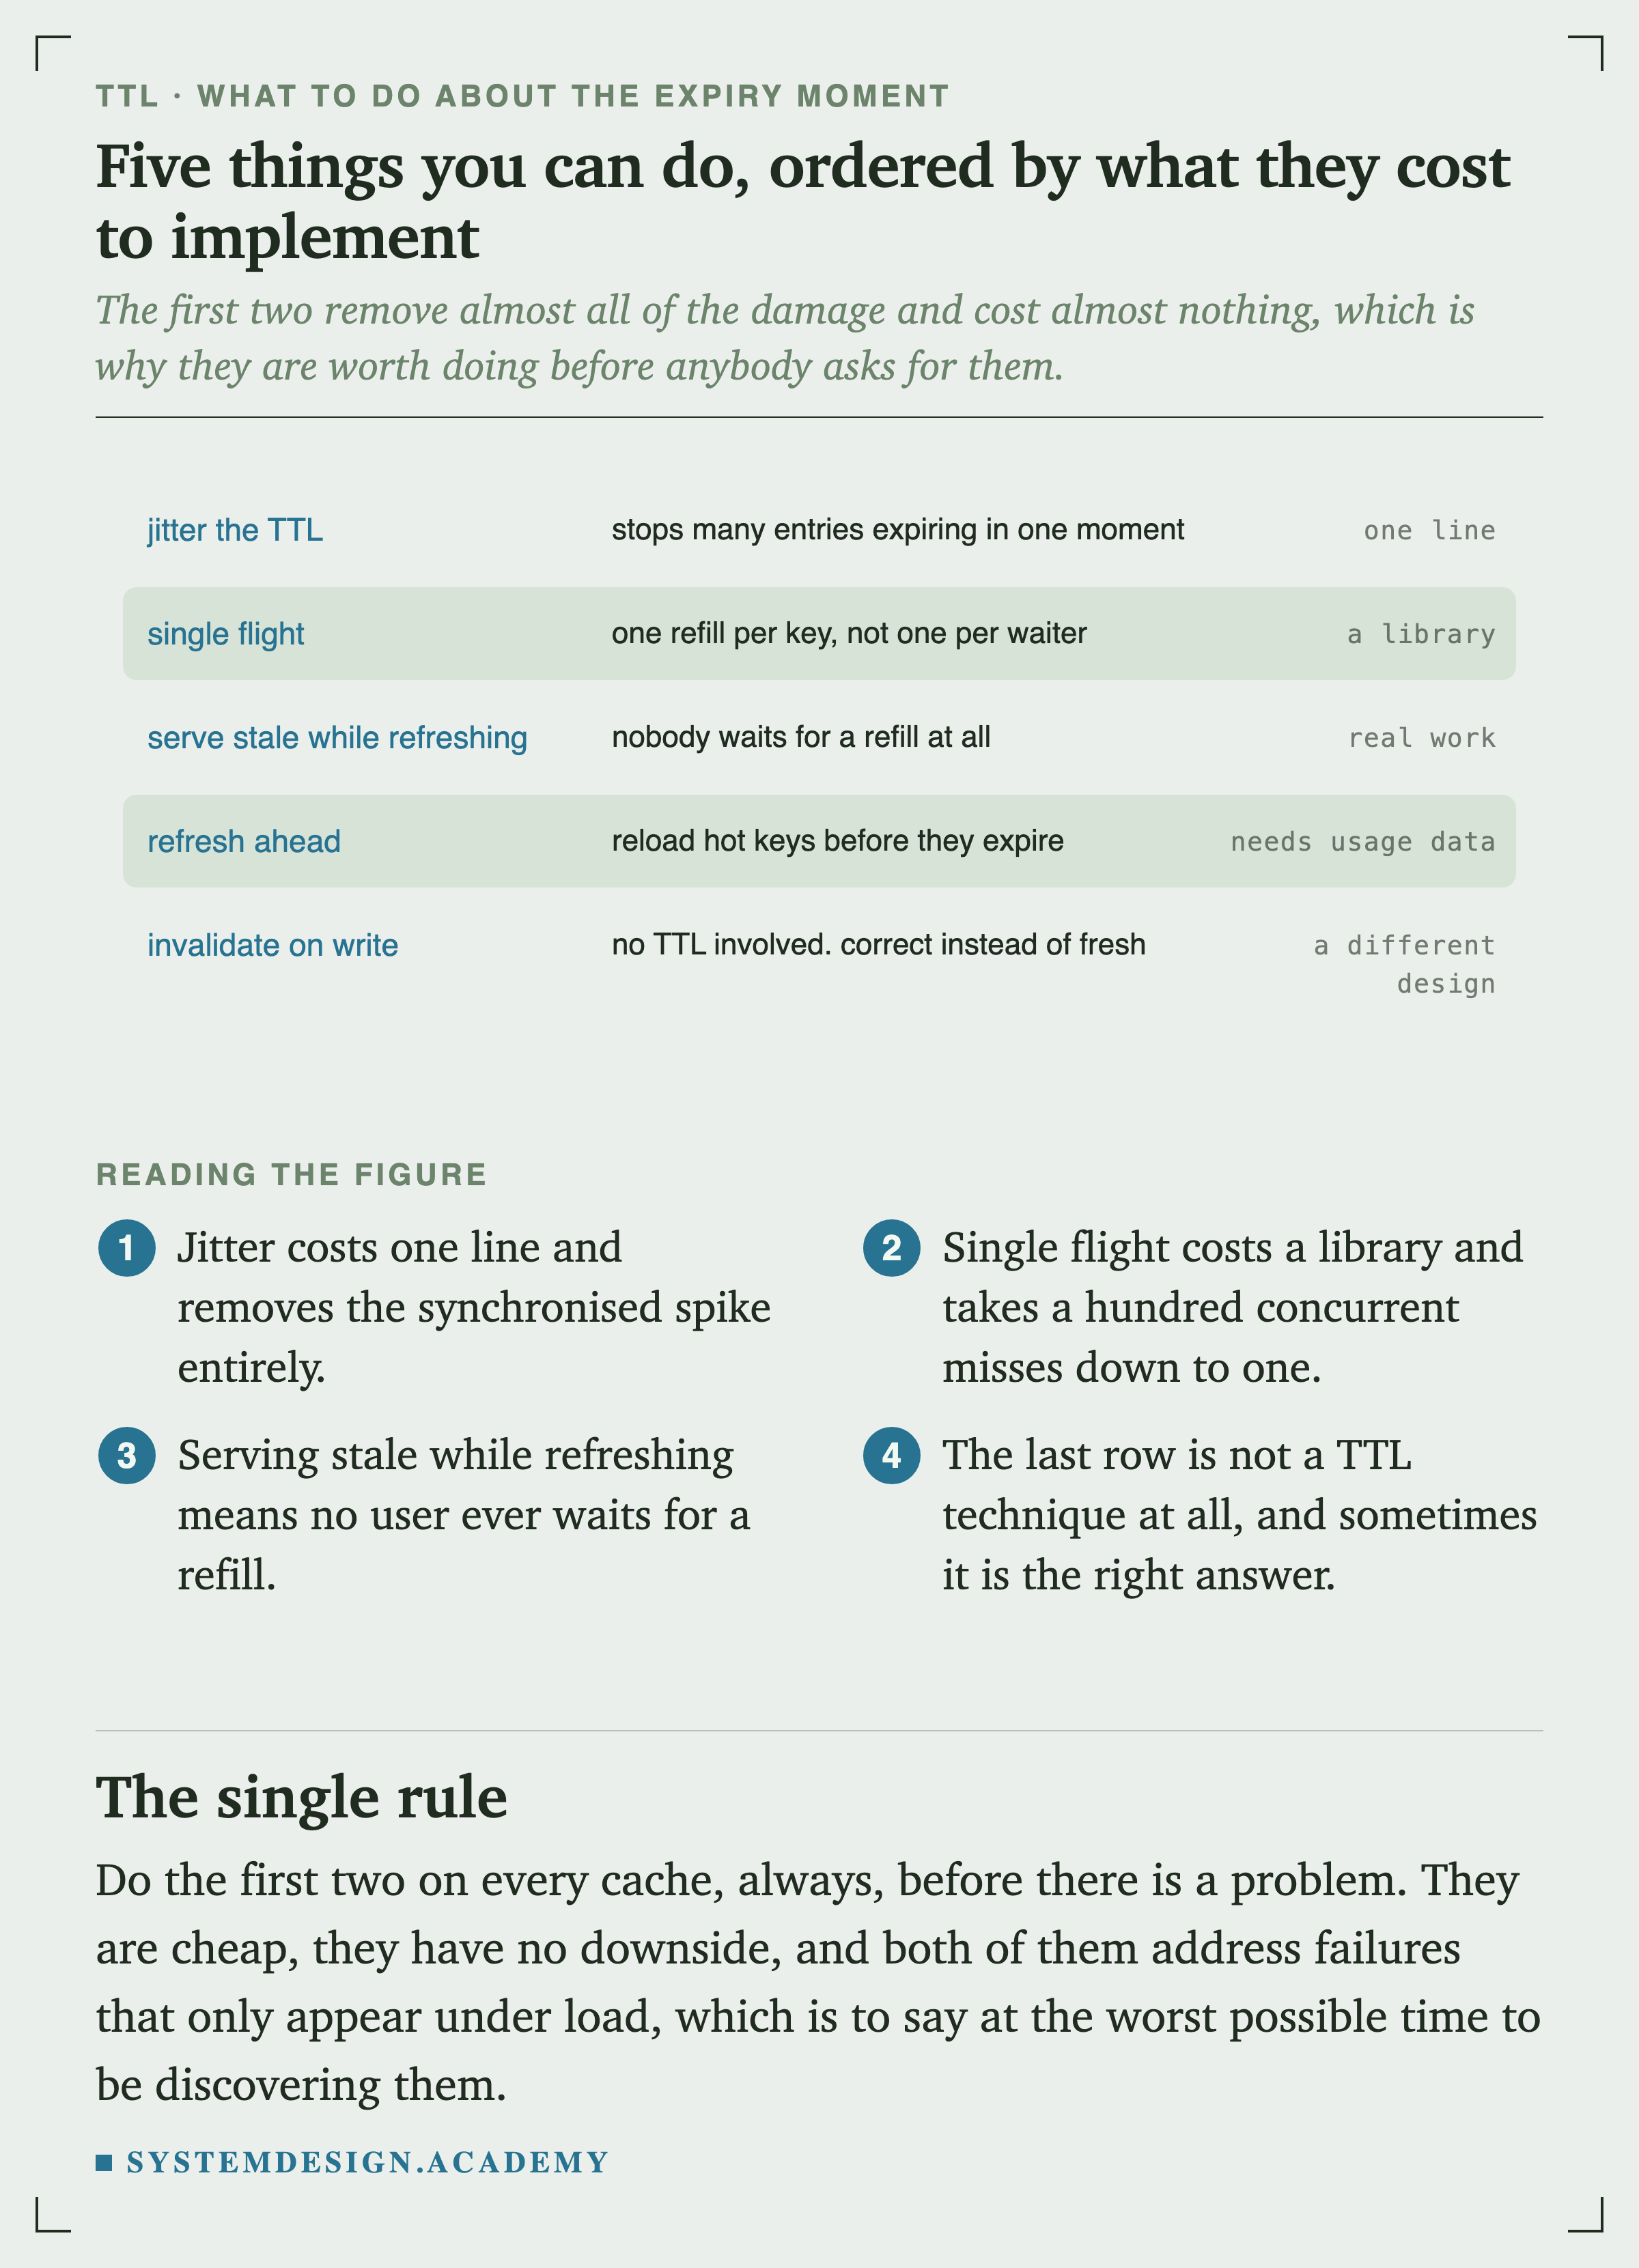
    Five rows with an implementation cost each. Jitter the TTL stops many entries expiring in one moment, one line. Single flight gives one refill per key and not one per waiter, a library. Serving stale while refreshing means nobody waits for a refill, real work. Refresh ahead reloads hot keys before they expire, needs usage data. Invalidate on write involves no TTL and is correct instead of fresh, a different design.
    FigureFigure 11. Five things you can do, ordered by what they cost

    Do the first two on every cache, always, before there is a problem. They are cheap, they have no downside, and both address failures that only appear under load, which is the worst time to be discovering them.
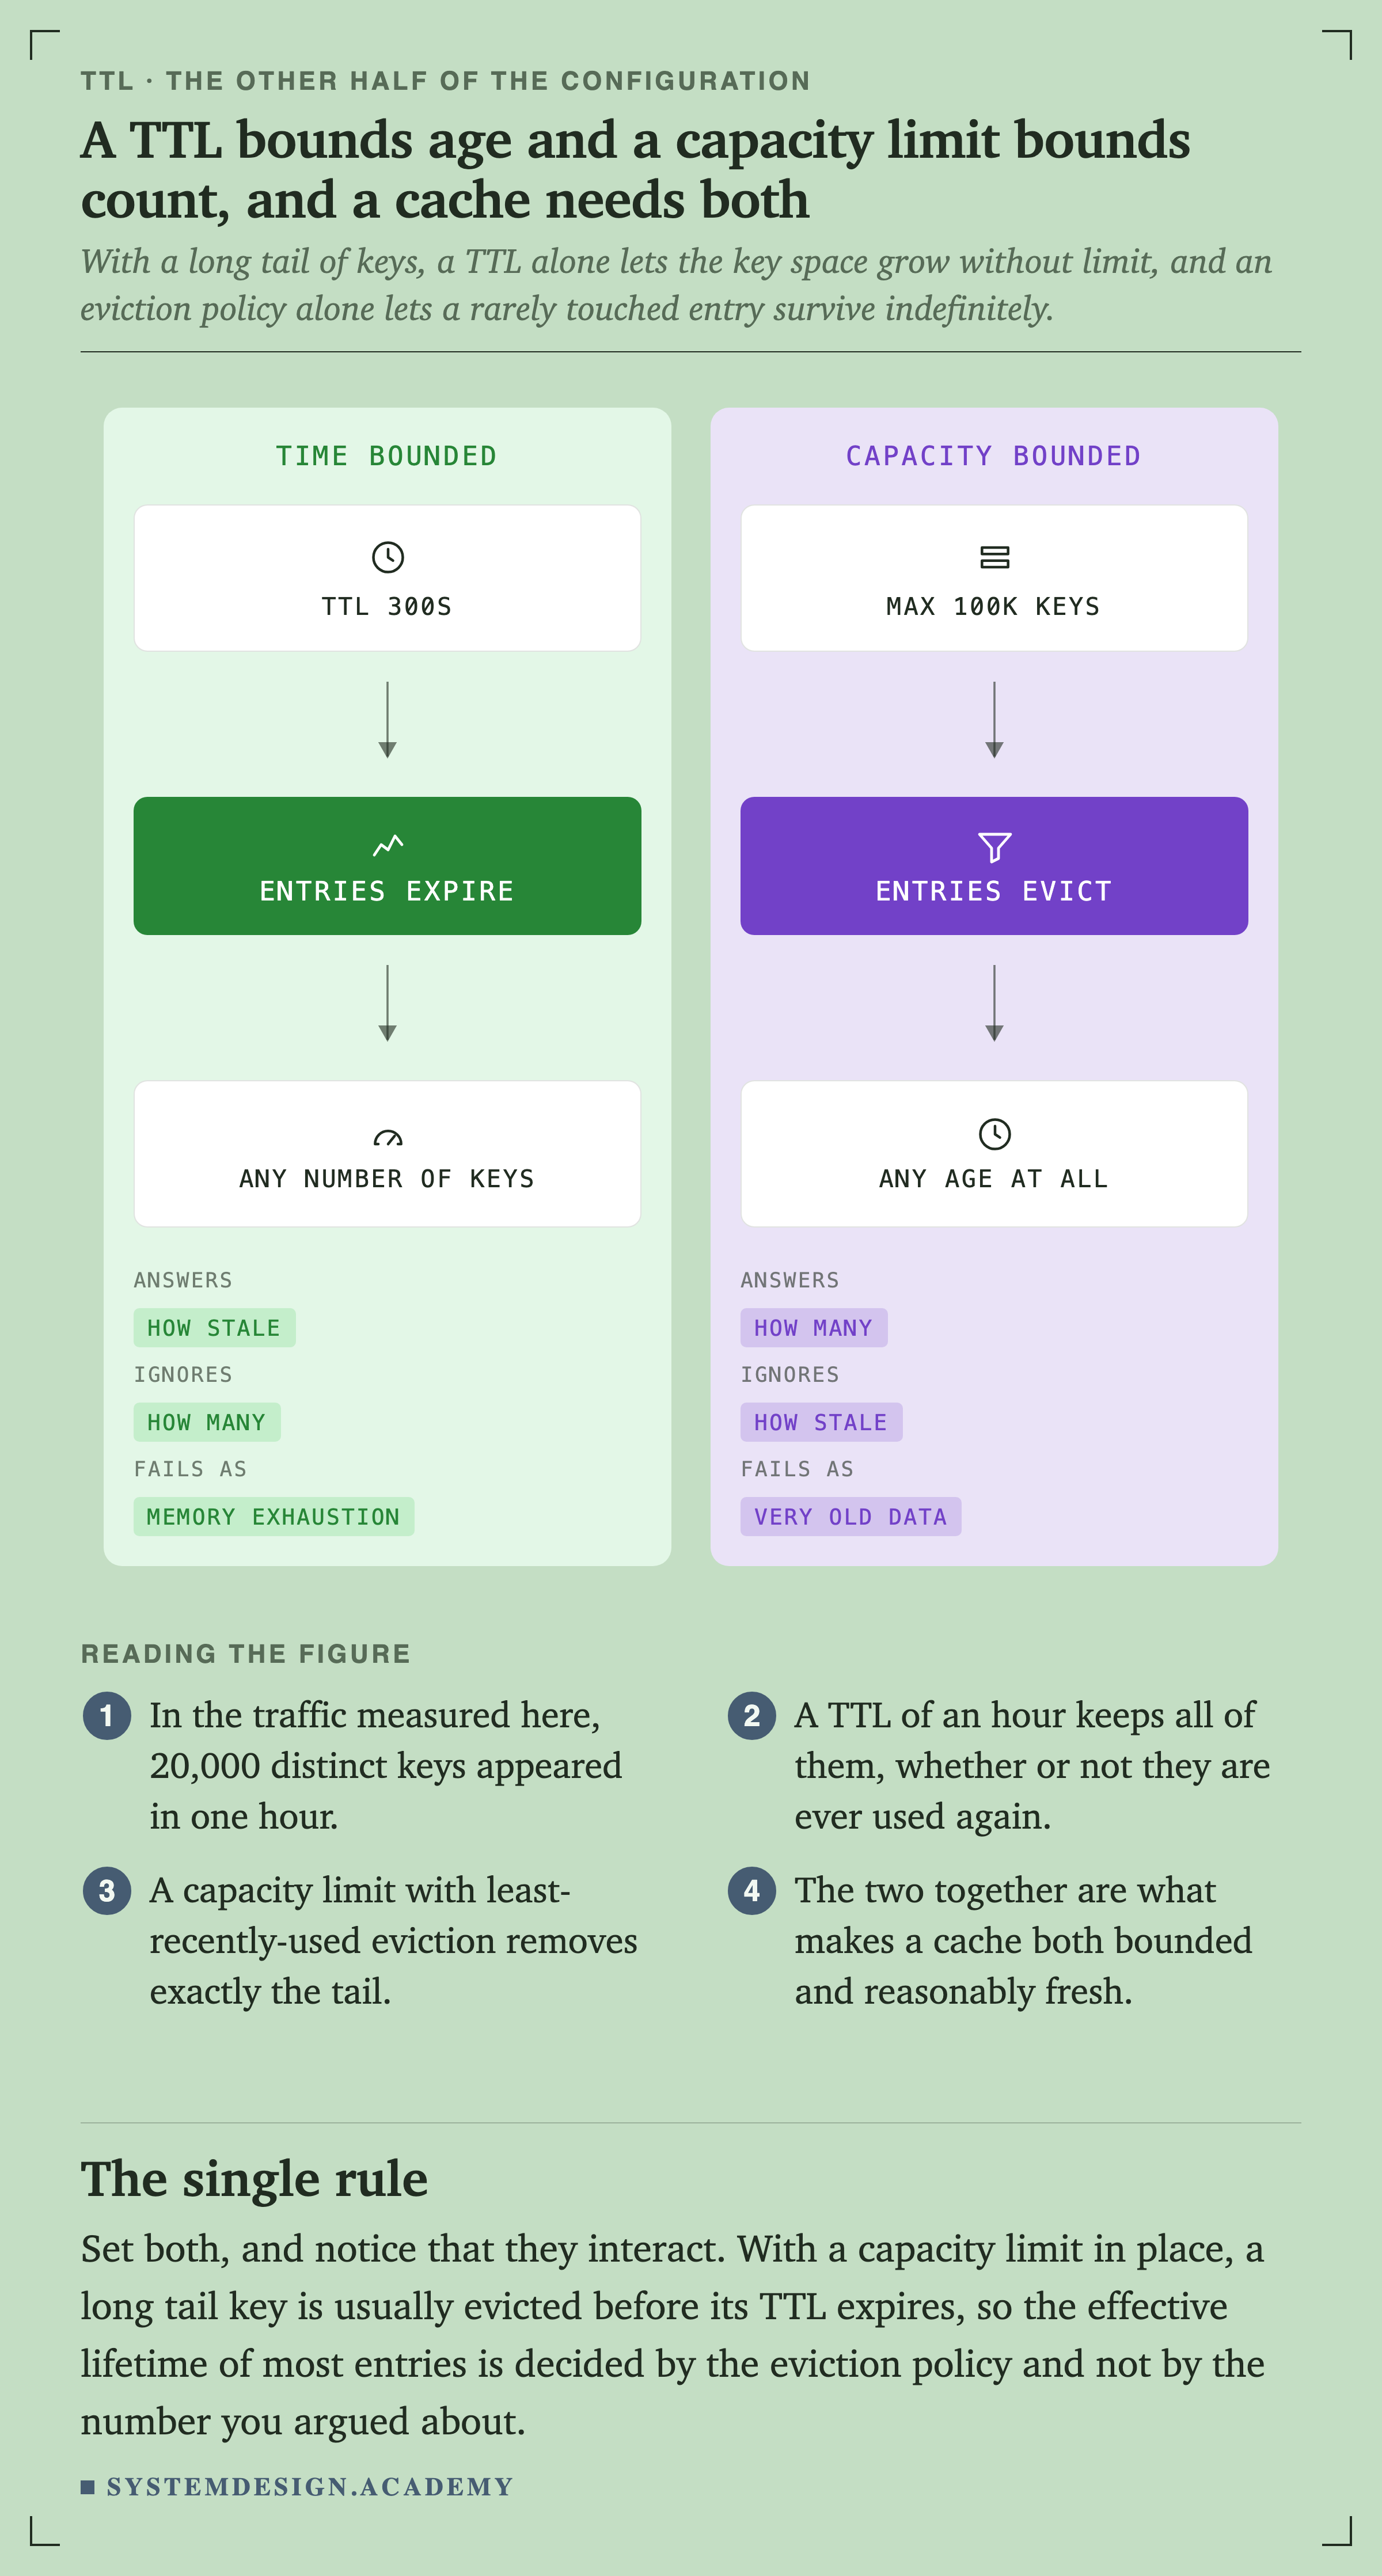
    Two panels. The left, time bounded, shows a TTL of 300 seconds causing entries to expire, allowing any number of keys. Its key reads: answers how stale, ignores how many, fails as memory exhaustion. The right, capacity bounded, shows a maximum of 100k keys causing entries to evict, allowing any age. Its key reads: answers how many, ignores how stale, fails as very old data.

    Choosing, and Then Measuring

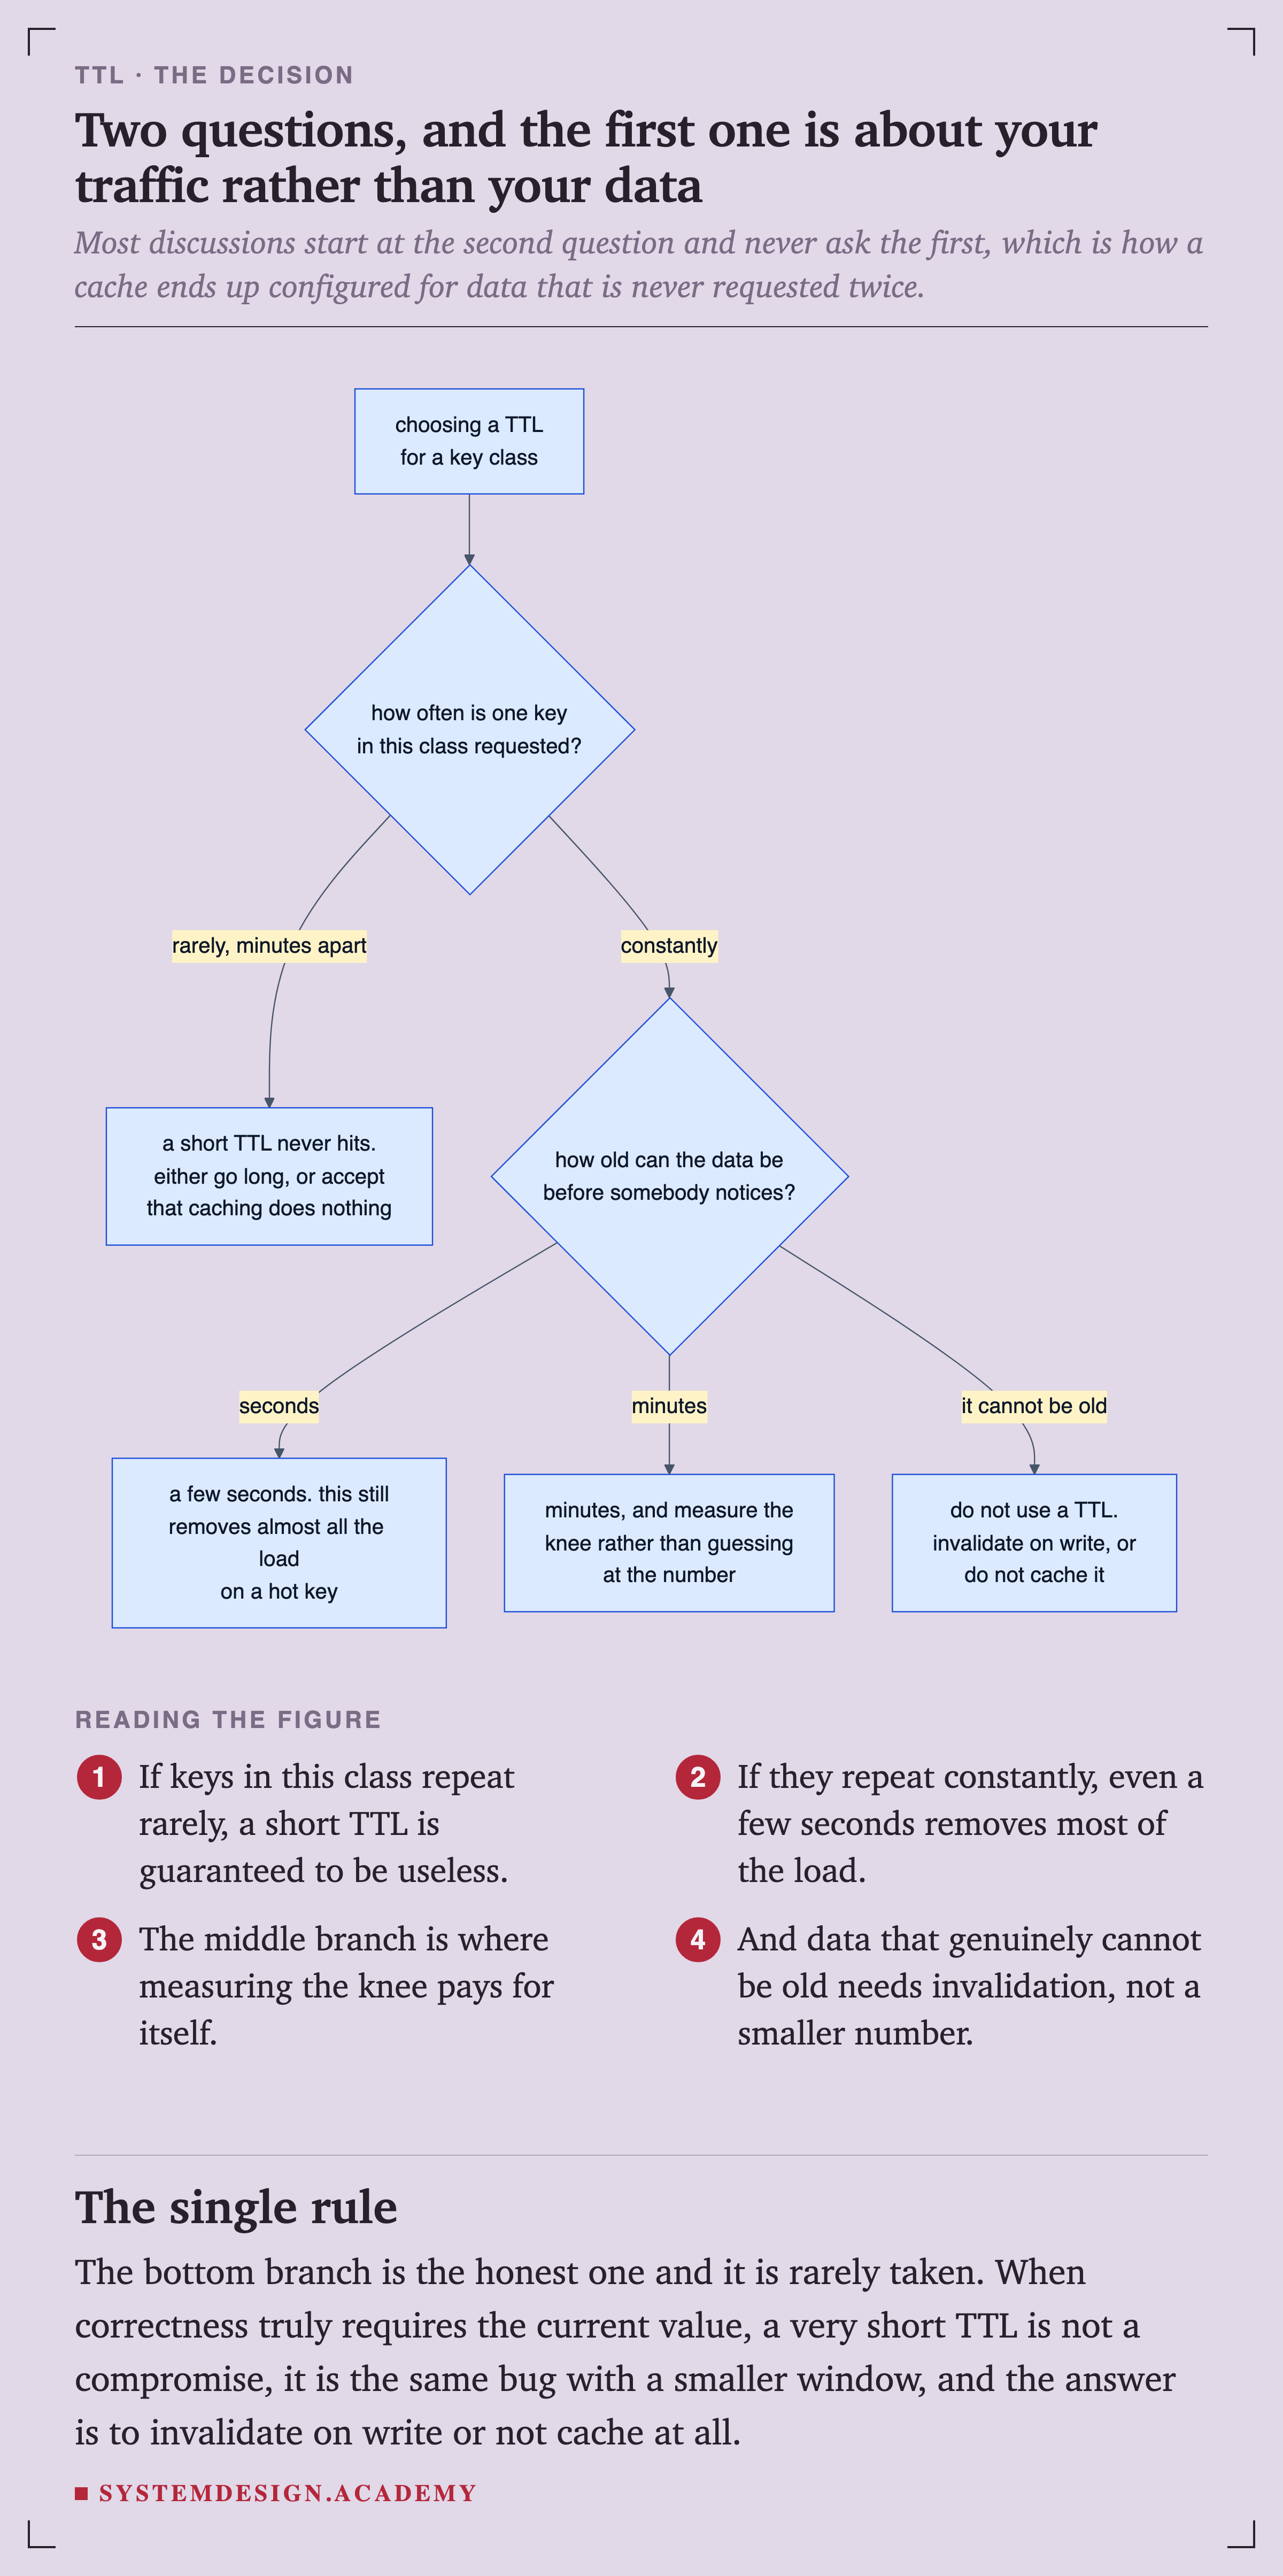
    A flowchart. Starting from choosing a TTL for a key class, it asks how often one key in this class is requested. If rarely, minutes apart, then a short TTL never hits, so either go long or accept that caching does nothing. If constantly, it asks how old the data can be before somebody notices. Seconds means a few seconds, which still removes almost all the load on a hot key. Minutes means minutes, measuring the knee instead of guessing. If it cannot be old, do not use a TTL: invalidate on write, or do not cache it.
    FlowchartFigure 13. Two questions, and the first is about your traffic rather than your data

    The bottom branch is the honest one and it is rarely taken. When correctness truly requires the current value, a very short is not a compromise, it is the same bug with a smaller window.
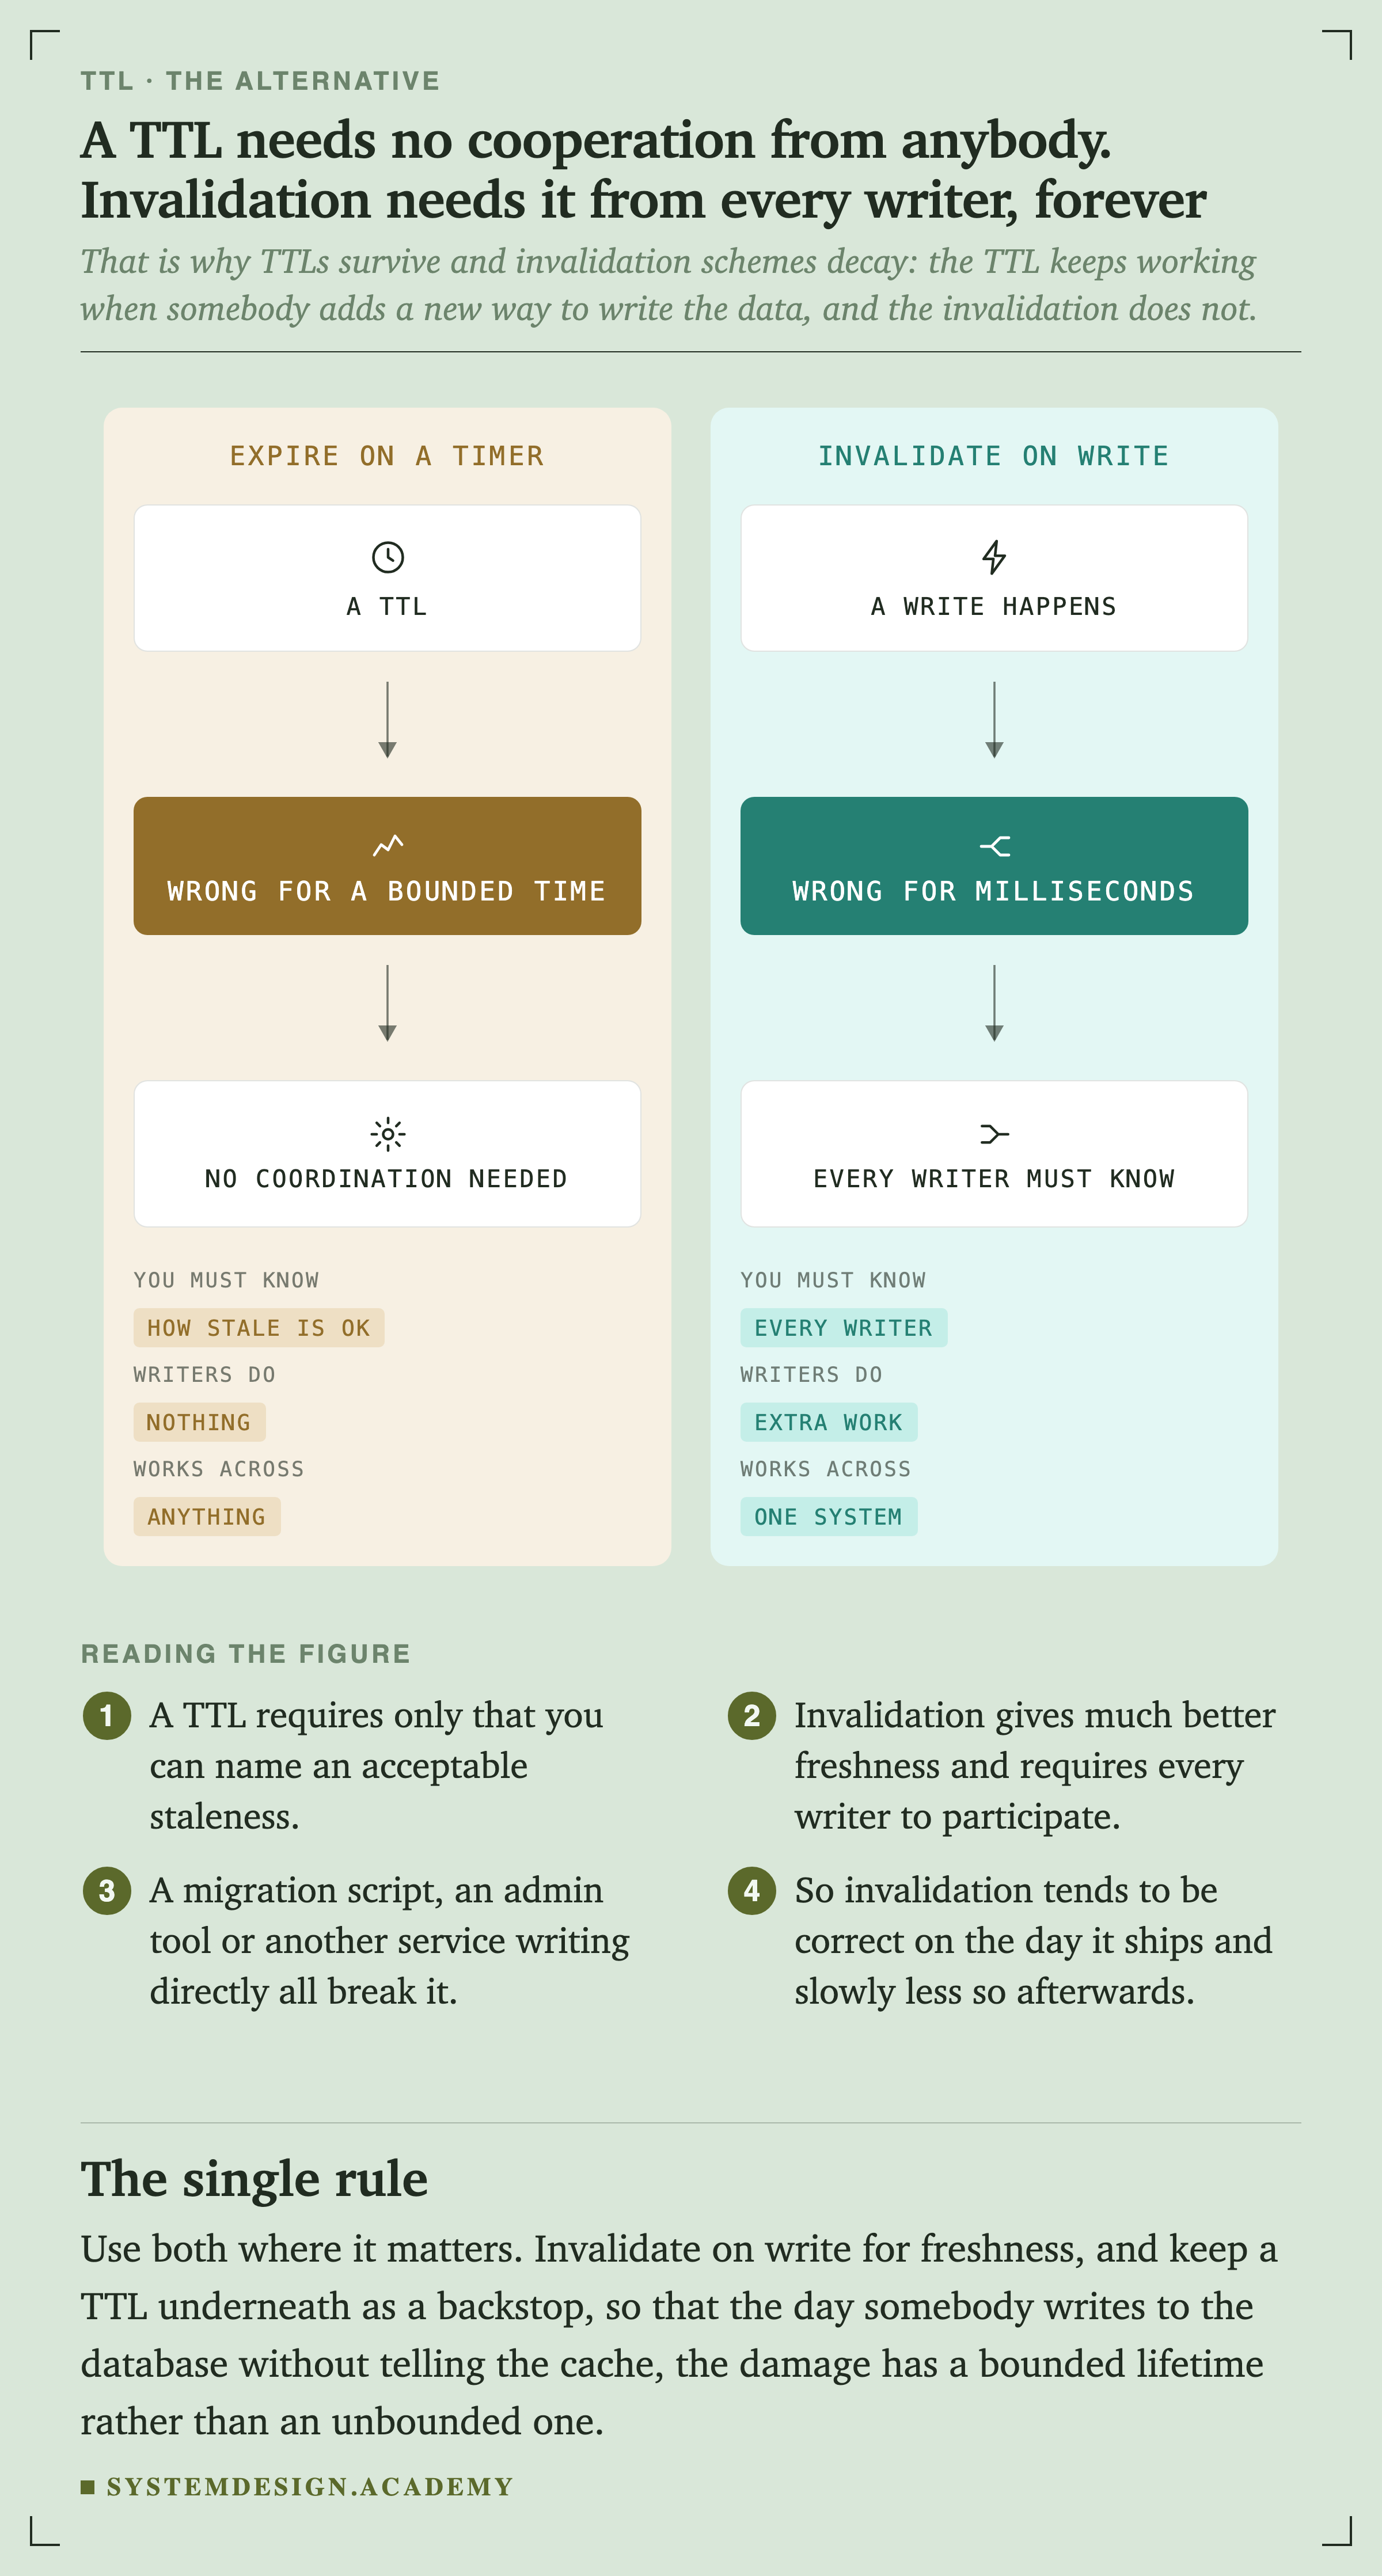
    Two panels. The left, expire on a timer, shows a TTL leading to being wrong for a bounded time, with no coordination needed. Its key reads: you must know how stale is ok, writers do nothing, works across anything. The right, invalidate on write, shows a write leading to being wrong for milliseconds, with every writer needing to know. Its key reads: you must know every writer, writers do extra work, works across one system.
    ComparisonFigure 14. A TTL needs no cooperation. Invalidation needs it from every writer, forever

    That is why TTLs survive and invalidation schemes decay. A migration script, an admin tool or another service writing directly all break invalidation, and the TTL keeps working regardless. Use both: invalidate for freshness, and keep a TTL underneath as a backstop.

    Quick Check

    Knowledge Check

    4 questions - Score 80% to pass

    Q1

    Your cache hit rate is 88.5 percent at a 900 second TTL. Someone proposes raising it to an hour. What should you expect?

    Q2

    A cache that never expired would still miss on 4.8 percent of requests in the measured traffic. Why?

    Q3

    Your database load spikes sharply every five minutes, matching your cache TTL exactly. What is happening and what is the cheapest fix?

    Q4

    You want to stop guessing at TTLs. What single measurement answers the most questions?
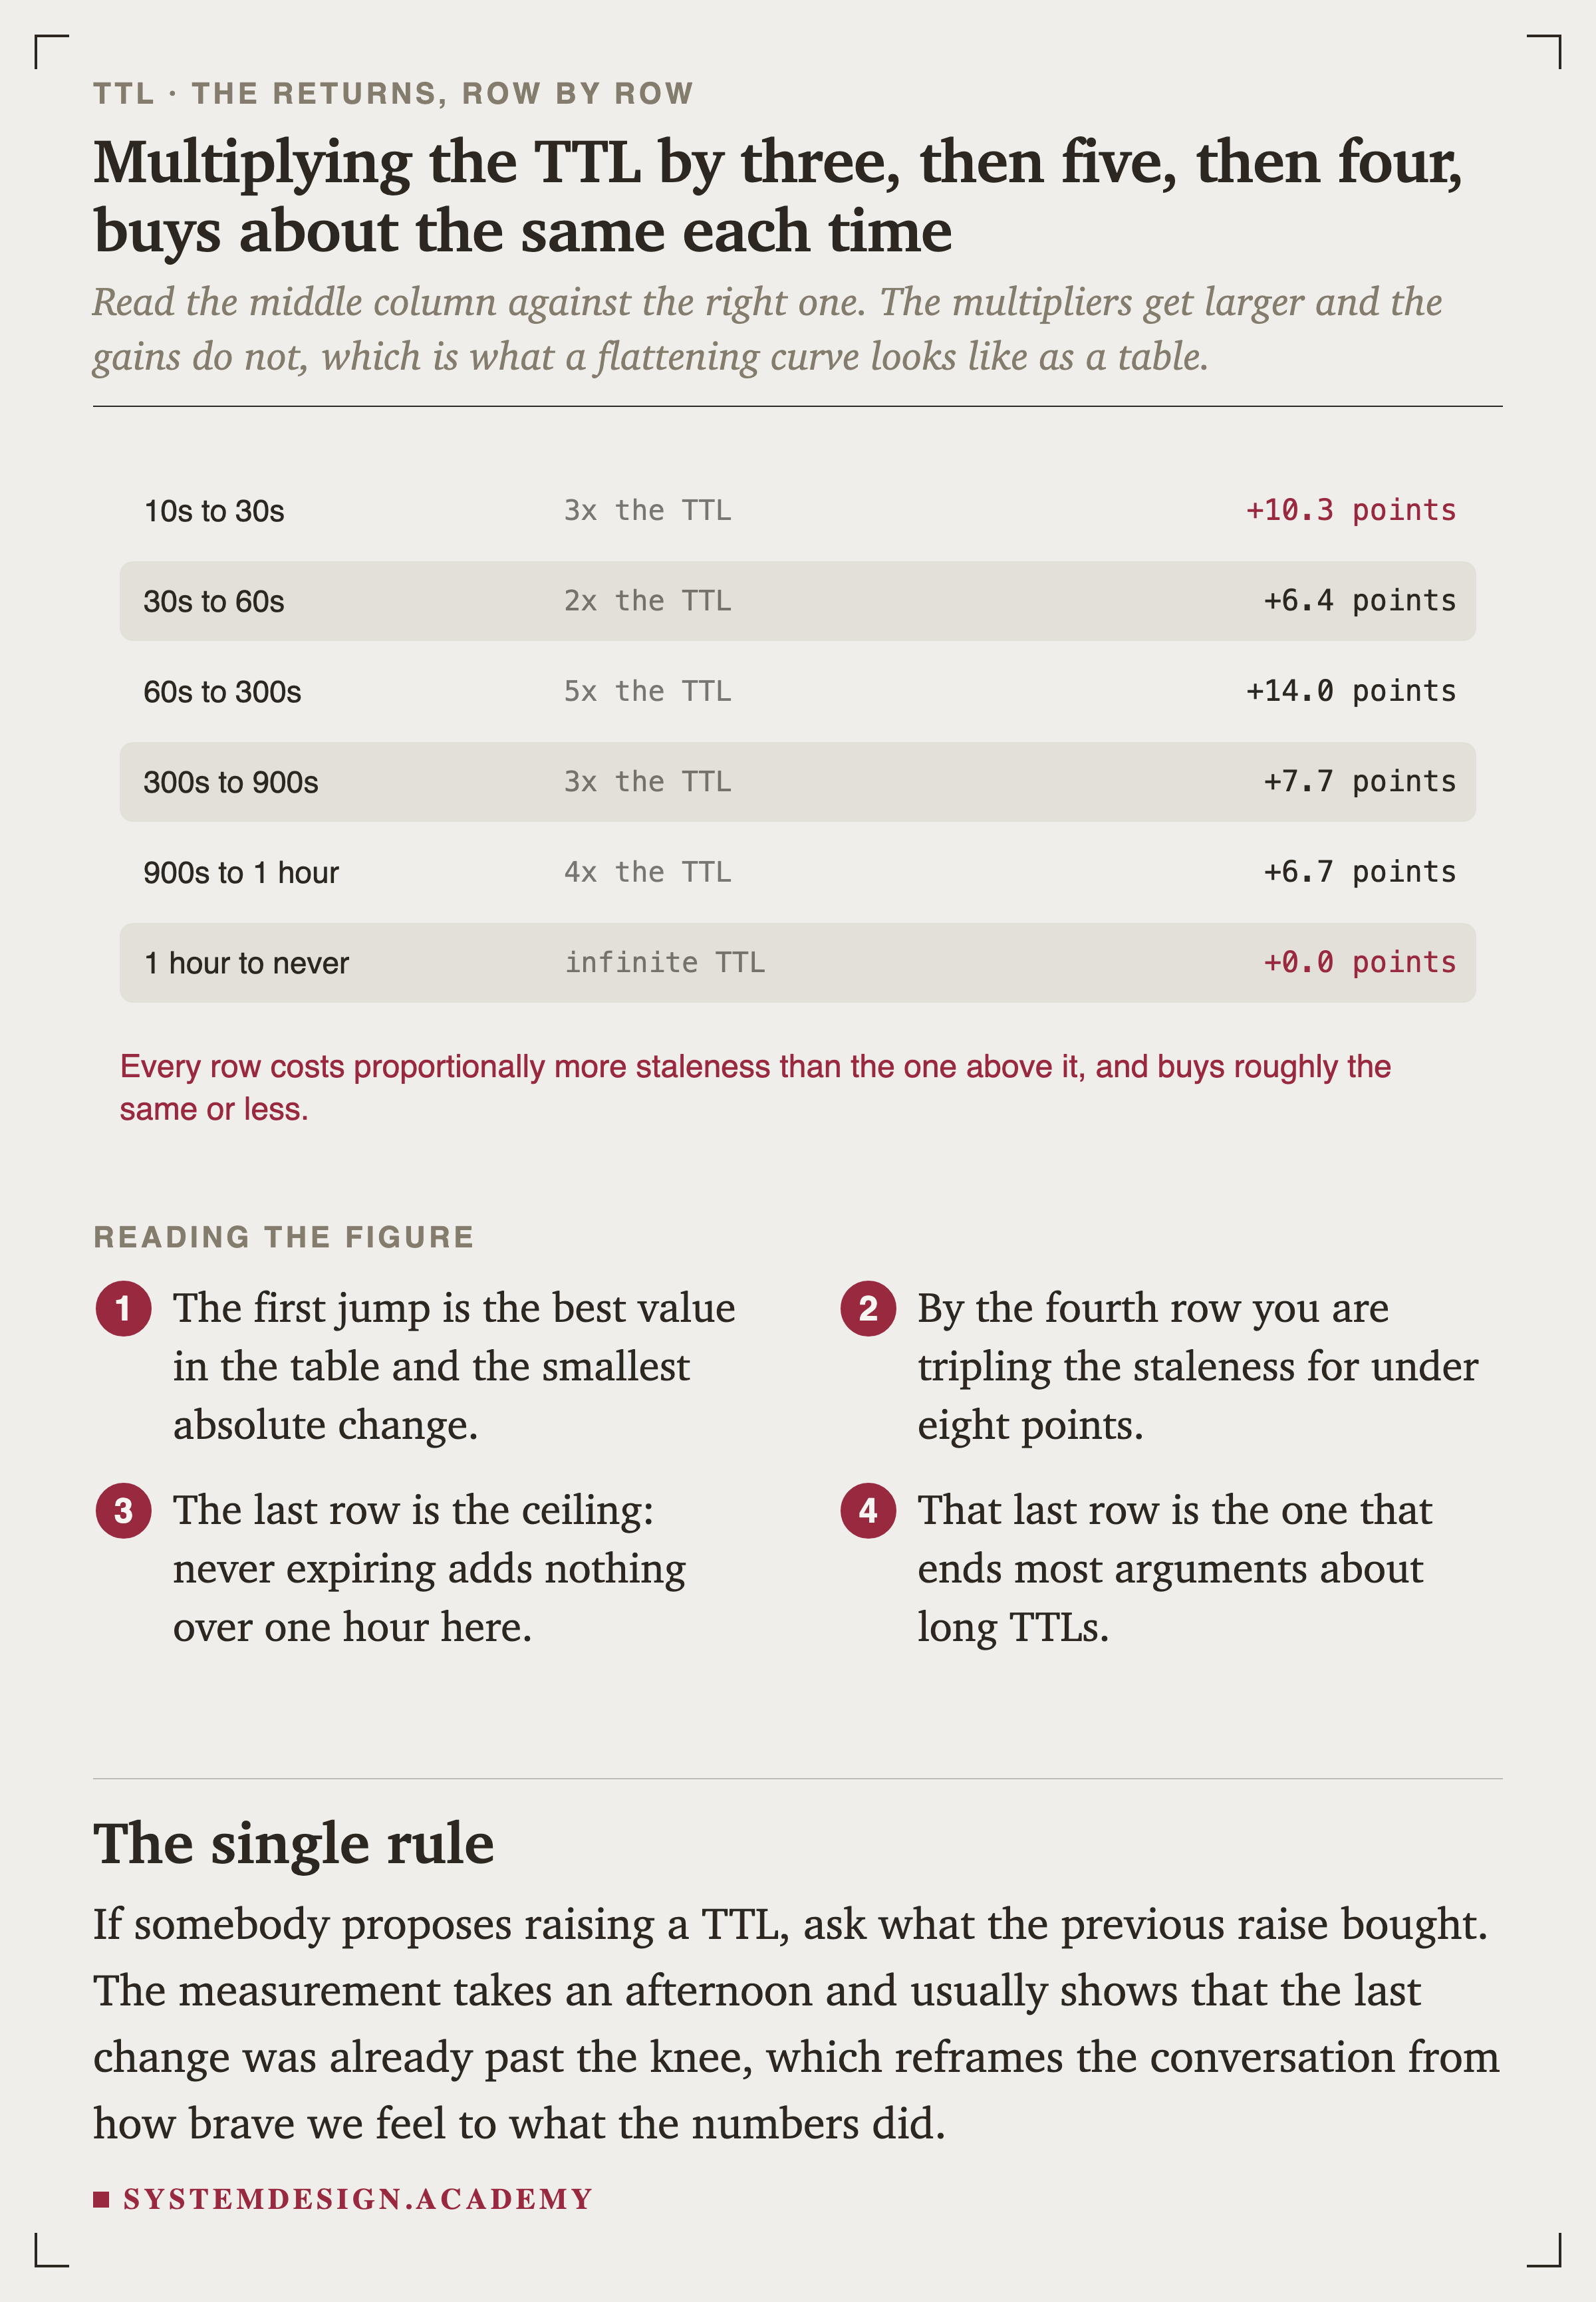
    Six rows. 10s to 30s is 3x the TTL for plus 10.3 points. 30s to 60s is 2x for plus 6.4. 60s to 300s is 5x for plus 14.0. 300s to 900s is 3x for plus 7.7. 900s to 1 hour is 4x for plus 6.7. 1 hour to never is an infinite TTL for plus 0.0 points.
    FigureFigure 5. The multipliers get larger and the gains do not

    If somebody proposes raising a TTL, ask what the previous raise bought. The measurement takes an afternoon and usually shows the last change was already past the knee.

    ComparisonFigure 12. A TTL bounds age and a capacity limit bounds count

    With a long tail of keys, a TTL alone lets the key space grow without limit. The two together are what makes a cache both bounded and reasonably fresh, and they interact: with a capacity limit, most tail entries are evicted well before their TTL expires.

    after “The Expiry Moment”

    Curious how teams set this up for real?

    In the System Design course, the next step is Refresh-Ahead Cache.

    25 minutes, drawn step by step, so you can sketch it yourself afterwards.

    Open the System Design course page
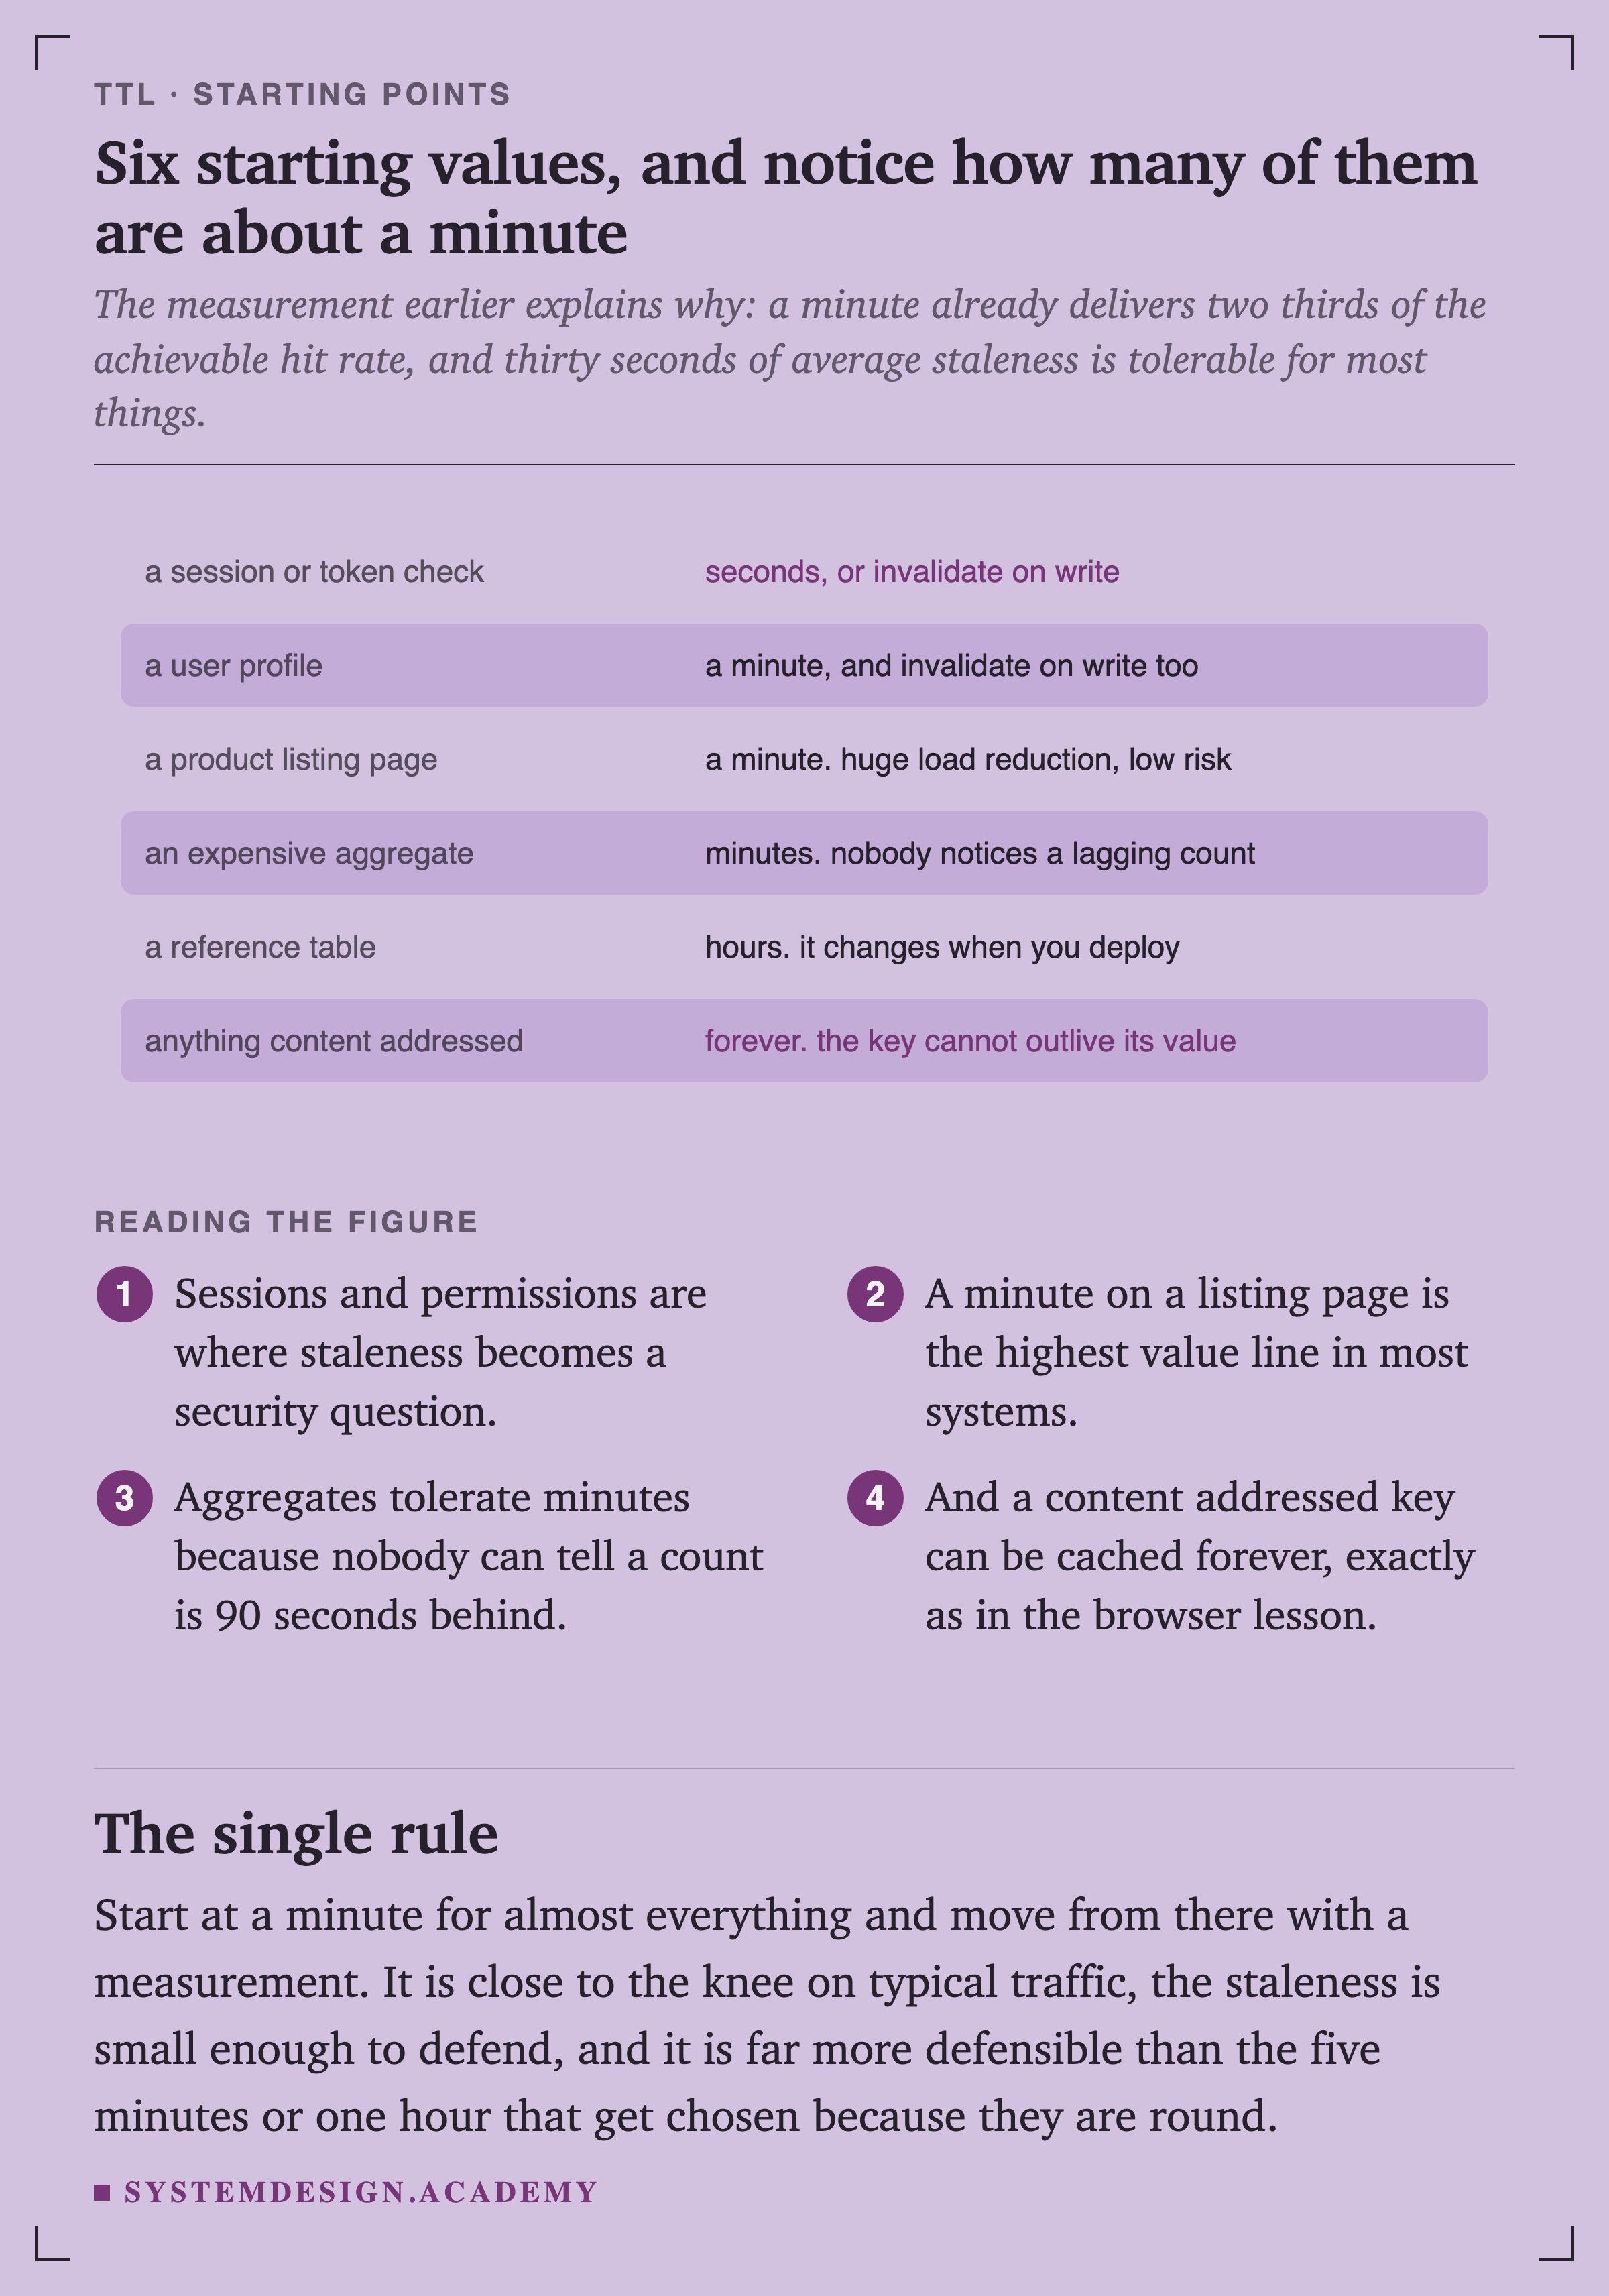
    Six starting values. A session or token check gets seconds, or invalidate on write. A user profile gets a minute, and invalidate on write too. A product listing page gets a minute, for huge load reduction at low risk. An expensive aggregate gets minutes, since nobody notices a lagging count. A reference table gets hours, since it changes when you deploy. Anything content addressed gets forever, since the key cannot outlive its value.
    FigureFigure 15. Six starting points, and notice how many are about a minute

    The measurement explains why. A minute already delivers two thirds of the achievable hit rate, and thirty seconds of average staleness is tolerable for most things. Start there and move with a measurement.

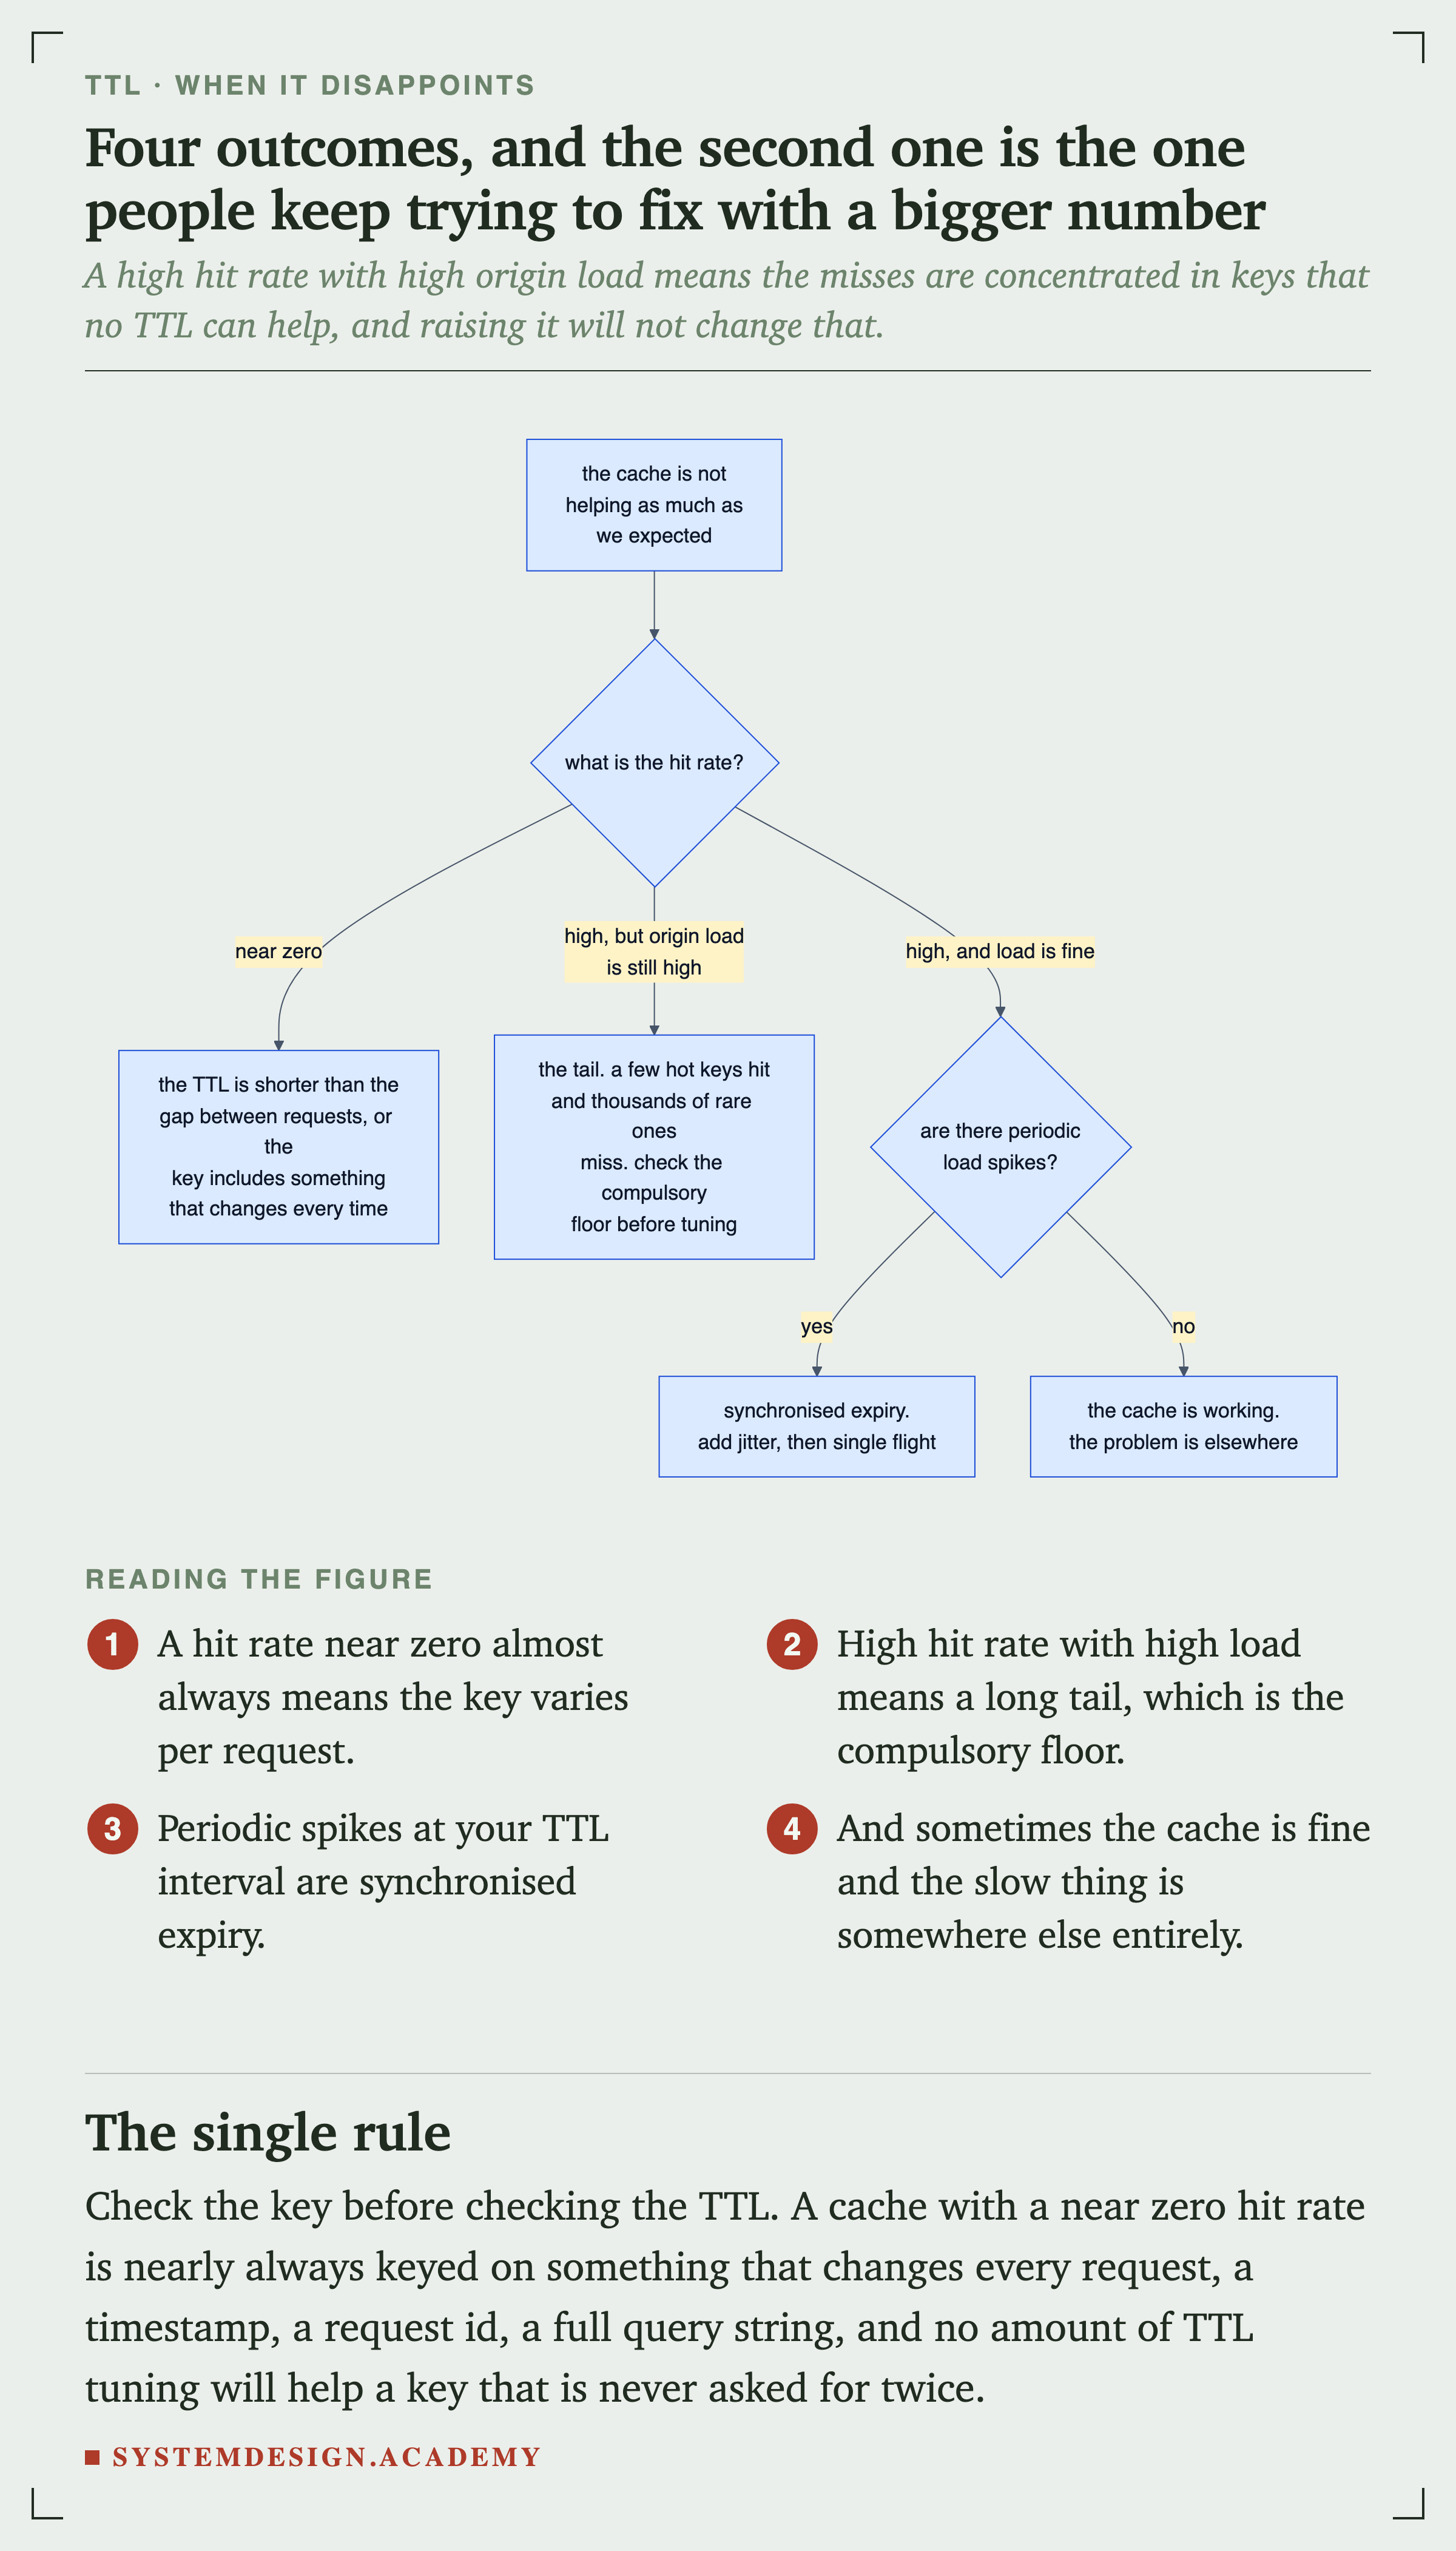
    A flowchart for a cache that is not helping as much as expected. A hit rate near zero means the TTL is shorter than the gap between requests, or the key includes something that changes every time. A high hit rate with high origin load means the tail: a few hot keys hit and thousands of rare ones miss, so check the compulsory floor before tuning. A high hit rate with acceptable load and periodic spikes means synchronised expiry, so add jitter then single flight. Otherwise the cache is working and the problem is elsewhere.
    FlowchartFigure 16. Four outcomes, and the second is the one people fix with a bigger number

    Check the key before checking the TTL. A cache with a near zero hit rate is nearly always keyed on something that changes every request: a timestamp, a request id, a full query string.

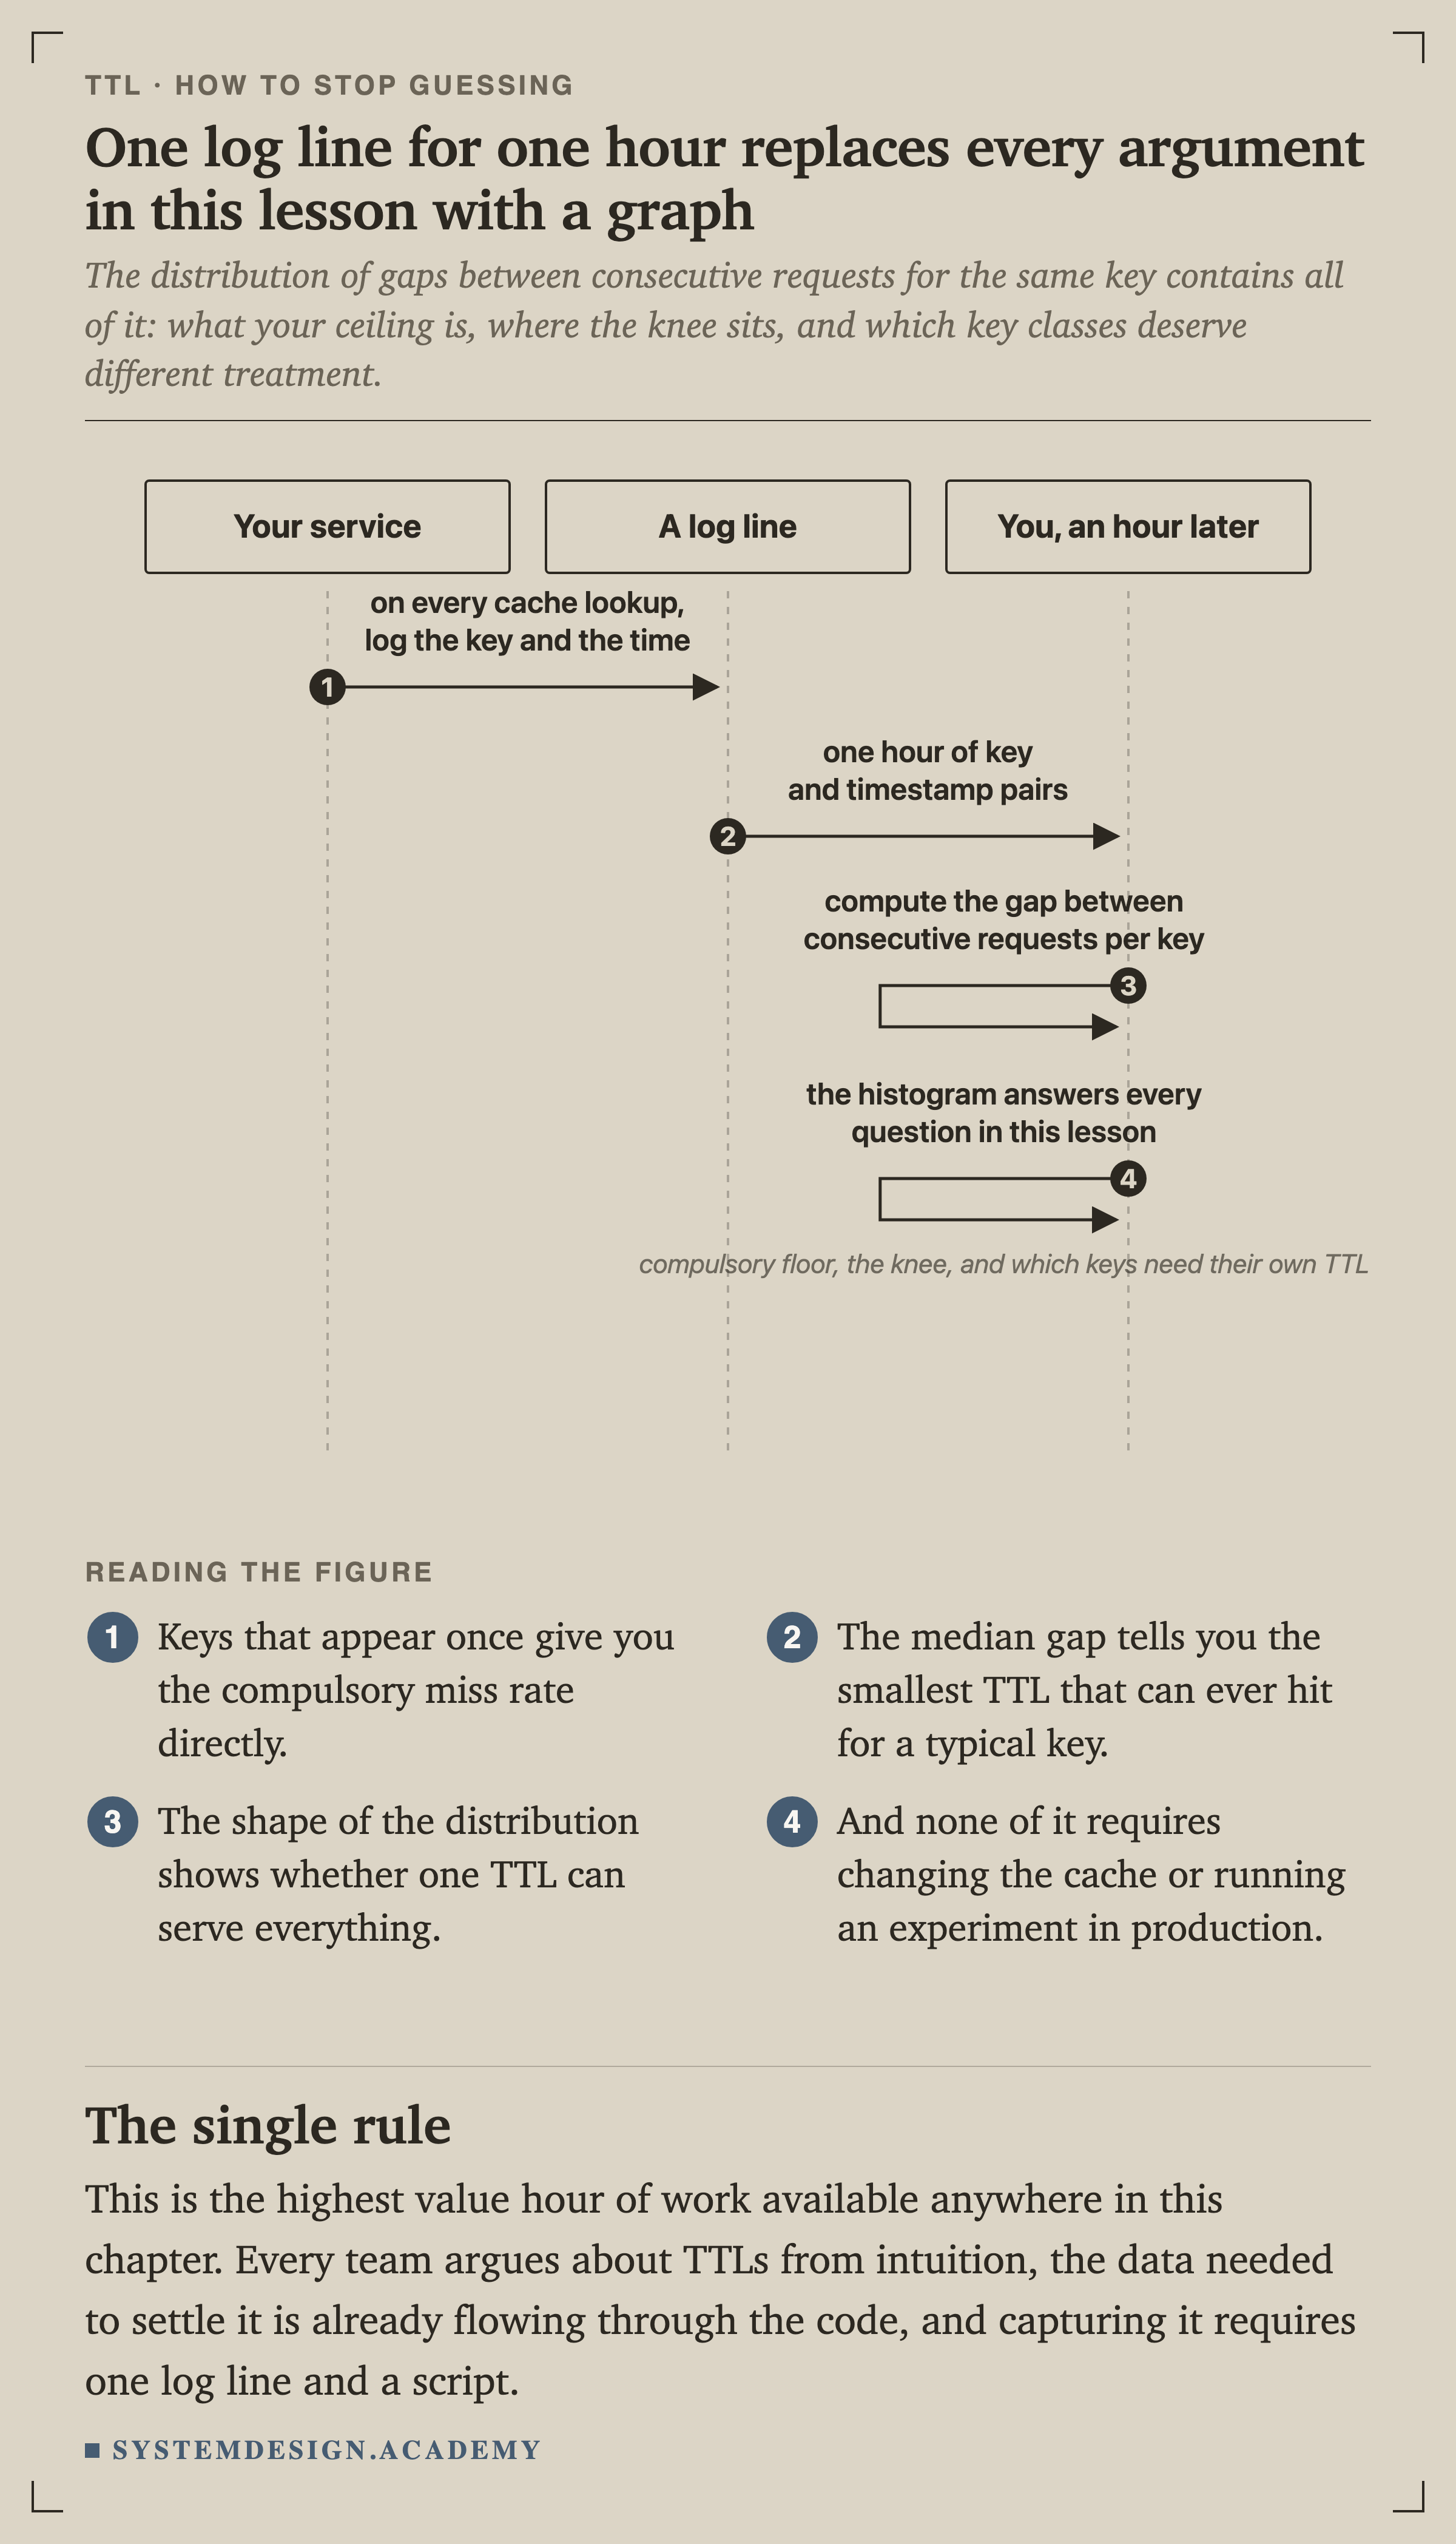
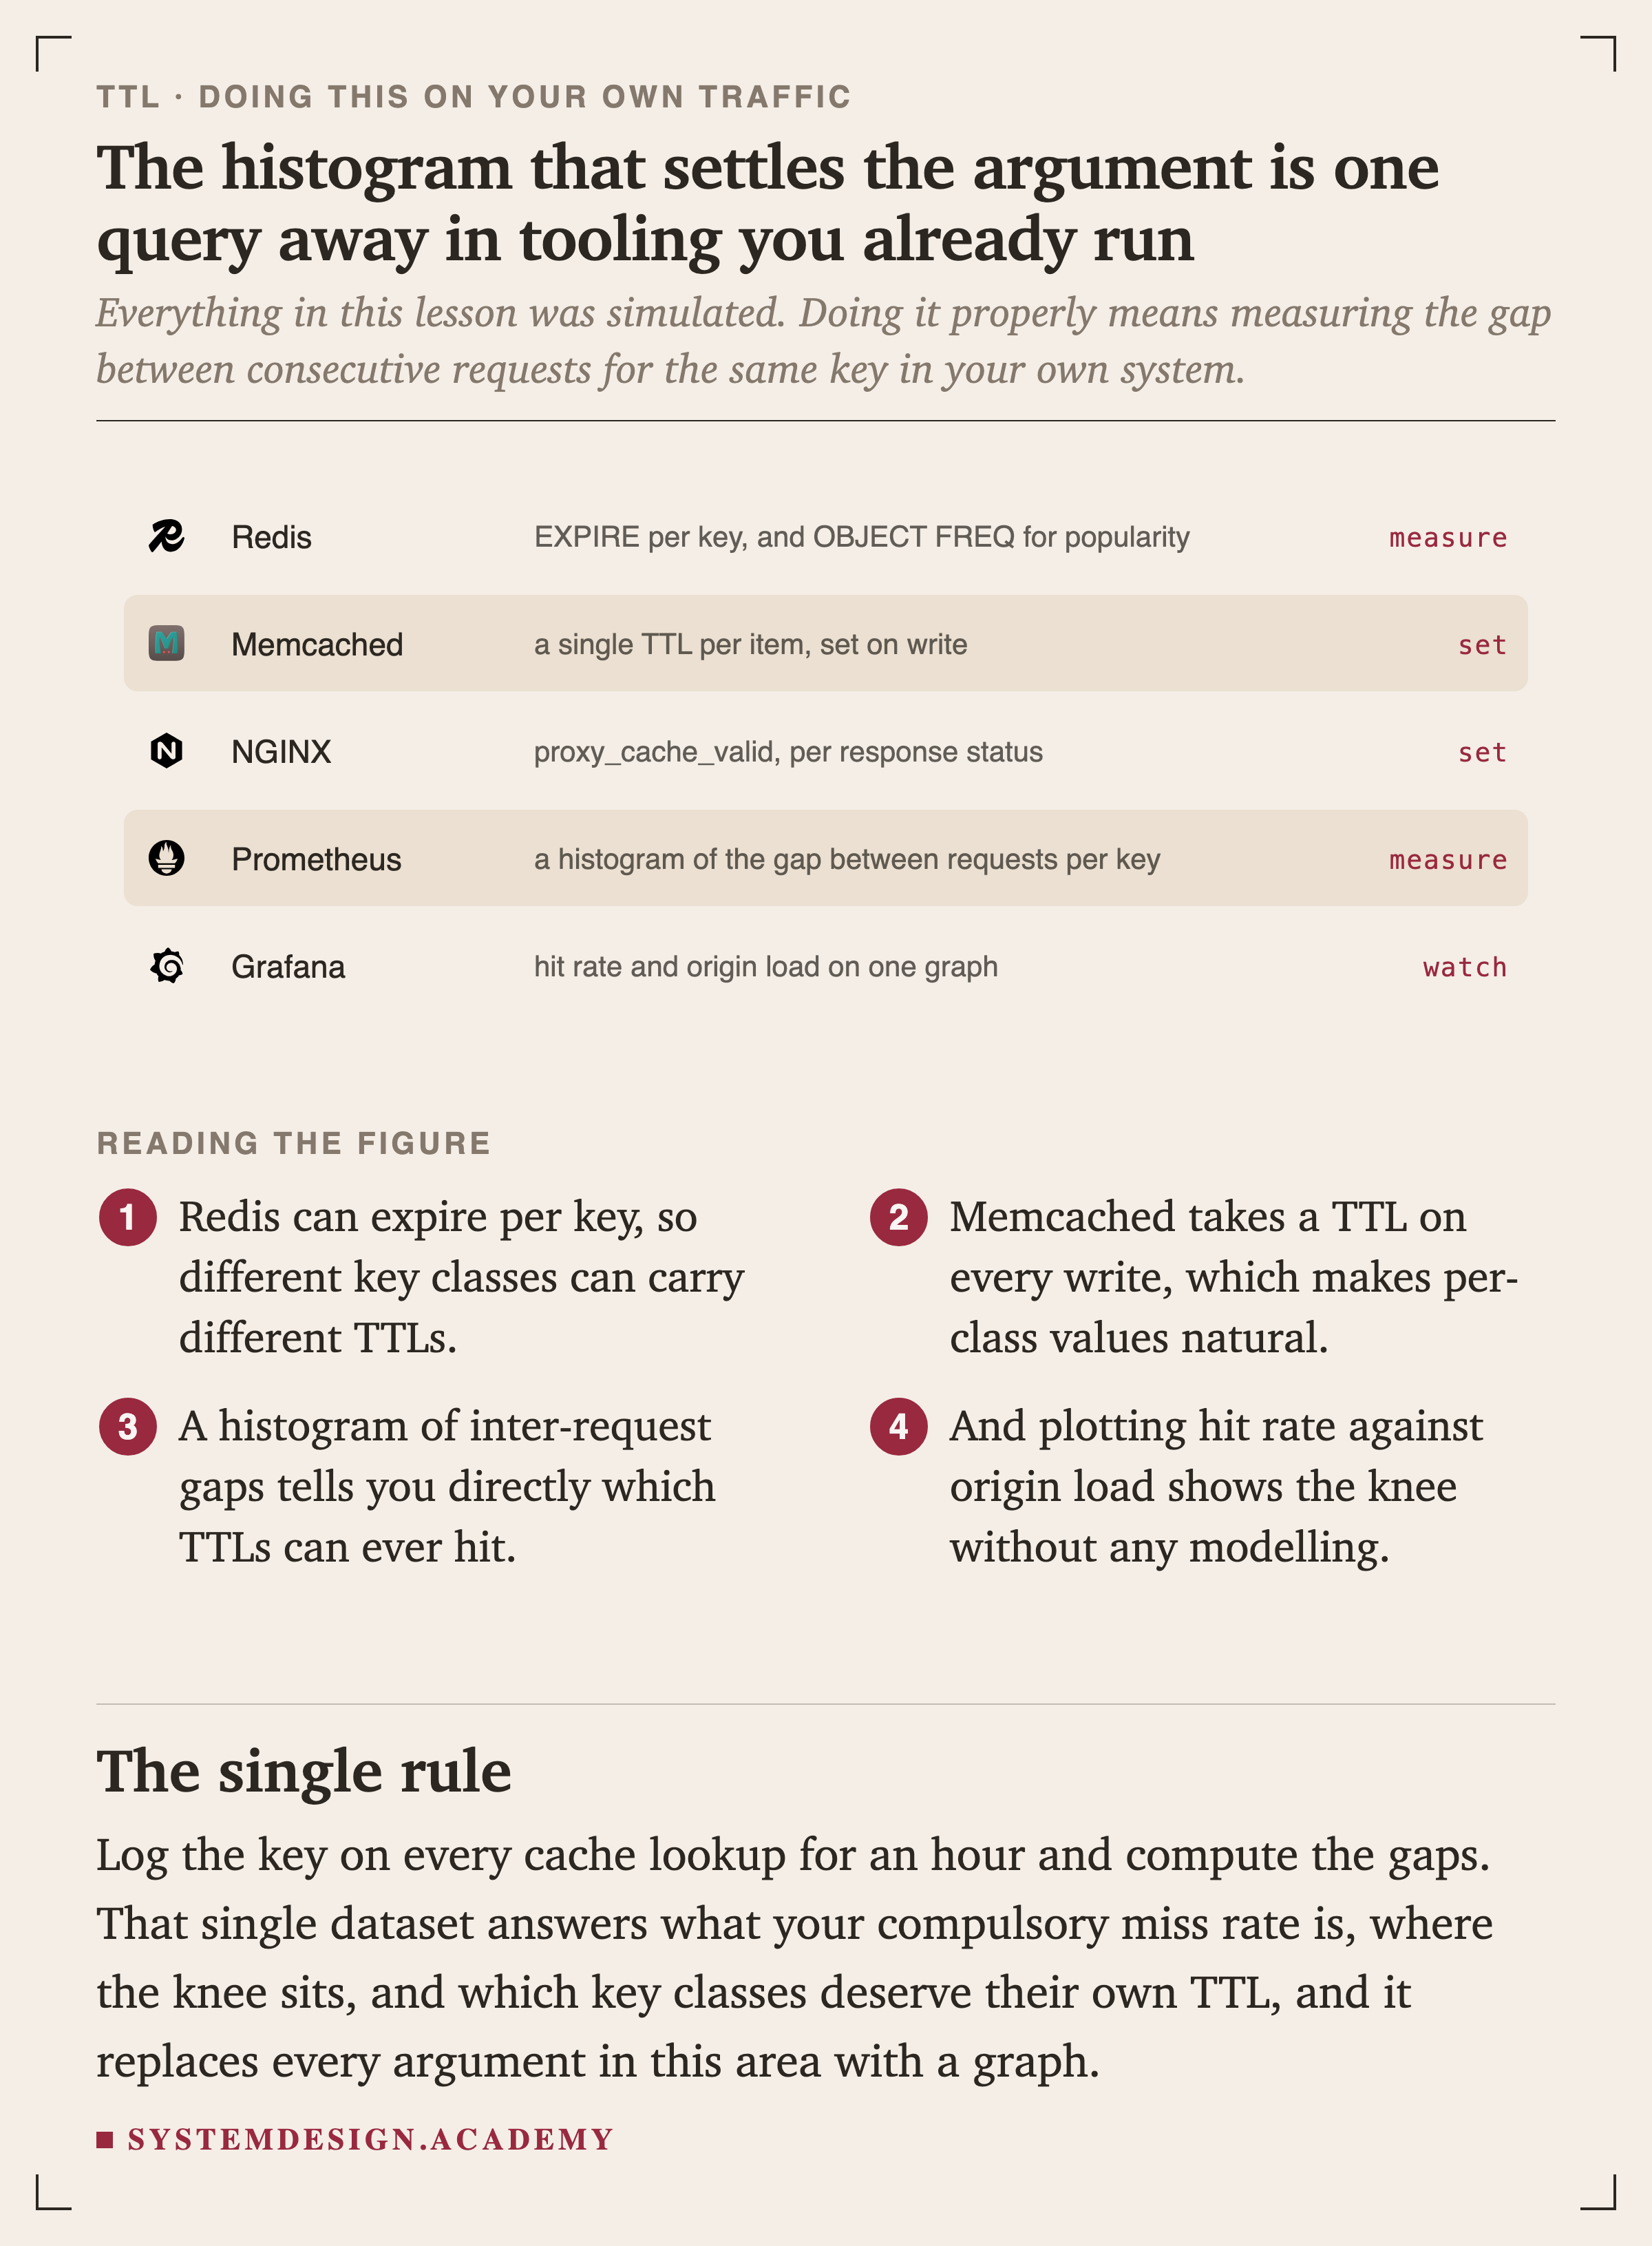
    A sequence diagram with three lifelines: your service, a log line, and you an hour later. On every cache lookup, log the key and the time. That produces one hour of key and timestamp pairs. Compute the gap between consecutive requests per key. The resulting histogram answers every question in this lesson, noted as the compulsory floor, the knee, and which keys need their own TTL.
    SequenceFigure 17. One log line for one hour replaces every argument here with a graph

    Keys that appear once give you the compulsory miss rate directly. The median gap tells you the smallest TTL that can ever hit. None of it requires changing the cache or running an experiment in production.

    Five rows with real product logos. Redis offers EXPIRE per key and OBJECT FREQ for popularity, tagged measure. Memcached takes a single TTL per item set on write, tagged set. NGINX offers proxy_cache_valid per response status, tagged set. Prometheus can hold a histogram of the gap between requests per key, tagged measure. Grafana puts hit rate and origin load on one graph, tagged watch.
    ArchitectureFigure 18. The histogram that settles it is one query away in tooling you already run

    can expire per key, so different key classes can carry different TTLs. Plotting hit rate against origin load shows the knee without any modelling at all.

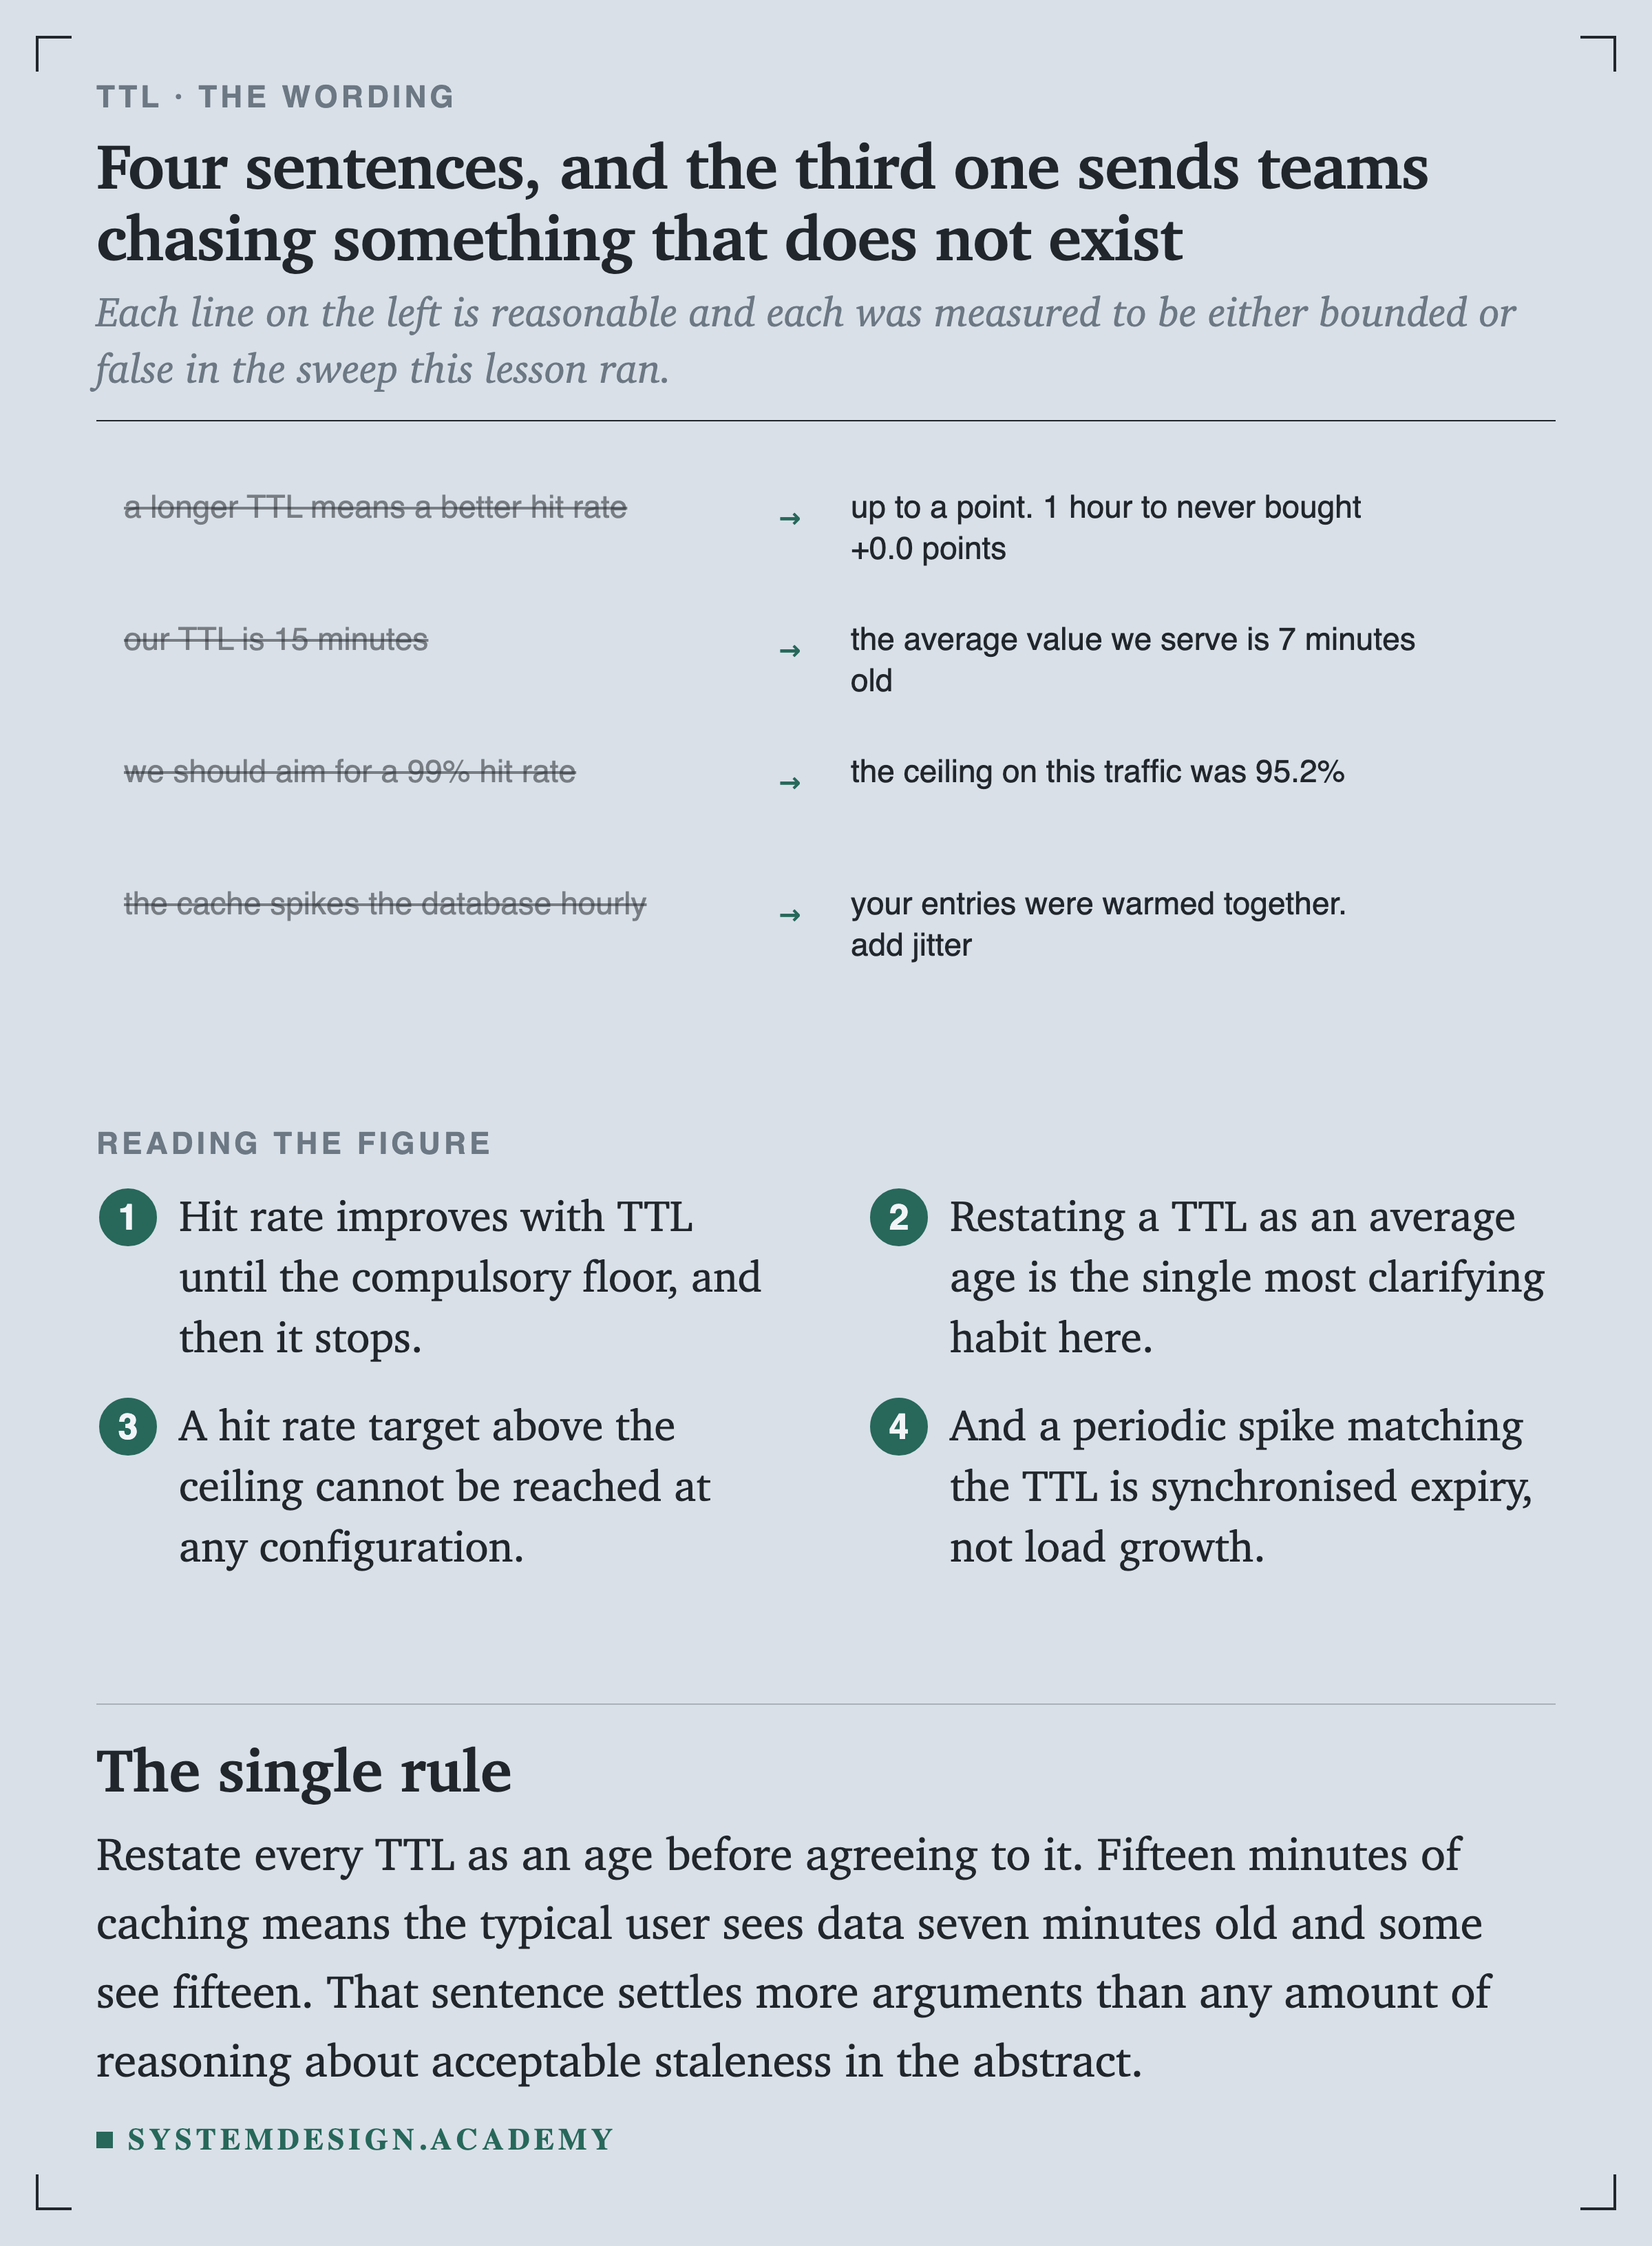
    Four pairs of sentences. A longer TTL means a better hit rate becomes up to a point, since 1 hour to never bought plus 0.0 points. Our TTL is 15 minutes becomes the average value we serve is 7 minutes old. We should aim for a 99 percent hit rate becomes the ceiling on this traffic was 95.2 percent. The cache spikes the database hourly becomes your entries were warmed together, add jitter.
    FigureFigure 19. Four sentences, and the third sends teams chasing something that does not exist

    Restate every TTL as an age before agreeing to it. That one habit settles more arguments than any amount of reasoning about acceptable staleness in the abstract.

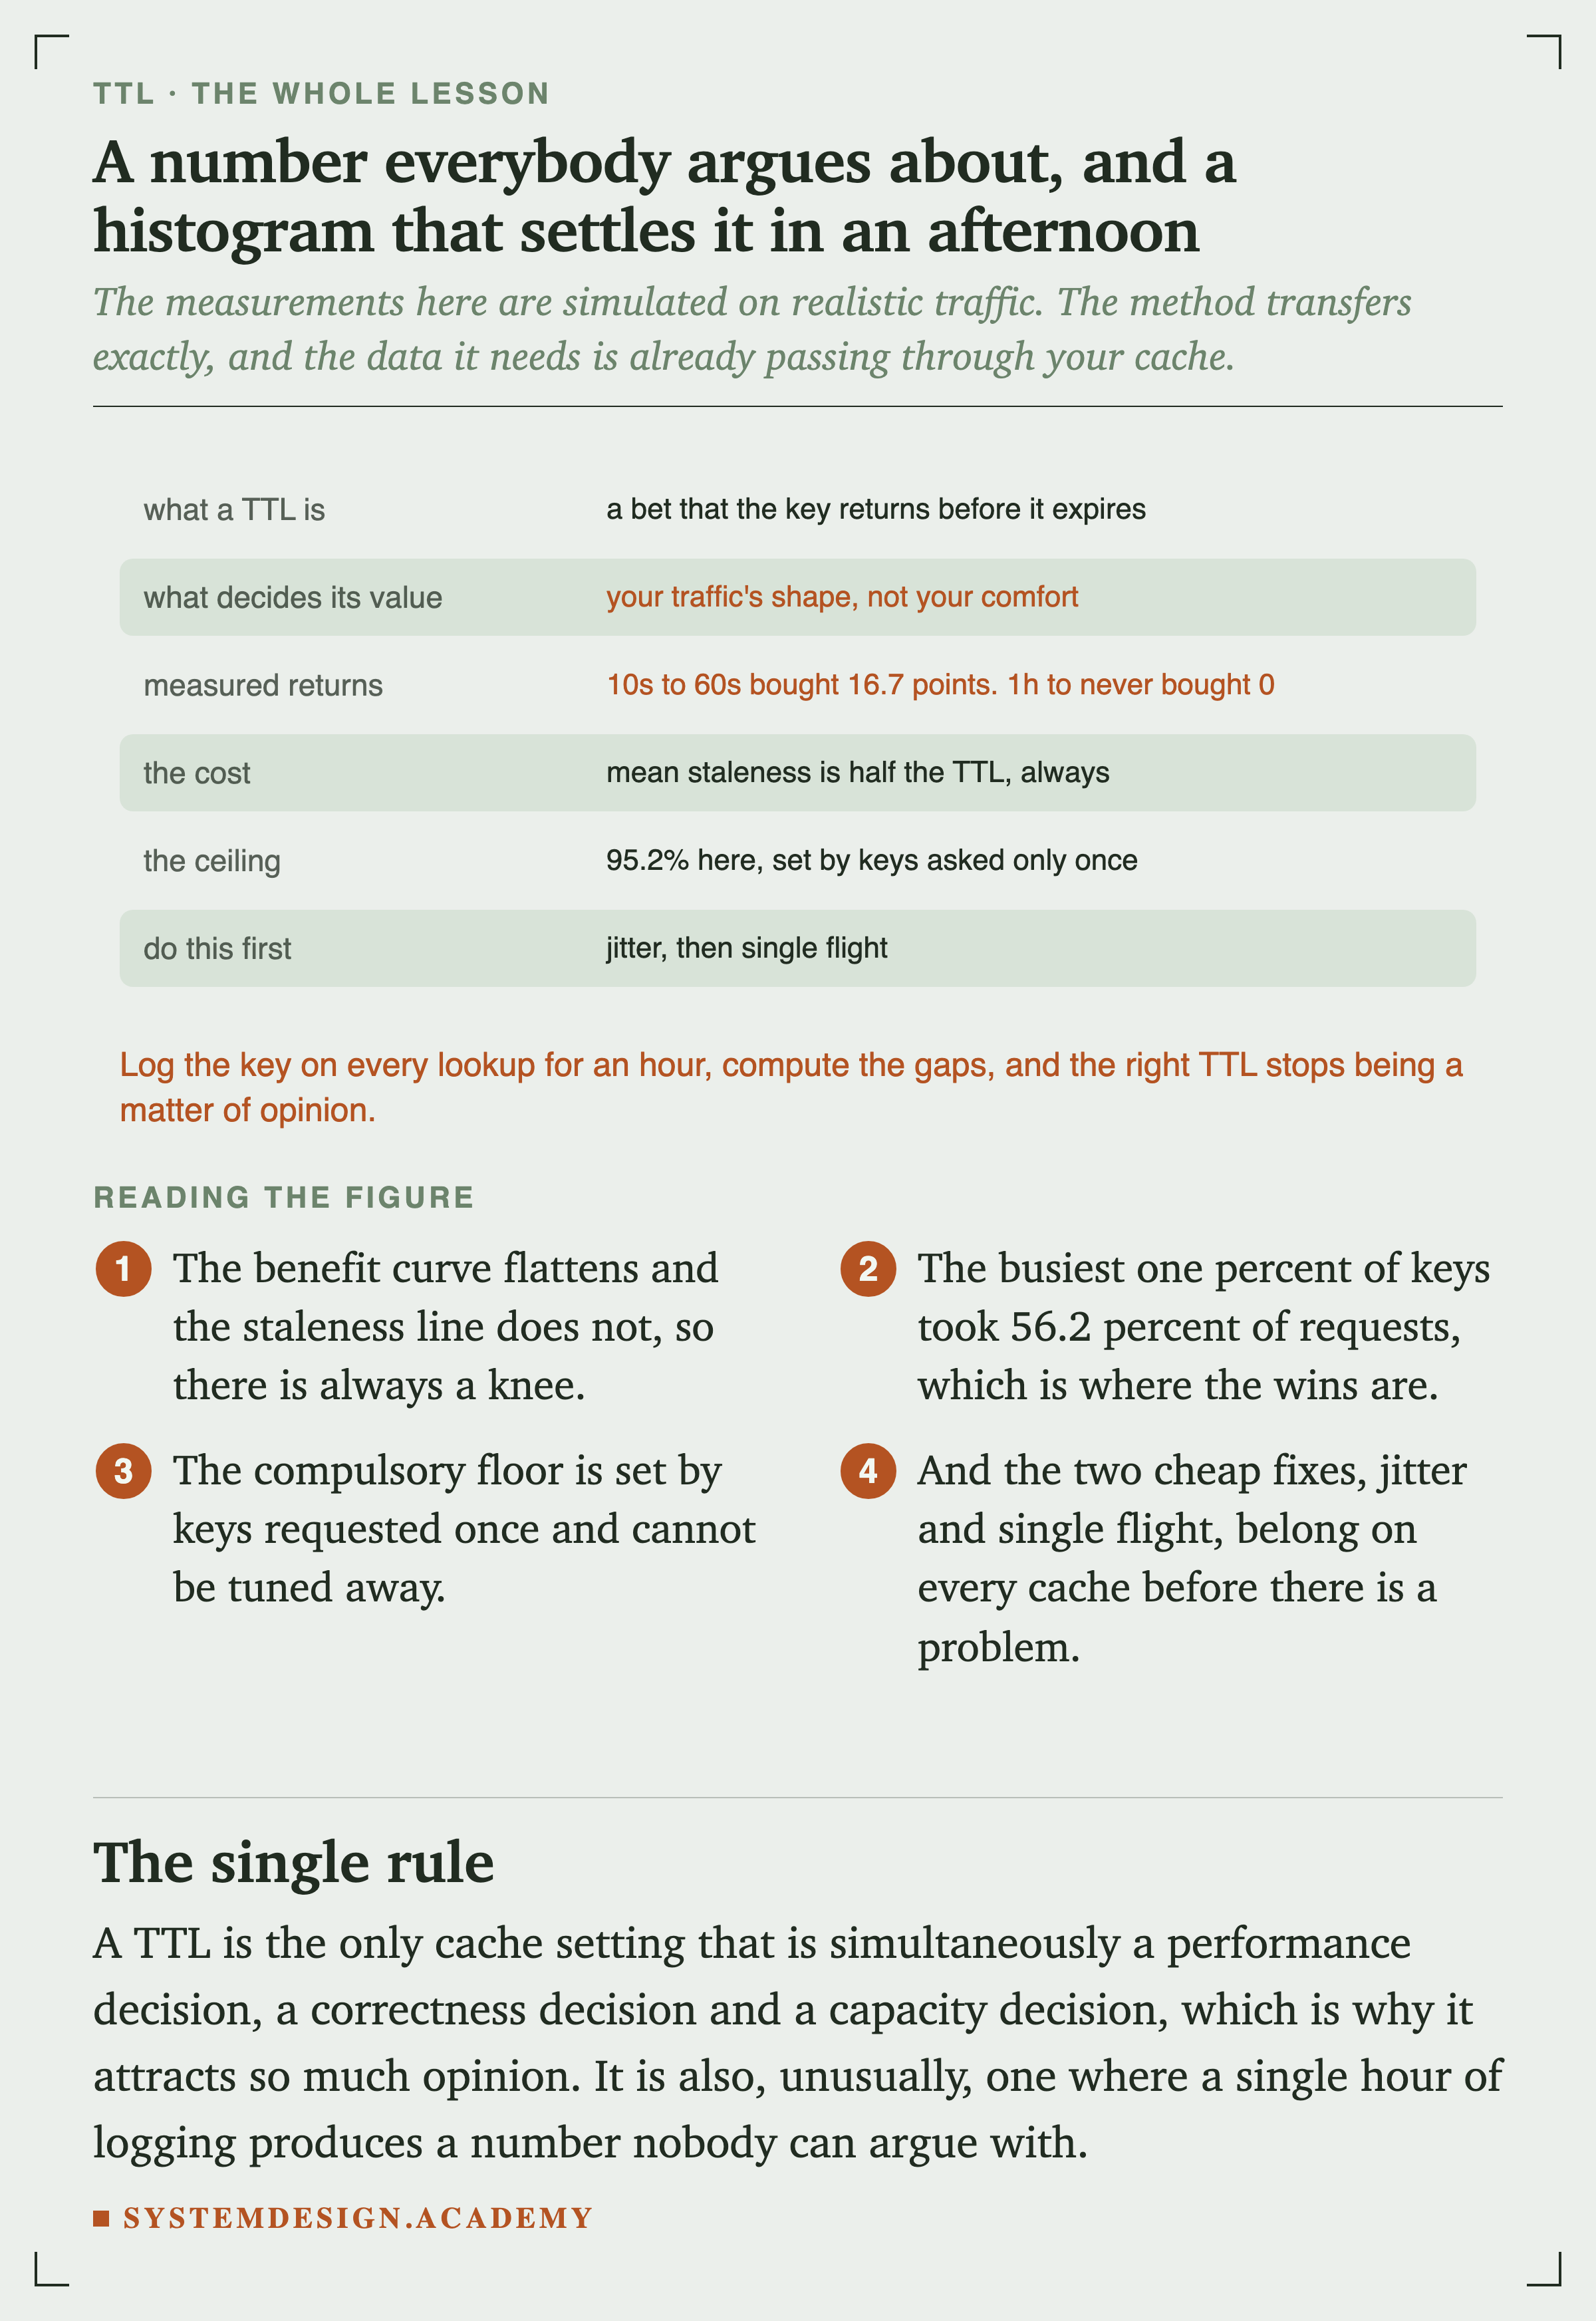
    Six rows summarising the lesson. What a TTL is: a bet that the key returns before it expires. What decides its value: your traffic's shape, not your comfort. Measured returns: 10s to 60s bought 16.7 points, 1h to never bought 0. The cost: mean staleness is half the TTL, always. The ceiling: 95.2 percent here, set by keys asked only once. Do this first: jitter, then single flight.
    FigureFigure 20. A number everybody argues about, and a histogram that settles it

    A TTL is the only cache setting that is simultaneously a performance decision, a correctness decision and a capacity decision, which is why it attracts so much opinion. It is also, unusually, one where a single hour of logging produces a number nobody can argue with.

    after “Choosing, and Then Measuring”

    If this section made sense, the next step is close by.

    The System Design course gives this its own lesson: Cache Invalidation.

    25 minutes that turn this section into an answer you can defend.

    See the System Design course $49 once, lifetime access