Thirty Traces, Thirty Passes, Nothing Learned
Take thirty real traces. They are the ones captured for the chapter: ten questions, three runs each, with the real similarity score of every document the retriever brought back.
Put a reasonable metric on them. "Did retrieval put the right document in the context window?" It is the first thing most teams measure, and it is the right question to ask.
The answer is yes. Thirty times out of thirty.
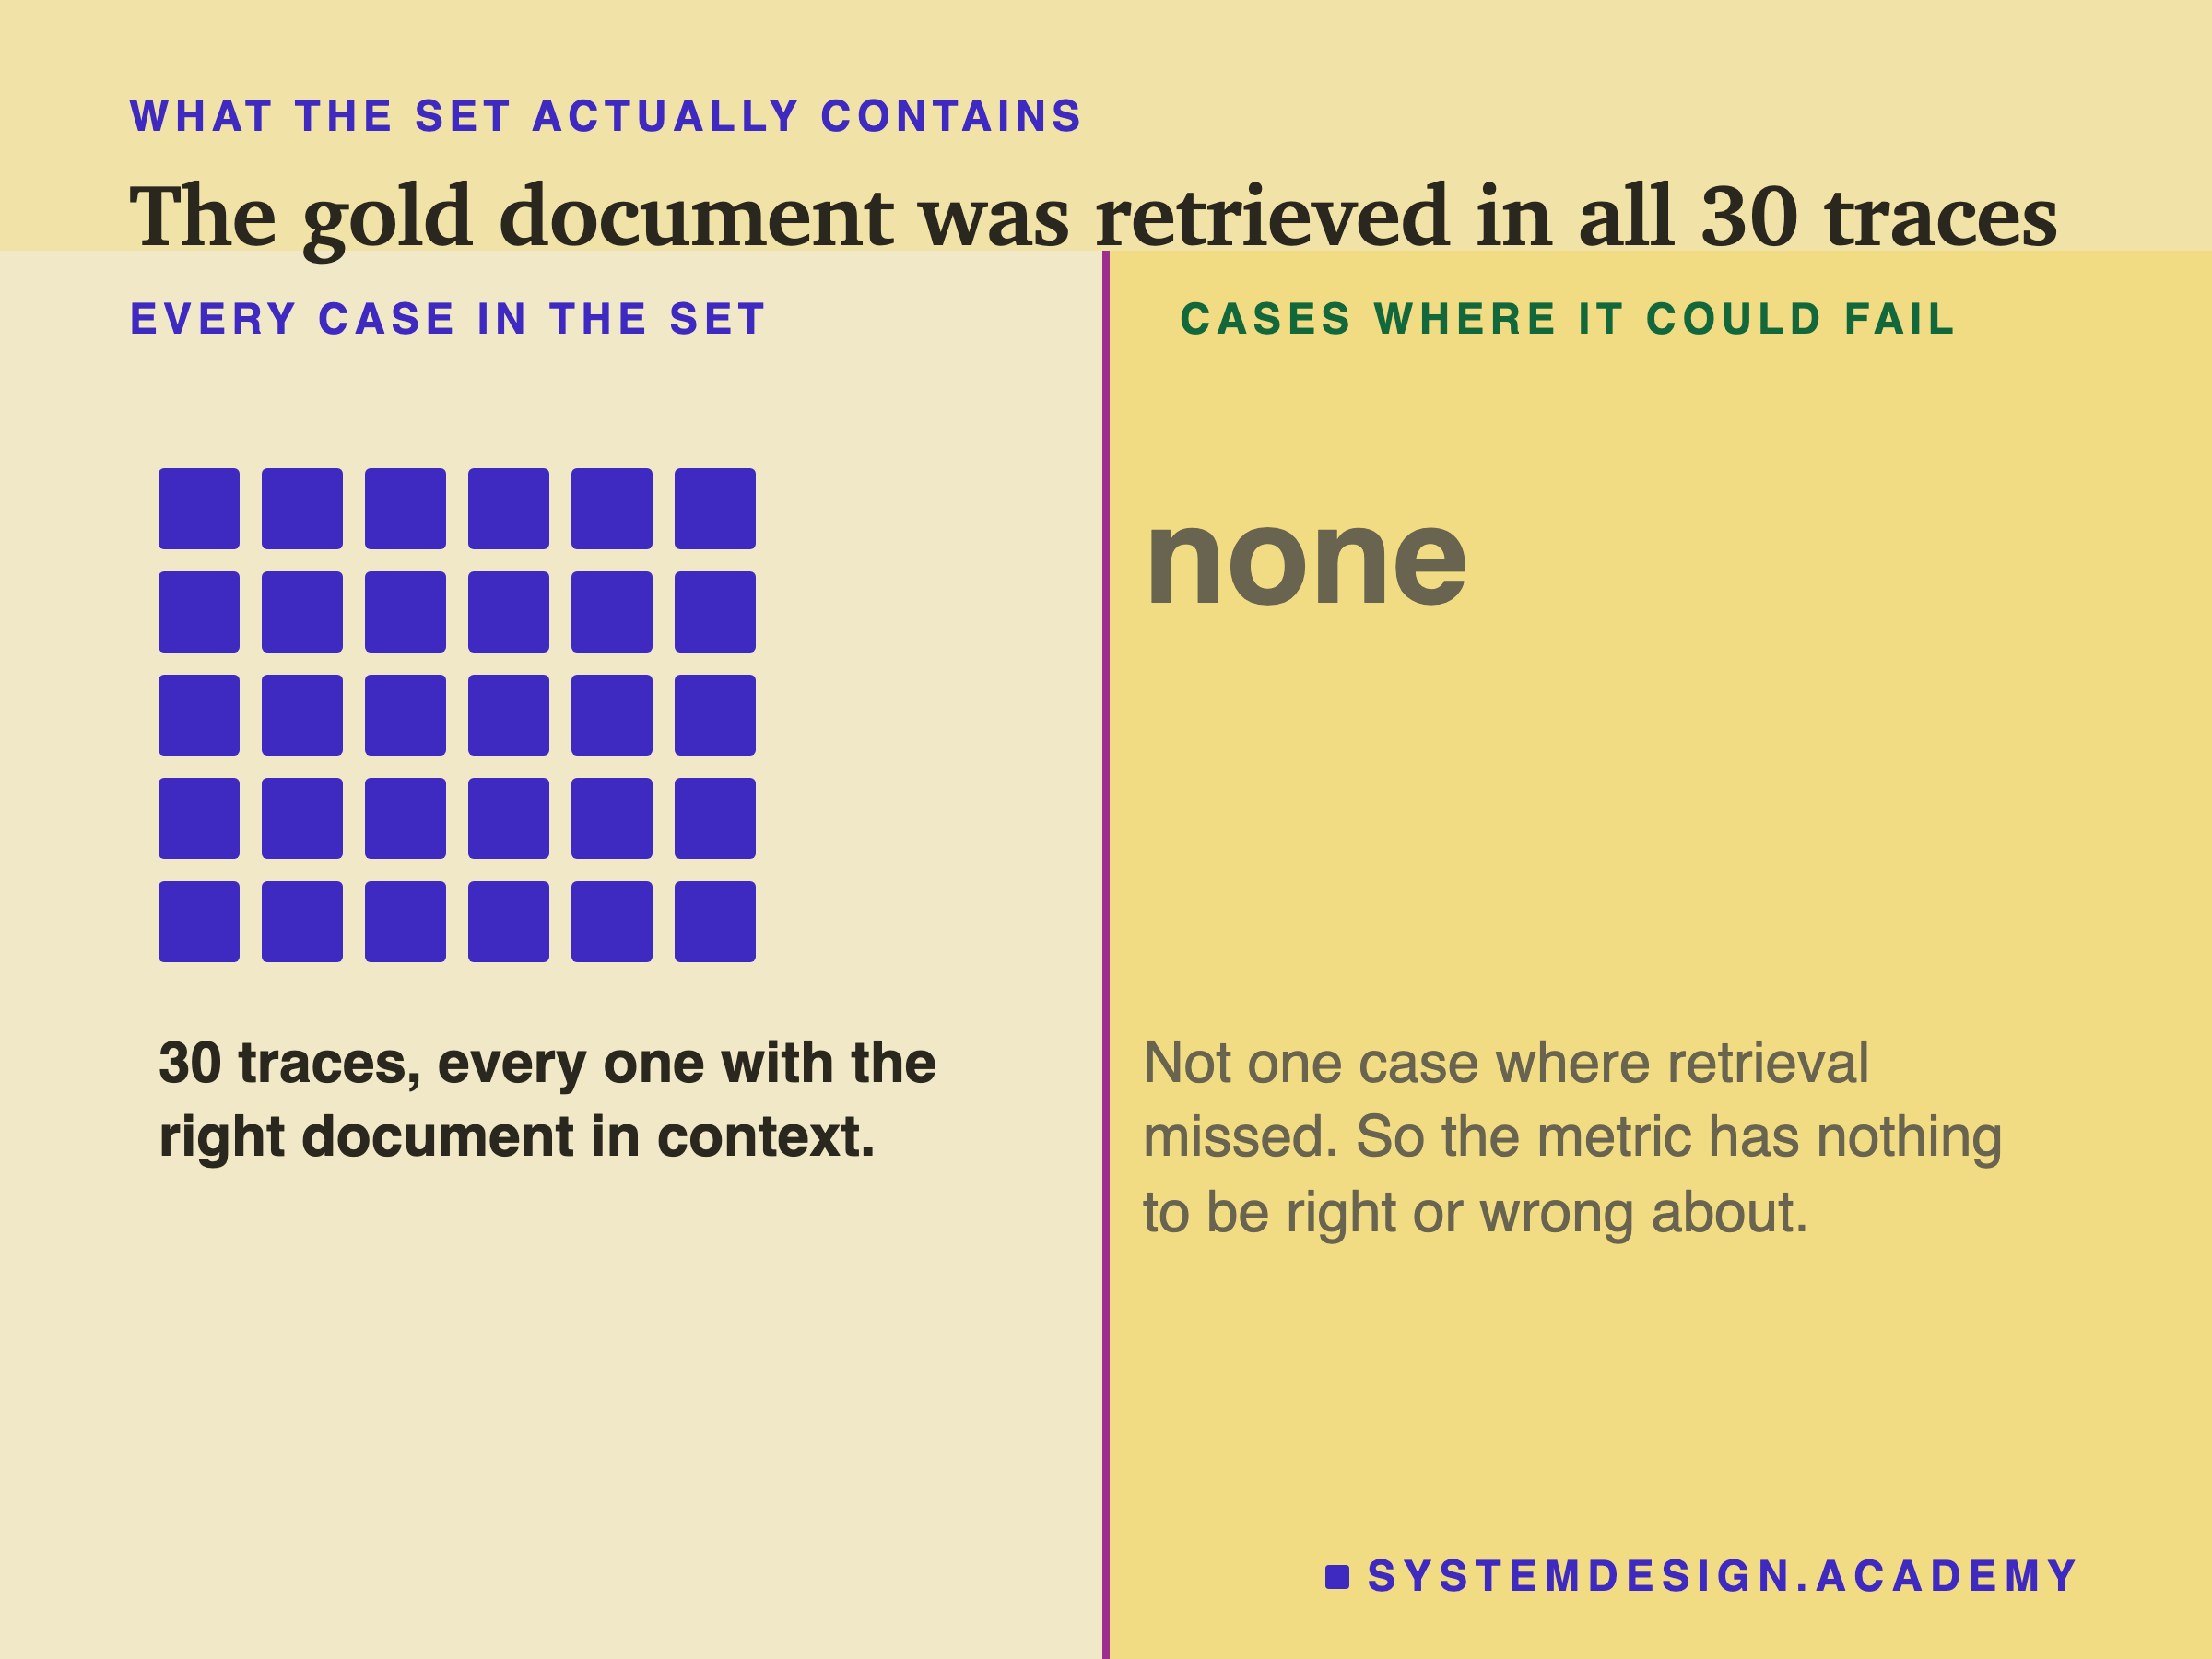
That number has a property worth naming. Its variance is zero. The metric never once took a different value, so nothing about it can move, so nothing about it can tell you anything. If the retriever got worse tomorrow, this metric would have to drop below 30 of 30 to say so. But the set contains no case where it ever did, so nobody knows whether it can.
A Metric That Cannot Fail Cannot Detect
This is the trap, and it is quiet because the dashboard looks healthy.
A green metric means one of two things. Either the system is handling the hard cases, or the set contains no hard cases. From the metric alone you cannot tell which, and the two look identical on a chart.
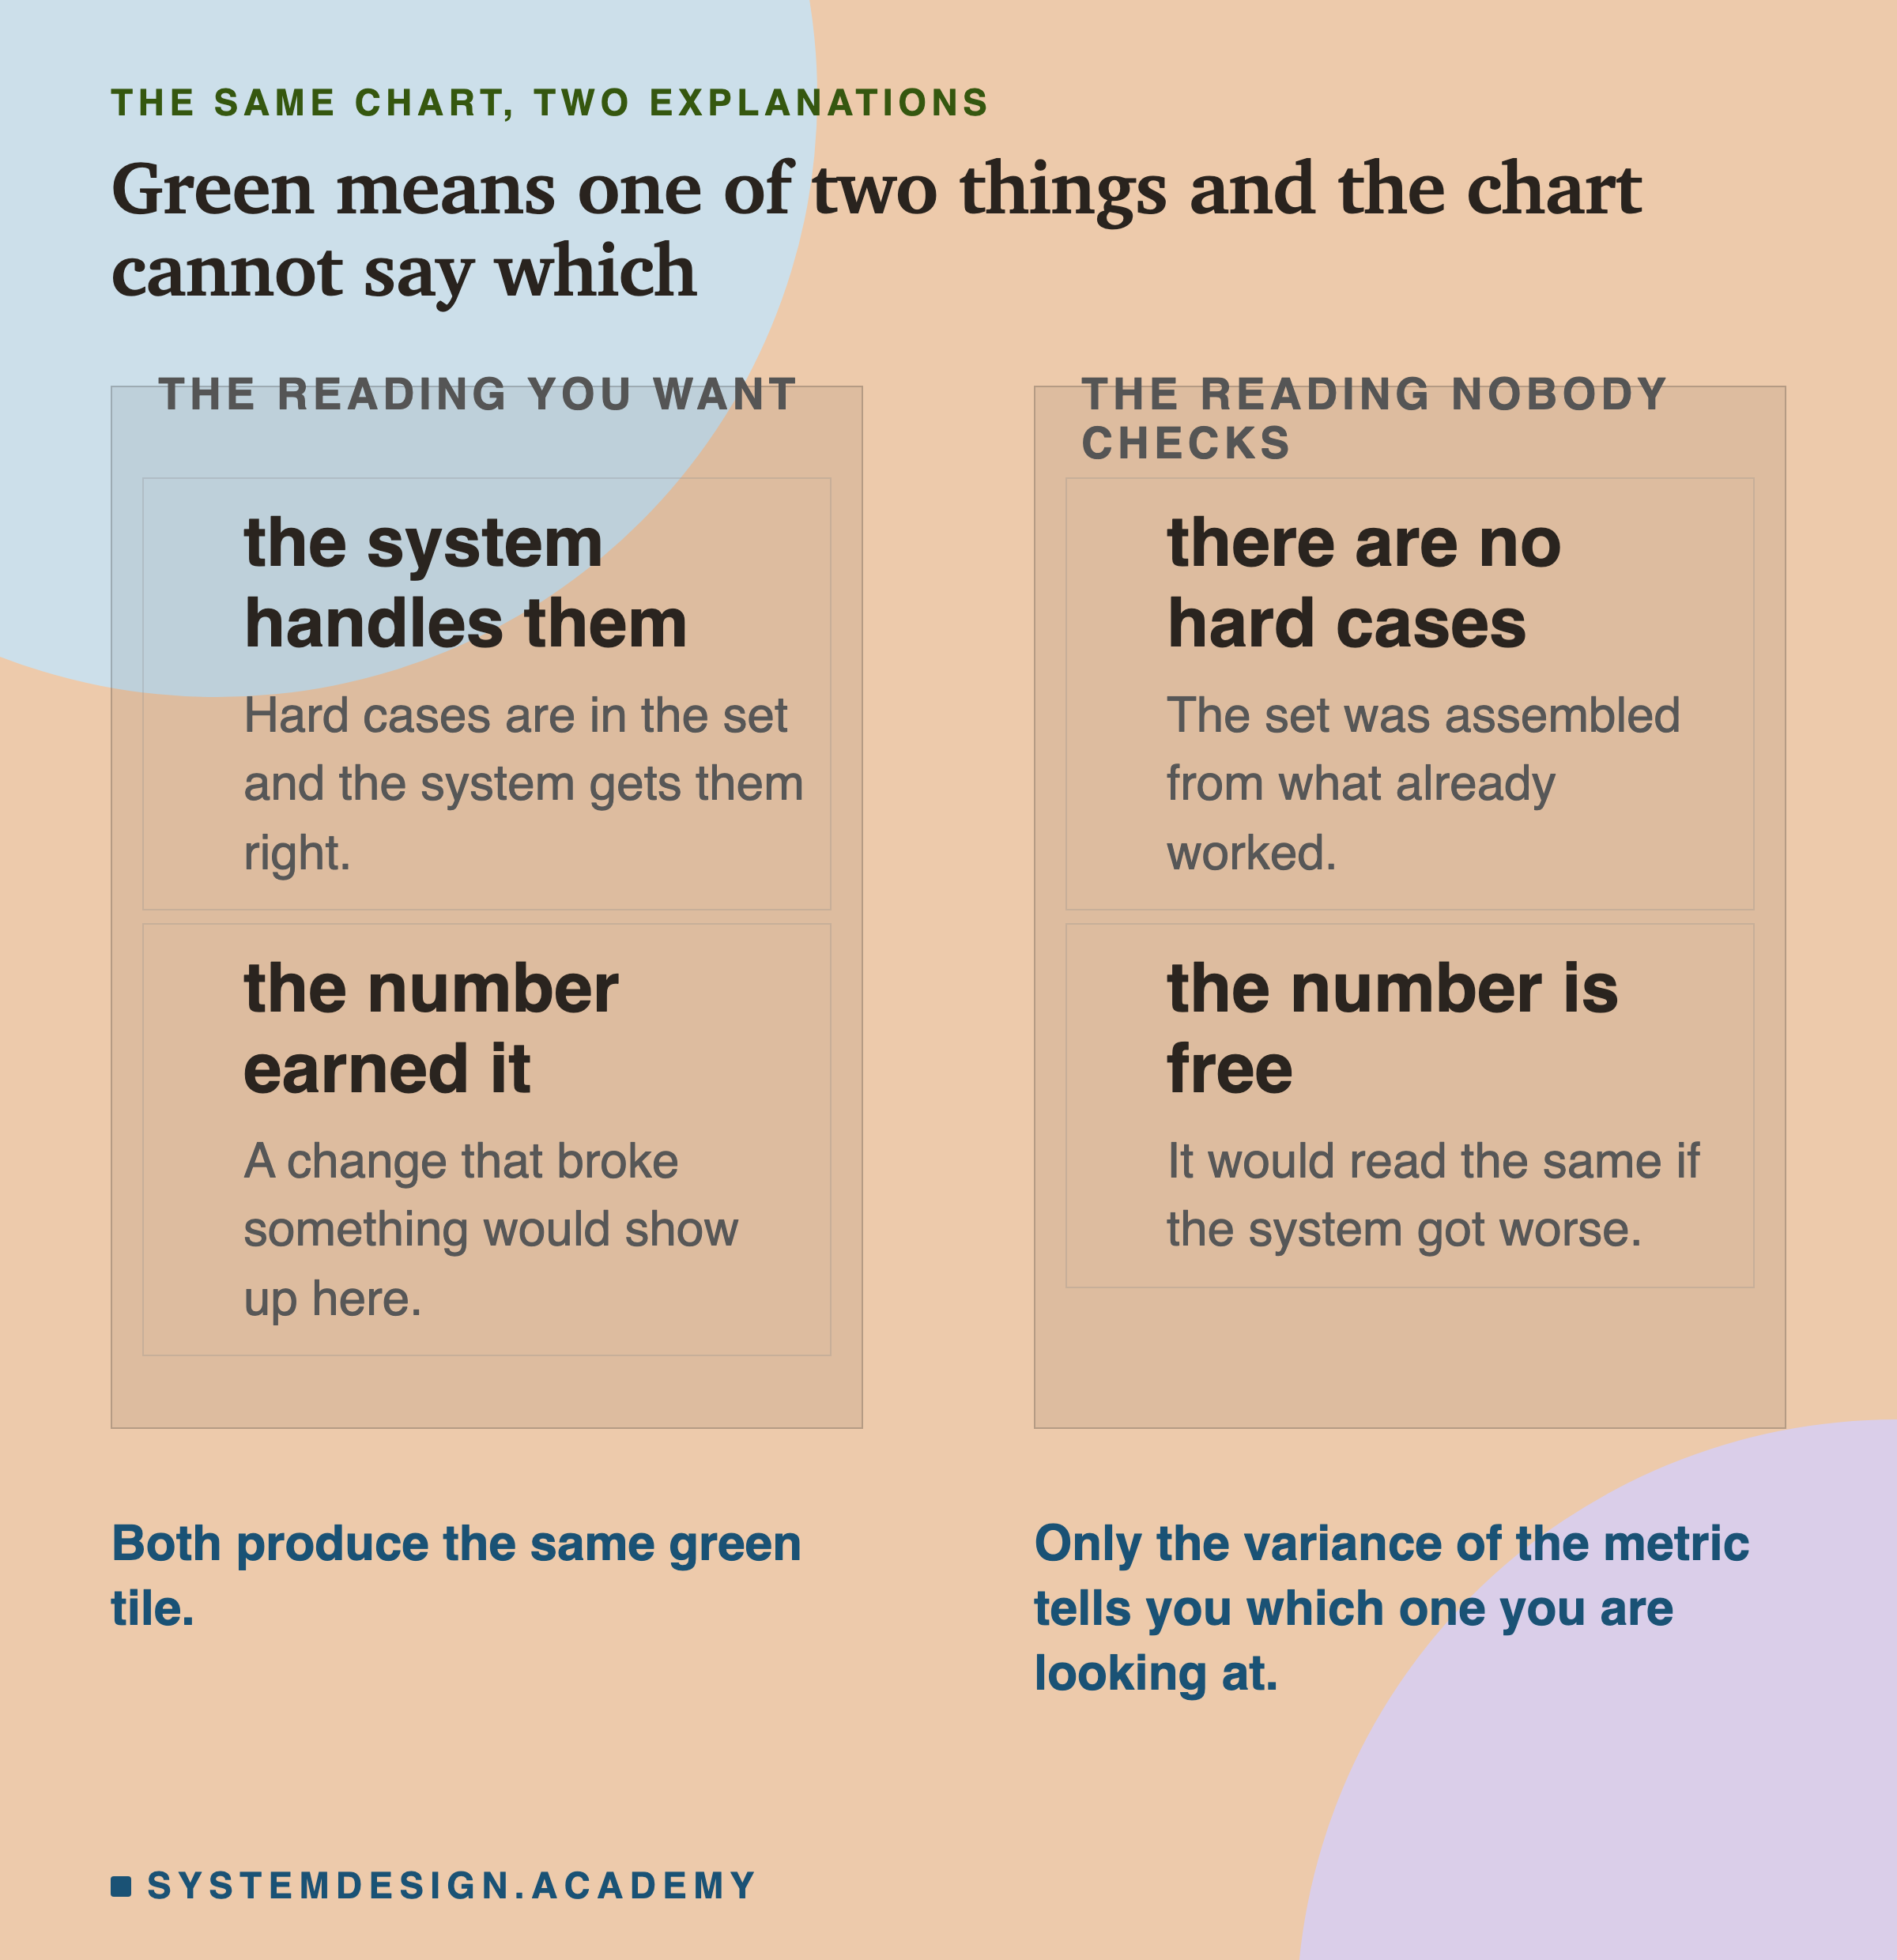
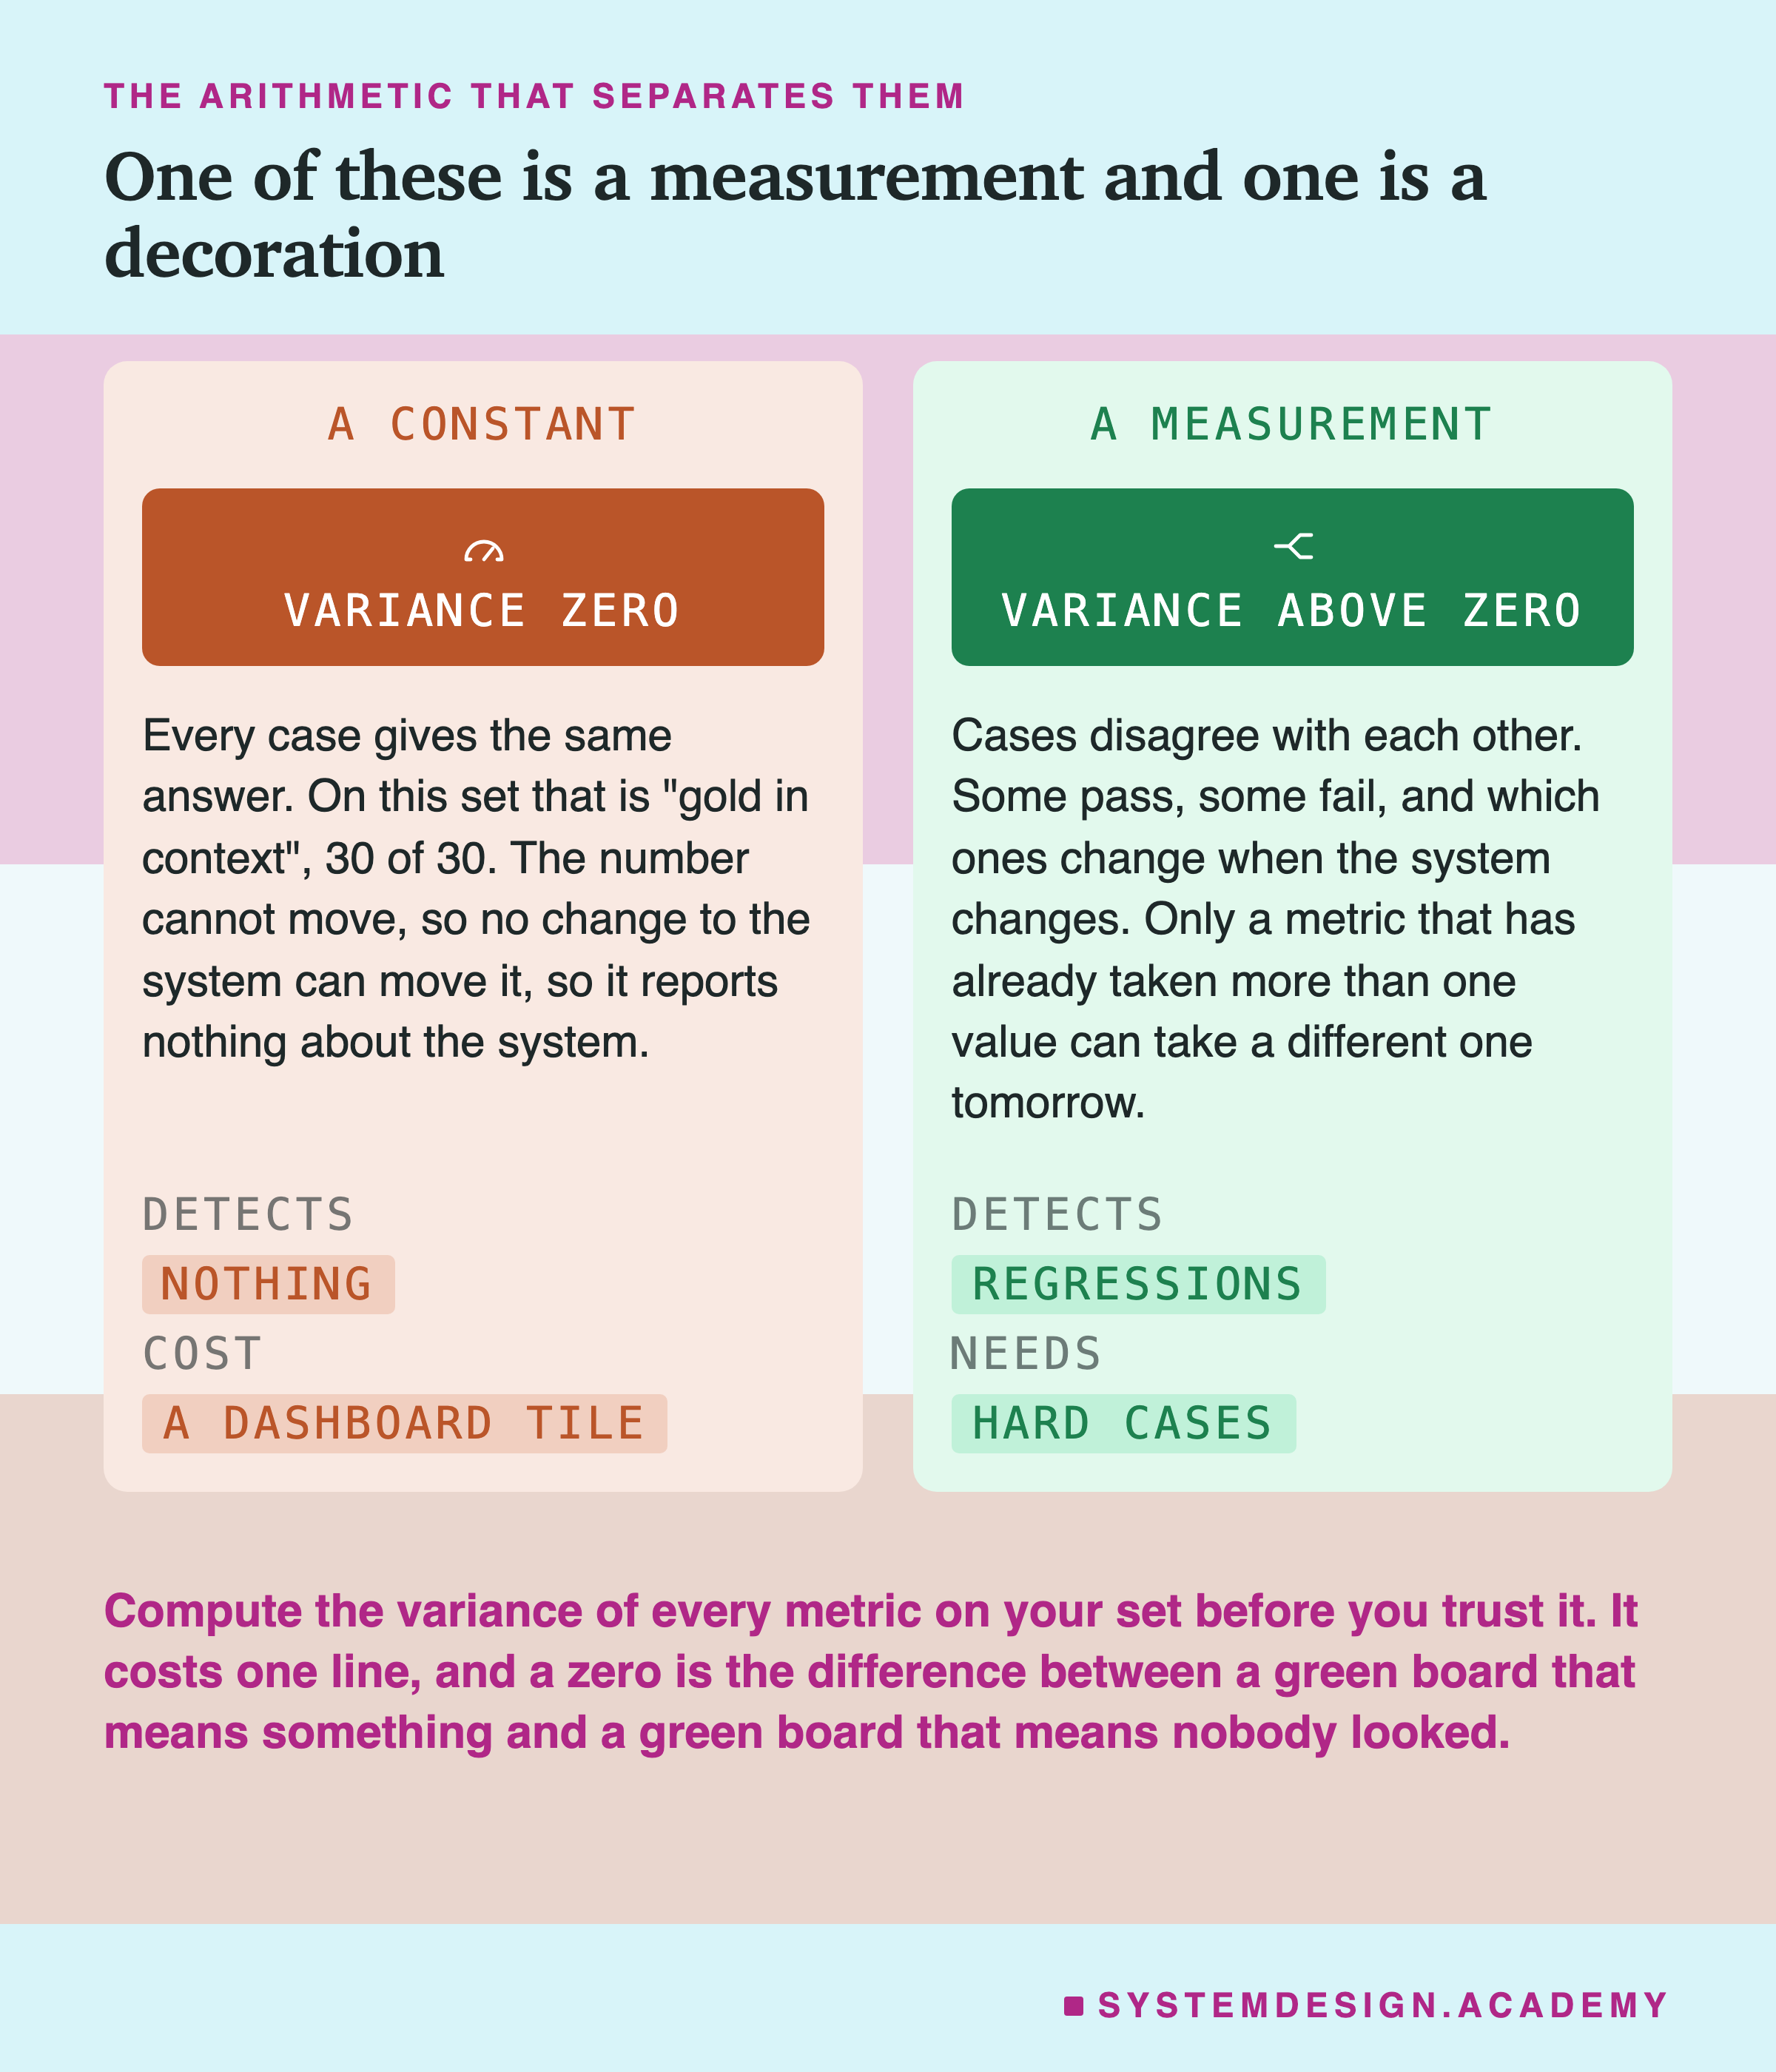
The test is arithmetic. Compute the variance of the metric across your set. If it is zero, the metric is a constant, and a constant is not a measurement.
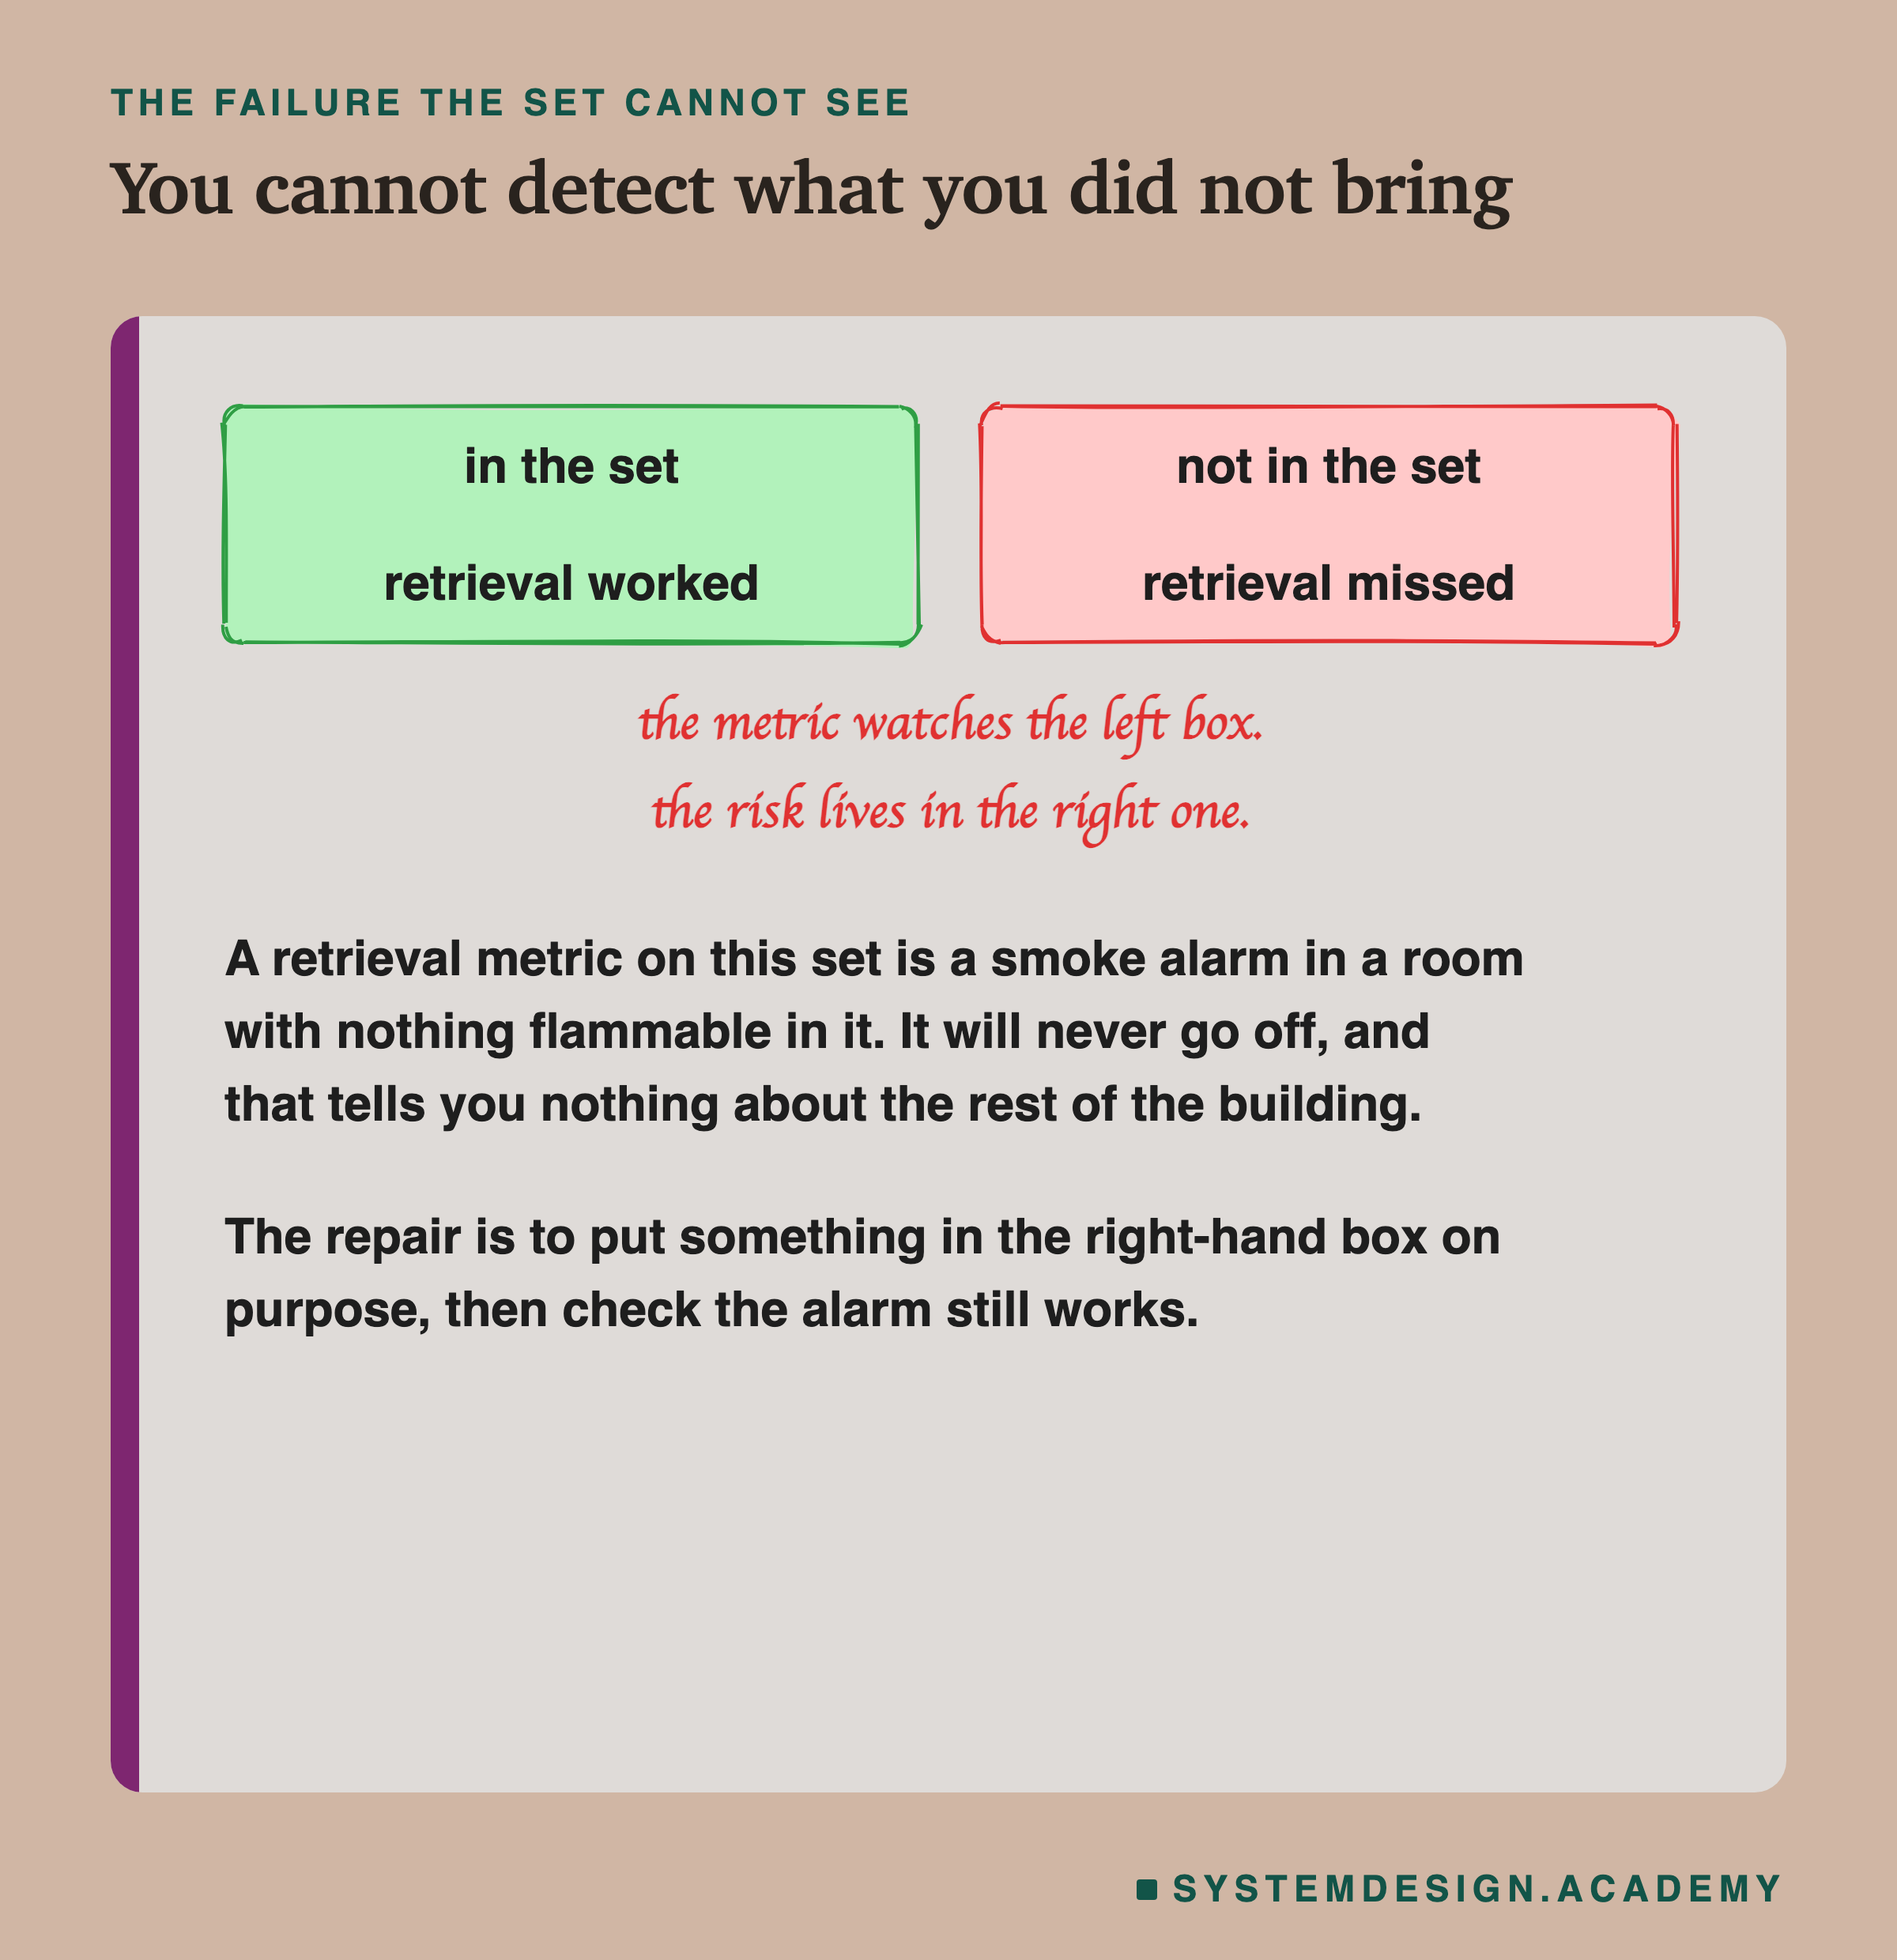
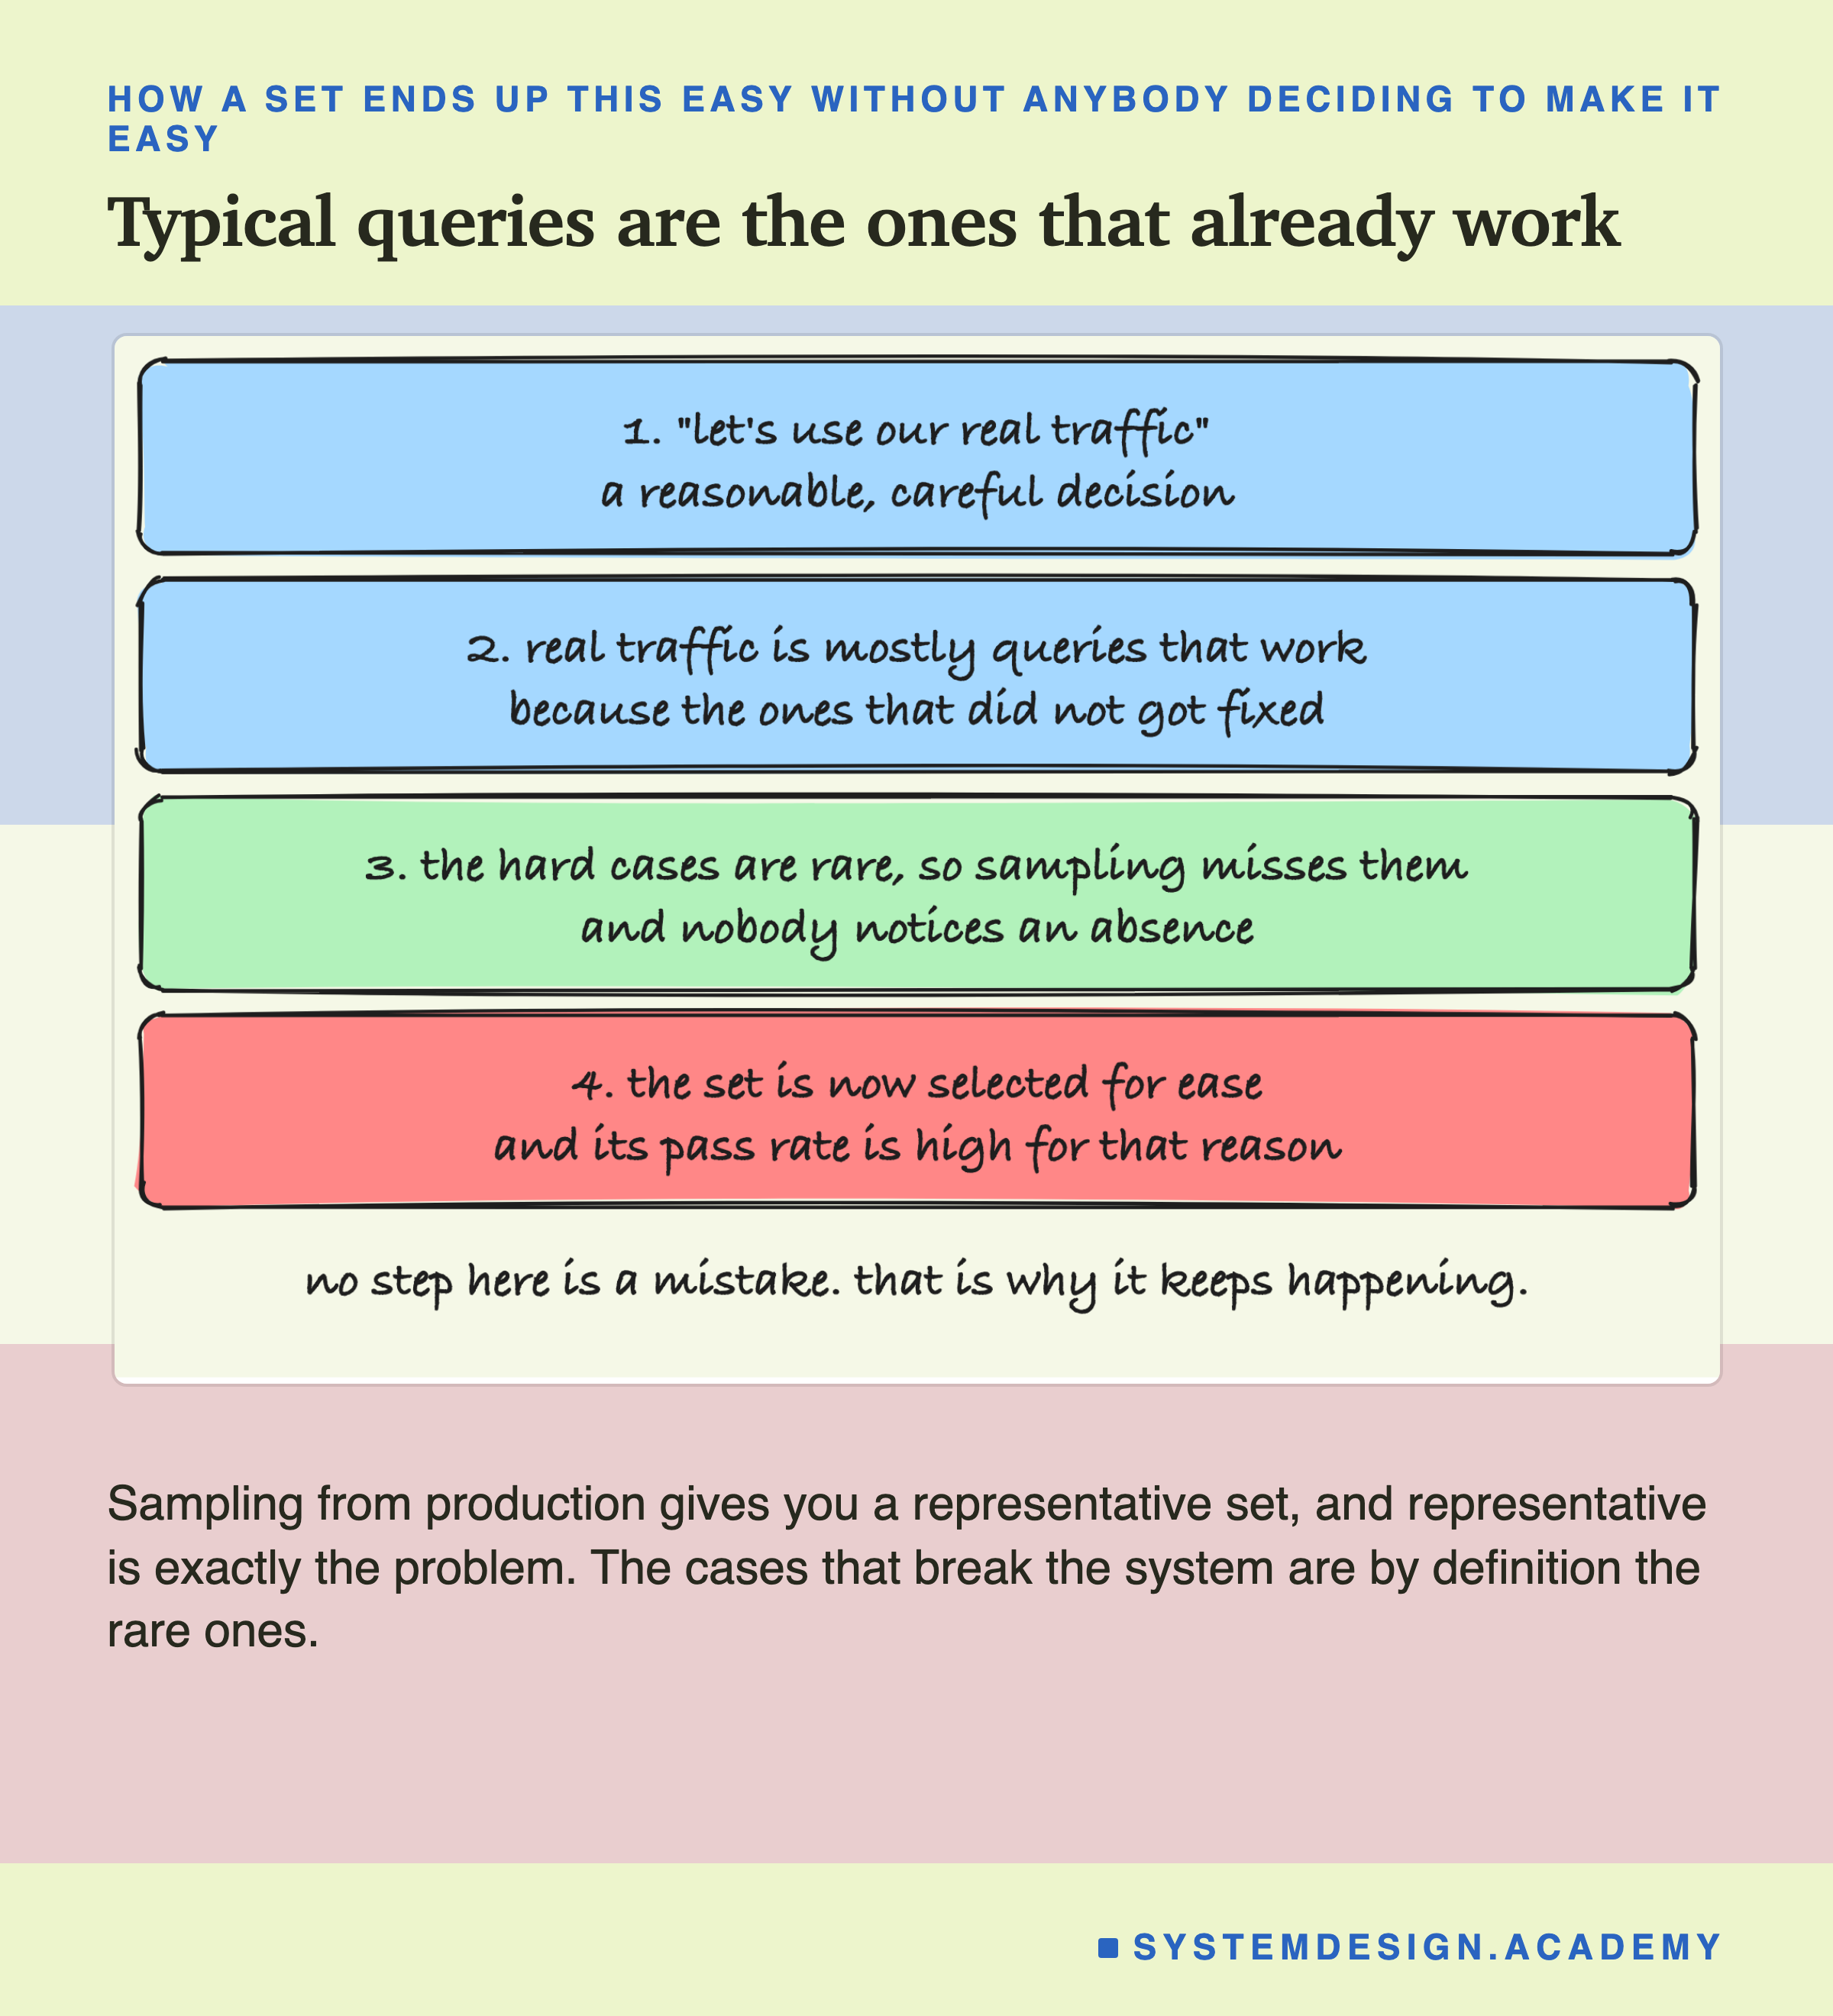
There is a second, softer version of the same problem. The metric does vary, but only a little, and every case that made it vary is one you already fixed. The set then measures your history rather than your risk.
Not Every Pass Is the Same Pass
The second thing the thirty traces hide is that a pass carries no information about how close it was.
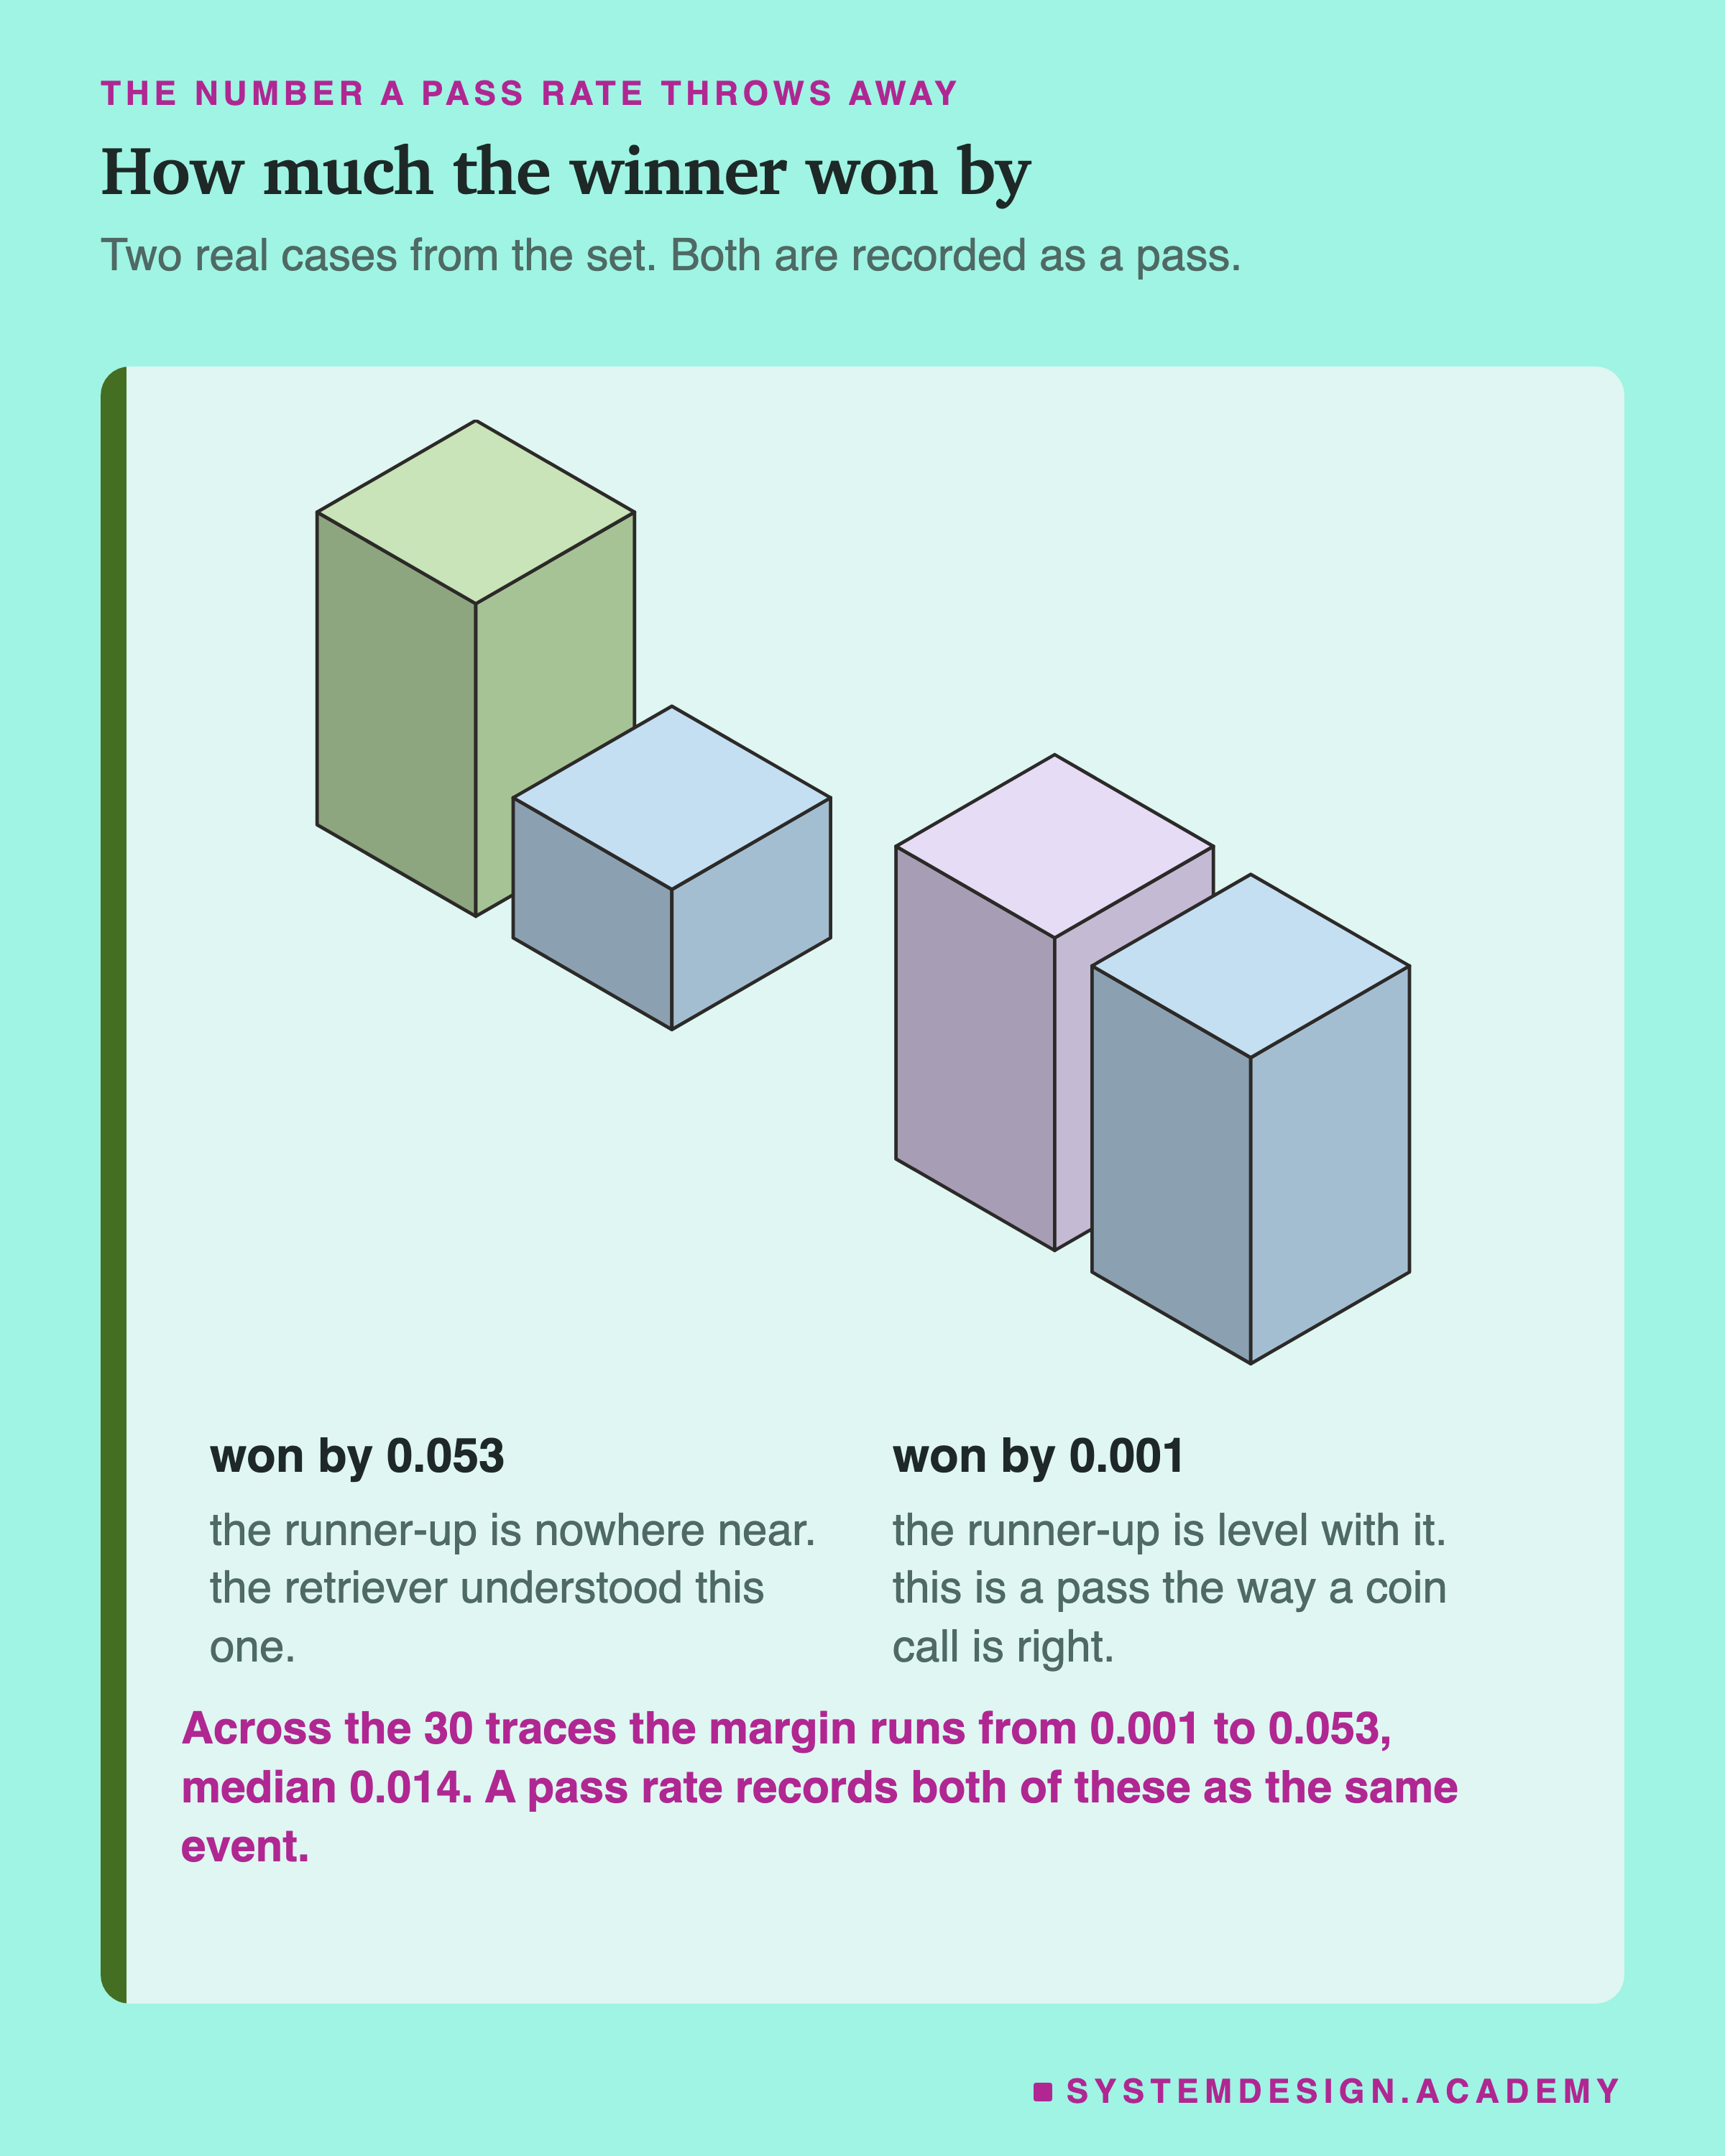
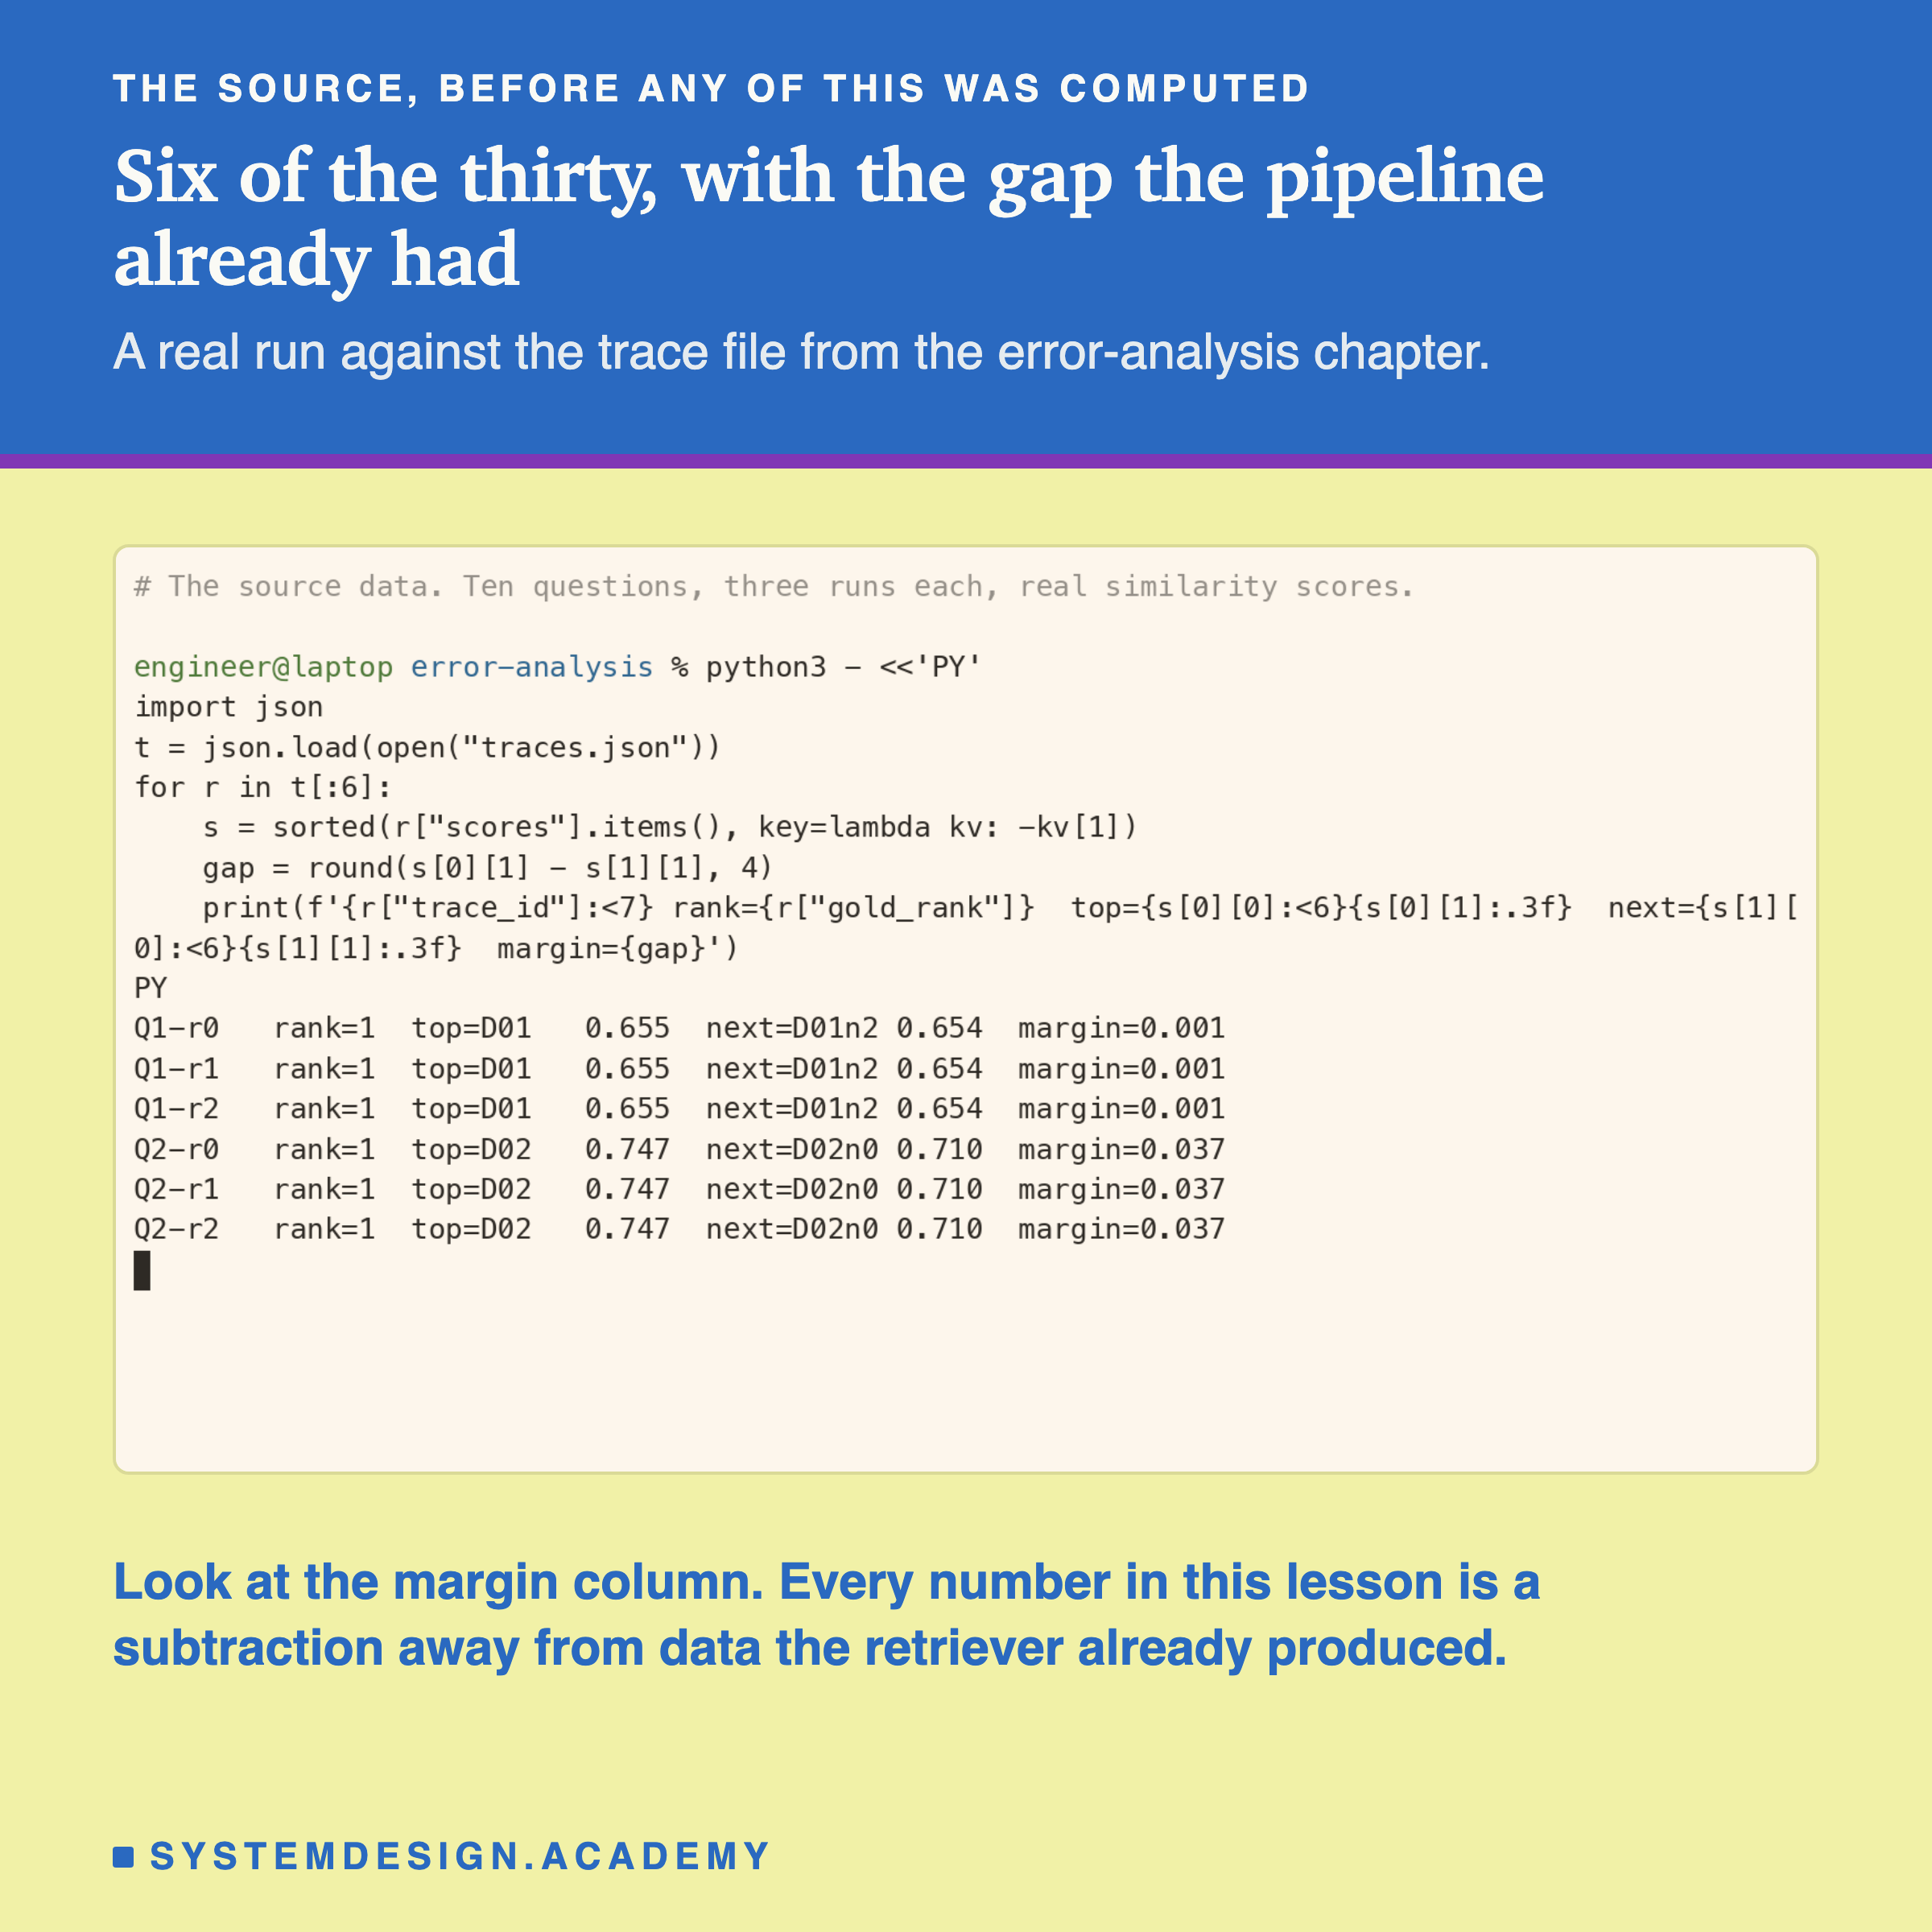
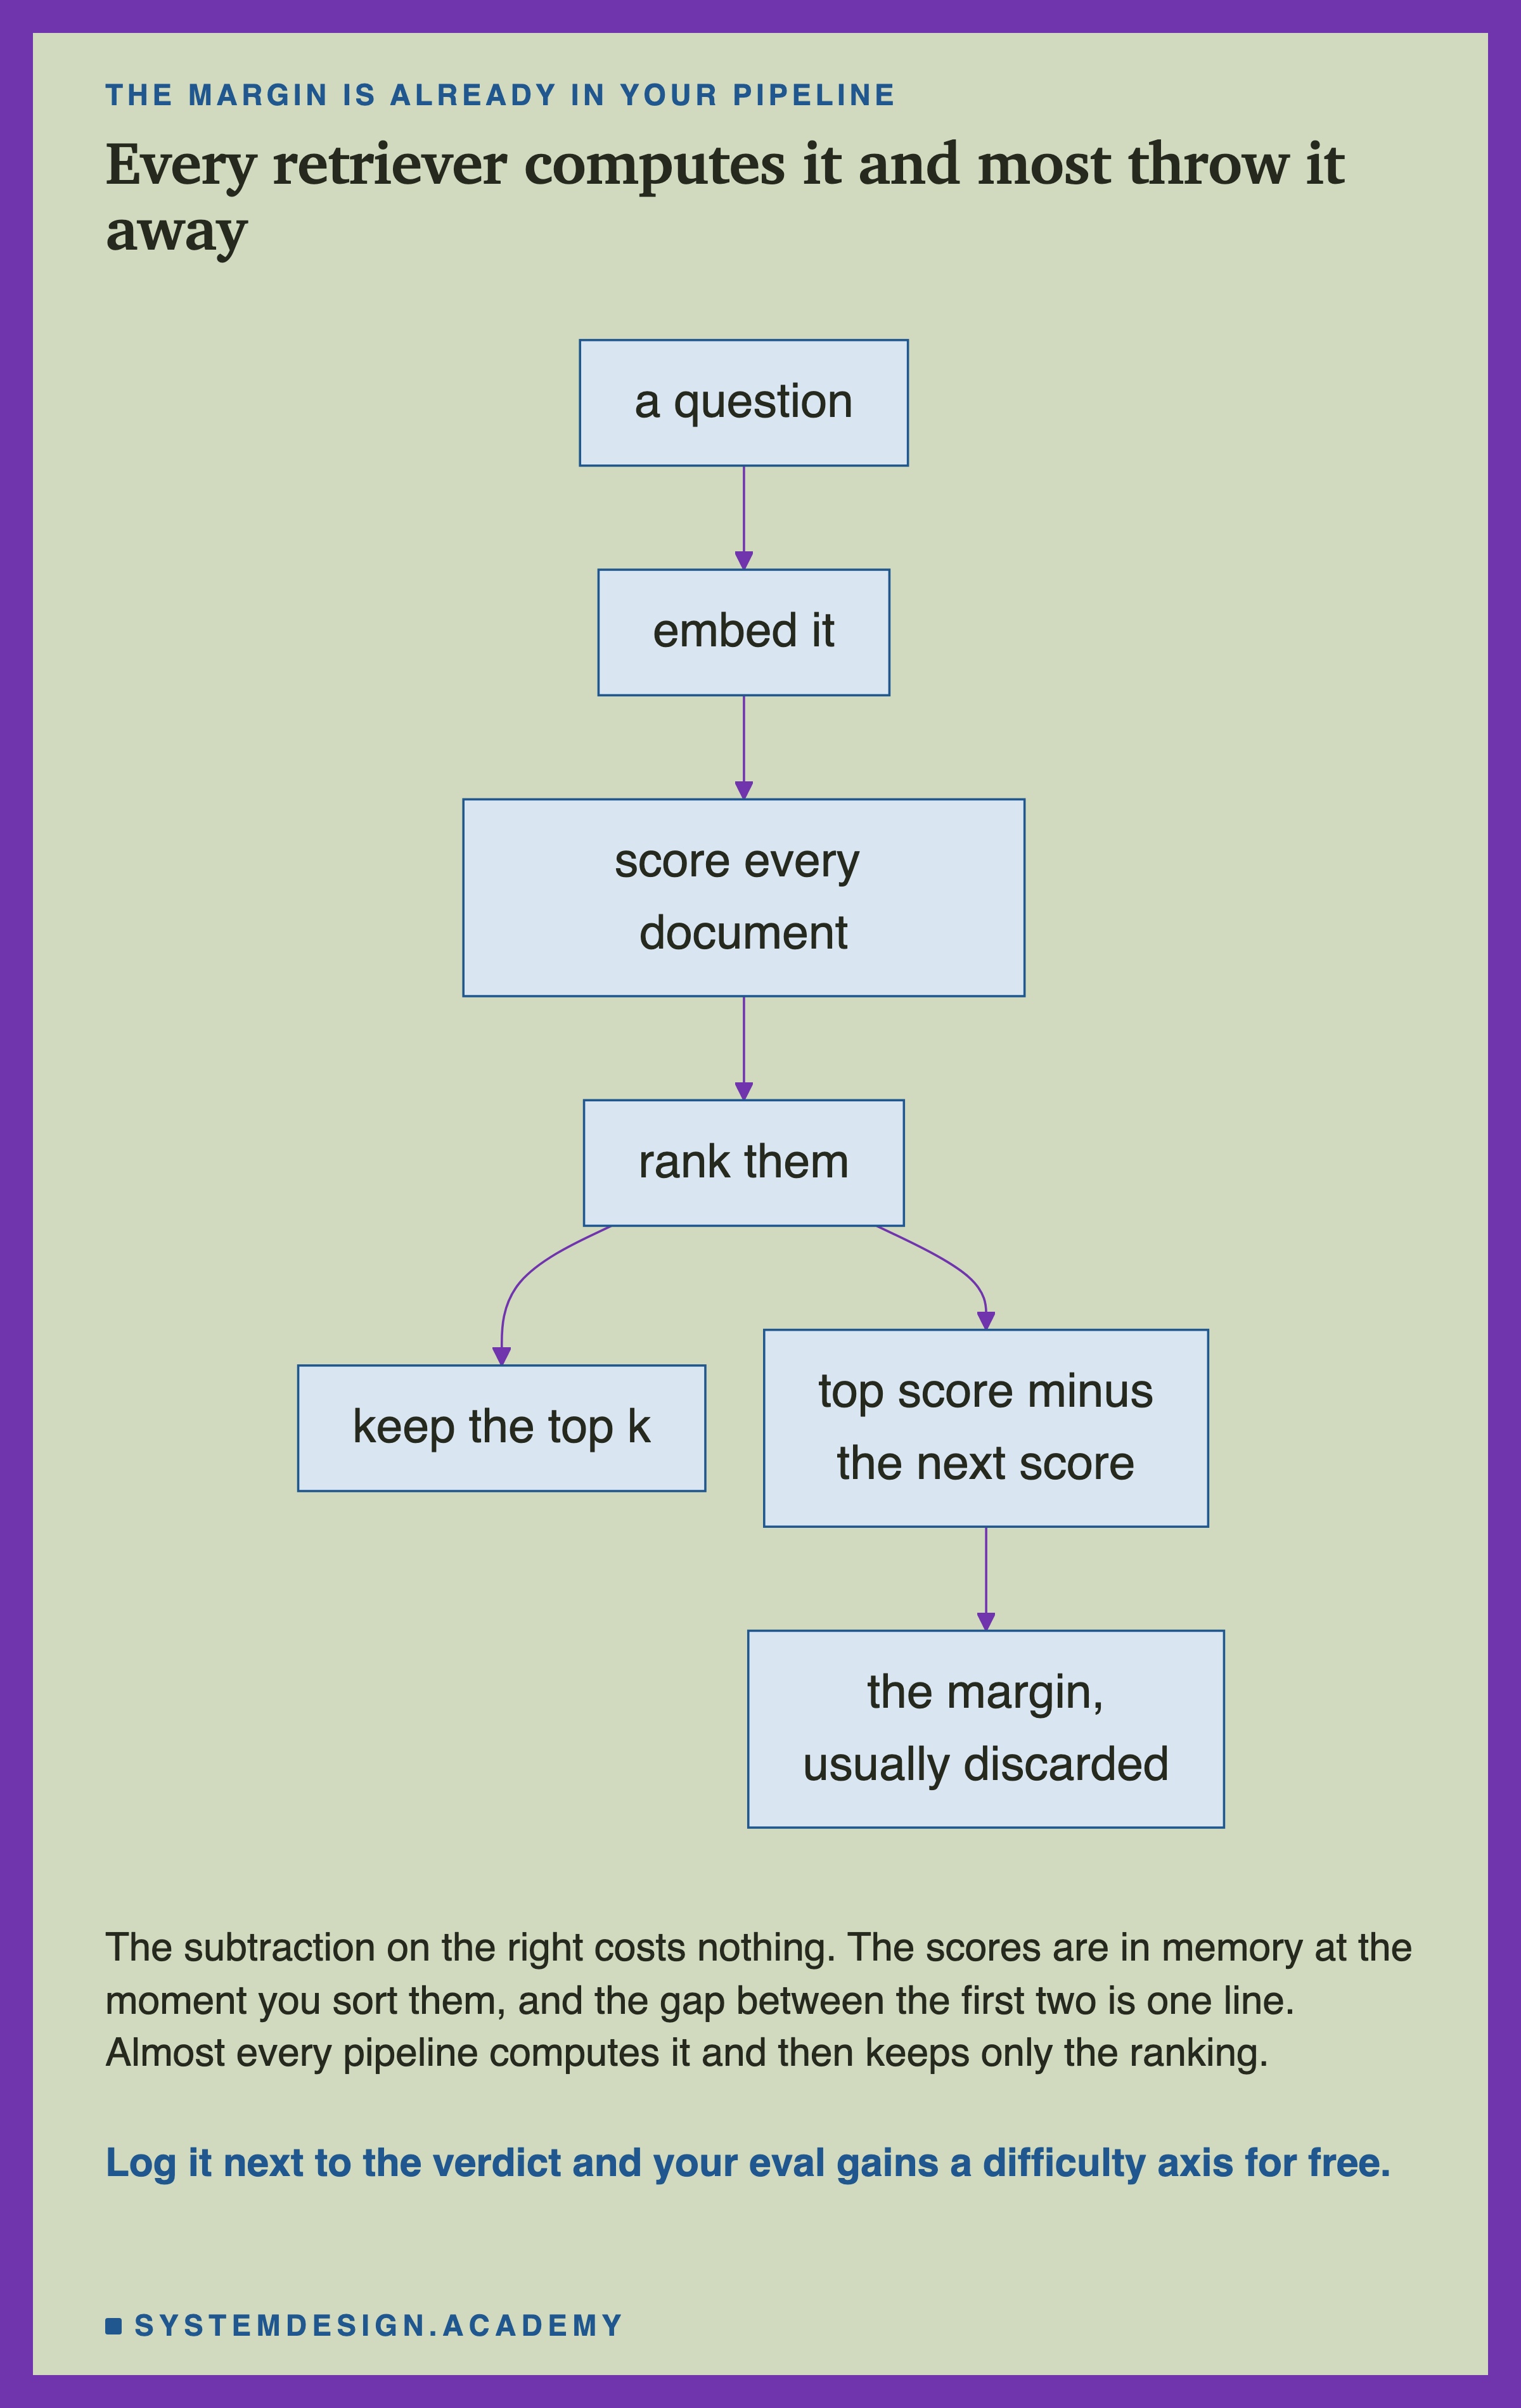
For each trace there is a top-scoring document and a runner-up. The gap between them is the margin. It is the amount by which the system got the answer right.
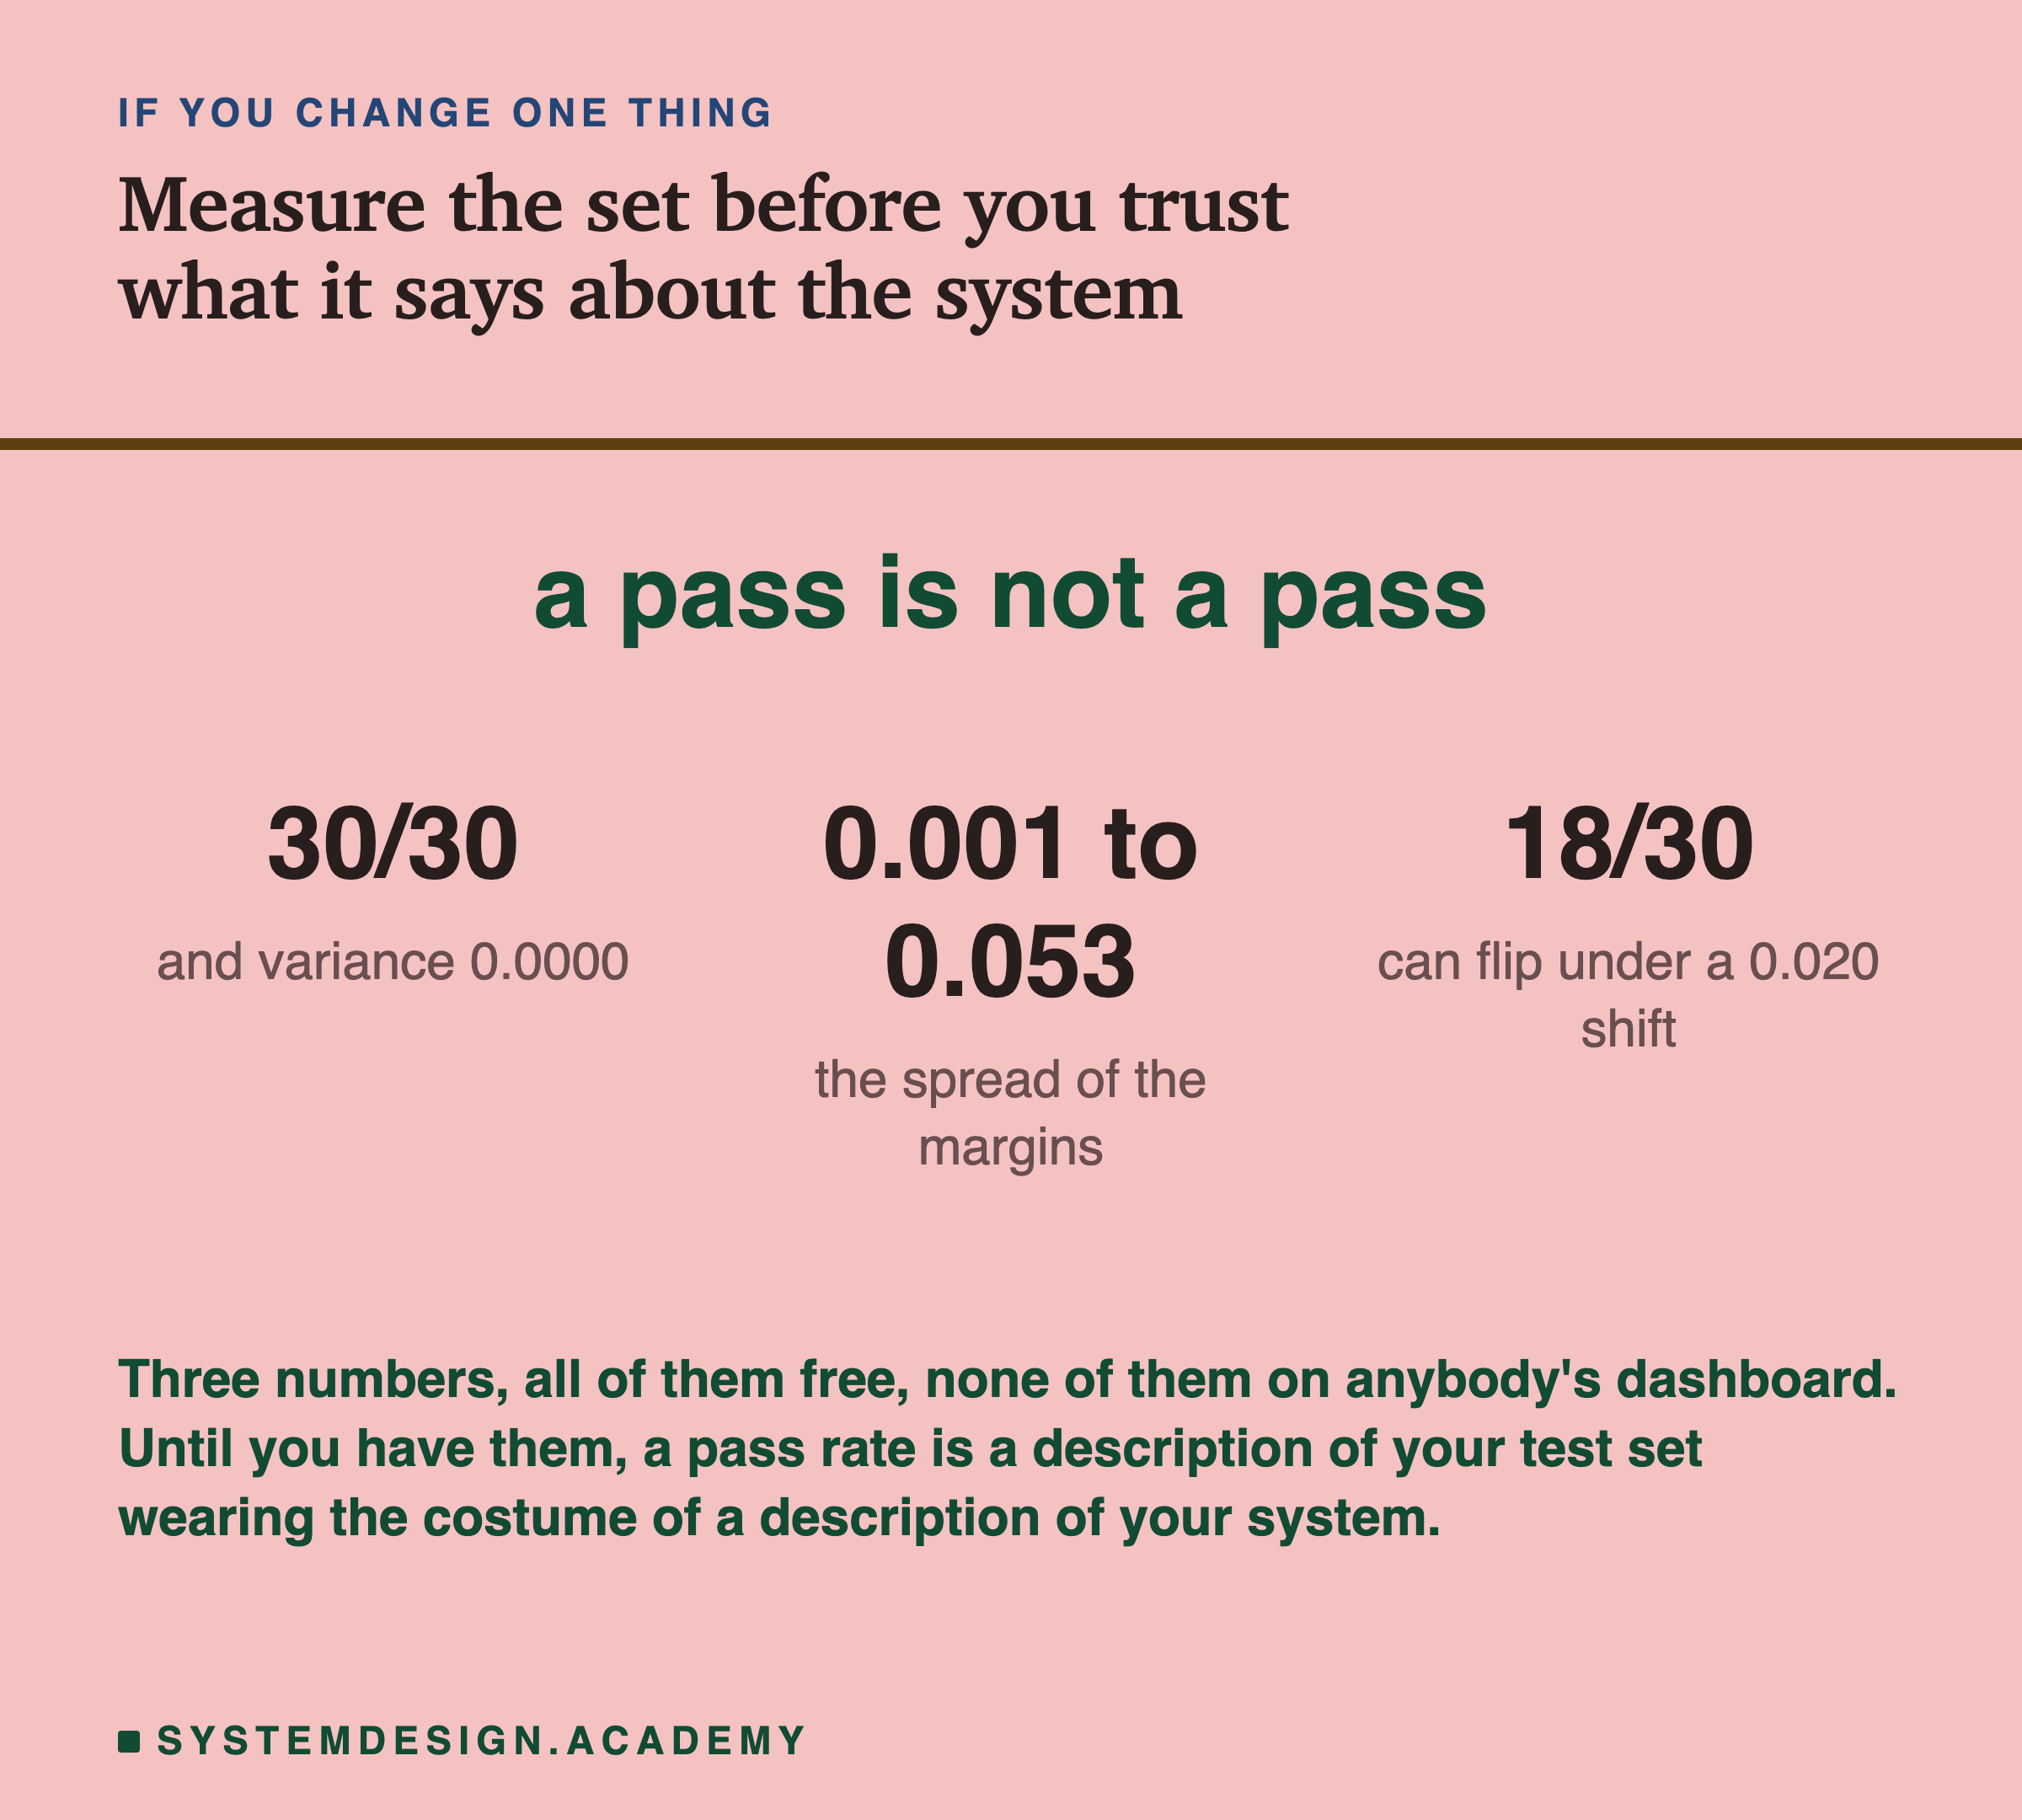
Across these thirty traces the margin runs from 0.001 to 0.053, with a median of 0.014.
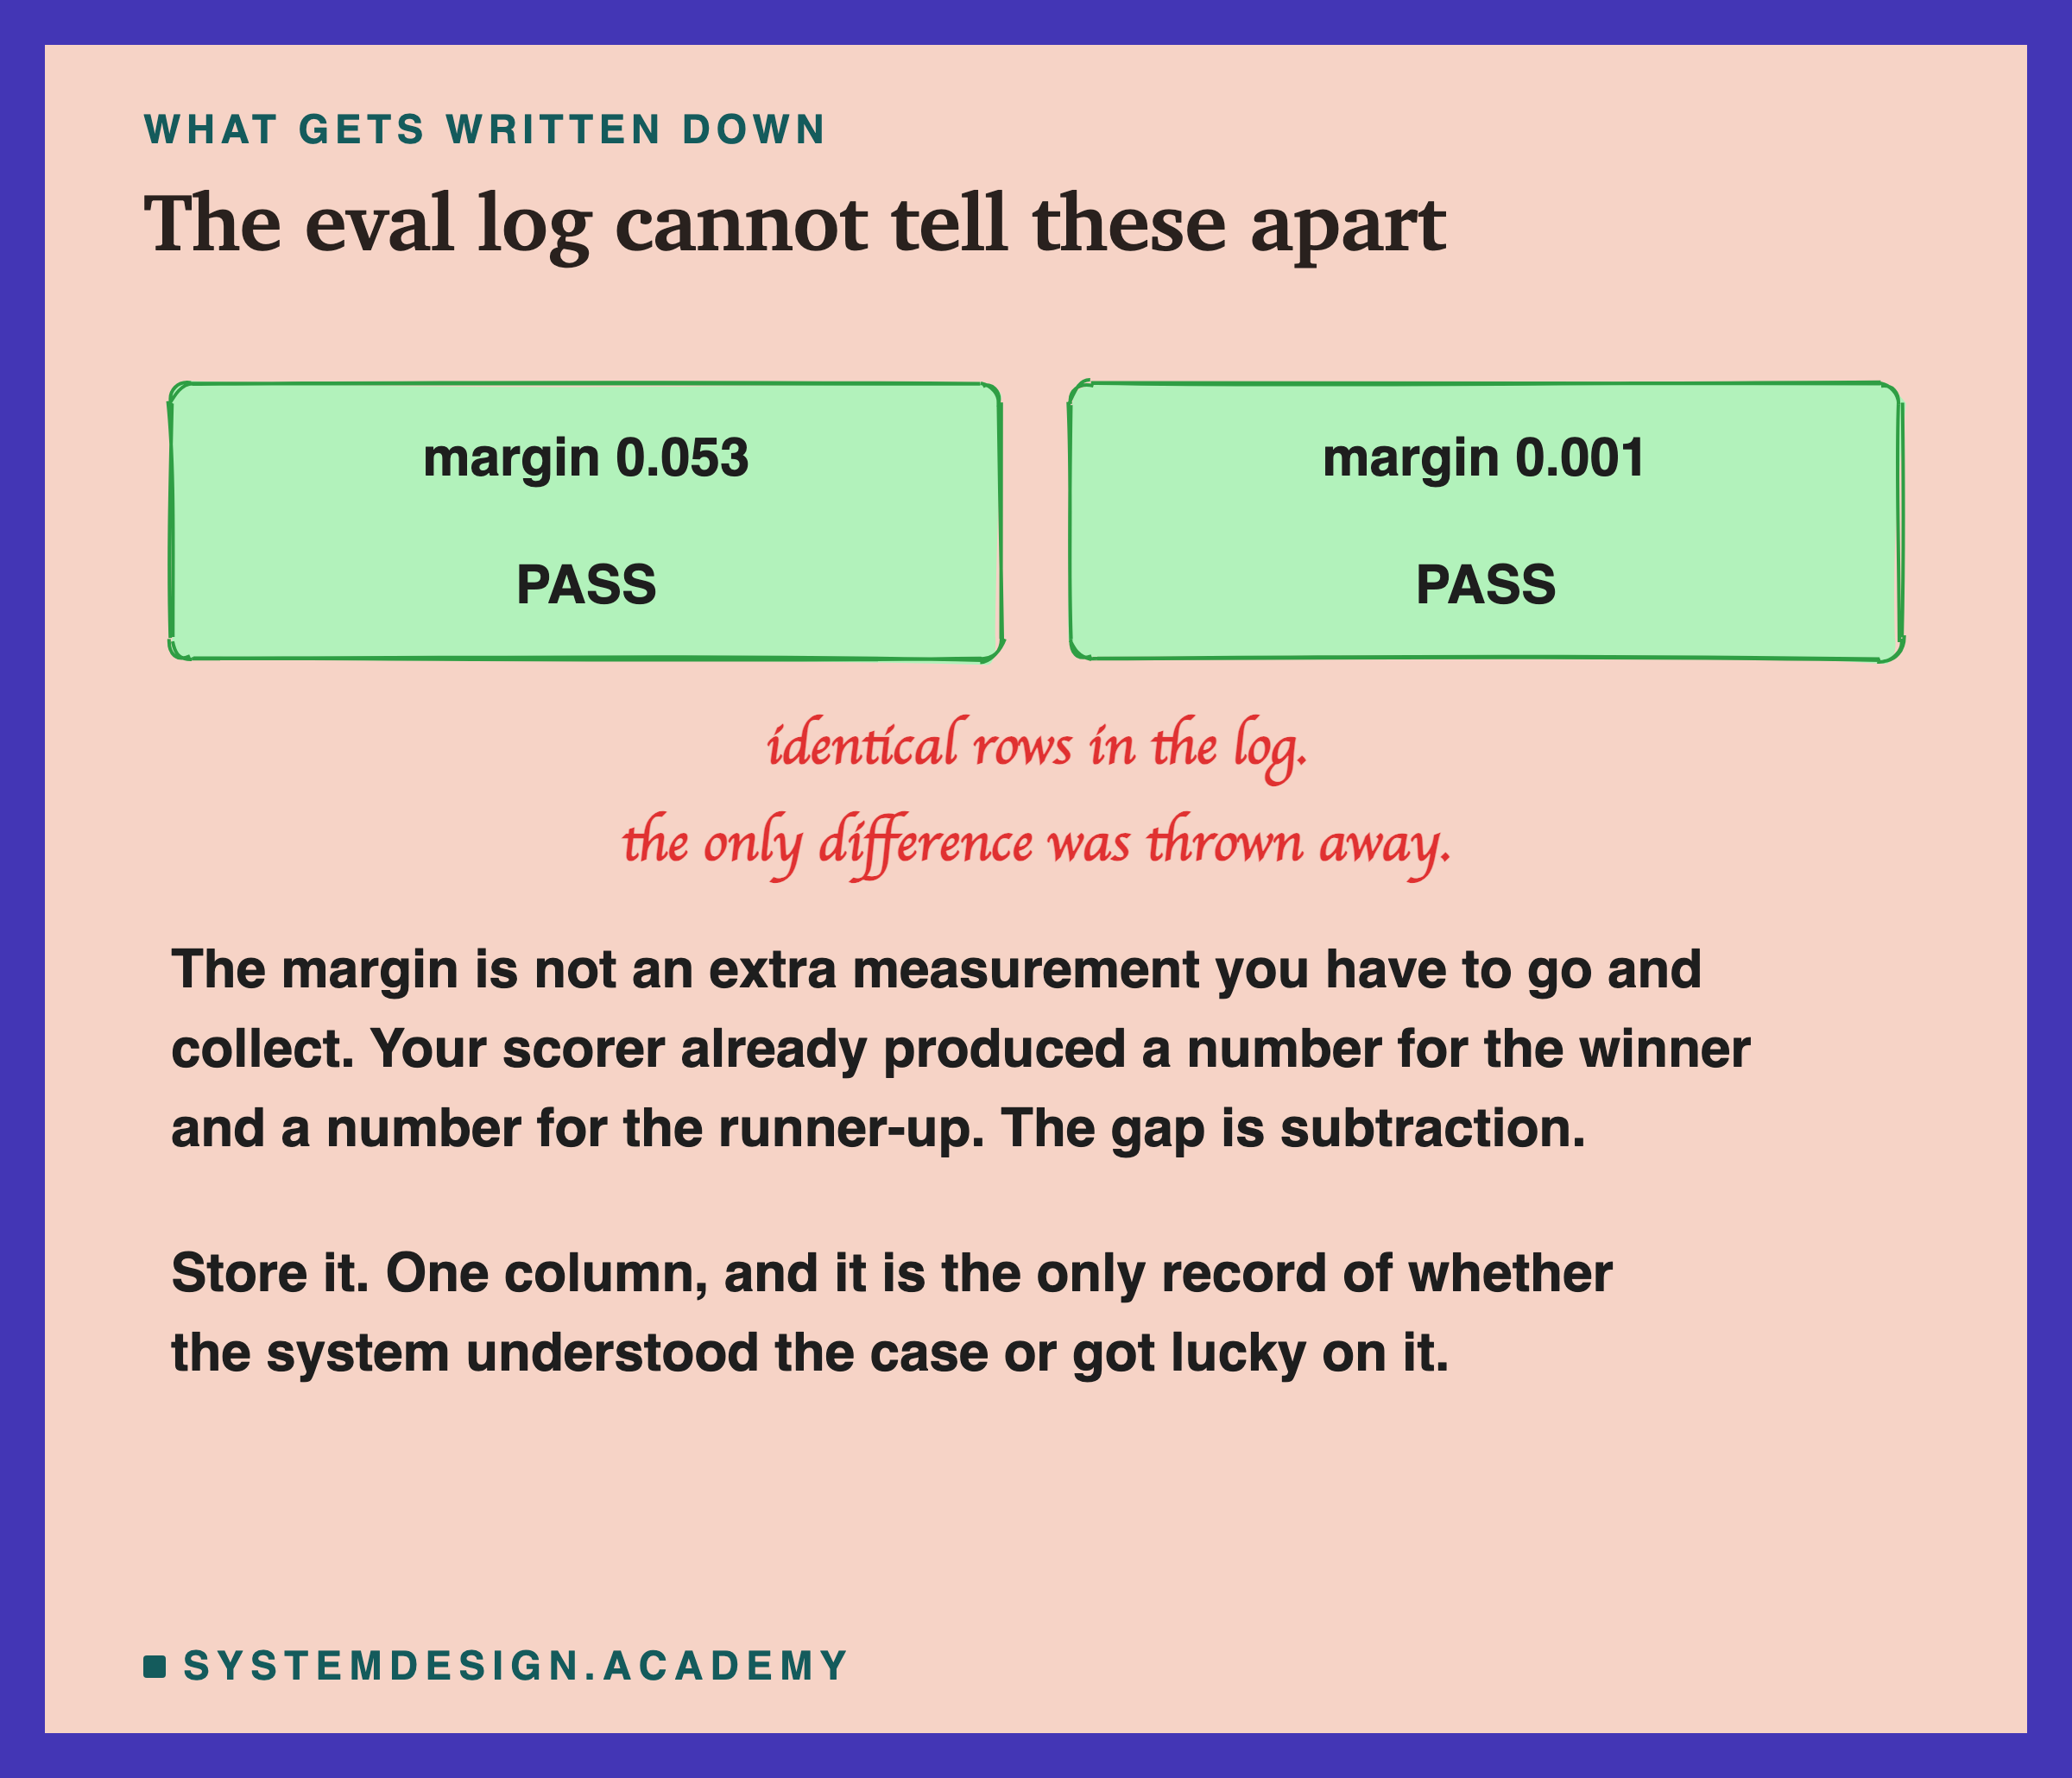
A case won by 0.053 is one the retriever understood. A case won by 0.001 is one it got right the way a coin gets a call right. The eval writes down "pass" for both.
Sorting the Set by How Hard It Actually Was
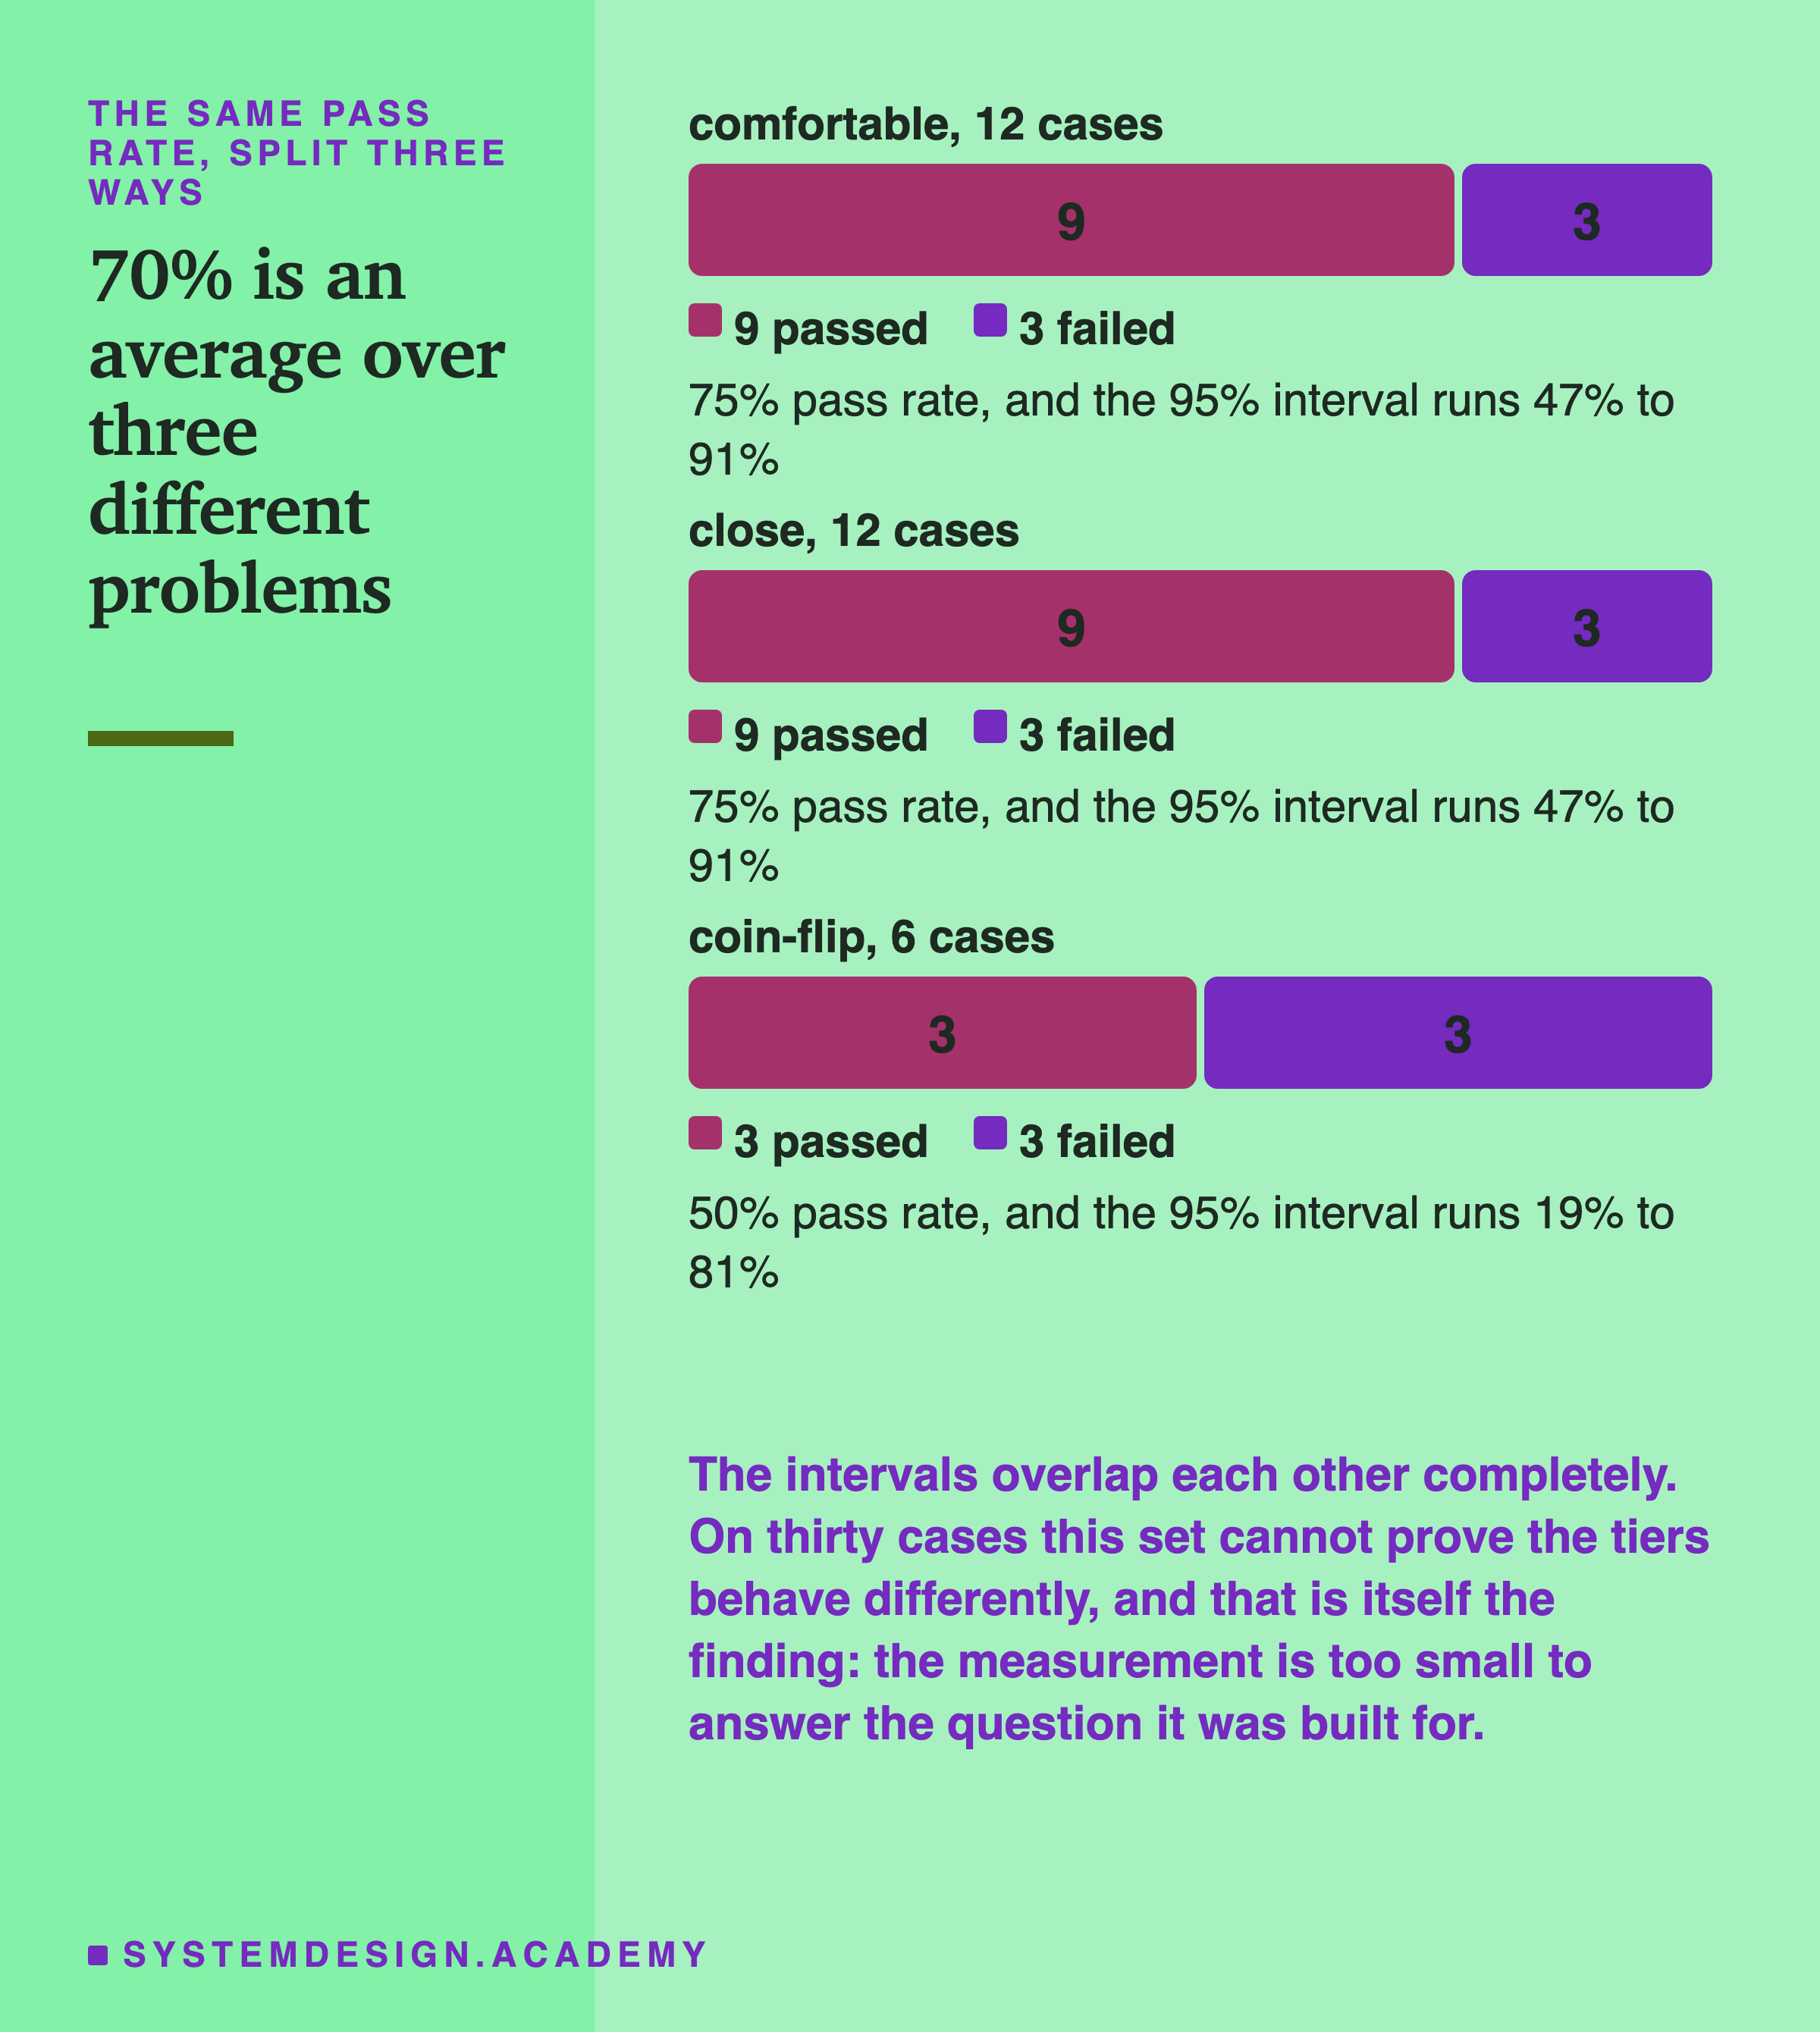
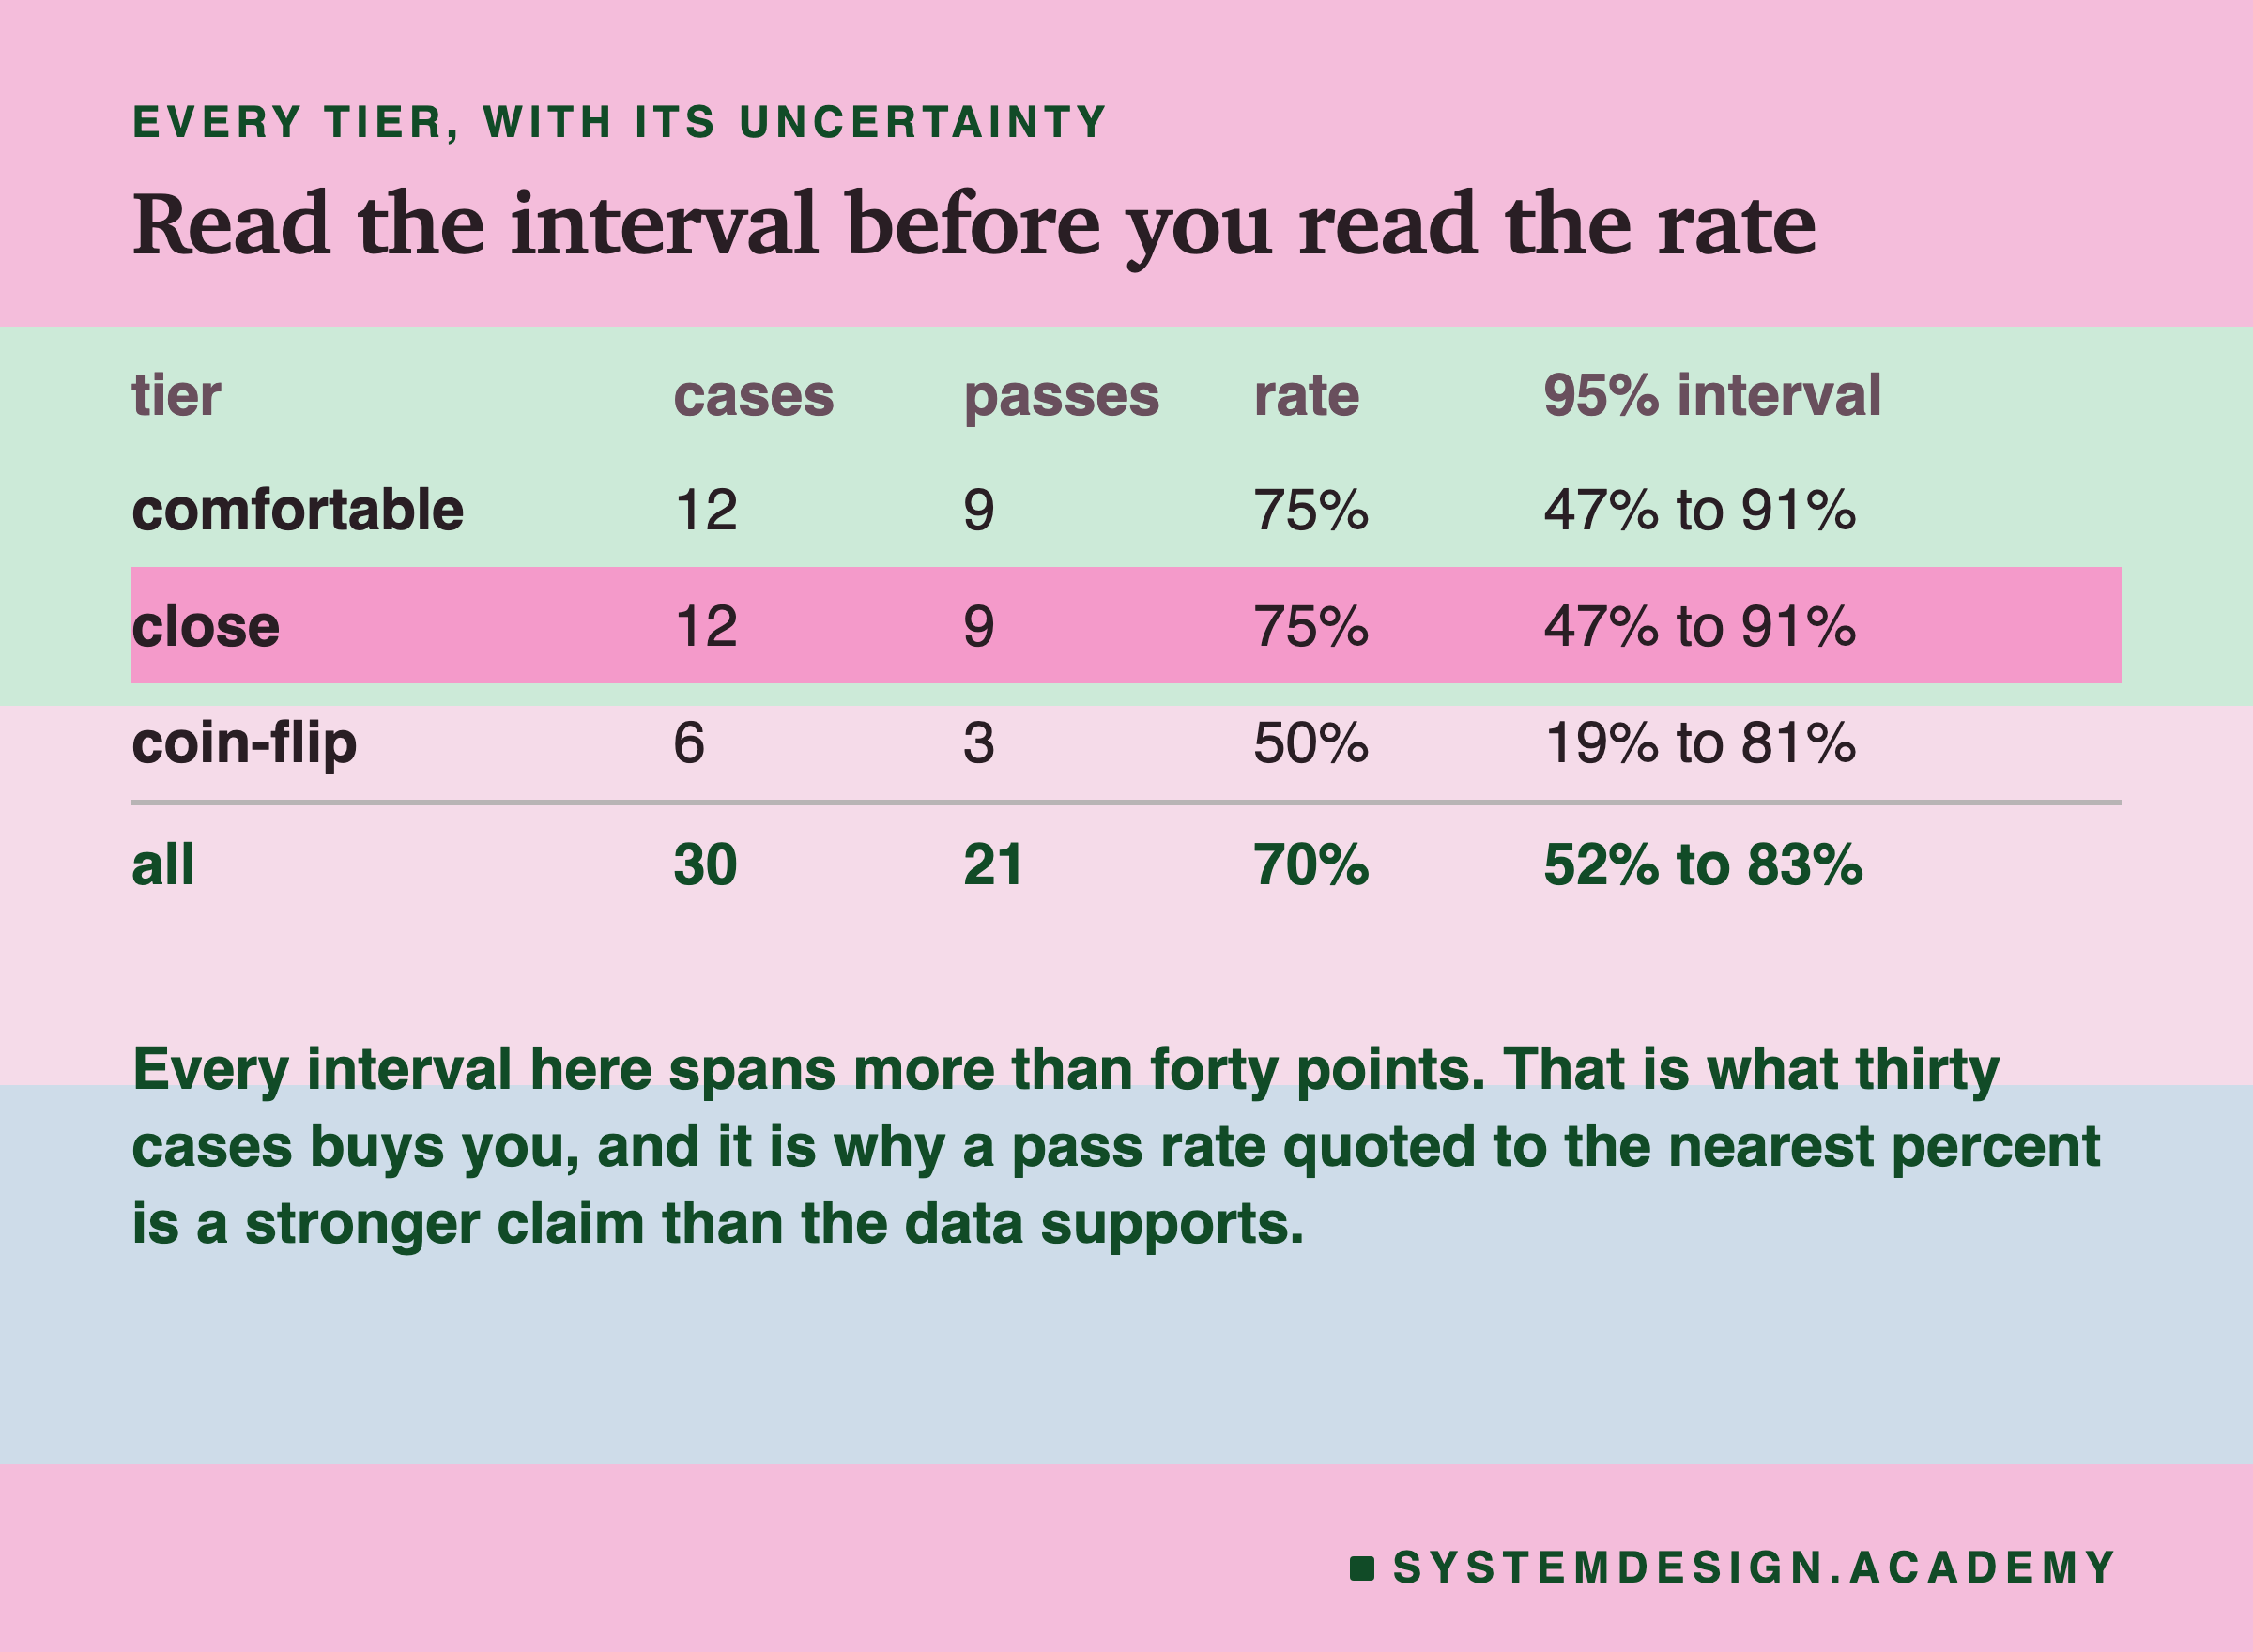
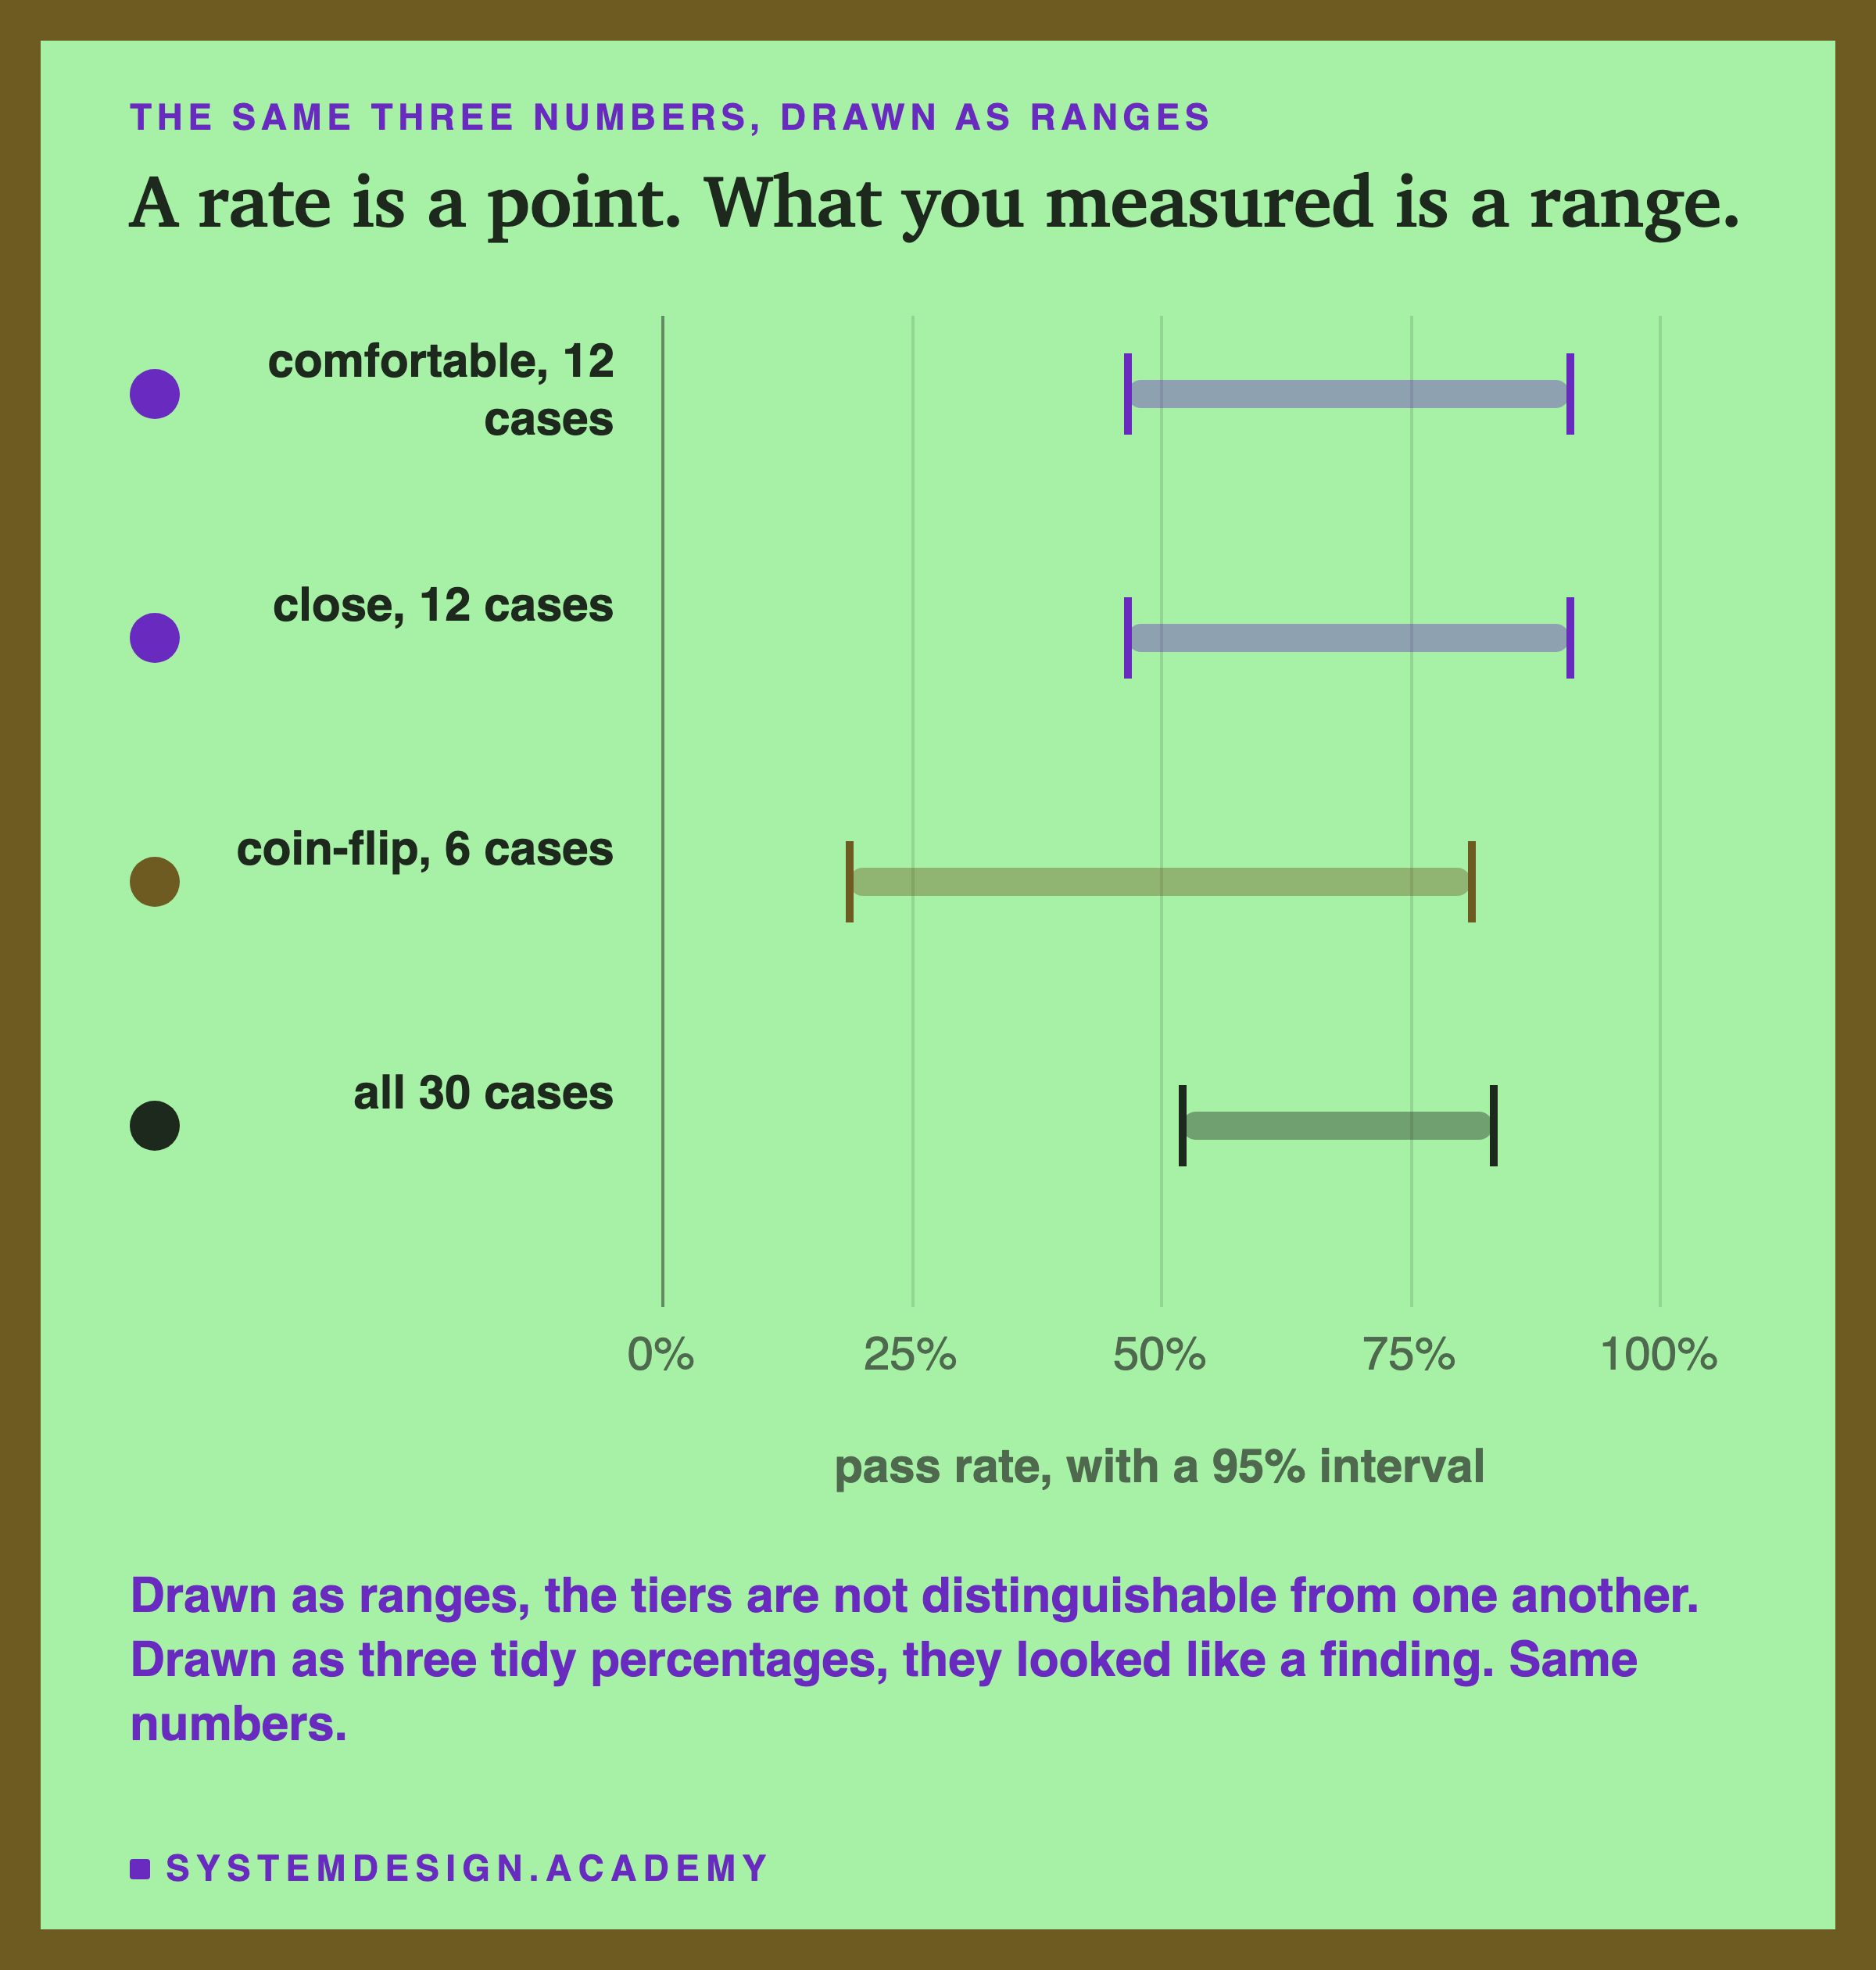
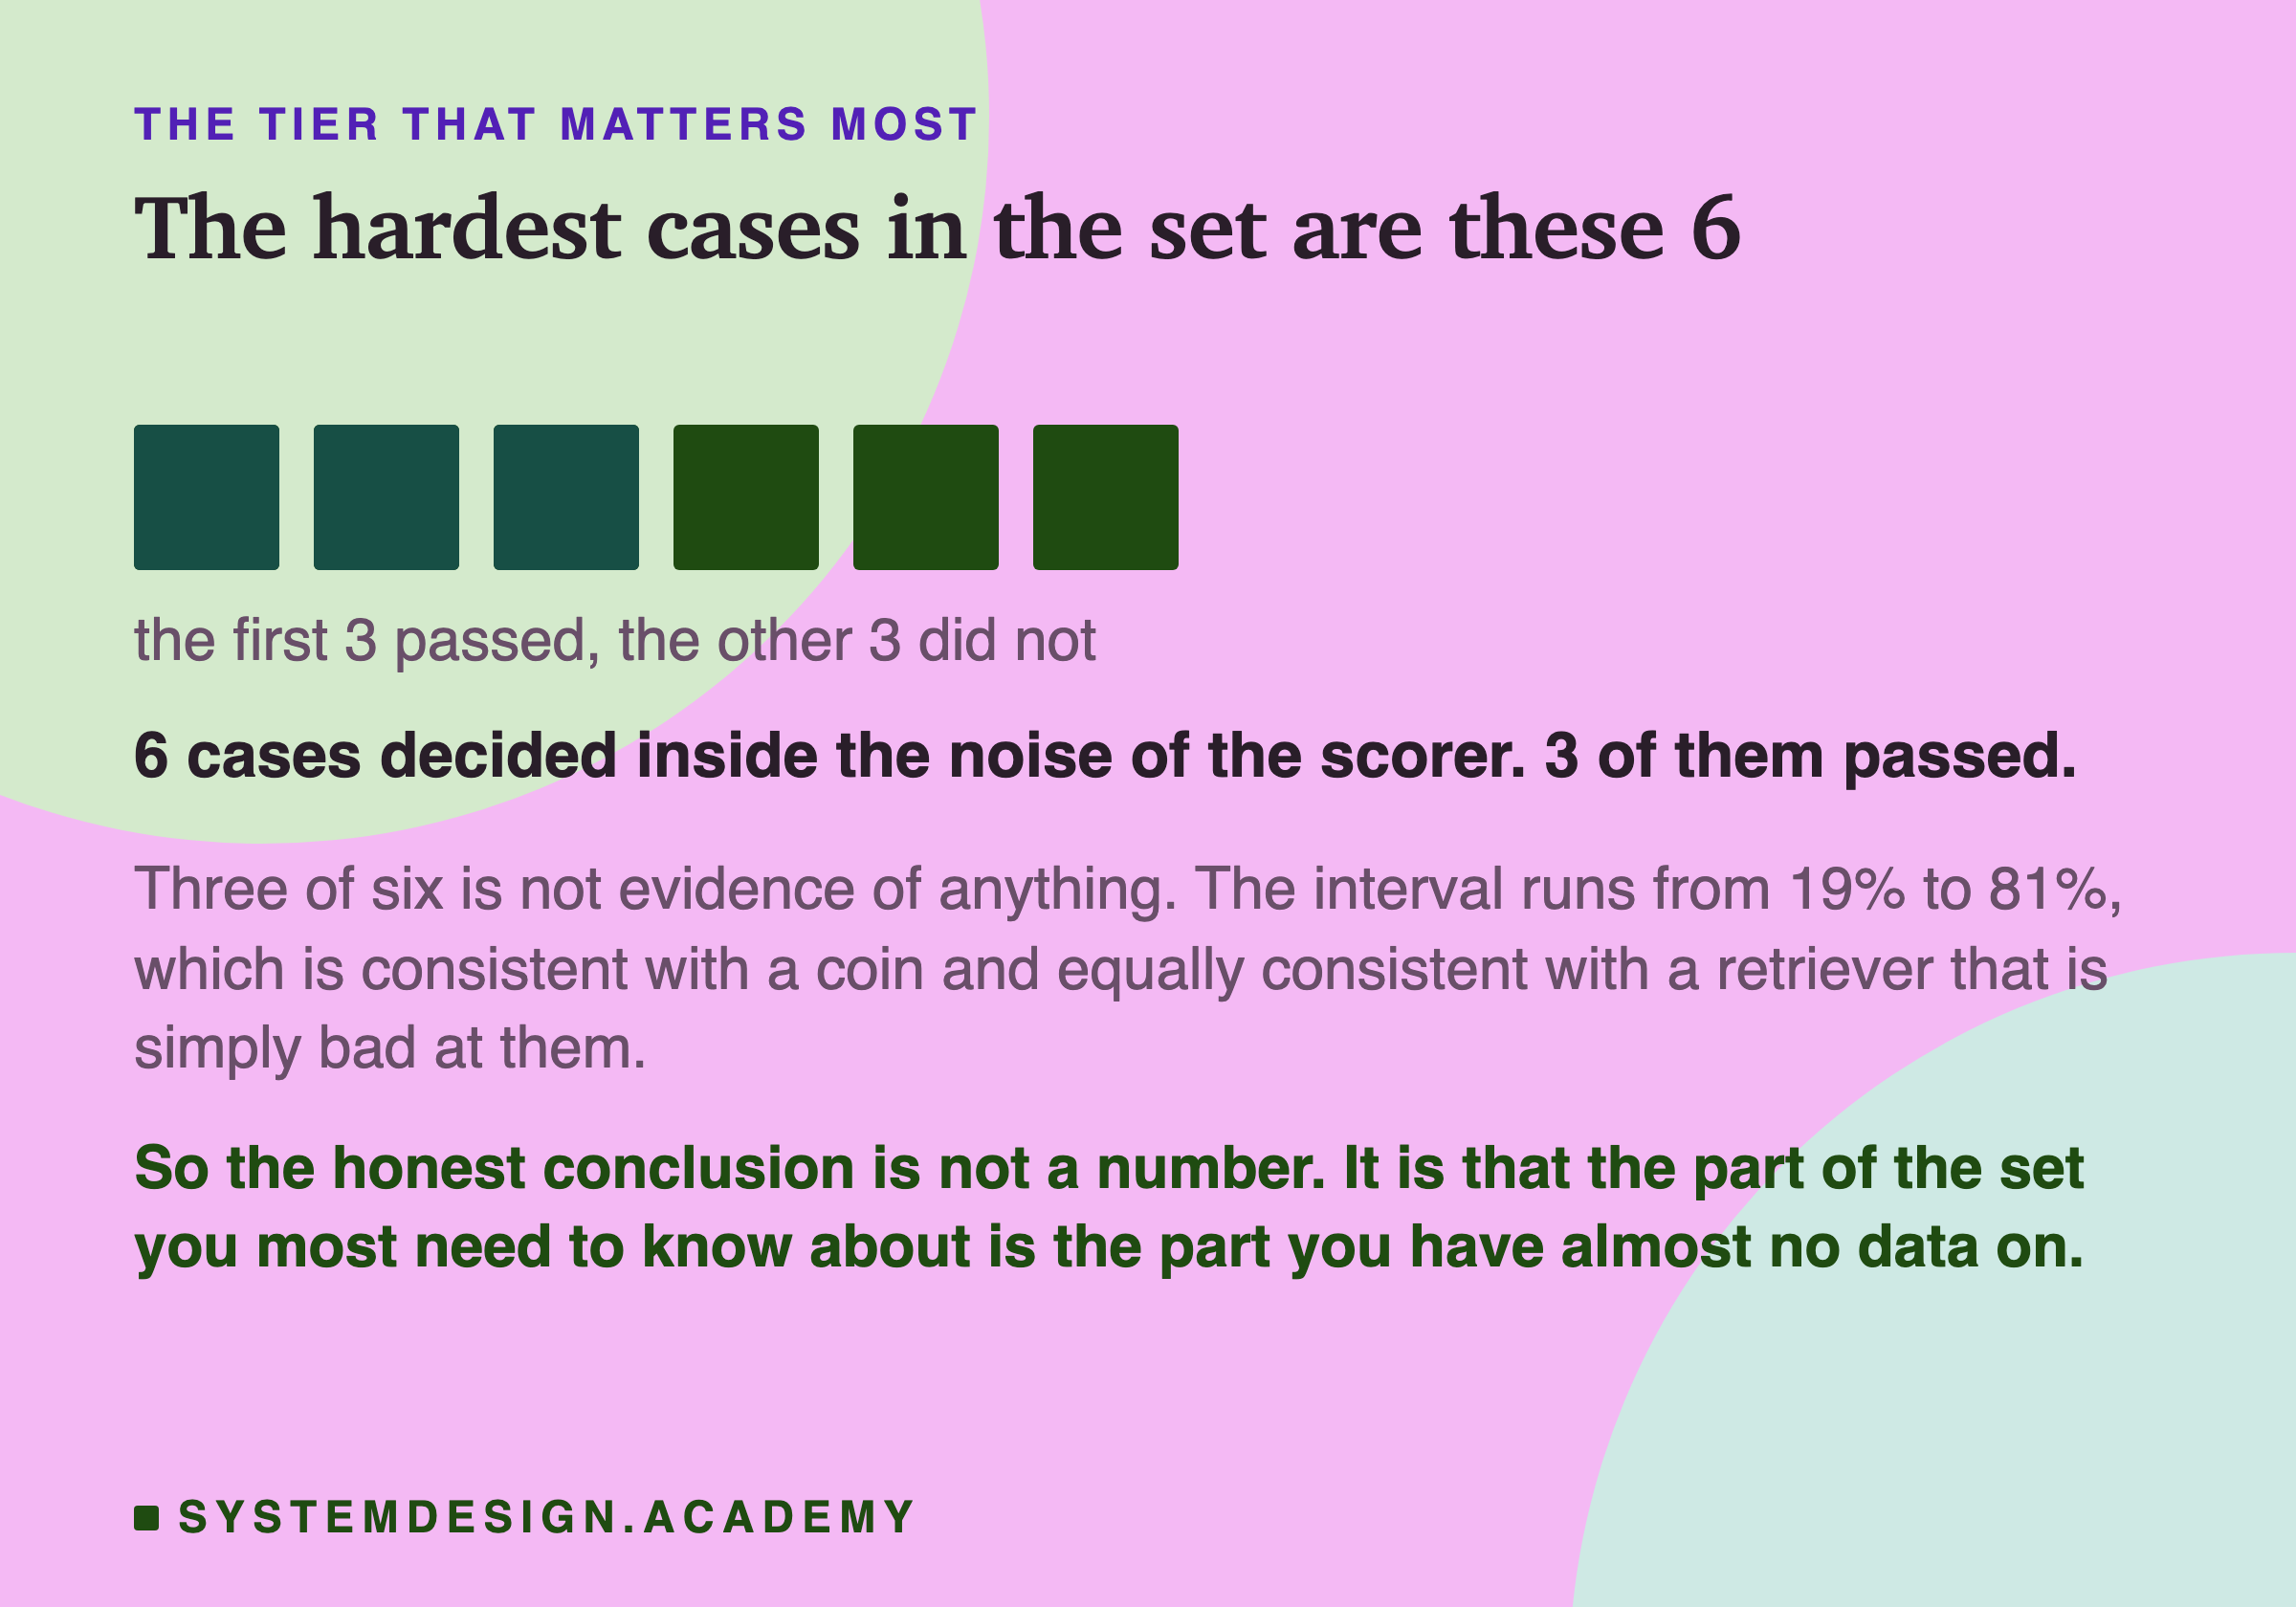
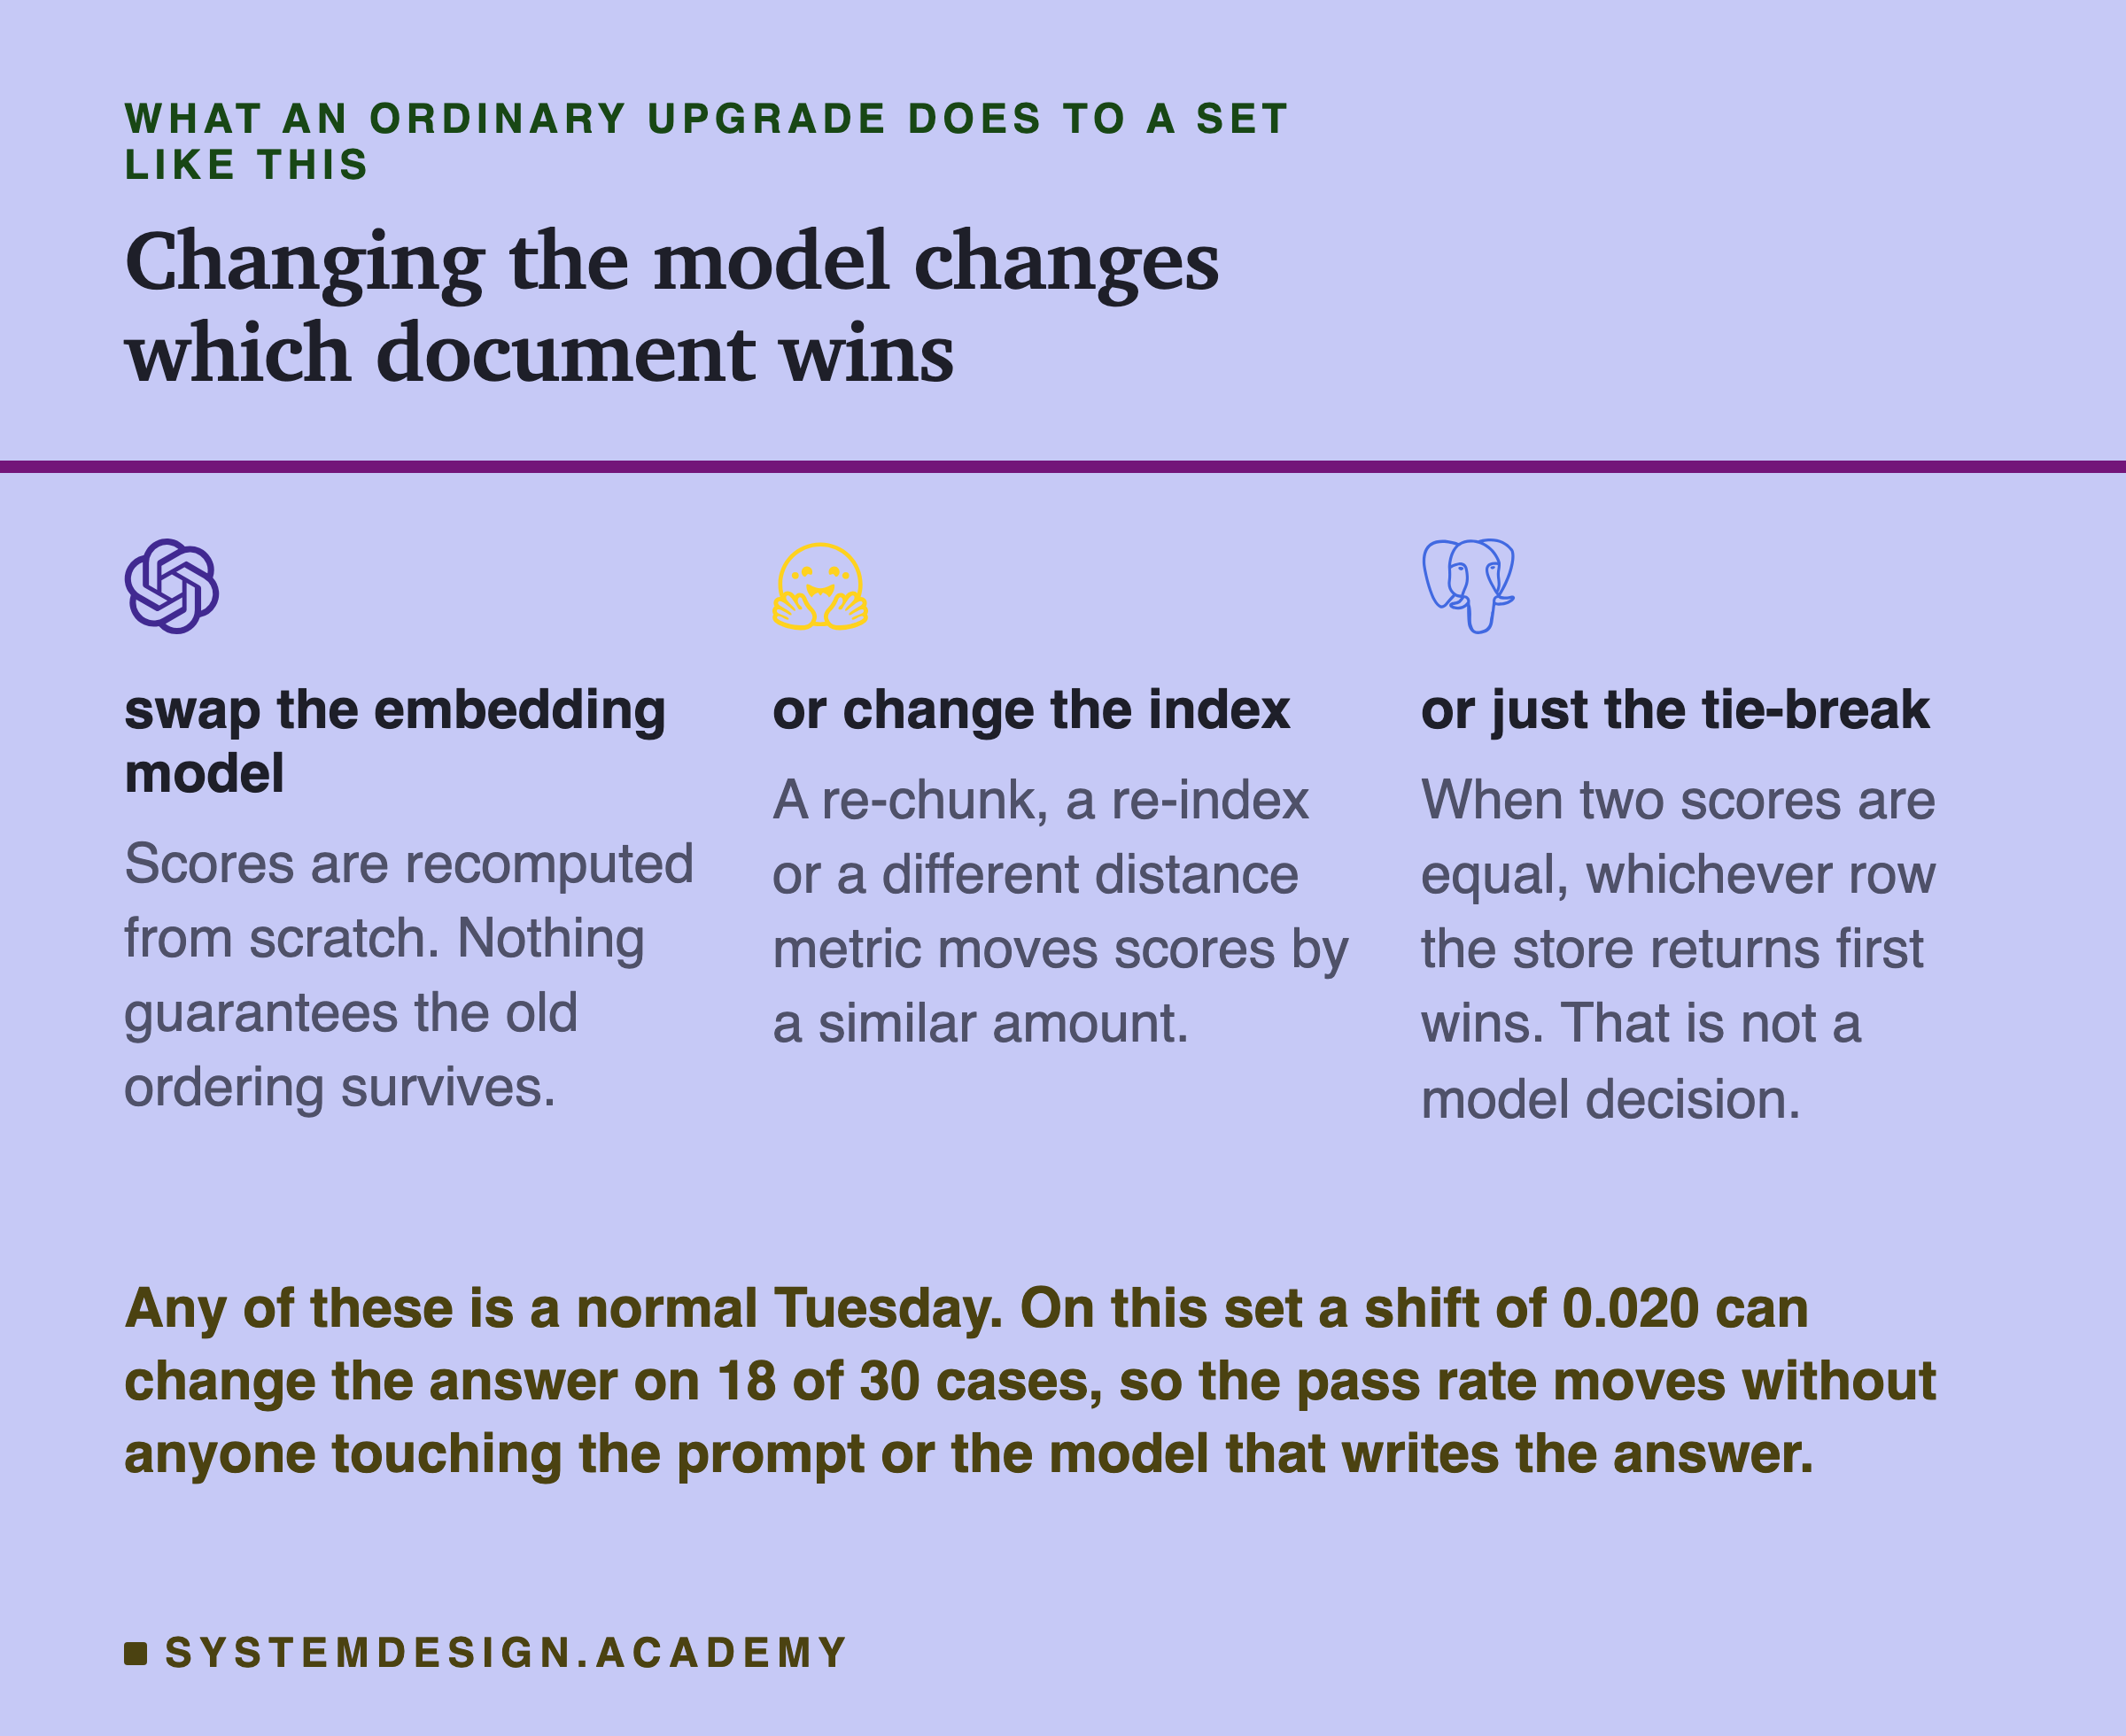
Split the thirty by margin. The boundaries below are a judgement, not a law, and they are in the lab so you can disagree with them. The reasoning: 0.01 is roughly the amount a different model, a re-index, or a change of tie-break rule moves a score.
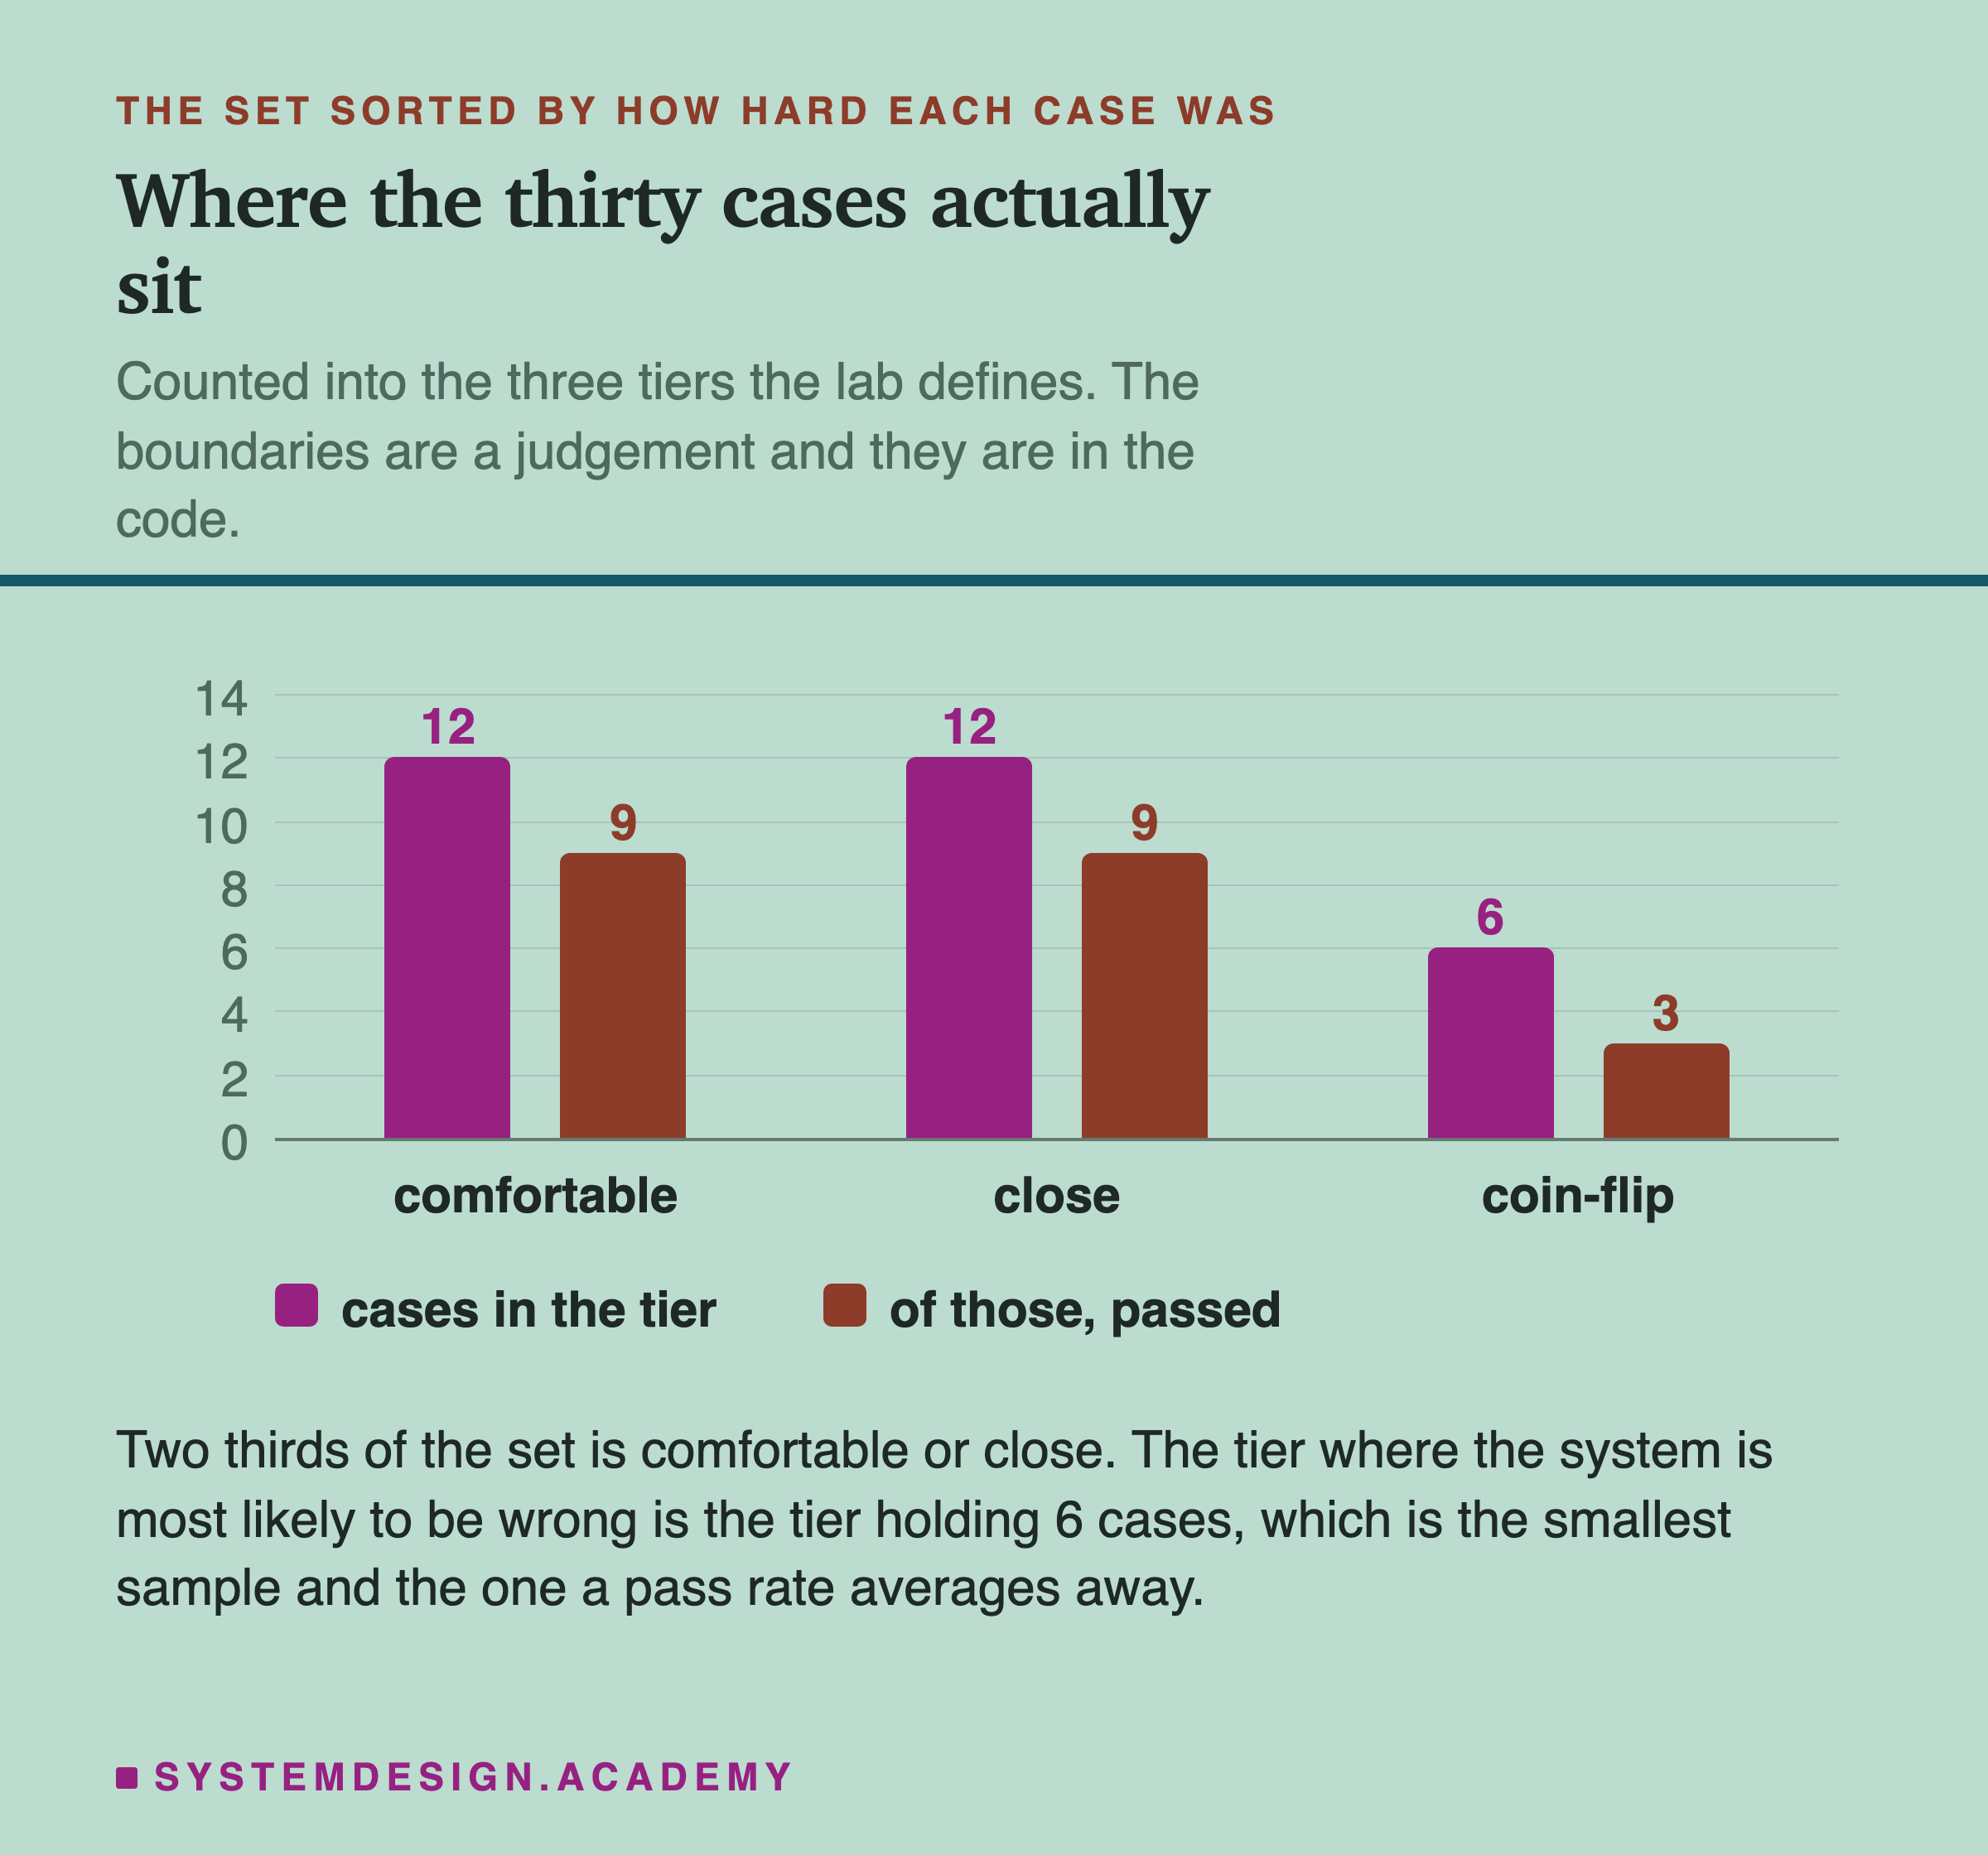
| tier | margin | cases | passes | pass rate | 95% interval |
|---|---|---|---|---|---|
| comfortable | 0.020 and up | 12 | 9 | 75% | 47% to 91% |
| close | 0.010 to 0.020 | 12 |
How Far Would the Scores Have to Move?
There is a cheaper question than "is my system good", and it has an exact answer.
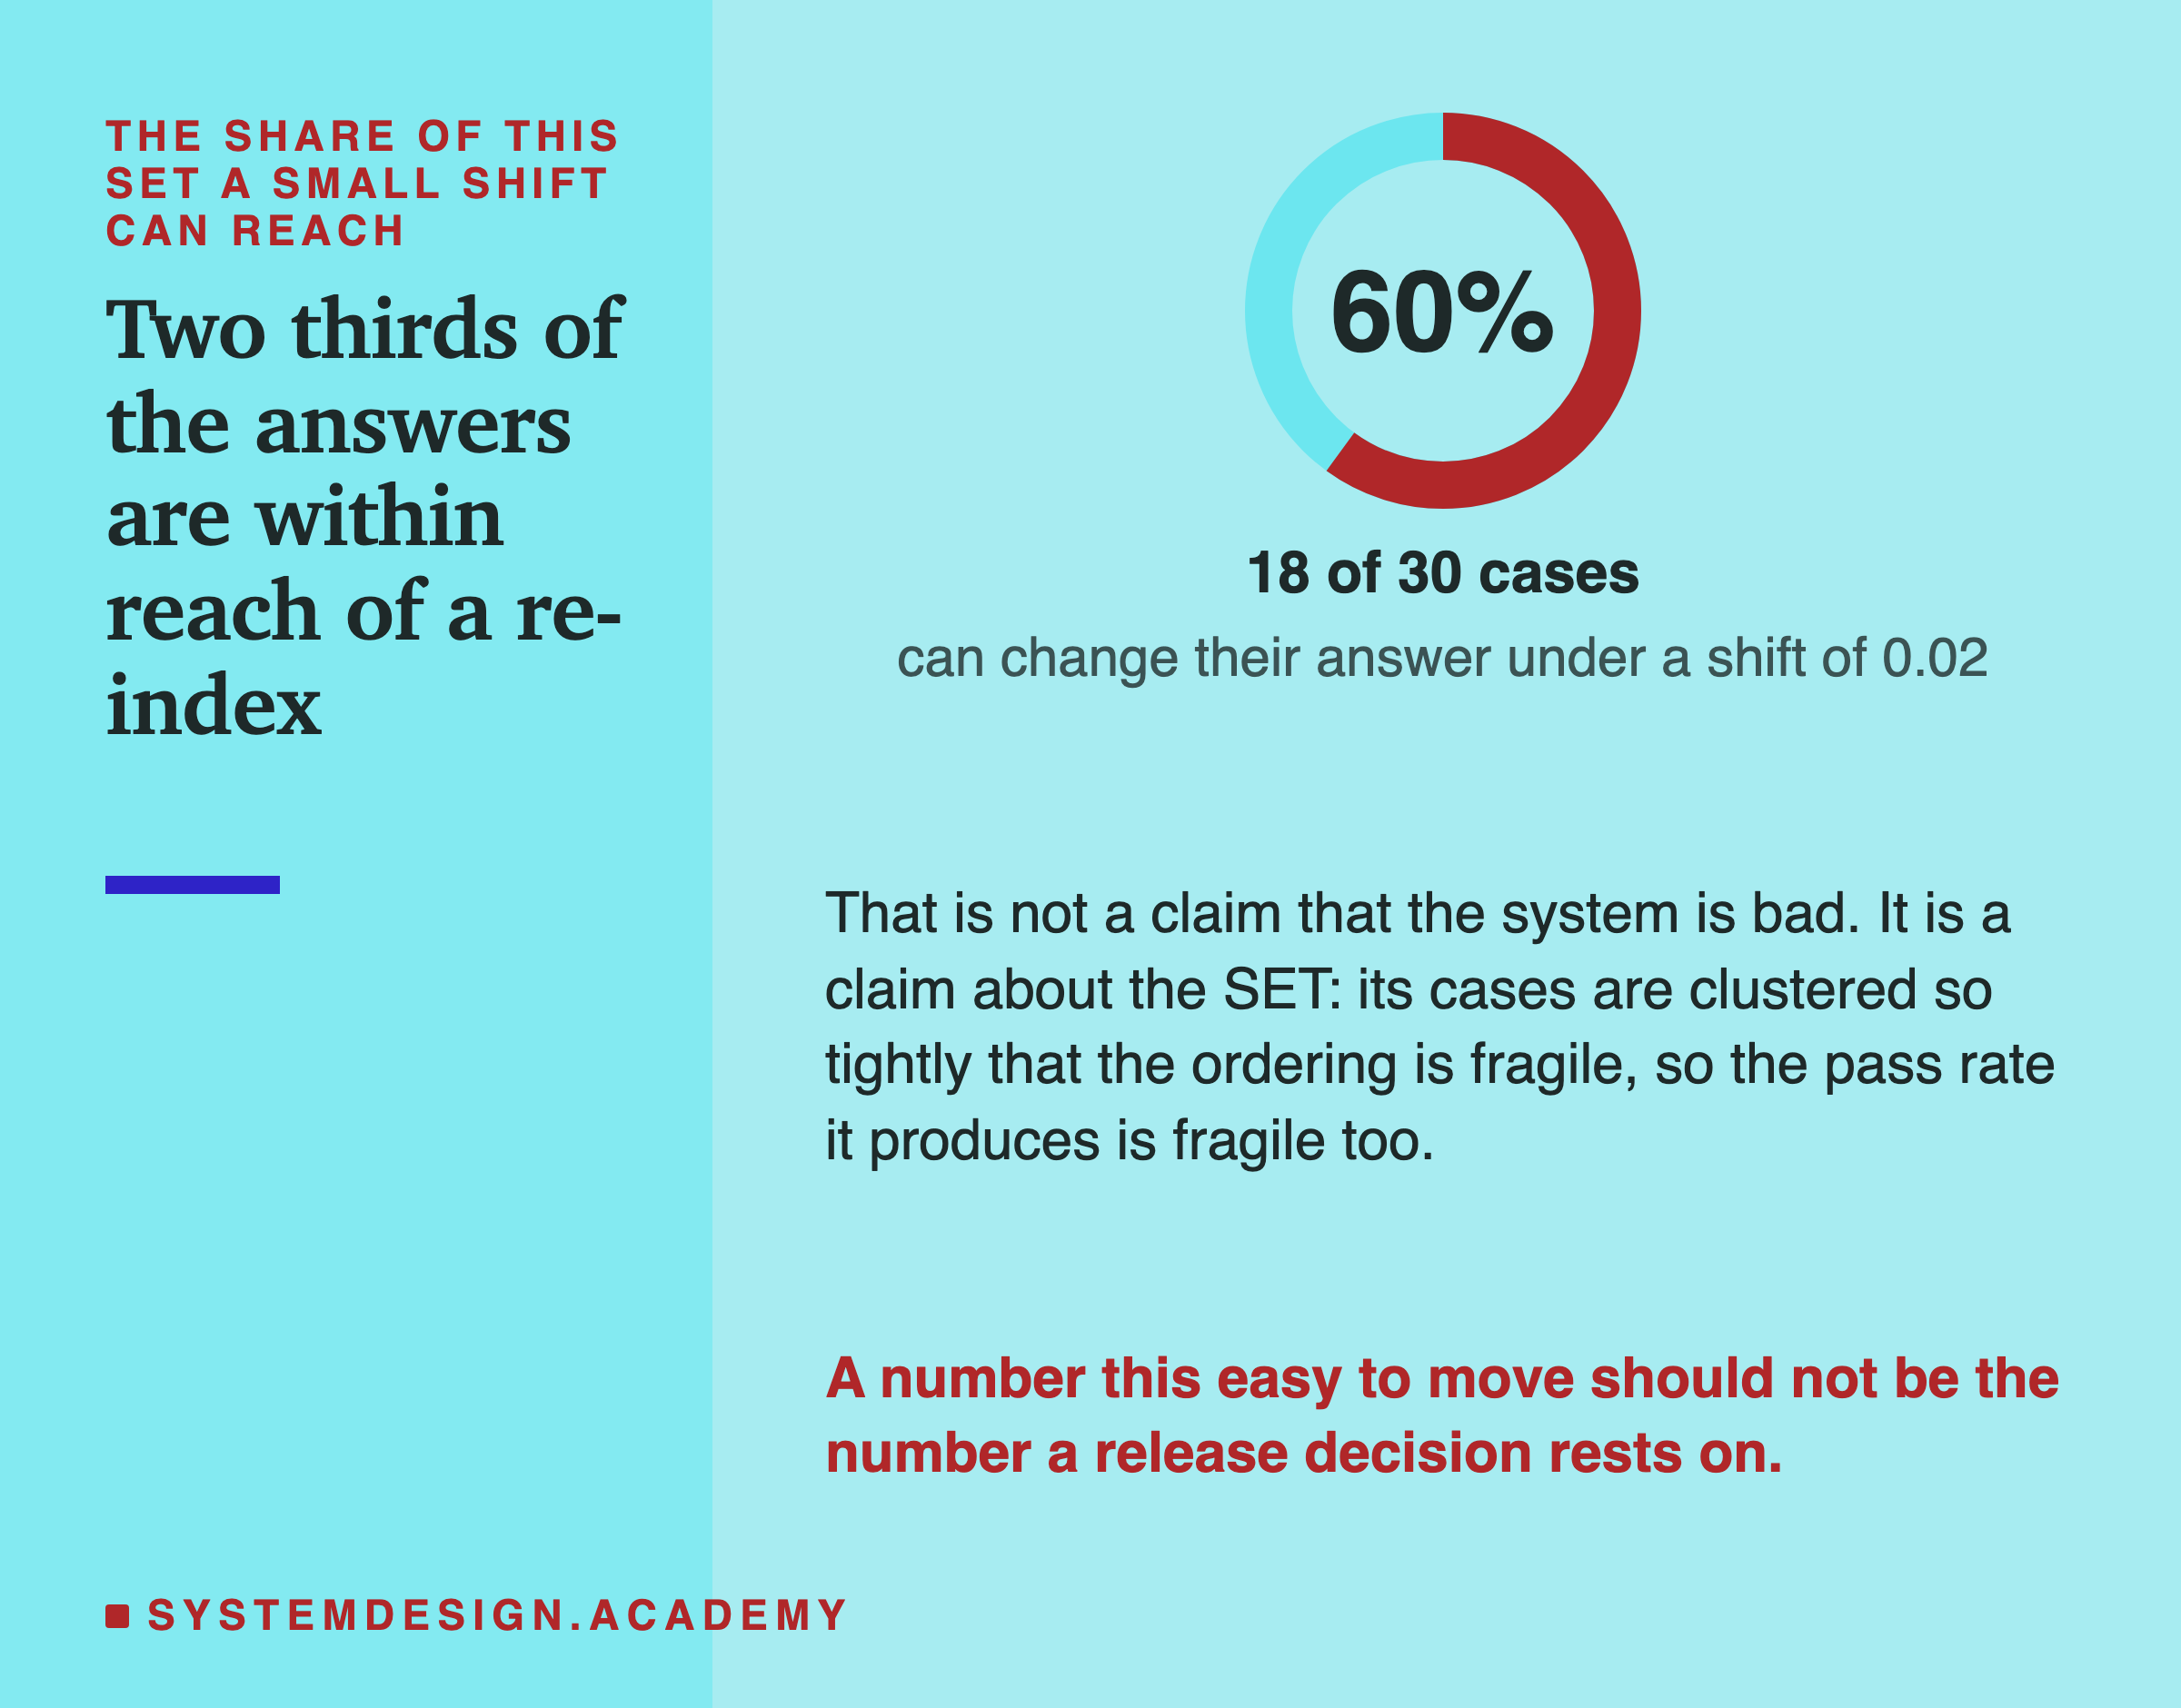
If every score shifted by some small amount, how many cases would change their answer?
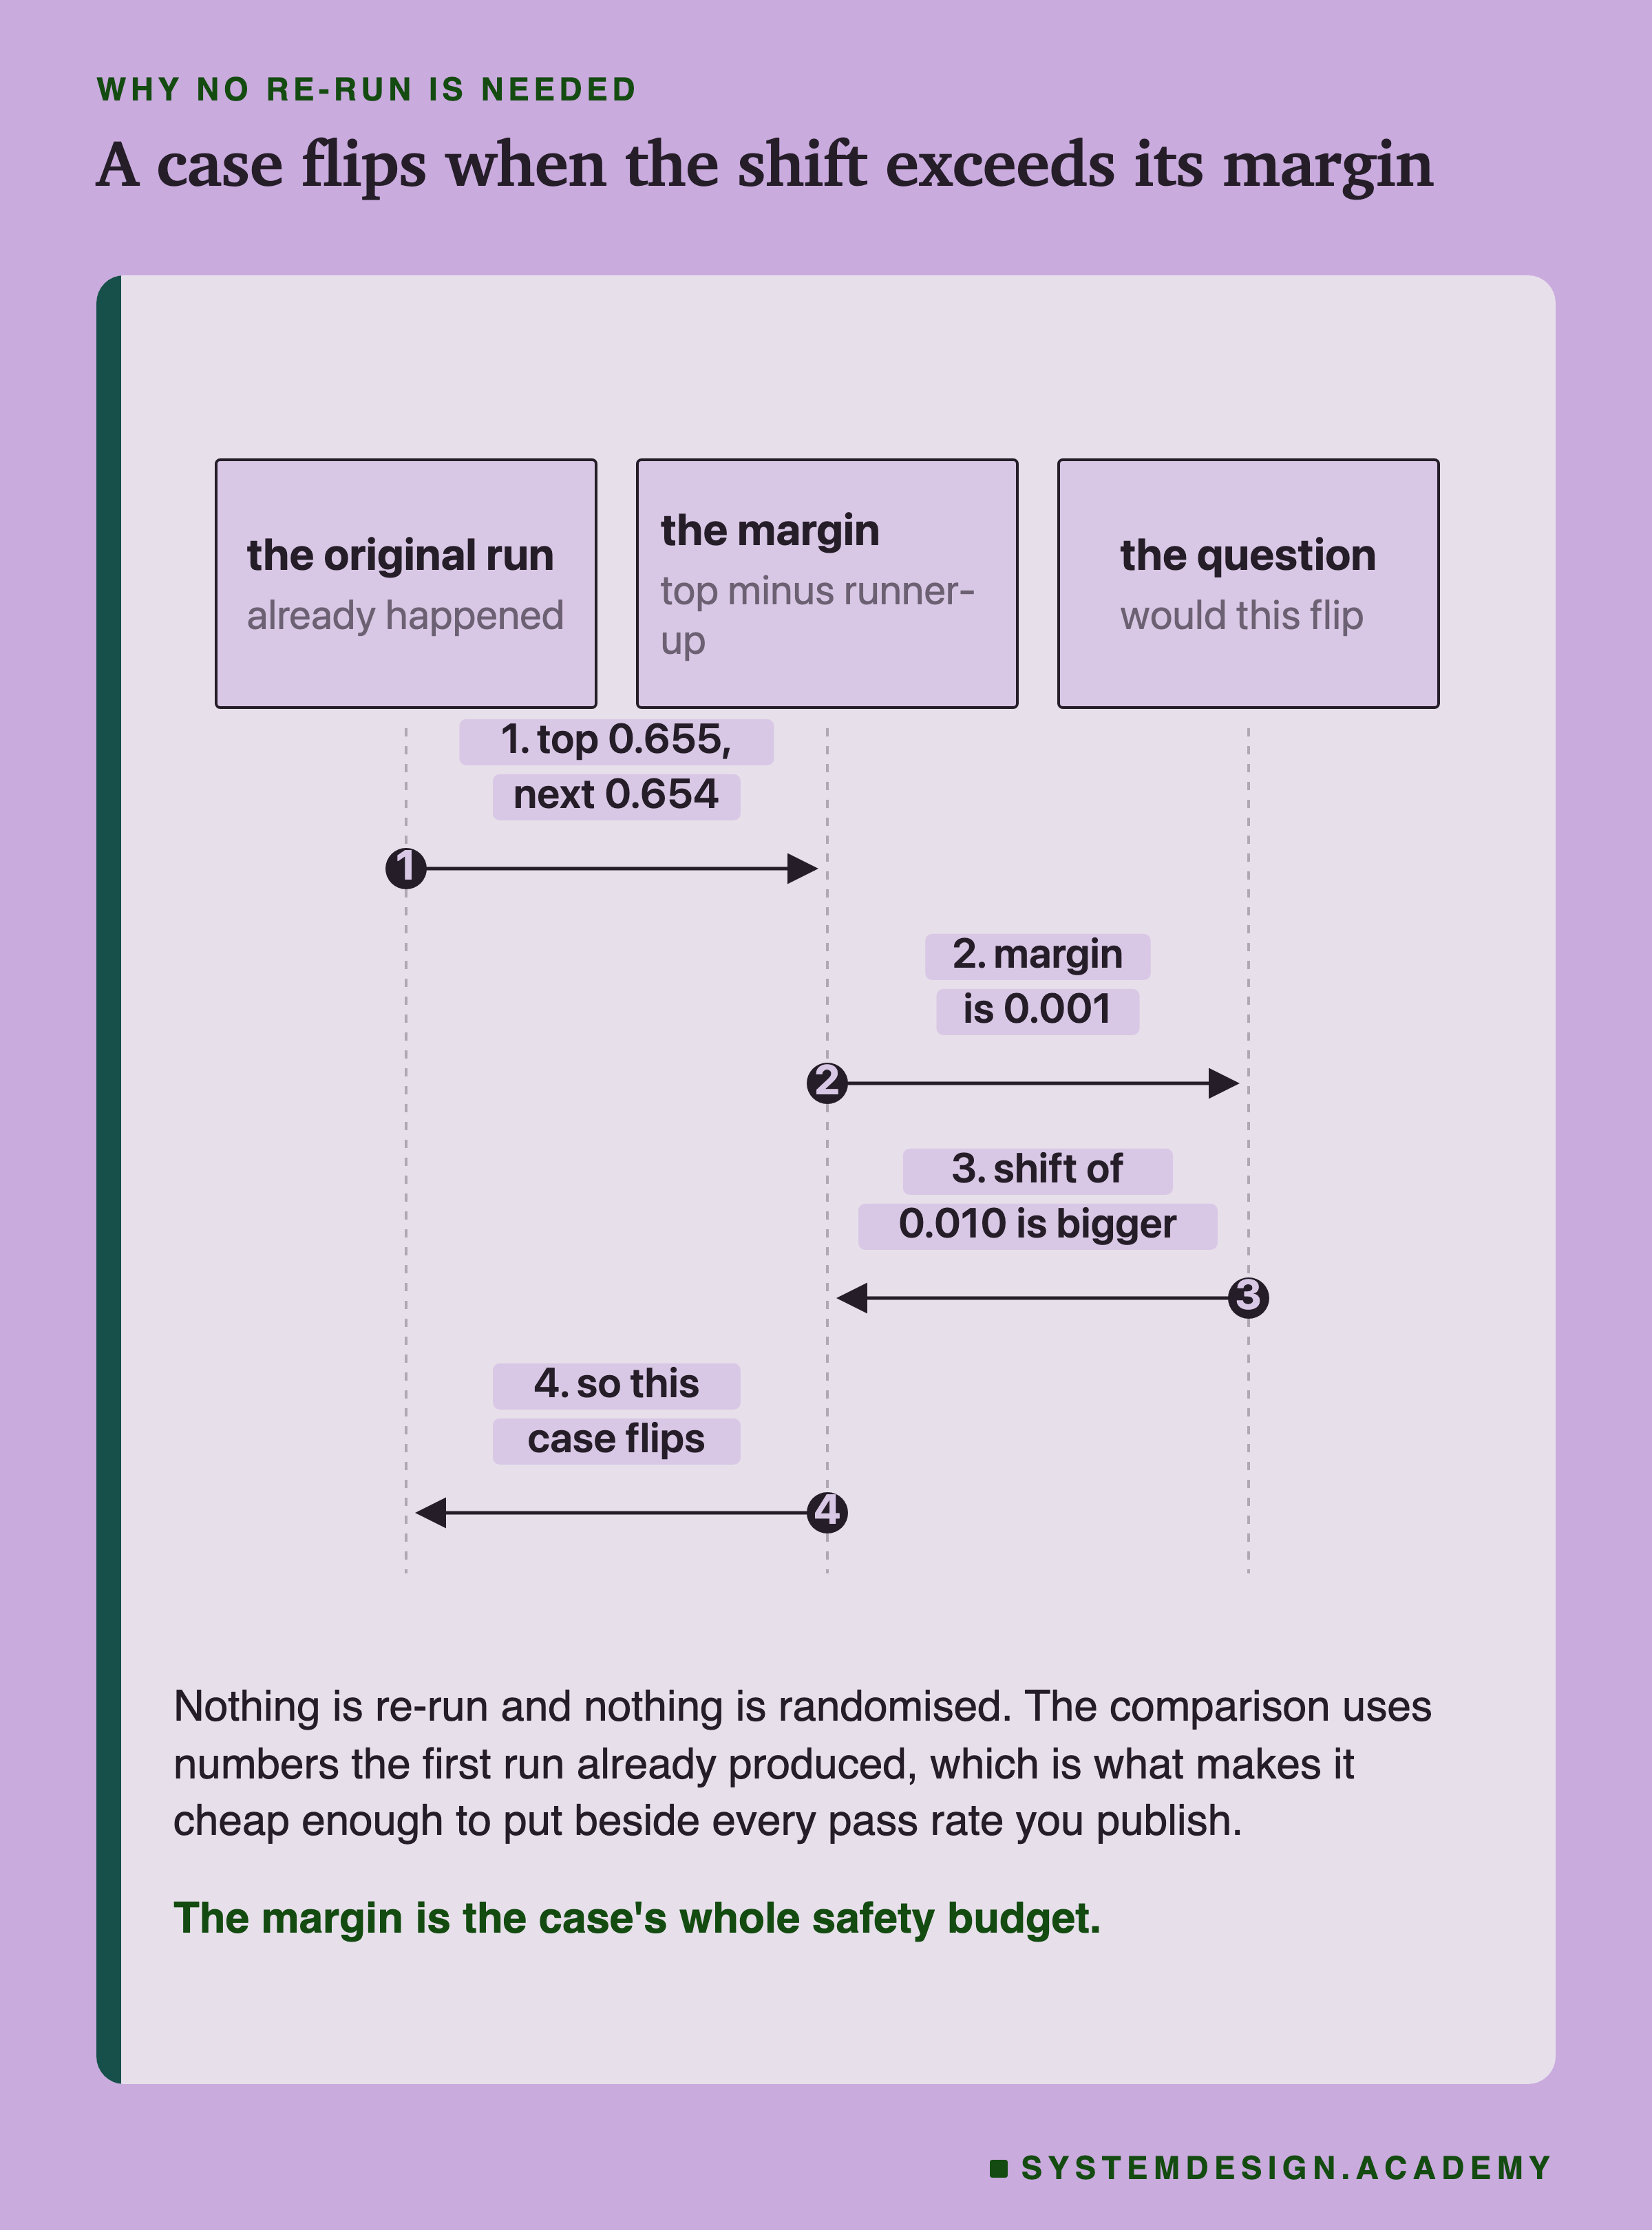
You do not need to simulate this. A case changes its answer when the shift is bigger than its margin, and you already measured every margin. So it is a comparison, not an experiment.
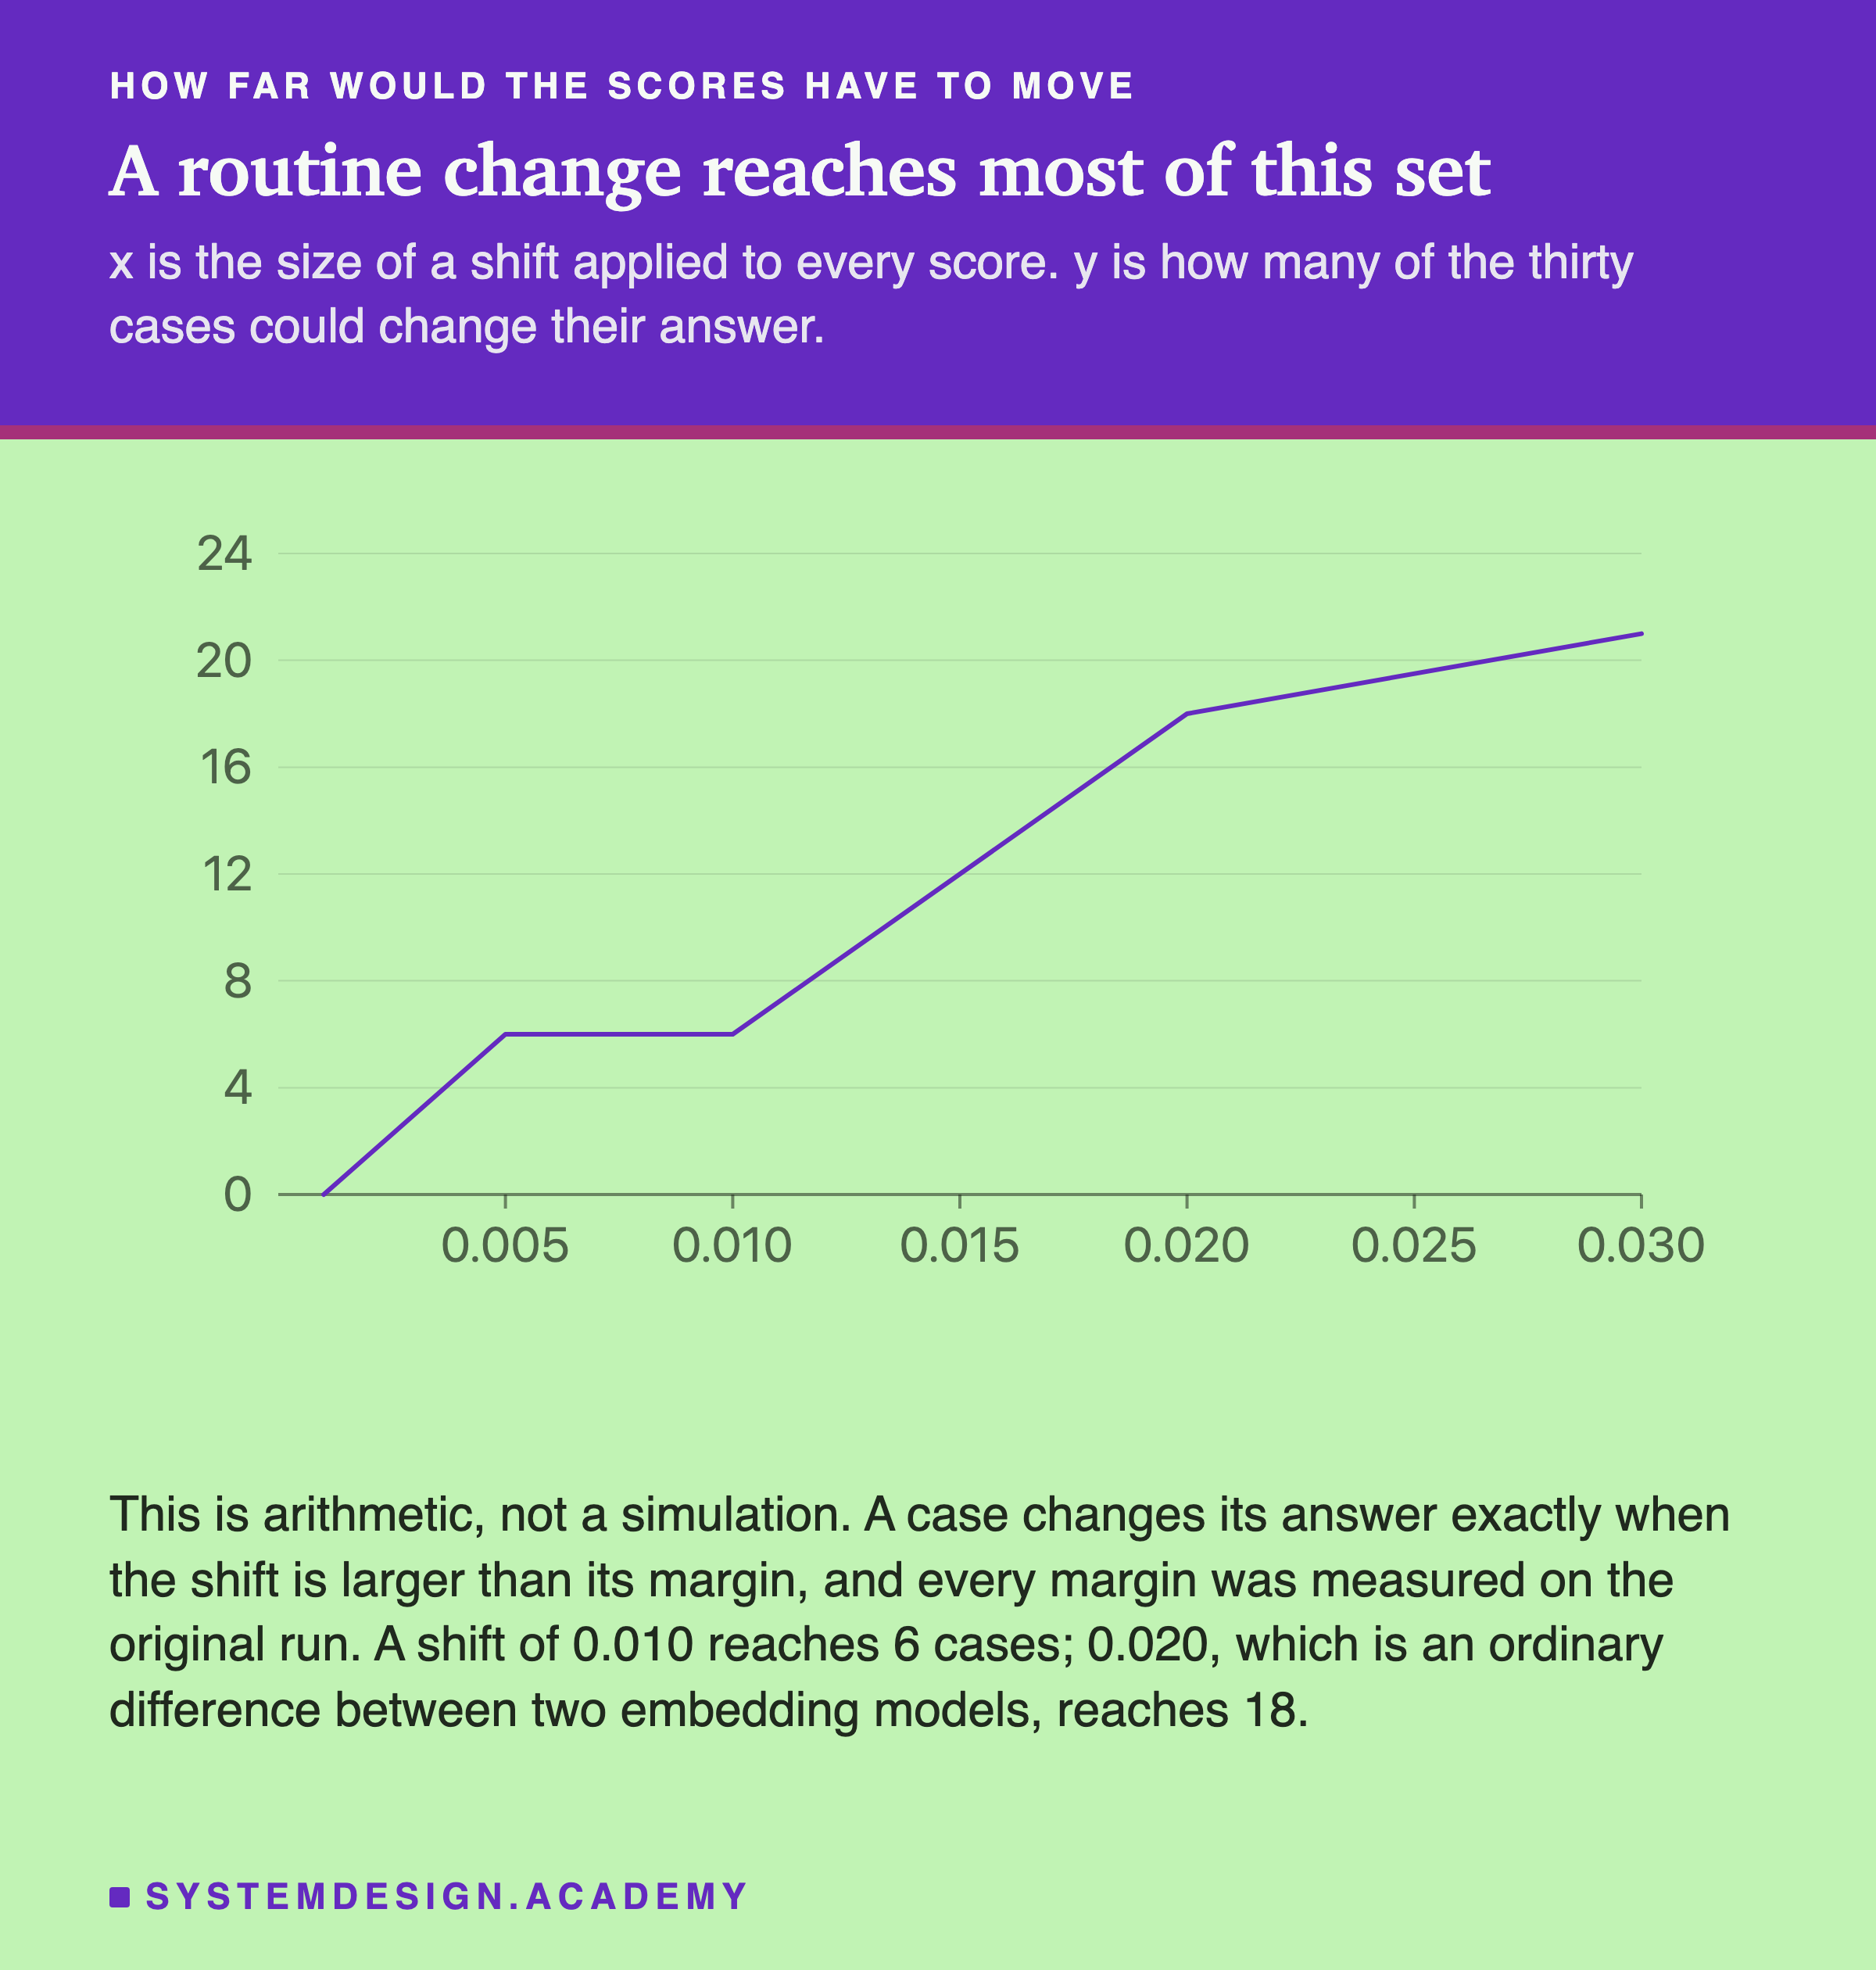
| shift | cases that can flip | share of the set |
|---|---|---|
| 0.001 | 0 | 0% |
Run It
The code below reads the same thirty traces. It prints three measurements. What the set can detect, how hard its cases were, and how far the scores would have to move.
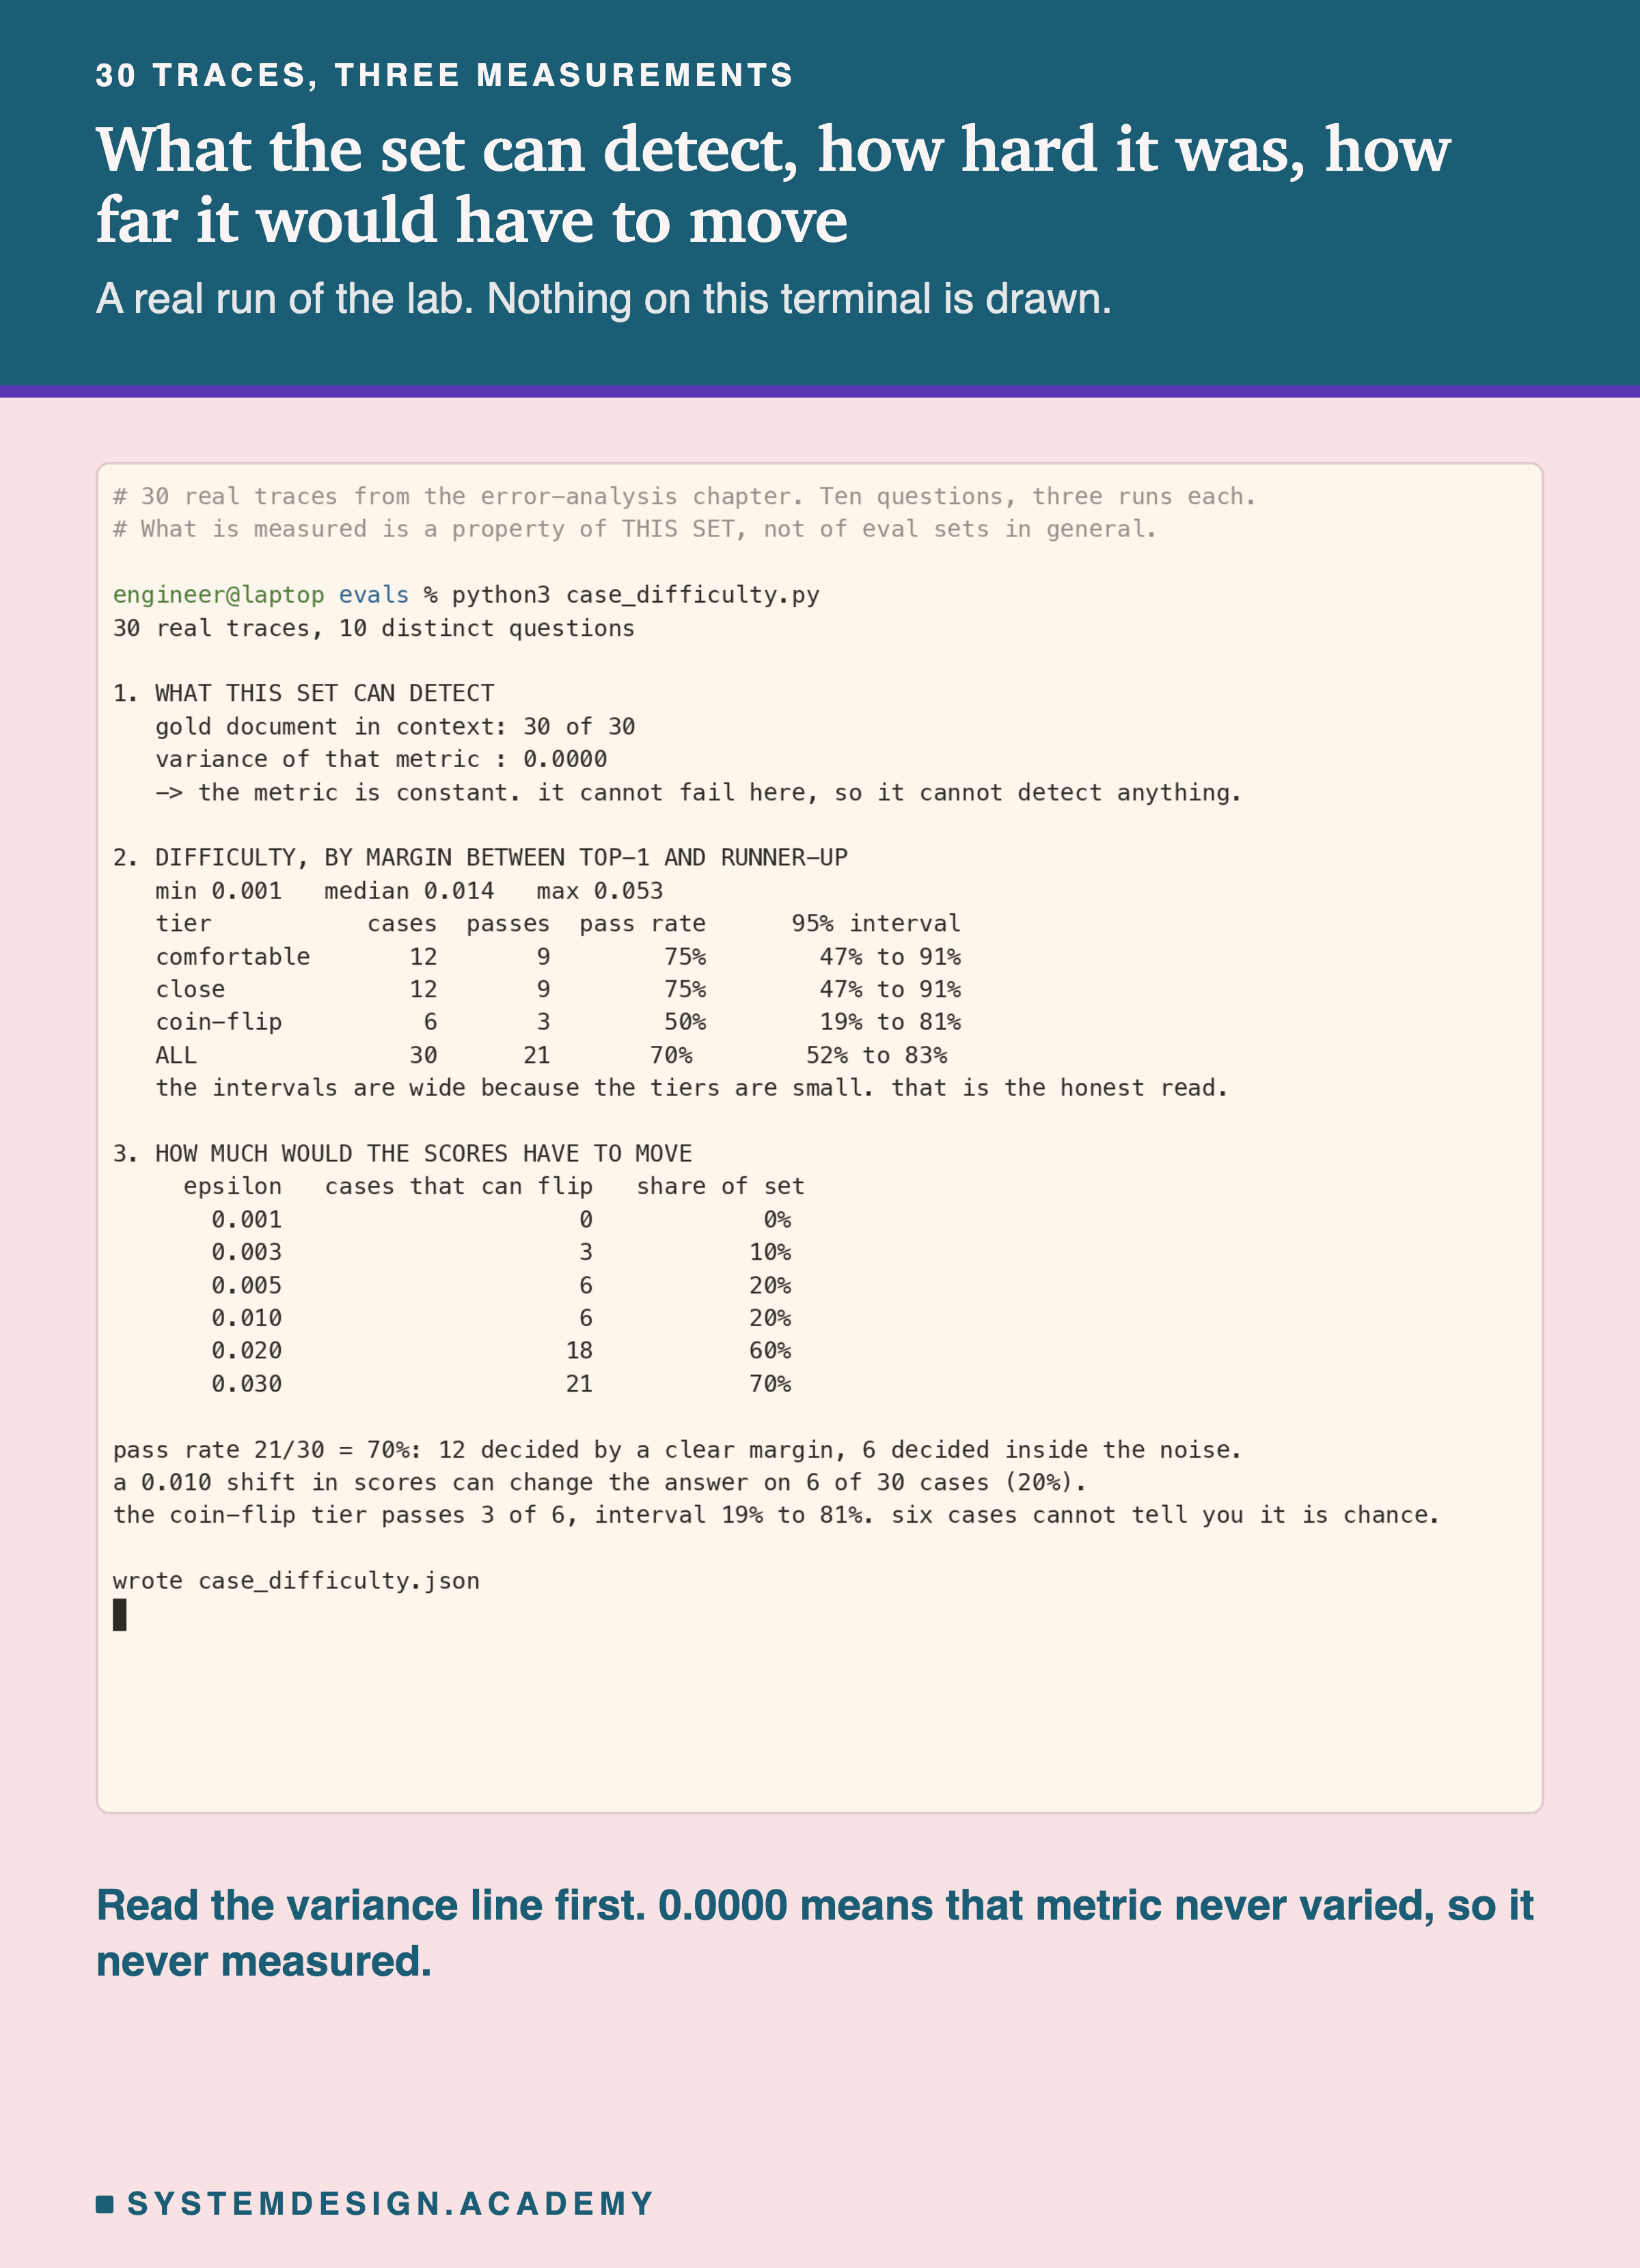
Read the variance line first. It is the only line that tells you whether the rest of the output is worth anything. Then read the intervals in section two, then the sweep in section three. The pass rate is the least informative number the lab prints.
What to Do About It
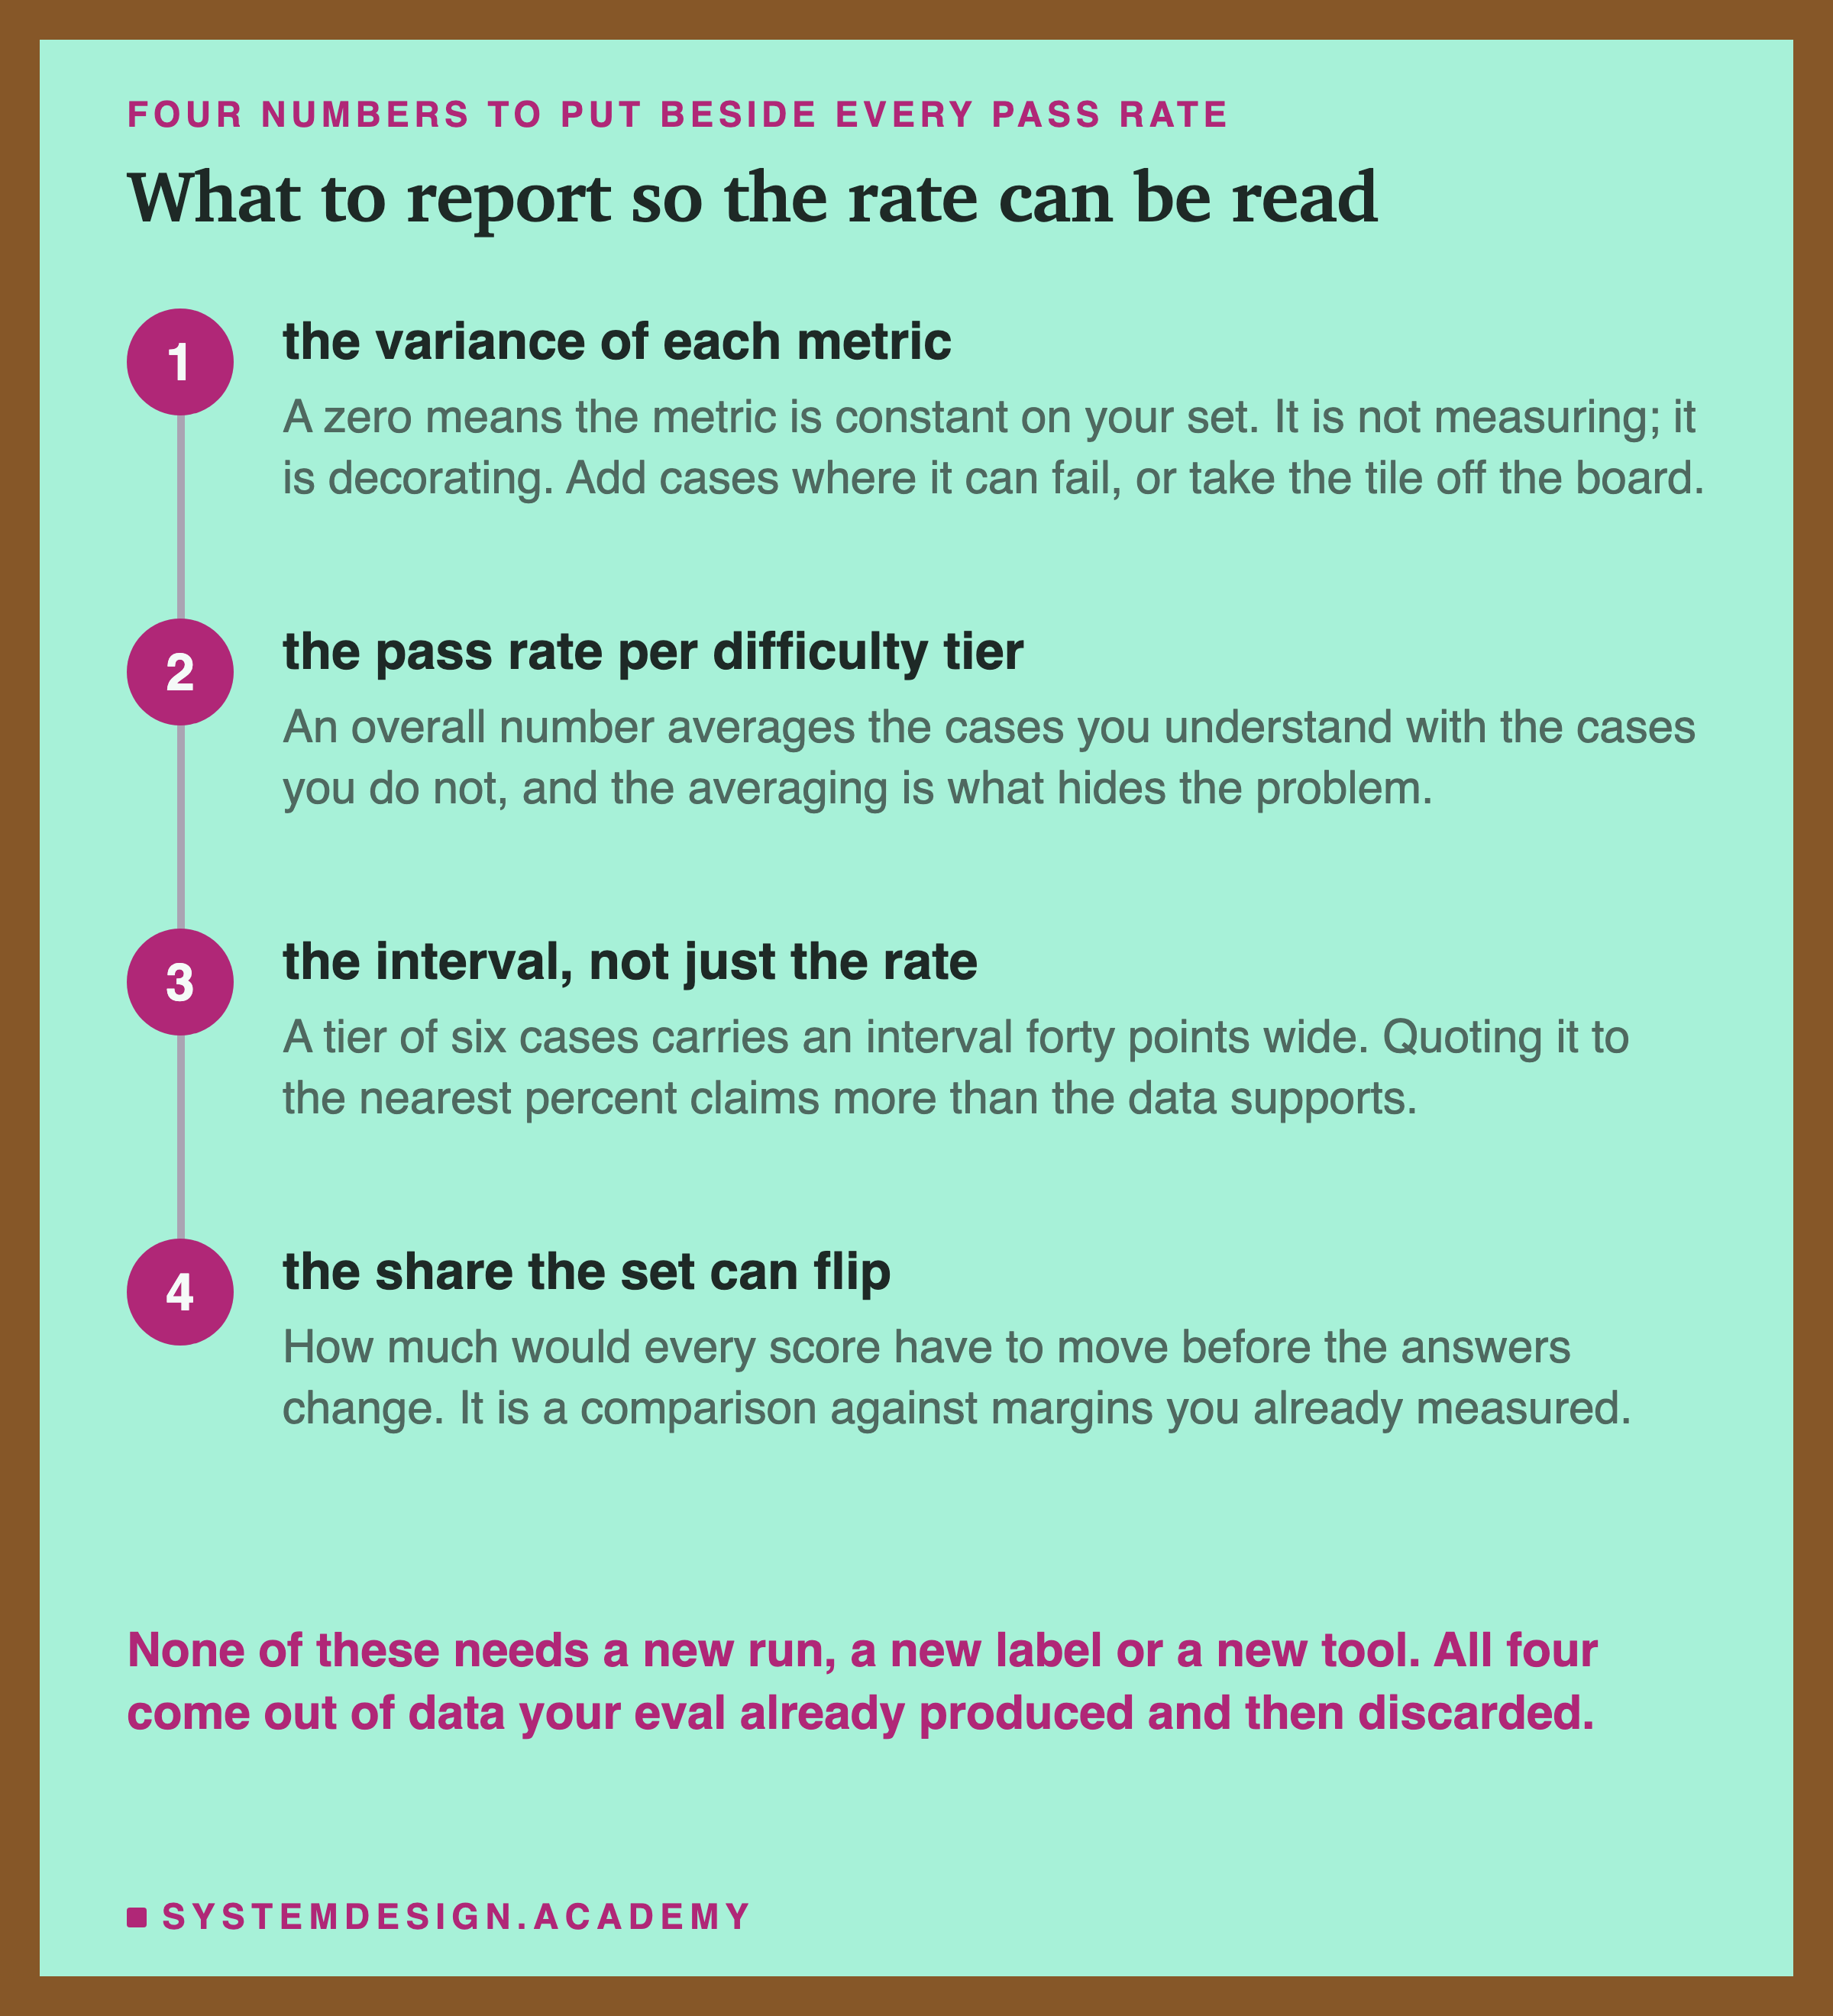
None of this says throw the set away. Thirty real traces are worth more than three hundred invented ones. It says the pass rate needs two numbers beside it before anyone trusts it.
Report the variance of every metric. A metric with zero variance on your set is not measuring; it is decorating. Either add cases where it can fail, or take it off the dashboard.
Report the pass rate per difficulty tier, not just overall. An overall number averages a tier you understand with a tier you do not, and the averaging is what hides the problem.
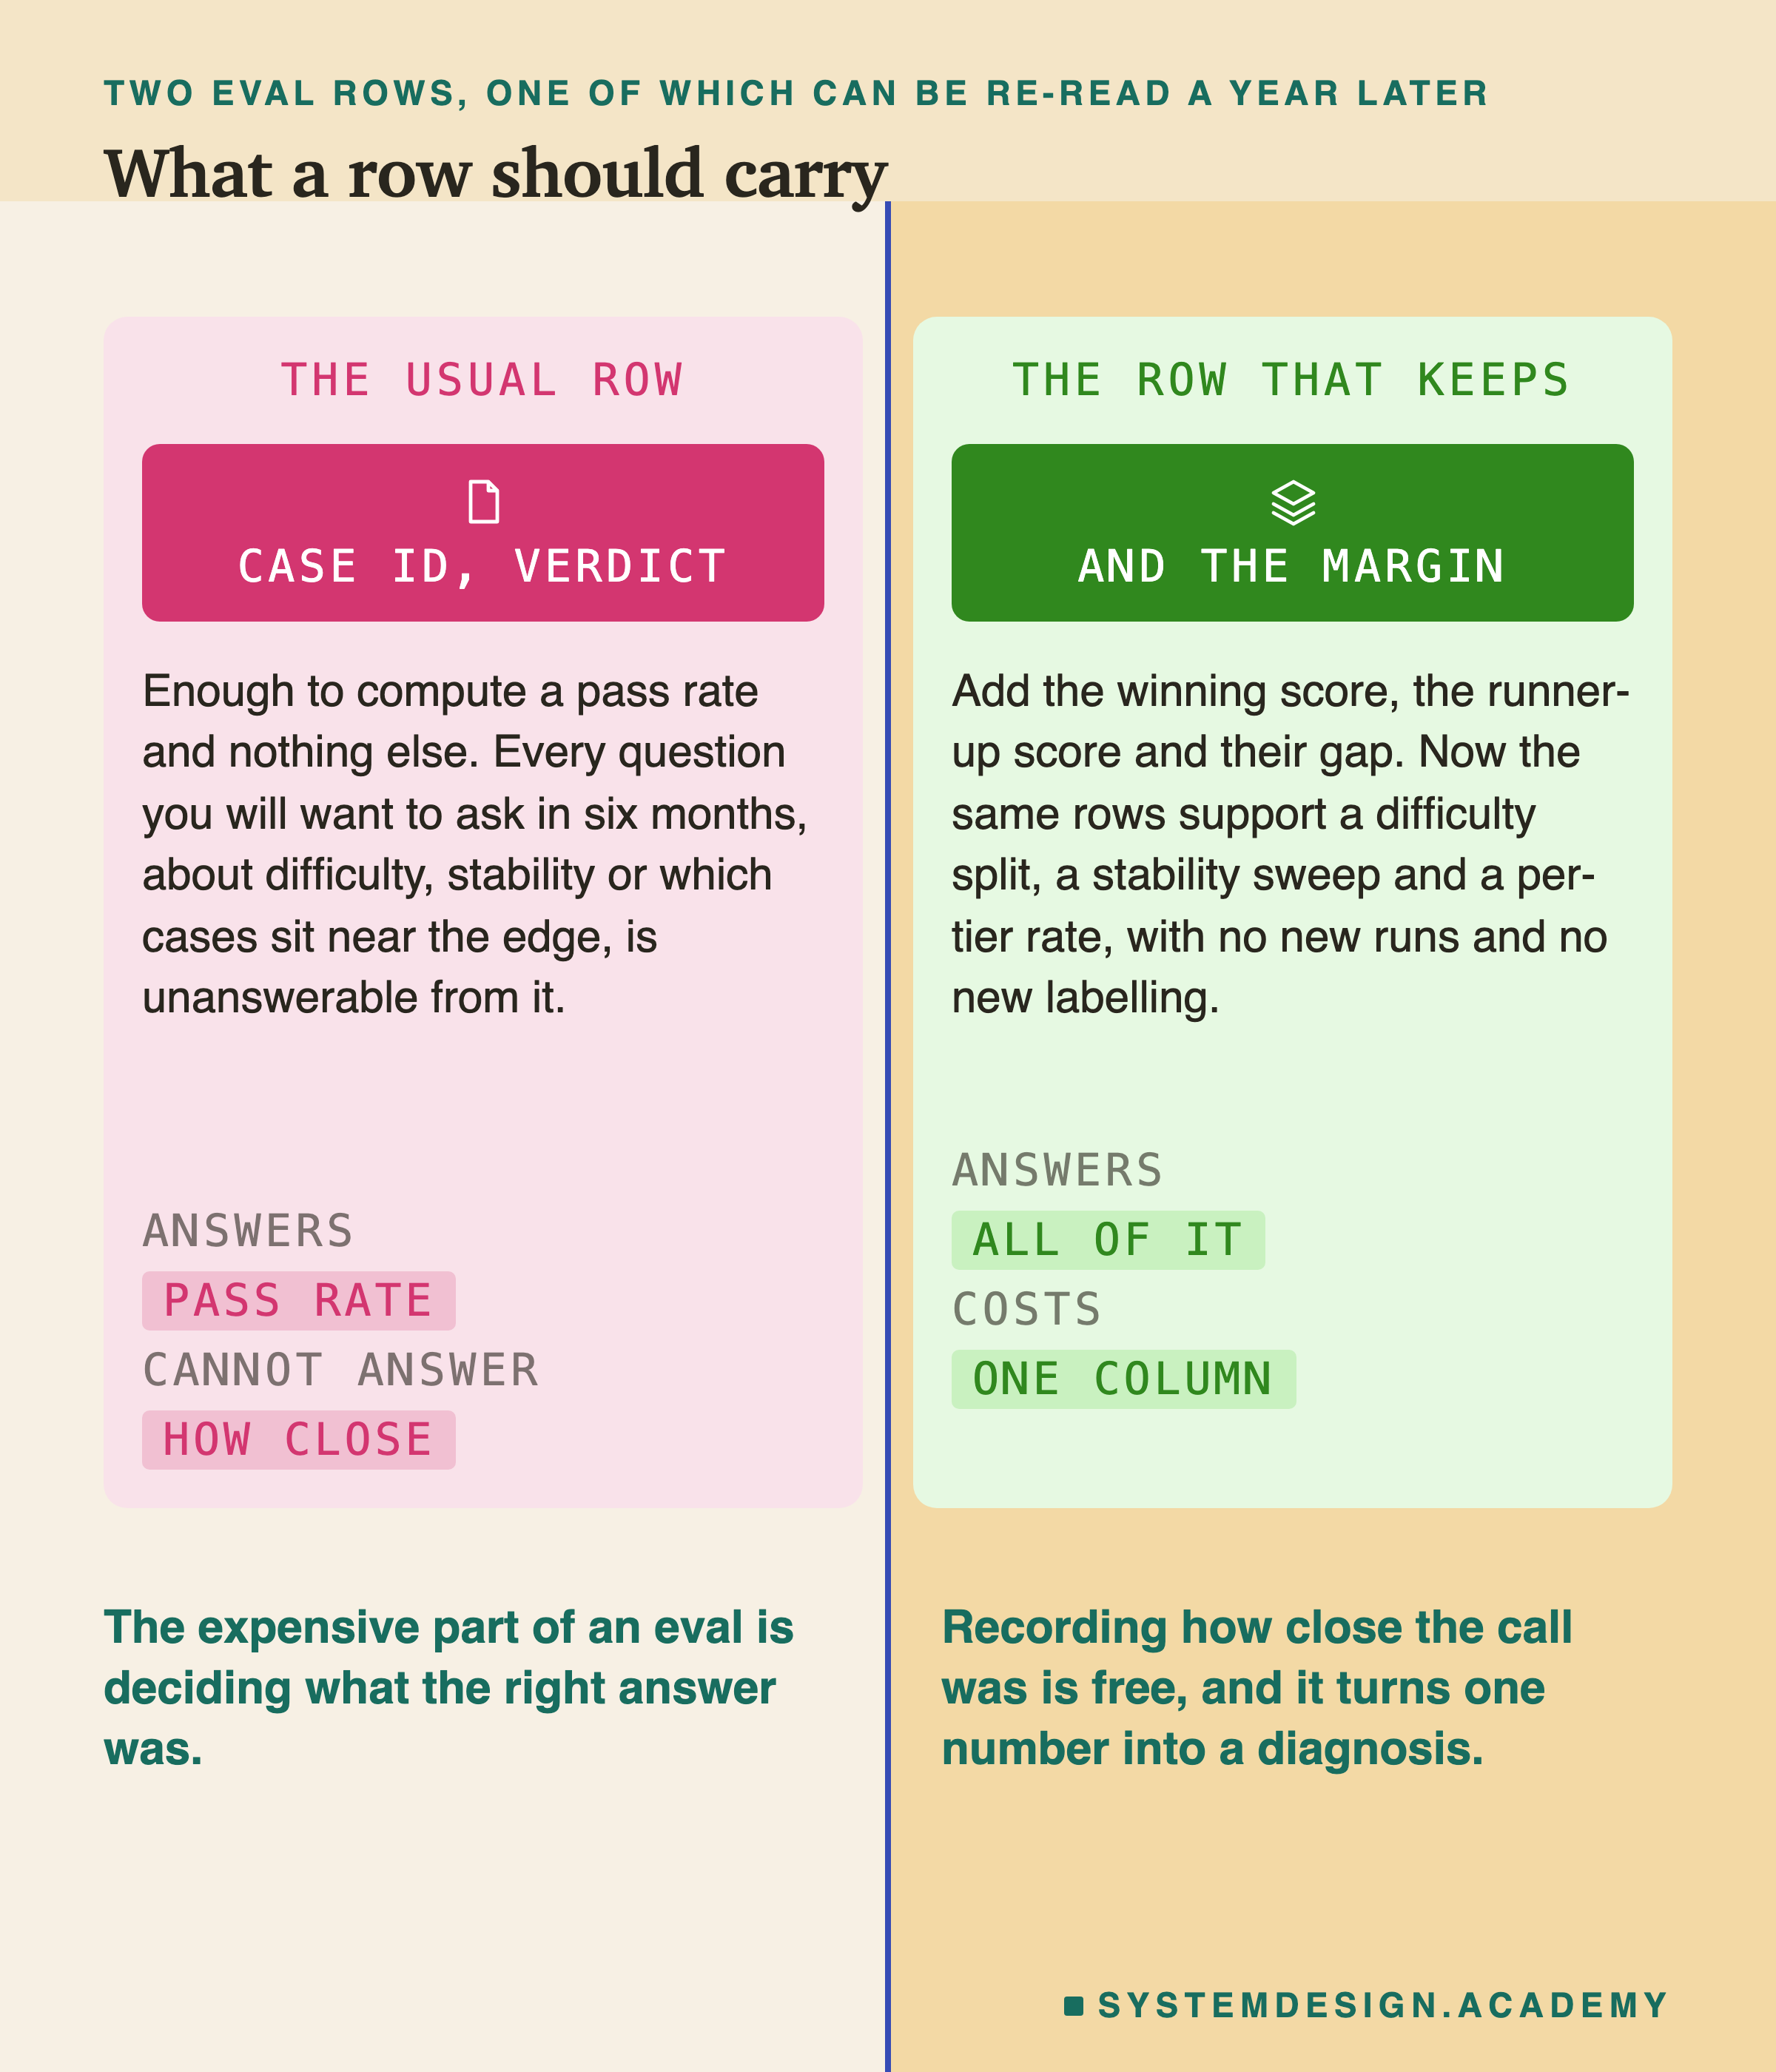
Keep the margin. Whatever your scorer is, it produced a number for the winner and a number for the runner-up. Store the gap. It costs one column and it is the only record of how close the call was.
Knowledge Check
Knowledge Check
4 questions - Score 80% to pass
Your retrieval metric reads 100% across your whole eval set. What have you learned?
Two cases both pass. One was won by a margin of 0.053, the other by 0.001. What does the pass rate record?
The coin-flip tier passes 3 of 6. What can you conclude?
Why can the flip analysis be computed without running anything again?