systemdesign.academyAI EngineeringFree lessonsSign inGet the course
  1. Home
  2. AI Engineering: Evaluation, LLM Ops and Security
Previous lessonError Analysis: Reading Failures Before Building MetricsNext lessonLLM-as-Judge and Its Failure Modes

System Design

  • Foundation
  • Intermediate
  • Advanced
  • Capstone

AI Engineering

  • Foundation
  • Data, RAG and Agents
  • Evaluation, LLM Ops and Security

systemdesign.academy

  • Home
  • Glossary
  • Interview prep
  • Reviews
  • About
  • Pricing
  • Privacy
  • Terms
  • Refunds
  • Delivery
  • Contact
  • LLM Evaluation and Error Analysis
  • Building a Golden Dataset: The Set That Catches Regressions
  • AI Engineering · Evals

    Building a Golden Dataset: The Set That Catches Regressions

    Free preview: the first part of this 14-part lesson.

    Already bought the course? Sign in to read the whole lesson.

    this lesson is part of

    AI Engineering

    Unlock this lesson and the 199 other paid lessons

    • 210 lessons in 16 chapters
    • 118 lessons built on a lab that really ran
    • An AI tutor beside every lesson that answers and draws
    • Lifetime access, every new lesson included

    $49 once, by PayPal

    See the AI Engineering course

    The rest of this lesson

    1. What a Golden Dataset Actually Is
    2. Where the Cases Come From, and What Goes In
    3. Where the Answer Key Comes From: Consensus, Not One Opinion
    4. Why Not Just Sample Traffic at Random?
    5. A Coverage Map Turns 'Are We Testing Enough?' Into a Picture
    6. How Big, and Why Bigger Is Not Better
    7. The Regression Test: Run It Before and After
    8. Version the Set Like Code, Diff Per Case
    9. When You Have No Real Cases: Synthetic Data, Carefully
    10. A Golden Set Rots If You Let It
    11. The Trap: Never Let the Golden Set Touch Training
    12. How Teams Actually Run This
    13. Knowledge Check

    read the rest of this lesson in

    AI Engineering

    Unlock this lesson and the 199 other paid lessons

    • 210 lessons in 16 chapters
    • 118 lessons built on a lab that really ran
    • An AI tutor beside every lesson that answers and draws
    • Lifetime access, every new lesson included

    $49 once, by PayPal

    See the AI Engineering course

    Continue this lesson

    in Evals

    This lesson is part of the AI Engineering course. Unlock the full course, a separate one-time payment, for lifetime access.

    One-time payment. Lifetime access. No subscription.
    Global
    $49/lifetime

    One-time payment via PayPal

    Get Lifetime Access
    Foundation lessons free, try before you buy
    India Special
    India
    ₹999/lifetime

    One-time payment: UPI, card or netbanking

    Get Lifetime Access
    Foundation lessons free, try before you buy
    Every ML Platform lesson, Foundation to Advanced
    Real architecture diagrams with real tool logos
    MLOps, LLMOps, and data engineering in depth
    Quizzes with instant feedback
    Built and reviewed by senior engineers
    Lifetime access, all future content included

    Foundation lessons of this course are free, no payment needed. Try them now

    The Prompt Tweak That Fixed One Thing and Broke Three

    In April 2026, Anthropic added a short instruction to the Claude Code system prompt. It told the model to keep the text between tool calls under 25 words and to keep final responses short unless the task needed detail. The goal was reasonable: Opus had grown verbose and was burning tokens. The standard set of evaluations they ran before shipping showed no regression. So they shipped it.

    Then the complaints came in. The model felt terse and mechanical. That is a regression: something that used to work stopped working, quietly, because of a change nobody connected to it. When they went back and ran a broader set of evaluations, one of them showed a 3 percent drop, for two different model versions. A single short instruction, well under 25 words, had quietly cost measurable quality on a task their normal suite never checked. They reverted it a few days later. Anthropic wrote this up in the open, and it is worth reading:

    an update on recent Claude Code quality reports.
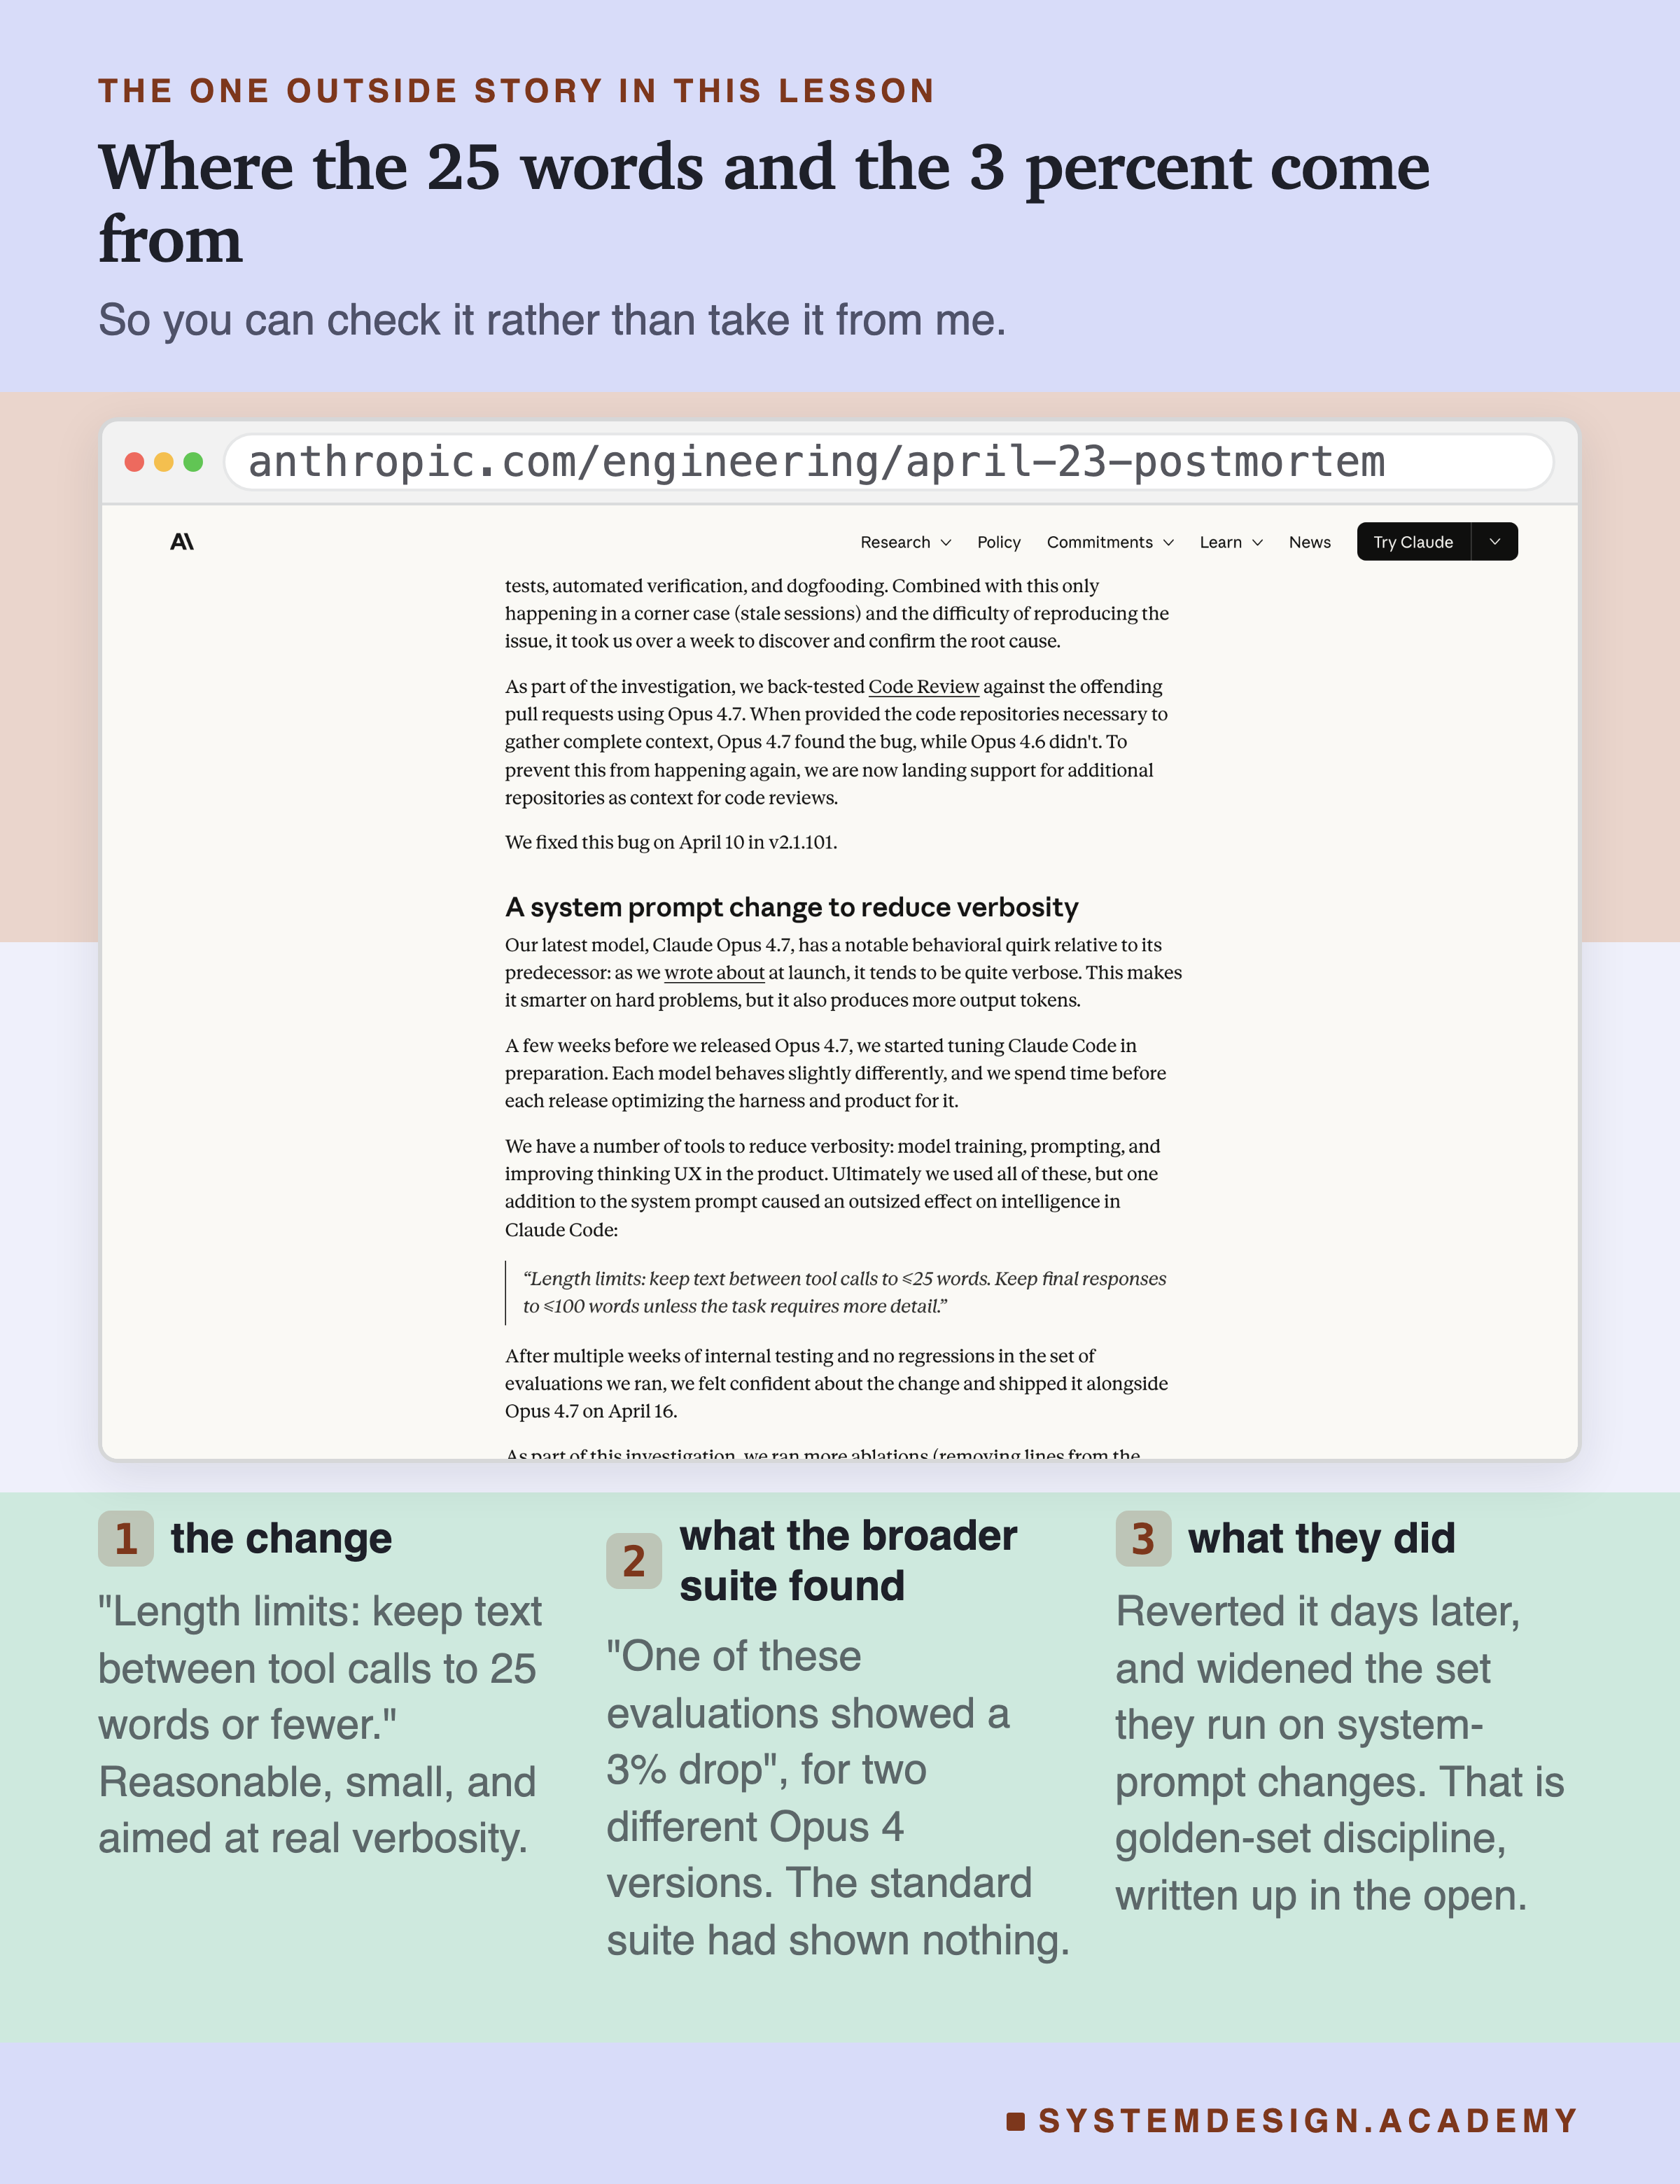
    A screenshot card of Anthropic's Claude Code postmortem page, with three points pulled out so the story can be checked rather than taken on trust. The change: keep text between tool calls to 25 words or fewer. What the broader suite found: one of the evaluations showed a 3 percent drop, for two different Opus 4 versions, where the standard suite had shown nothing. What they did: reverted days later, and widened the set they run on system-prompt changes

    I am asking you to read a story about a team that got this wrong, so the page it comes from is here rather than a footnote. The quotes above are theirs, not my summary of them. If you only click one link in this chapter, make it that one. A careful team writing up a regression they shipped is rarer, and more useful, than any framework.

    Sit with what happened there. A careful team, with a real eval suite, tested a tiny change for weeks. They still shipped a regression. The specific case that broke was not in the set they ran. The change probably fixed the verbosity it was aimed at. It also broke something else, and nobody saw it until users did. This is not a story about a sloppy team. It is a story about the limits of an eval set that was not built to catch this particular kind of break. That is a design problem, not an effort problem.
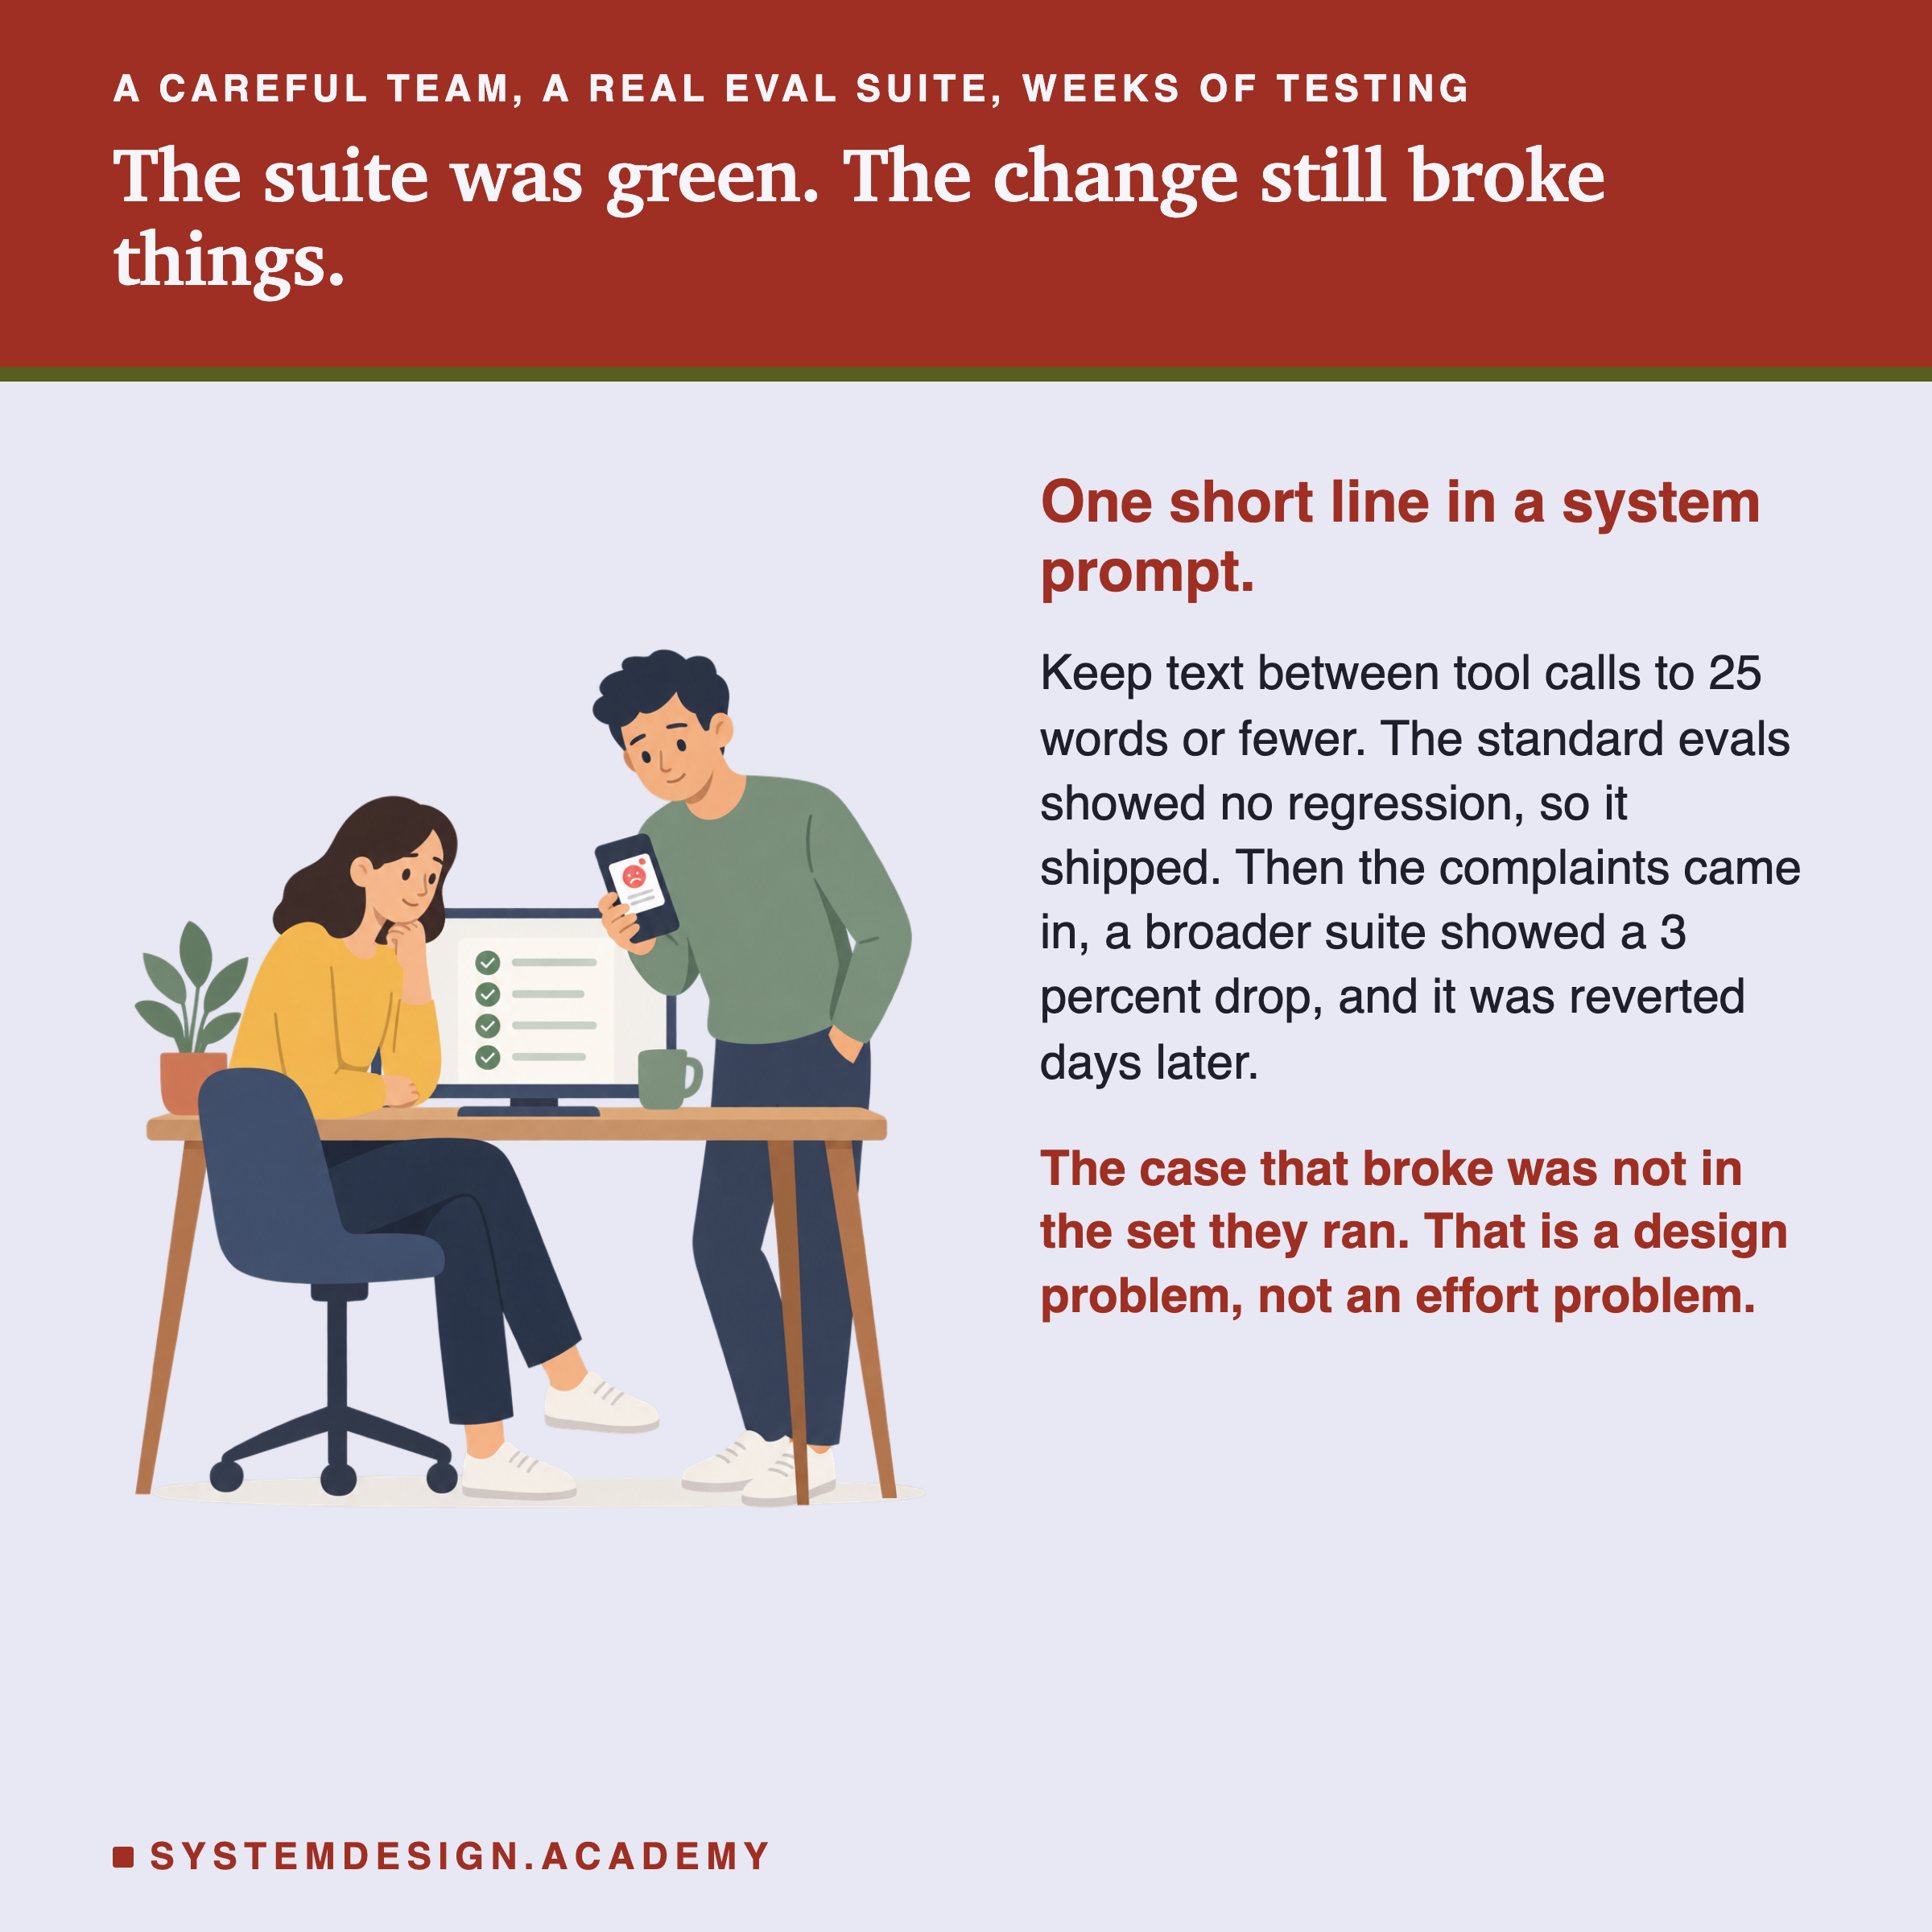
    An illustrated scene of two engineers looking at a monitor showing a green checklist with every tick in place, while one of them holds a phone with an unhappy message. Beside it the story: one short line in a system prompt asking for 25 words or fewer between tool calls, standard evals showing no regression so it shipped, then complaints, then a broader suite showing a 3 percent drop, then a revert days later. The closing line is that the case which broke was not in the set they ran, which is a design problem rather than an effort problem

    Sit with the shape of it. The suite was real, the change was small, and the testing was weeks long. None of that helped, because the case that broke was not in the set. You cannot test your way out of a coverage gap by testing harder.
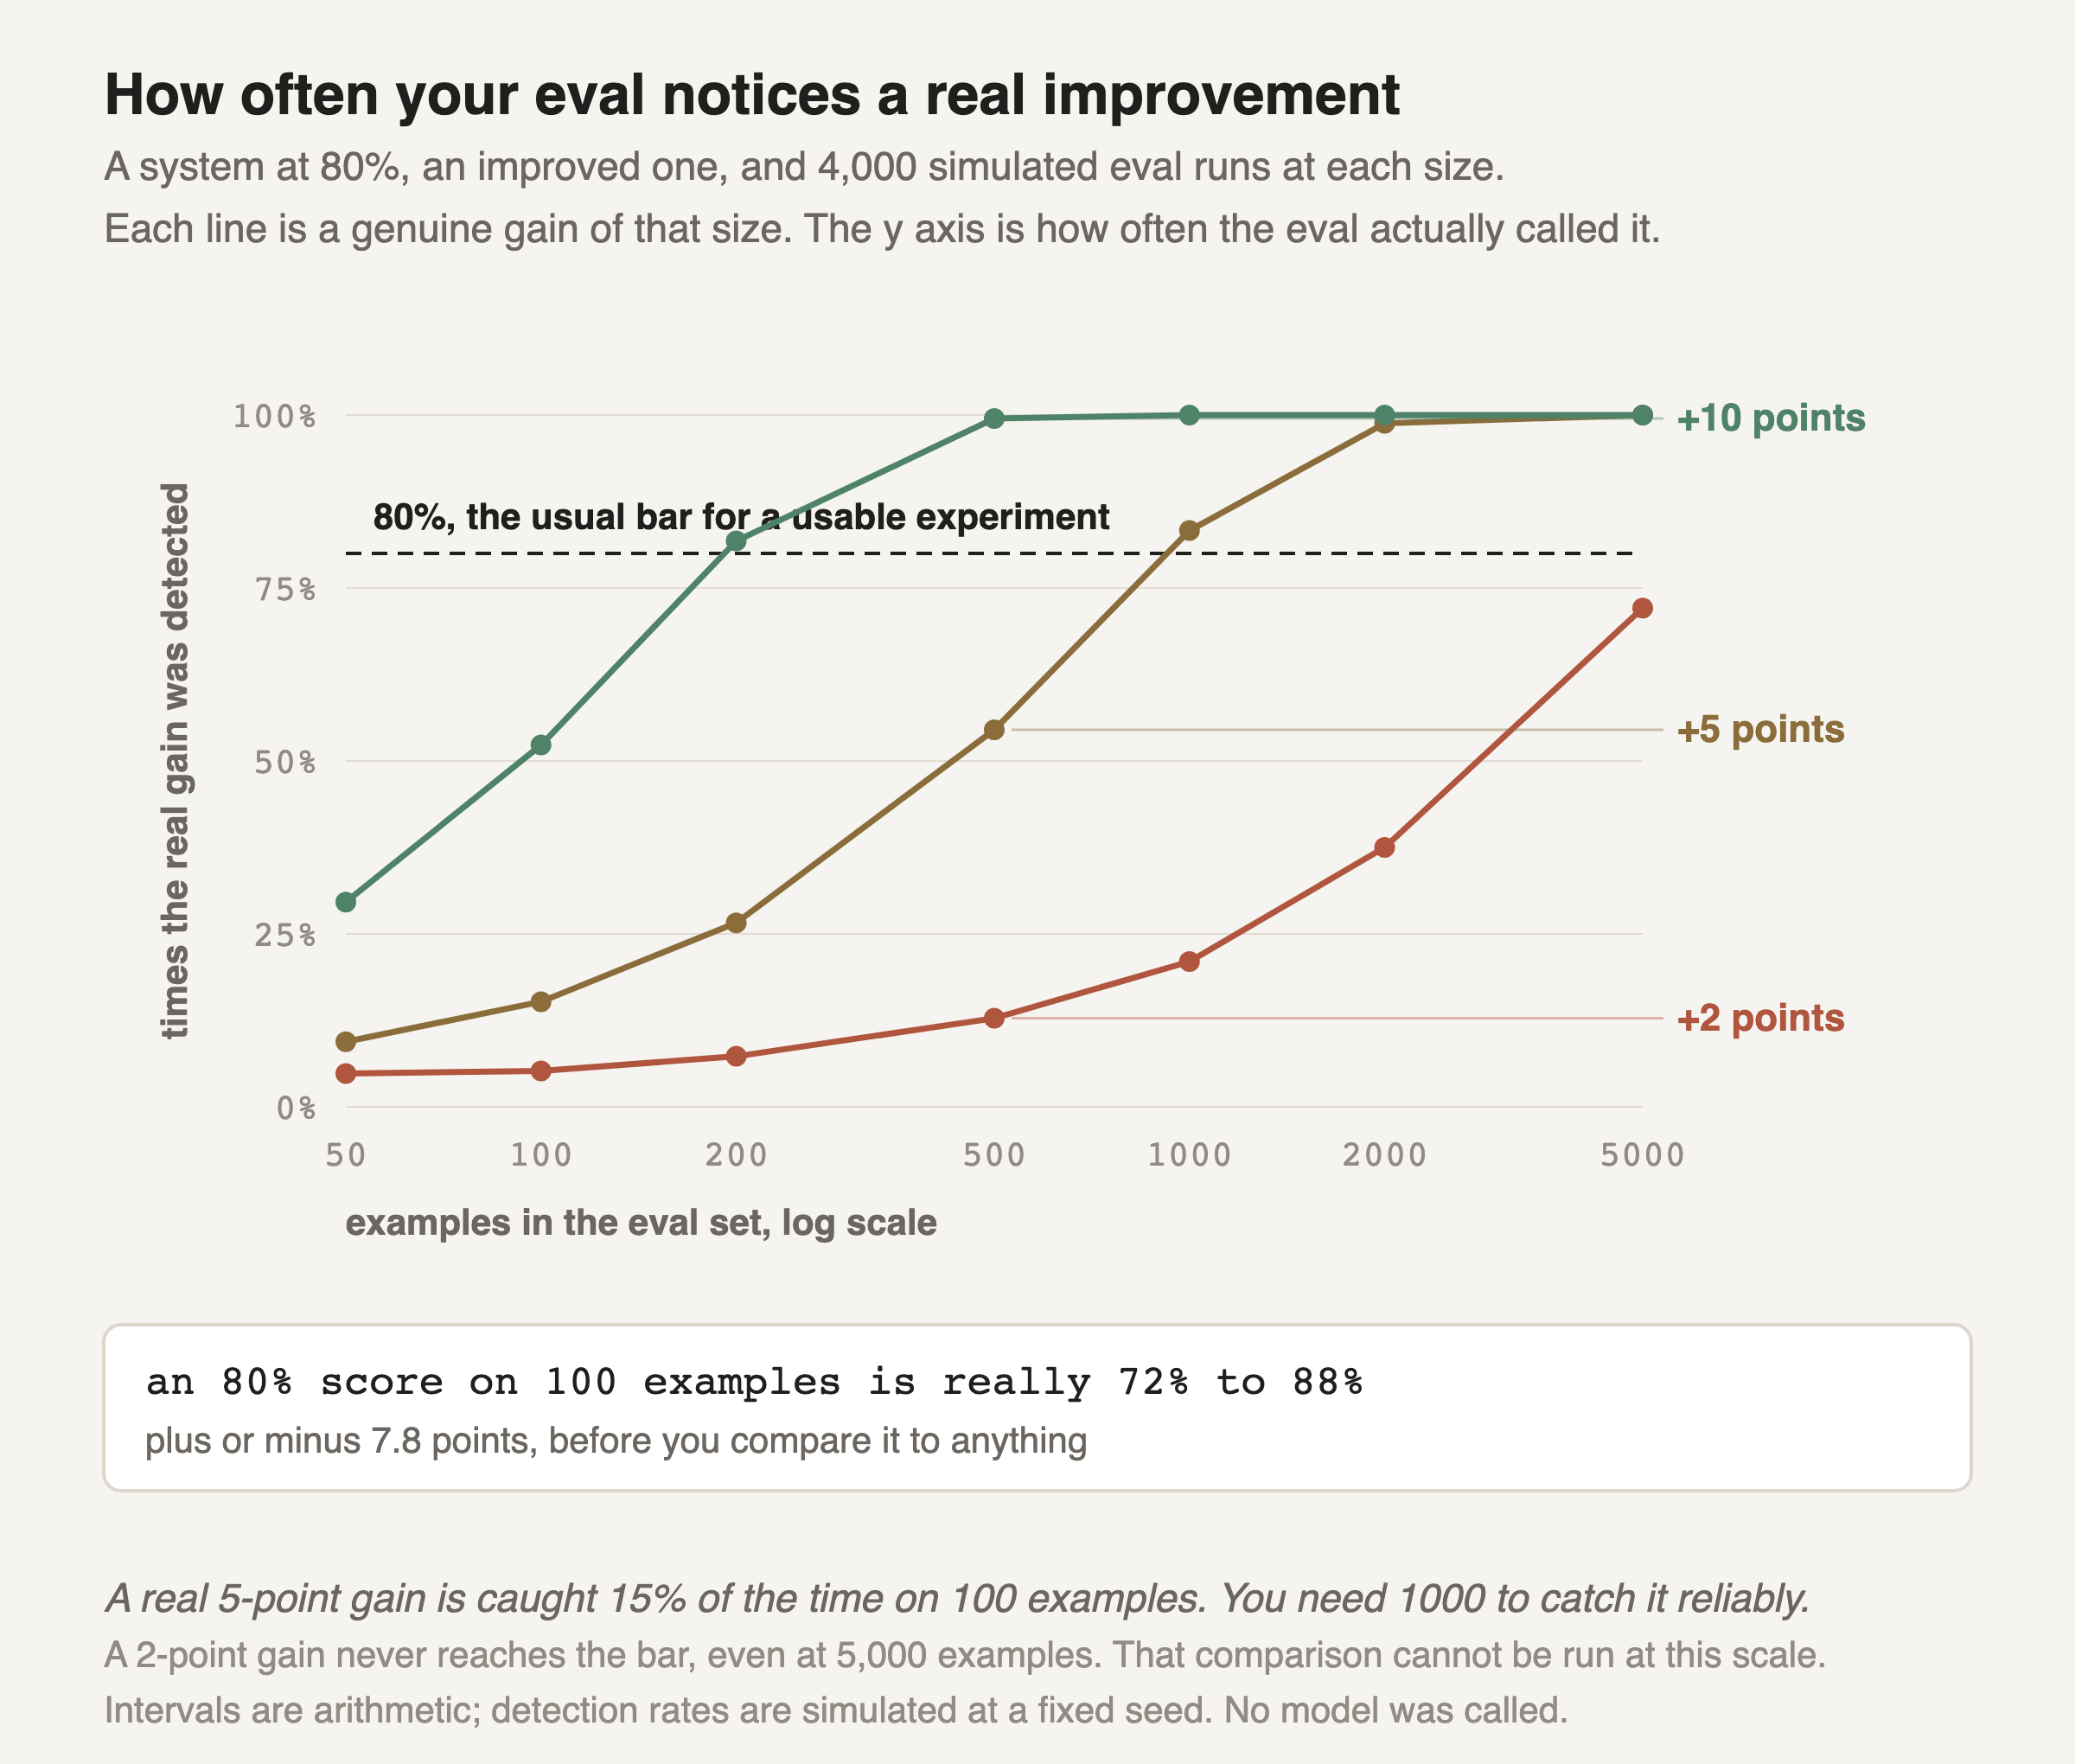
    A log-scale chart of how often a real improvement is detected, against the number of examples in the eval set, for gains of 2, 5 and 10 points over an 80 percent baseline, from 4,000 simulated eval runs at each size. A 10-point gain is detected 30 percent of the time at 50 examples, 52 at 100, 82 at 200 and effectively always from 500. A 5-point gain is detected 9 percent at 50, 15 at 100, 27 at 200, 55 at 500 and 83 at 1,000. A 2-point gain is detected 5 percent at 100, 21 percent at 1,000 and 72 percent at 5,000, never reaching the 80 percent bar. A panel notes that an 80 percent score on 100 examples is really 72 to 88 percent.
    ChartConfidence intervals are arithmetic; detection rates are simulated at a fixed seed

    The 3 percent drop in that story is worth sitting with for a different reason. A 3-point move is right at the size where the number of examples decides whether you see it at all.

    Start with a single score. Eighty percent on 100 examples is not 80 percent. It is somewhere between 72 and 88, and that is before comparing it to anything. Run the identical system twice and the two scores will differ by several points for no reason whatsoever.

    Now the comparison. Each line is a genuine improvement of that size, put through 4,000 simulated eval runs. The y axis is how often the eval actually noticed. On 100 examples a real 5-point gain is caught 15 percent of the time, so 85 percent of the time you conclude your better prompt did nothing. To catch it reliably you need about 1,000 examples.

    The 2-point line never reaches the bar, even at 5,000. That is the uncomfortable part. If your eval set is a few hundred examples, a 2-point difference is not a small signal you should look at harder. It is not a signal your experiment can produce.

    Which turns "how many examples do I need" from a matter of taste into arithmetic. Decide the smallest improvement worth shipping, then size the set so you would actually catch it. If you cannot afford that many labelled examples, that is a real constraint. The honest response is to stop reporting differences the set cannot support, rather than to report them anyway.

    None of this makes a bigger set enough on its own. In the Anthropic story the size was not the problem. The failing behaviour was absent from the set entirely, and no amount of statistical power finds a case you never wrote down. Size decides what you can measure. Coverage decides what you can see at all.

    That is the failure this lesson prevents. You change a prompt, swap a model, or adjust retrieval, and the change helps one thing while hurting three others. Nothing throws an error. The average looks fine. The break reaches production silently. A is the tool that makes that break loud instead of silent, and building one well is a skill the industry pays for and rarely teaches.

    By the end of this lesson you will know which cases belong in the set, how many, and where they come from. You will also know how to keep the set from rotting, and the one mistake that turns every number it produces into a lie.