The Rollback That Took 45 Minutes
After deploying a broken release, a team needed to roll back. Their rolling deployment process took 45 minutes to replace all instances with the previous version. During those 45 minutes, users experienced errors, partial failures, and degraded performance. For a financial platform processing $2M per hour, that 45-minute window cost real money.
Blue-green deployment maintains two identical environments: Blue (current production) and Green (idle). You deploy the new version to Green, run smoke tests, then switch the from Blue to Green. If anything goes wrong, switch back to Blue. Instant rollback in seconds, not minutes.
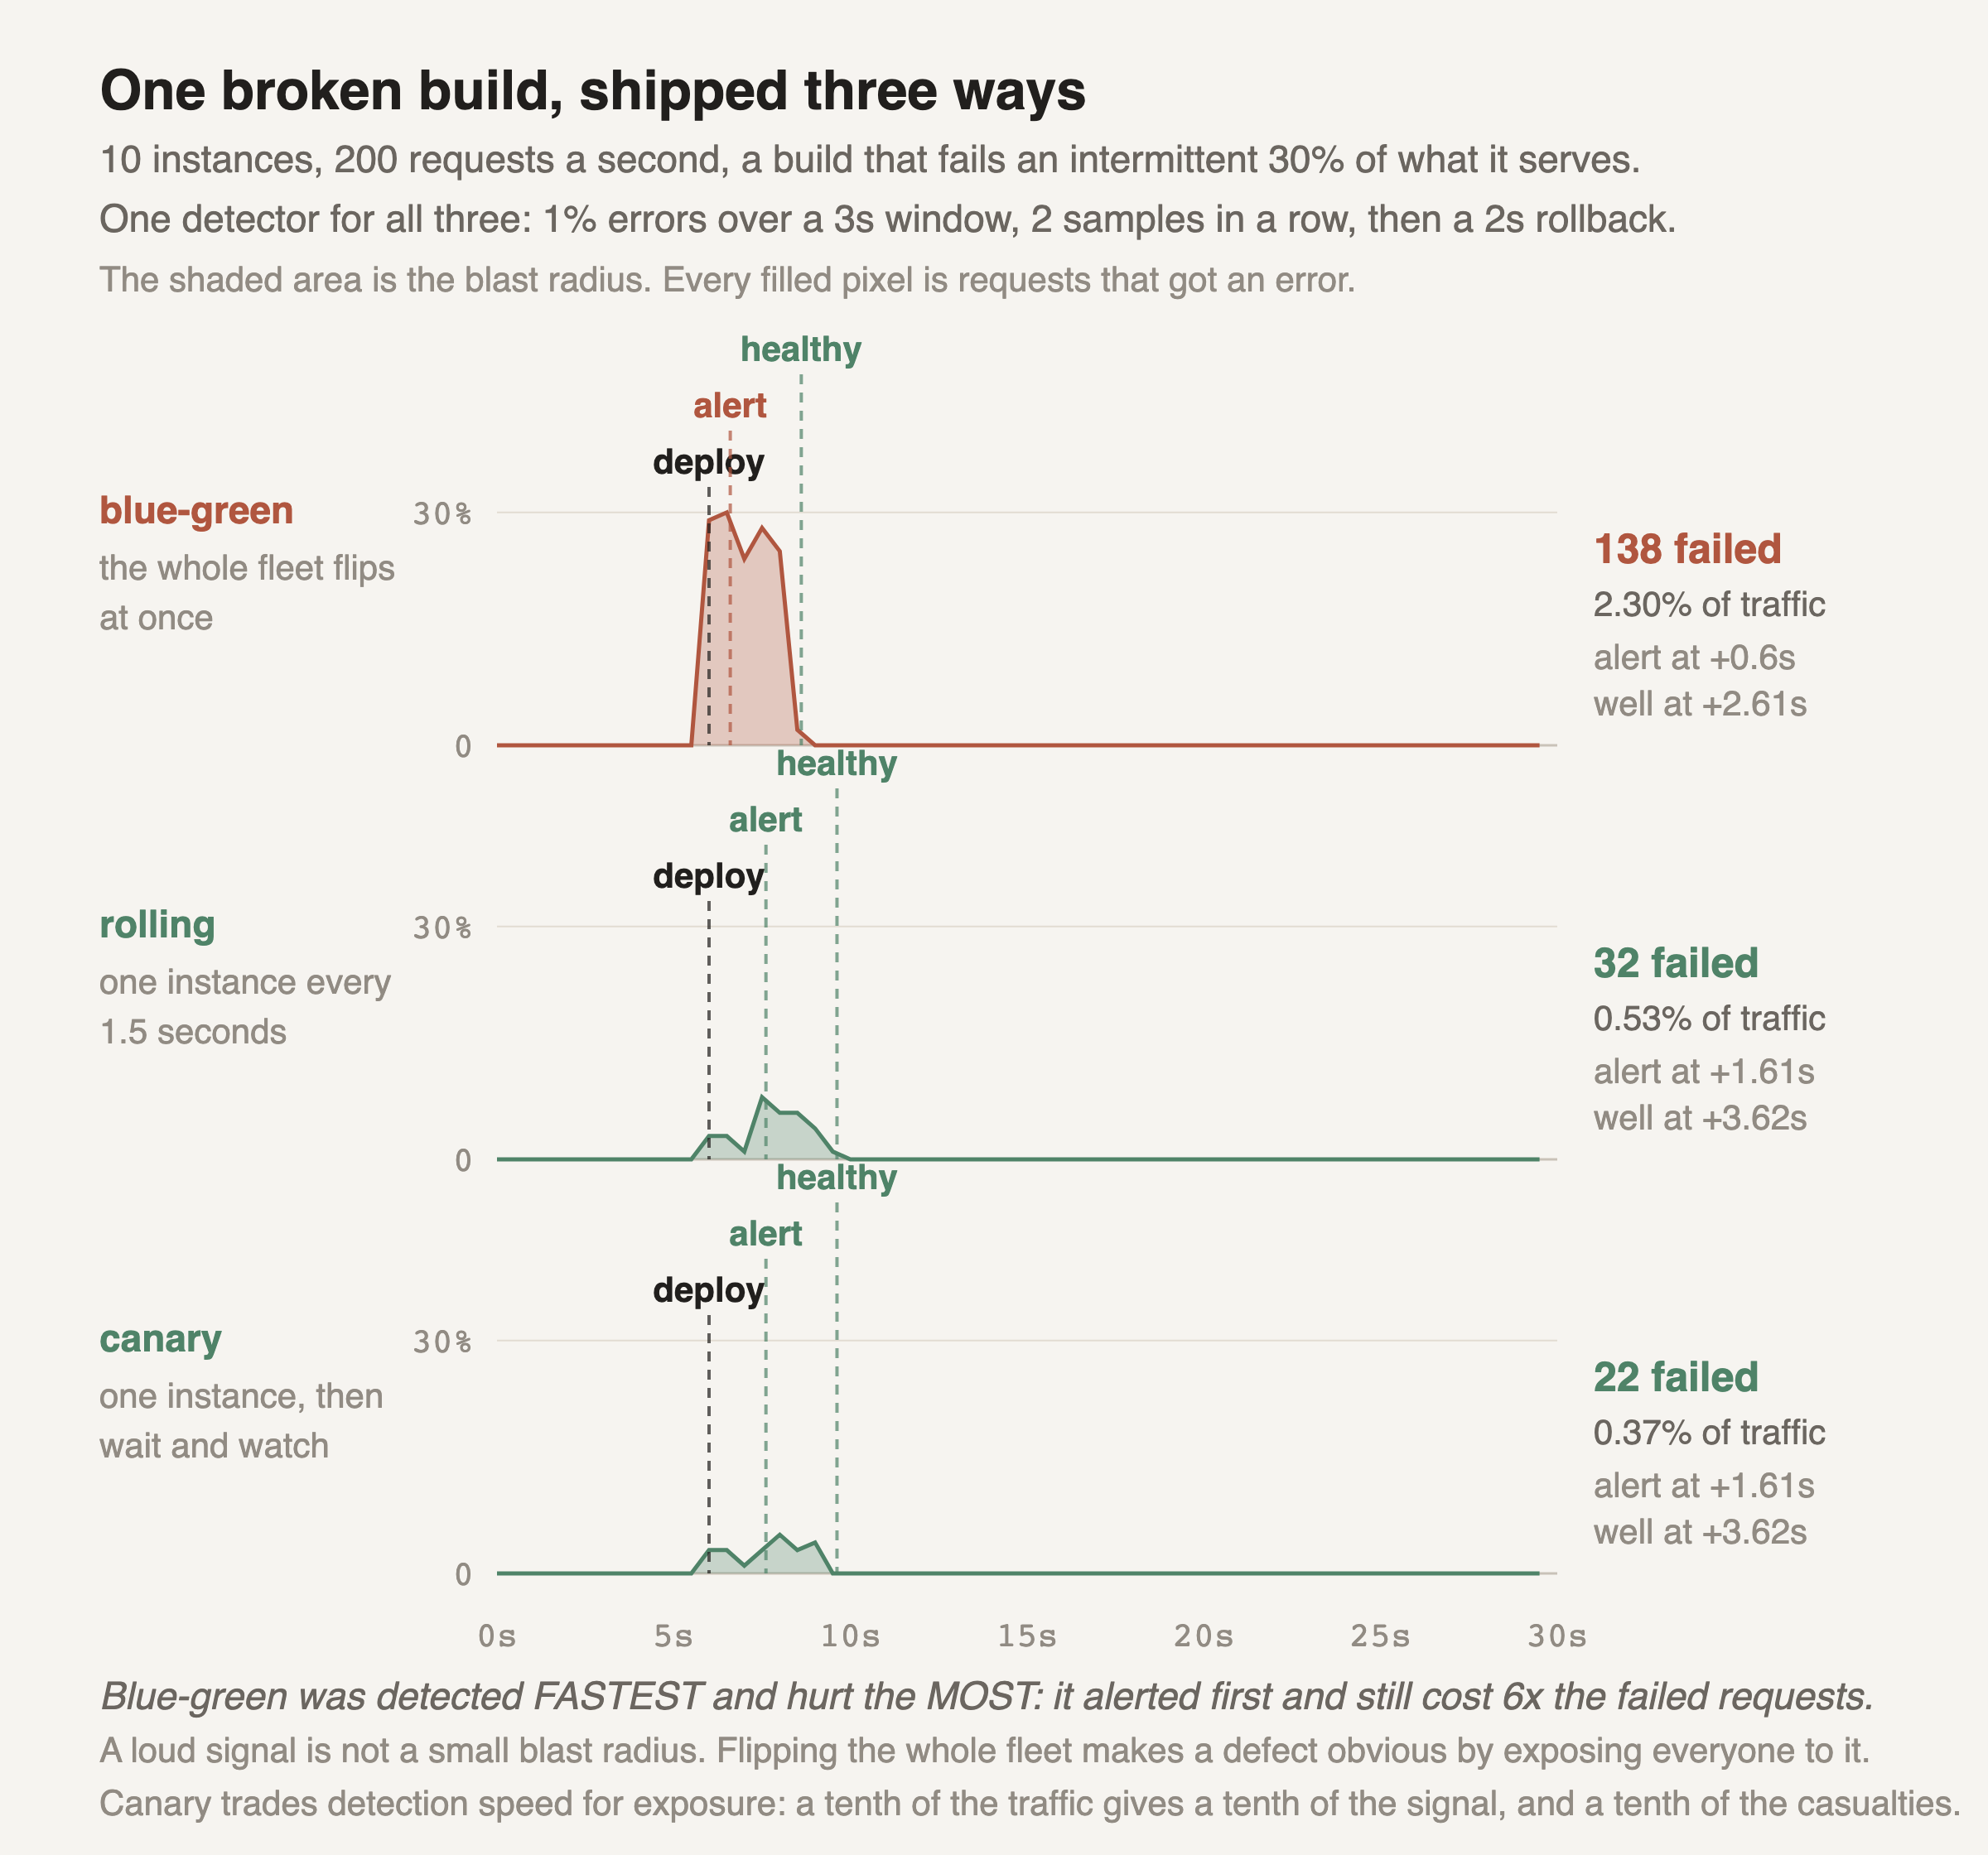
The shaded area under each curve is the blast radius. It is not a metaphor: the area is literally the requests that got an error, so a wider or taller shape means more people affected.
Blue-green produced the loudest possible signal. Flipping the whole fleet at once took the error rate straight to 30 percent and the detector fired 0.6 seconds later. On the usual scorecard that is the best result on the page.
And it hurt six times as many people as canary: 138 failed requests against 22. The reason is the shape, not the timing. For the whole detect-and-roll-back window, 100 percent of traffic was on the bad build. Spotting a problem quickly does nothing for the requests already meeting it.
Canary took two and a half times longer to notice, on purpose. One instance out of ten means a tenth of the traffic, so a tenth of the signal, so the error rate only reached 5 percent and the detector needed more samples. It also means a tenth of the casualties, and that is the trade the pattern is making.
Rolling sits between the two and keeps getting worse the longer it runs. Its curve climbs as each replaced instance adds to the exposed share. Here the detector caught it after the second instance. Had the deployment been faster, or the detector slower, it would have ended up at the blue-green result.
None of which argues against blue-green, and it is worth being precise about why. The 45-minute rollback in the story above is the problem blue-green really does solve. What this run shows is that instant rollback only helps after somebody pulls the lever. The exposure that decides your incident report happens before that, while the detector is still gathering samples, and a full flip puts every user in that window. Blue-green with a canary stage in front of the switch gives you both.
This pattern was popularized by Martin Fowler and Jez Humble in the Continuous Delivery book. Companies like LinkedIn, Etsy, and Facebook have all used variations of it for high-stakes deployments.