One Number Went Up and One Went Down
Somebody raises k on the retriever. Recall@k improves, the change is approved, and it ships. A week later the answers are worse and nothing in the diff explains it.
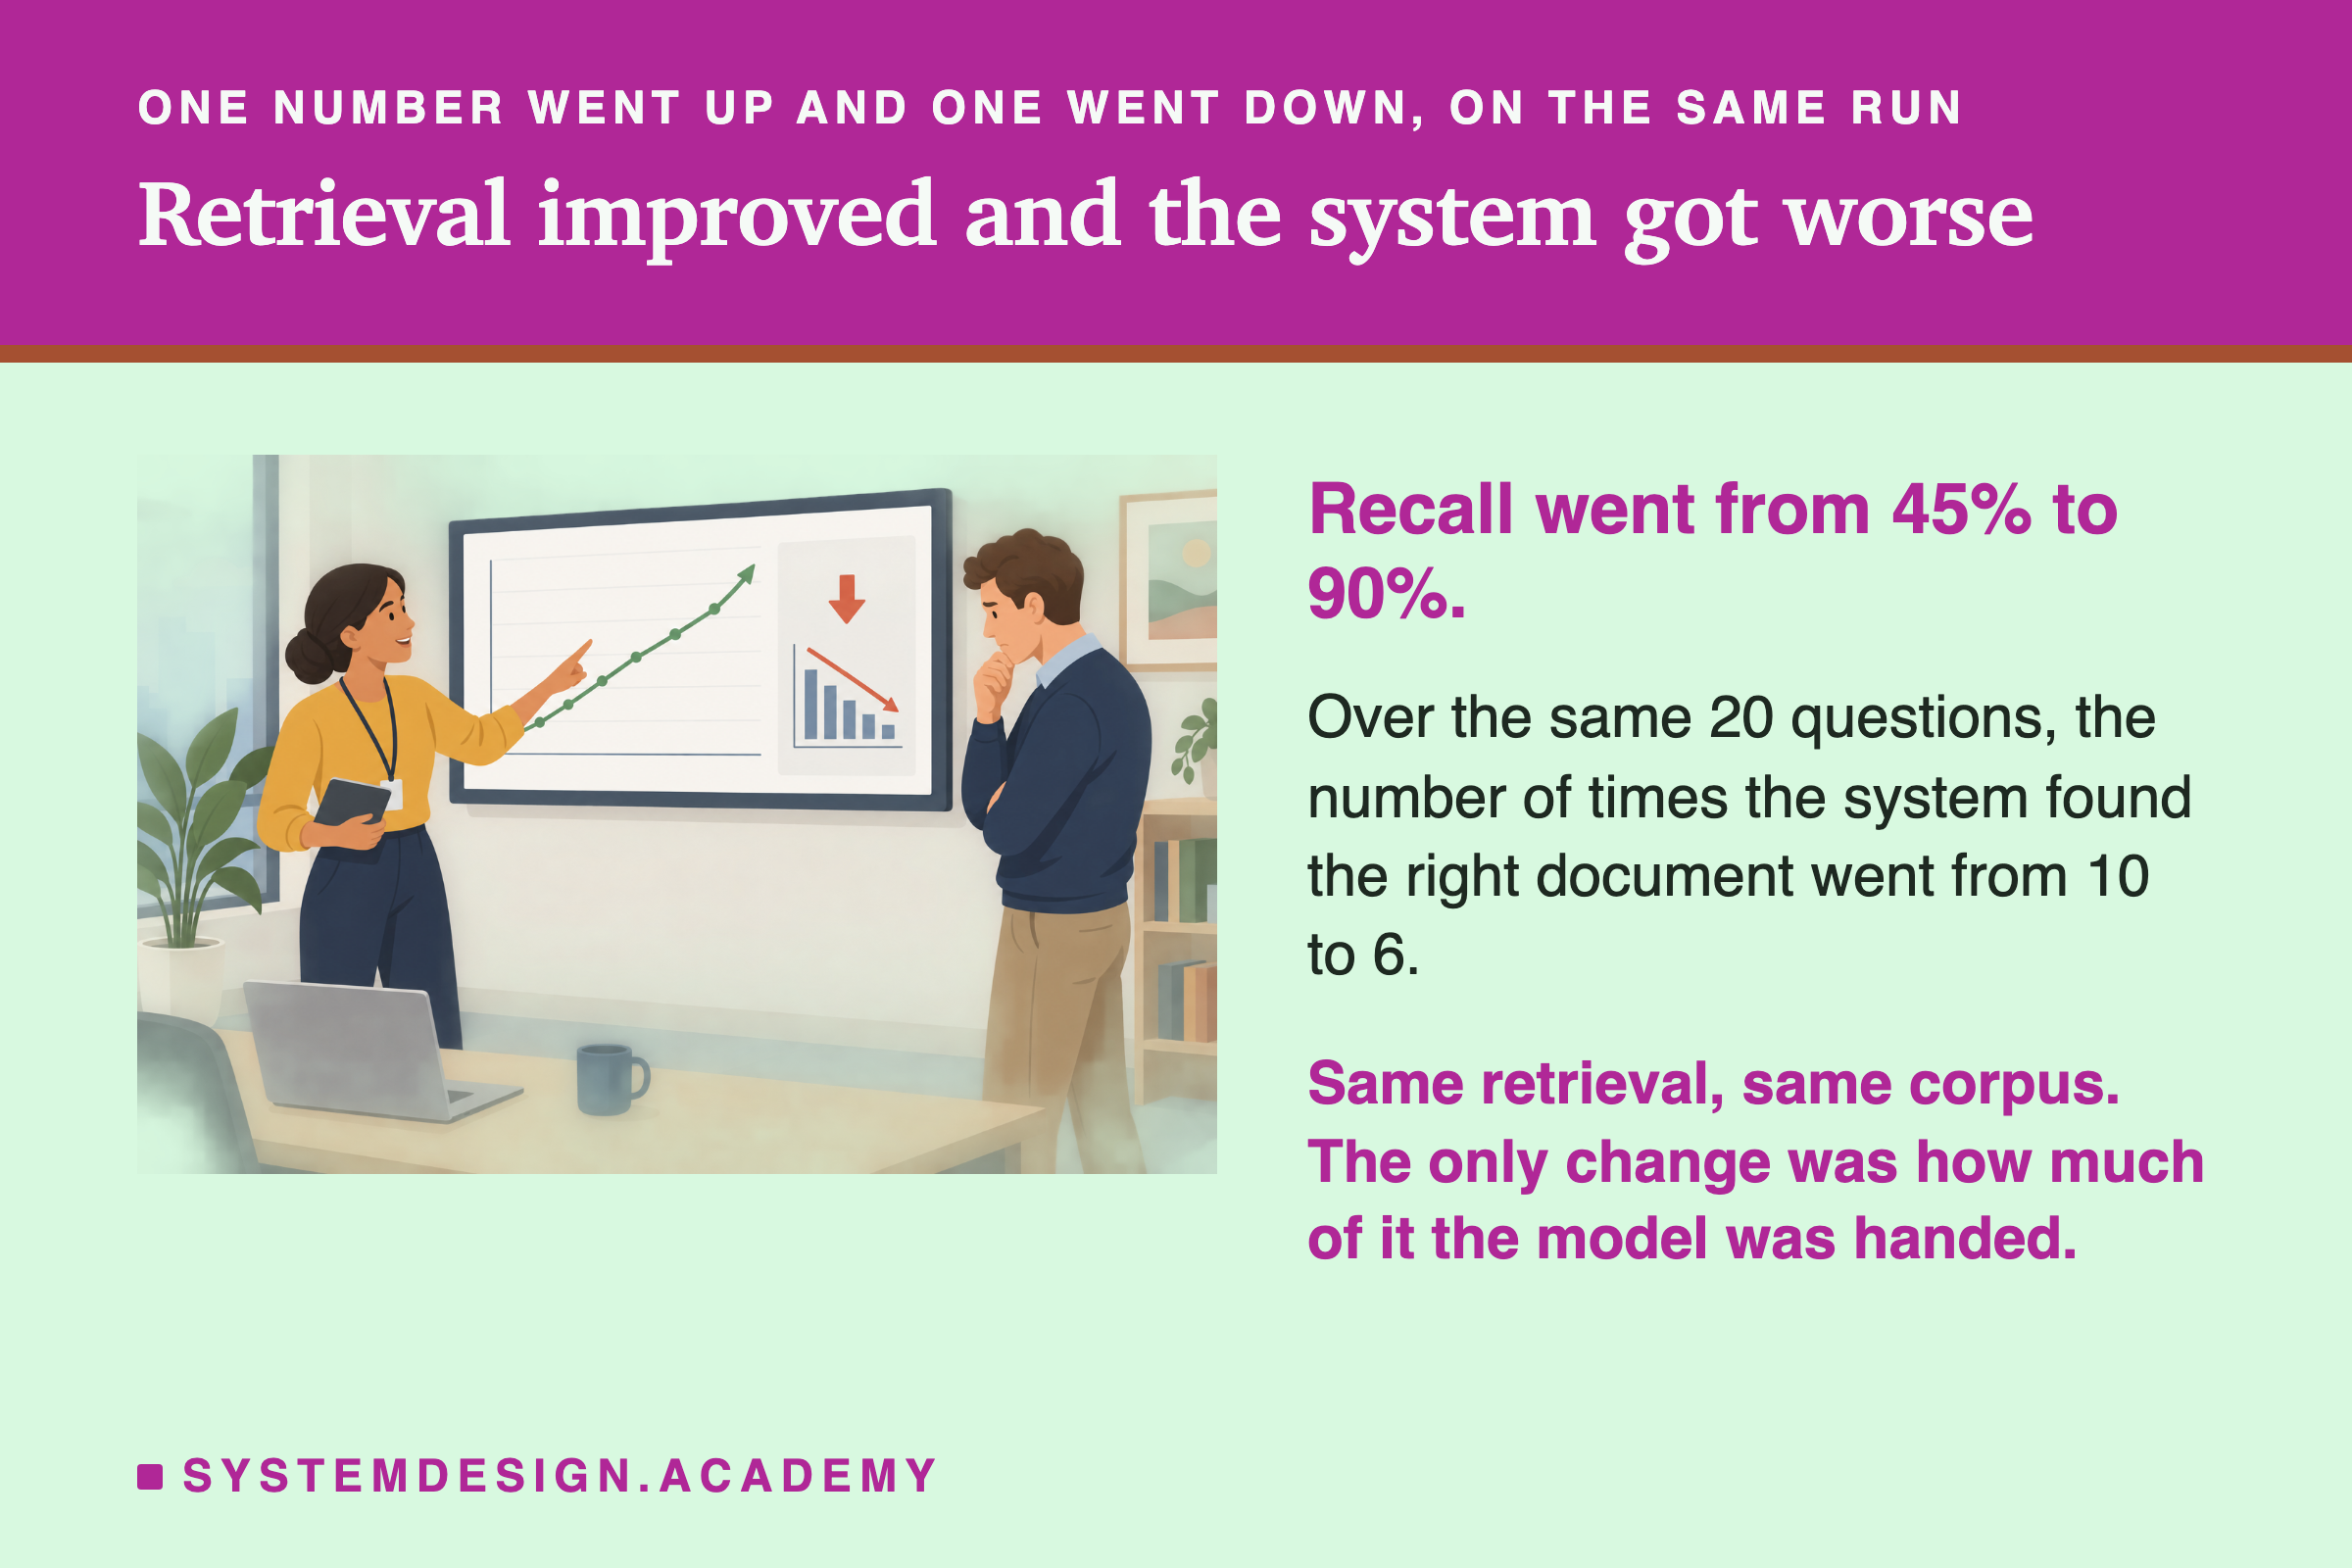
Both of those numbers are from one run, on the same twenty questions and the same ranking. Neither is a mistake and neither is the whole picture.
What Was Held Still
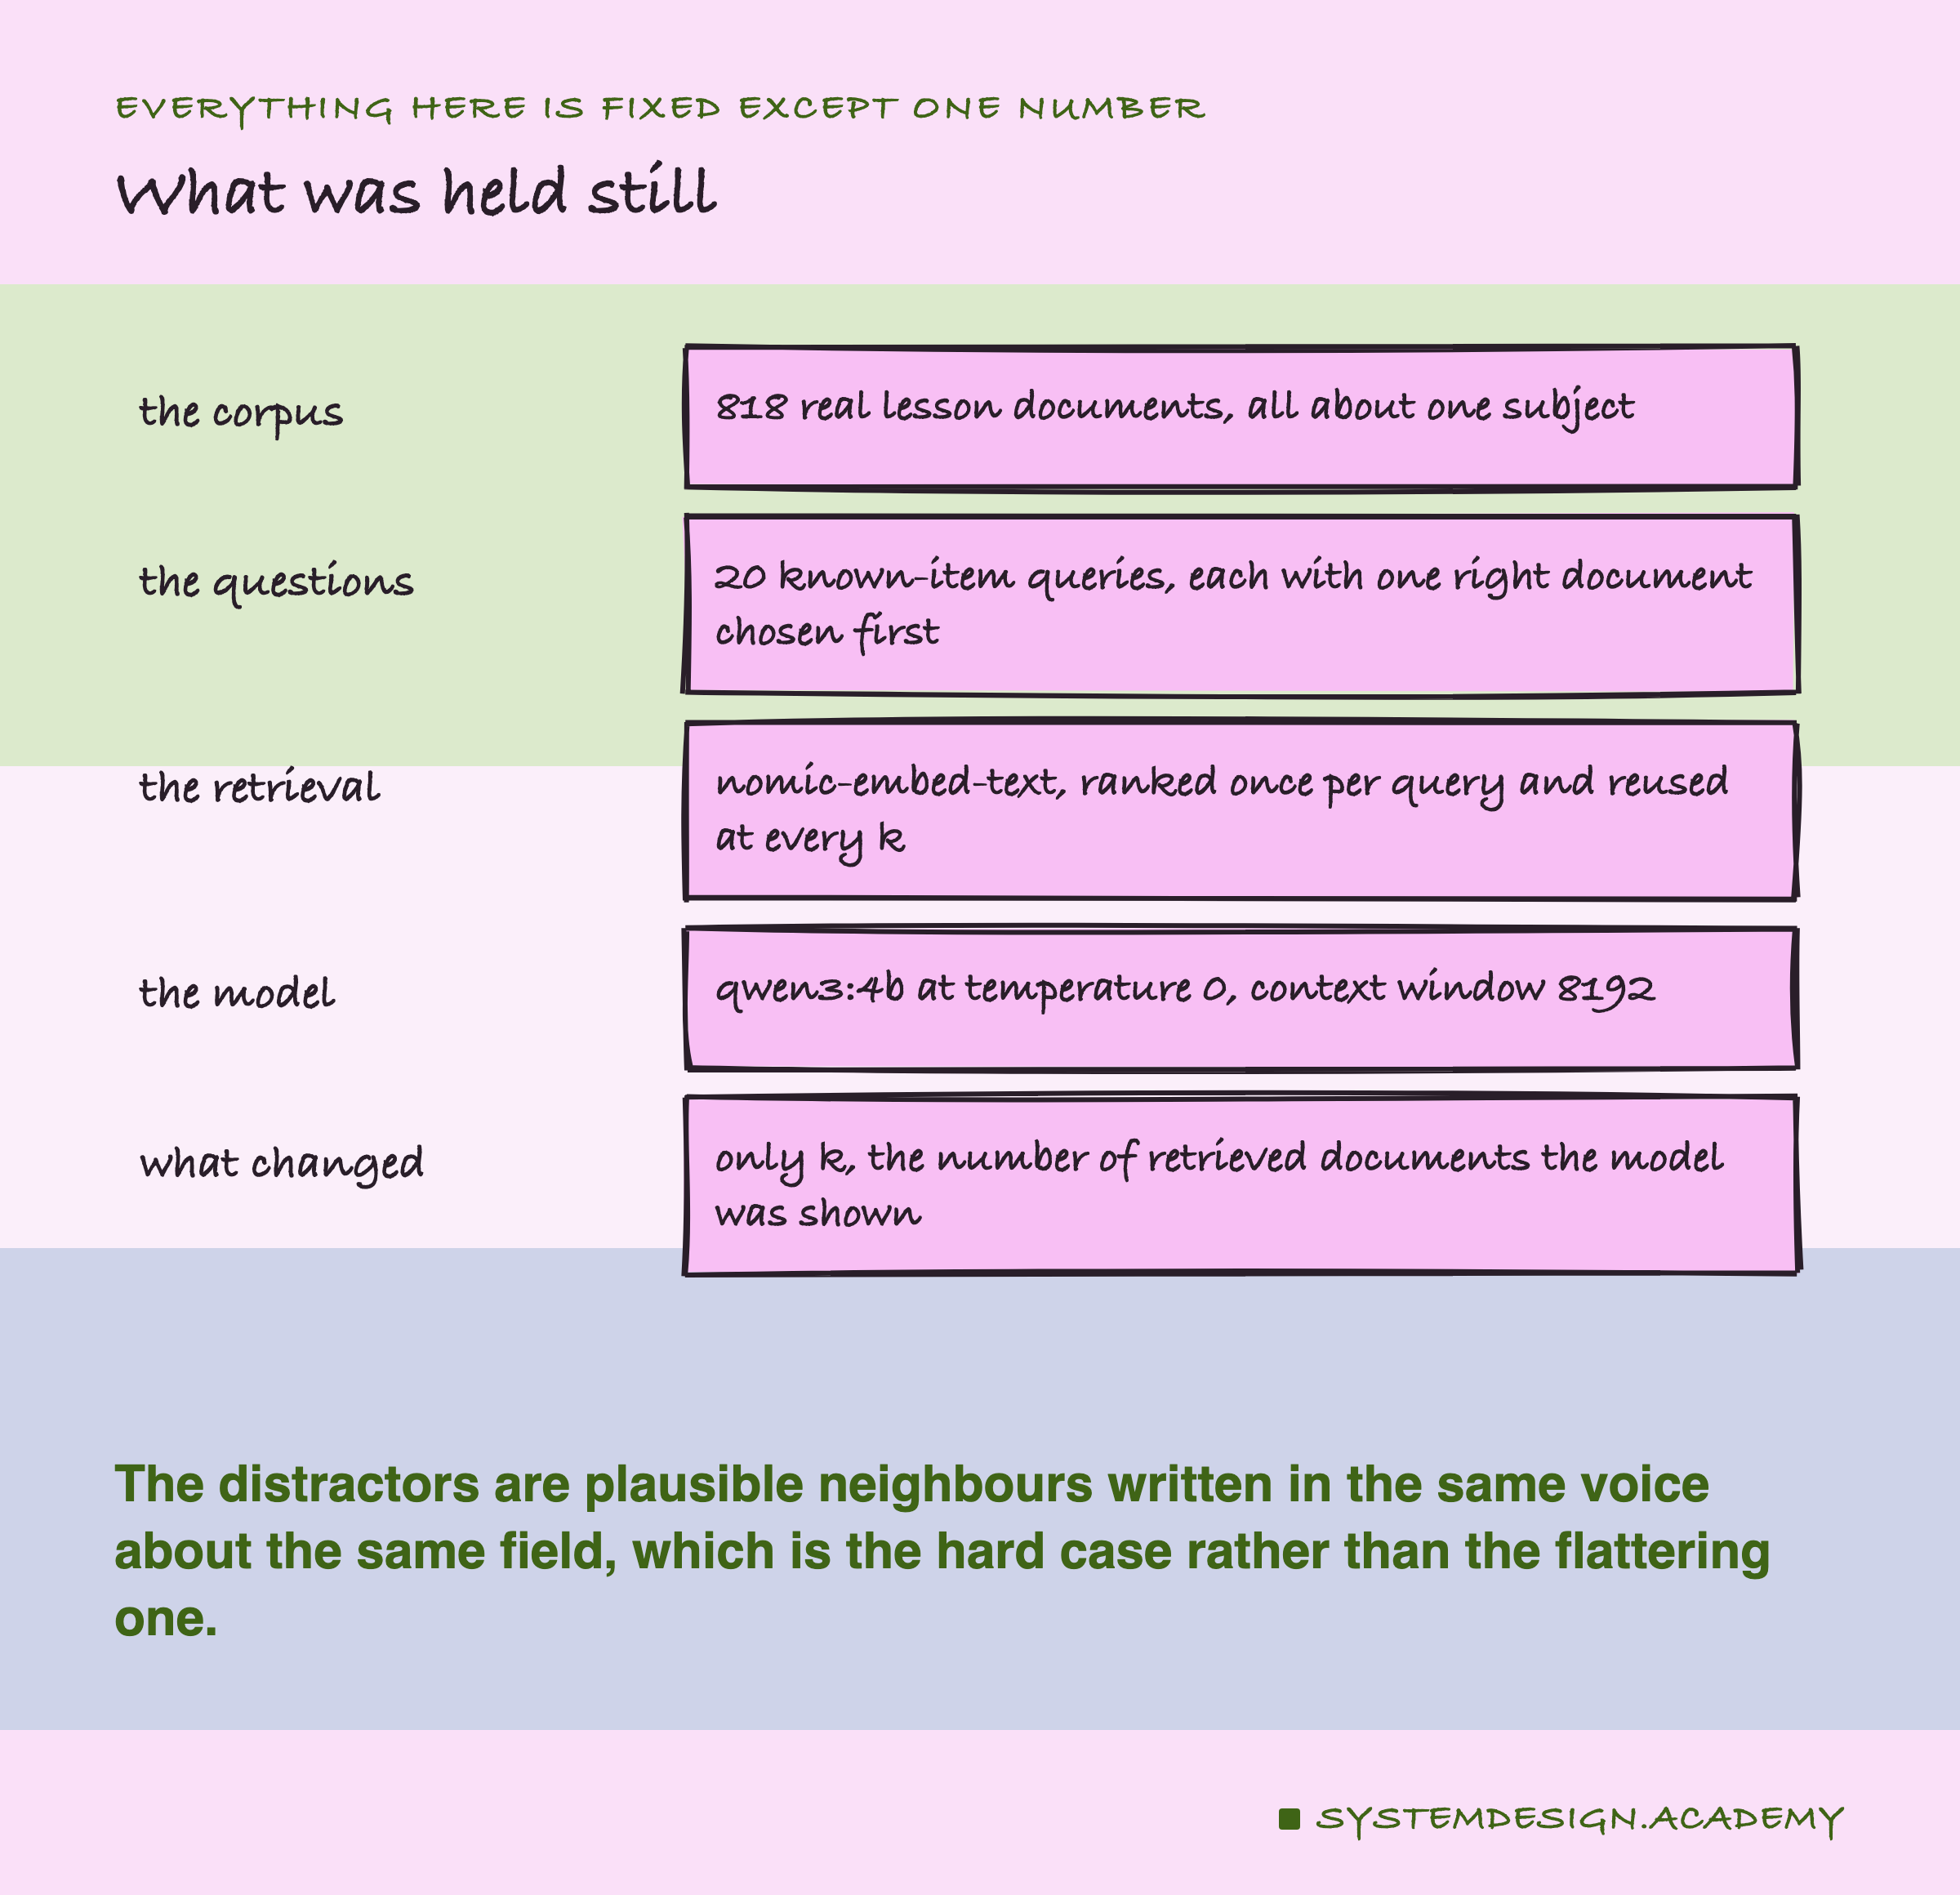
The ranking is computed once per question and never recomputed. Raising k does not change which documents come back or in what order. It changes only how far down that list the model is allowed to see.
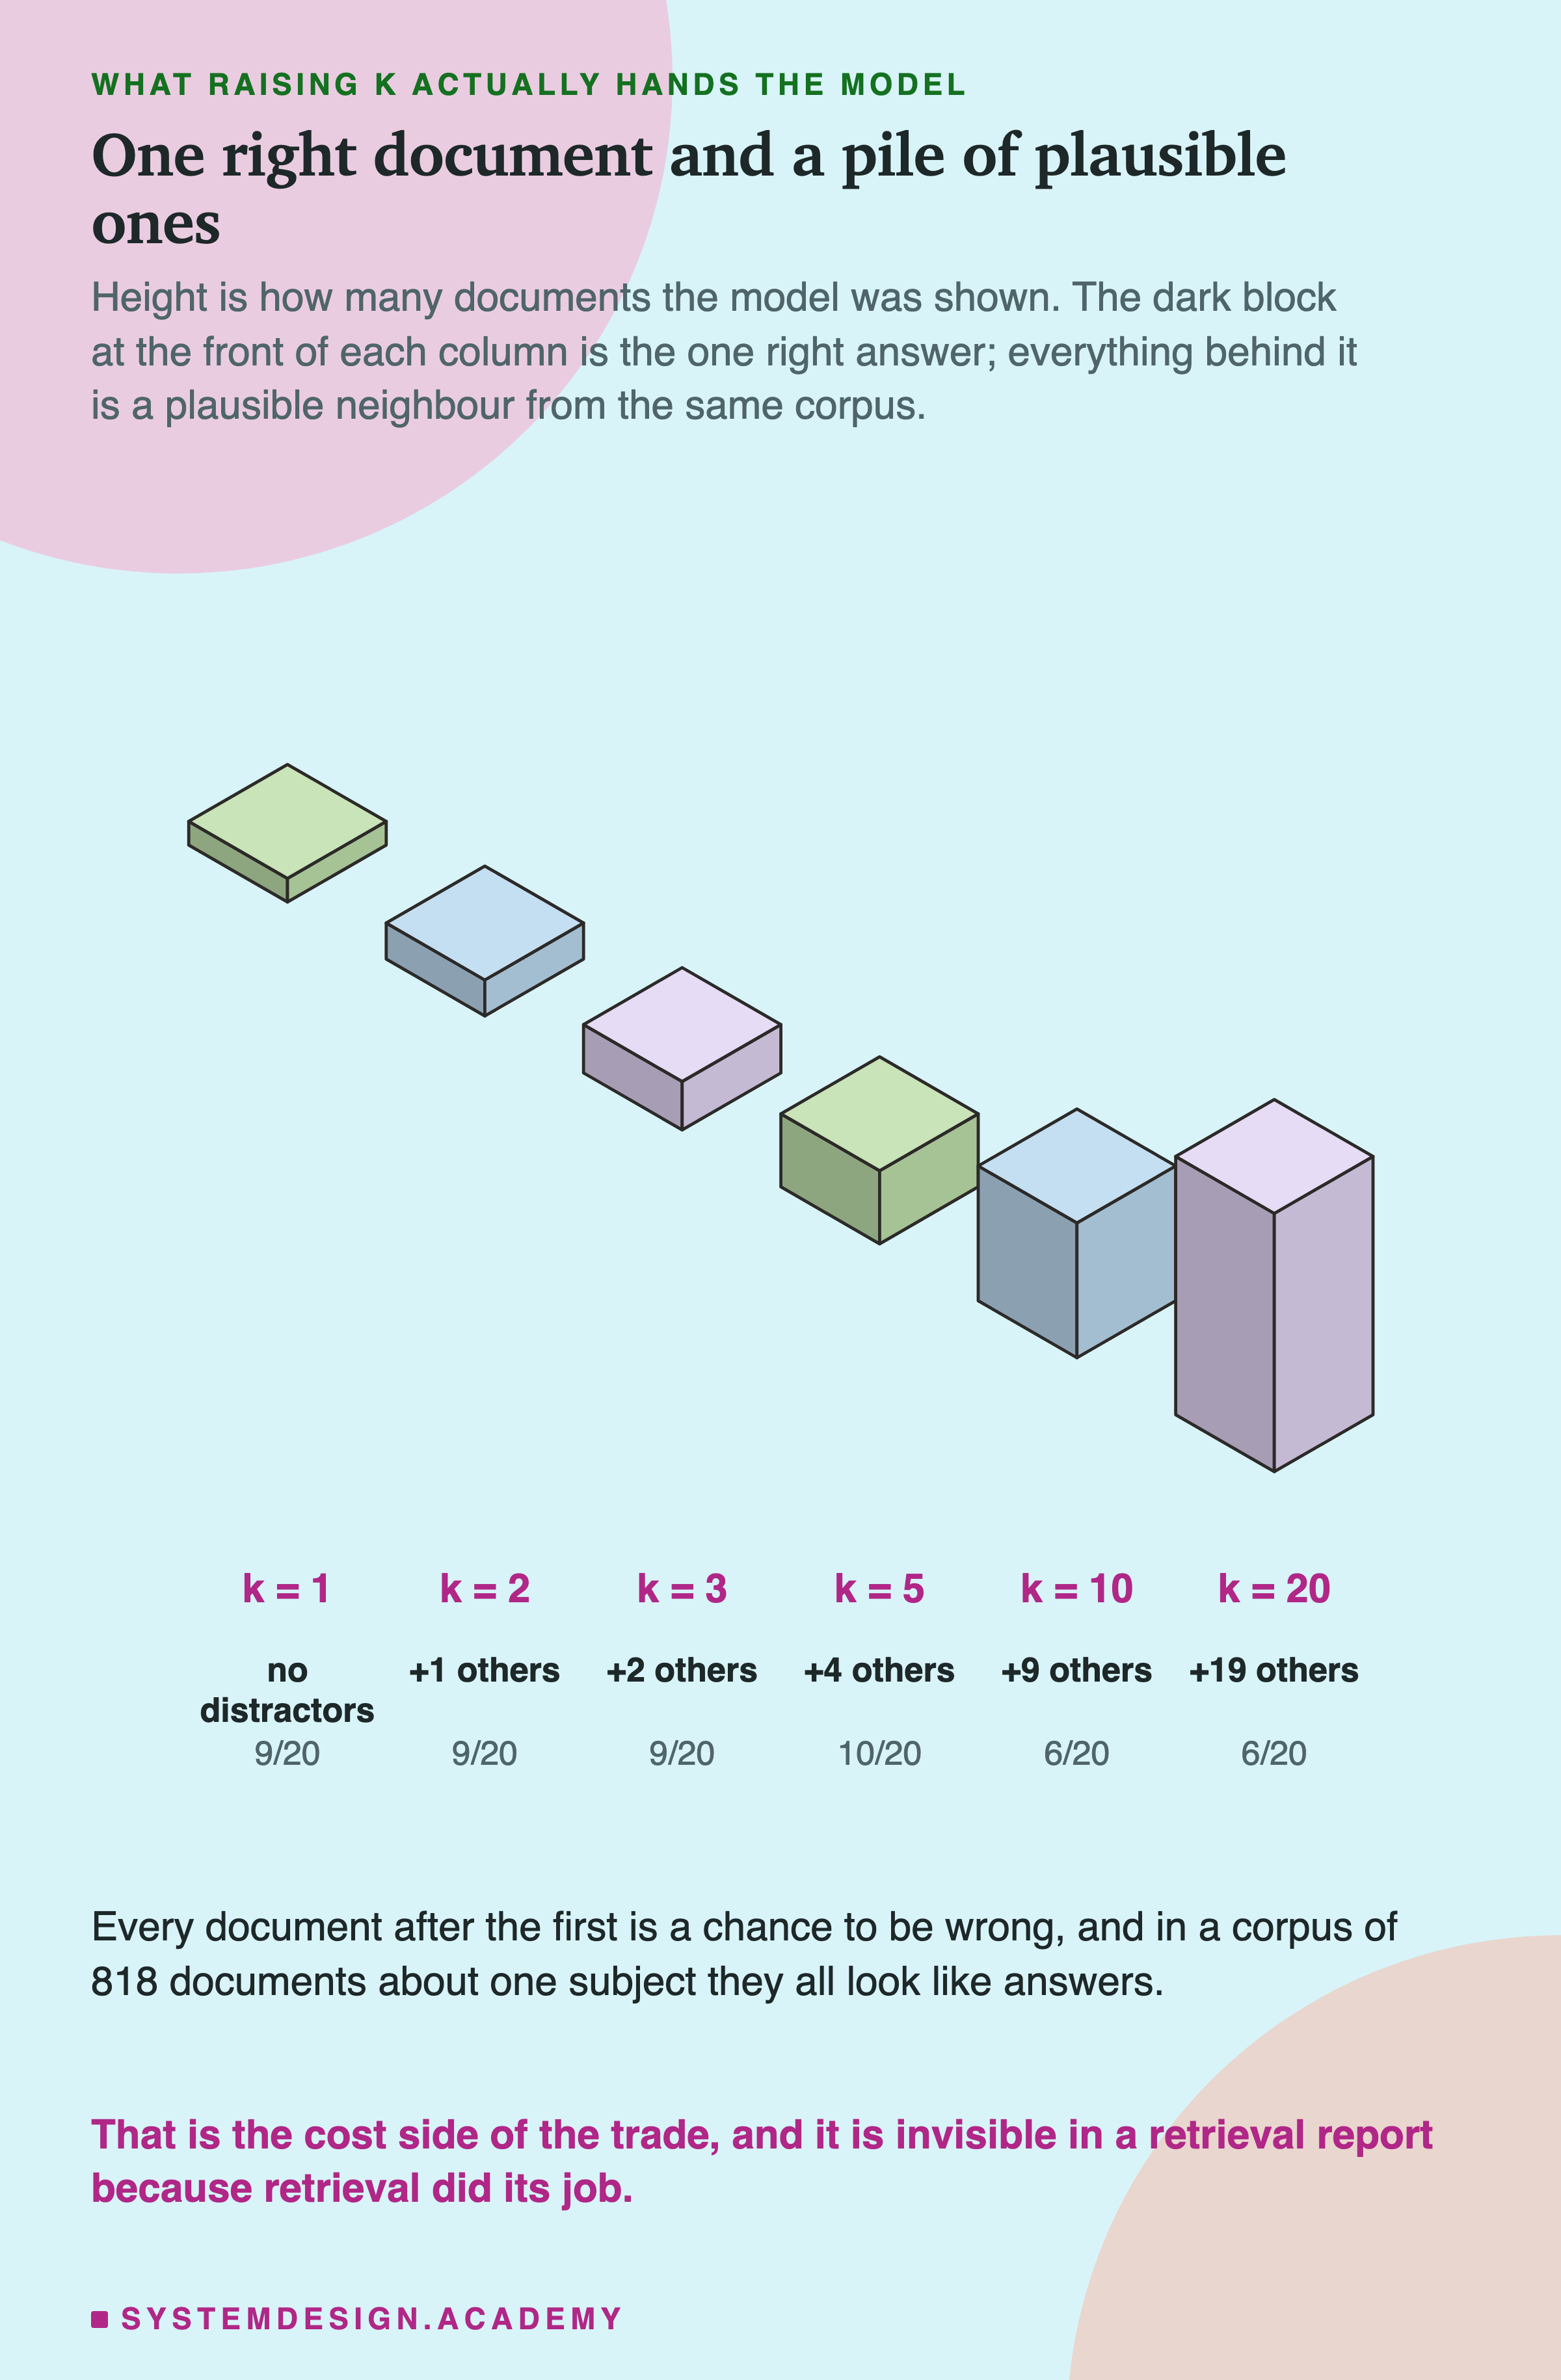
A toy corpus of unrelated documents makes any retriever look excellent. This one is 818 lessons about one subject, so every wrong answer is a plausible neighbour written in the same voice.
There Is No Judge in the Grading Path
The previous two lessons measured how much a judge model moves when you reword its rubric or leave its temperature unset. Putting one in this experiment would mean two things were moving and neither could be attributed.
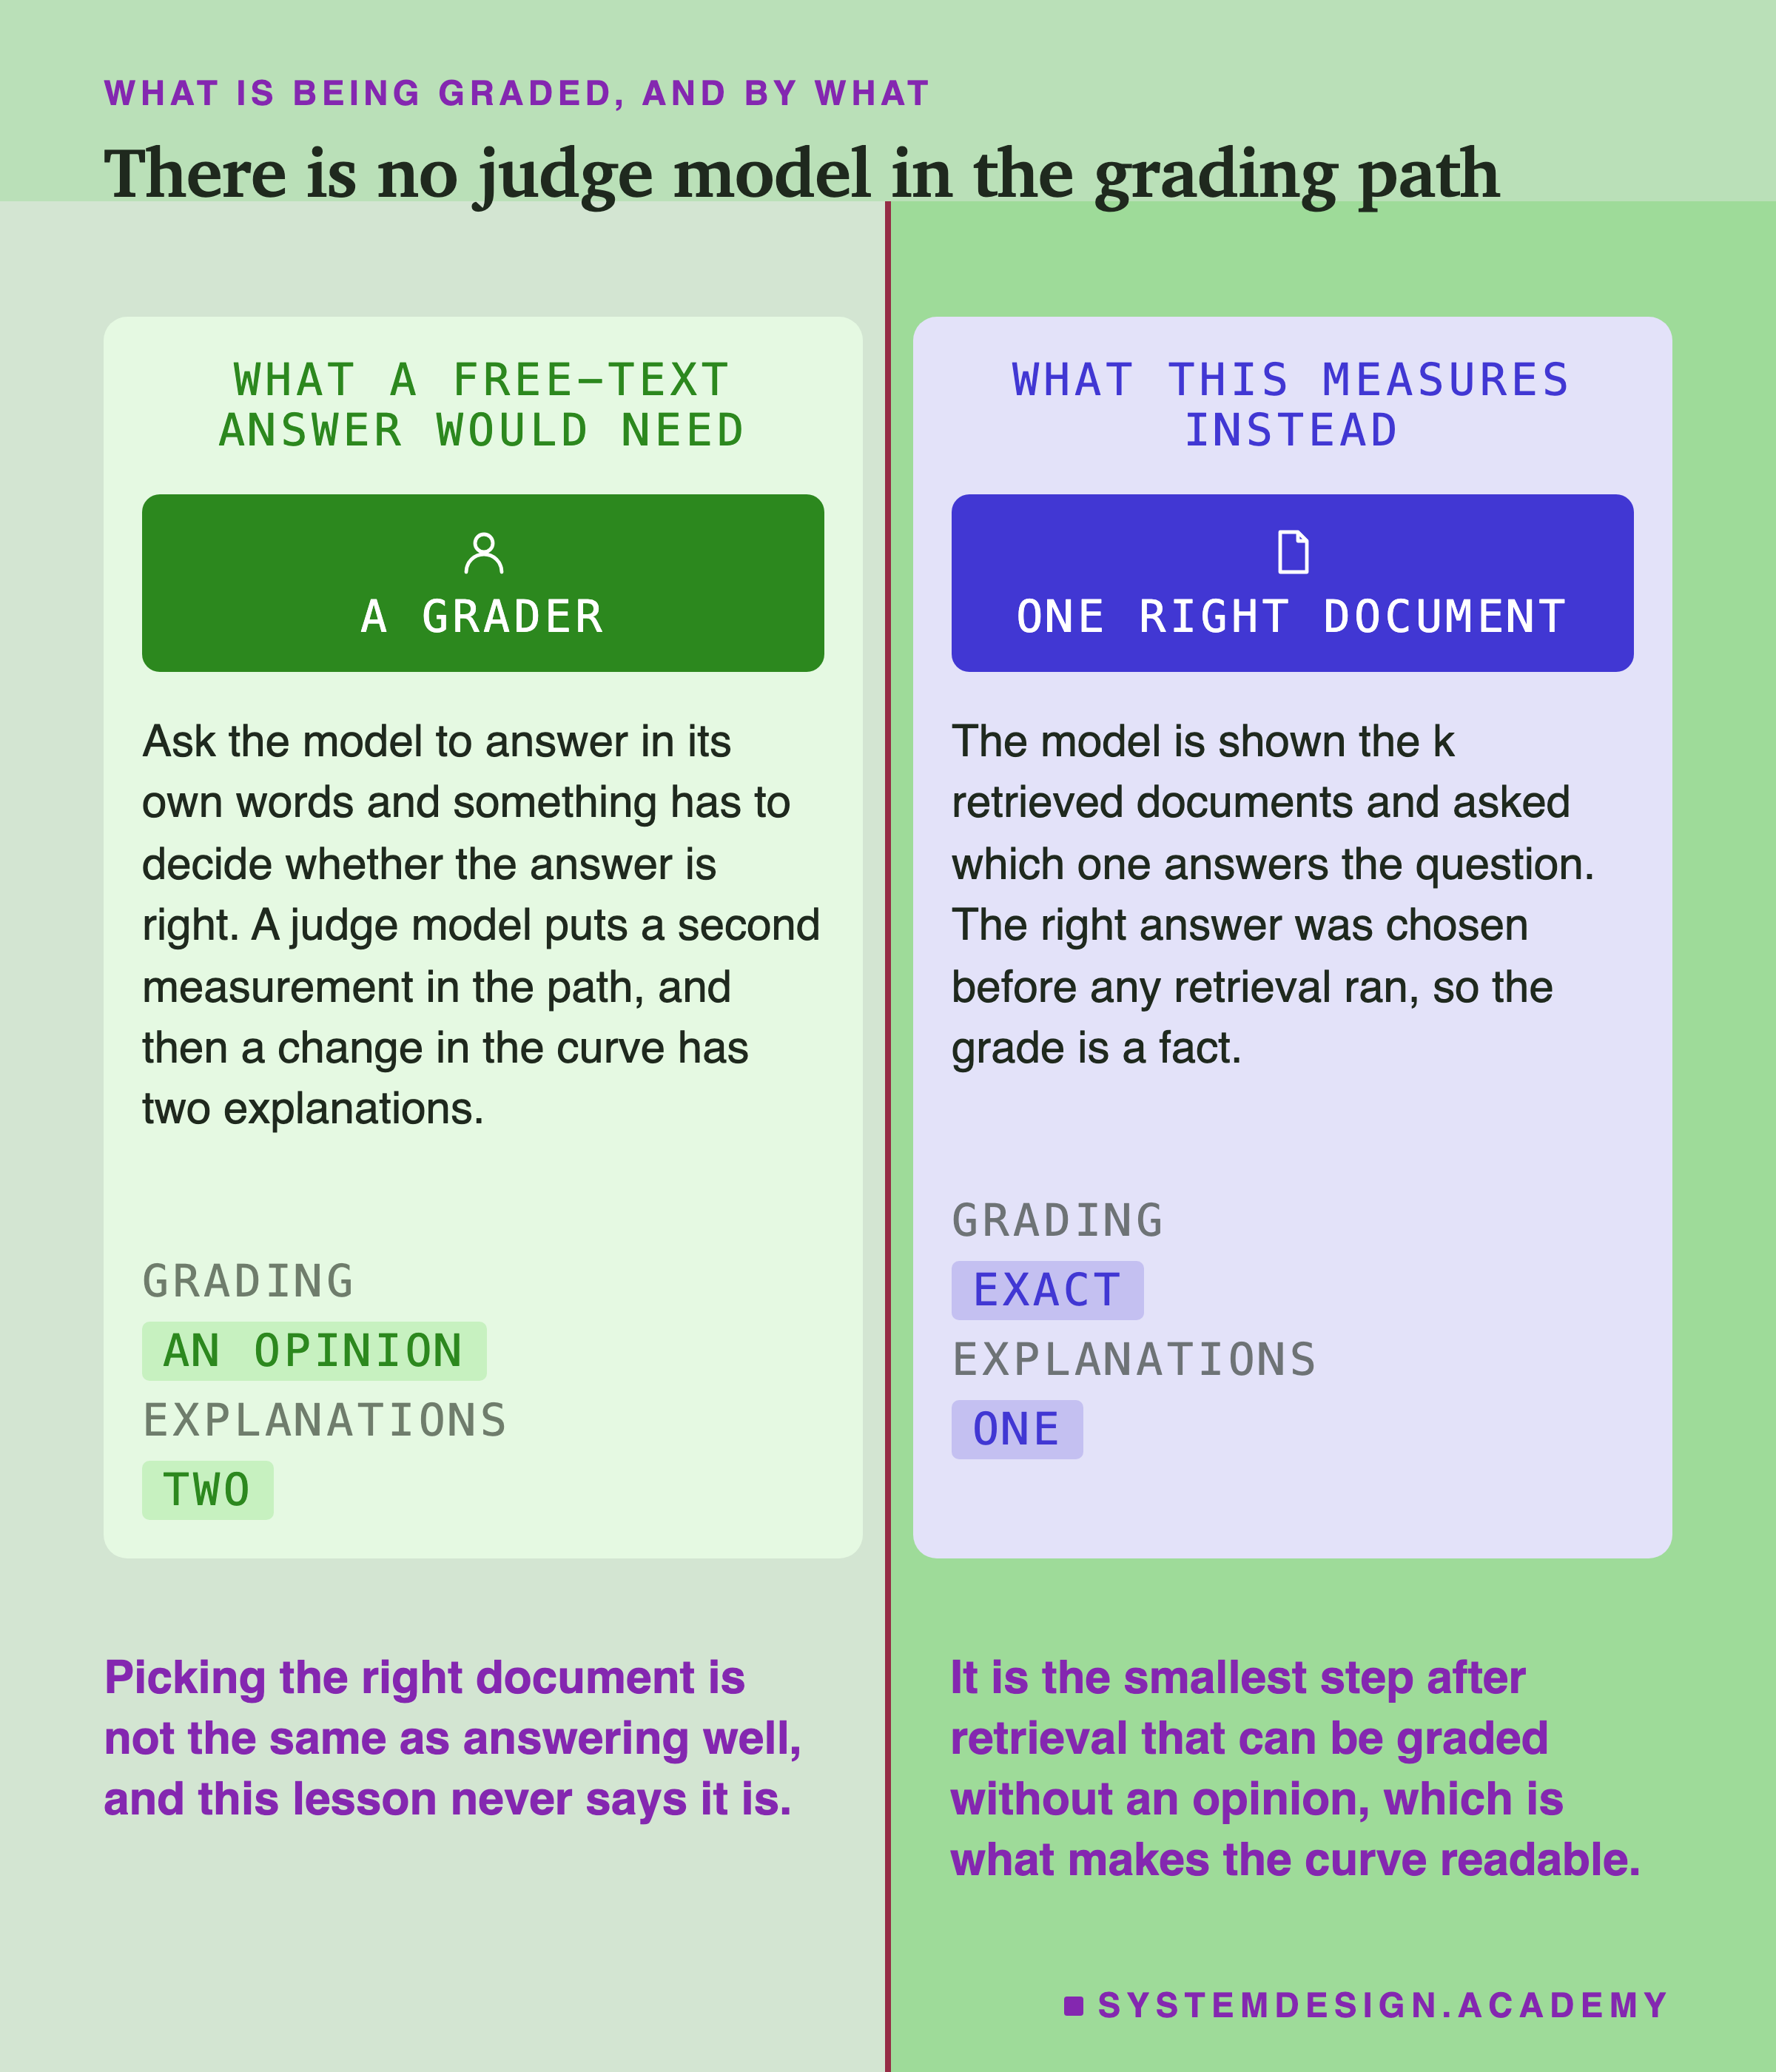
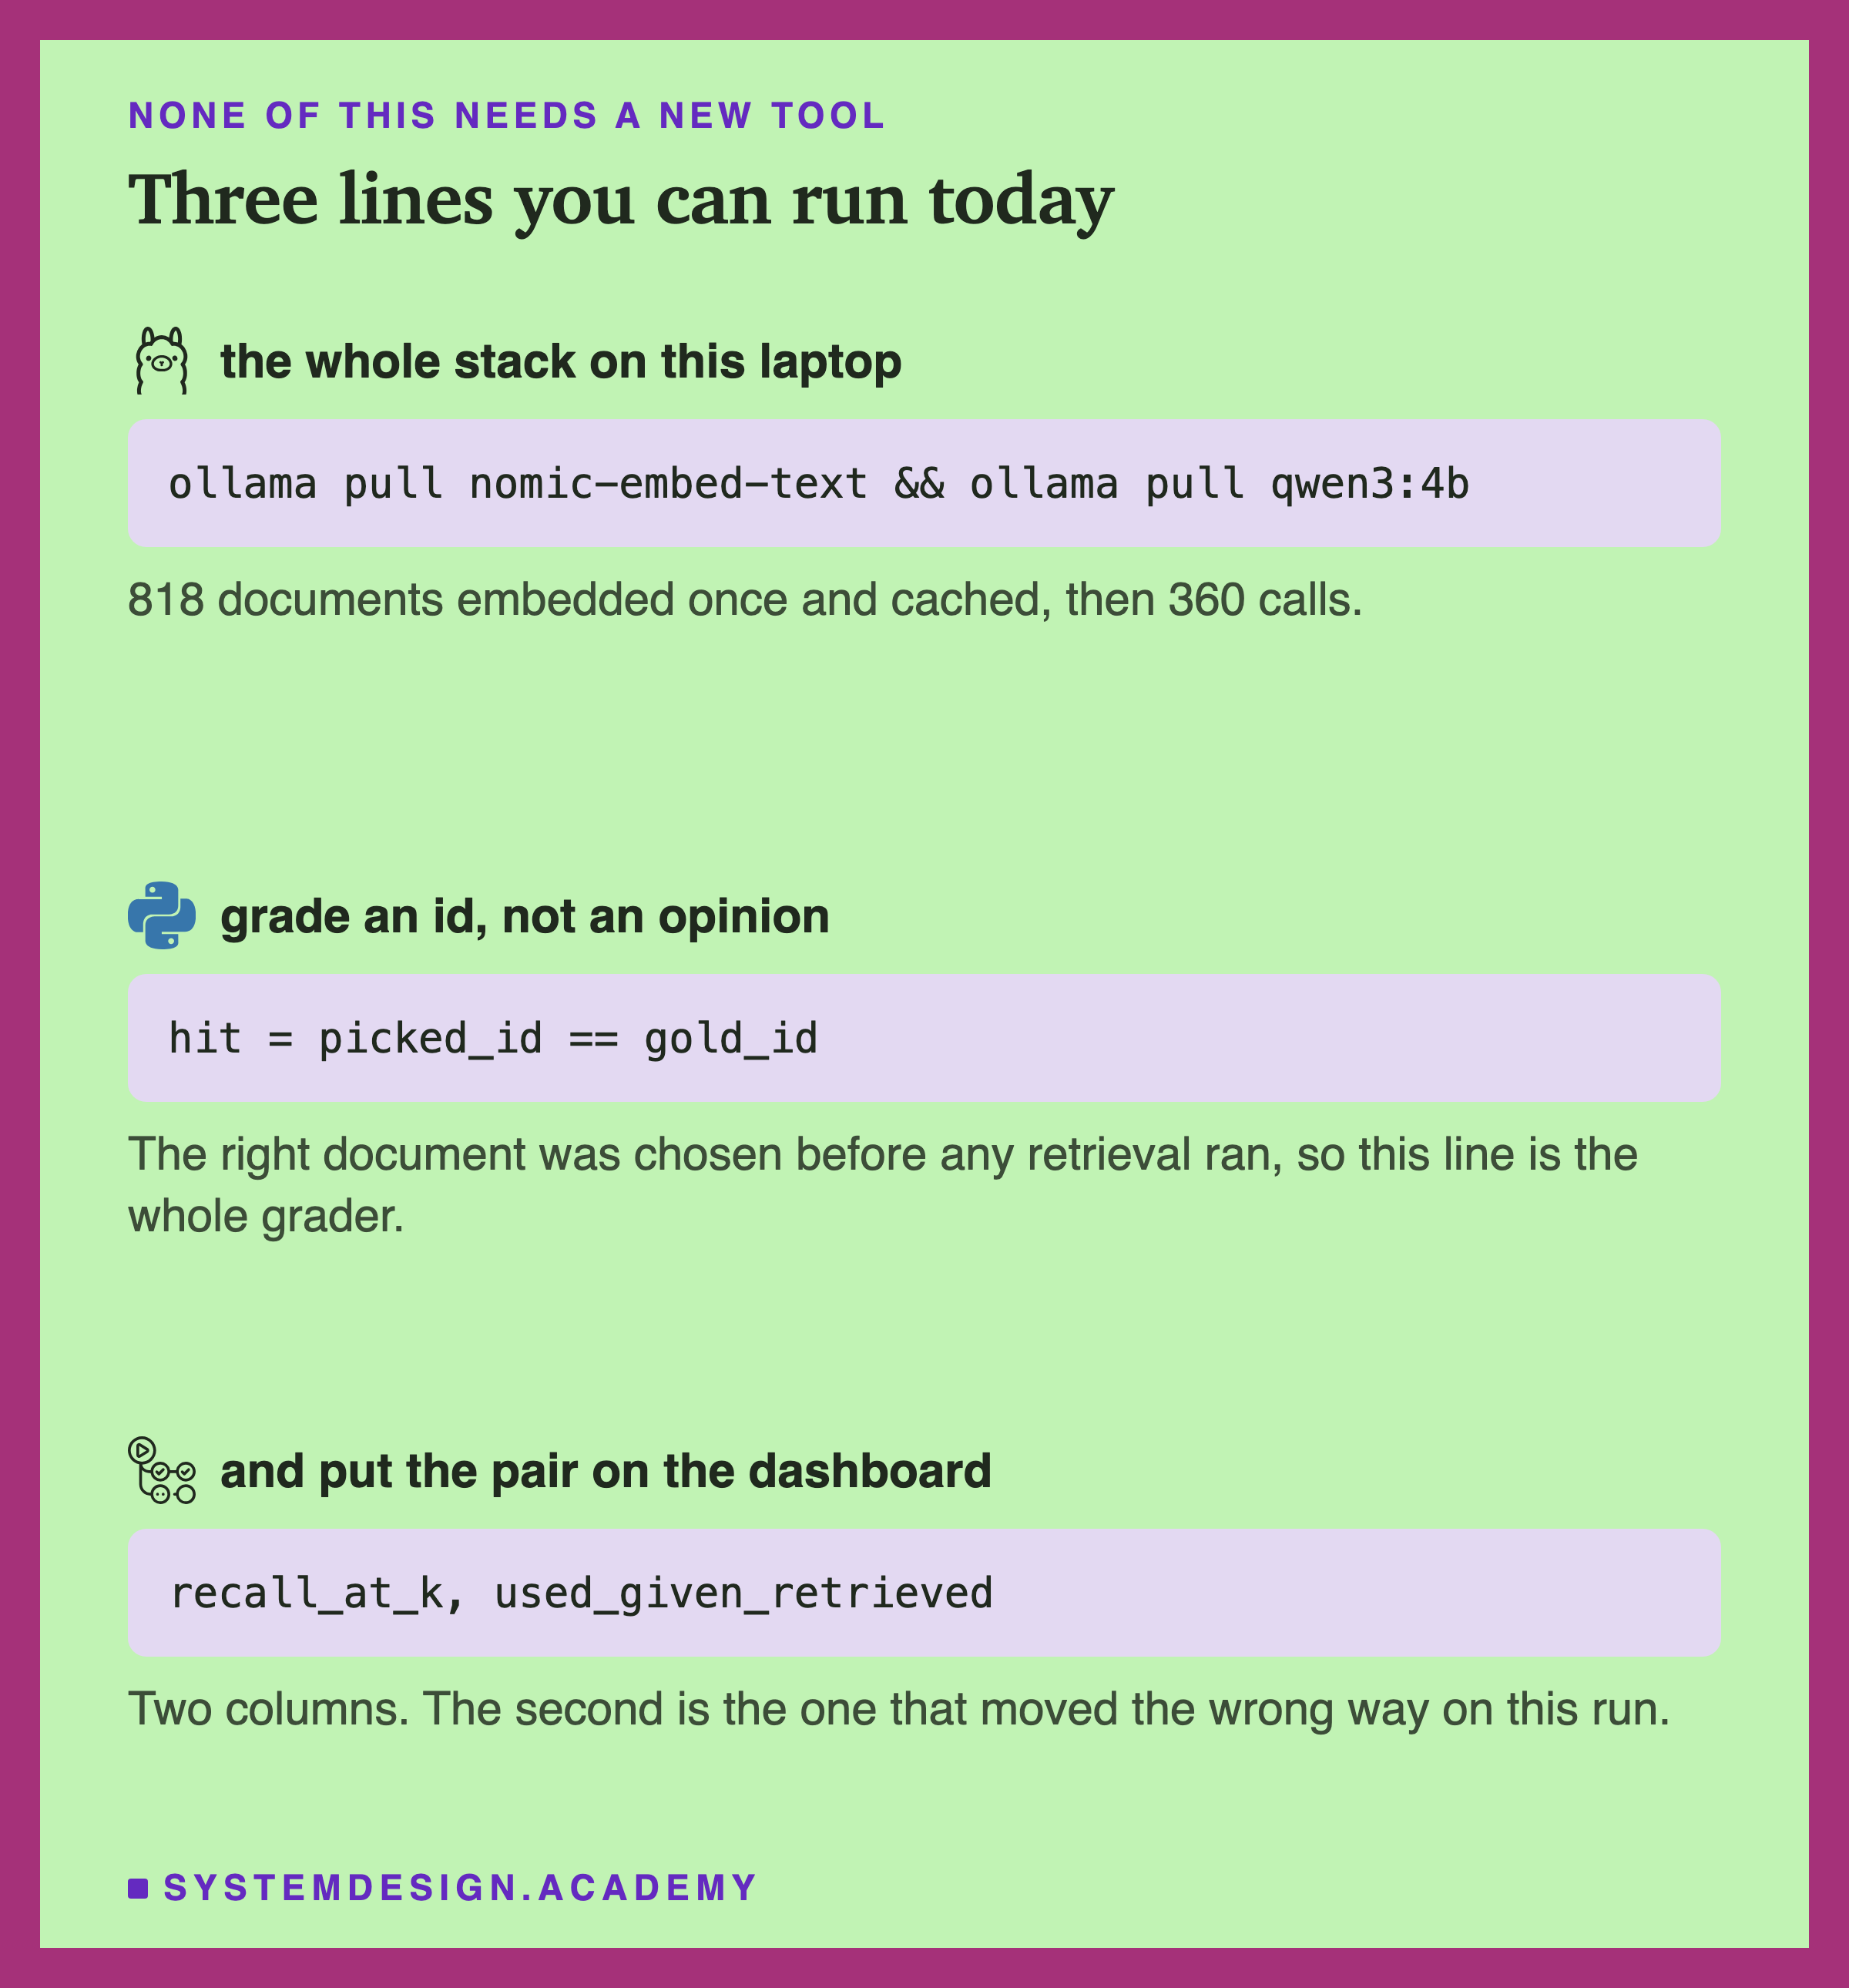
So the outcome measured here is narrow on purpose. Did the model, shown the retrieved documents, identify the one that answers the question. An exact match against an id chosen before the experiment ran.
That is not the same as answering well, and the lesson never claims it is. It is the smallest step after retrieval that can be graded without an opinion.
The Metric That Cannot Go Down
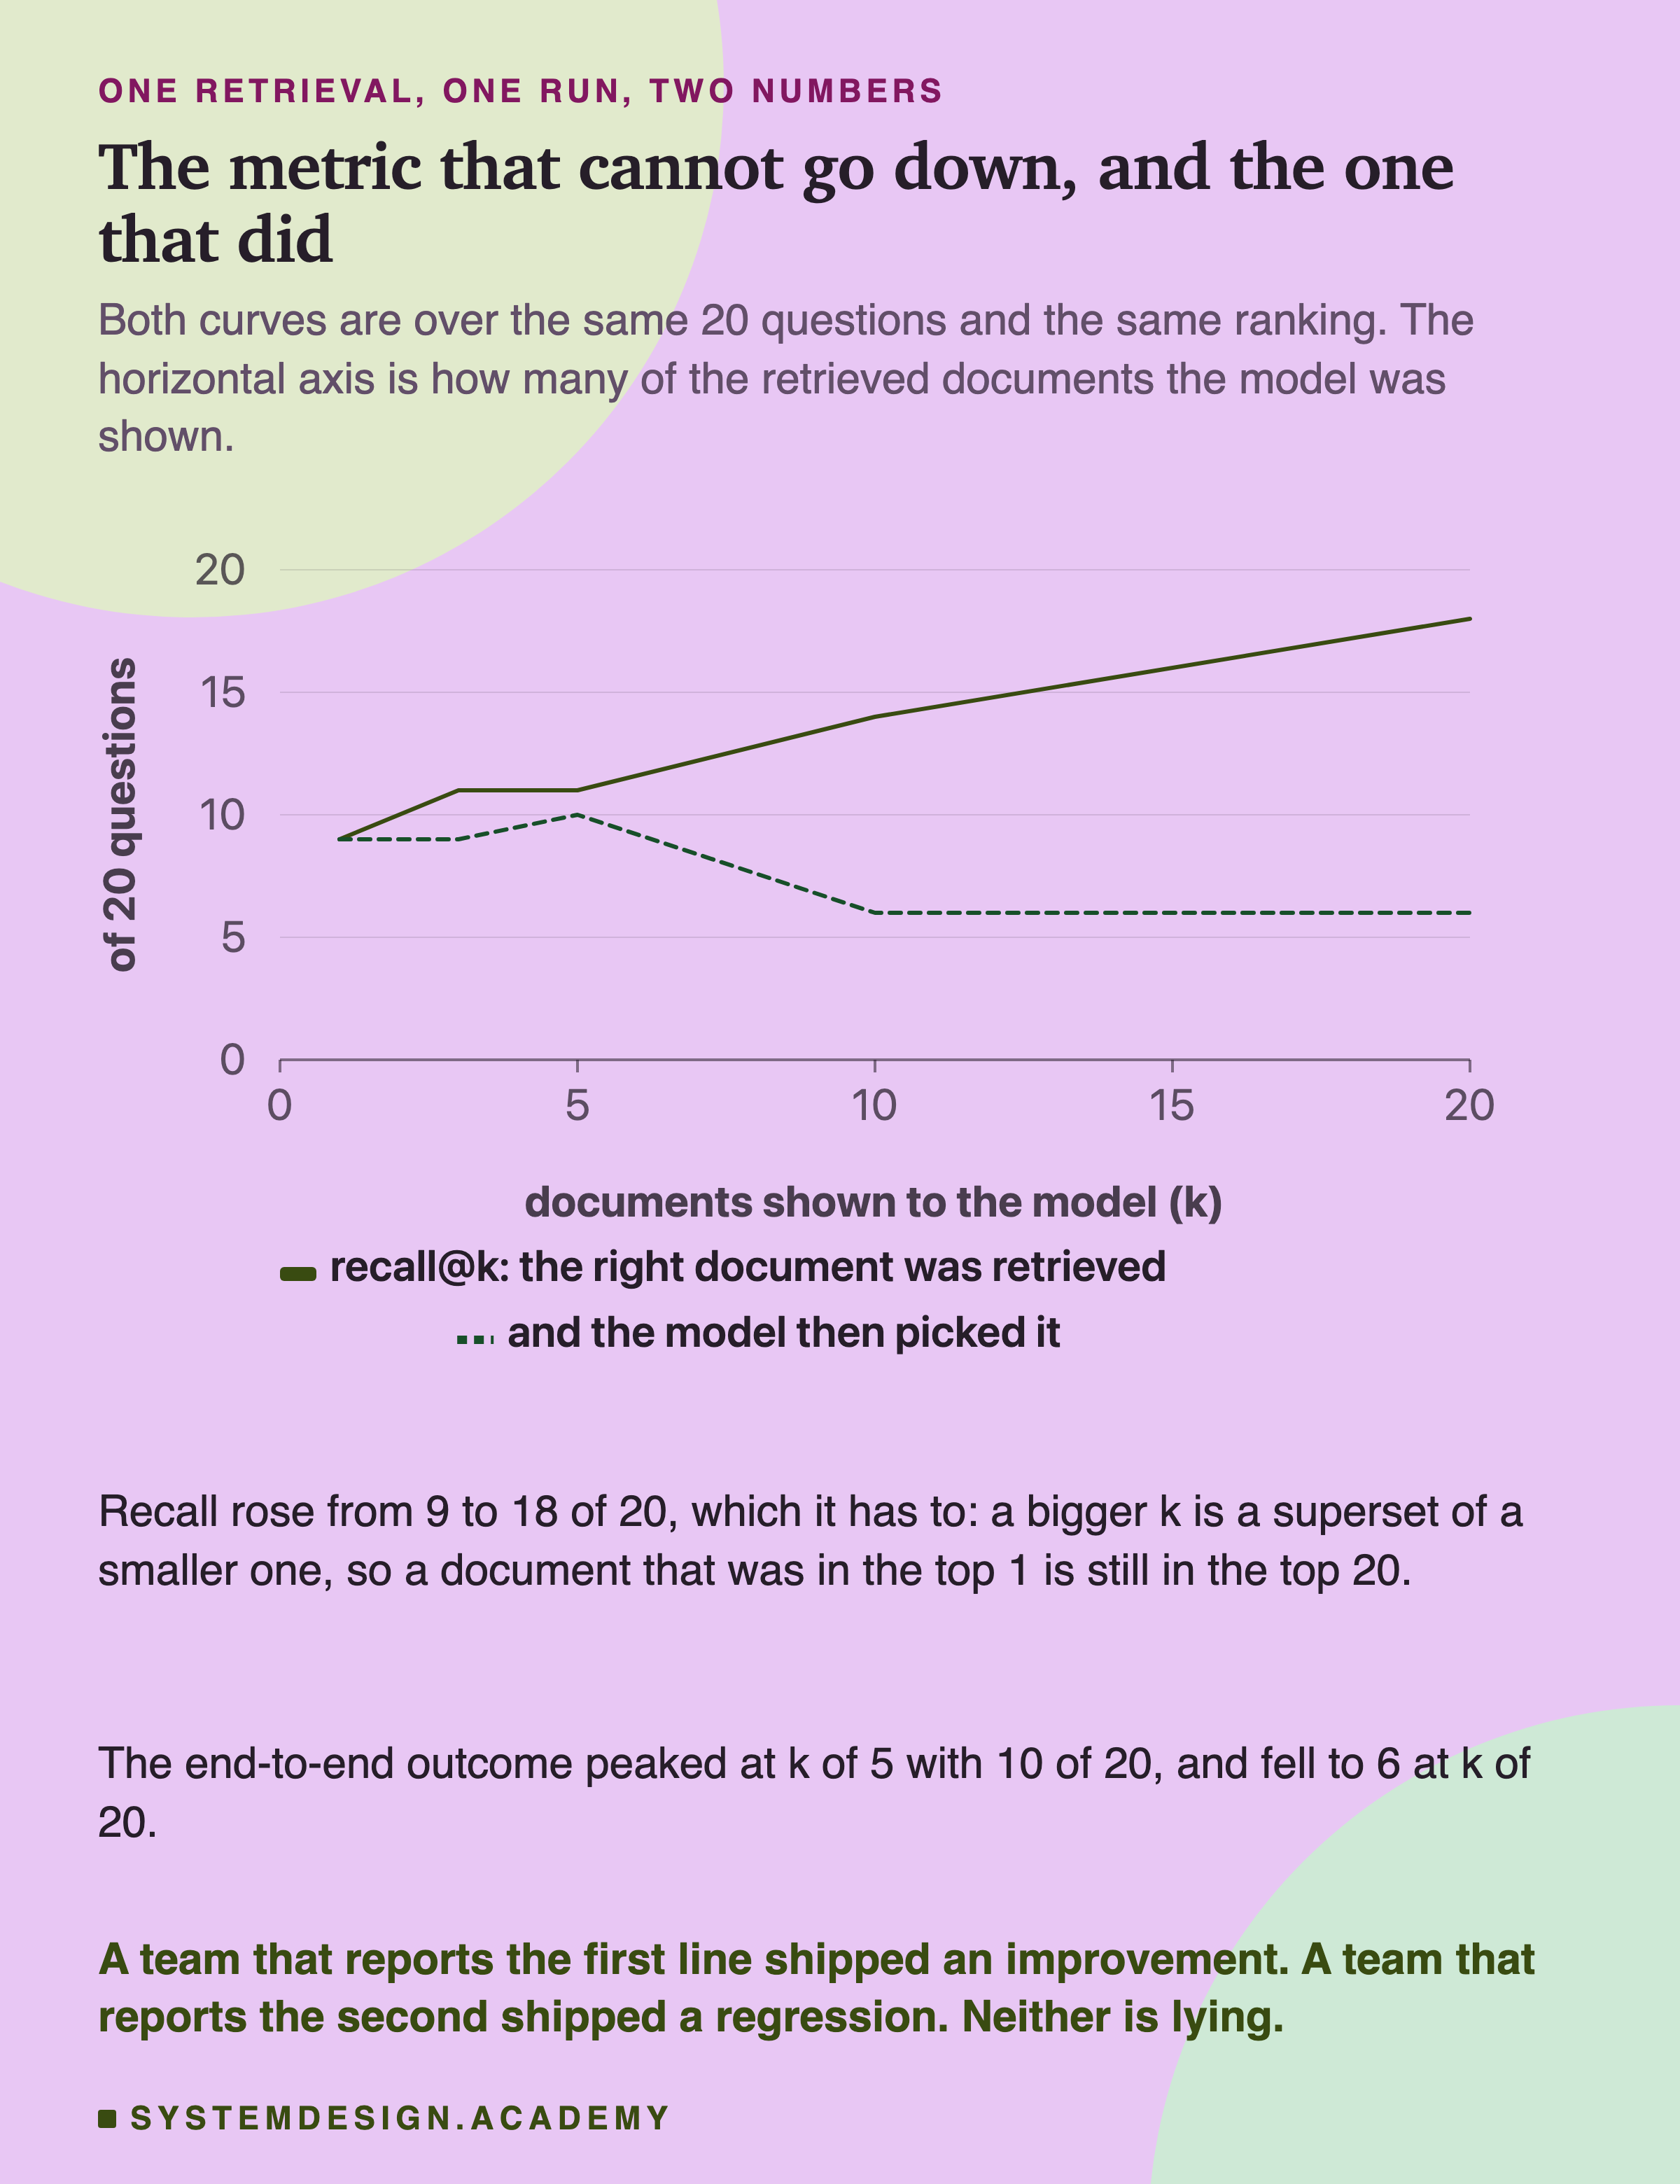
Recall@k is the share of questions whose right document is somewhere in the top k. It cannot fall when k rises, because the top twenty contains the top ten, which contains the top five.
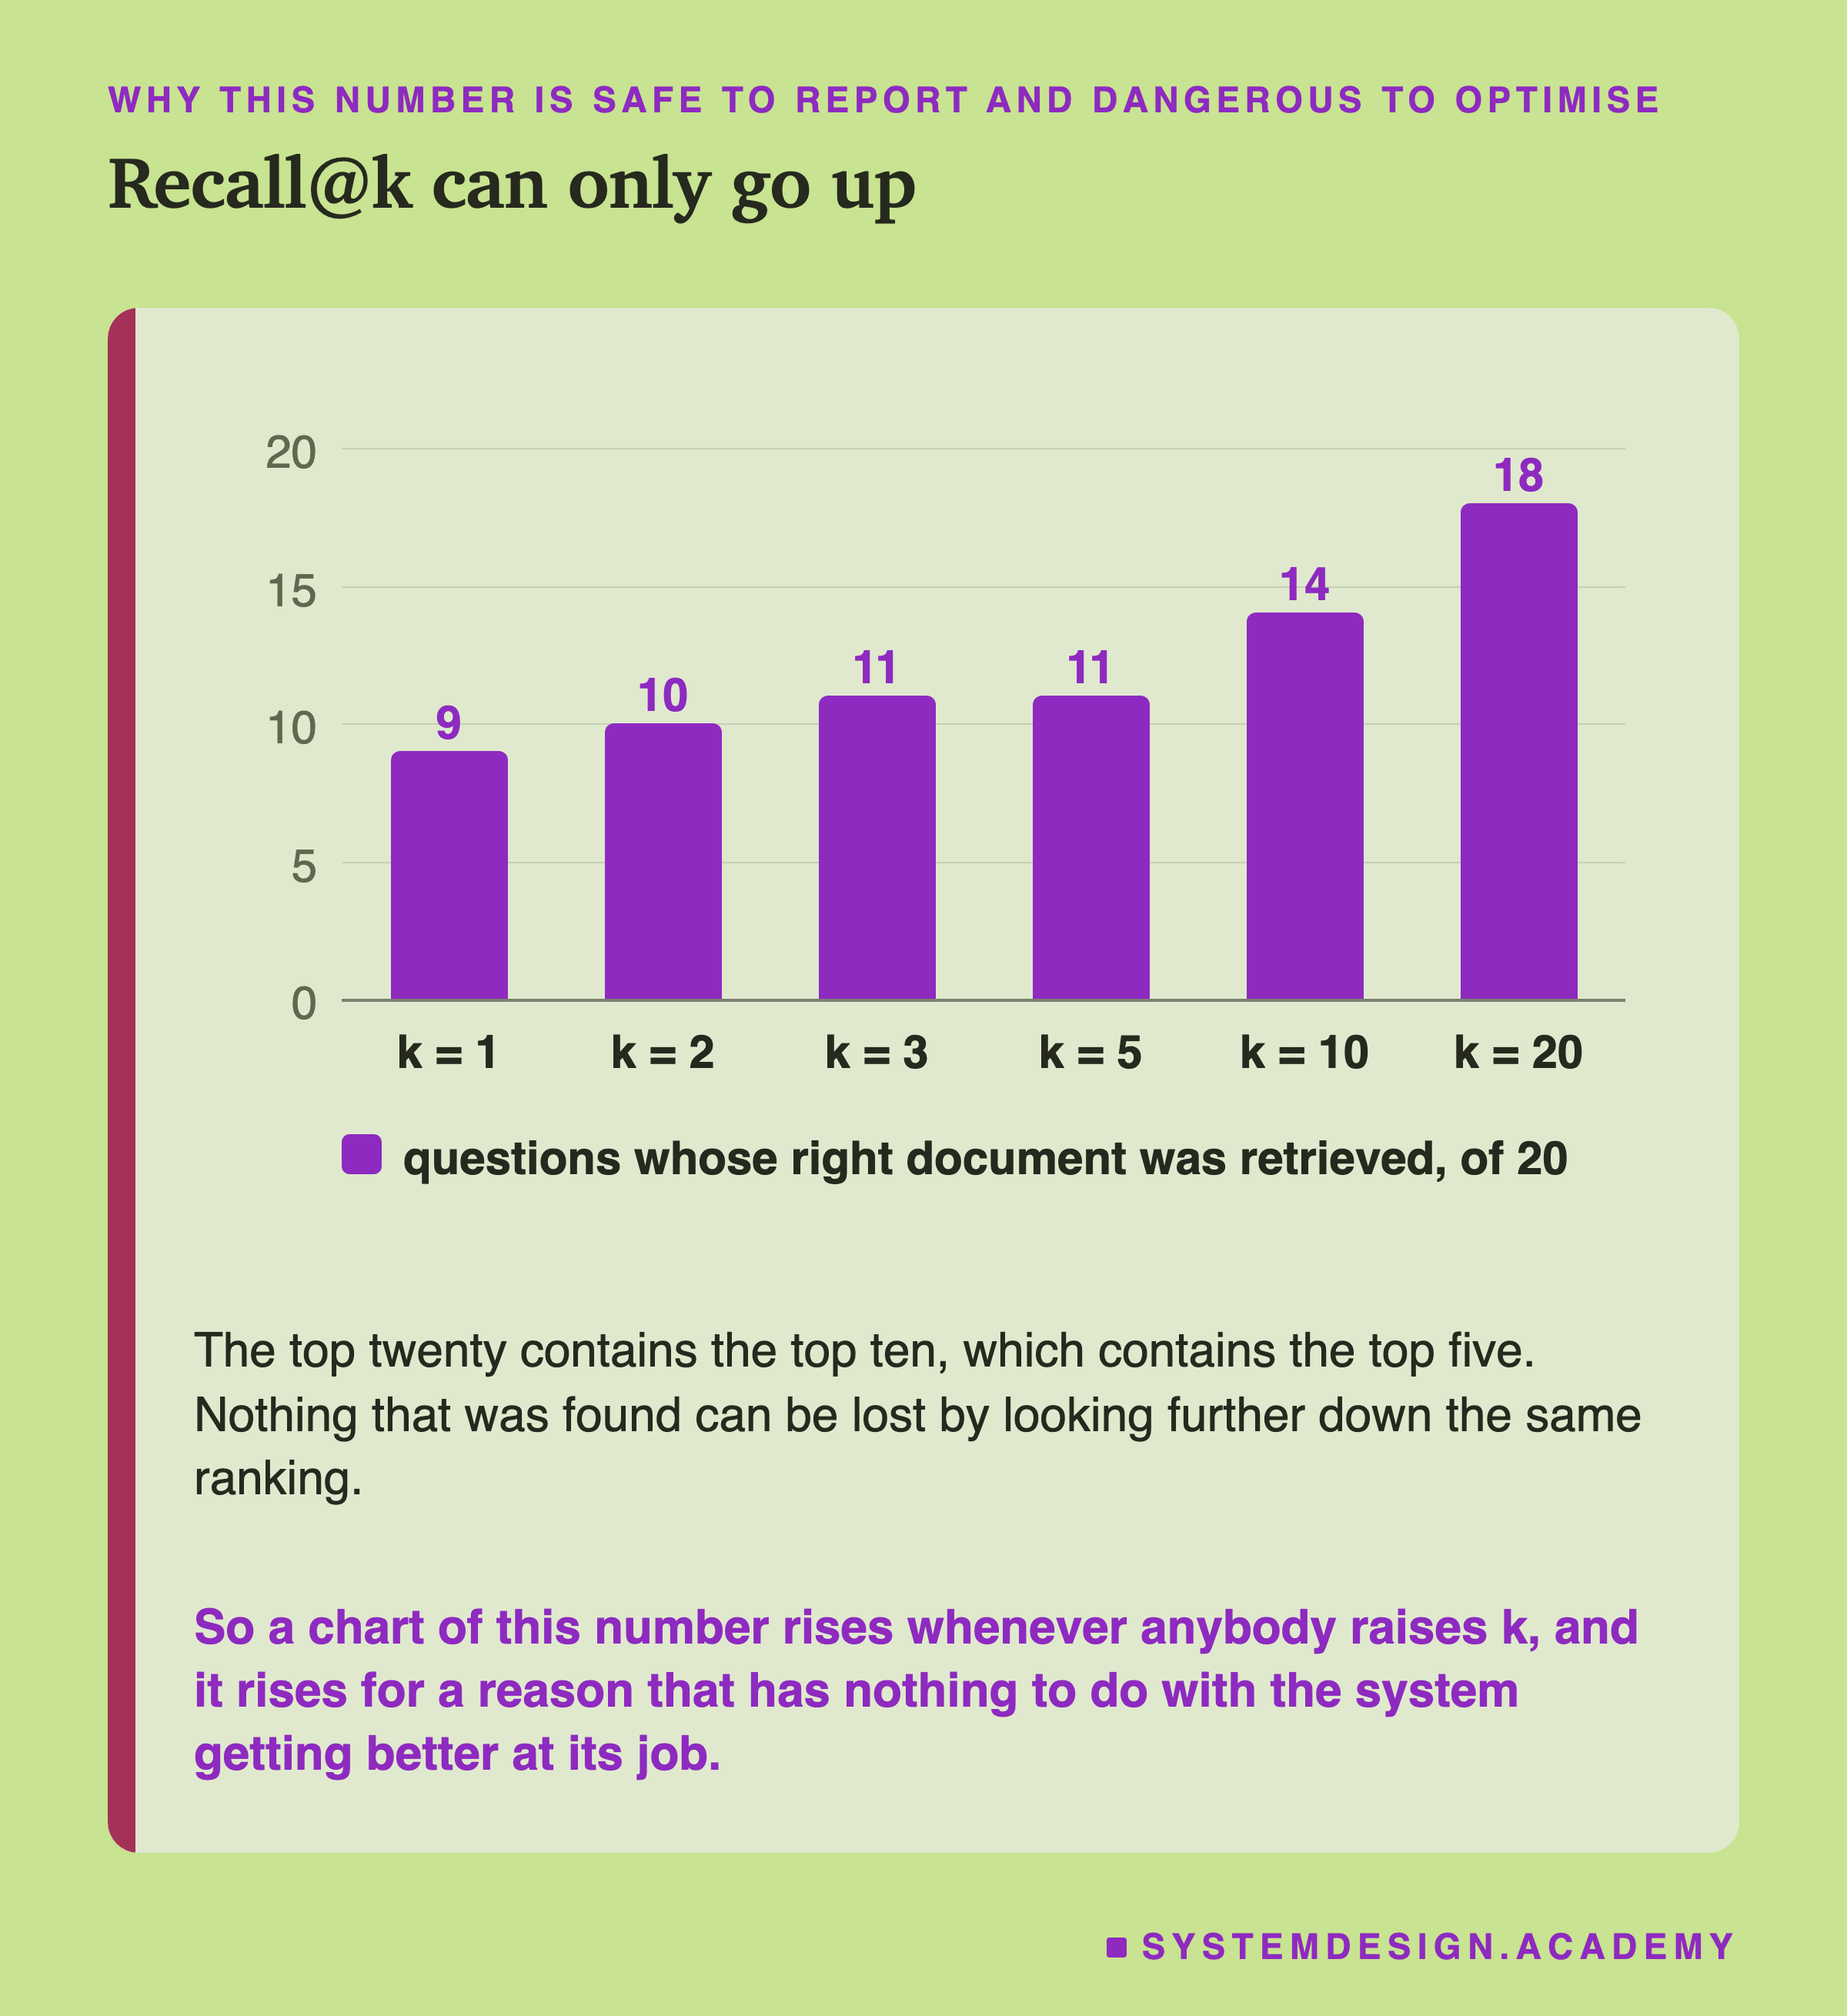
That is what makes it a comfortable number to put on a dashboard and a dangerous one to optimise. Raising k moves it every time, whatever else happens.
When the Right Document Was in the Room
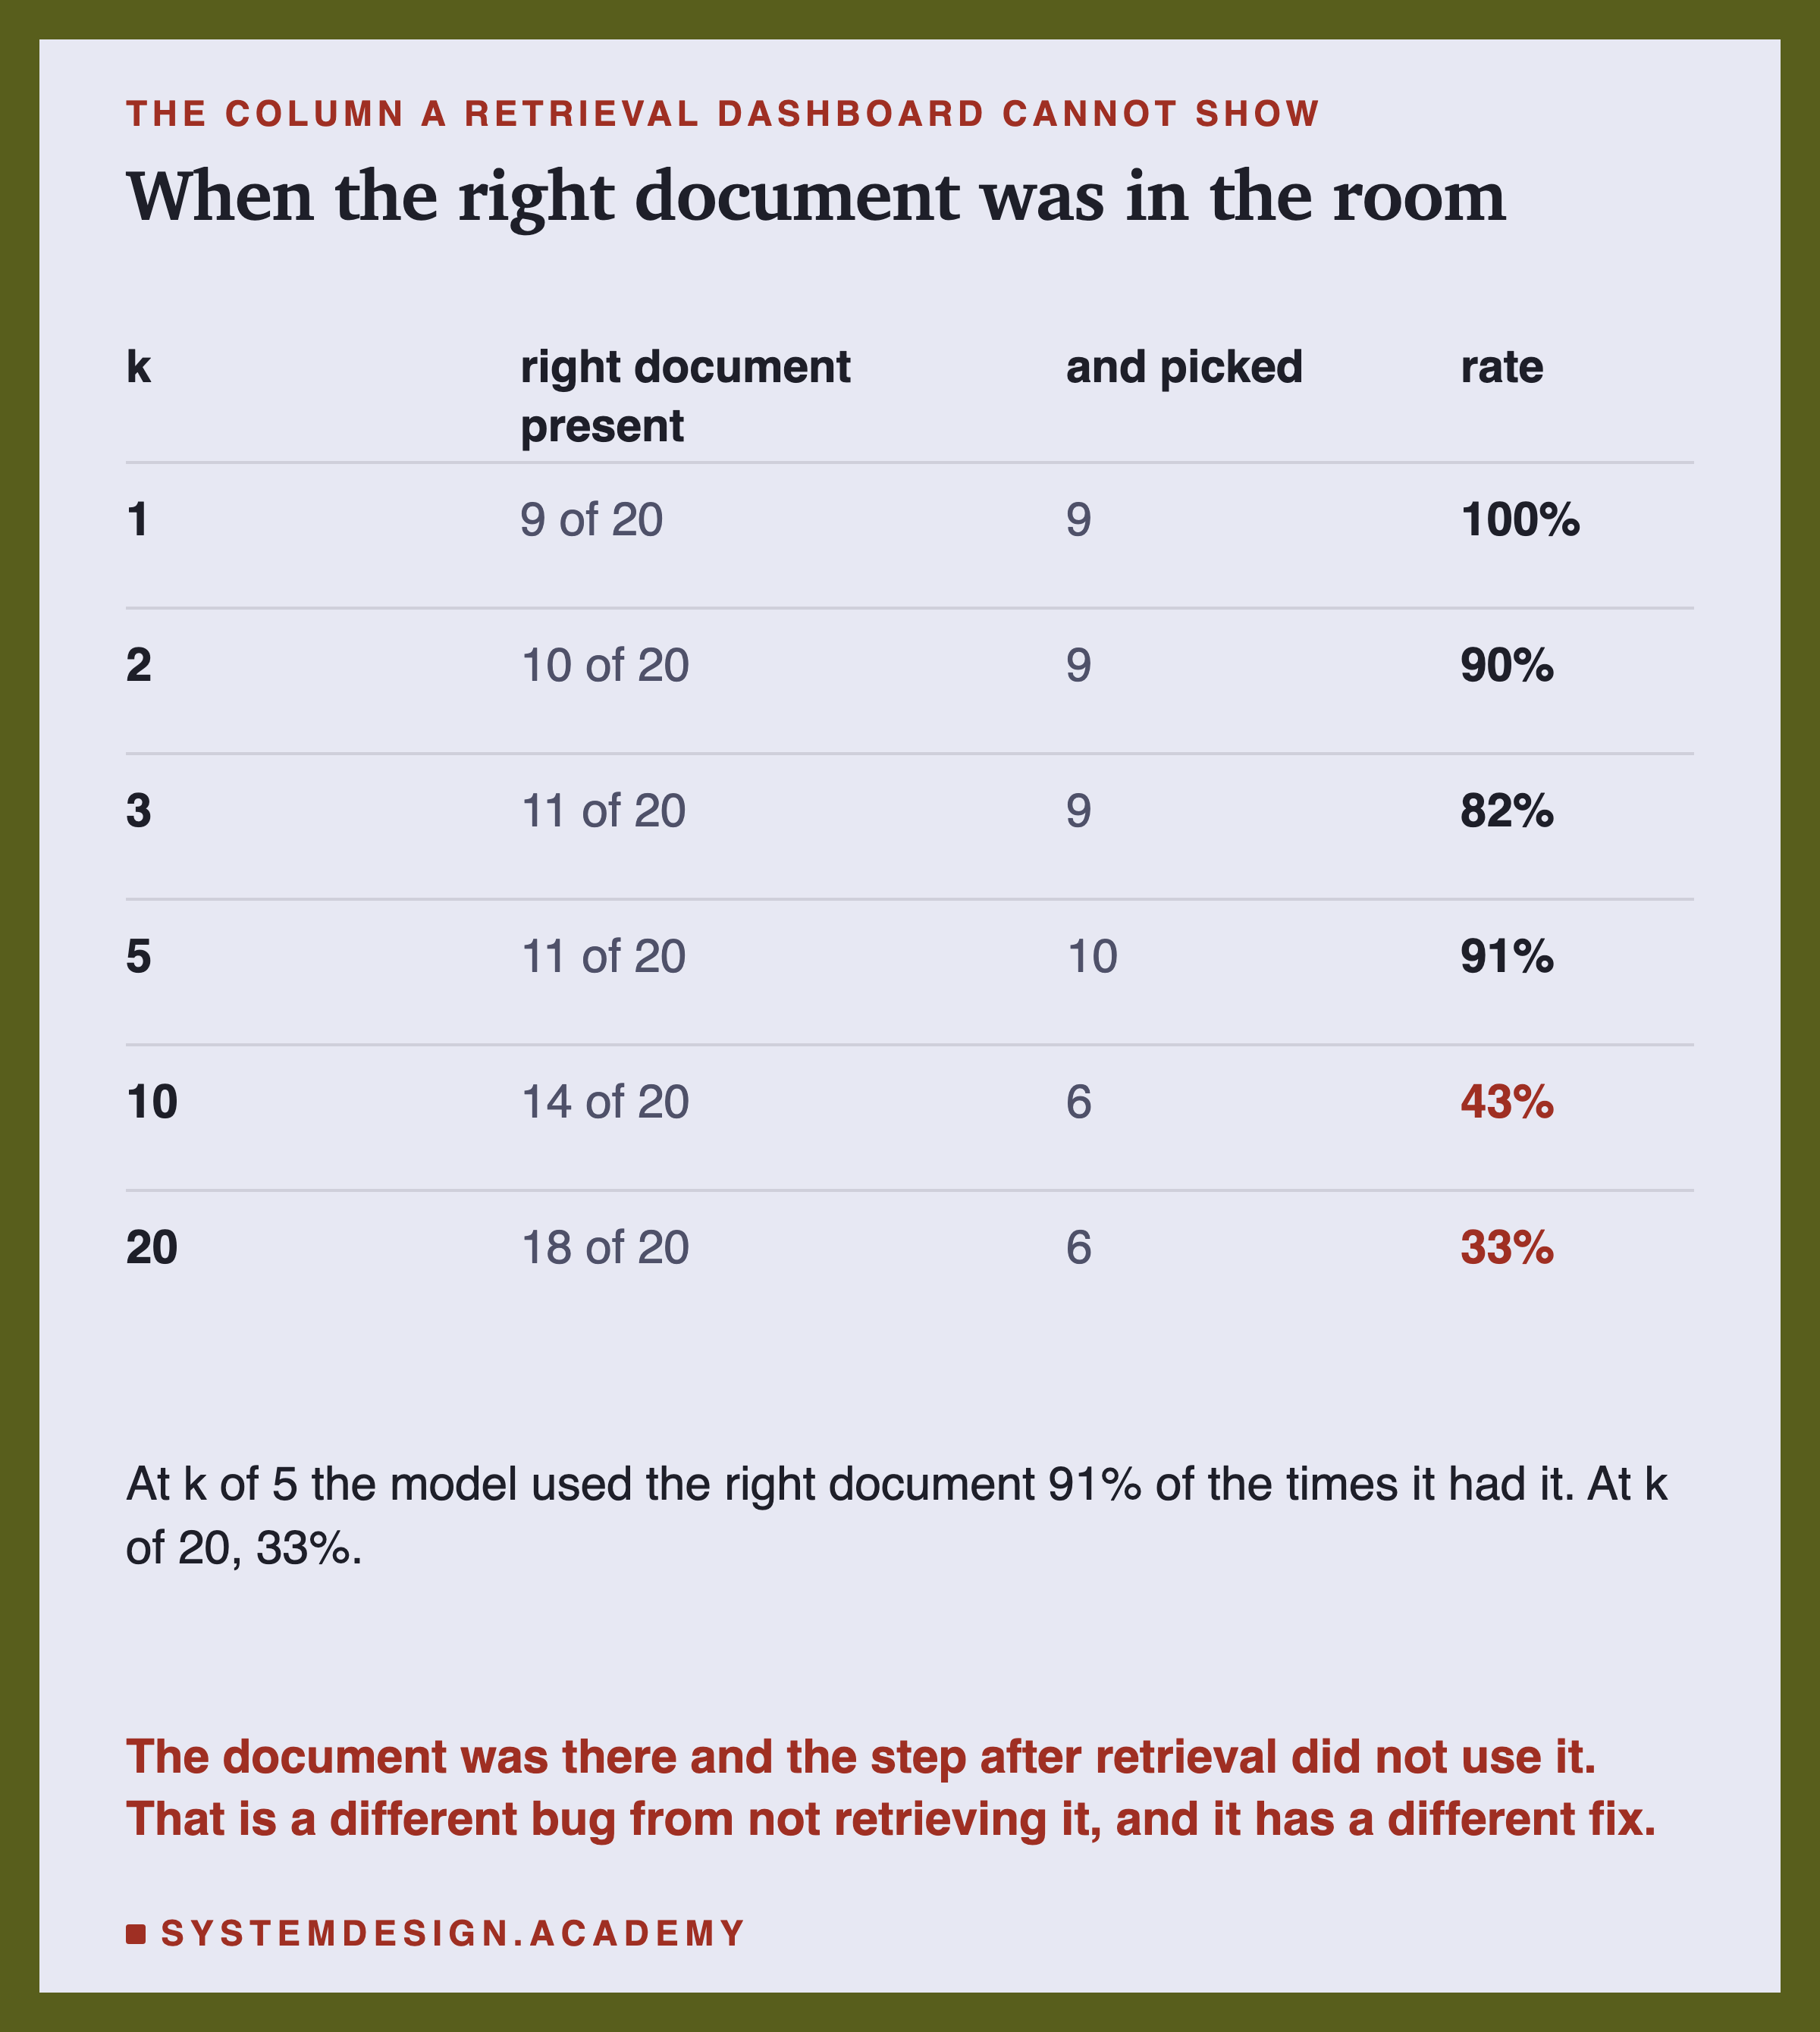
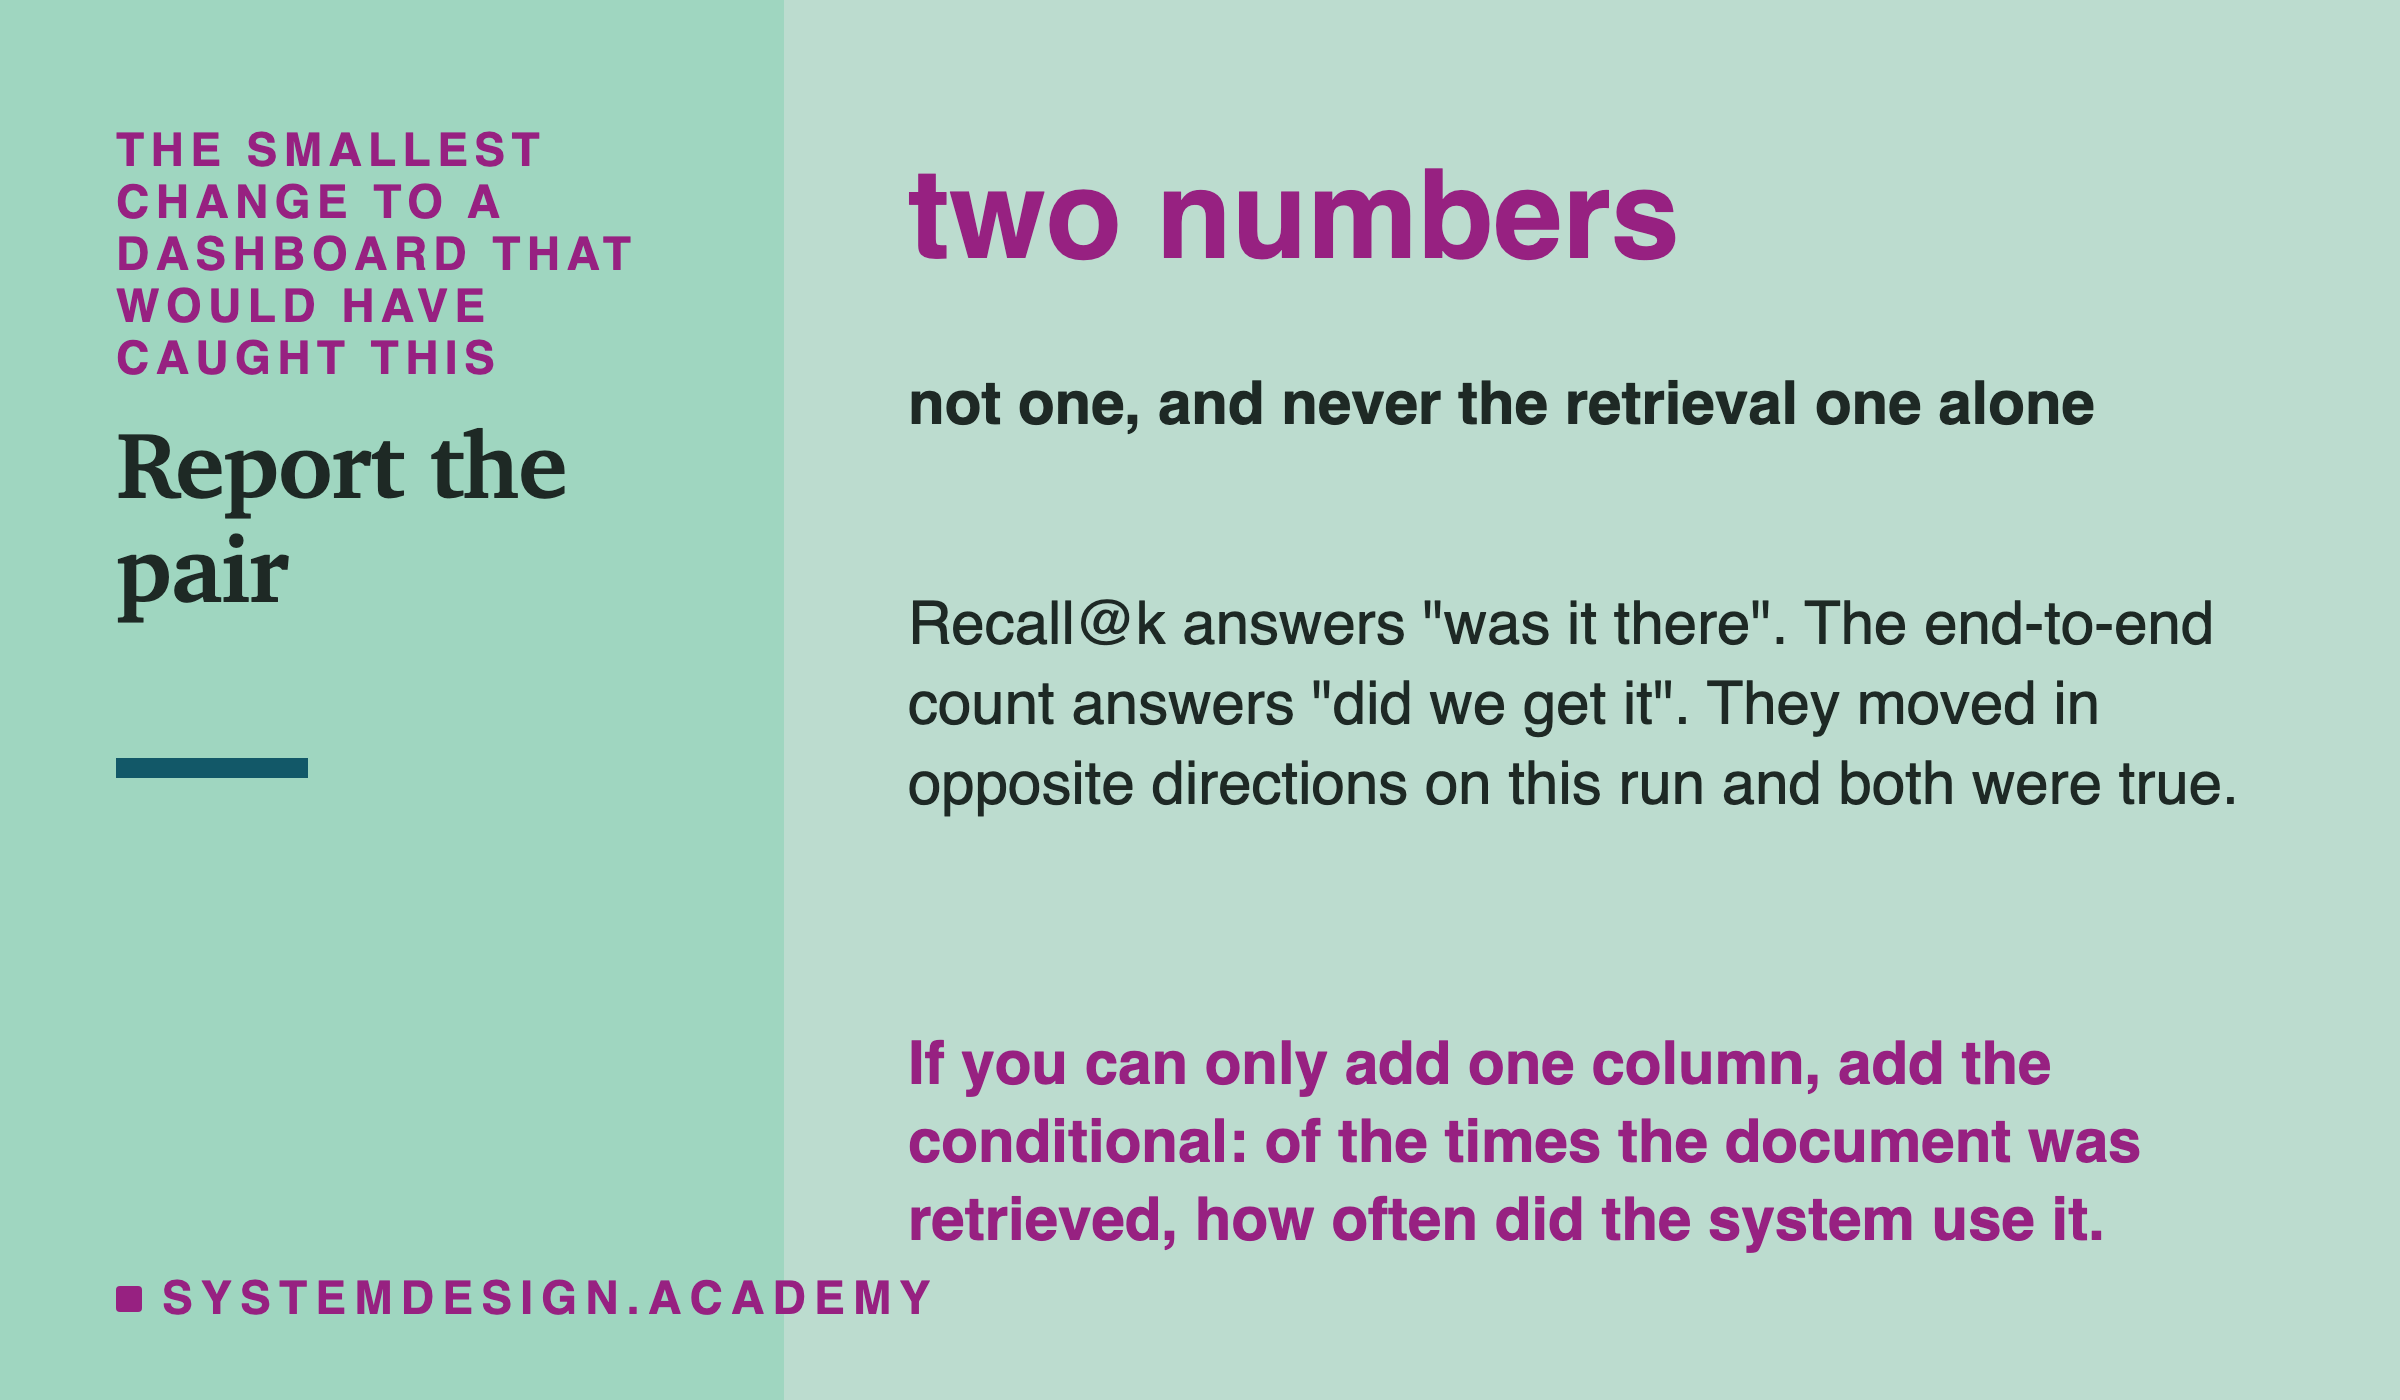
This is the column a retrieval dashboard cannot show. Of the questions where retrieval succeeded, how often did the step after it use what retrieval found.
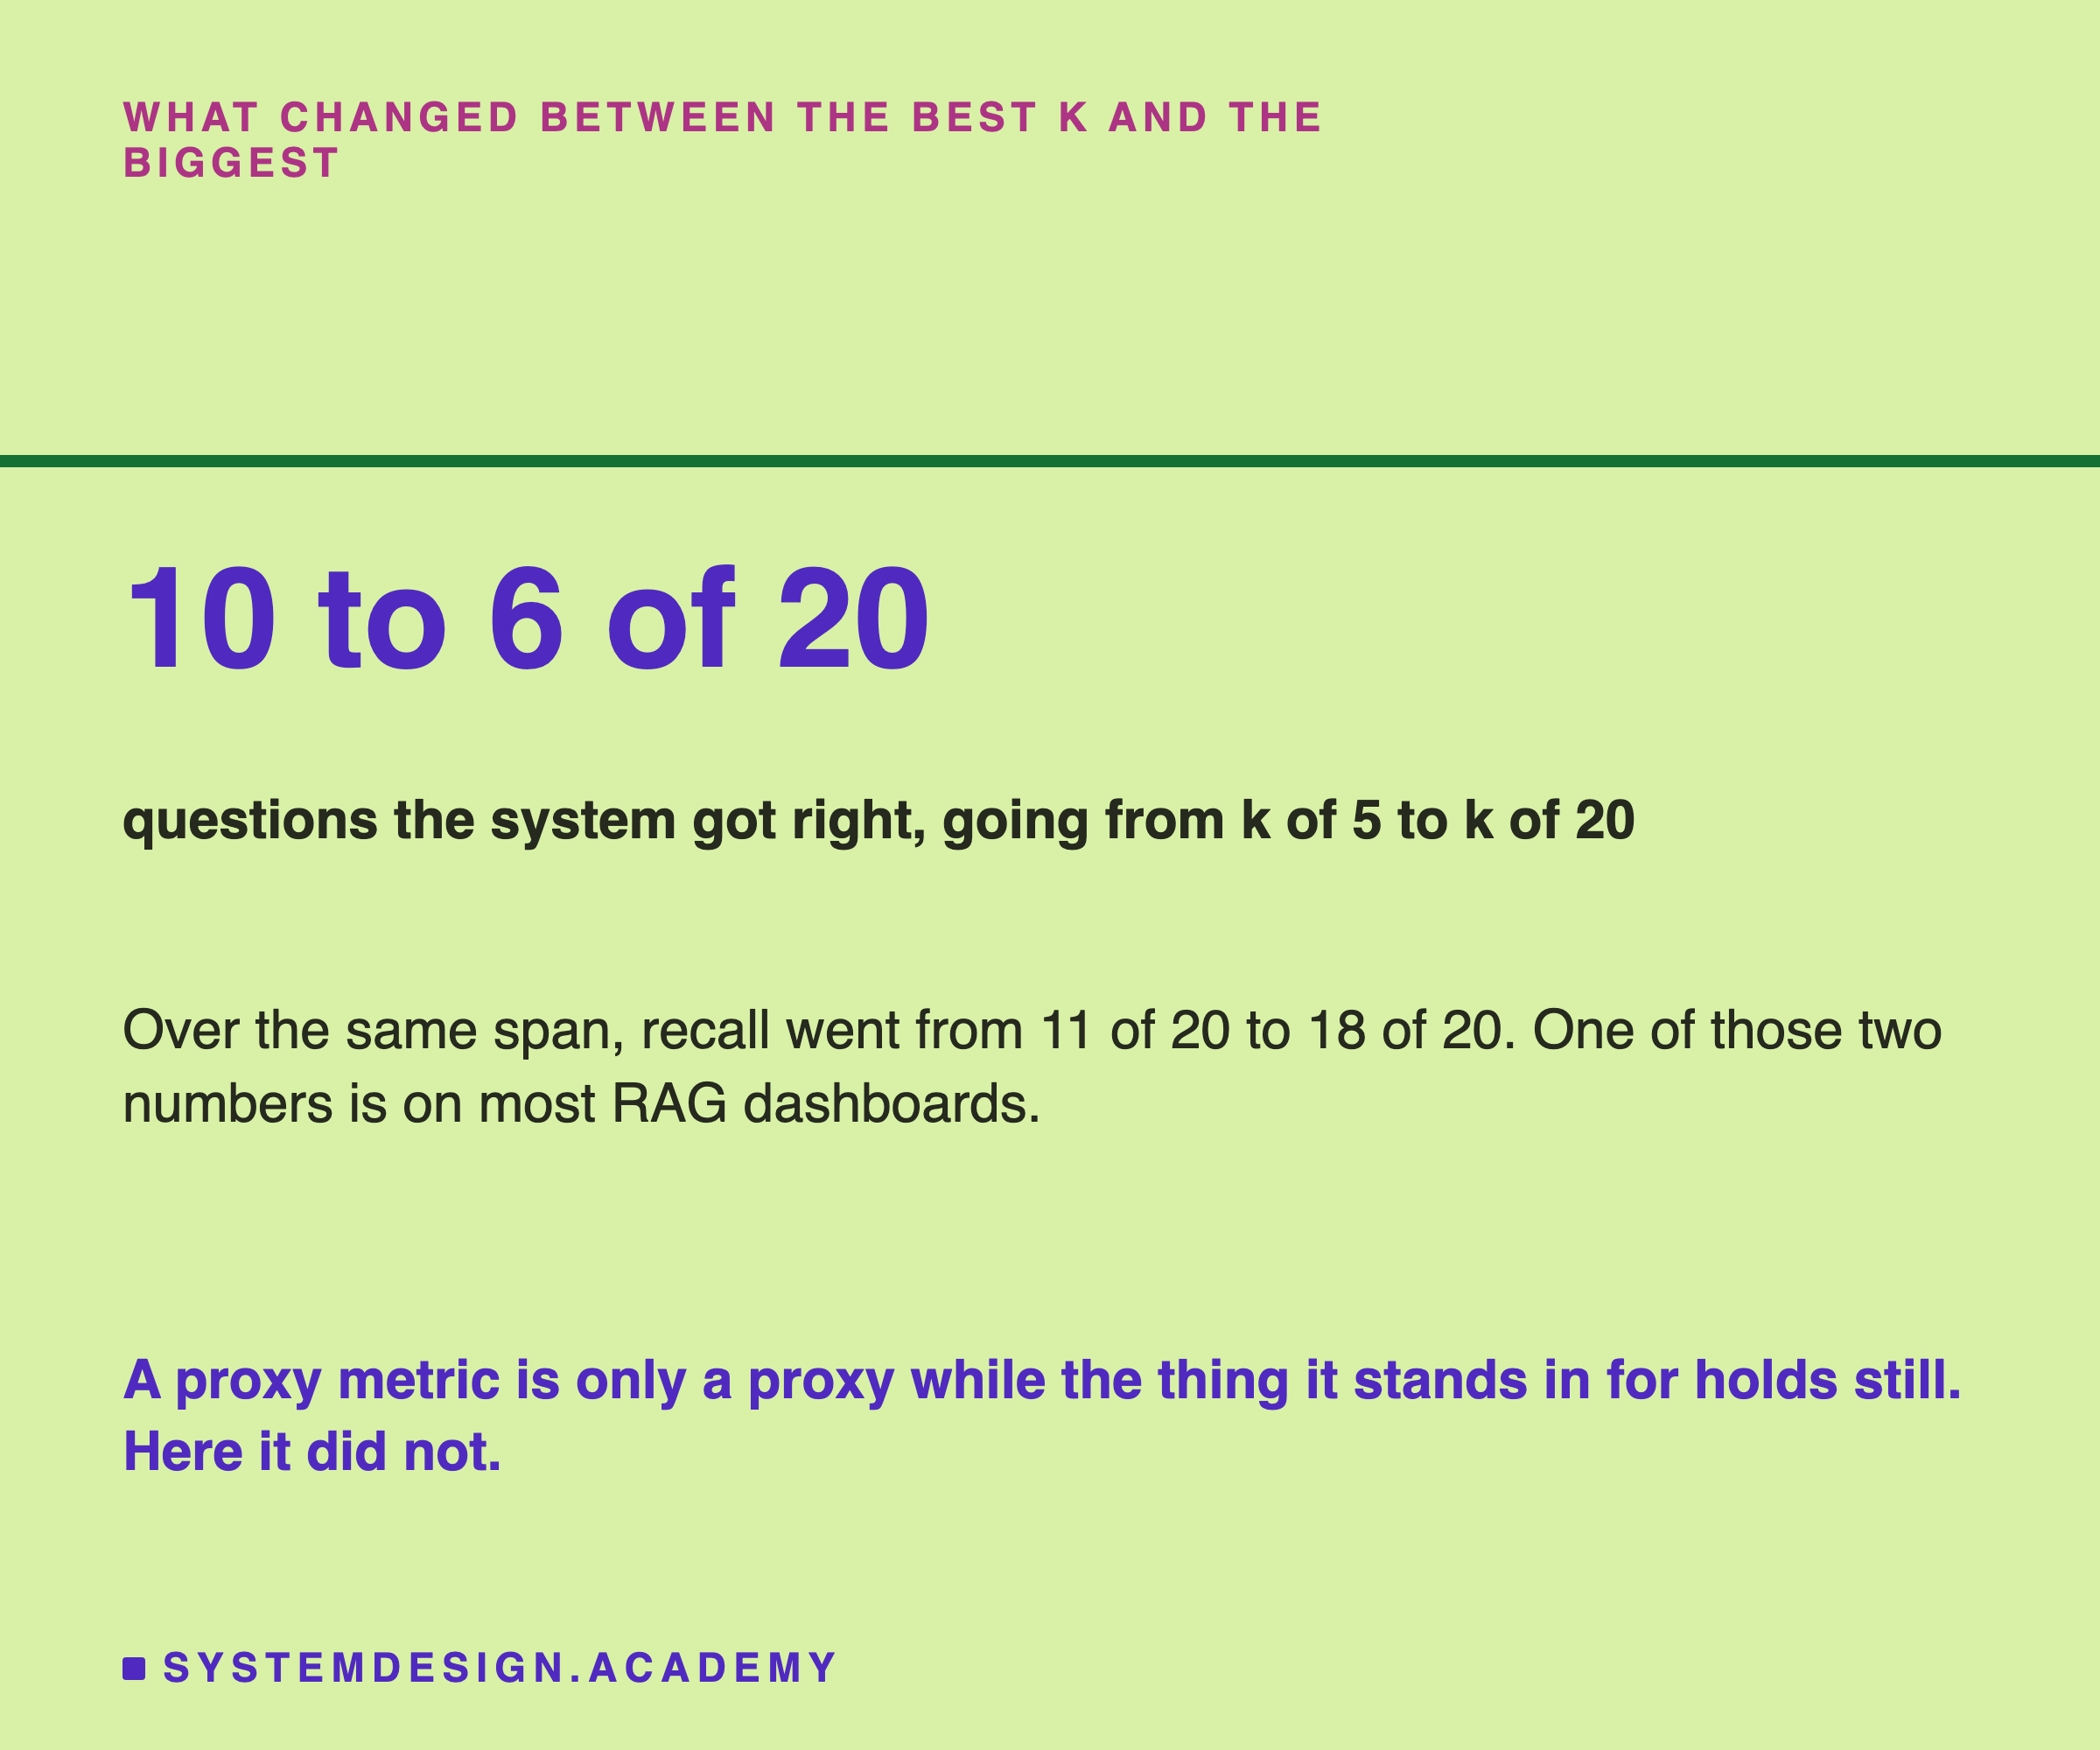
At k of 5 that was 10 of the 11 it had. At k of 20 it was 6 of the 18.
Read the first row of that table carefully, because it is not a measurement of the model at all.
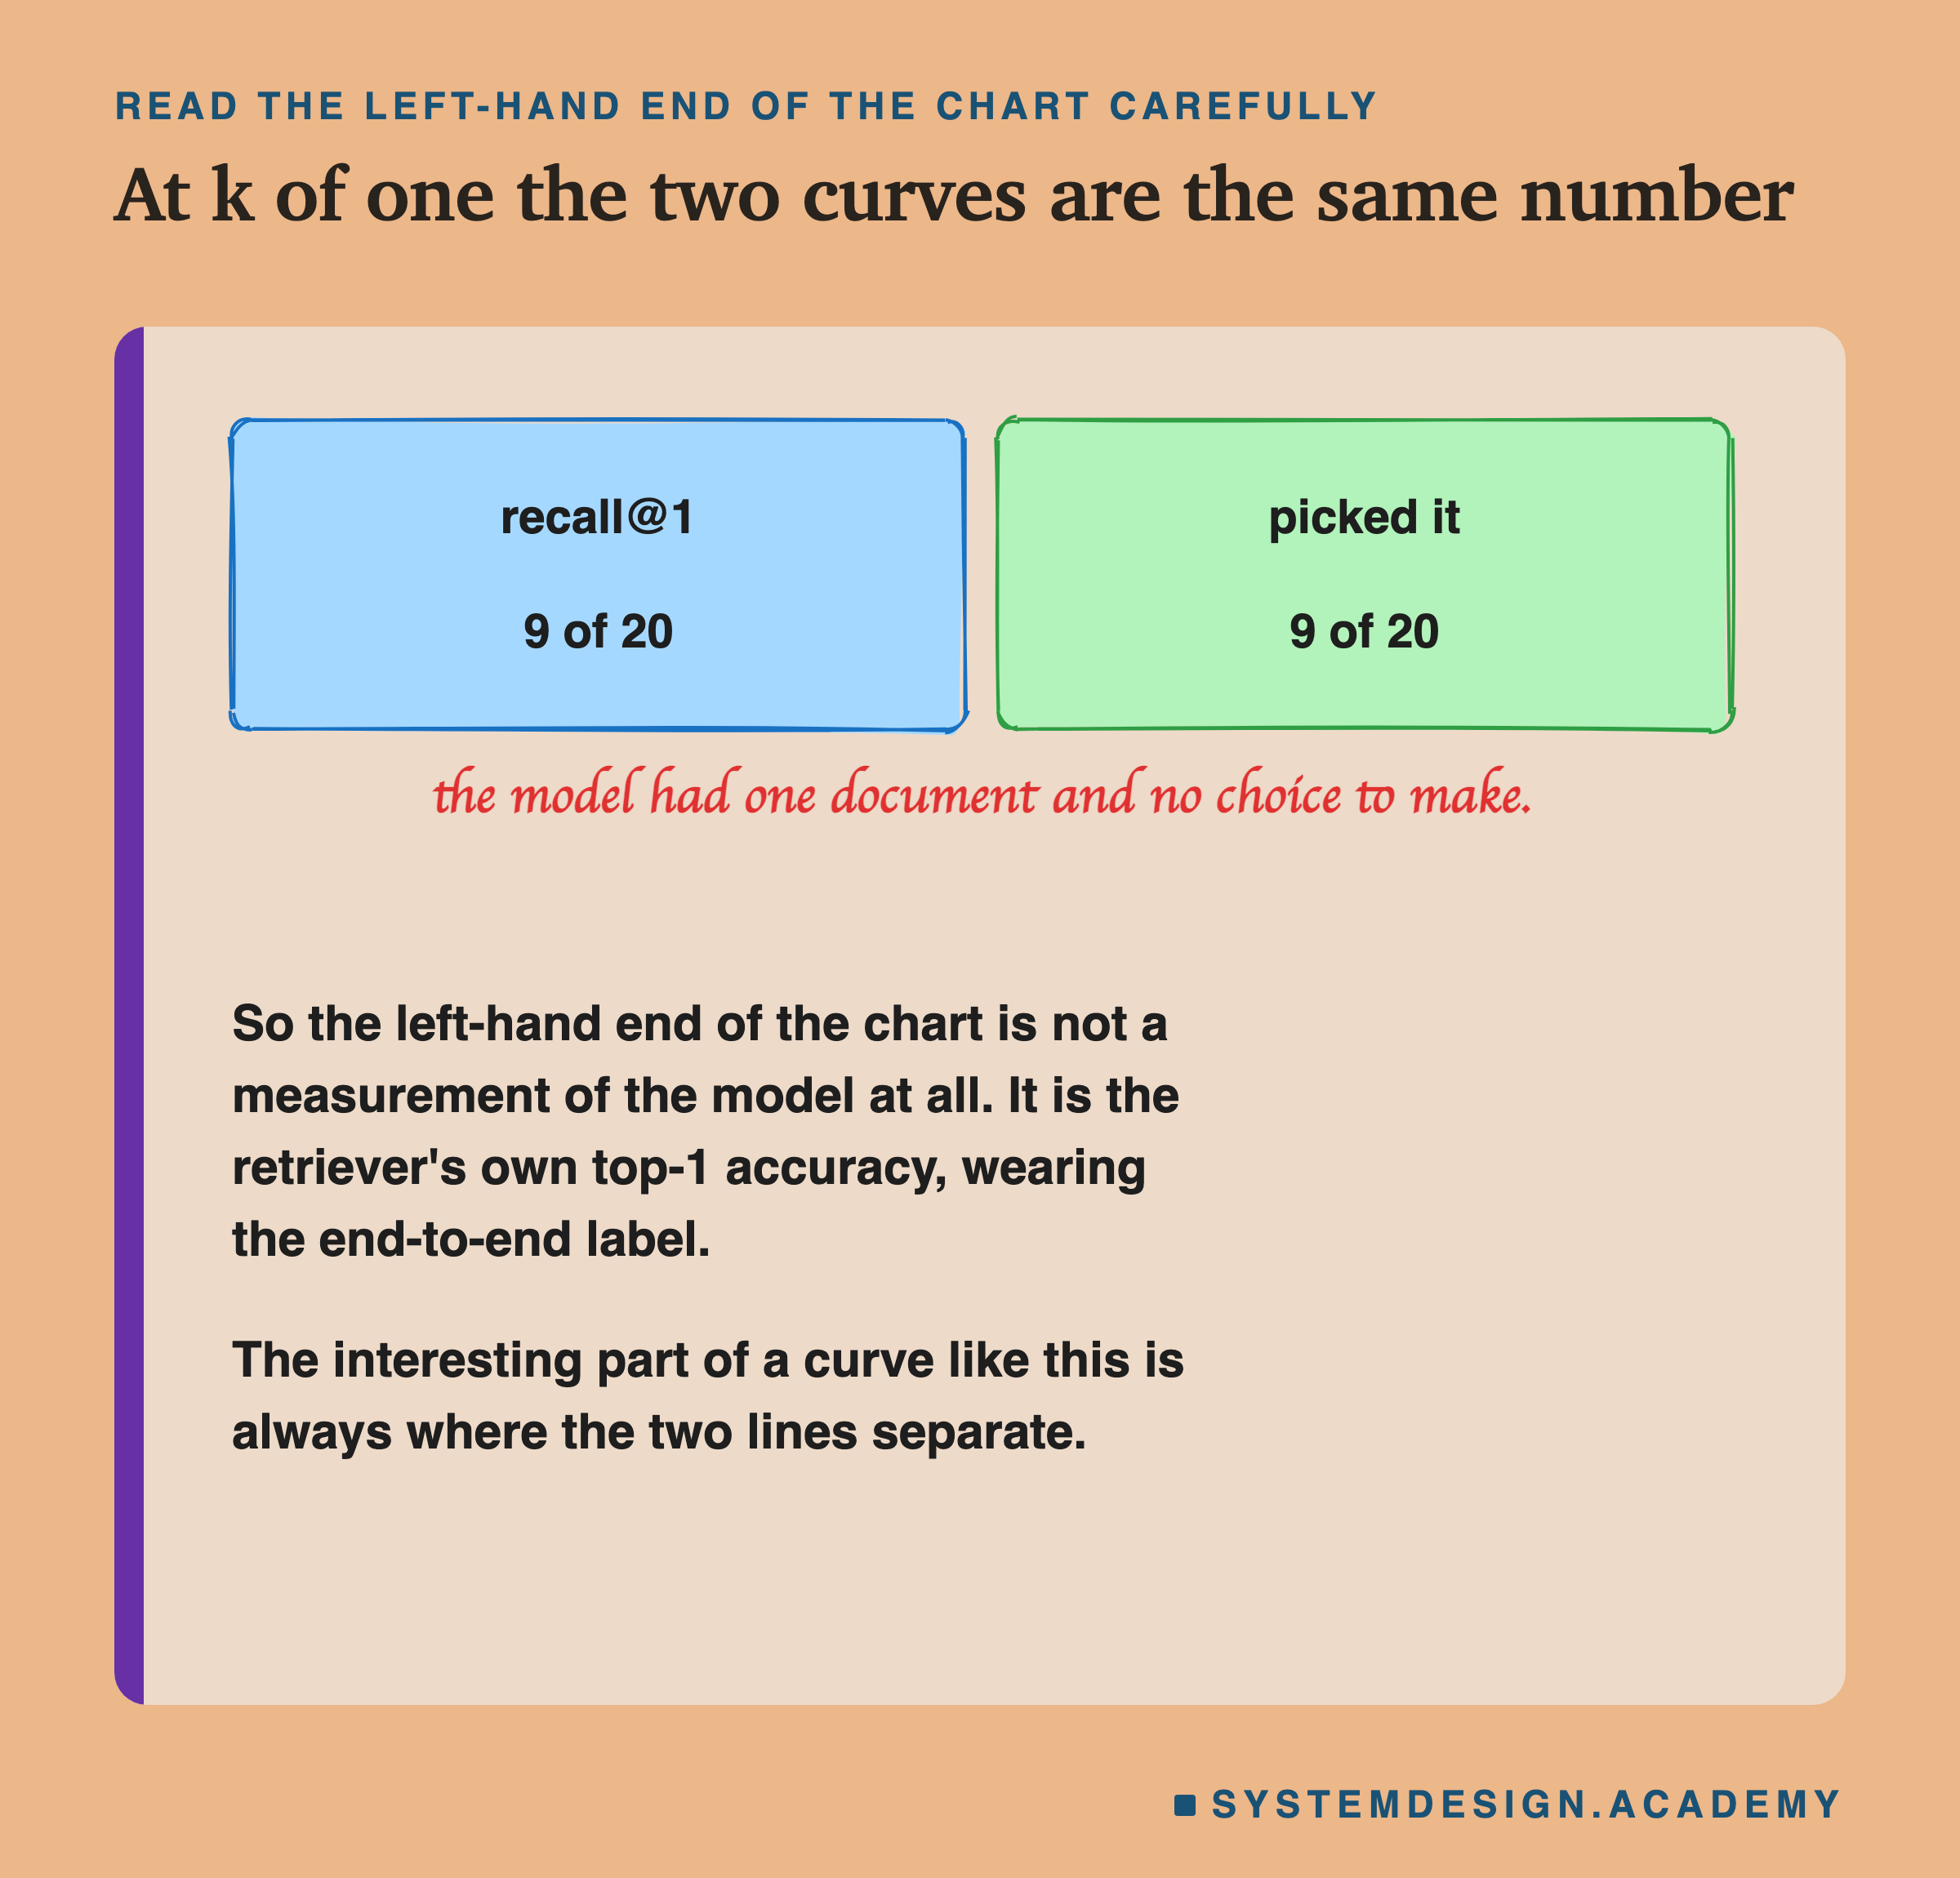
At k of one the model is handed a single document and asked which one answers the question. There is no choice to make, so the two curves are the same number by construction.
The Lab
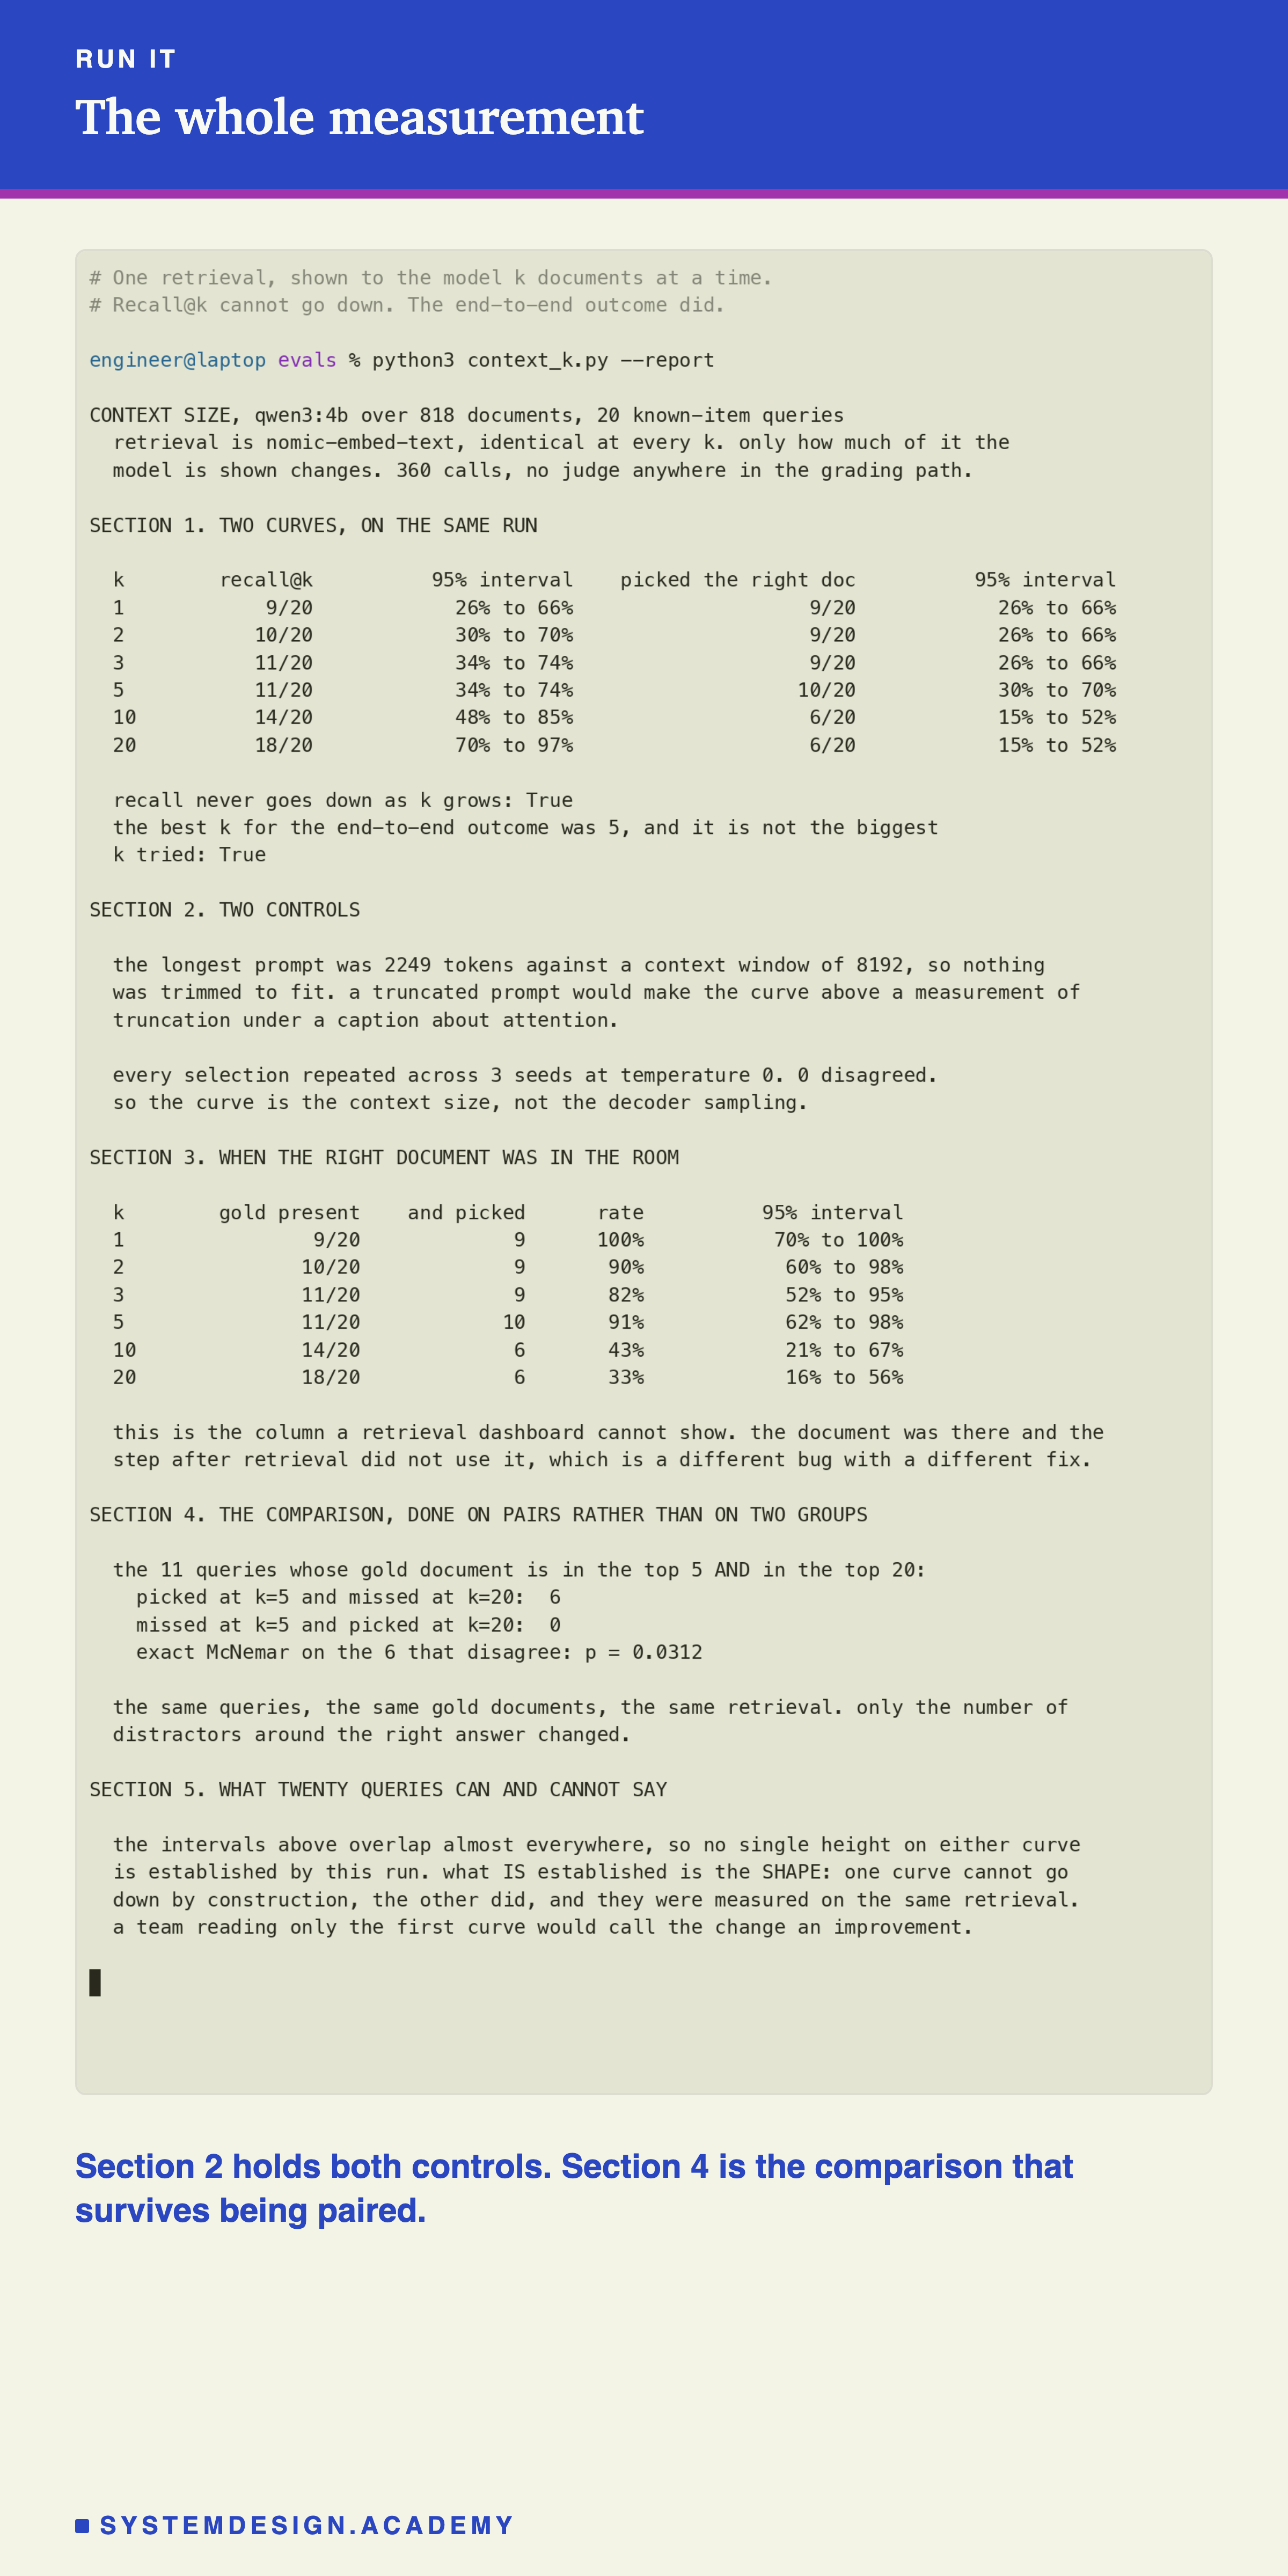
Section 2 holds both controls. Section 4 is the comparison that survives being paired.
Two Things That Could Have Made This Meaningless
The first is the decoder. Every selection was made three times at temperature 0 with three different seeds, which the previous lesson showed is a control that can fail. None of the 120 selections disagreed with itself.
The second matters more here. A prompt that does not fit the context window is silently trimmed, and then the curve would be a picture of truncation under a caption about attention. The longest prompt in this sweep was 2249 tokens against a window of 8192. The lab prints both, so the reader does not have to take it on trust.
Neither check is interesting when it passes. Both would have invalidated the whole lesson if it had not.
The Comparison, Done on Pairs
The conditional rate at k of 5 is 10 of 11 and at k of 20 it is 6 of 18. Those two fractions share their questions: every question whose document is in the top 5 is also in the top 20. Comparing them as though they were two independent groups is the same mistake as running a coin-flip test on paired data.
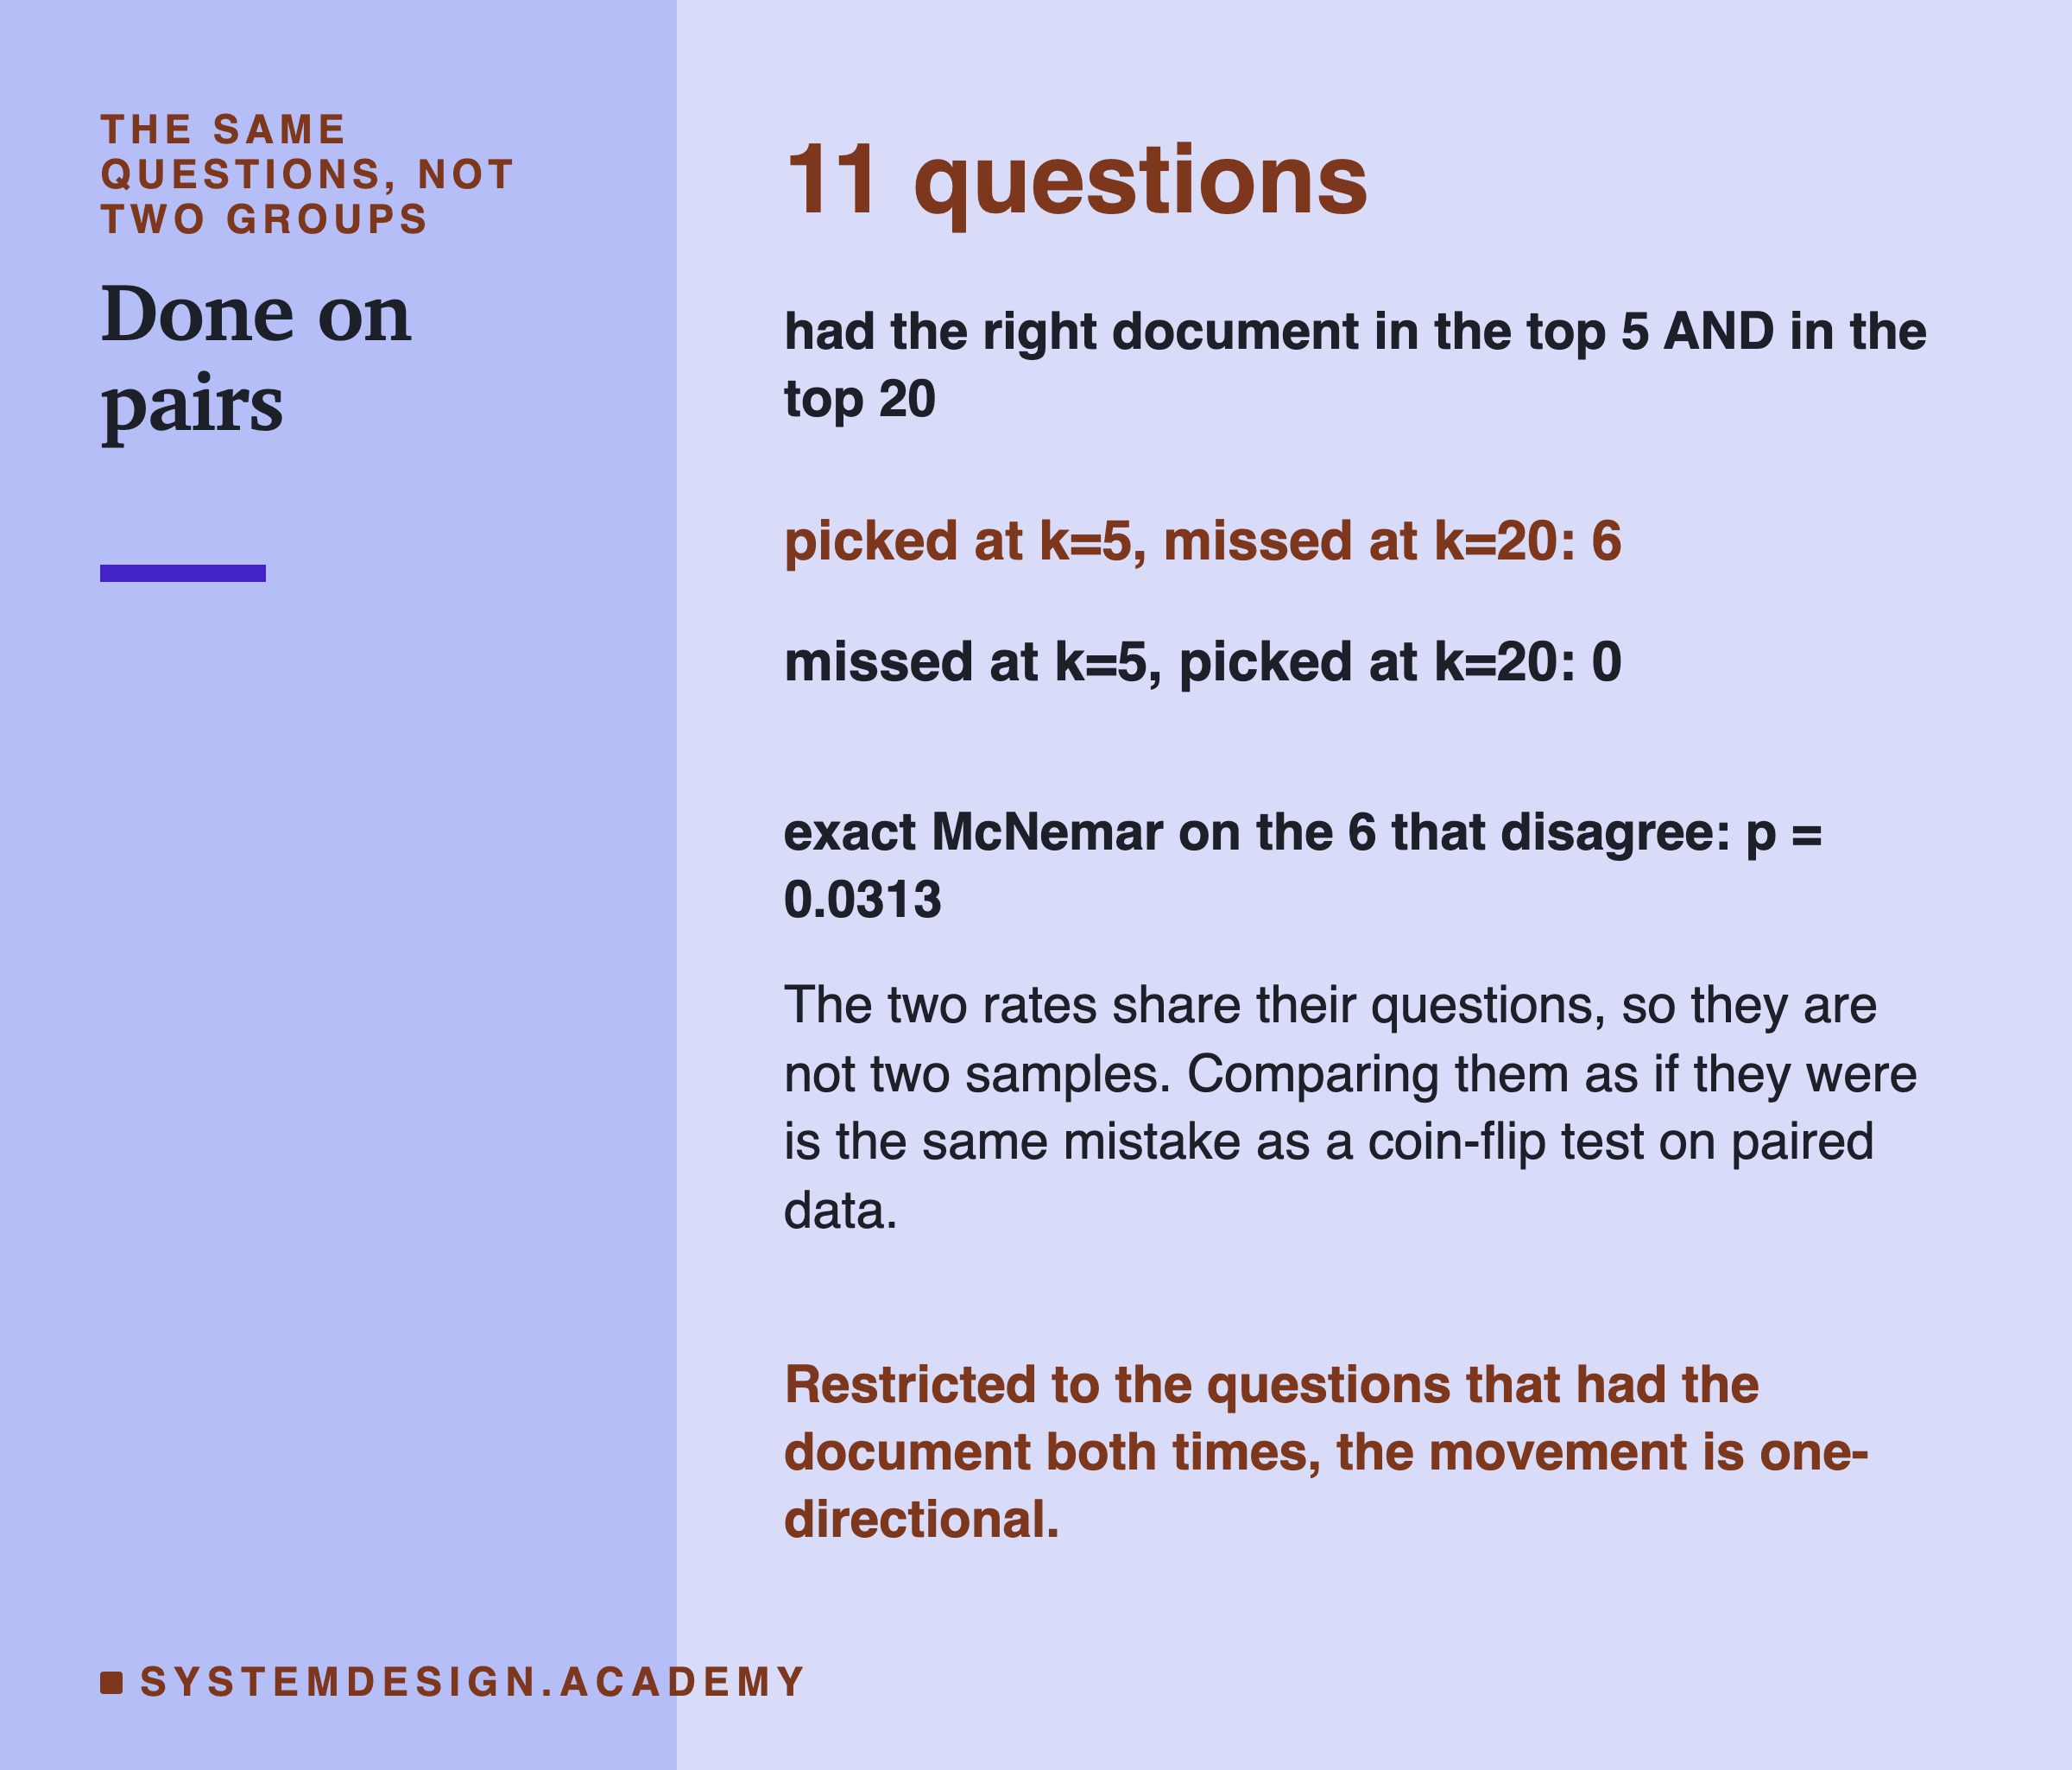
Restricted to the 11 questions that had the document at both values of k, six moved from right to wrong and none moved the other way. An exact McNemar test on the six discordant pairs gives p = 0.0312.
Same questions, same gold documents, same ranking. The only thing that changed was how many plausible neighbours were sitting around the right answer.
The End-to-End Number Is a Product
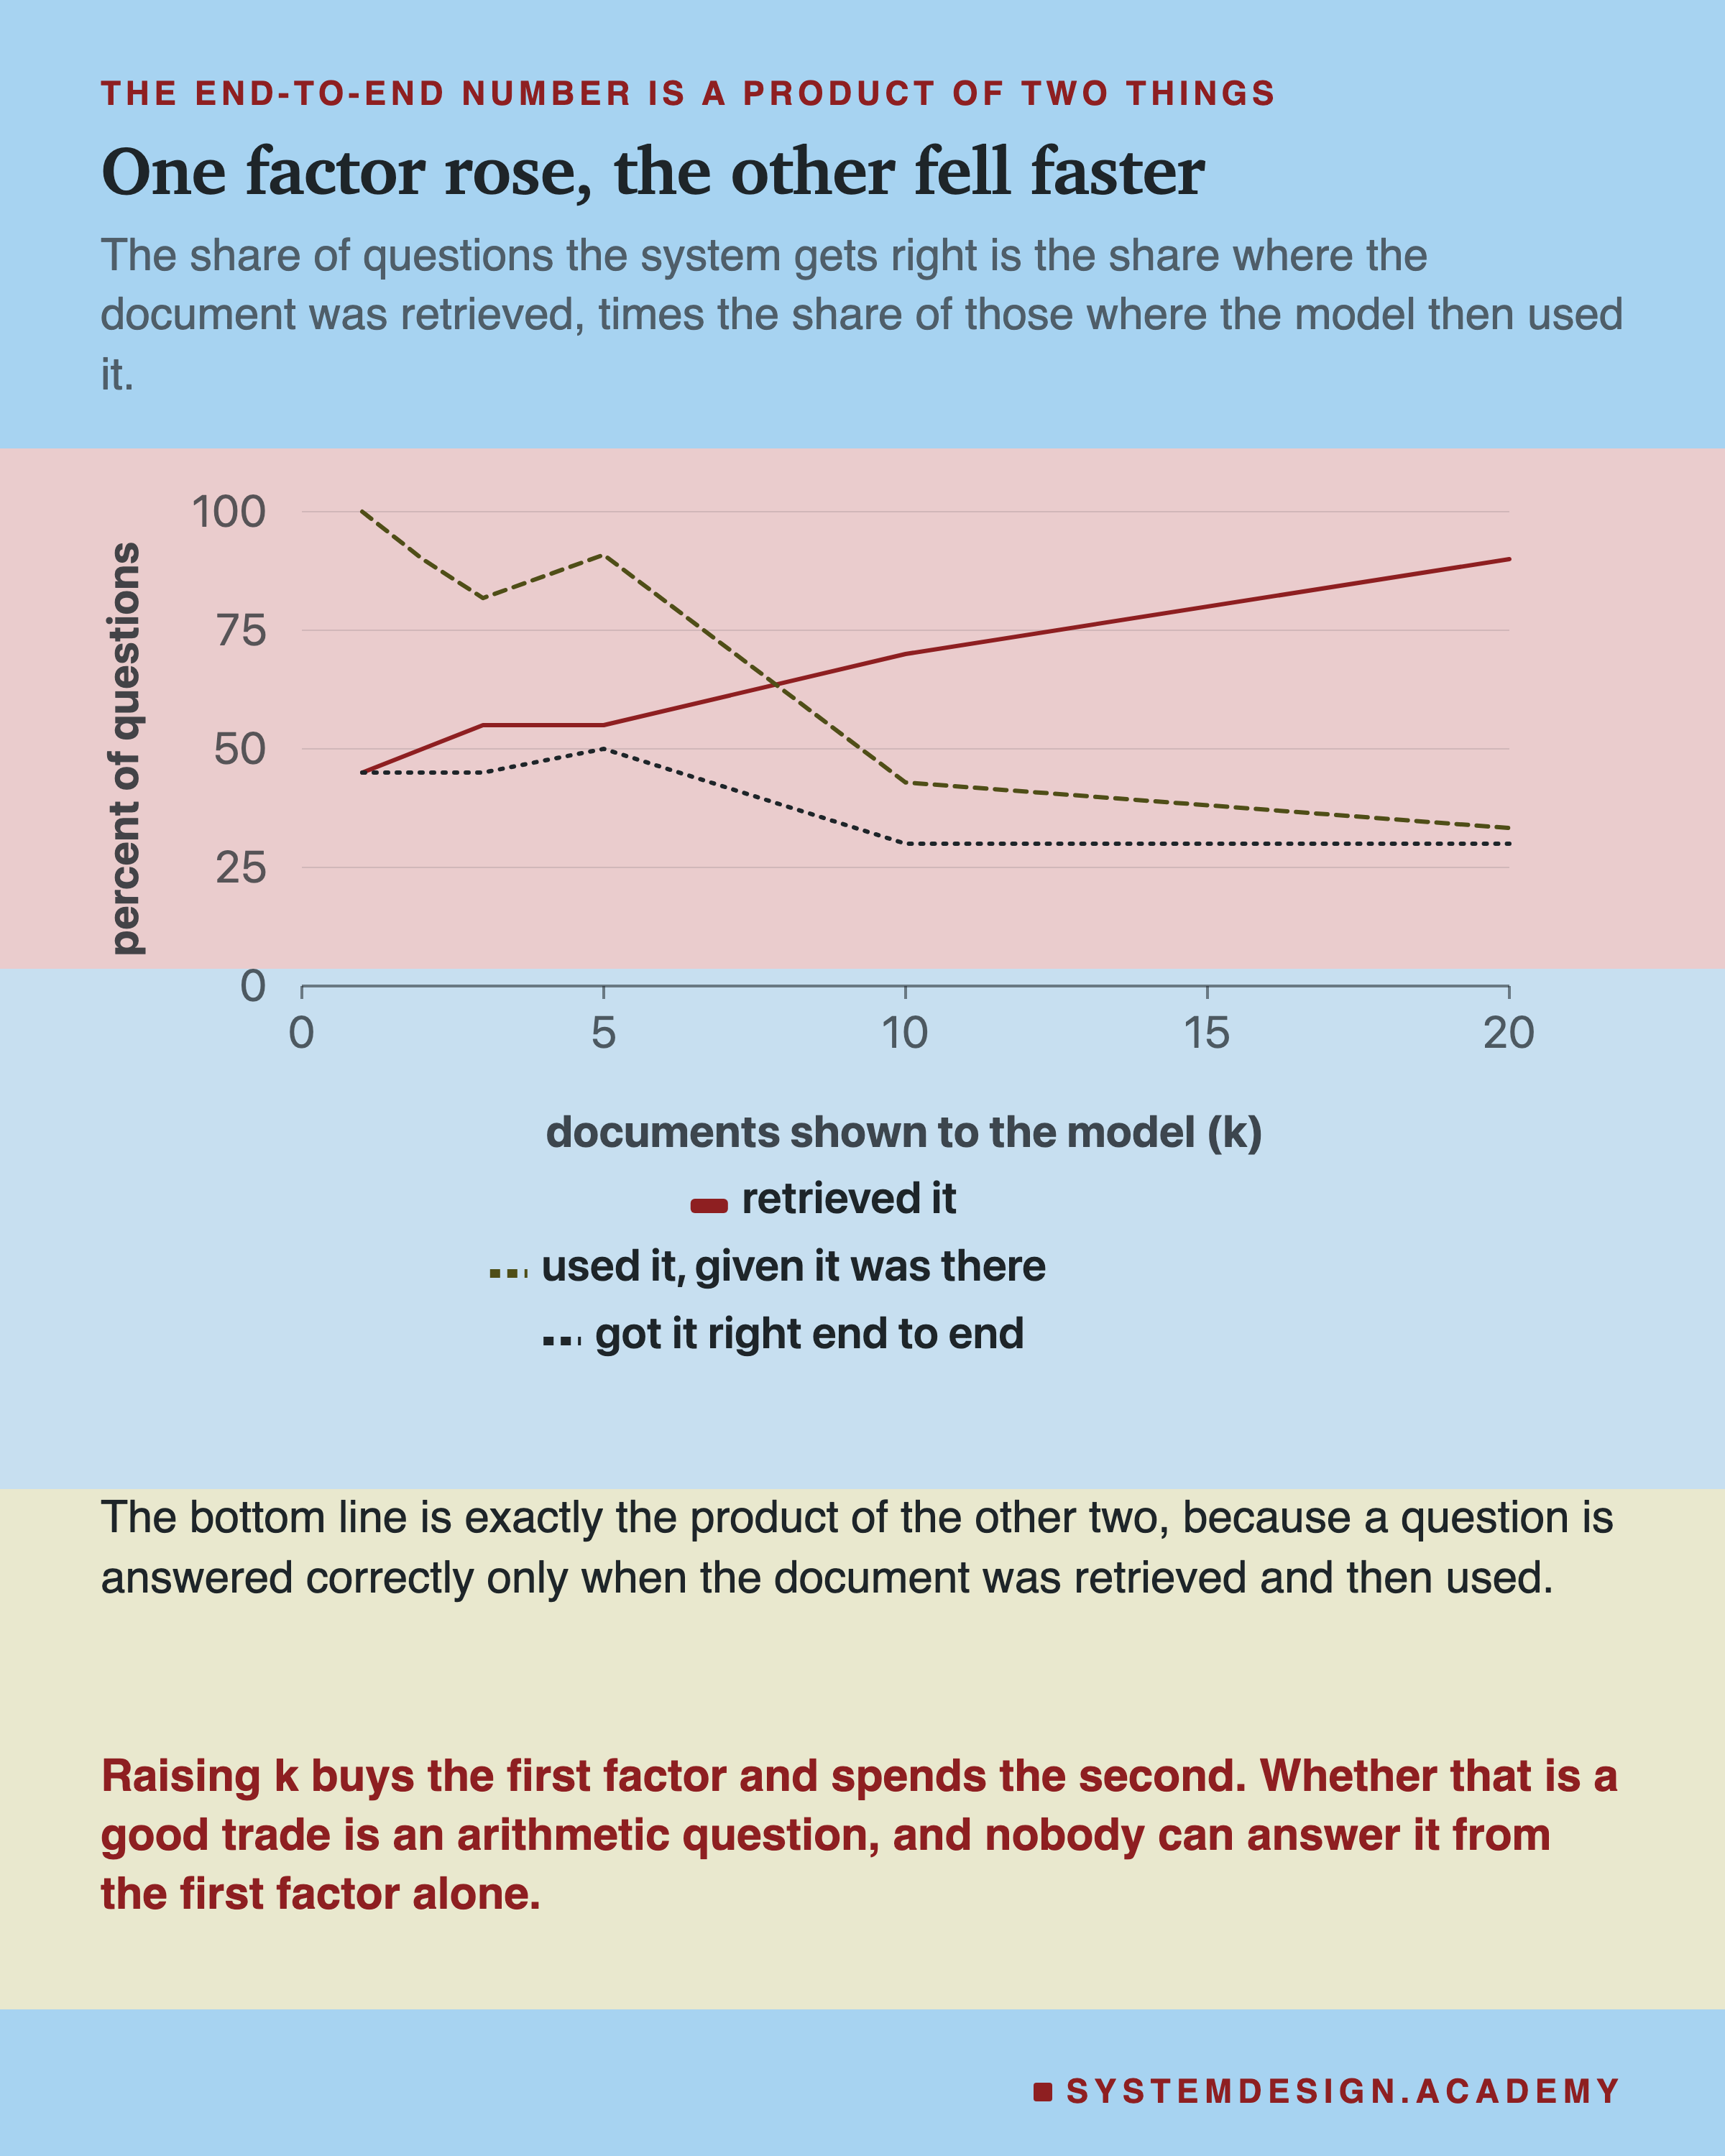
A question is answered correctly only if the document was retrieved and then used. So the end-to-end rate is the product of two rates, and raising k buys one of them by spending the other.
That makes the choice of k arithmetic rather than taste, and the arithmetic needs both factors.
Part 3 is the one worth sitting with. A metric is valid exactly when the factor it ignores holds still, and that assumption is almost never written down anywhere. Written down here, it is obviously false: the second factor fell from 91% to 33% across the same sweep.
Why More Context Makes the Right Document Harder to Use
This lab measures that the model used the right document less often as k grew. It does not measure why, and the difference matters.
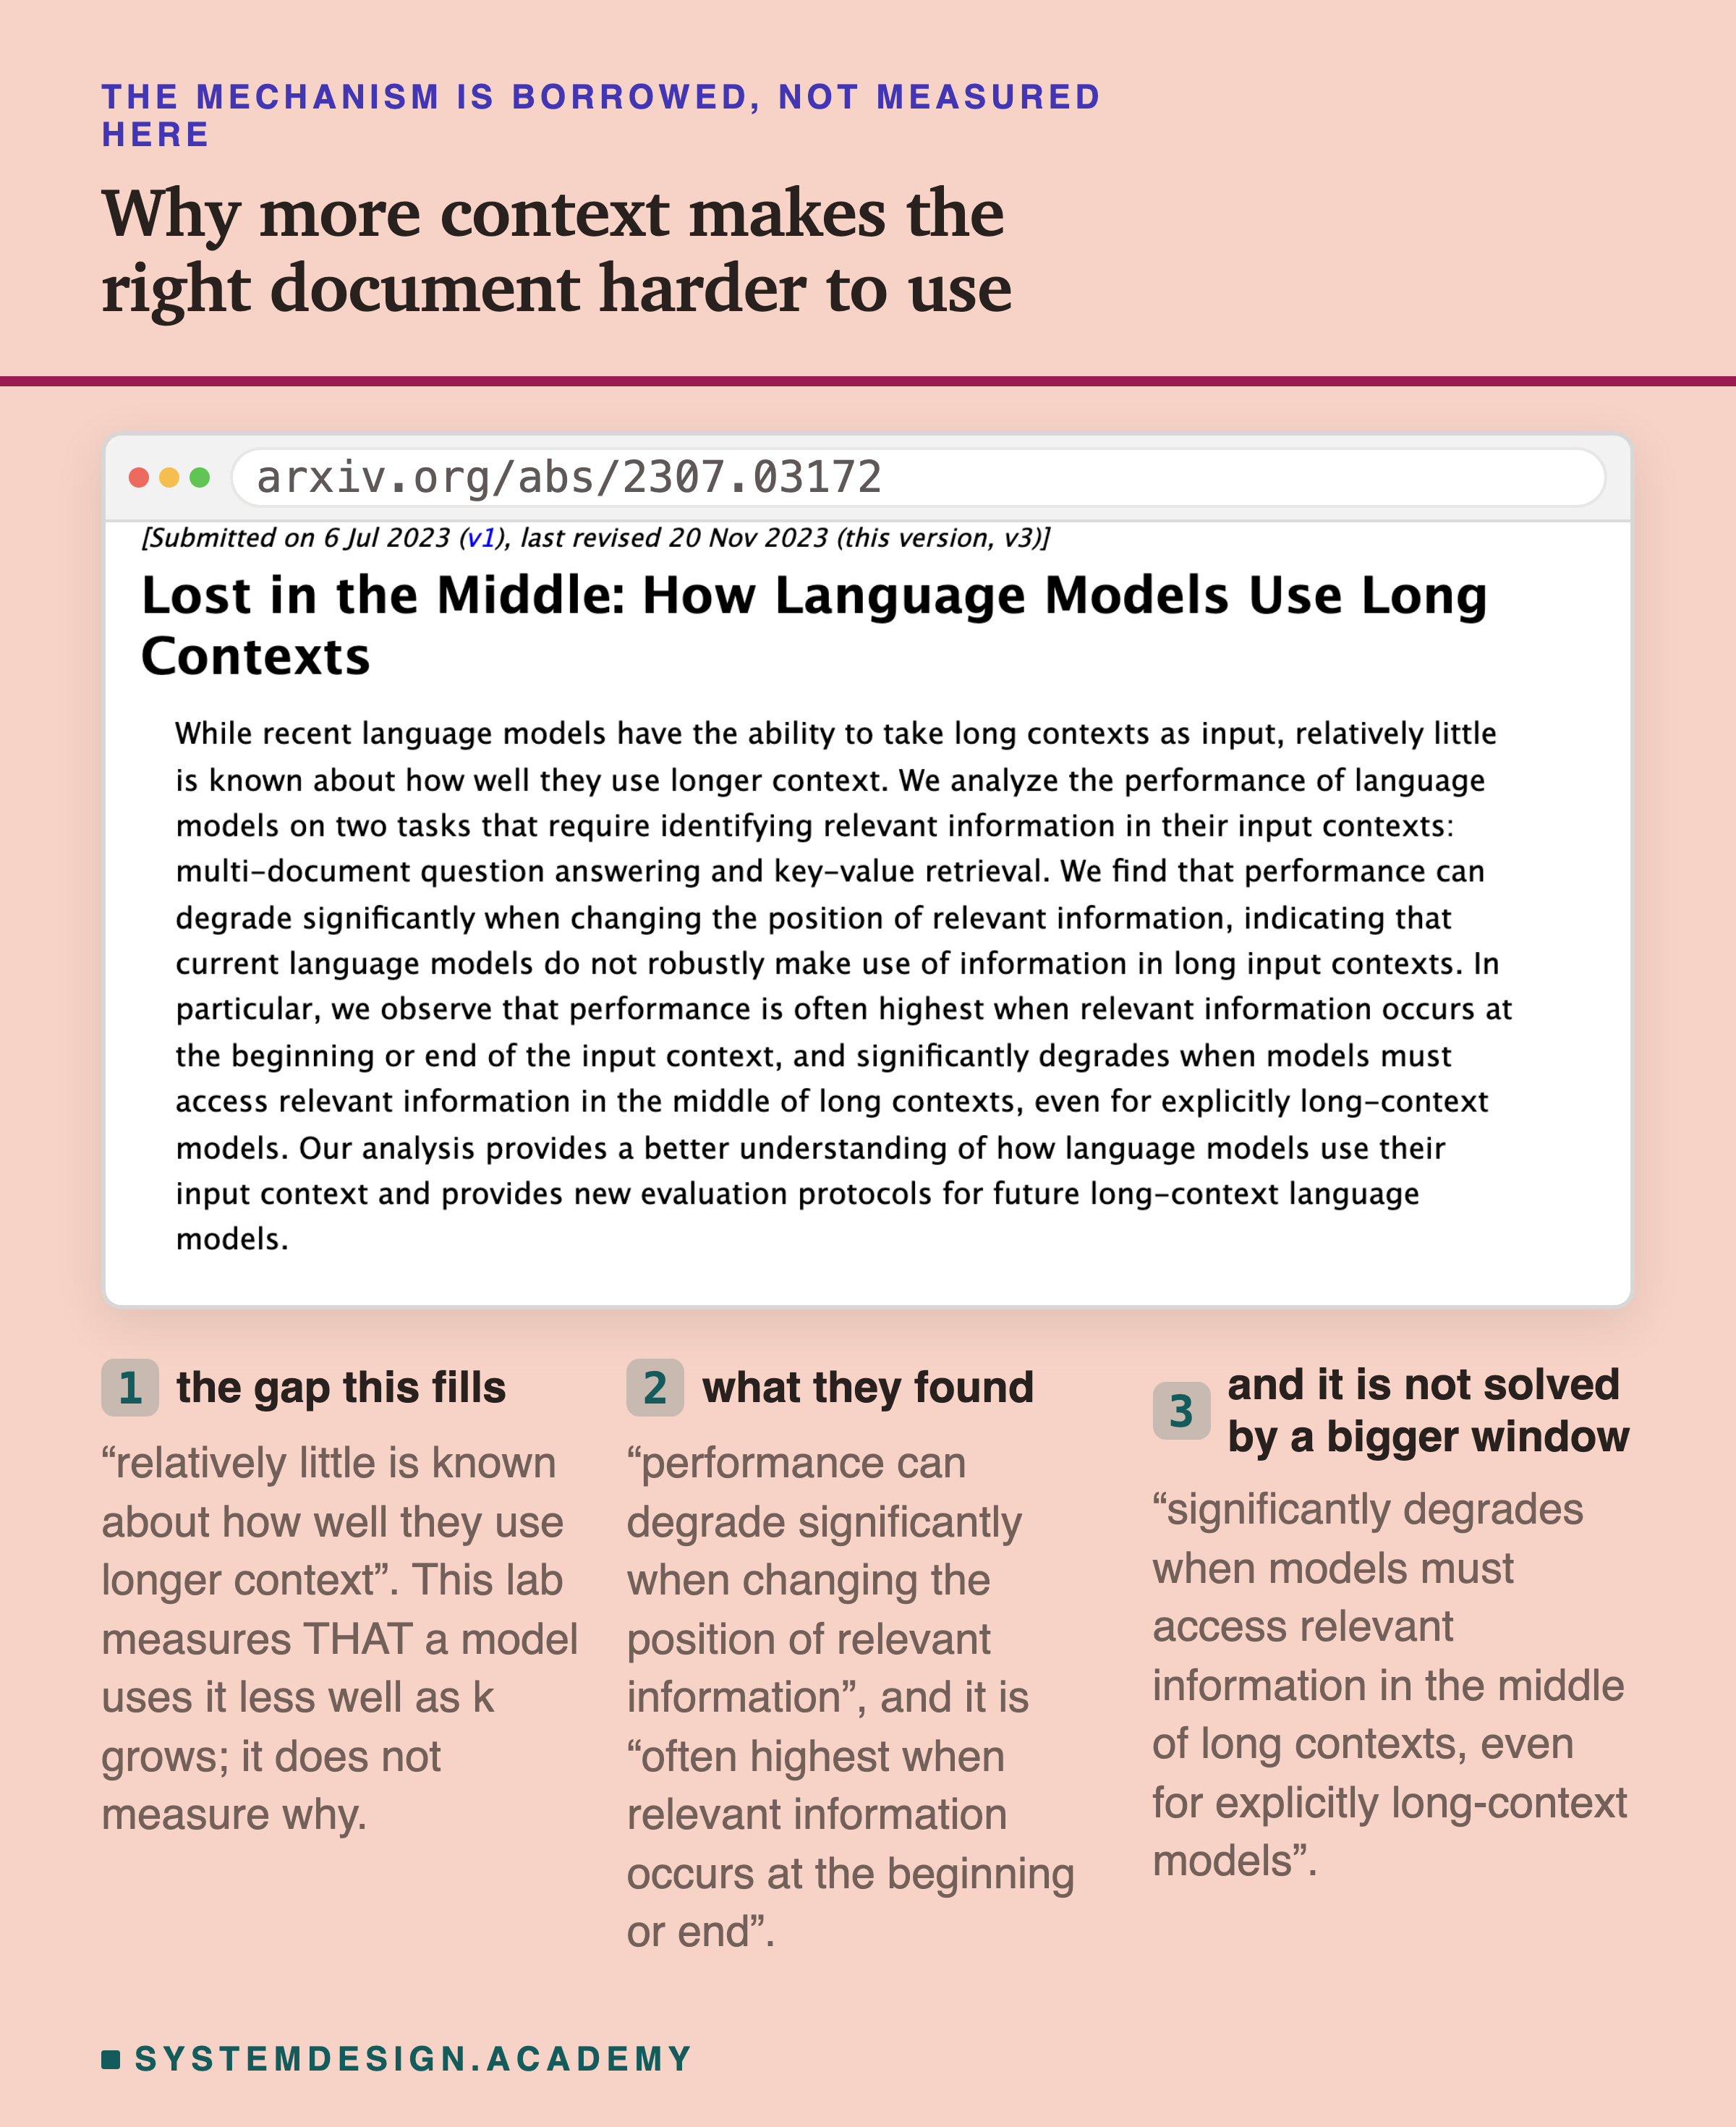
The published work is about position: a model uses information at the start and the end of its context more reliably than information in the middle. Raising k pushes documents into the middle, and it puts more of them there.
That is the borrowed explanation and it fits. What is measured here is narrower and more useful: on this corpus, with this model, the trade turned negative somewhere between k of 5 and k of 10.
Two Failures, One Number
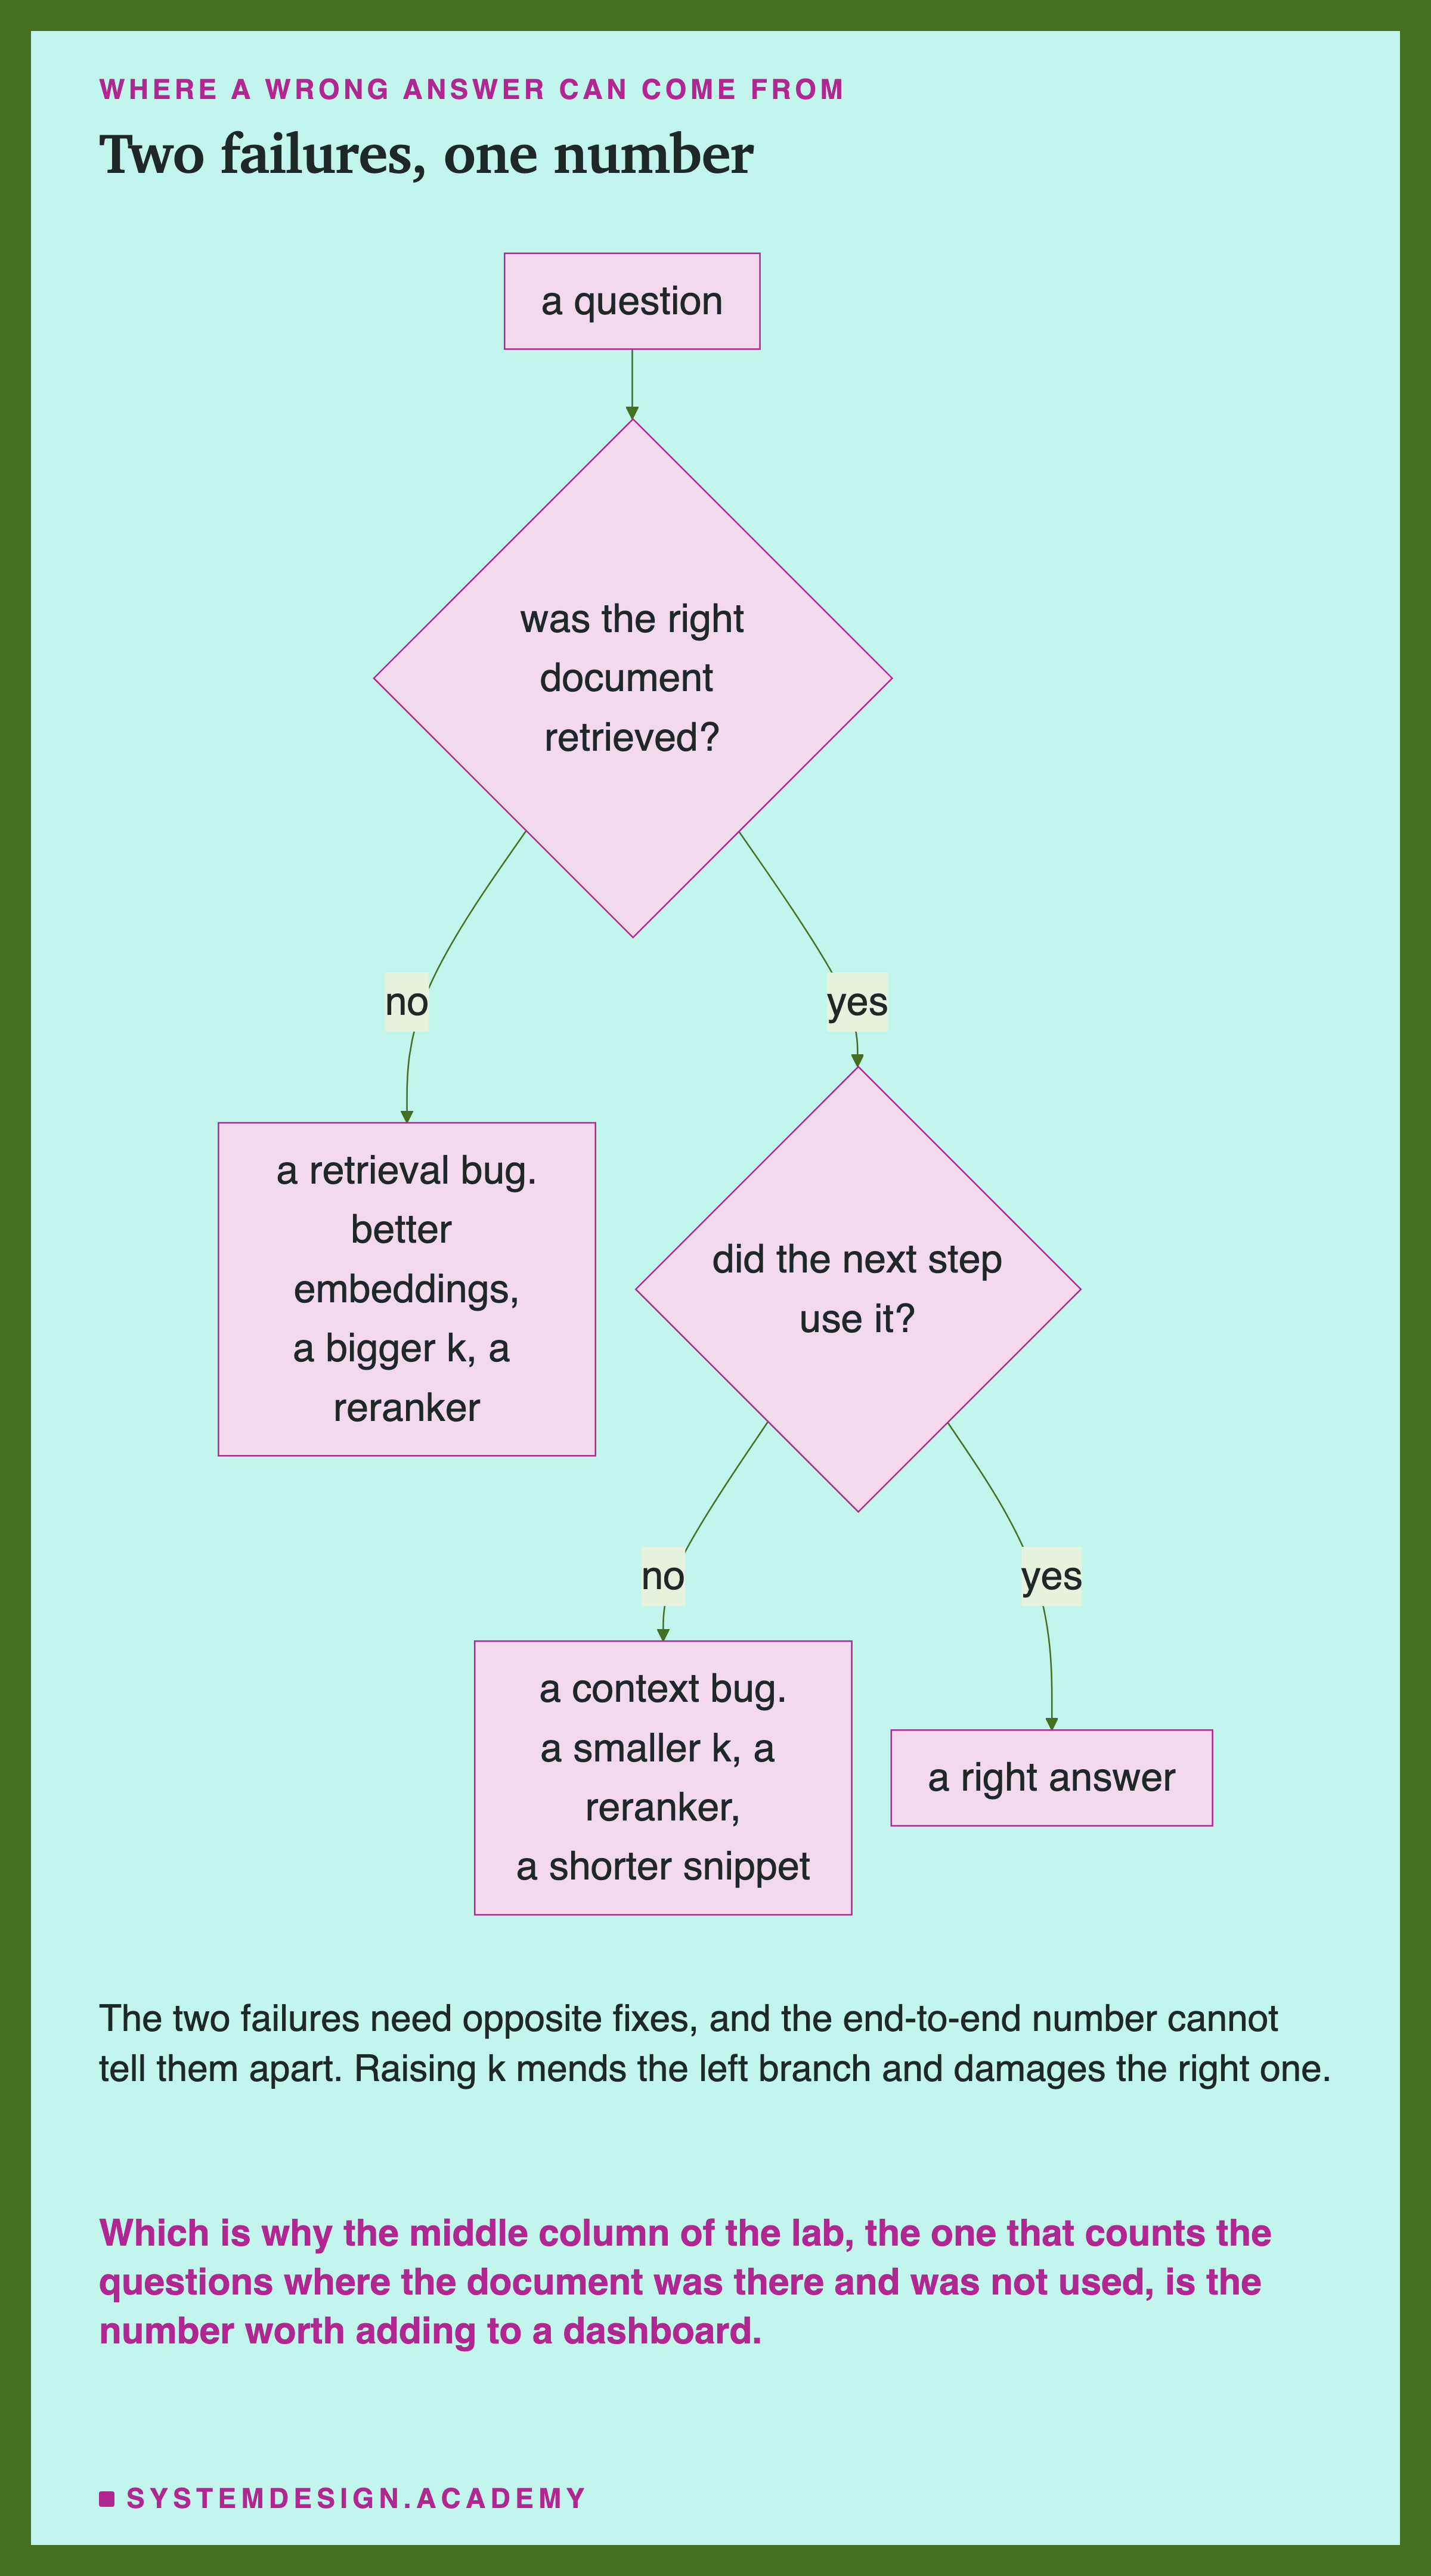
A wrong answer has two causes and they need opposite fixes. Raising k mends one and damages the other, which is exactly why a single end-to-end number cannot tell you what to do next.
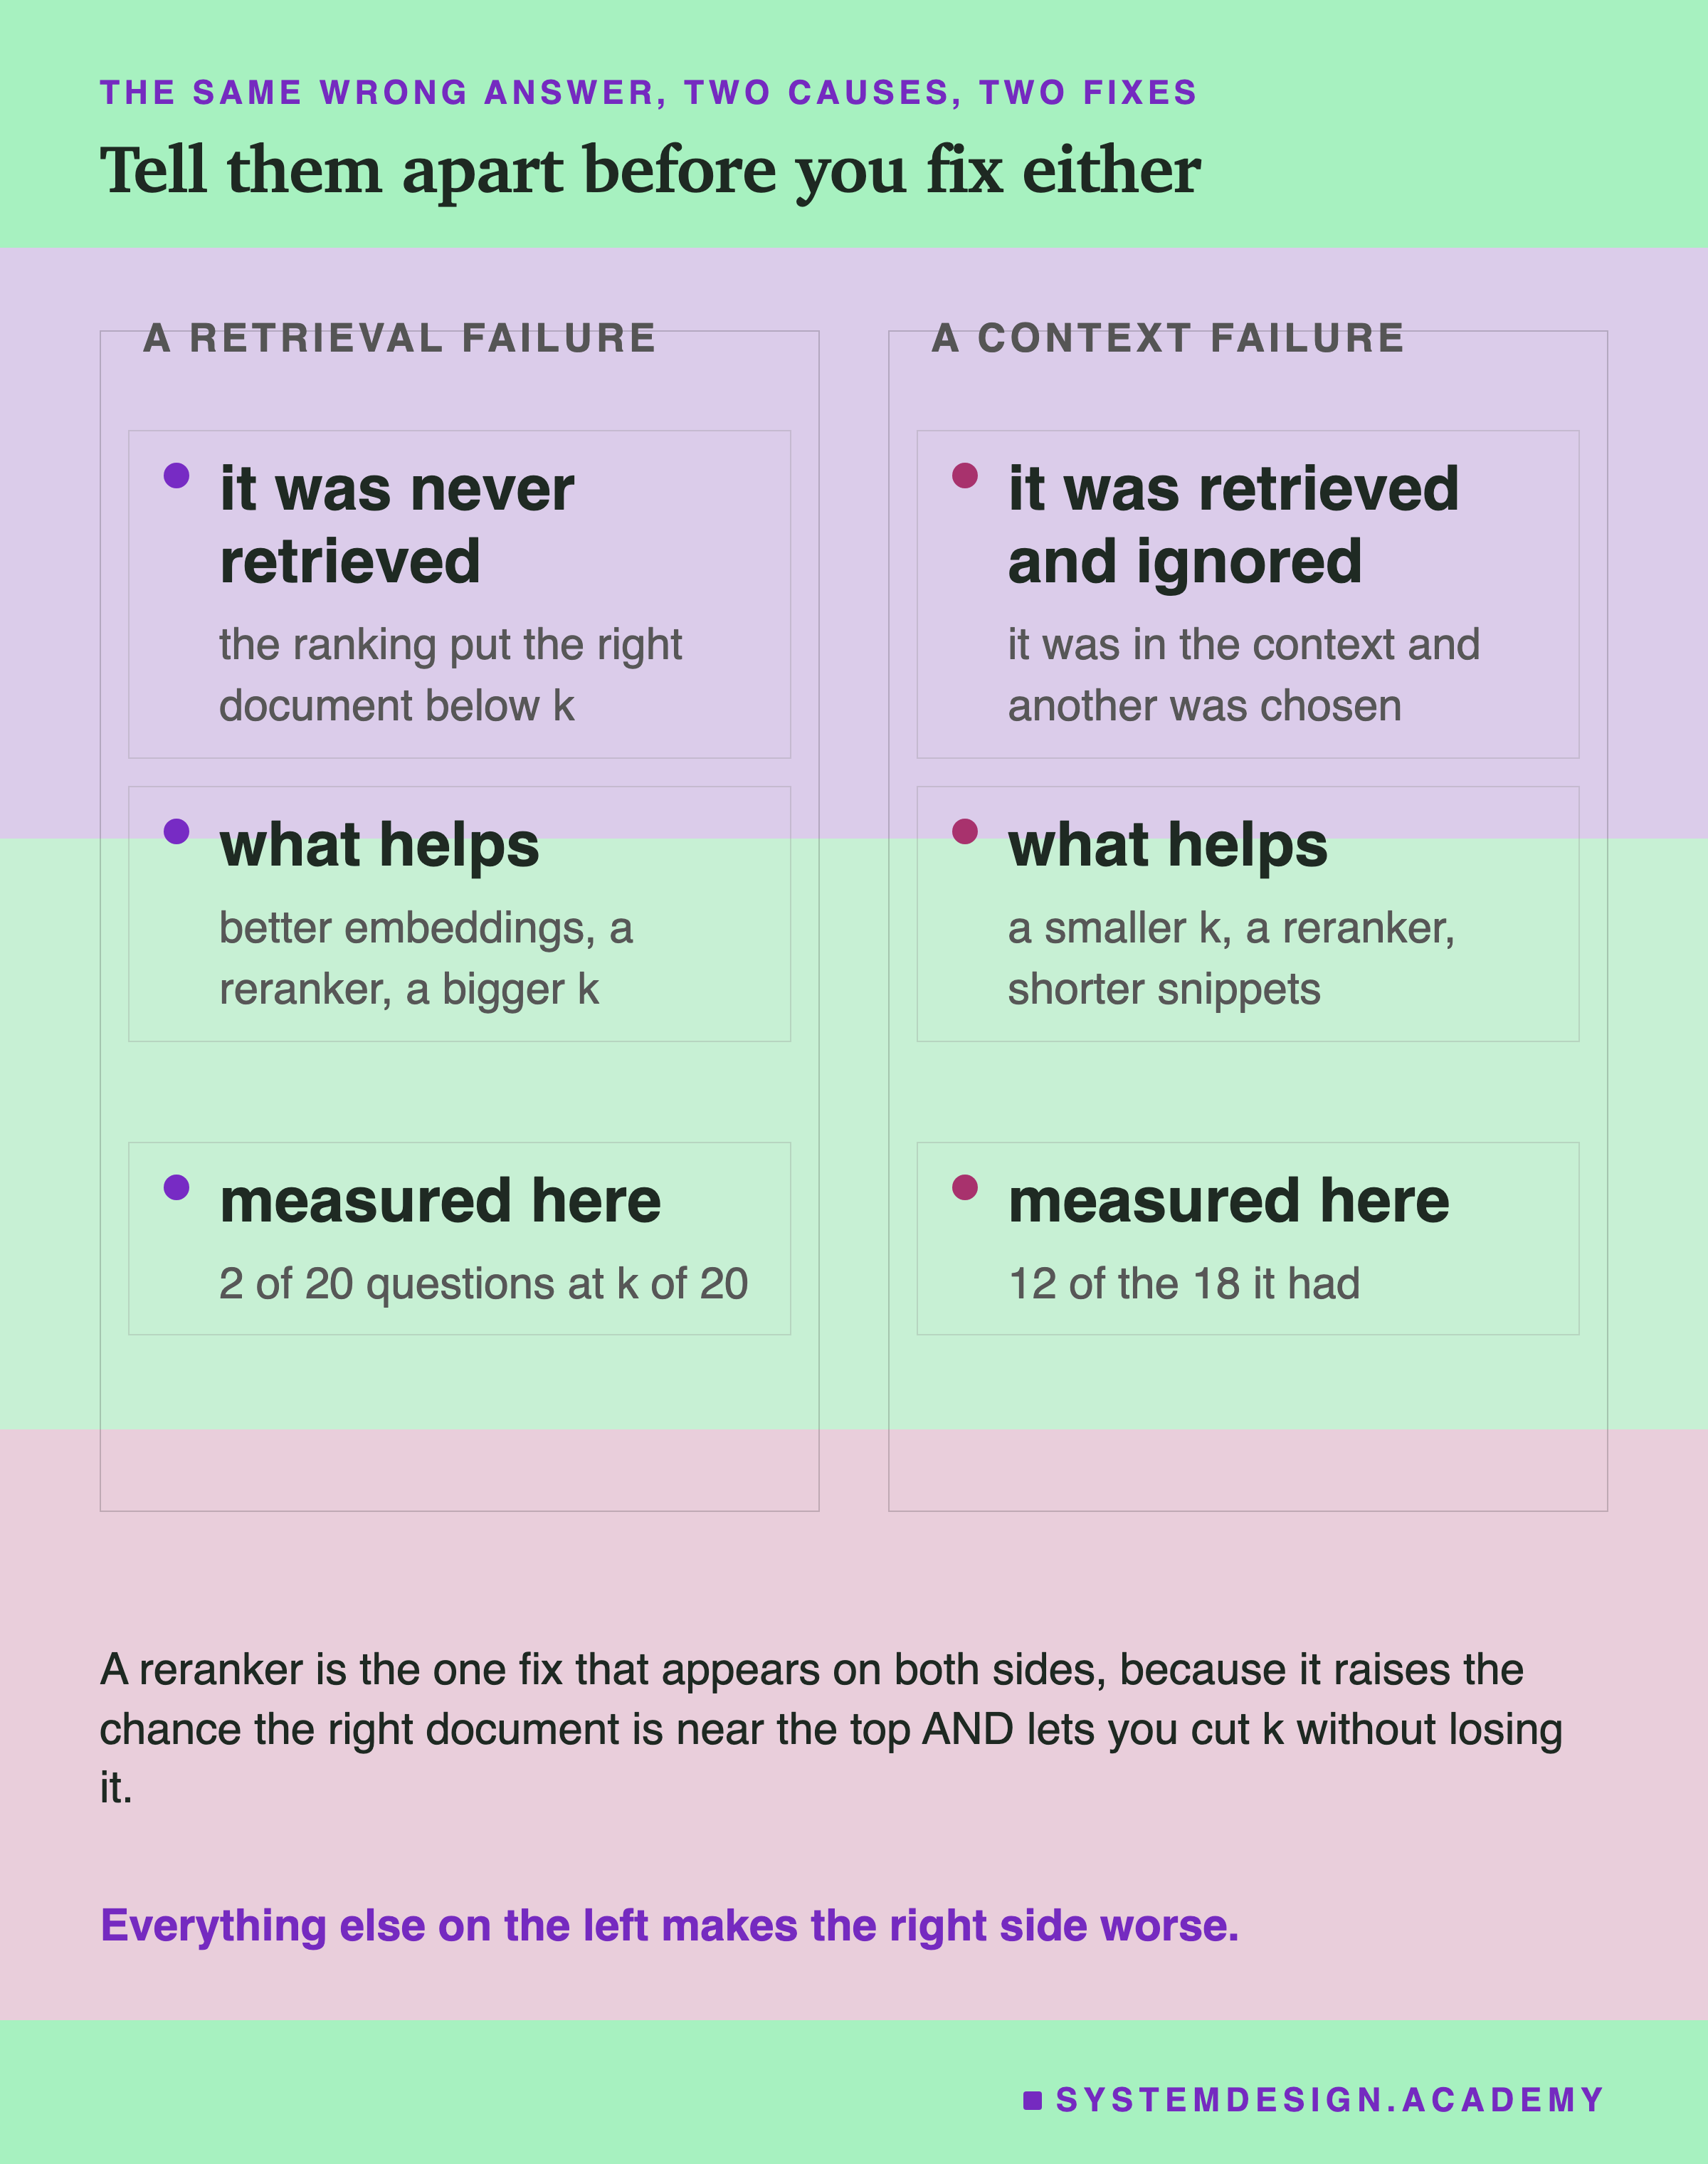
At k of 20 this system failed 14 of 20 questions. Two of those were retrieval failures and twelve were the other kind, and a retrieval report would have shown only the two.
Nobody in This Chain Made a Mistake
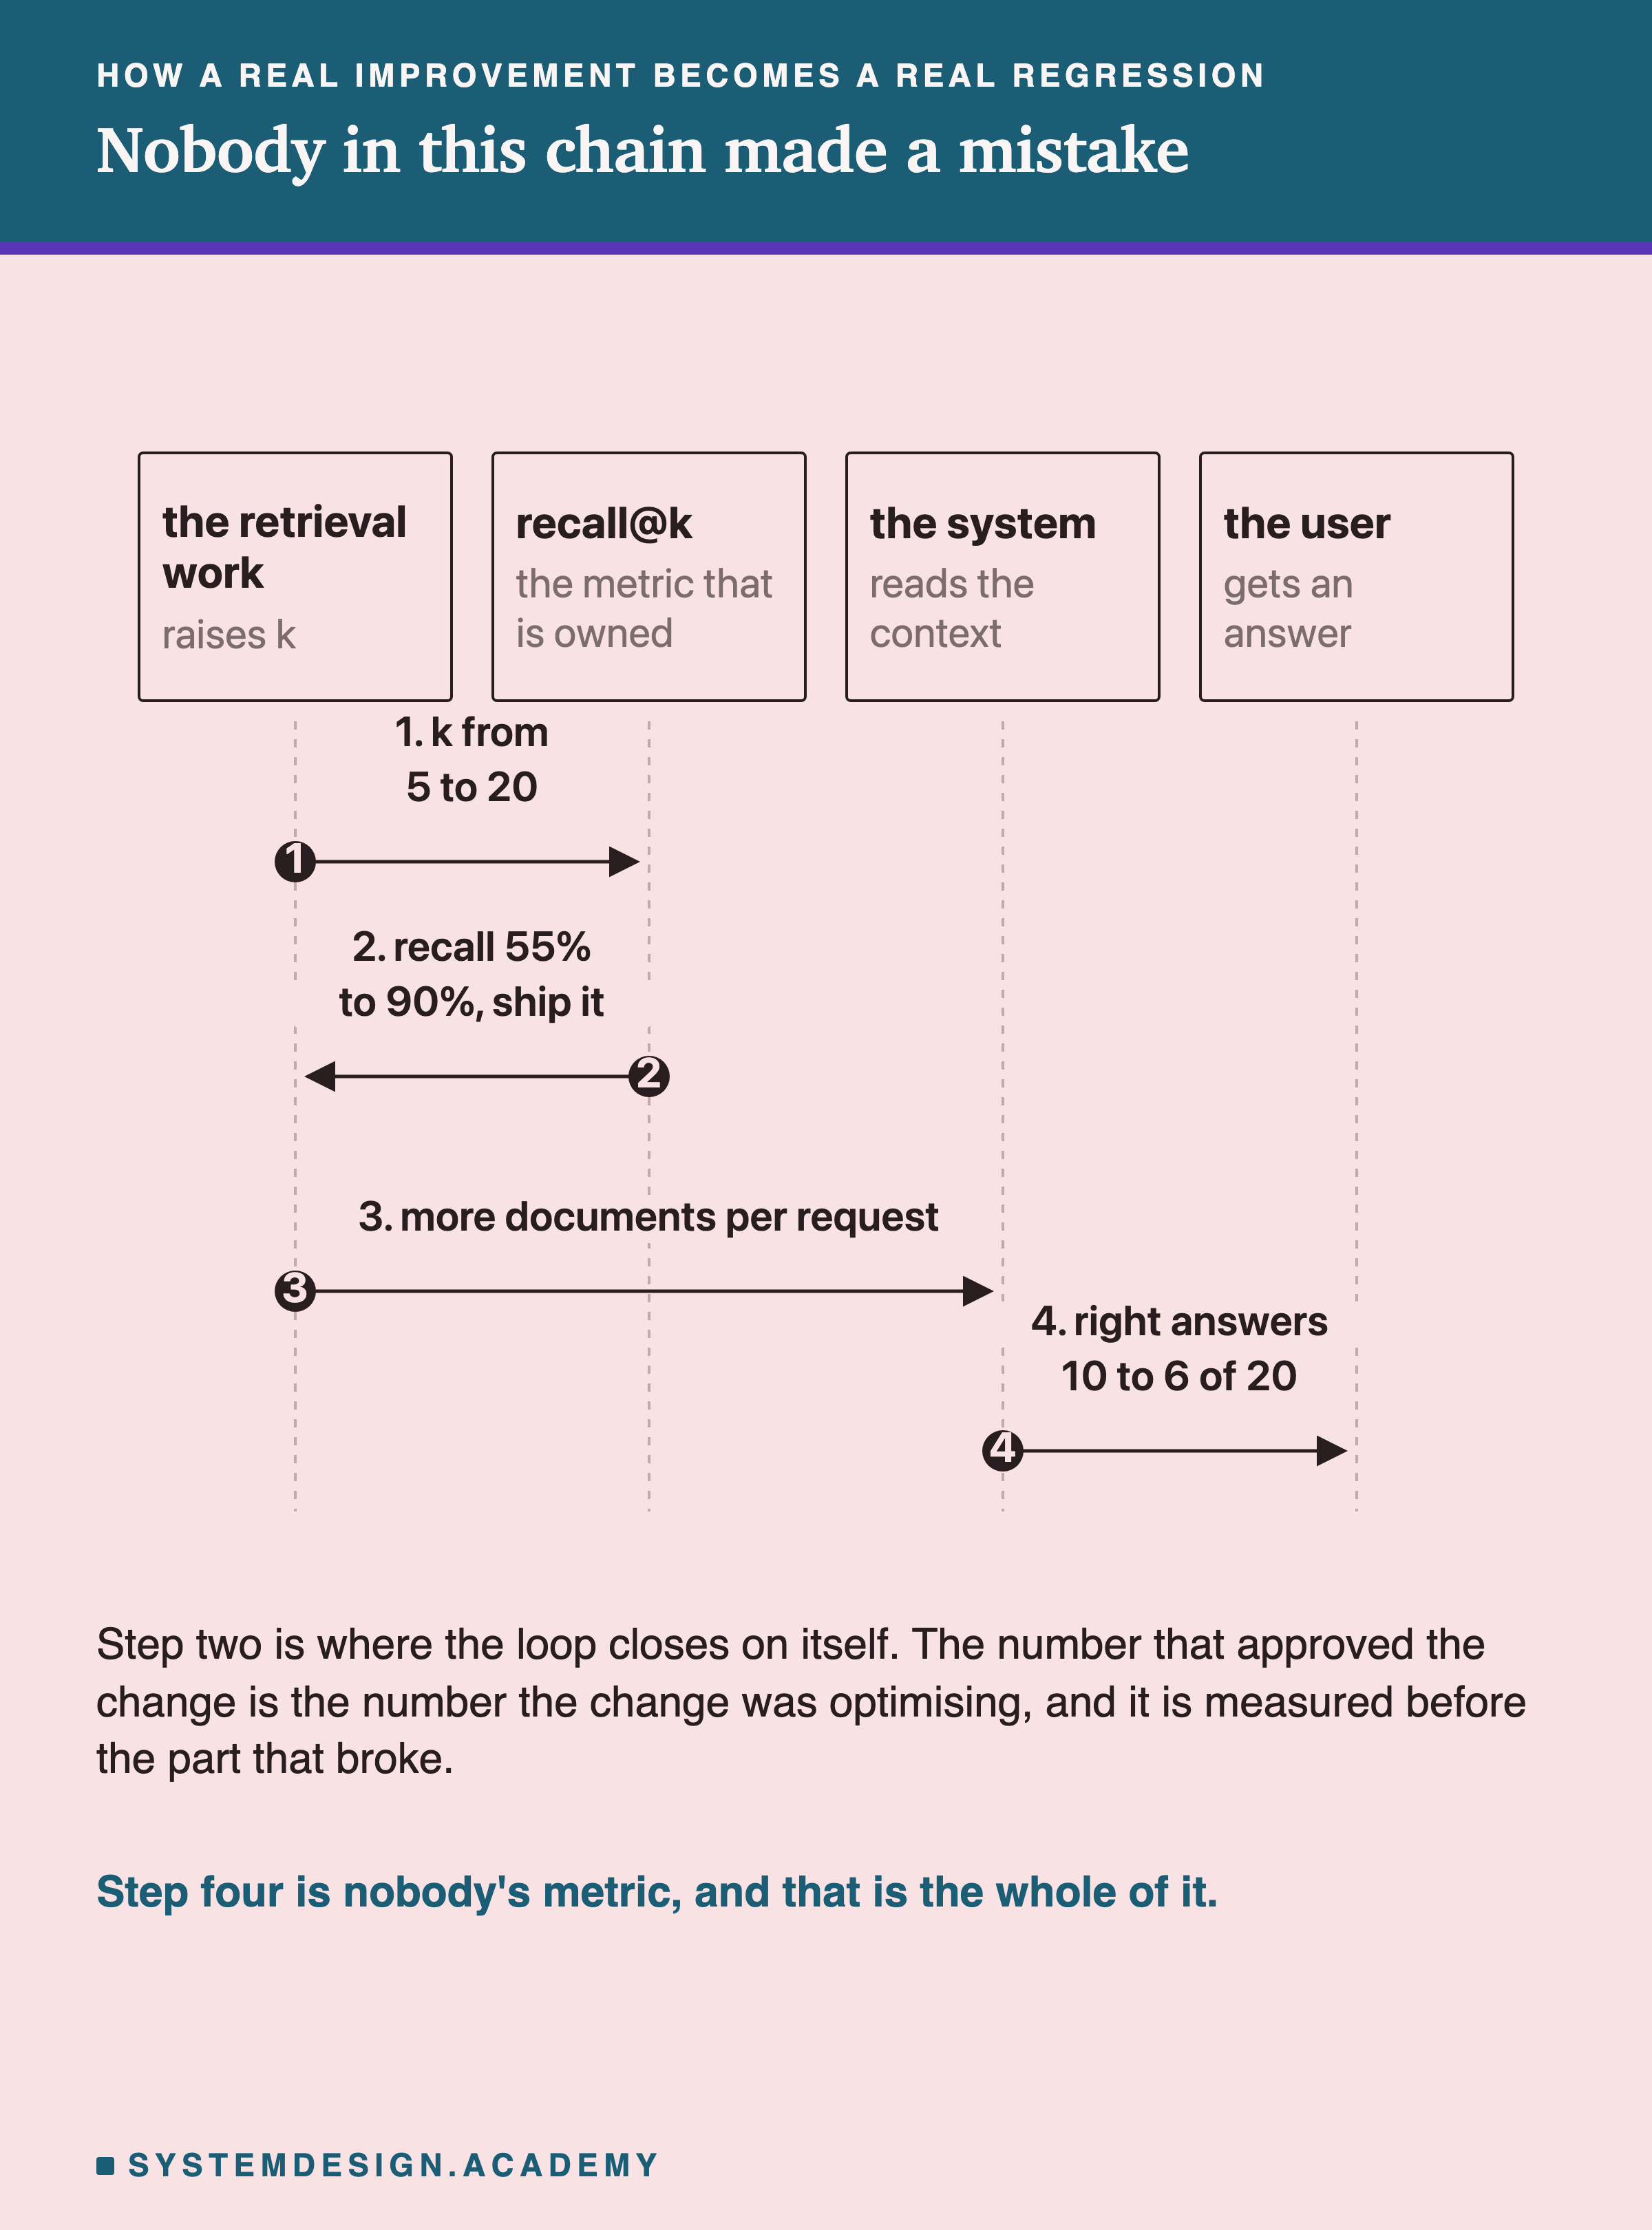
The number that approved the change is the number the change was optimising, and it is measured at a boundary before the part that broke.
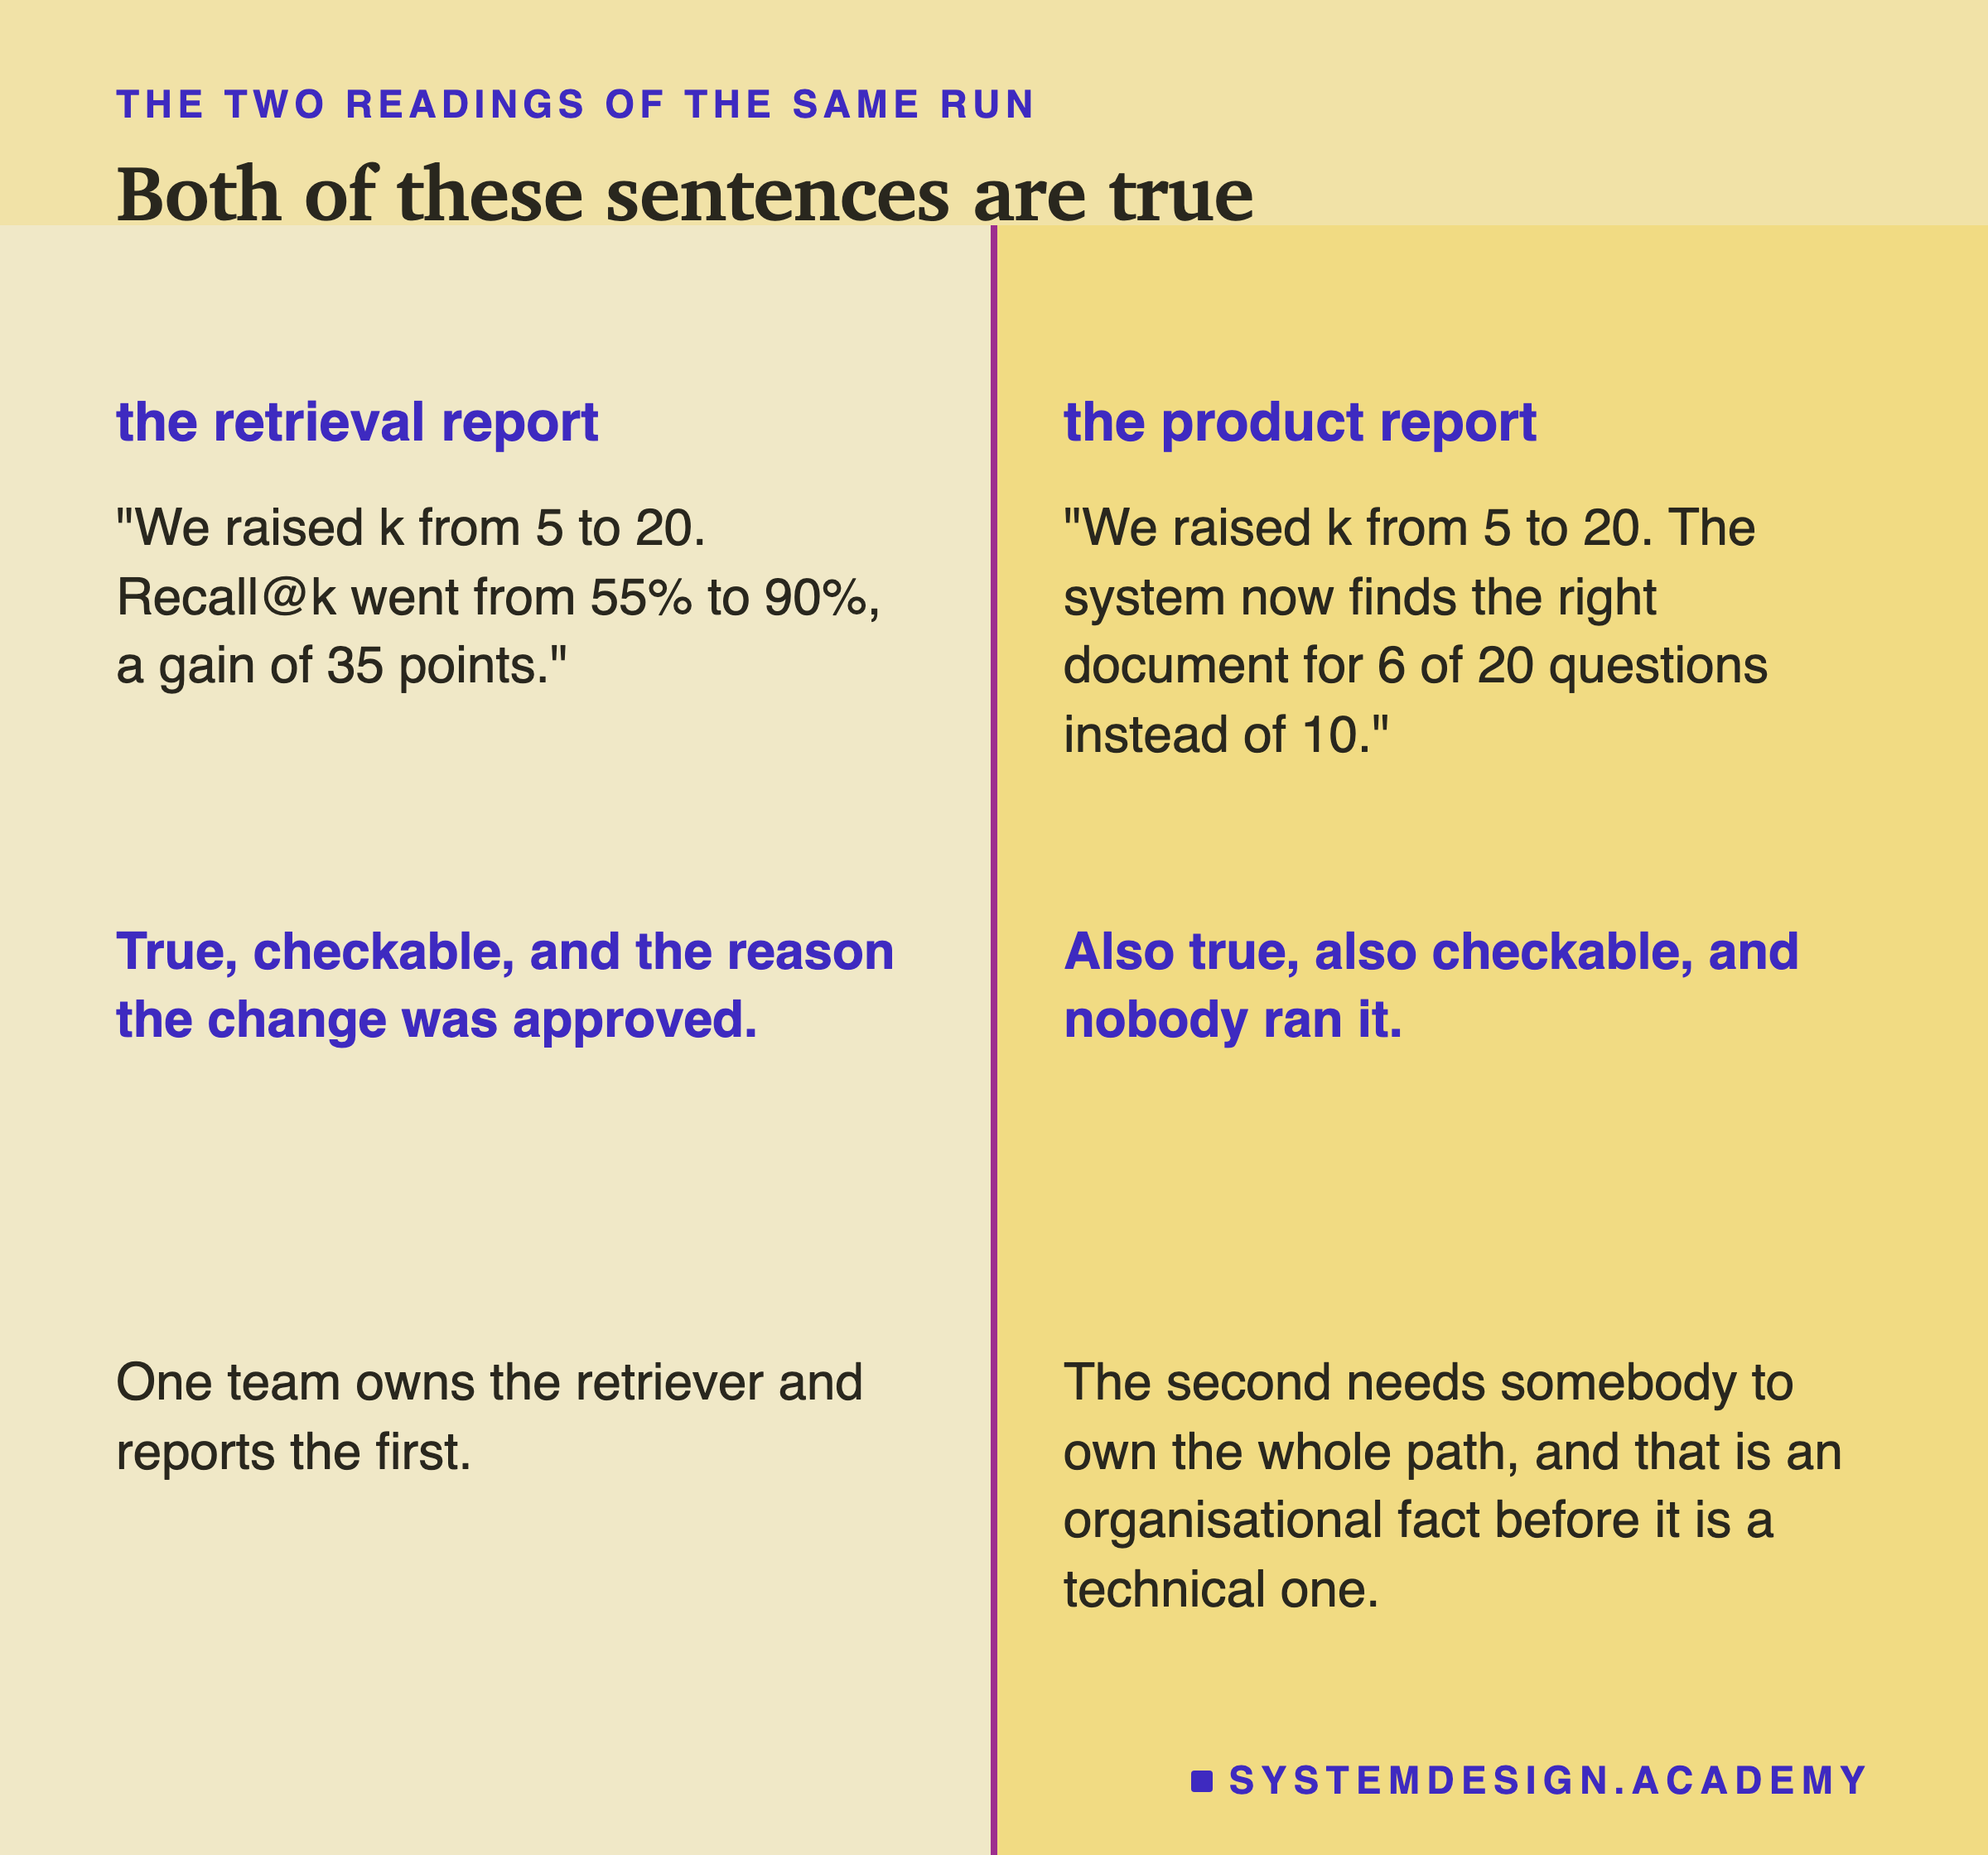
Both sentences are true and checkable. Which one gets written depends on who owns which boundary, which makes this an organisational problem before it is a technical one.
What Twenty Questions Can and Cannot Say
The lab prints a 95% interval on every rate and they overlap almost everywhere. At 20 questions, recall@5 of 11 of 20 has an interval from 34% to 74%, which is most of the scale.
So no single height on either curve is established by this run. Two things are.
The first is the shape. One curve cannot go down, by construction rather than by luck, and the other did. That comparison does not depend on either height being precise.
The second is the paired test. Six of the eleven questions that had the document at both values of k went from right to wrong and none went the other way. On the discordant pairs, p = 0.0312. That is a within-question comparison and it does not spend its power on the between-question variance.
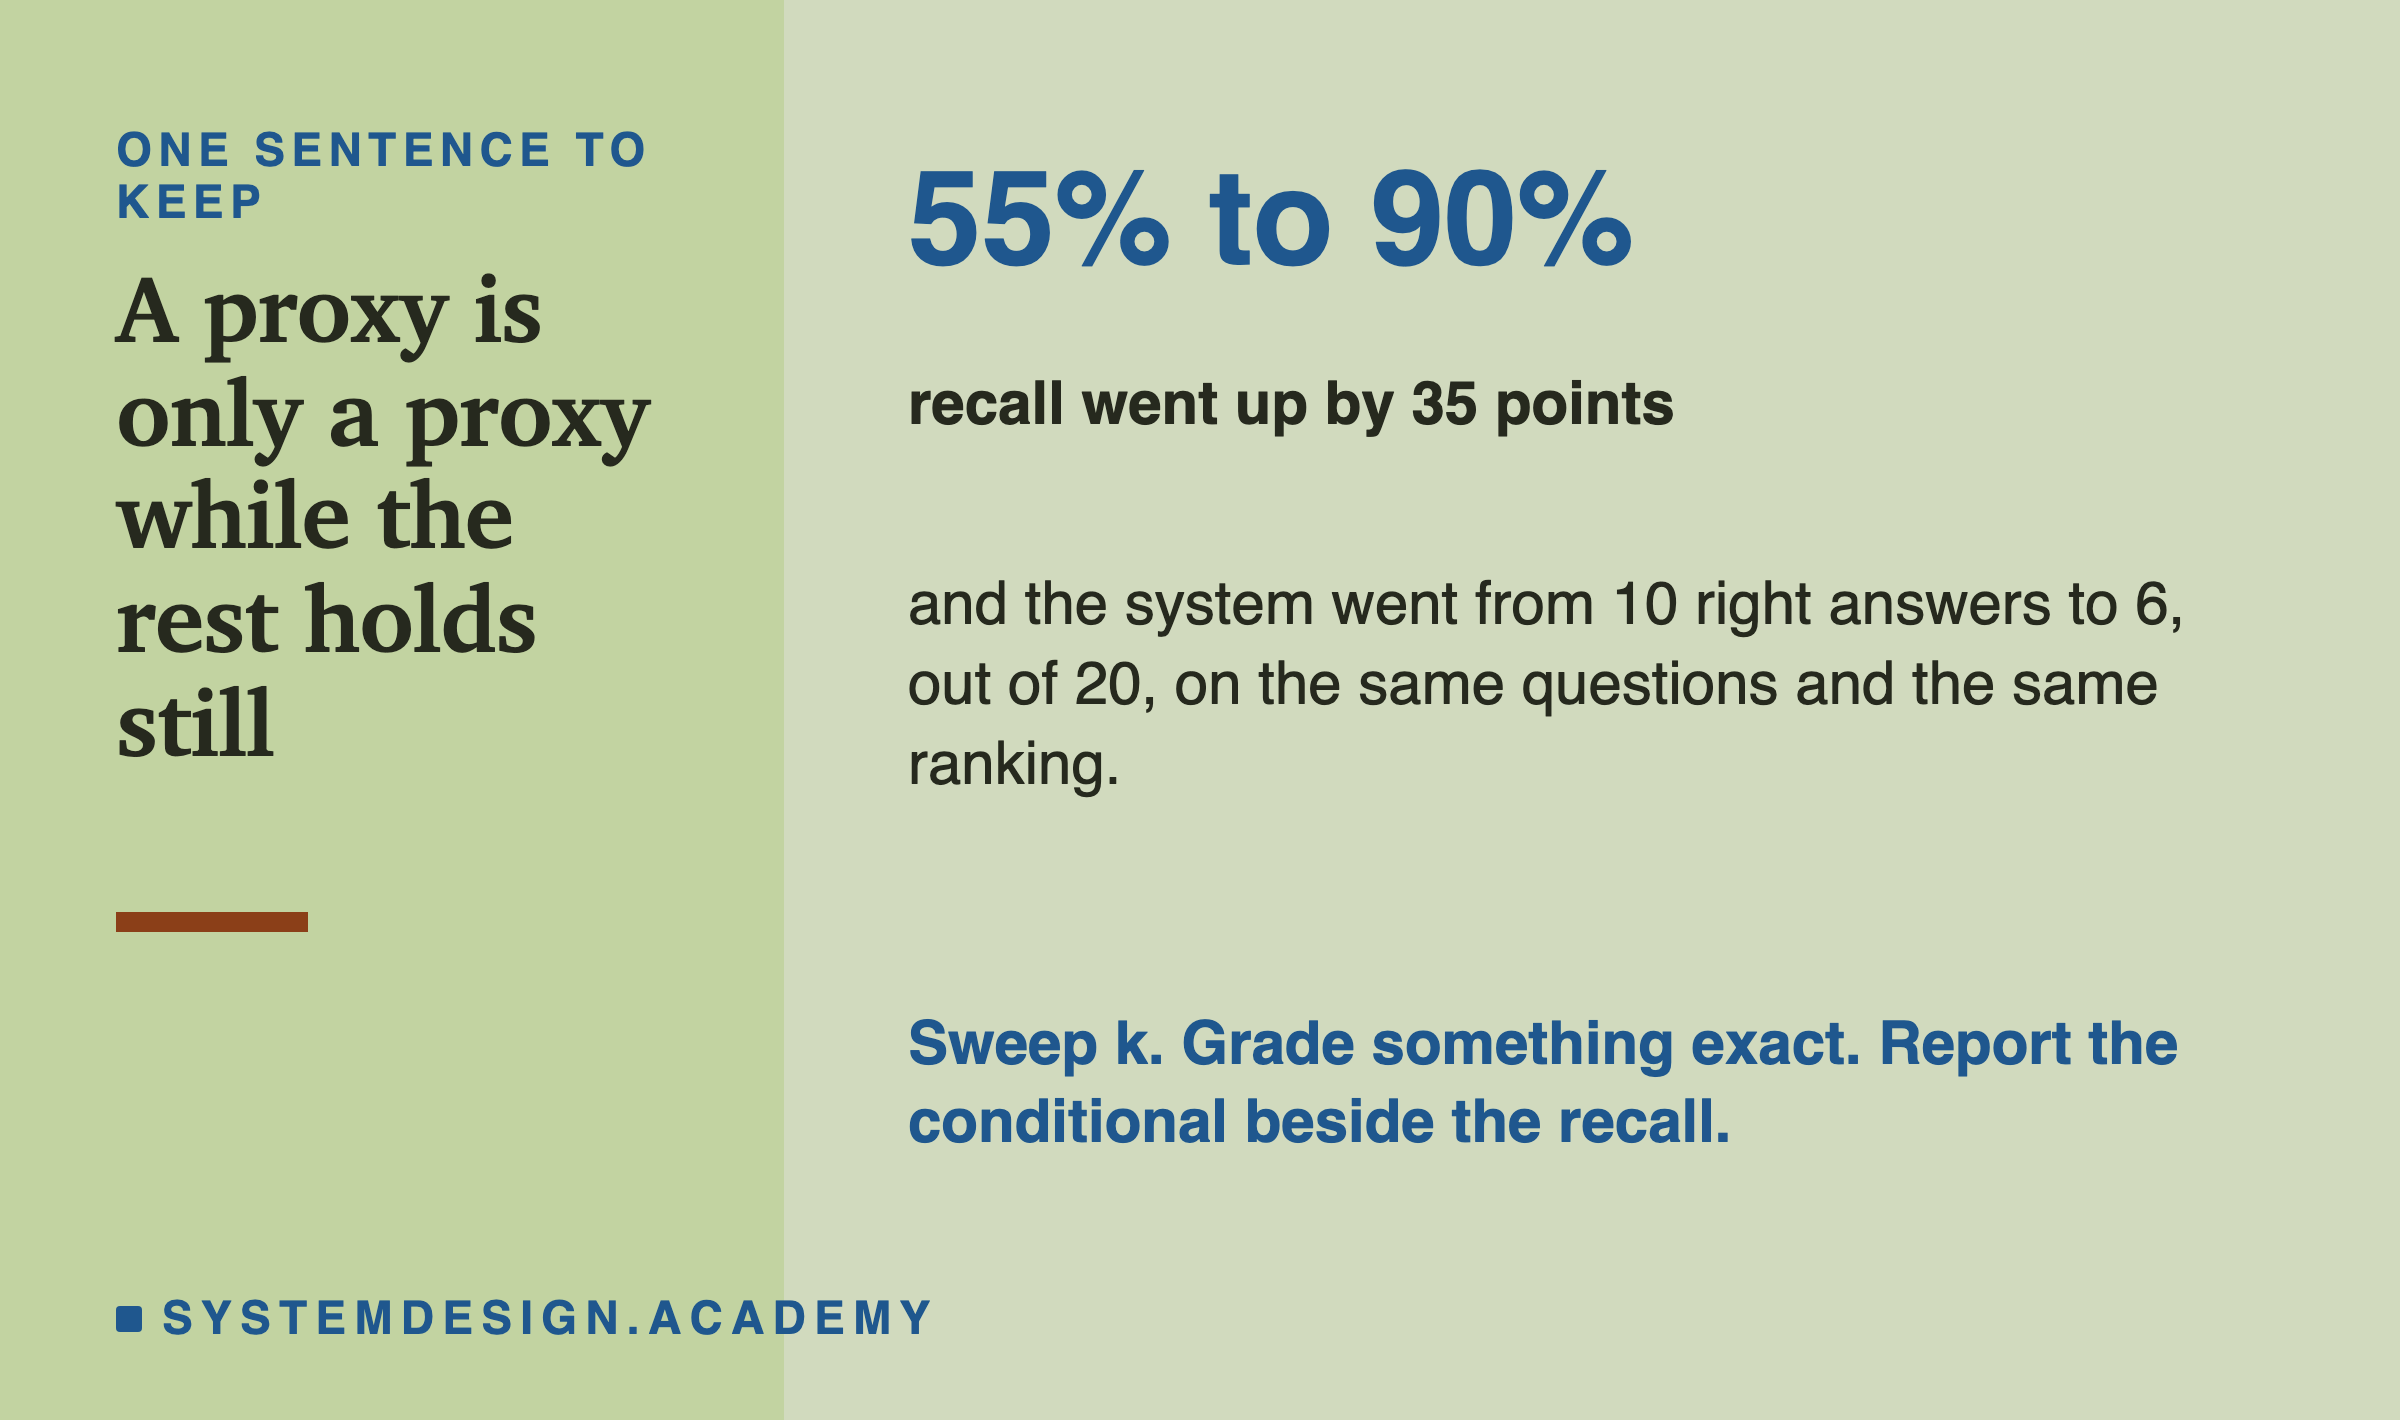
If you want the heights, you need the eval-power lesson's arithmetic and a much bigger set of questions. If you want to know whether raising k helped your system, the sweep above is enough and it costs an afternoon.
What To Do On Monday
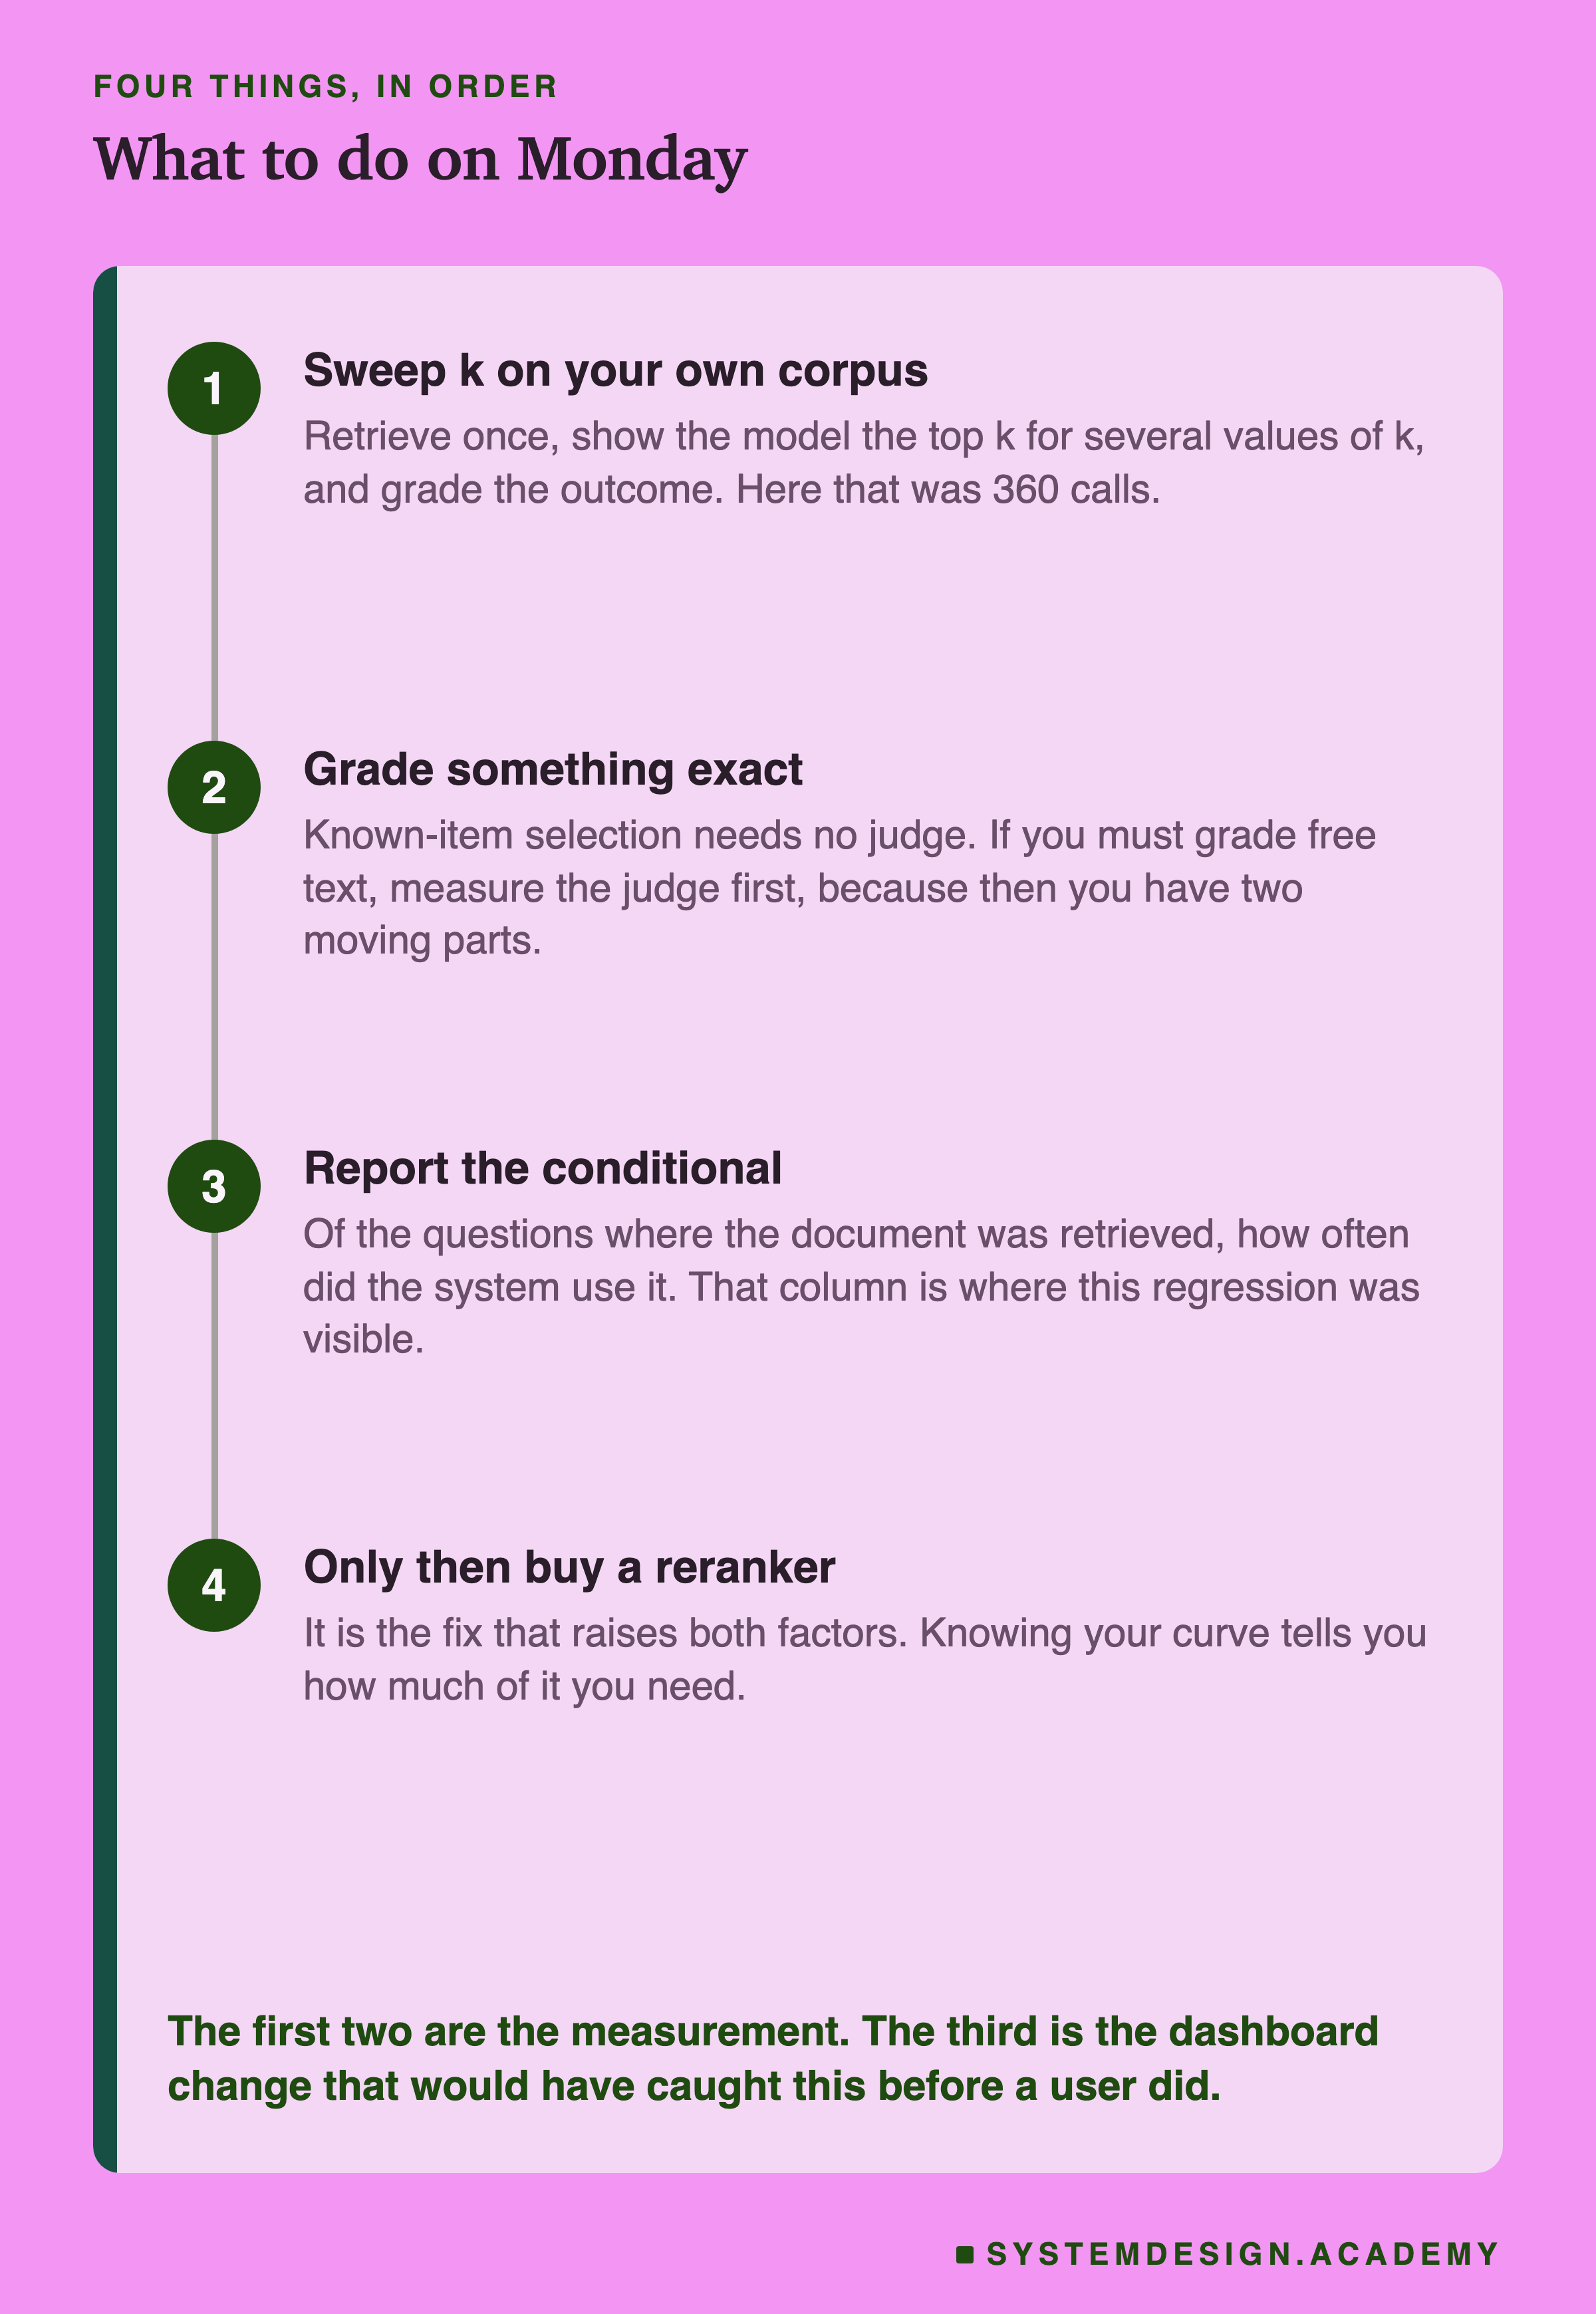
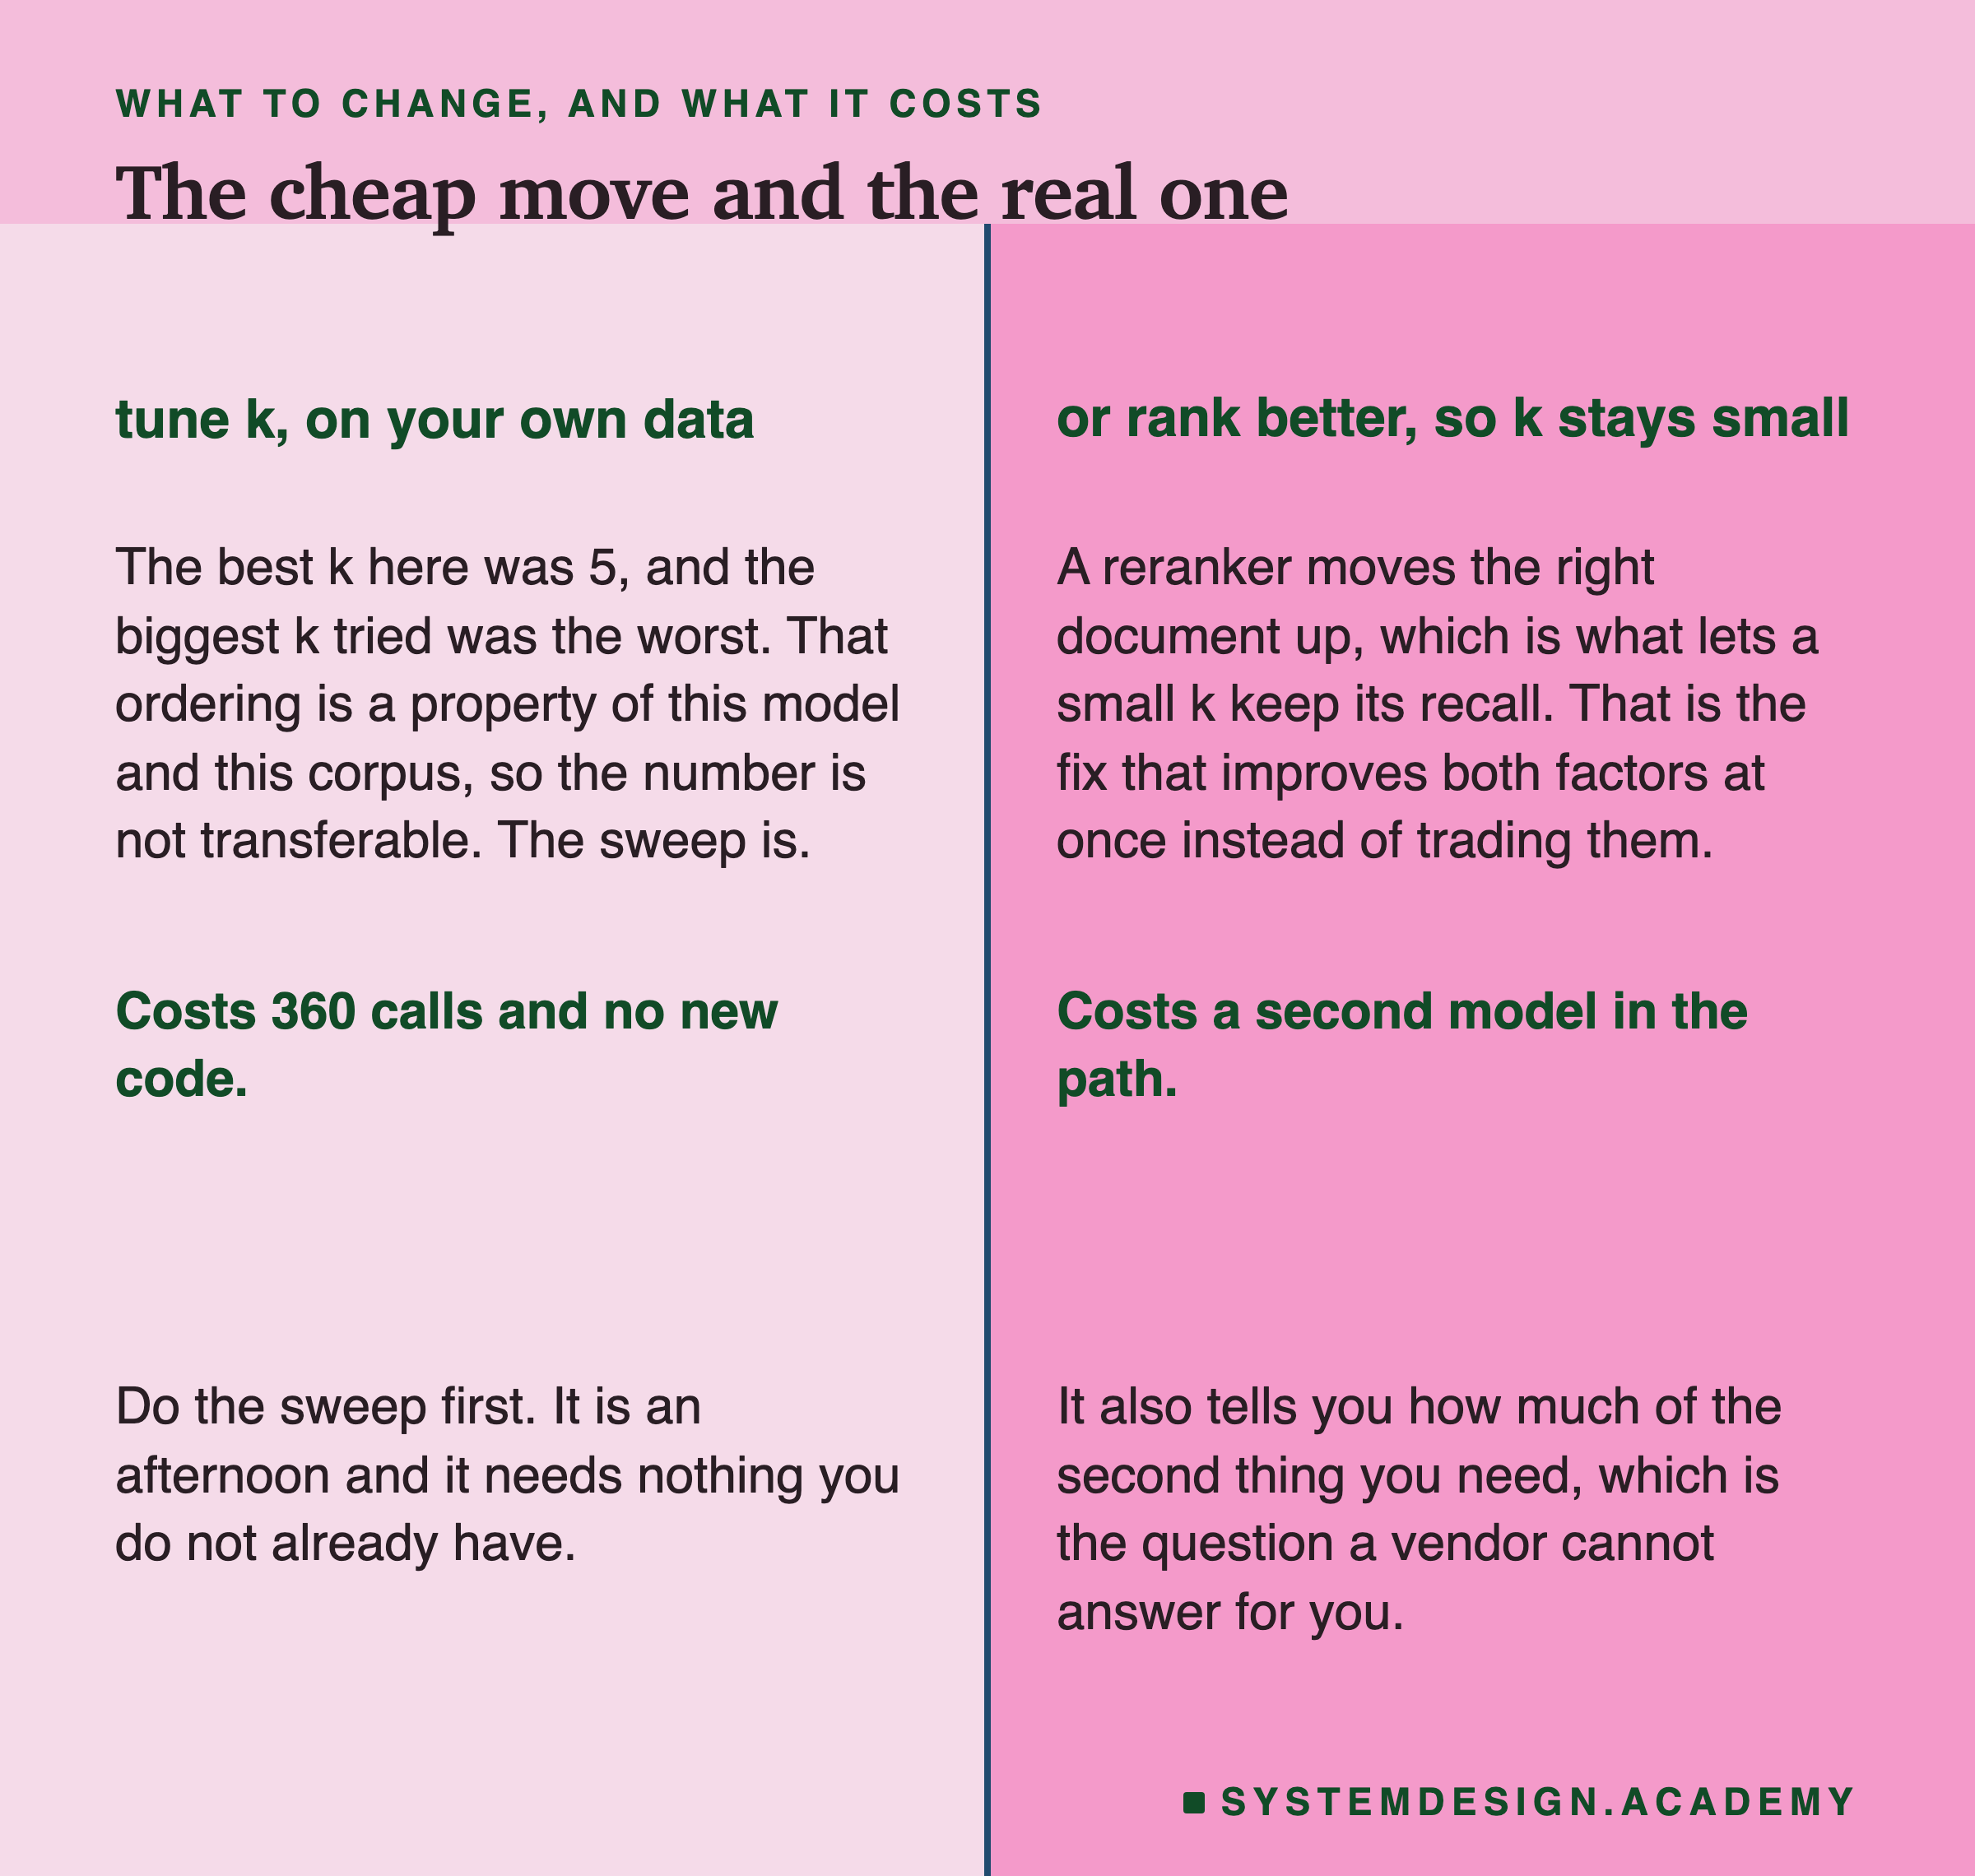
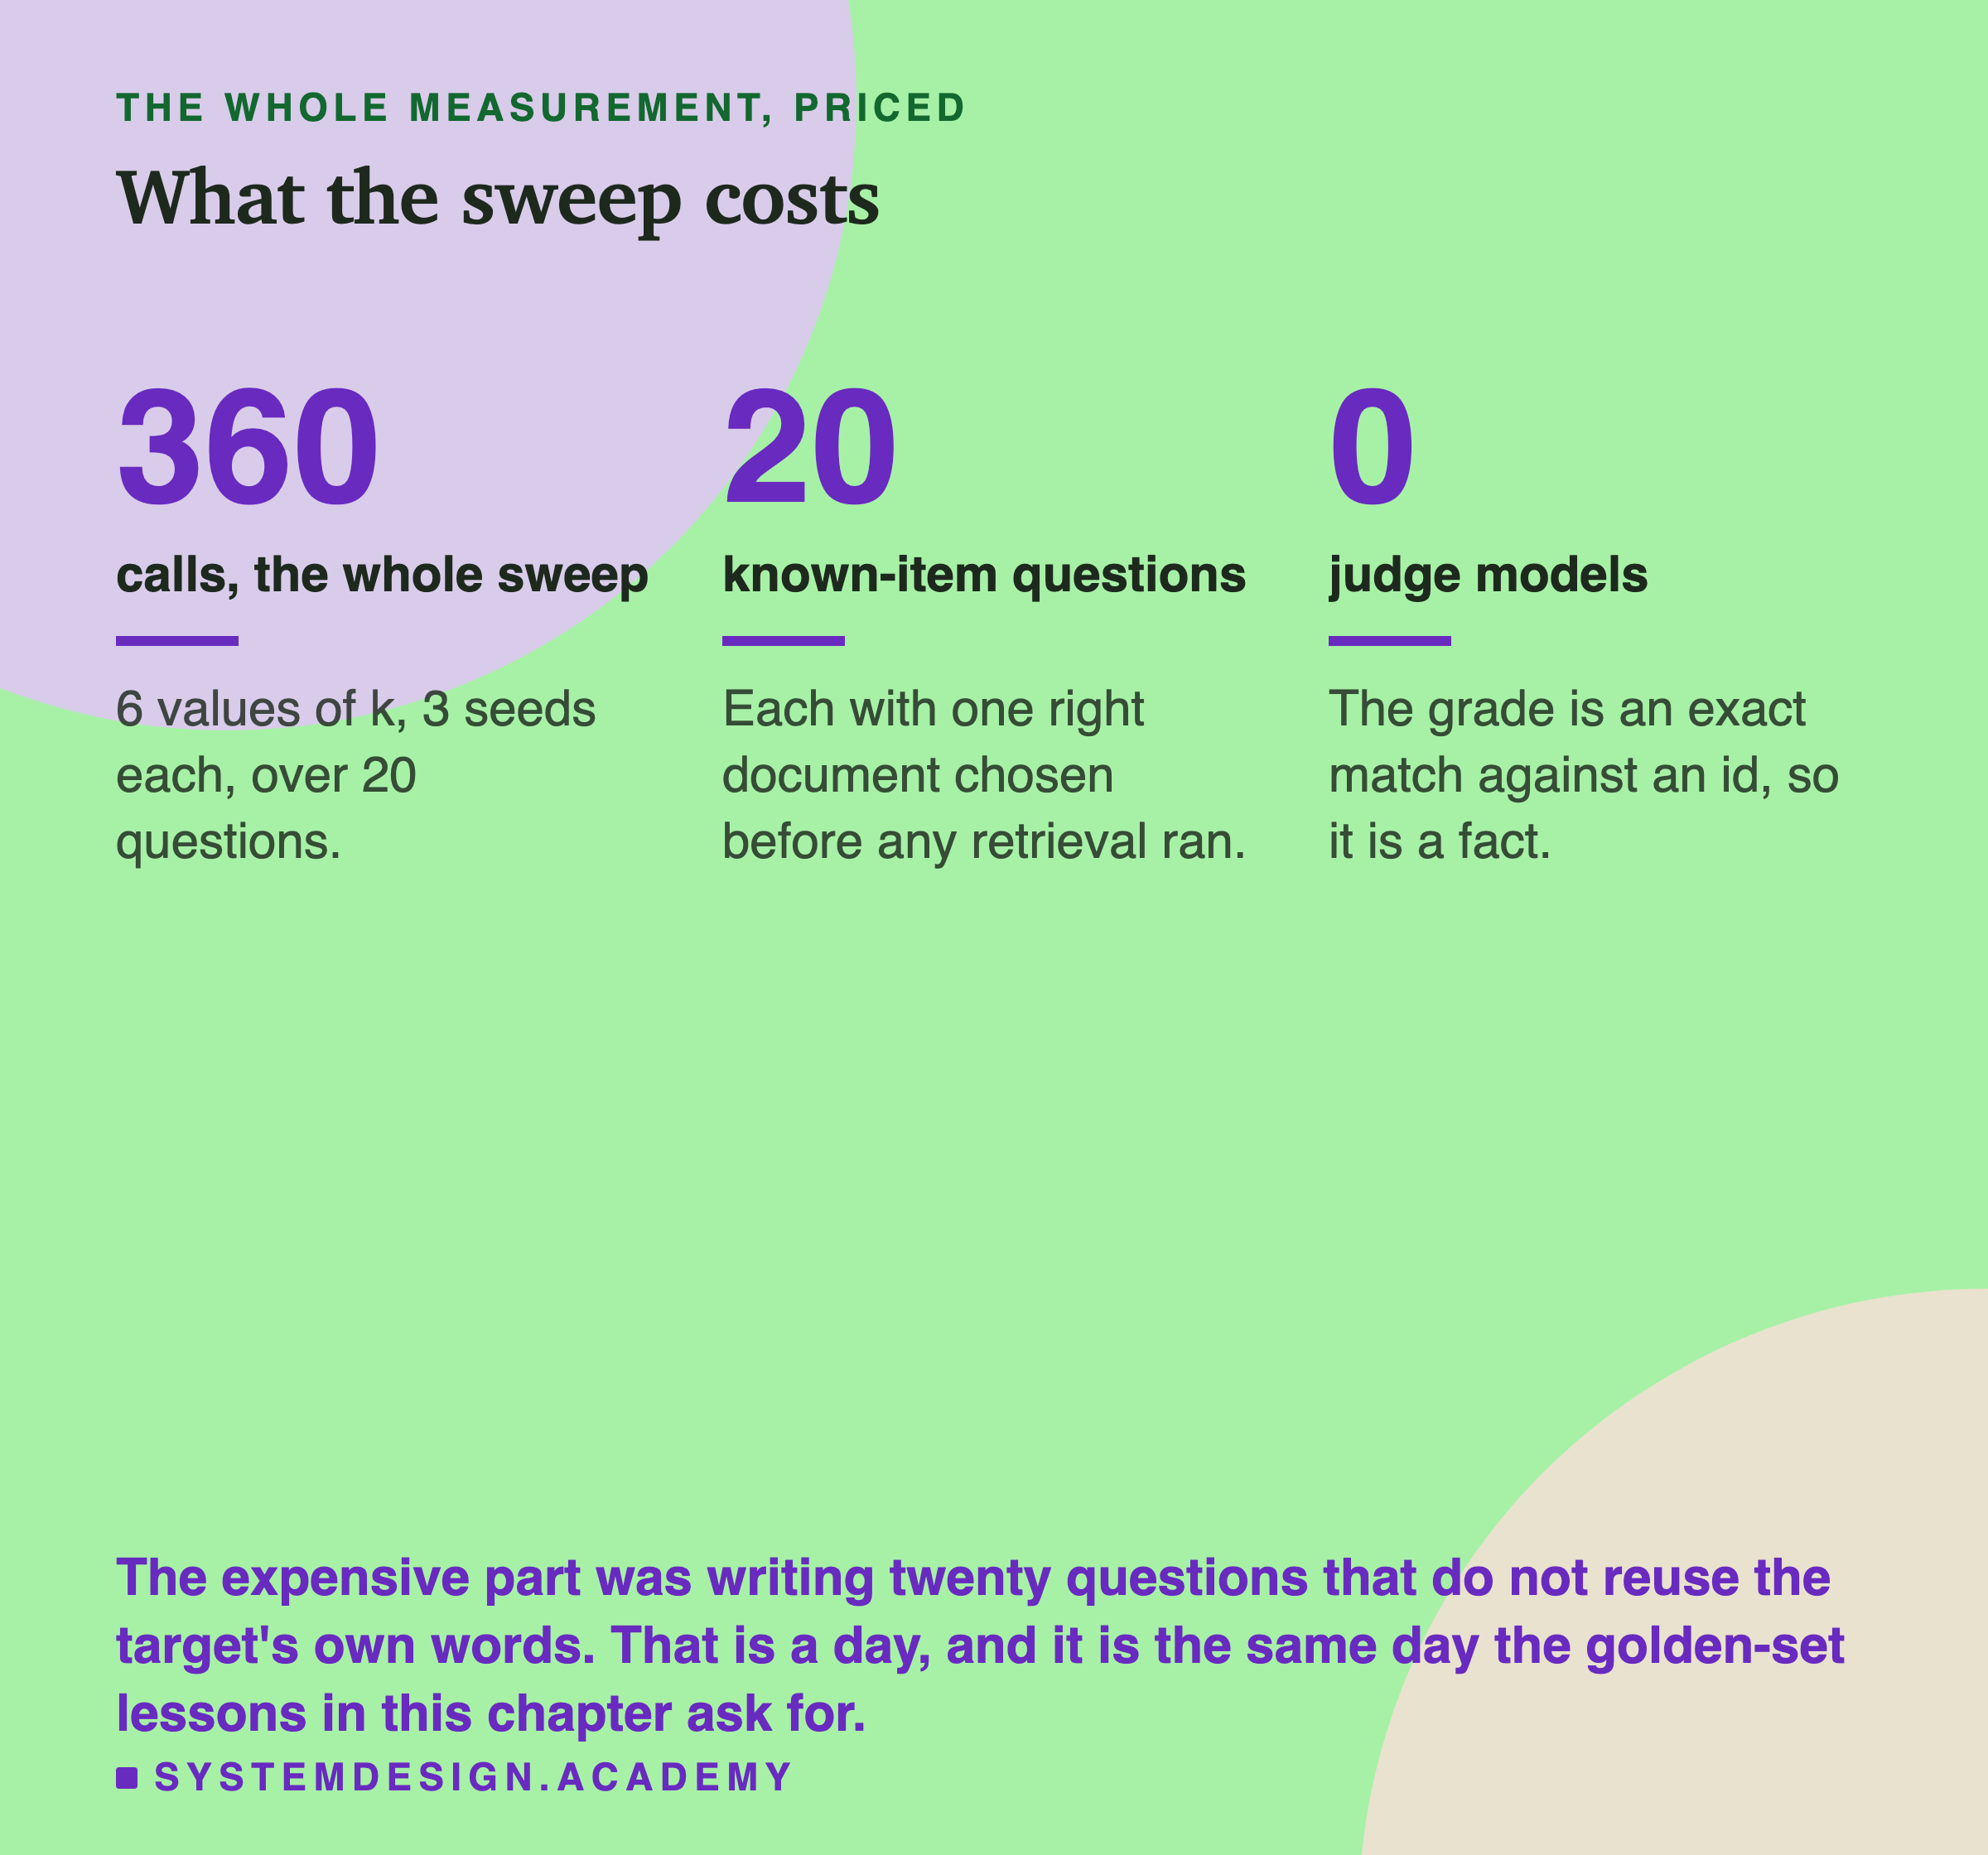
The expensive part is not the calls. It is having twenty questions with a known right answer that do not reuse the target document's own vocabulary.
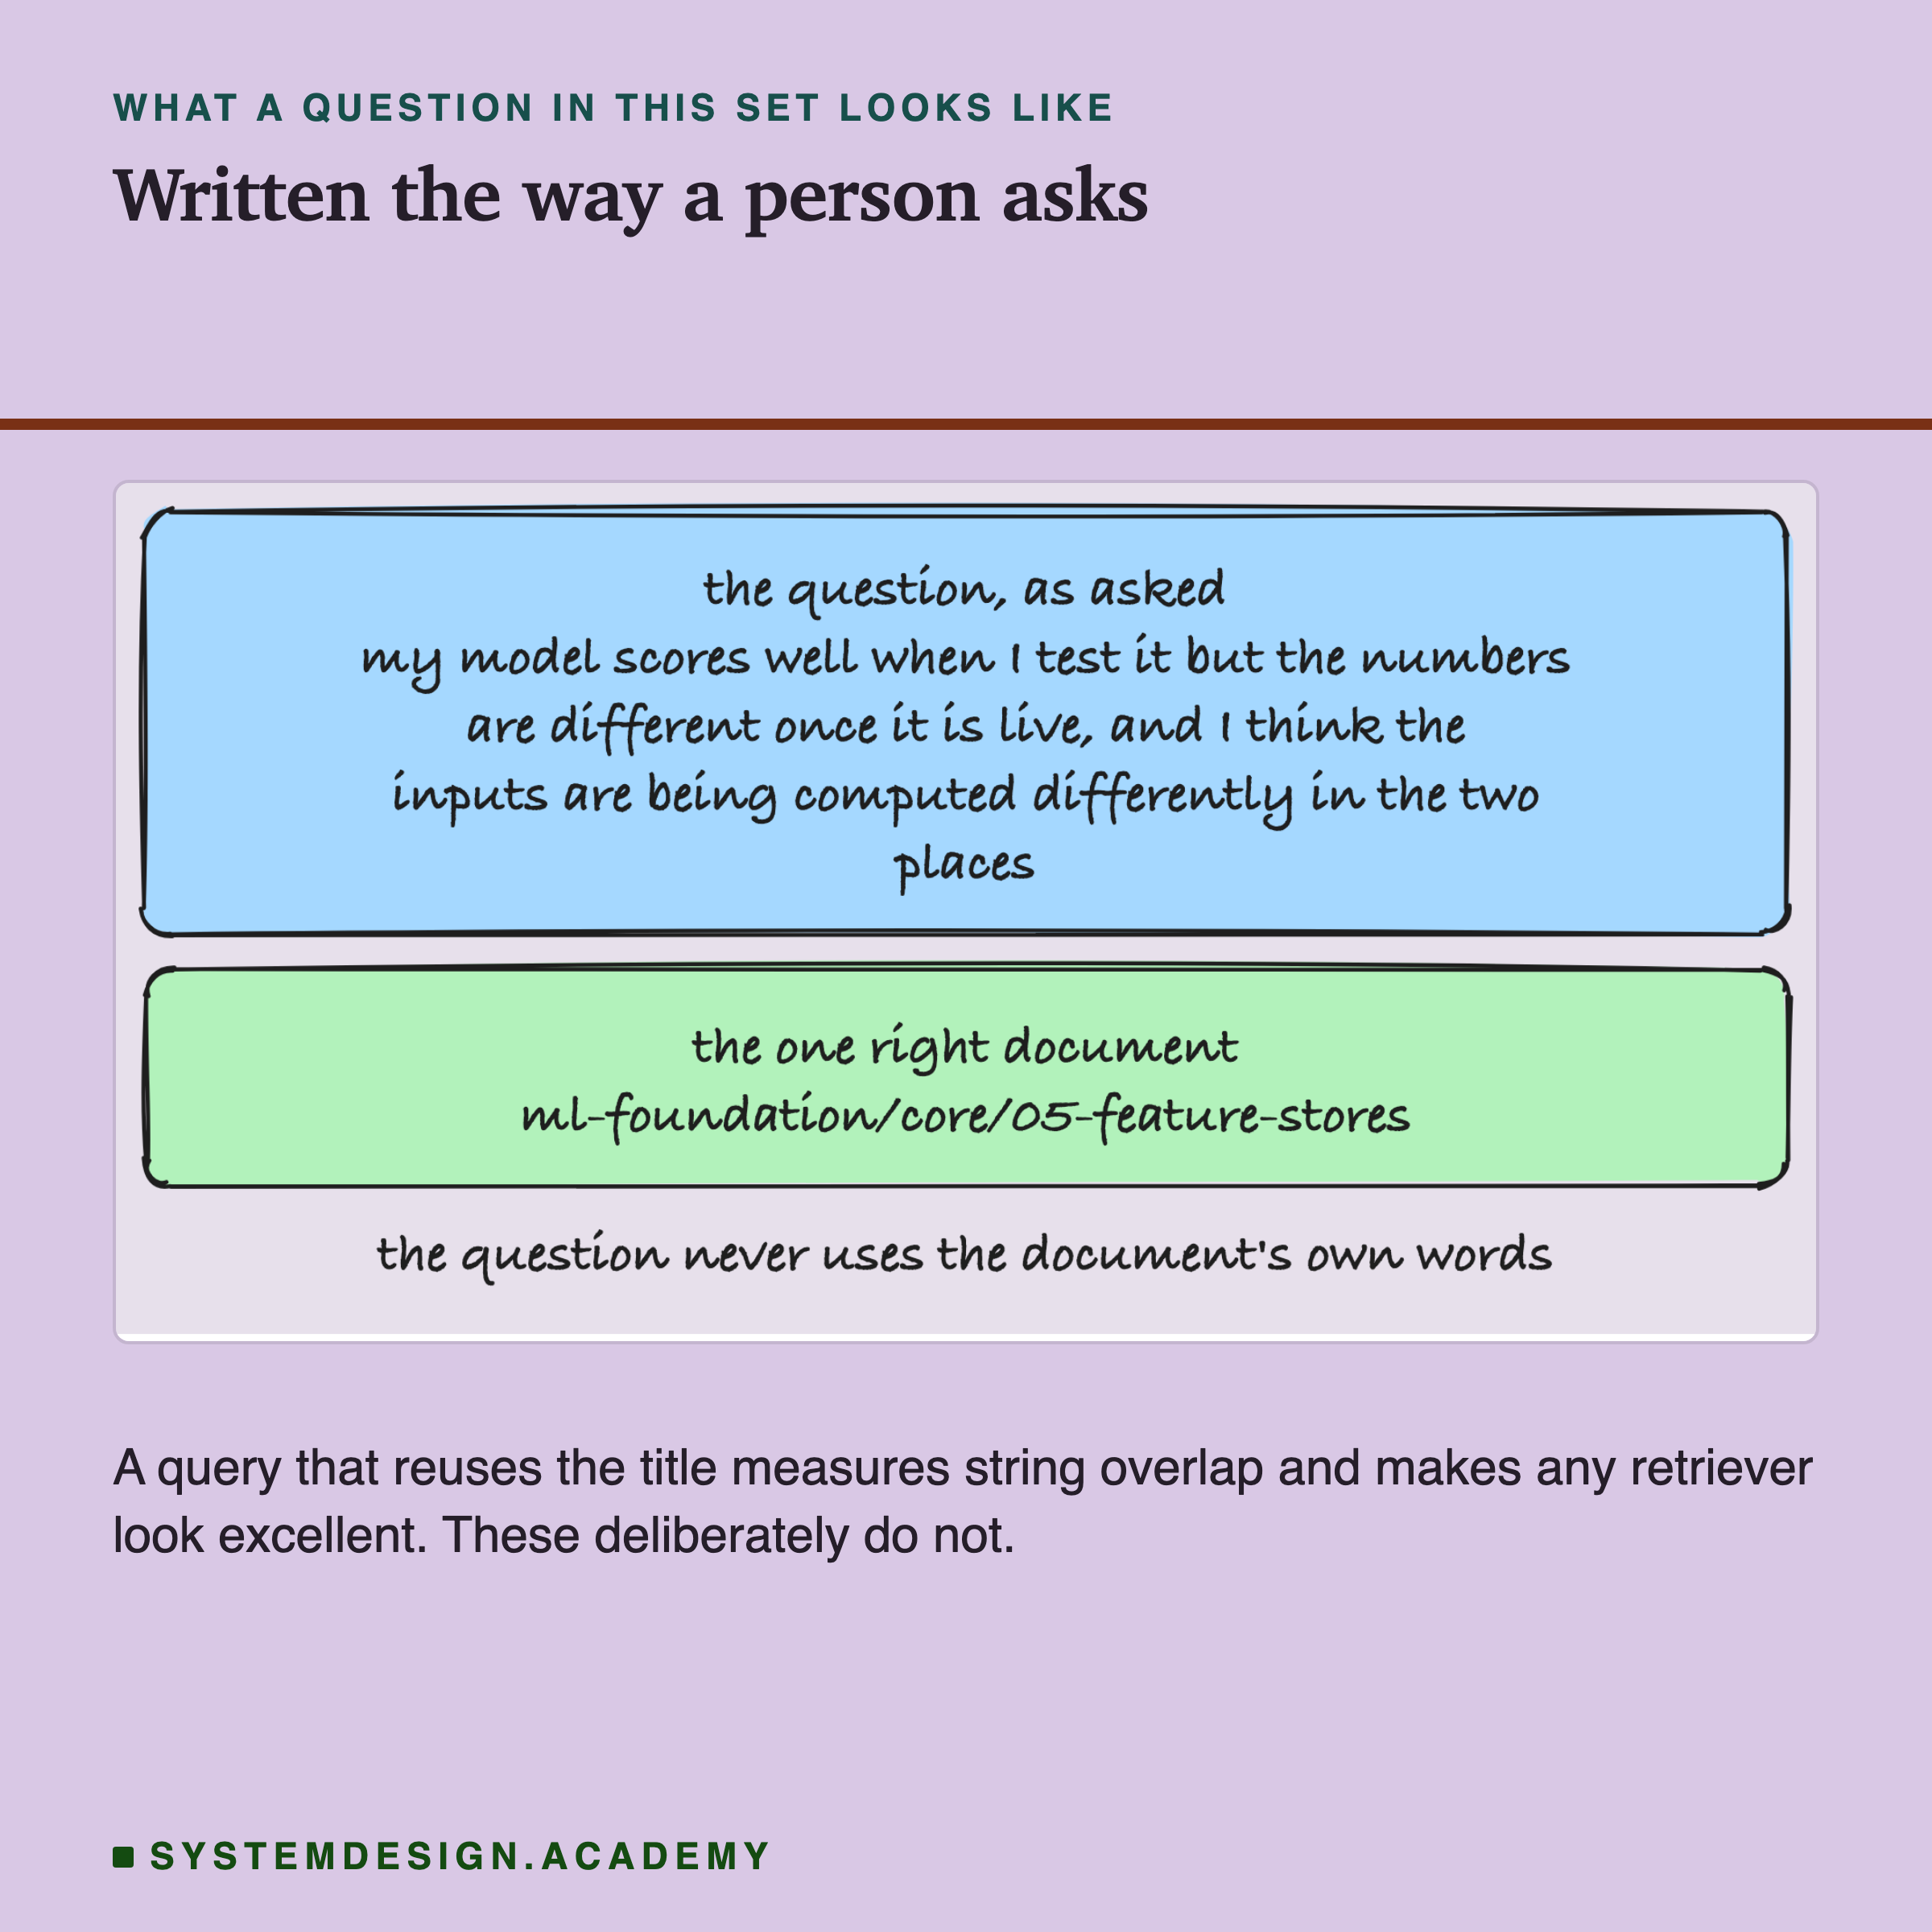
That question never says "". A query that reuses the document's title measures string overlap and will make any retriever look excellent.
Knowledge Check
Knowledge Check
5 questions - Score 80% to pass
Recall@k rose from 9 to 18 of 20 as k went from 1 to 20. Why is that rise guaranteed rather than informative?
At k of 5 the model used the right document on 10 of the 11 questions where retrieval found it. At k of 20, 6 of 18. Why does the lesson use a McNemar test rather than comparing those two fractions directly?
At k of 1 the recall curve and the end-to-end curve are the same number. What does that tell you?
The prompt at k of 20 was 2249 tokens and the context window was set to 8192. Why does the lab print both?
Your RAG dashboard shows recall@k and nothing else. What is the cheapest column to add?