The Demo Worked. The Service Did Not.
A team ships a retrieval-augmented chatbot over their help center. In the demo it is flawless: ask a question, watch it pull the right article and answer in grounded, confident prose. Everyone claps. Then it goes live to real traffic and the trouble starts. The first spike of users pushes response times past ten seconds. The monthly cloud bill arrives and the GPU line item is four times the estimate. Someone updates the refund policy on Tuesday, and the bot keeps quoting the old one through Friday. During a busy afternoon the model server falls over, and instead of degrading, the whole feature returns error pages.
None of that is a problem. The retrieval works, the reranker works, the model answers well when it answers at all. What broke is everything around the model: how it is served, how fast it responds under load, what each answer costs, how the index stays current, and what happens when a dependency fails. That gap between a notebook that works and a service that stays up is the entire subject of this lesson.
A separate chapter covers what RAG is and why retrieval grounds a model. This one assumes you already have that pipeline and asks the harder question: how do you operate it, at scale, for months, without it becoming slow, expensive, stale, or unreliable?
We will treat the RAG plus LLM feature as what it really is in production, a distributed system with a budget, a cost model, a freshness contract, and a reliability target. By the end you will be able to read a live RAG service the way an on-call engineer does: know where the time goes, where the money goes, what breaks, and which lever fixes it.
It Is Two Systems Sharing One Index
The first thing to get straight is that a production system is not one program. It is two, and they run on completely different clocks. The offline lane turns documents into a searchable index; it runs on a schedule or when documents change, and it is allowed to be slow. The online lane answers live questions on every request, and it lives or dies by a latency budget. They touch at exactly one place, the shared vector store, and the single rule that keeps them consistent is that both lanes must embed with the same pinned model, or the query vectors and the document vectors stop being comparable.
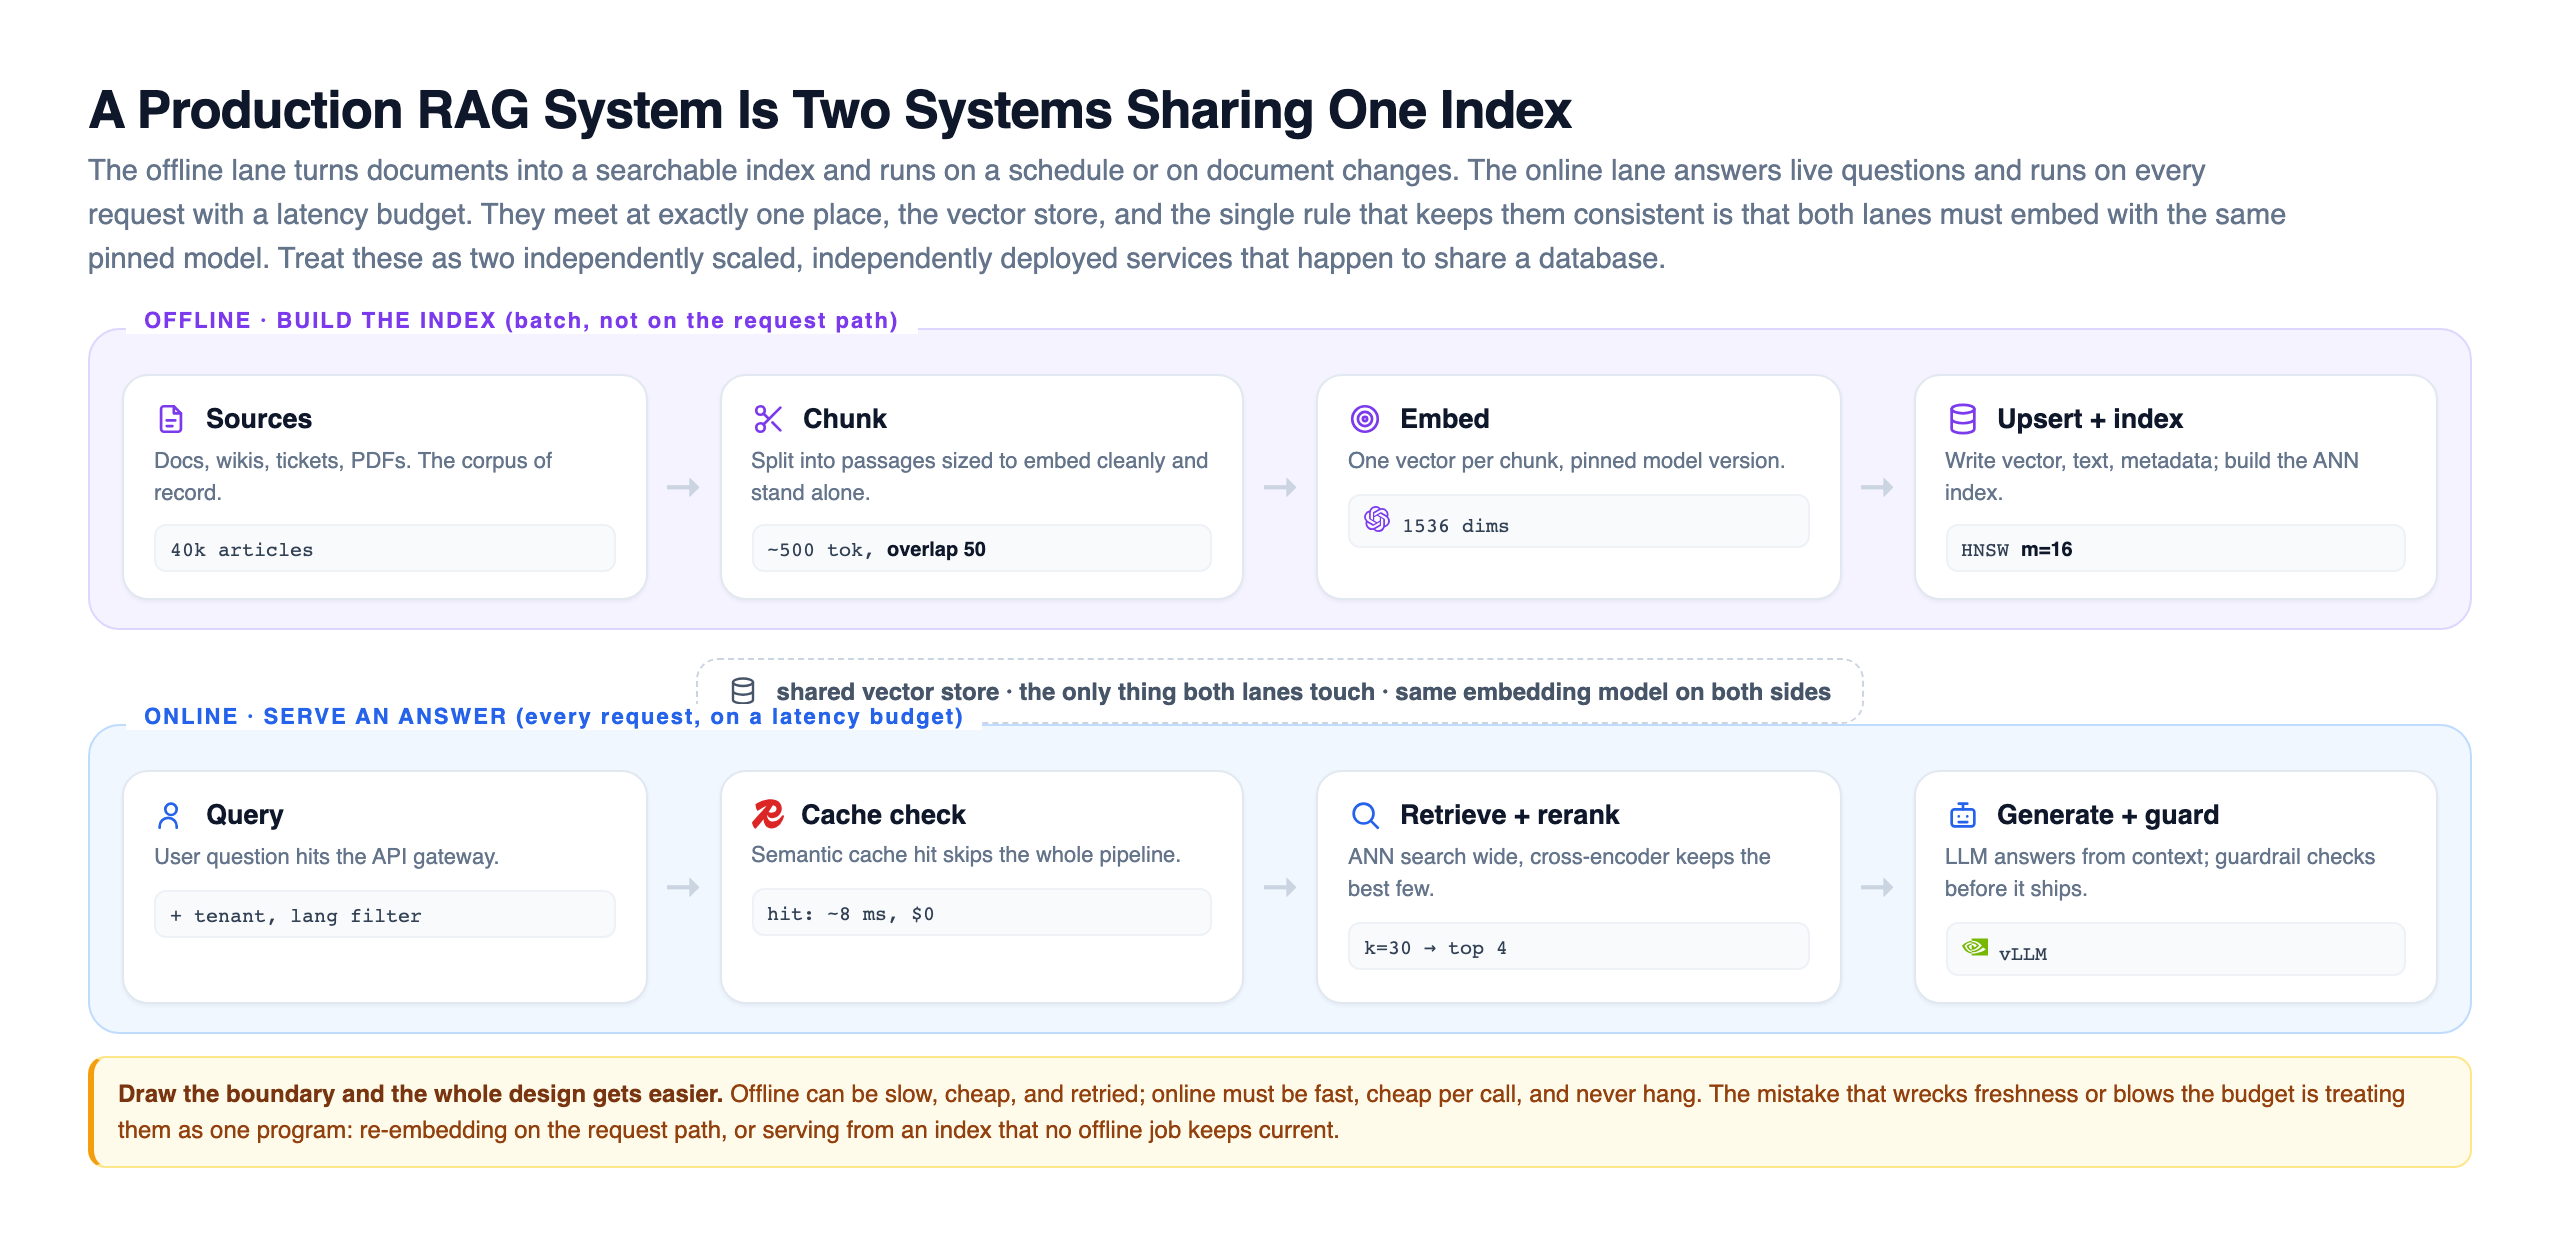
Drawing that boundary is the design decision everything else hangs off. Offline work can be slow, cheap, retried on failure, and scaled with ordinary batch infrastructure. Online work must be fast, cheap per call, and must never hang, because a hung request is a user staring at a spinner. The classic mistake that wrecks a RAG service is collapsing the two: re- documents on the request path, or serving queries against an index that no offline job keeps up to date. Keep them as two independently deployed, independently scaled services that happen to share a database, and each one becomes something you can reason about, monitor, and scale on its own terms.
Notice where the expensive box sits. In the online lane, retrieval and are cheap and fast. The large language model is the slow, costly, fragile component, and almost every operational decision in the rest of this lesson is really a decision about how to call that model less often, serve it more efficiently, or survive it when it fails.
One Request, Service by Service
Before we optimize anything, trace a single live request through the online lane so the order and the fan-out are concrete. This is what happens on a cache miss, the expensive case where every service is touched.
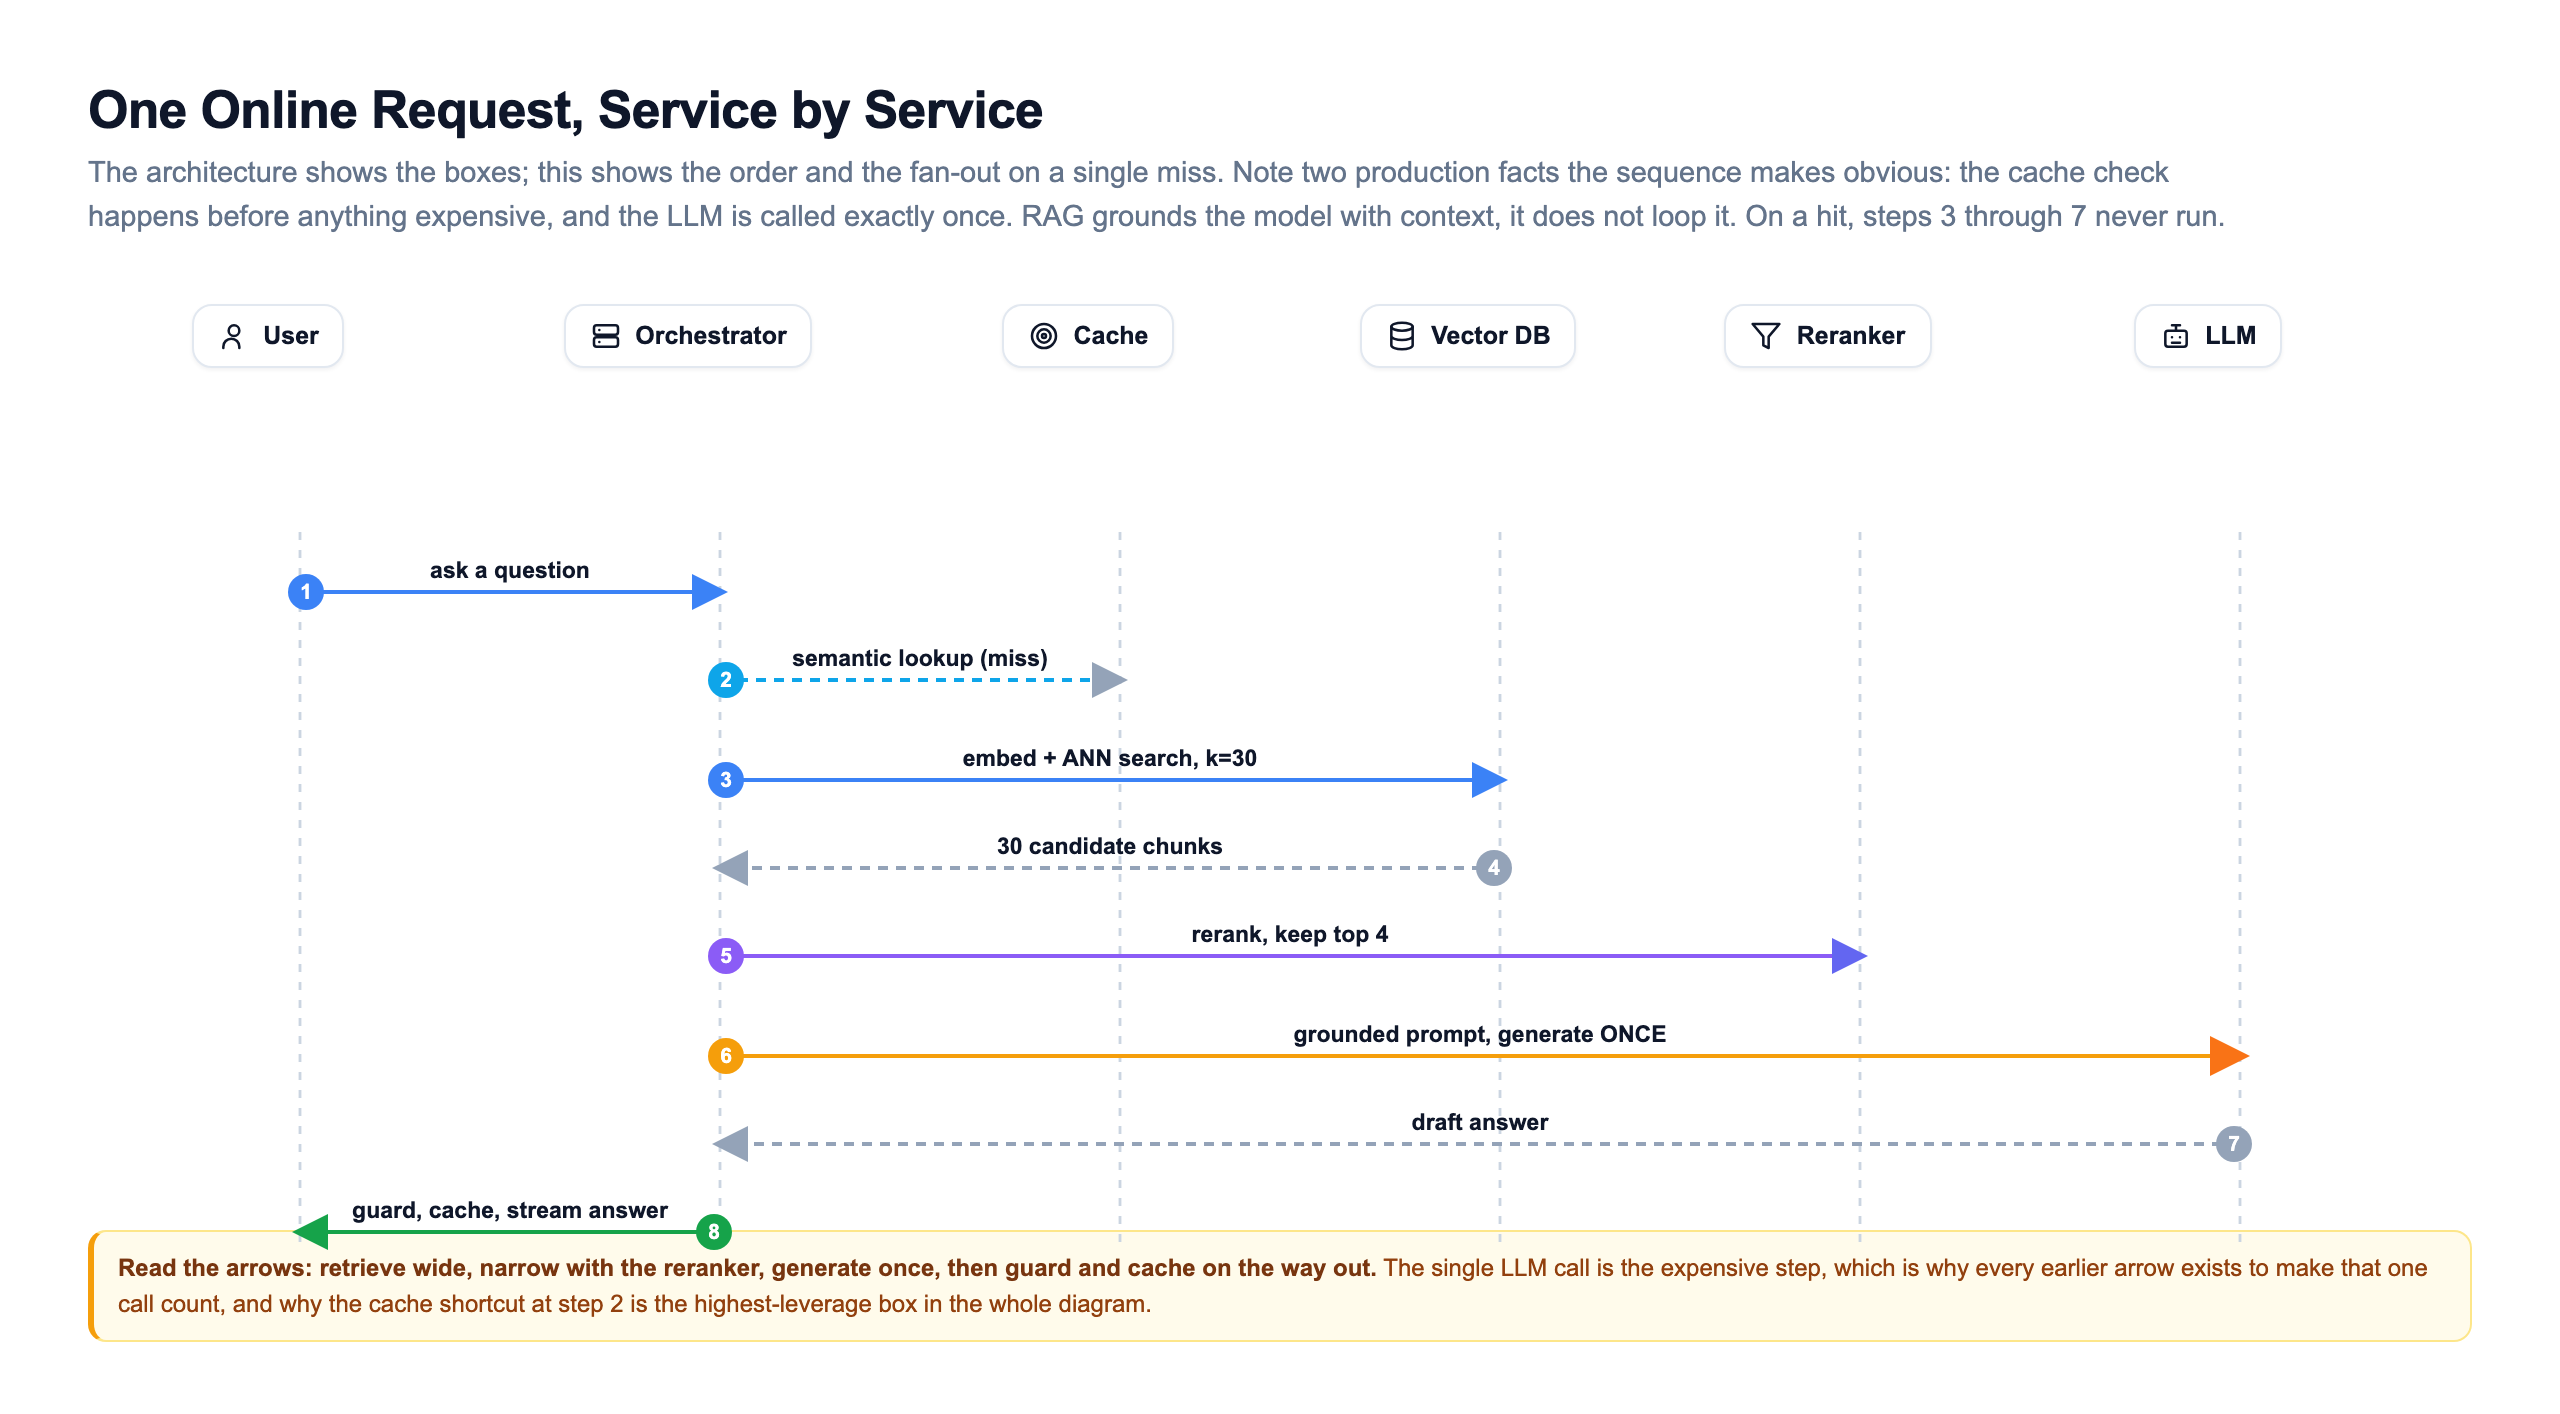
Two production facts jump out of the sequence. First, the cache check happens before anything expensive runs, because the cheapest request is the one you never have to compute. Second, the model is called exactly once. grounds the model with retrieved context; it does not spin it in a loop or call it repeatedly per question. Every arrow before that single generation exists to make that one expensive call count: retrieve wide to be safe, narrow with the reranker to keep the prompt tight, then generate once and guard the result on the way out.
That structure is why the operational levers are so lopsided. If the LLM call is the only expensive step and it runs at most once per uncached request, then the two things worth fighting over are avoiding the call entirely (the cache at step two) and making the calls you cannot avoid cheaper and faster (the serving stack behind step six). Hold that idea, because the next figure proves it with real numbers.
Where a Request Actually Spends Its Time
You cannot budget for you have not measured. So trace the same cache-miss request again, this time with a stopwatch on every stage, and the picture stops being abstract.
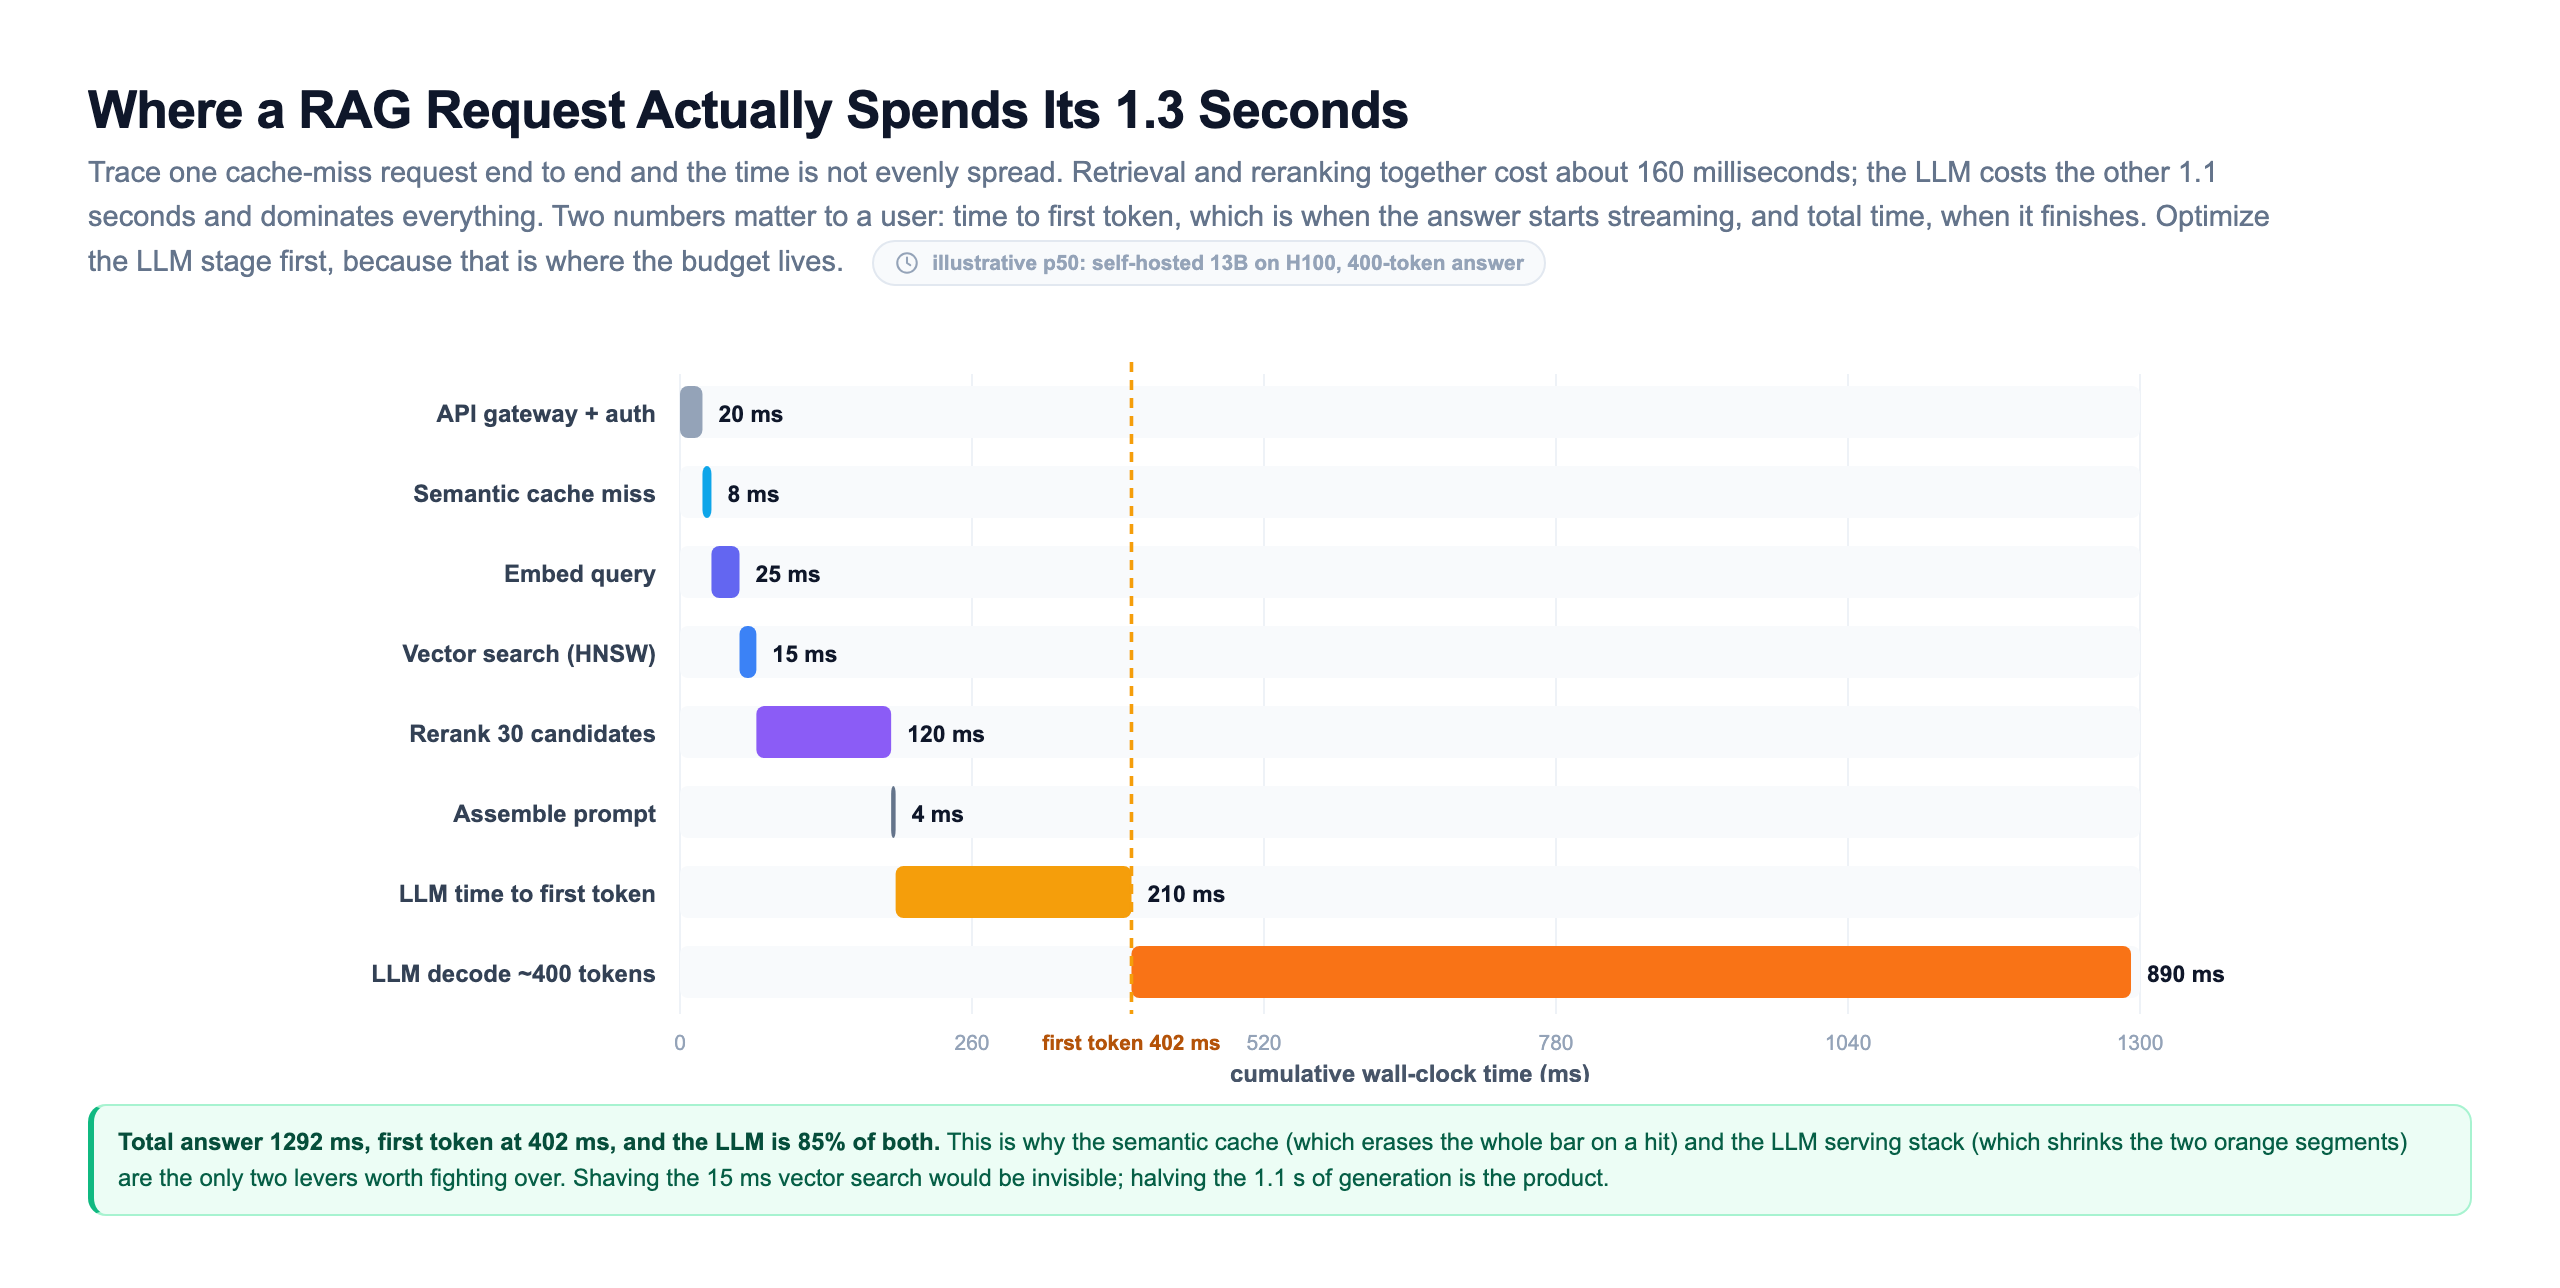
The time is not spread evenly, not even close. Everything up to and including retrieval and costs about one hundred sixty milliseconds combined. The language model costs the other eleven hundred, split between the time to produce the first token and the slower work of streaming the rest of the answer out one token at a time. Two numbers matter to a real user: time to first token, which is when the answer starts appearing and the wait feels over, and total time, which is when it finishes.
This changes what optimization even means. Shaving five milliseconds off vector search is invisible; the user will never feel it. Halving the eleven hundred milliseconds of generation is the entire product experience. That is why the two levers from the previous slide are the only ones worth serious engineering effort. The semantic cache erases the whole bar on a hit, taking a request from over a second to a few milliseconds. The serving stack, batching and on the model server, shrinks the two orange generation segments that dominate everything else. Chasing anything to the left of the model is polishing a corner nobody looks at.
Three Caches, Each Skipping a Different Cost
Since the model call is both the slowest and most expensive step, the highest-leverage move in production is to not make it. Real systems stack several caches at different points on the request path, and each one catches different traffic and skips a different chunk of the work.
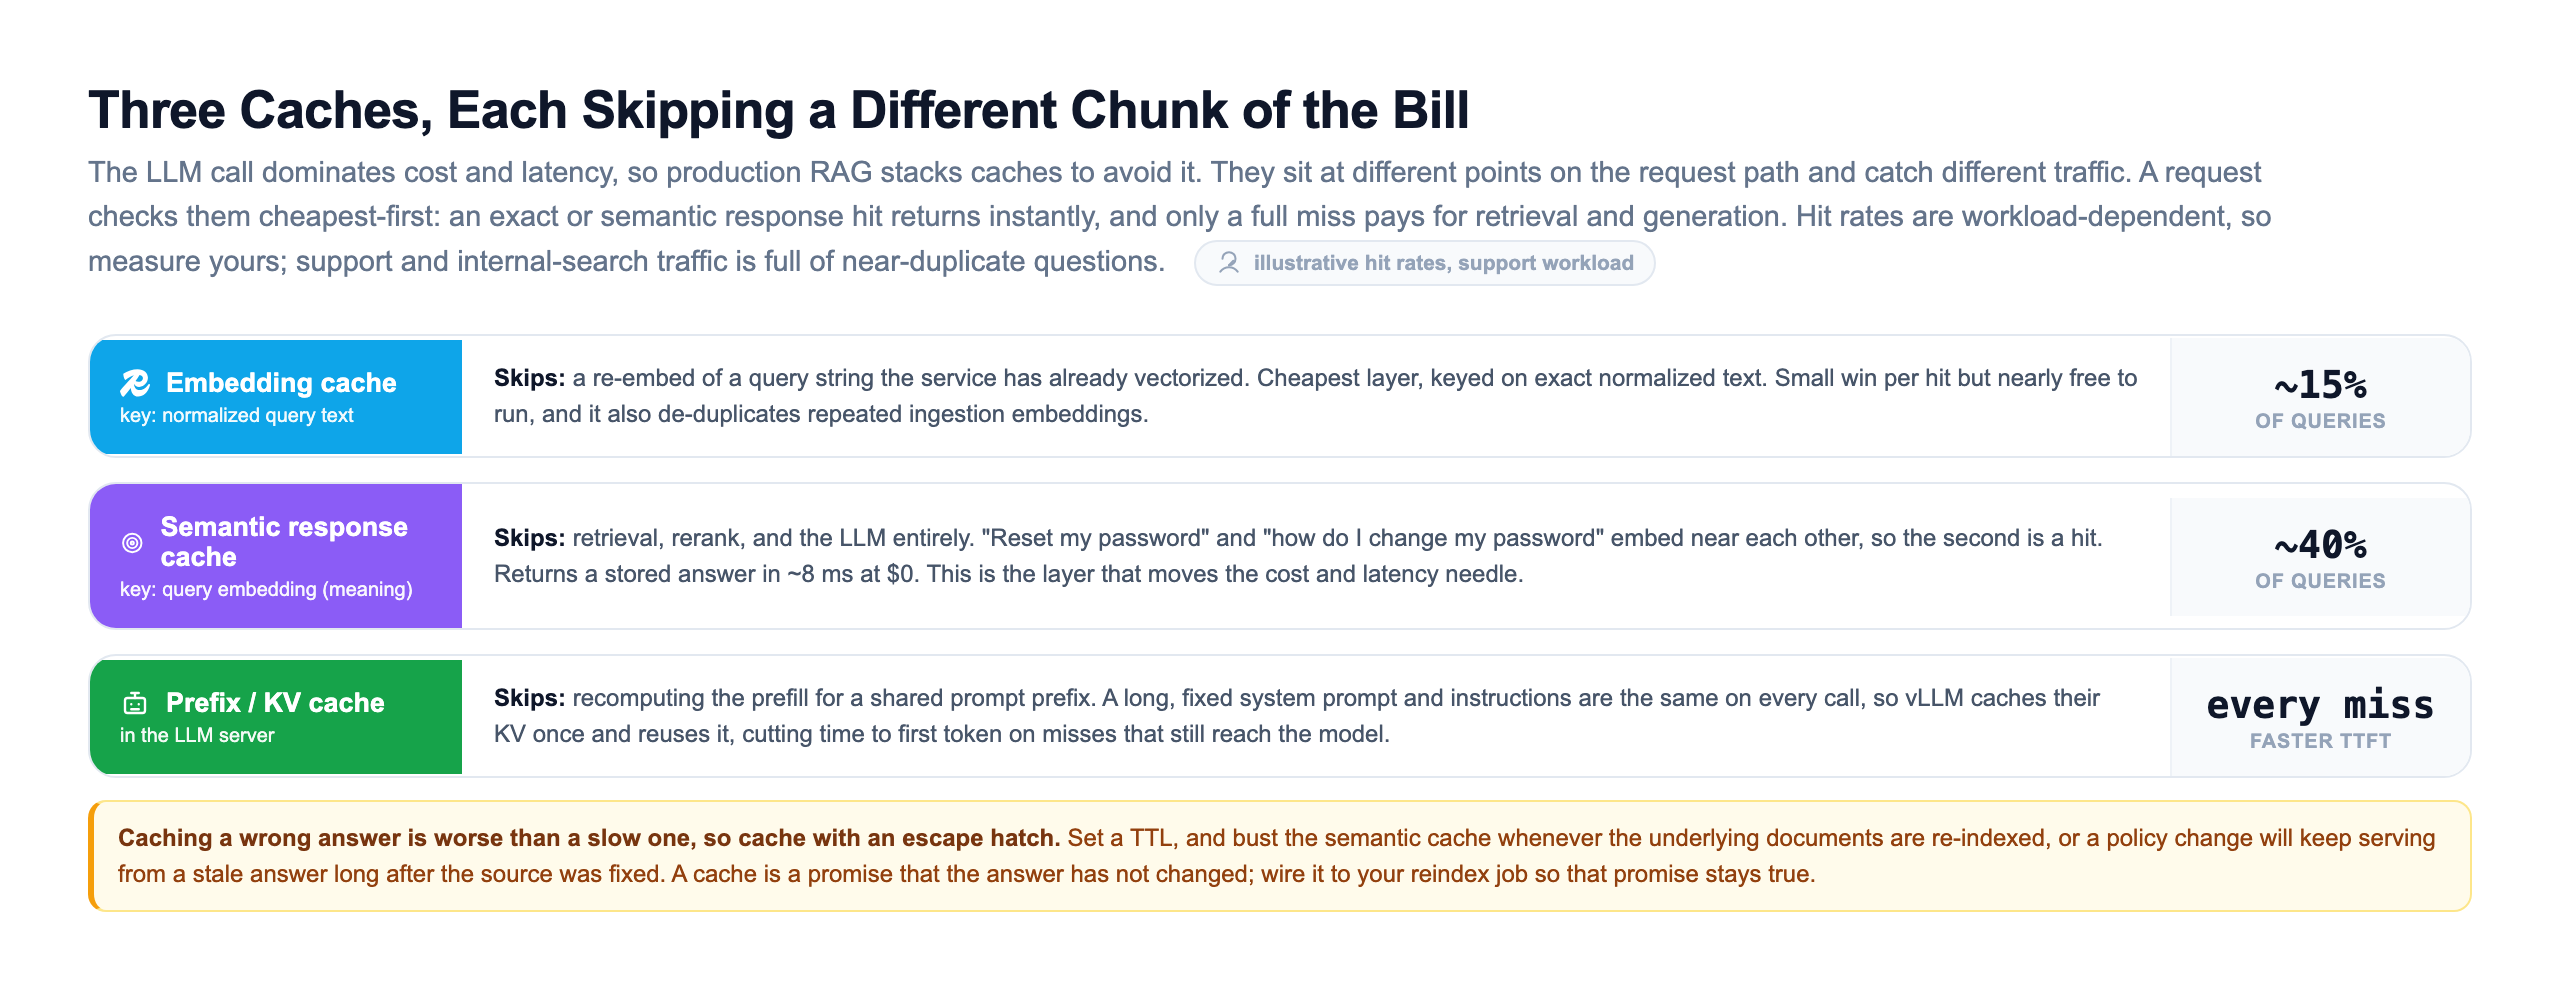
The cache is the cheapest and smallest win: if the same query string has already been vectorized, reuse the vector. The semantic response cache is the one that moves the needle. It keys on the meaning of a question, not its exact text, so "reset my password" and "how do I change my password" land on the same entry and the second one skips retrieval, reranking, and generation entirely, returning a stored answer in milliseconds at zero marginal cost. In support and internal-search traffic, a large share of questions are near-duplicates, so hit rates of forty percent and up are common. The third layer lives inside the model server: a long, fixed system prompt is identical on every call, so the server caches its key-value state once and reuses it, cutting time to first token on the misses that still reach the model.
There is one rule that keeps caches from becoming a liability. A cache is a promise that the stored answer has not changed, and a wrong answer served fast is worse than a right answer served slow. So give every cached answer a time-to-live, and wire the semantic cache to your reindex job: whenever the underlying documents change, bust the cached answers that drew on them. A cache that keeps serving last quarter's policy after the source was fixed is a bug wearing the costume of a performance optimization.
Cost per Query Is Almost Entirely the Model
and cost turn out to be the same story told twice, because both are dominated by the same box. Add up what a thousand answered questions actually cost and the shape mirrors the waterfall exactly.
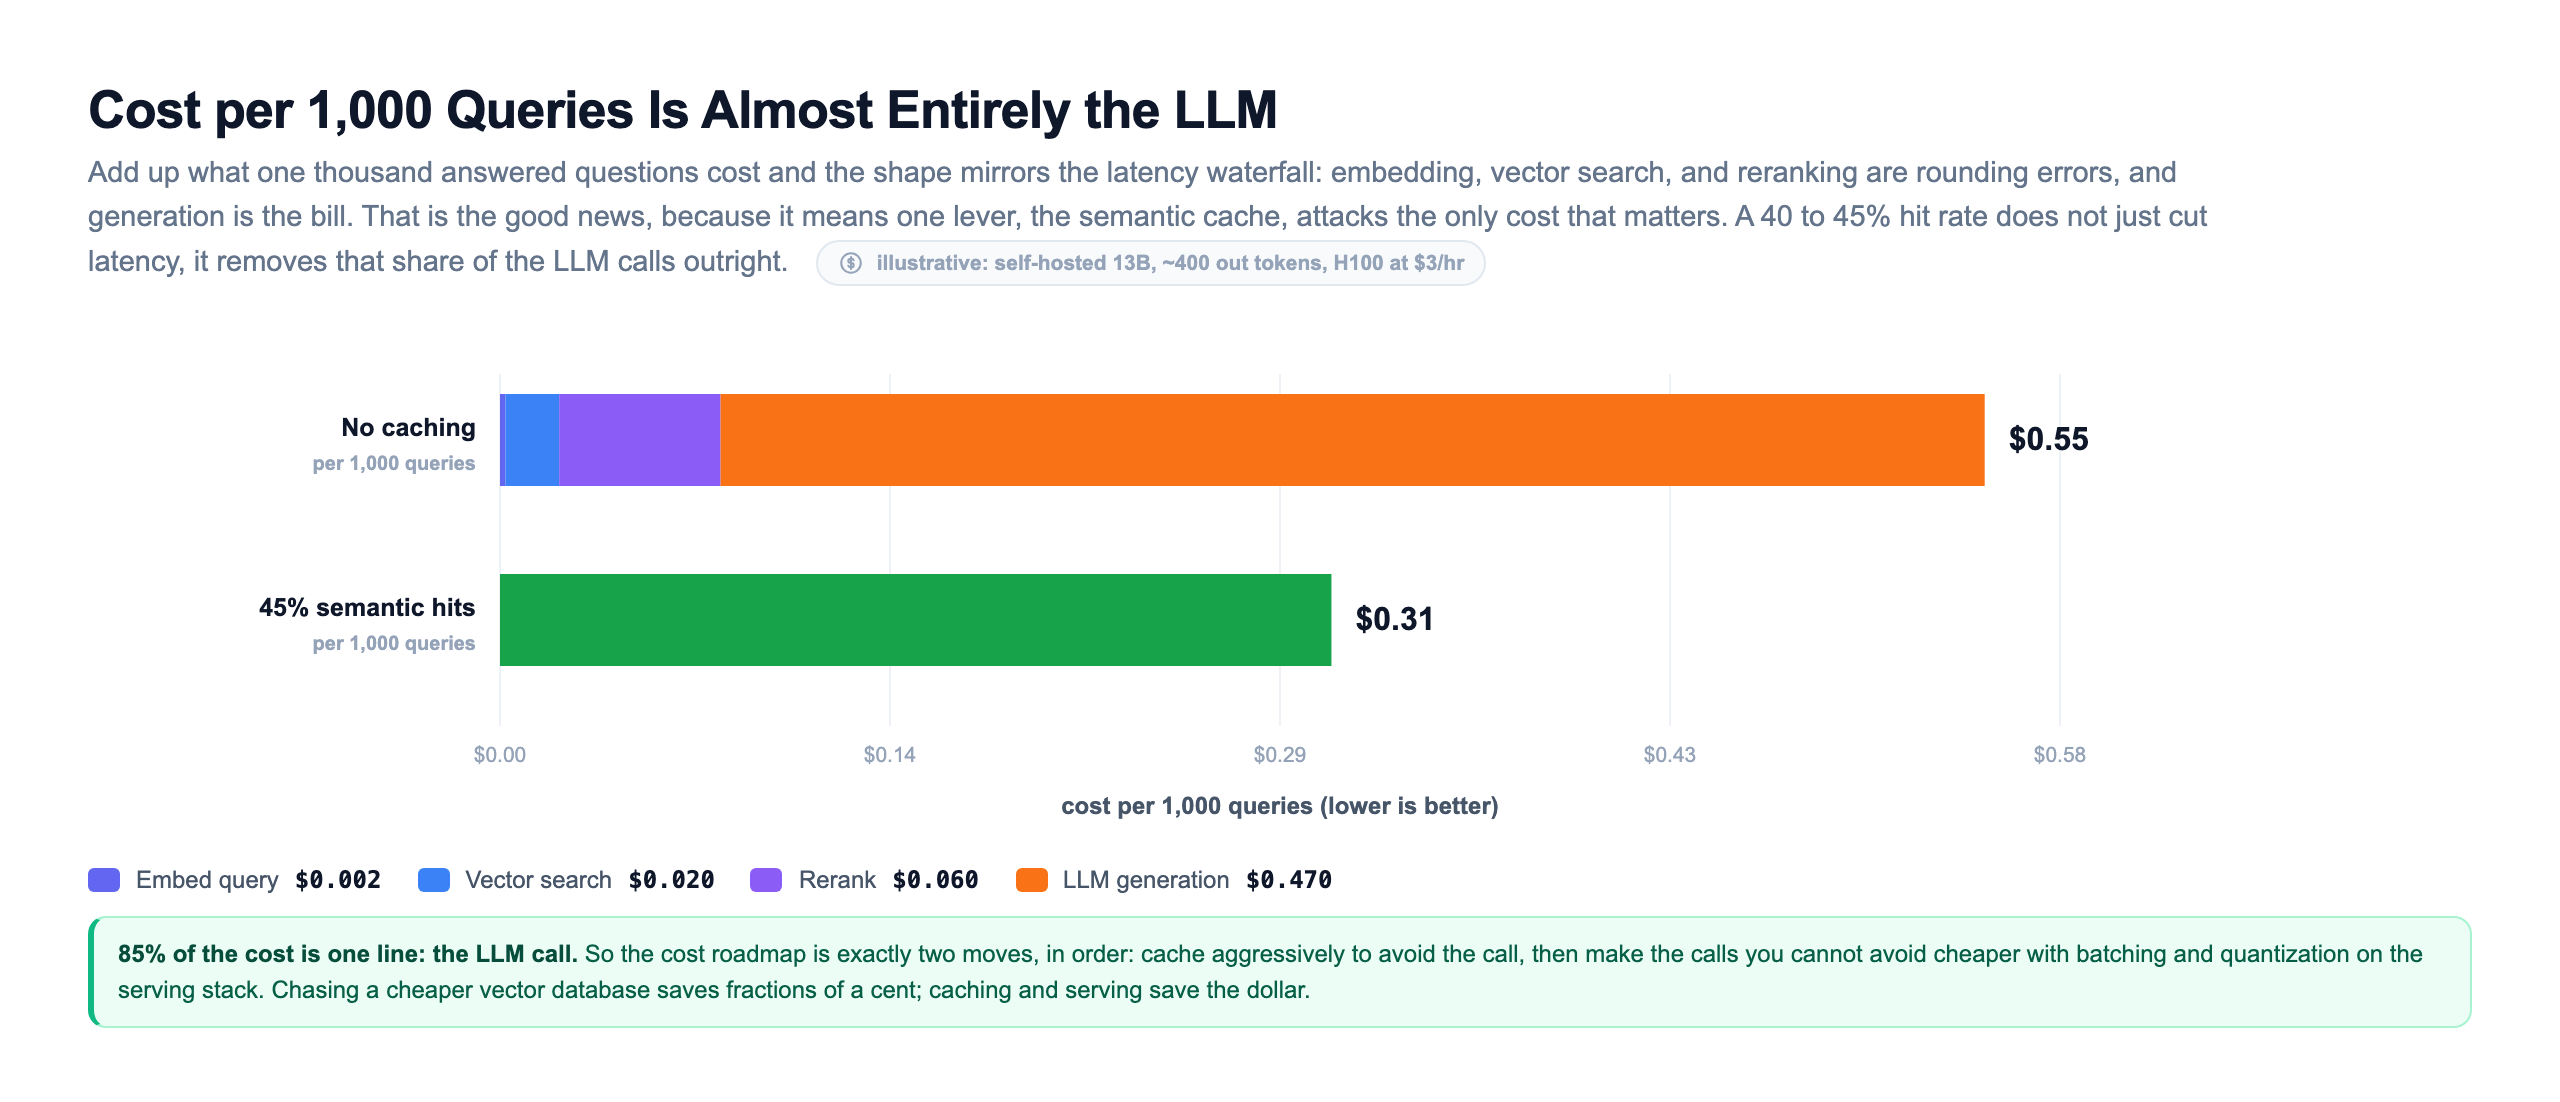
, vector search, and reranking are rounding errors on the bill. Generation is the bill. That is genuinely good news, because it means one lever, the semantic cache, attacks the only cost that matters, and it attacks it twice: a cache hit does not just return faster, it removes that share of the model calls from the cost model entirely. A forty to forty-five percent hit rate cuts the dominant cost by roughly the same fraction.
So the cost roadmap is exactly two moves, in order. First, cache aggressively to avoid the call. Then make the calls you cannot avoid cheaper with the serving techniques from the GPU and inference lessons: continuous batching to pack more requests onto each GPU, quantization to fit a smaller, faster model, and a right-sized model rather than reflexively reaching for the largest one. Chasing a cheaper saves fractions of a cent per thousand queries; caching and serving save the dollar. Here is a small simulation you can run to feel how a semantic cache changes both numbers at once.
The exact hit rate depends on your traffic and your similarity threshold, but the direction is always the same: because the model call dominates both cost and latency, anything that avoids it moves both numbers at once, which is why the cache is the first thing you build and the last thing you turn off.
Keeping the Index Fresh Without Rebuilding Everything
A answer is only as current as the index behind it, and a stale index is worse than no RAG, because it answers with total confidence from a document that is no longer true. But the obvious fix, rebuild the whole index whenever anything changes, is far too slow and expensive when the corpus is tens of thousands of documents. Production systems reindex incrementally: they stream document changes and re-embed only what actually changed.
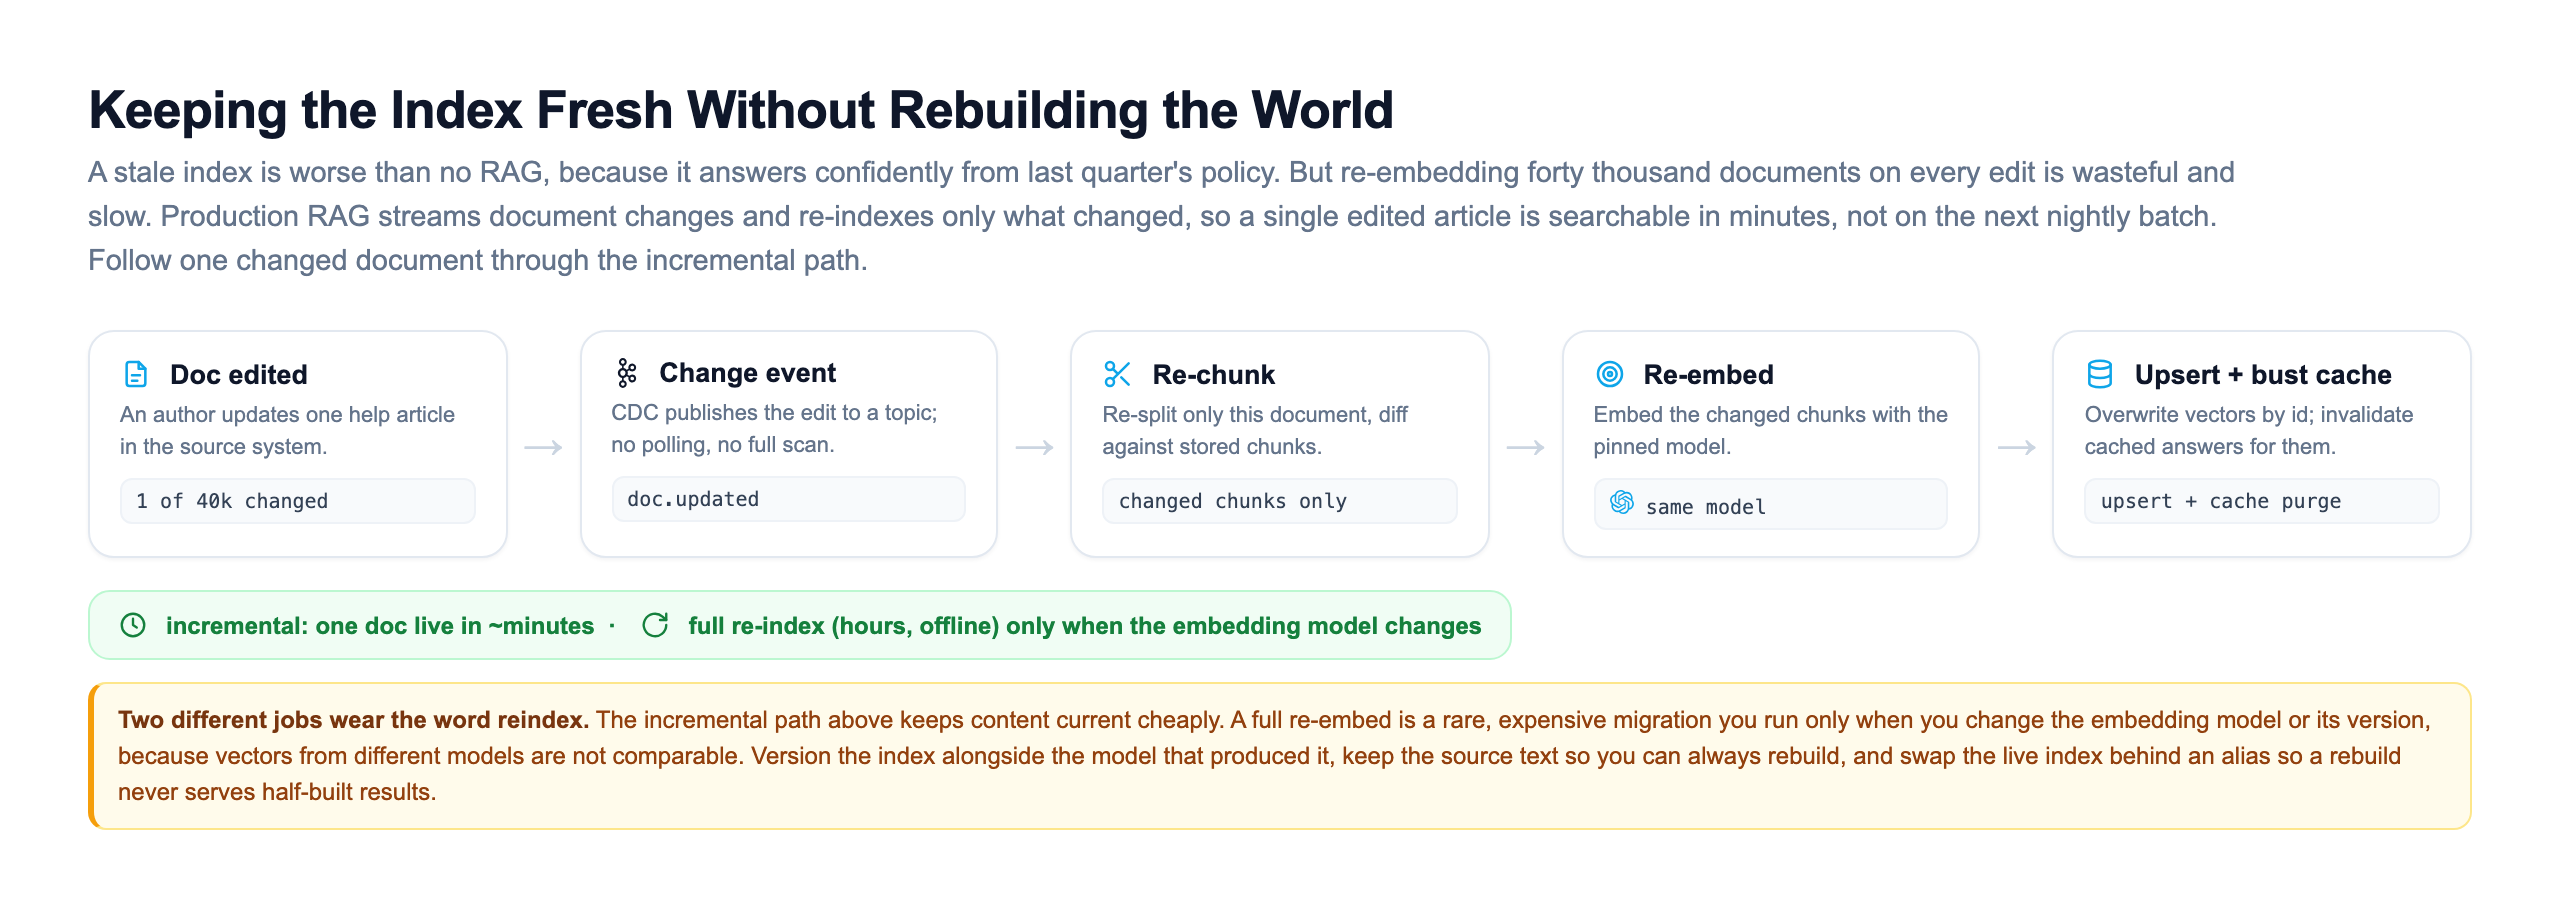
Follow one edited article through the path. A change-data-capture event announces the edit, so nothing has to poll or rescan the corpus. Only that document is re-chunked, only its changed chunks are re-embedded, and the new vectors overwrite the old ones by id. In the same step, any cached answers that drew on those chunks are invalidated, which is the wiring that keeps the cache honest. The result is that a single edited document is searchable again in minutes rather than waiting for a nightly batch.
Two very different jobs hide behind the word "reindex," and confusing them is a common outage. The incremental path above keeps content current cheaply and runs constantly. A full re-embed of the entire corpus is a rare, expensive migration you run only when you change the model or its version, because vectors produced by different models are not comparable and mixing them silently destroys recall. Treat the embedding model as a long-lived commitment: version your index alongside the model that built it, always keep the source text so you can rebuild from scratch, and swap the live index behind an alias so a rebuild never serves half-built, half-empty results to real users.
Three Tiers, Three Scaling Signals
When traffic grows, "add more replicas" is not a plan, because a service is not one uniform thing. It is three tiers with three different shapes, and each one scales on its own signal at its own speed and cost.
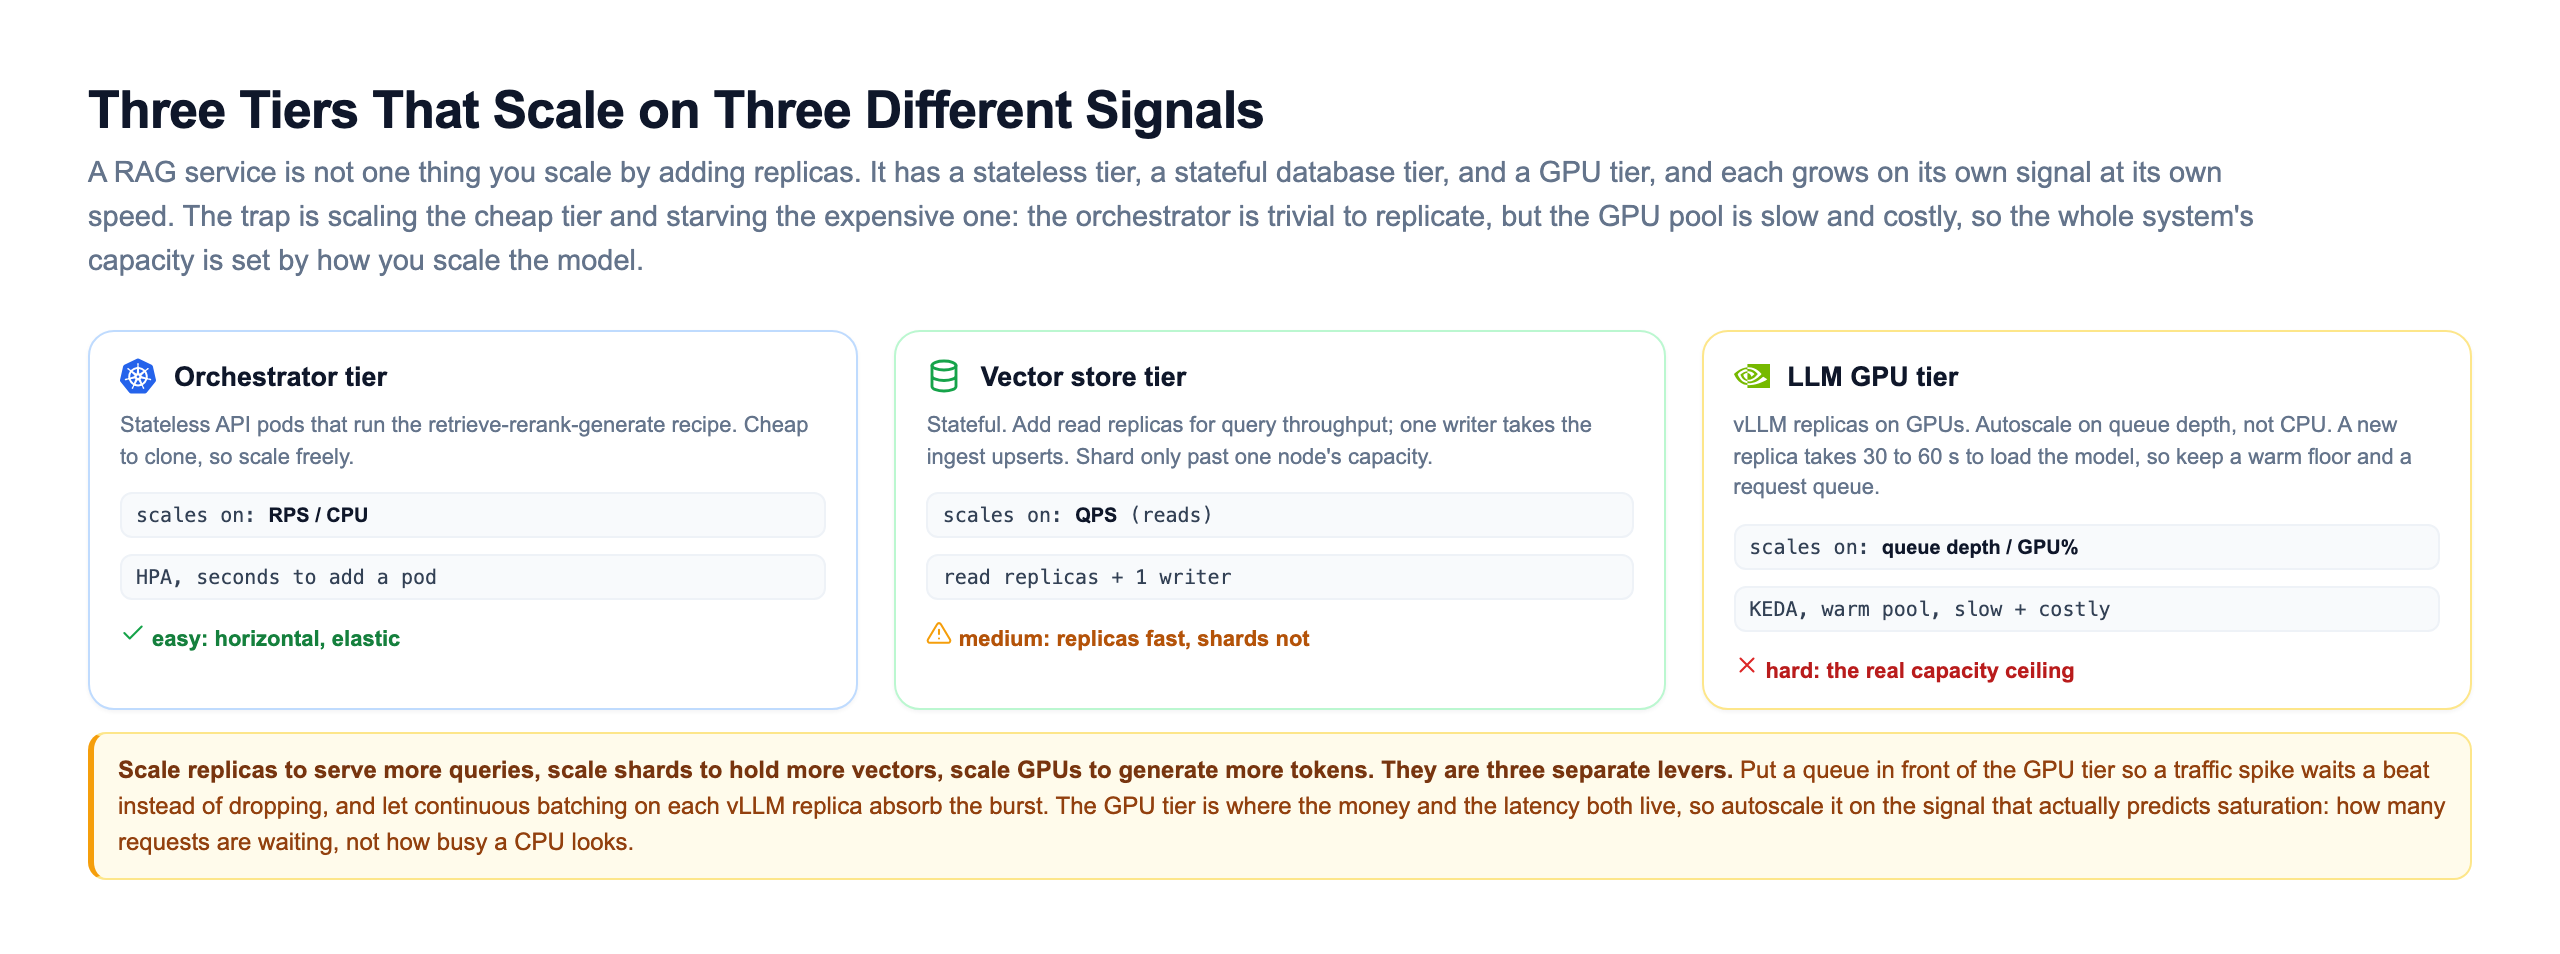
The orchestrator tier is stateless glue: pods that run the recipe and hold no data, so they are trivial to clone and scale freely on request rate. The vector store tier is stateful, so it scales differently: add read replicas to serve more queries per second, keep a single writer for ingest upserts, and only shard once a single node can no longer hold the vectors, because a vector index makes every query fan out to every shard. The GPU tier is the one that actually sets your capacity. New replicas are slow to start, because loading a multi-billion-parameter model into VRAM takes the better part of a minute, and they are expensive to keep running, so you autoscale them on queue depth rather than CPU, keep a warm floor of always-on replicas, and put a request queue in front so a traffic spike waits a beat instead of dropping requests.
The mnemonic that keeps these straight: scale replicas to serve more queries, scale shards to hold more vectors, scale GPUs to generate more tokens. They are three separate levers on three separate tiers. The trap that catches teams is scaling the cheap, easy tier and starving the expensive, hard one, then wondering why adding orchestrator pods did nothing while the GPU queue kept backing up. The GPU tier is where the money and the both live, so it is the tier to watch, and the signal that predicts its saturation is how many requests are waiting, not how busy a CPU looks.
When the Model Fails, Degrade on Purpose
The language model is the slowest, most expensive, and least reliable component on the path, and a live service cannot simply hand back an error the moment it is overloaded or unreachable. The professional answer is to plan the failure in advance: a ladder of fallbacks where each rung gives a worse but still useful answer, and the very bottom rung is an honest refusal rather than a hang or a .
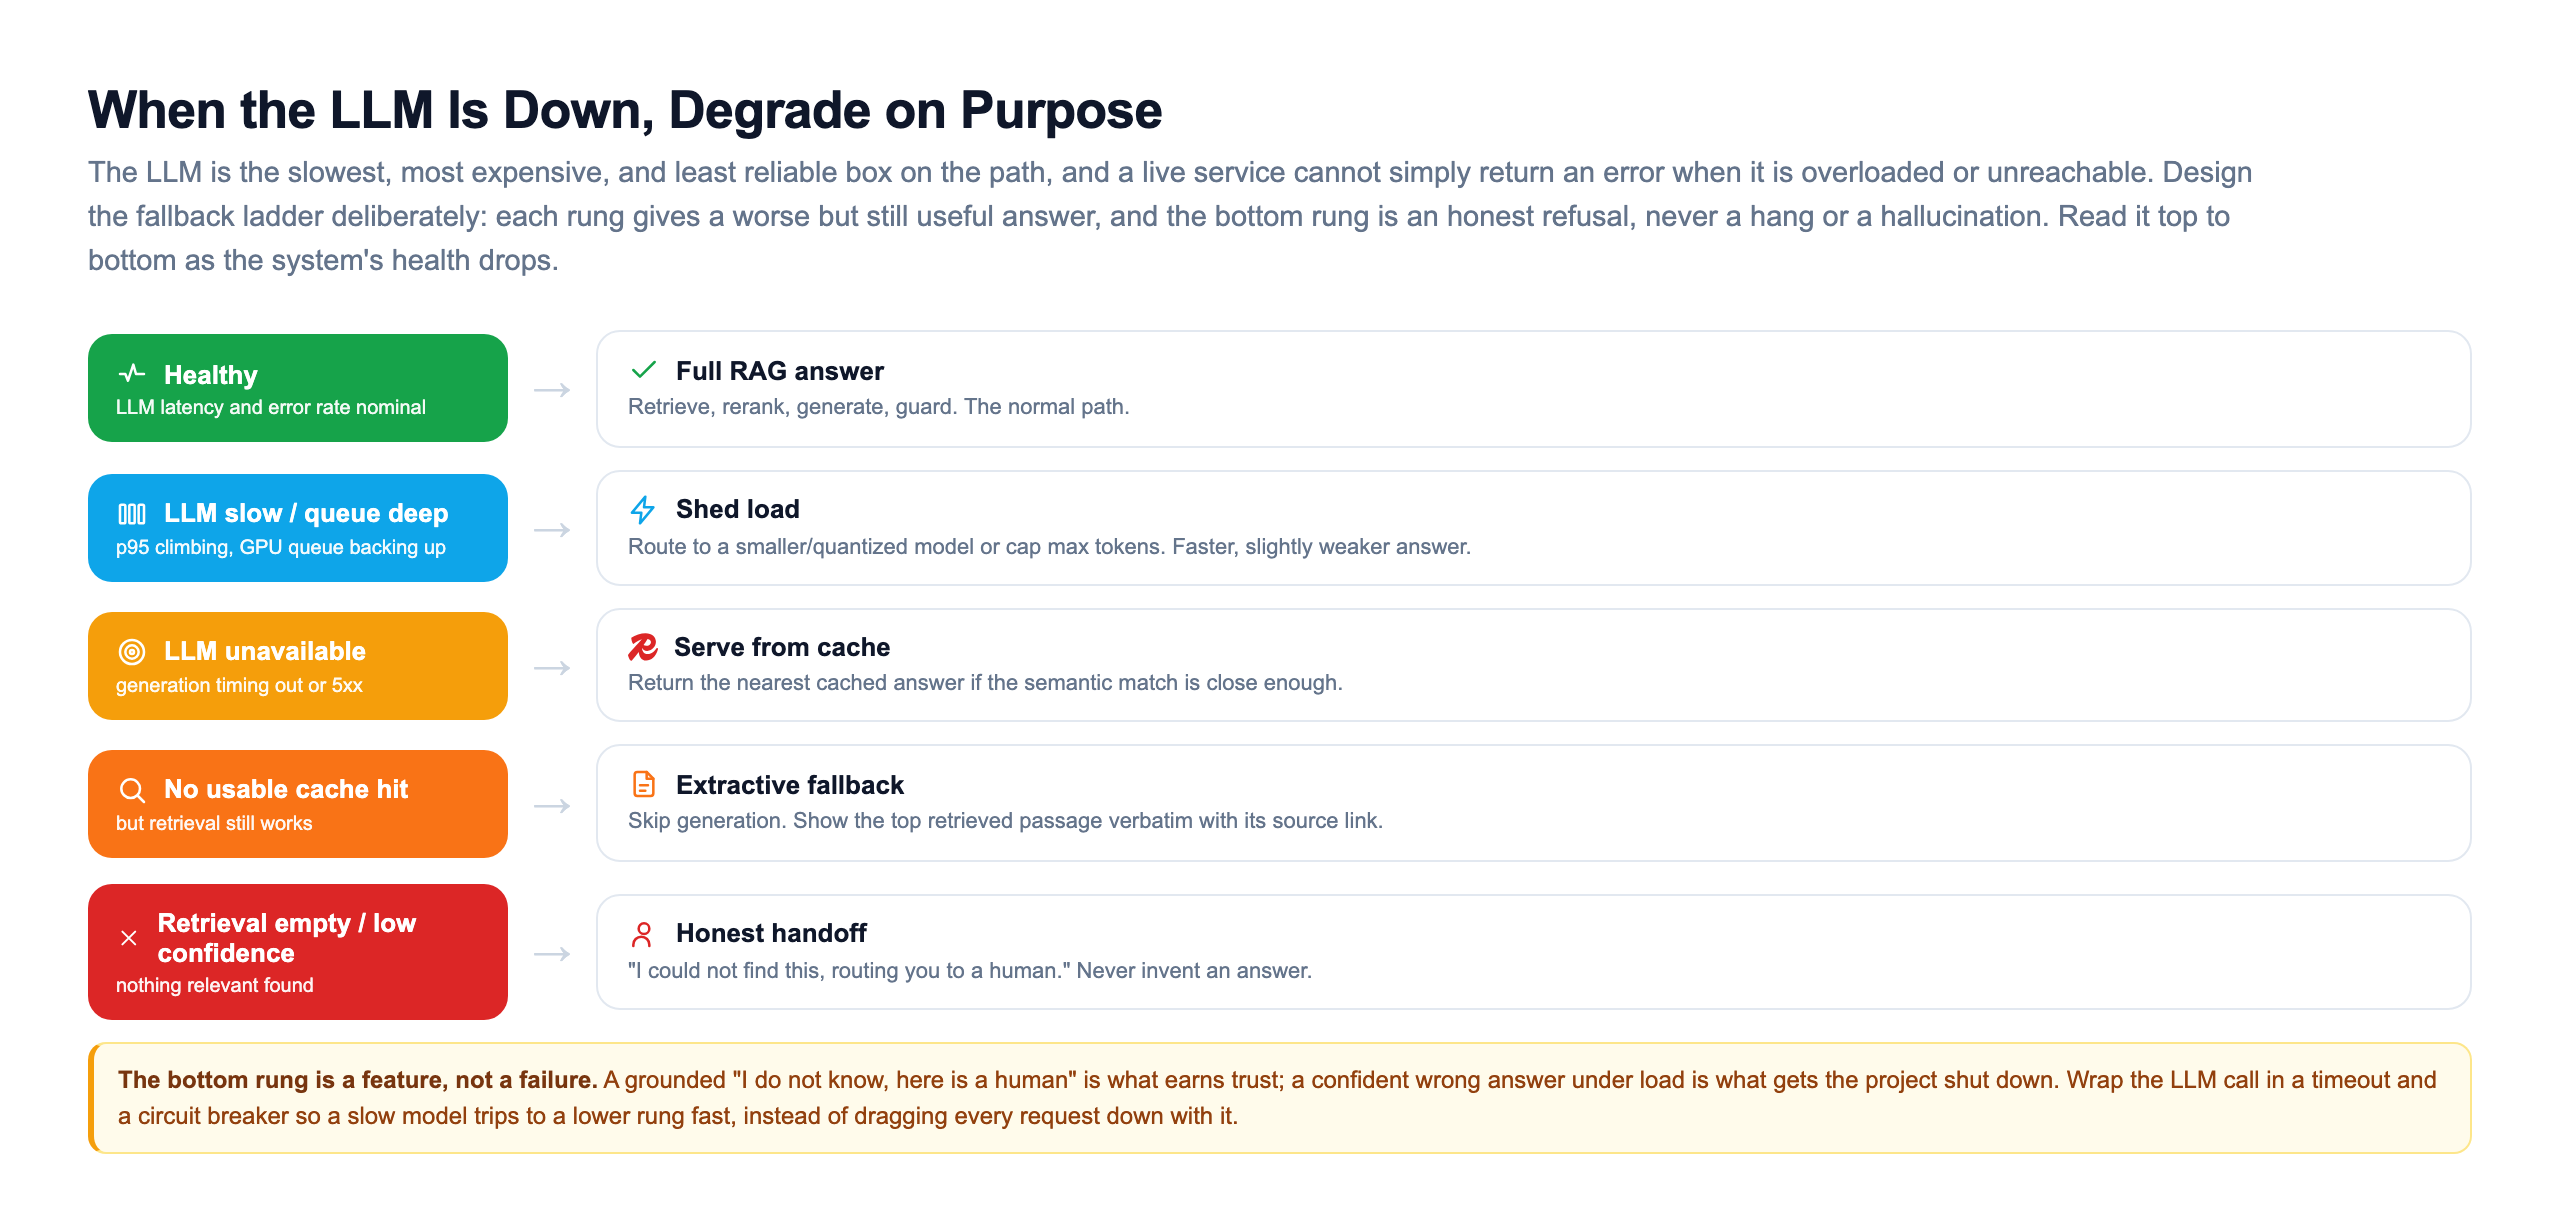
Read it as the system's health drops. When everything is healthy, serve the full grounded answer. When the model is slow and the queue is backing up, shed load: route to a smaller or quantized model, or cap the maximum answer length, trading a little quality for a lot of speed. When the model is unavailable entirely, fall back to the semantic cache and return the nearest close-enough answer. When there is no usable cache hit but retrieval still works, skip generation altogether and show the top retrieved passage verbatim with a link to its source, which is often genuinely helpful on its own. And when retrieval itself comes back empty or low-confidence, do the one thing that protects trust: say so, and route to a human.
That bottom rung is a feature, not a failure. A grounded "I could not find this, let me get a human" is exactly what makes people trust the system with real questions, while a confident wrong answer under load is what gets the whole project cancelled. To make the ladder actually fire, wrap the model call in a timeout and a , so a single slow or dead model trips quickly to a lower rung instead of dragging every waiting request down with it.
Watch the Quality, Then Guard Every Answer
A system degrades silently. Nobody files a ticket that says "retrieval recall dropped four points last week"; they just quietly stop trusting the bot. Because no human can eyeball a thousand answers a day, you close the loop with monitoring: log every answer with its evidence, score a sample offline, alert on regressions, and act on the specific metric that moved.
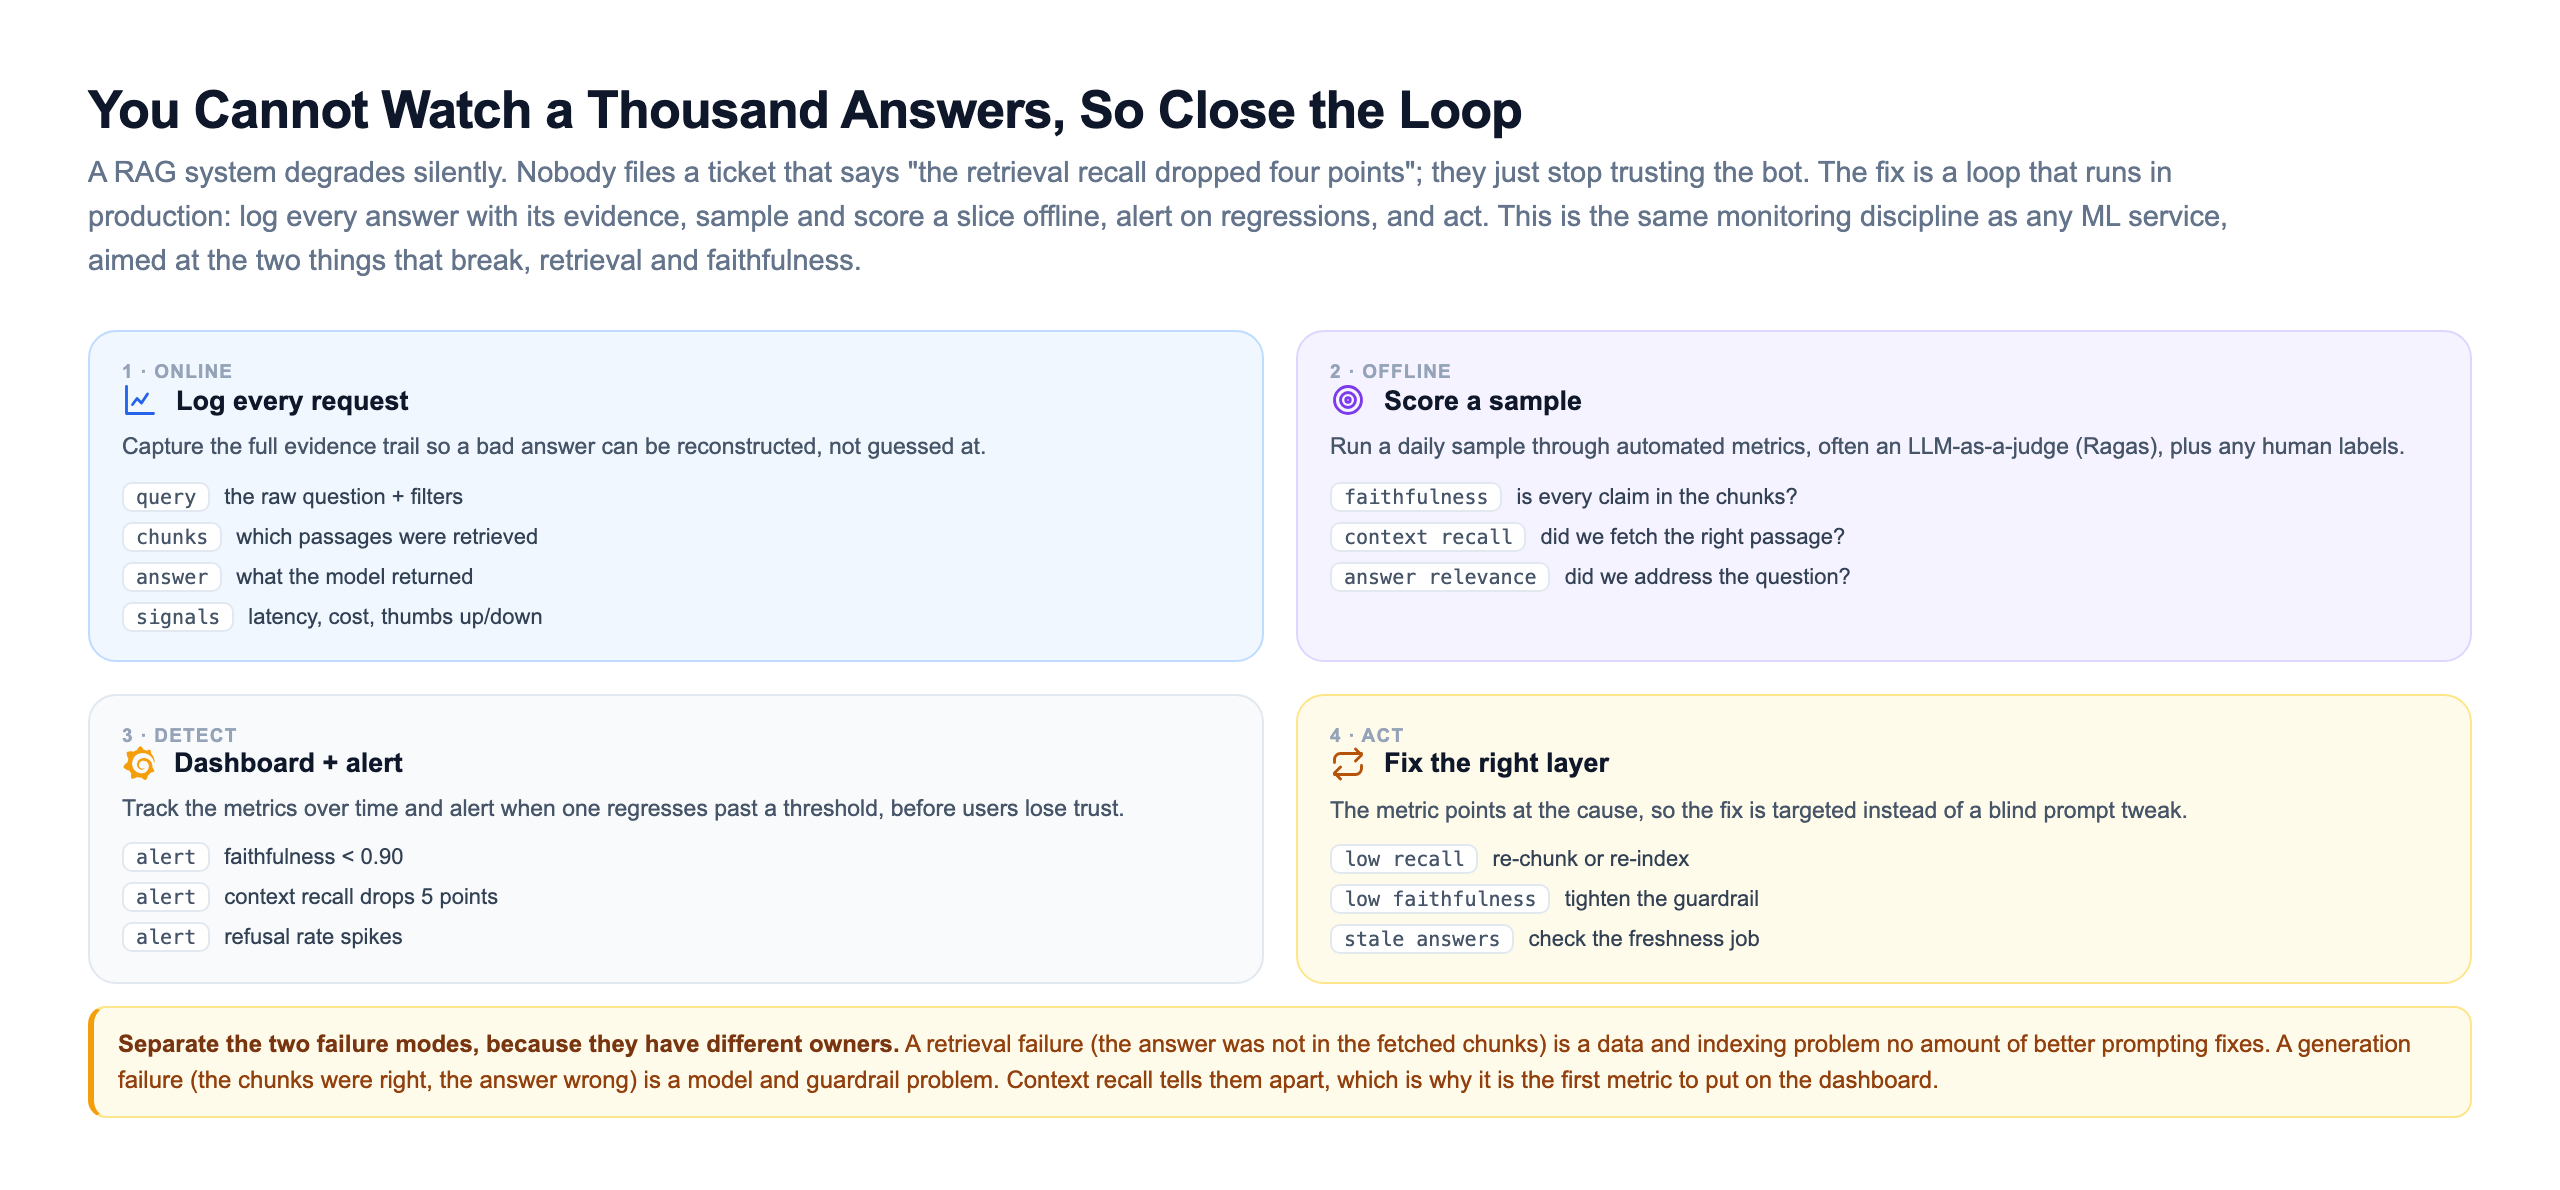
The most important discipline here is separating the two failure modes, because they have different owners and different fixes. A retrieval failure means the answer was never in the passages you fetched, which is a data and indexing problem that no amount of better prompting can fix. A generation failure means the passages were right but the answer was wrong, which is a model and guardrail problem. Context recall is the metric that tells them apart, which is why it is the first thing on the dashboard. Aim the fix at the layer the metric points to: re-chunk or re-index for low recall, tighten the guardrail for low faithfulness, check the freshness job for stale answers.
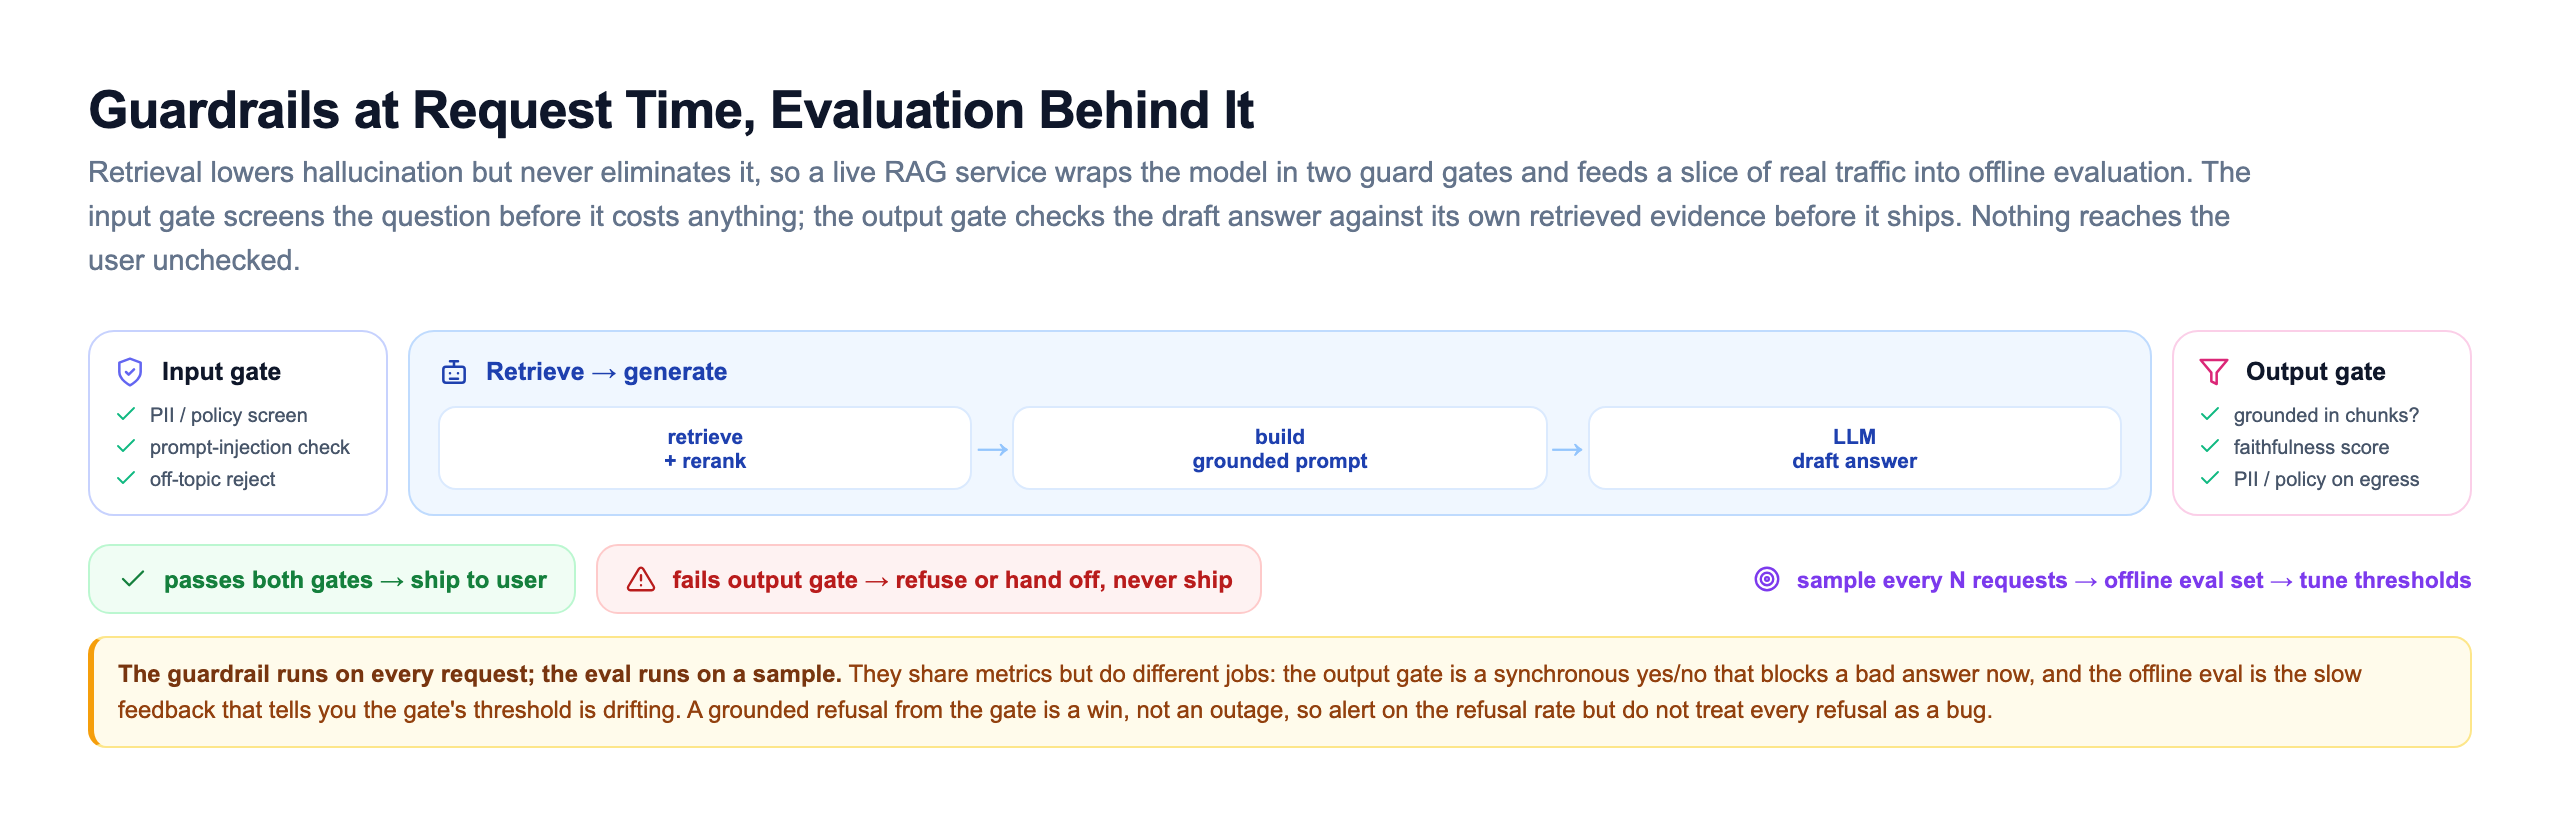
Monitoring tells you when quality has drifted; the guardrail stops a bad answer from shipping in the first place. Retrieval lowers but never eliminates it, so a live service wraps the model in two gates and feeds a slice of traffic into the offline evaluation above.
Give the Budget a Number, Then Split It
"Fast enough" is not something you can page an engineer about at three in the morning. A service level objective is: a specific percentile you commit to and alert on. Pick the number the product actually needs, then divide it into a per-stage budget with real headroom left over, so every stage has a ceiling and every regression has an owner.
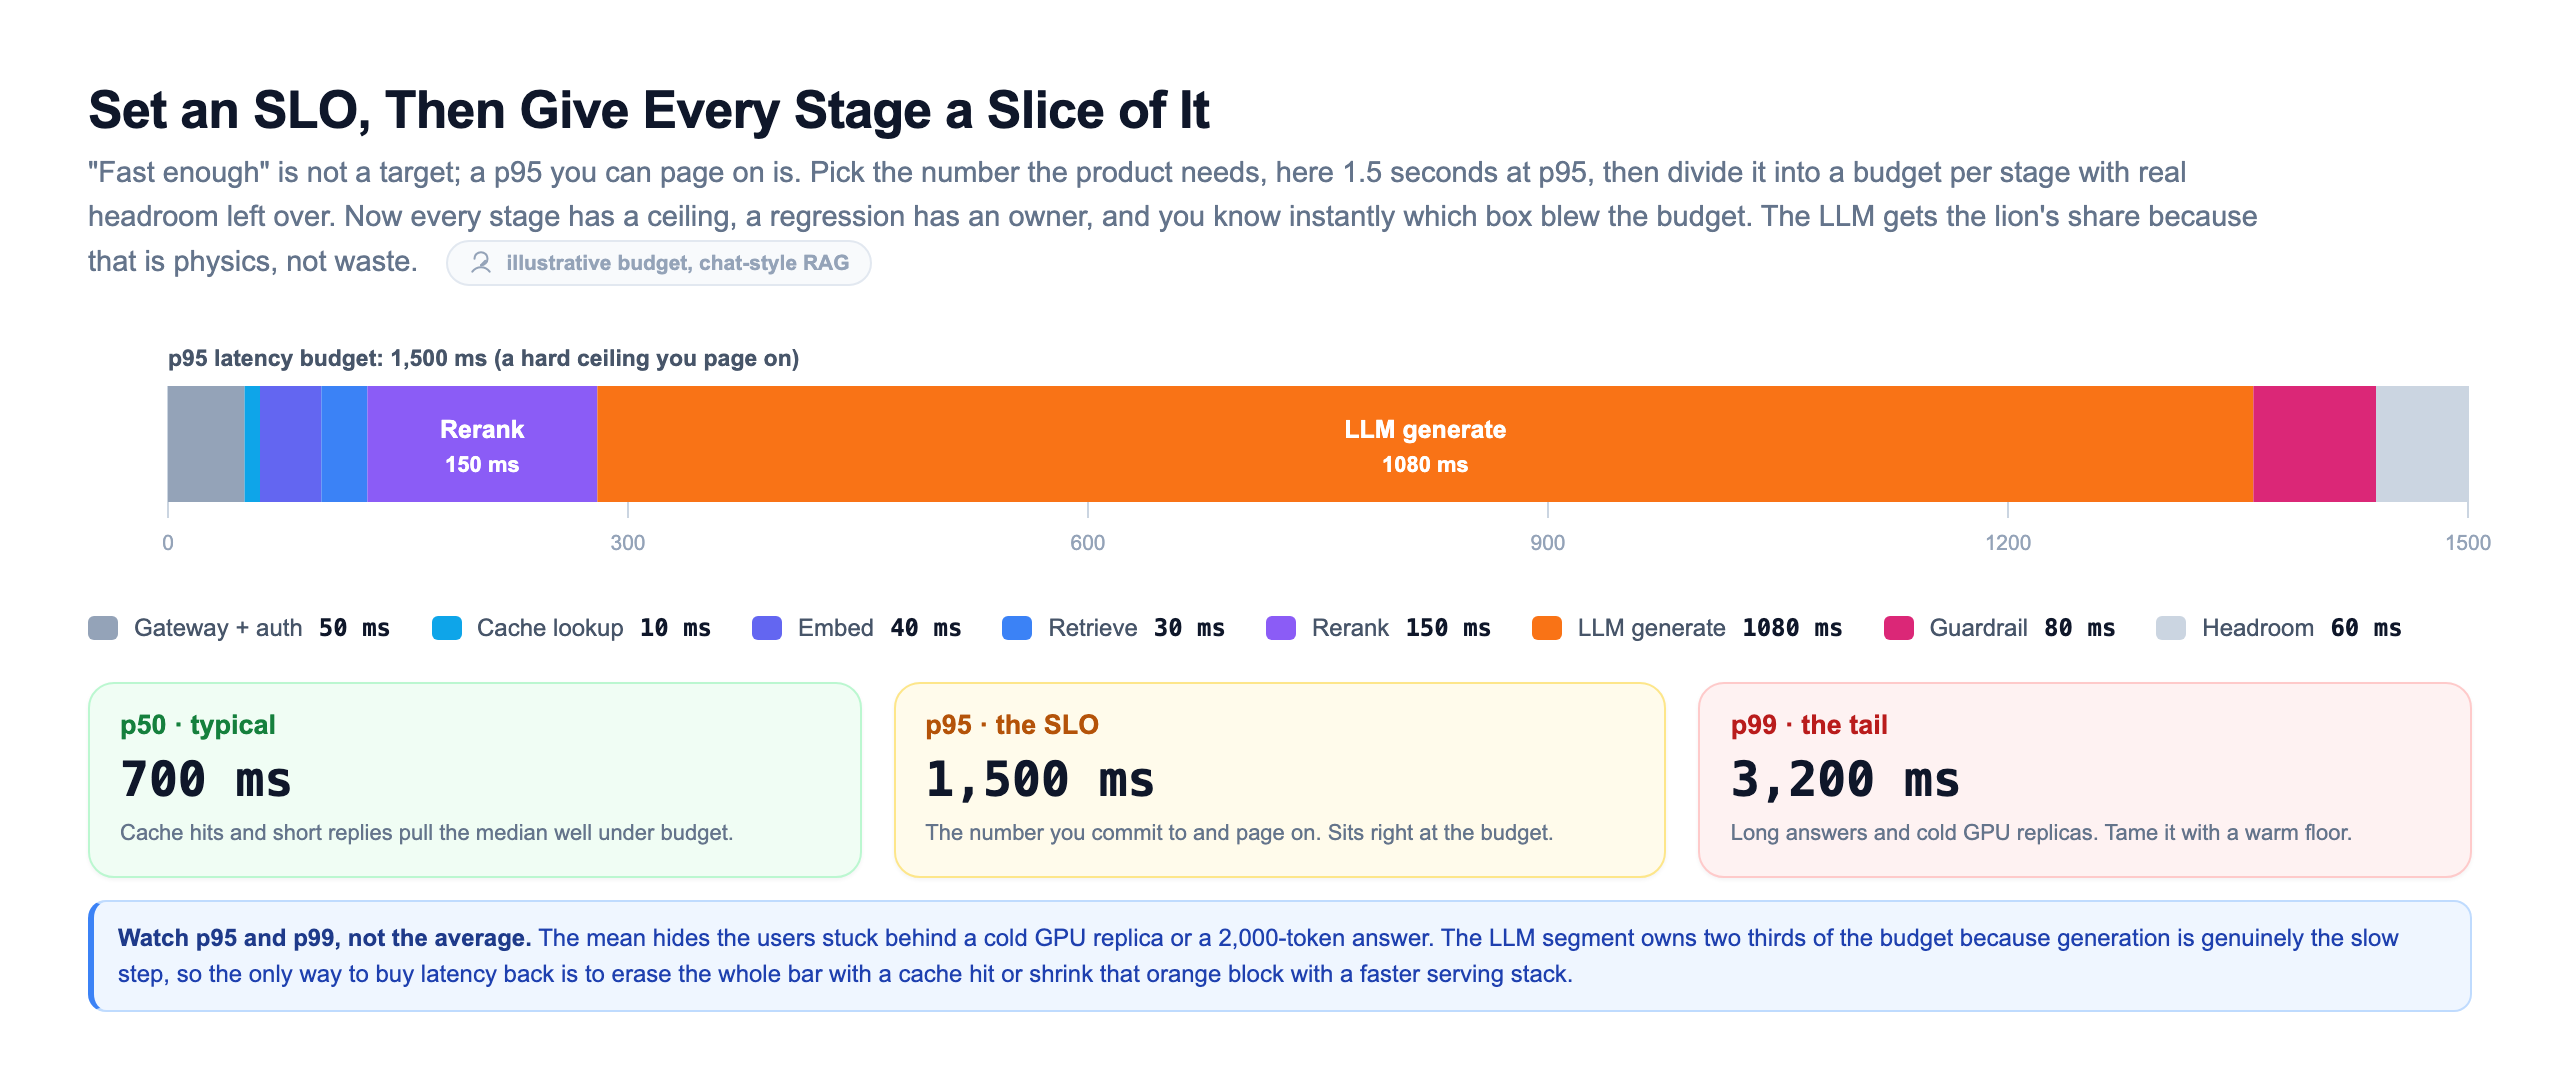
Two things about this budget are worth internalizing. First, the language model owns roughly two thirds of it, and that is physics, not waste; generation is genuinely the slow step, so the budget honestly reflects it. Second, you watch the percentiles, not the average. The mean is a comforting lie that hides the users stuck behind a cold GPU replica or a two-thousand-token answer. The median is low because cache hits and short replies pull it down, but the tail is where the model's variance lives, and the tail is what makes users distrust the service. Budget for the tail, set your alert on the percentile, and keep a warm floor of GPU replicas so a p99 request is not waiting a full minute for a model to load. The only way to buy latency back against this budget is the same pair of levers as everything else: erase the whole bar with a cache hit, or shrink the model's block with a faster serving stack.
The Seven Things You Actually Operate
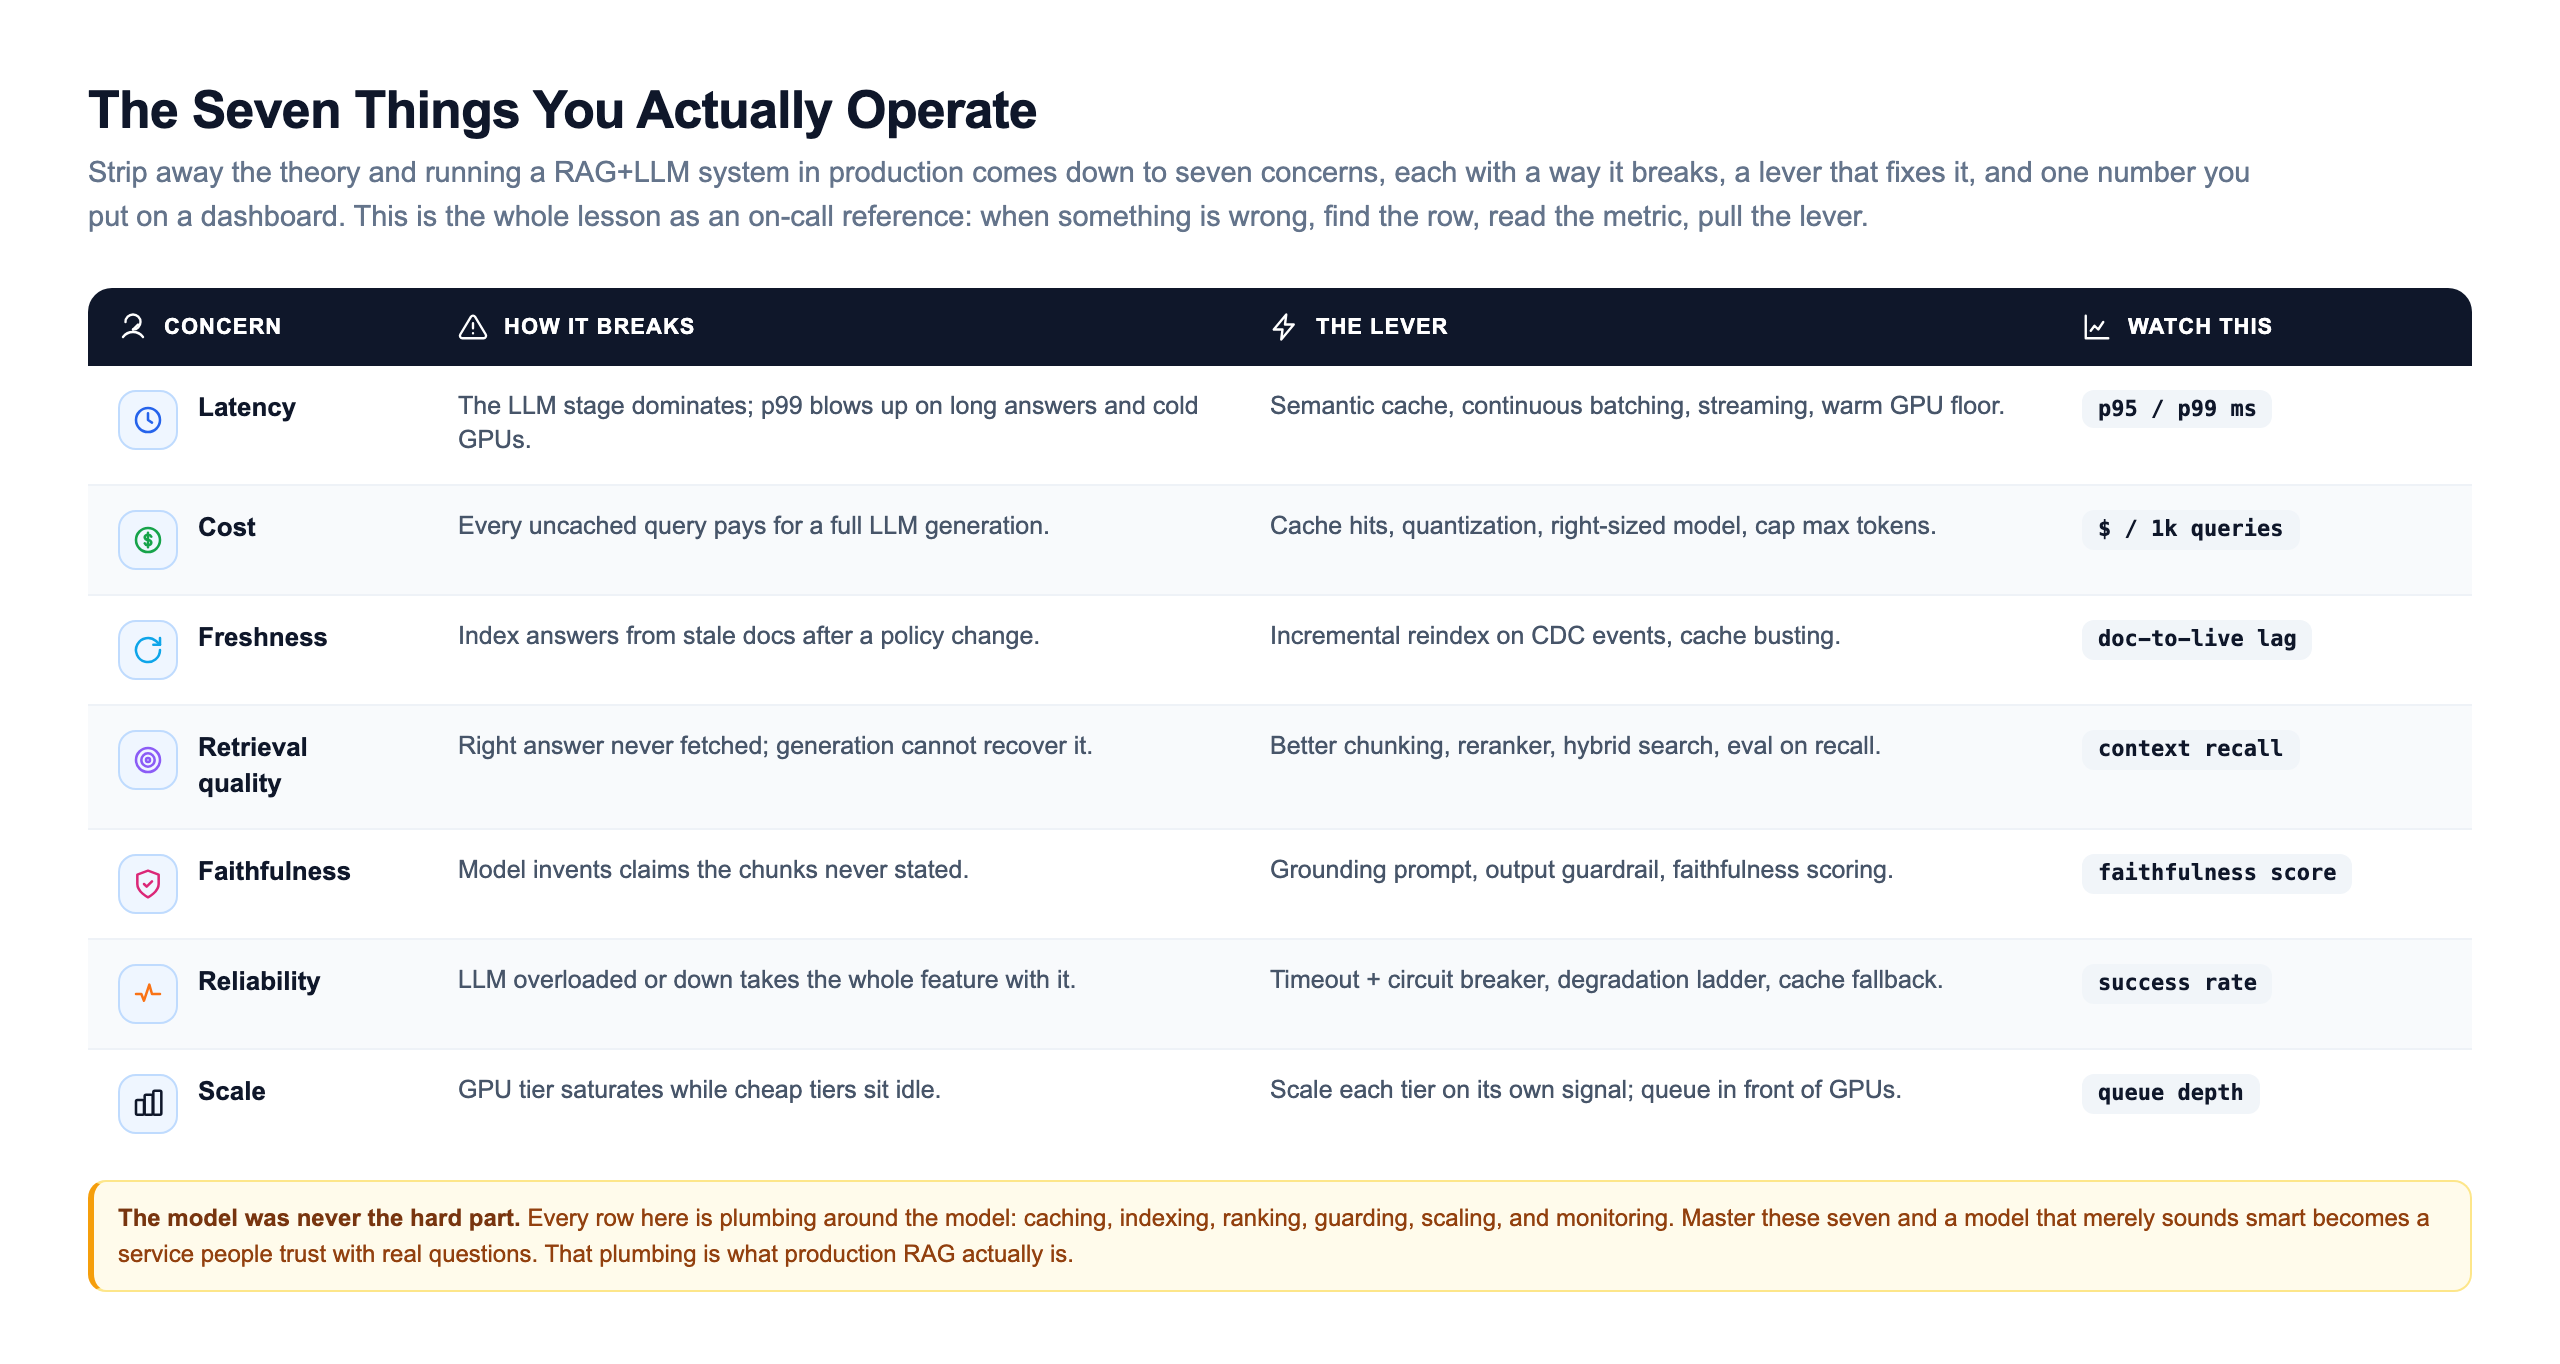
Strip away the theory and running a plus LLM system in production comes down to seven concerns. Each one has a characteristic way it breaks, a lever that fixes it, and one number you put on a dashboard. This is the whole lesson compressed into an on-call reference card: when something is wrong, find the row, read the metric, pull the lever.
This is not hypothetical. DoorDash built an internal support chatbot on exactly this pattern, and their public engineering writeups describe the same skeleton: retrieve relevant knowledge-base articles, feed them to the model as context, and then run a separate quality-check stage that judges whether the generated response is supported and on-policy before it reaches the customer. That quality-check stage is the output guardrail from two slides back, doing faithfulness and relevance checks so a hallucinated answer never ships. The broader industry has converged on the same shape. Notion AI, Perplexity, and countless internal enterprise assistants are retrieve-then-generate systems underneath, differing mostly in how aggressively they cache, how they degrade, and how tightly they monitor and guardrail. The building blocks, and the seven concerns you operate them under, are the standard.
The lesson to carry out is the same one that runs through this whole track. The model was never the hard part. Every row in that table is plumbing around the model: , indexing, ranking, guarding, scaling, and monitoring. Master those seven and a model that merely sounds smart becomes a service people trust with real questions. That plumbing is what production RAG actually is.
Knowledge Check
Knowledge Check
4 questions - Score 80% to pass
In a production RAG request, which stage dominates both latency and cost, and what are the two highest-leverage ways to reduce it?
Why must a production RAG system treat incremental reindexing and a full re-embed as two different jobs?
The LLM server is overloaded and generation is timing out. What is the correct production behavior?
Which metric best distinguishes a retrieval failure from a generation failure in a RAG system, and why does that distinction matter?