The $40,000 Bill for a Model Nobody Was Using at 3 AM
A team ships a language model behind a chat feature. It works. is fine. Everyone moves on. A month later finance forwards the cloud bill with a note that just says "what is this." The line item is a fleet of GPU instances running twenty-four hours a day, seven days a week, at a few dollars per GPU per hour. Do that math on eight cards and you clear forty thousand dollars in a month, most of it spent at 3 AM when the product had almost no traffic and every one of those GPUs sat nearly idle.
This is the story that makes ML platform engineers care about scaling. A CPU web service that is over-provisioned wastes cents. A GPU service that is over-provisioned wastes a fortune, because the hardware is an order of magnitude more expensive and it does not get cheaper when it is idle. An H100 costs the same per hour whether it is running at 95 percent or 5 percent. That single asymmetry, a flat hourly cost paired with spiky demand, is the entire reason this lesson exists.
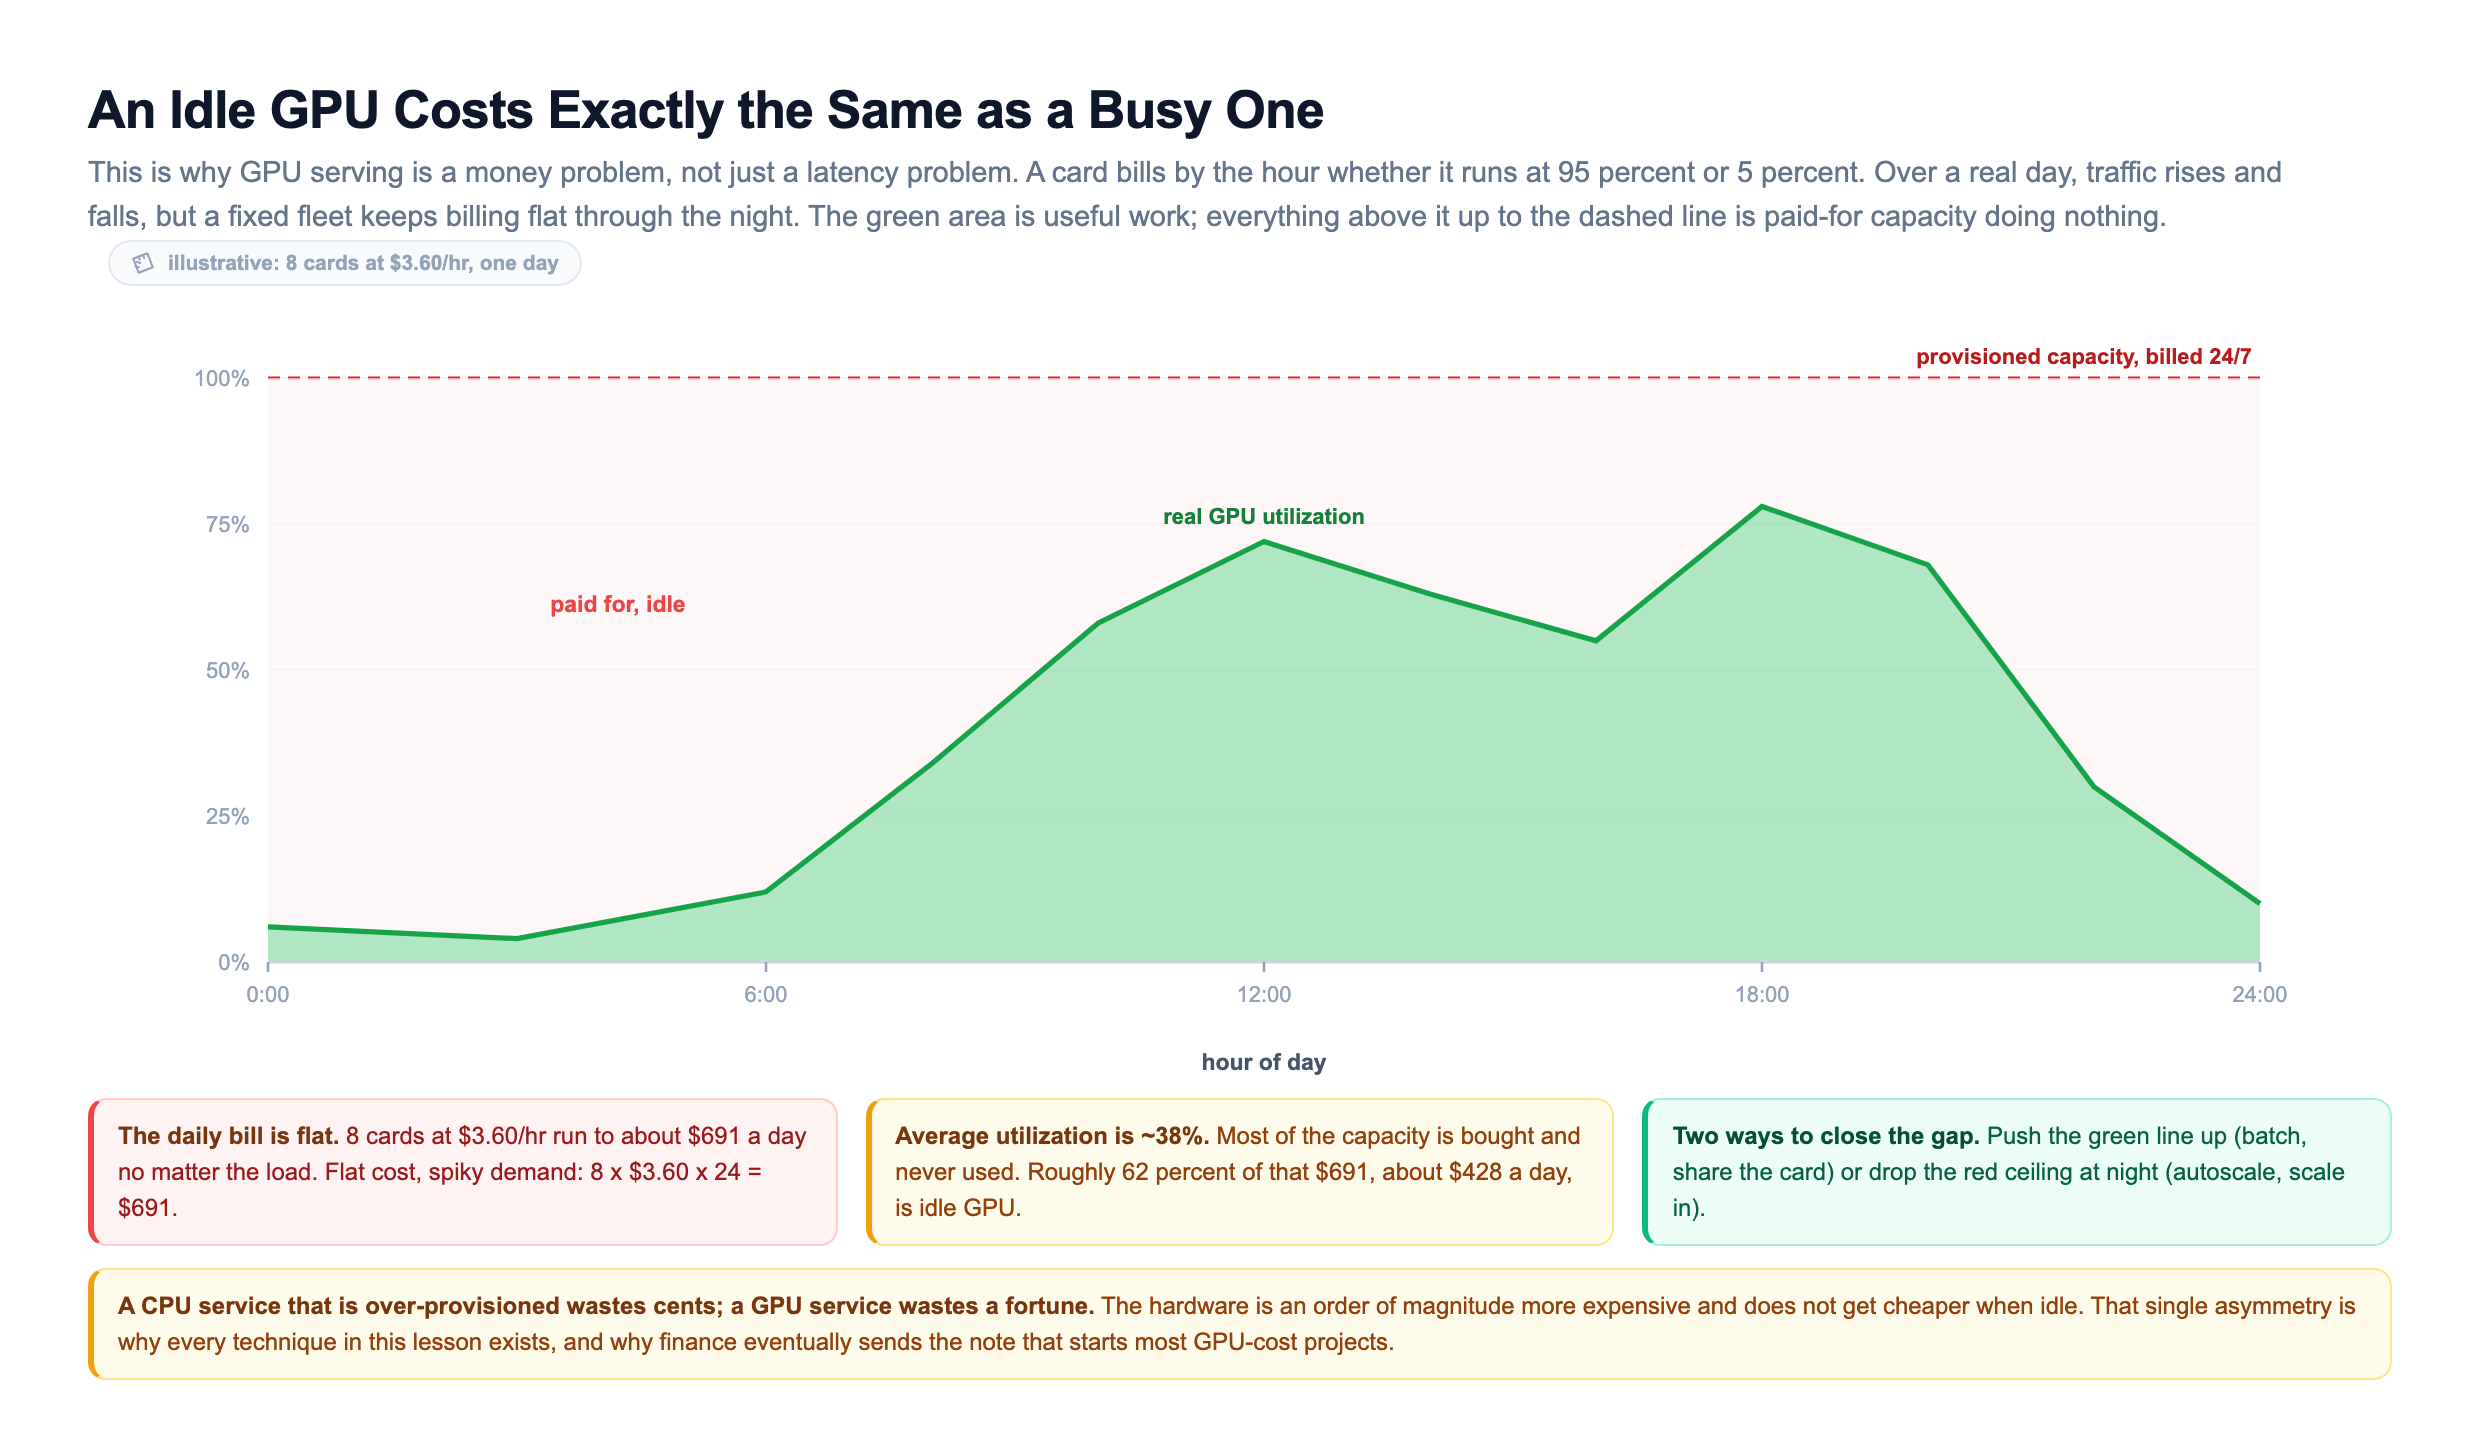
So the goal of this lesson is money, framed as engineering. You want to serve every real request fast enough, and pay for as little idle GPU as you can get away with. Everything that follows is one of two moves: push more requests through each expensive card, or run fewer cards when nobody is knocking. Keep those two levers in mind, because every technique in this lesson pulls on one of them.
Why GPUs, and the One Rule That Governs Everything
First, why a GPU at all. A CPU has a handful of powerful cores built to run one thing quickly. A GPU has thousands of small cores built to run the same operation across huge batches of numbers at once. A neural network is, underneath, a pile of matrix multiplications, which is exactly that kind of work. So a GPU can run a model tens to hundreds of times faster than a CPU. For anything bigger than a small model, GPU serving is not a luxury, it is the only way to hit a reasonable . But to scale a thing you have to know what it is made of, and two parts of a GPU set every limit that follows.
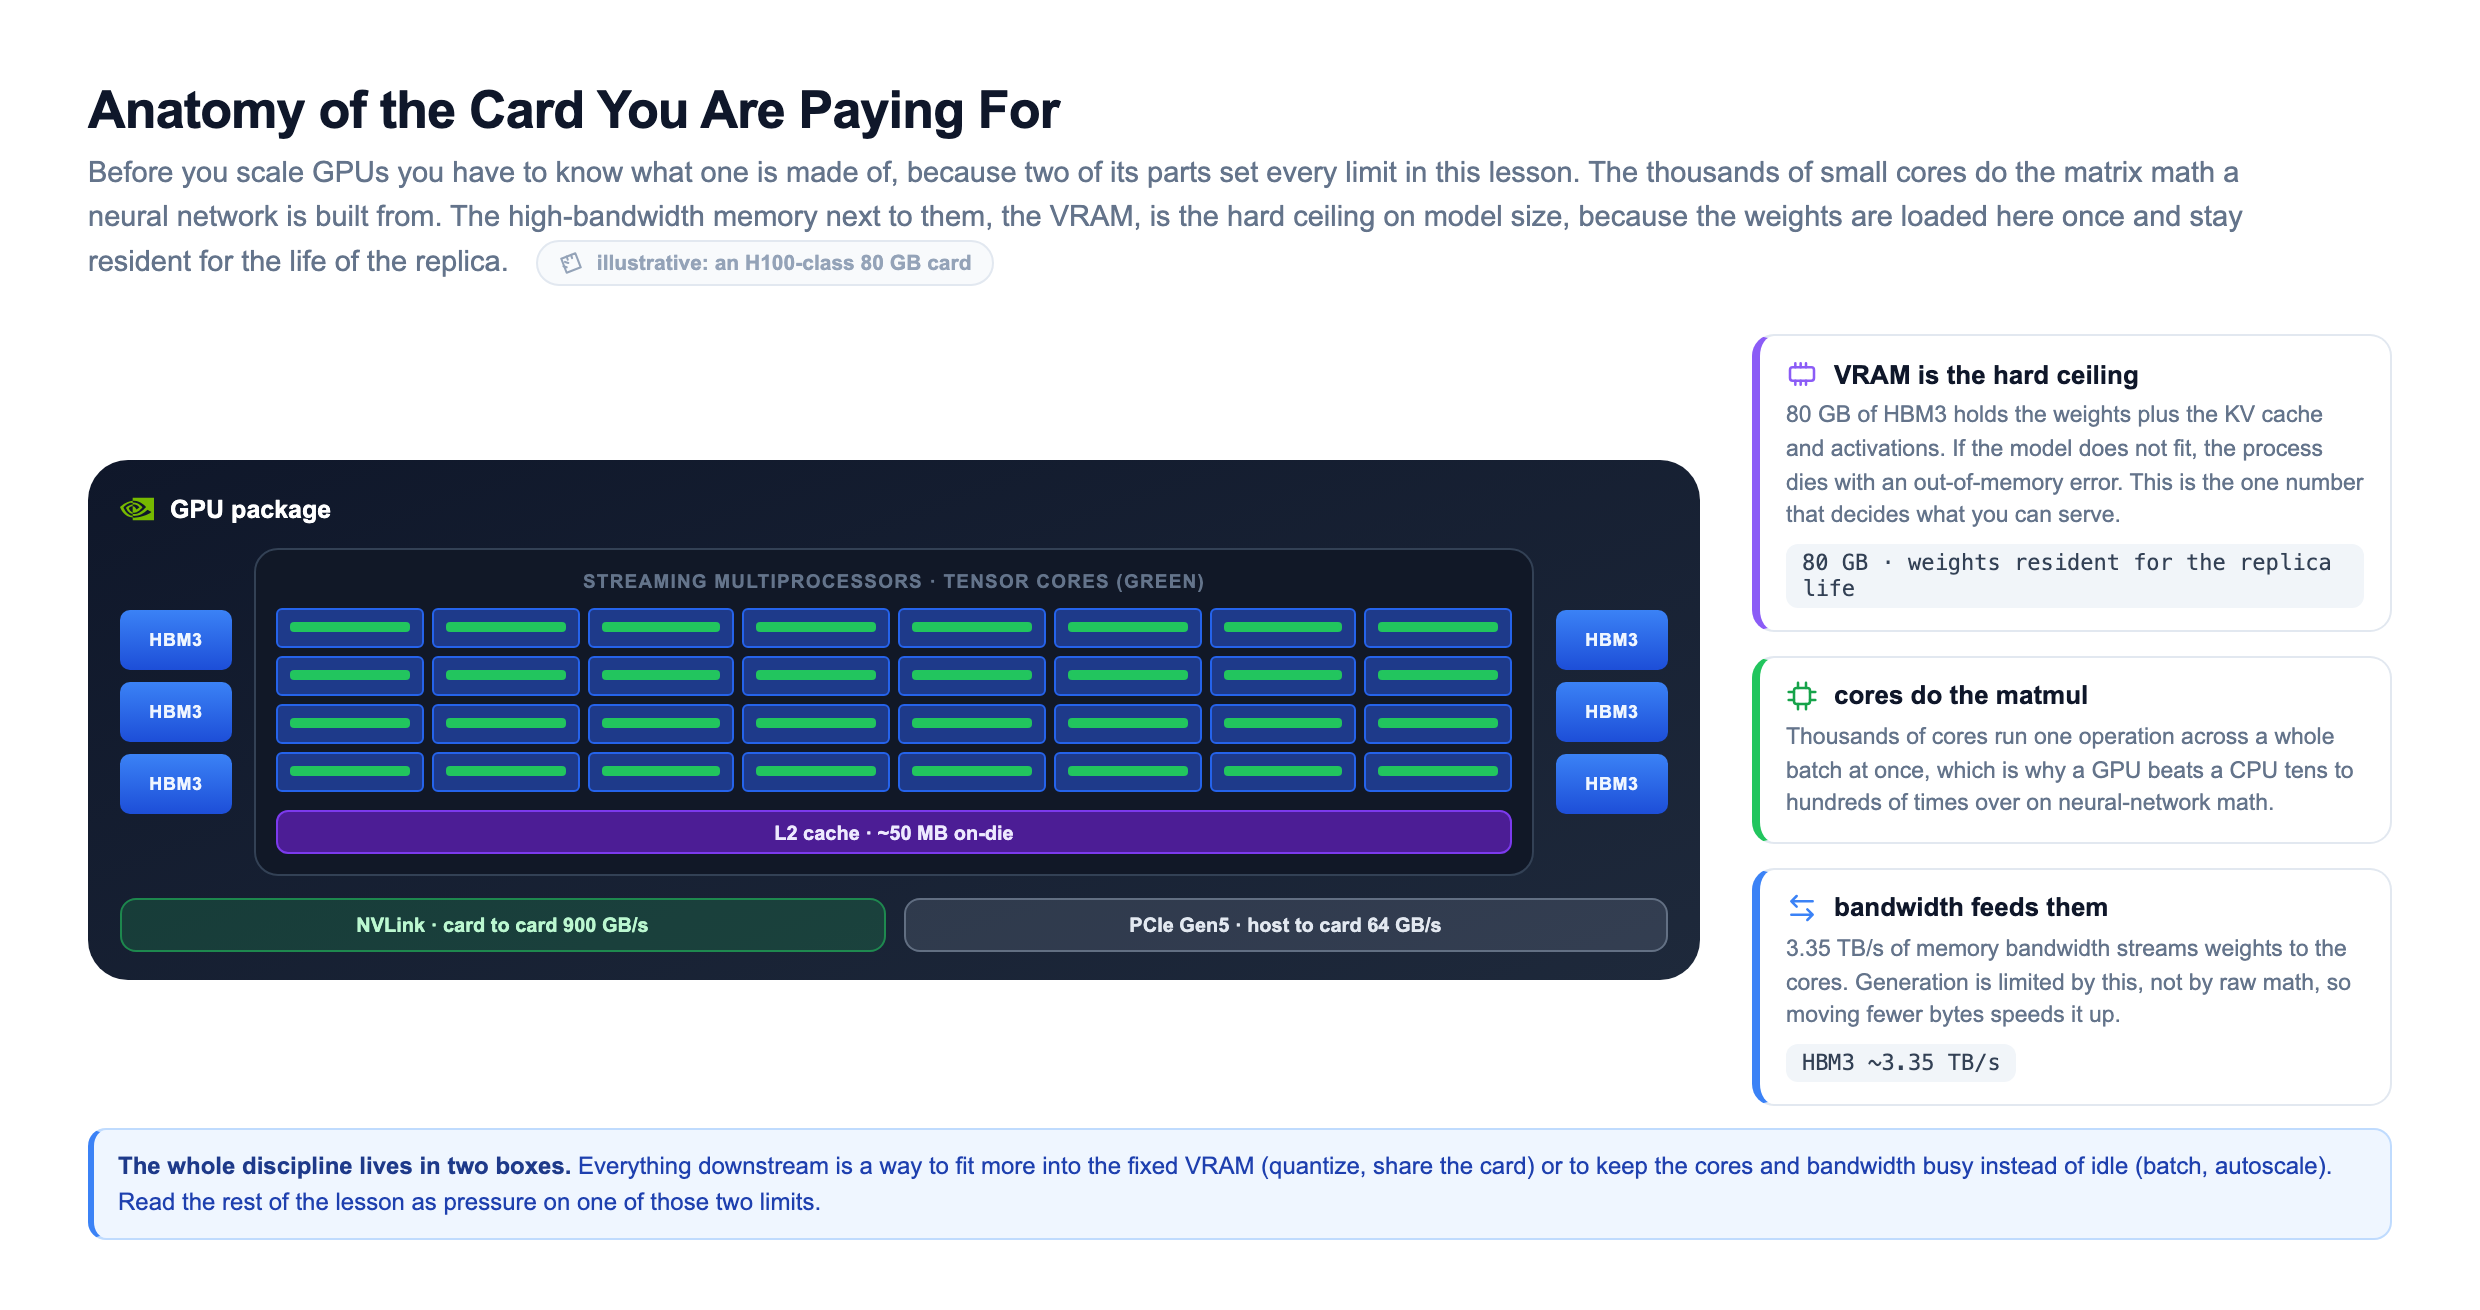
Now the one rule that governs all of GPU serving:
The model's weights must fit in the GPU's memory (VRAM), and they stay resident there for the life of the replica.
Which raises a question worth settling before you plan anything against it: how much memory does the card actually have? The product page is not the answer.
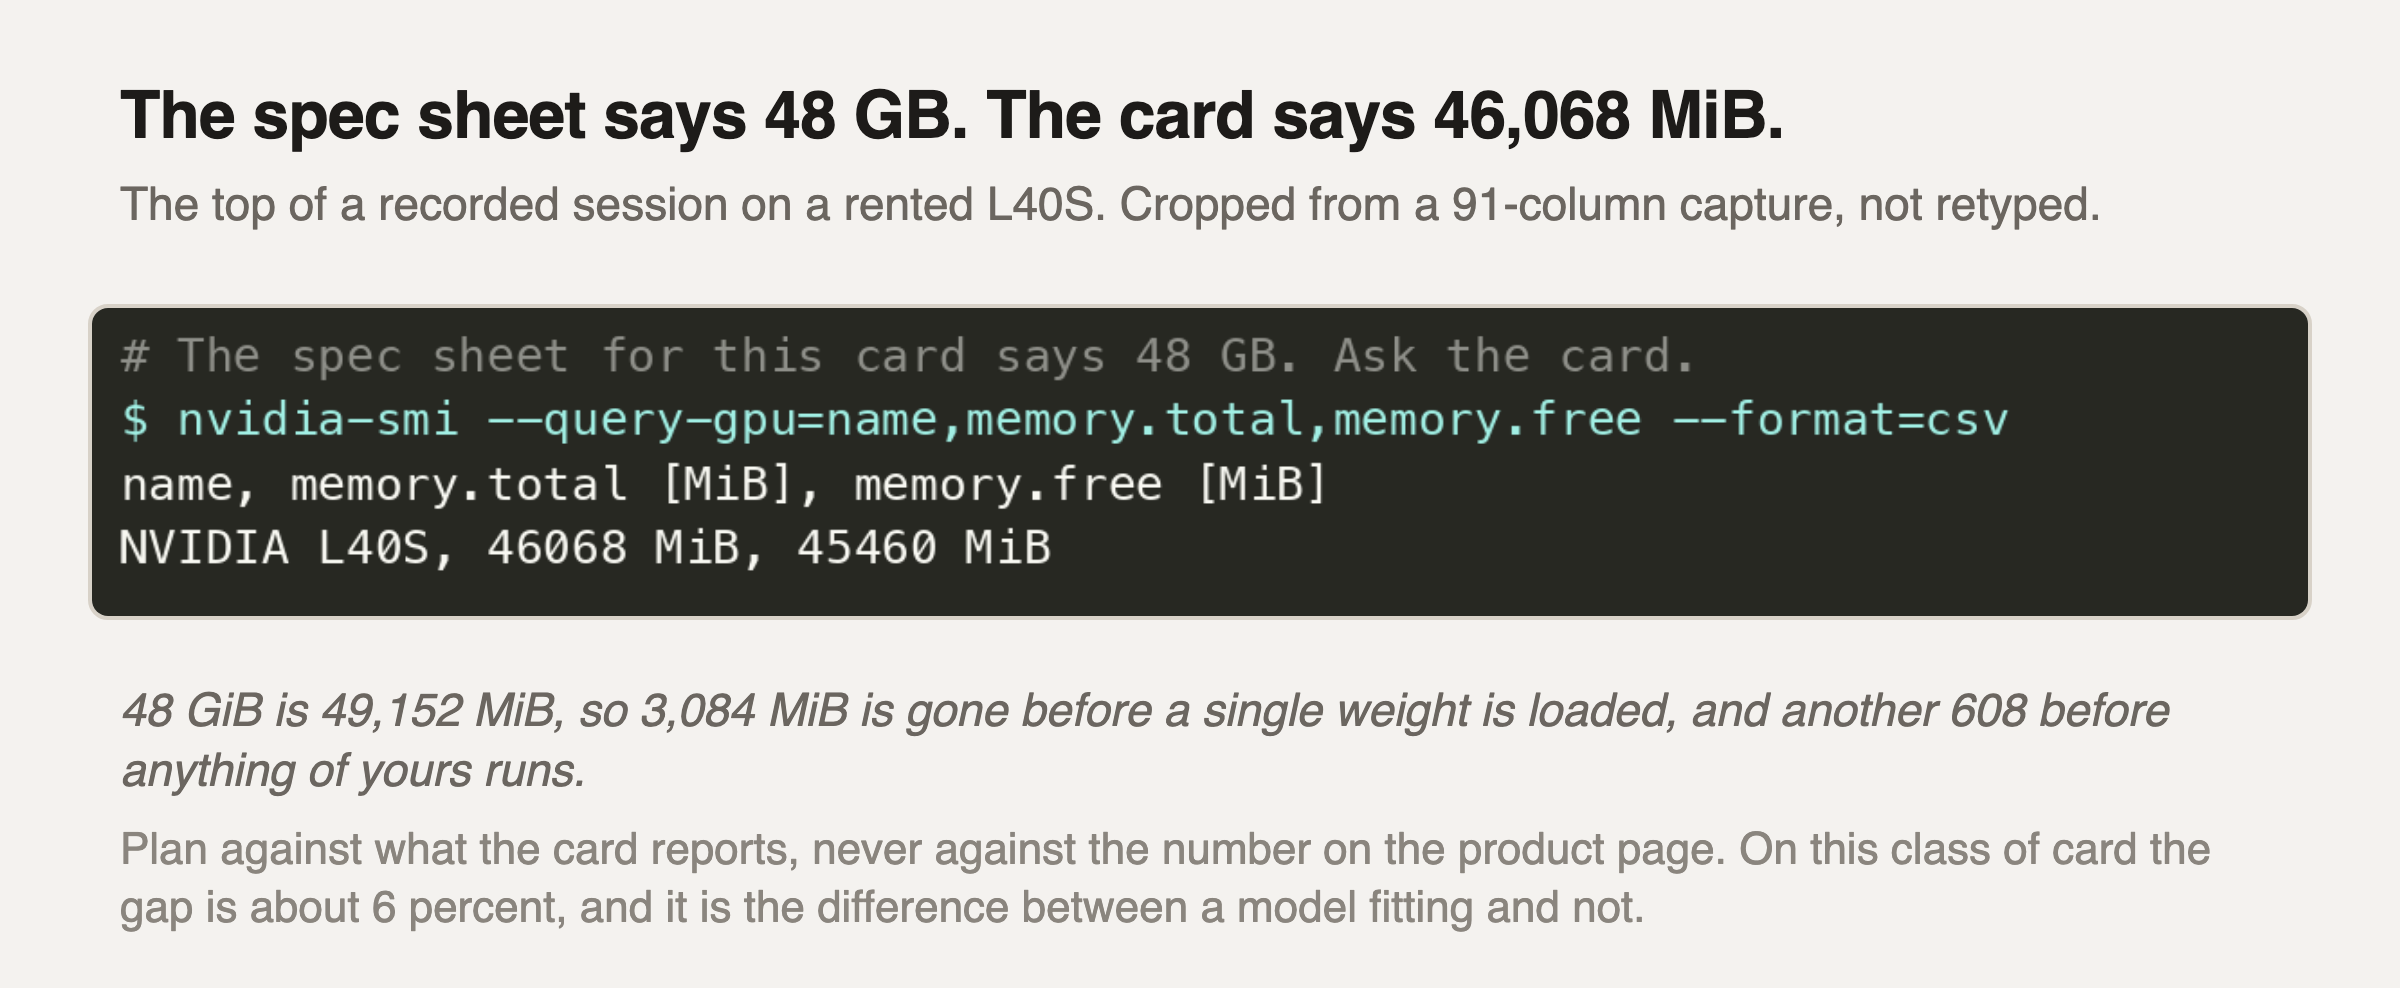
The card is sold as 48 GB. Forty eight gibibytes is 49,152 MiB, and this one reports 46,068. Three thousand and eighty four mebibytes are gone before you load anything, and a further 608 are taken by the driver's own context before a single tensor of yours arrives.
Two practical consequences, and the second is the one that bites.
Your usable budget is about six percent smaller than the number in the procurement spreadsheet. On a model sized to leave a couple of gigabytes of headroom on paper, six percent is the whole headroom, and the failure mode is not a warning at deploy time. It is an out-of-memory crash partway through the first request that needs a slightly longer context than the last one.
And the shortfall is not a rounding error you can wave away, it is structural. This class of card runs error-correcting memory, which reserves a fixed fraction of every chip, so it is present on every card of the type and it is not a defect. It is also not universal: cards using a different memory generation report their nominal size exactly, so a rule you learned on one card does not transfer to another.
The habit that follows is short. Never size a deployment from a product page. Run one command on the actual instance type you intend to rent, read what the card reports, and plan against that number.
You do not stream a model in from disk per request. You load it into VRAM once, when the replica boots, and it lives there. That makes VRAM the hard limit on what you can serve. Every card has a fixed amount, and the model plus its working memory has to fit inside it.
Here is the sizing math you will use constantly. Weights take the number of parameters times the bytes per parameter:
| Model size | FP32 (4 bytes) | FP16 (2 bytes) | INT8 (1 byte) |
|---|---|---|---|
| 1B params | ~4 GB | ~2 GB | ~1 GB |
| 7B params | ~28 GB | ~14 GB | ~7 GB |
| 13B params | ~52 GB | ~26 GB | ~13 GB |
| 70B params | ~280 GB | ~140 GB | ~70 GB |
And that is only the weights. You also need room for activations and, for language models, the that grows with every token and every concurrent request. A 7B model in FP16 needs about 14 GB of weights, so on a 24 GB card you have roughly 10 GB left for everything else. Run out and the process dies with a CUDA out-of-memory error. This single constraint is why so much of GPU serving is about making the model smaller, and why the first question in any capacity discussion is always "does it fit."
Batching: The Cheapest Way to Make One GPU Do More
Before you buy more GPUs, you make each GPU do more work. A GPU running one request at a time leaves almost all of its thousands of cores idle, because the math for a single input barely fills them. The fix is dynamic batching: the server holds incoming requests for a tiny bounded window, gathers whatever arrives, and runs them all in a single forward pass. Because the card does the math in parallel, a batch of sixteen costs almost the same wall-clock time as a batch of one. This is the biggest cheap win in all of GPU serving, and you should turn it on before you touch anything else.
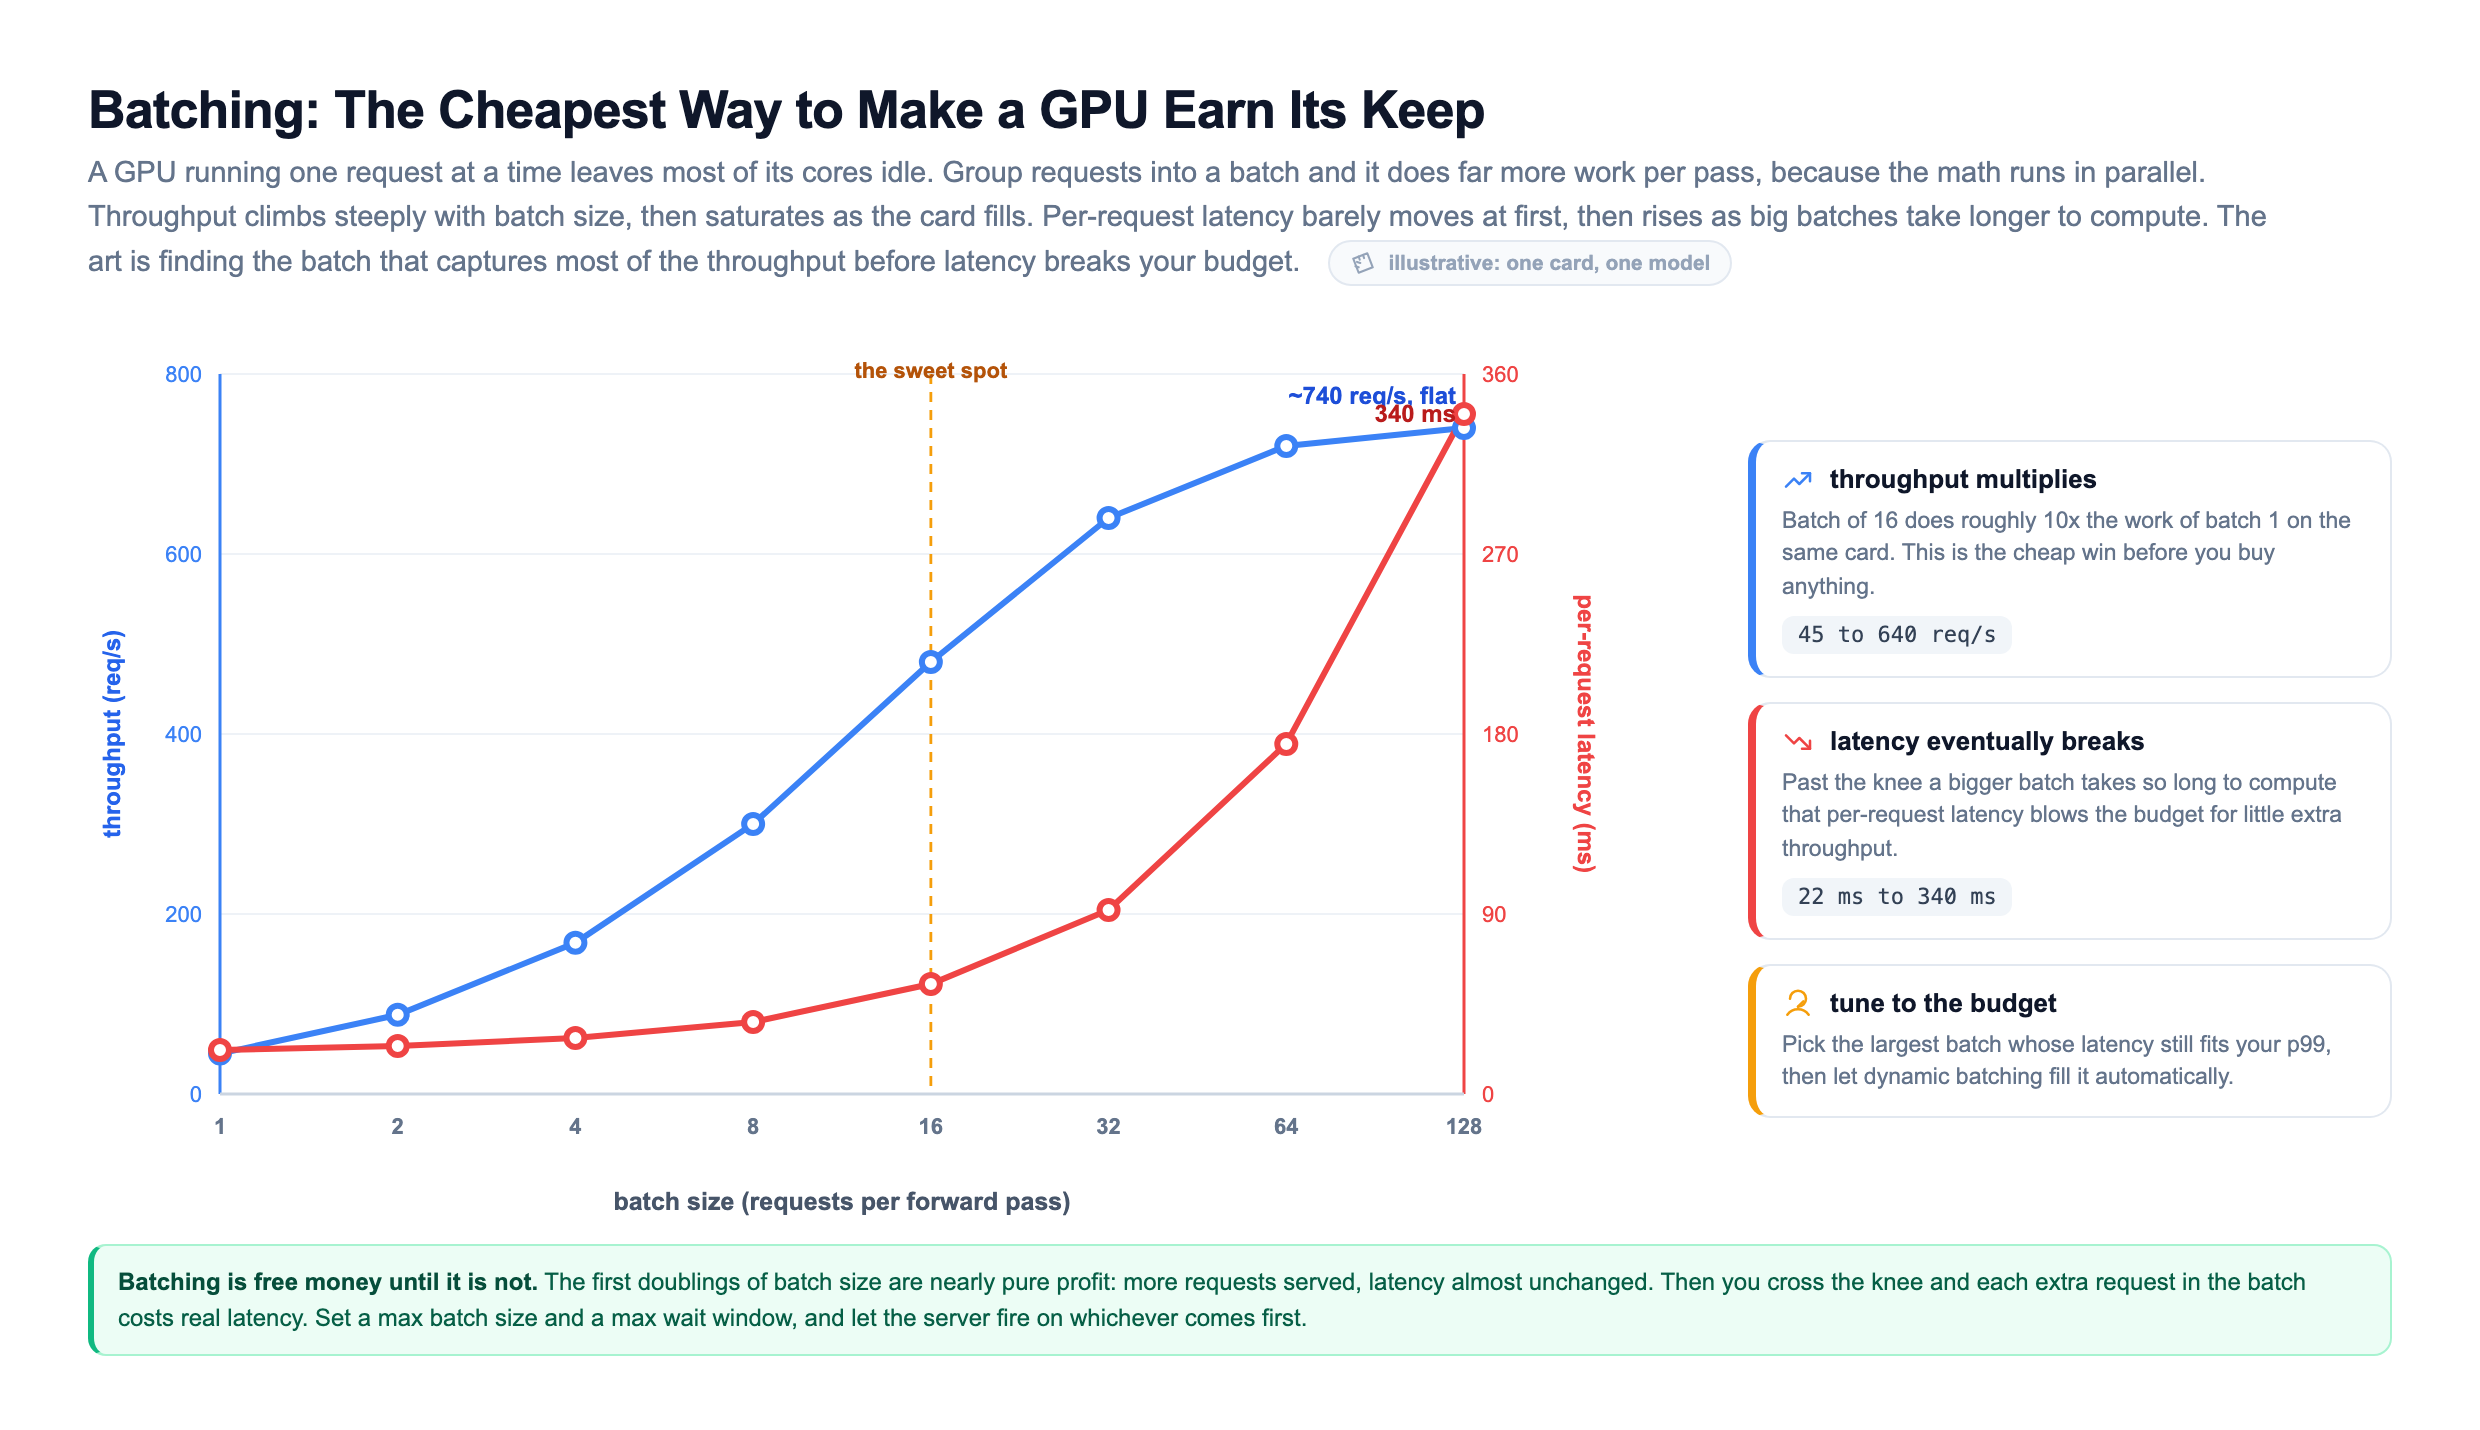
The chart shows why batching is free money right up until it is not. The first few doublings of batch size are nearly pure profit: many more requests served for almost no extra . Then you cross the knee, where a bigger batch takes so long to compute that per-request latency blows your budget while throughput barely improves. The craft is to pick the largest batch whose latency still fits your p99 target, then set a max batch size and a max wait window and let the server fire on whichever comes first.
Batching is only the first of several ways to get more out of one card. The others, roughly in order of return on effort, are: , storing the model's numbers in fewer bits so it both fits smaller and runs faster; distillation, training a small student model to imitate a big teacher so you can serve the student on a fraction of the hardware; and caching, putting a response cache in front of the GPUs so repeated inputs and shared prompt prefixes are answered in milliseconds without touching a card at all. A cache hit is the cheapest request there is, because it consumes zero GPU time.
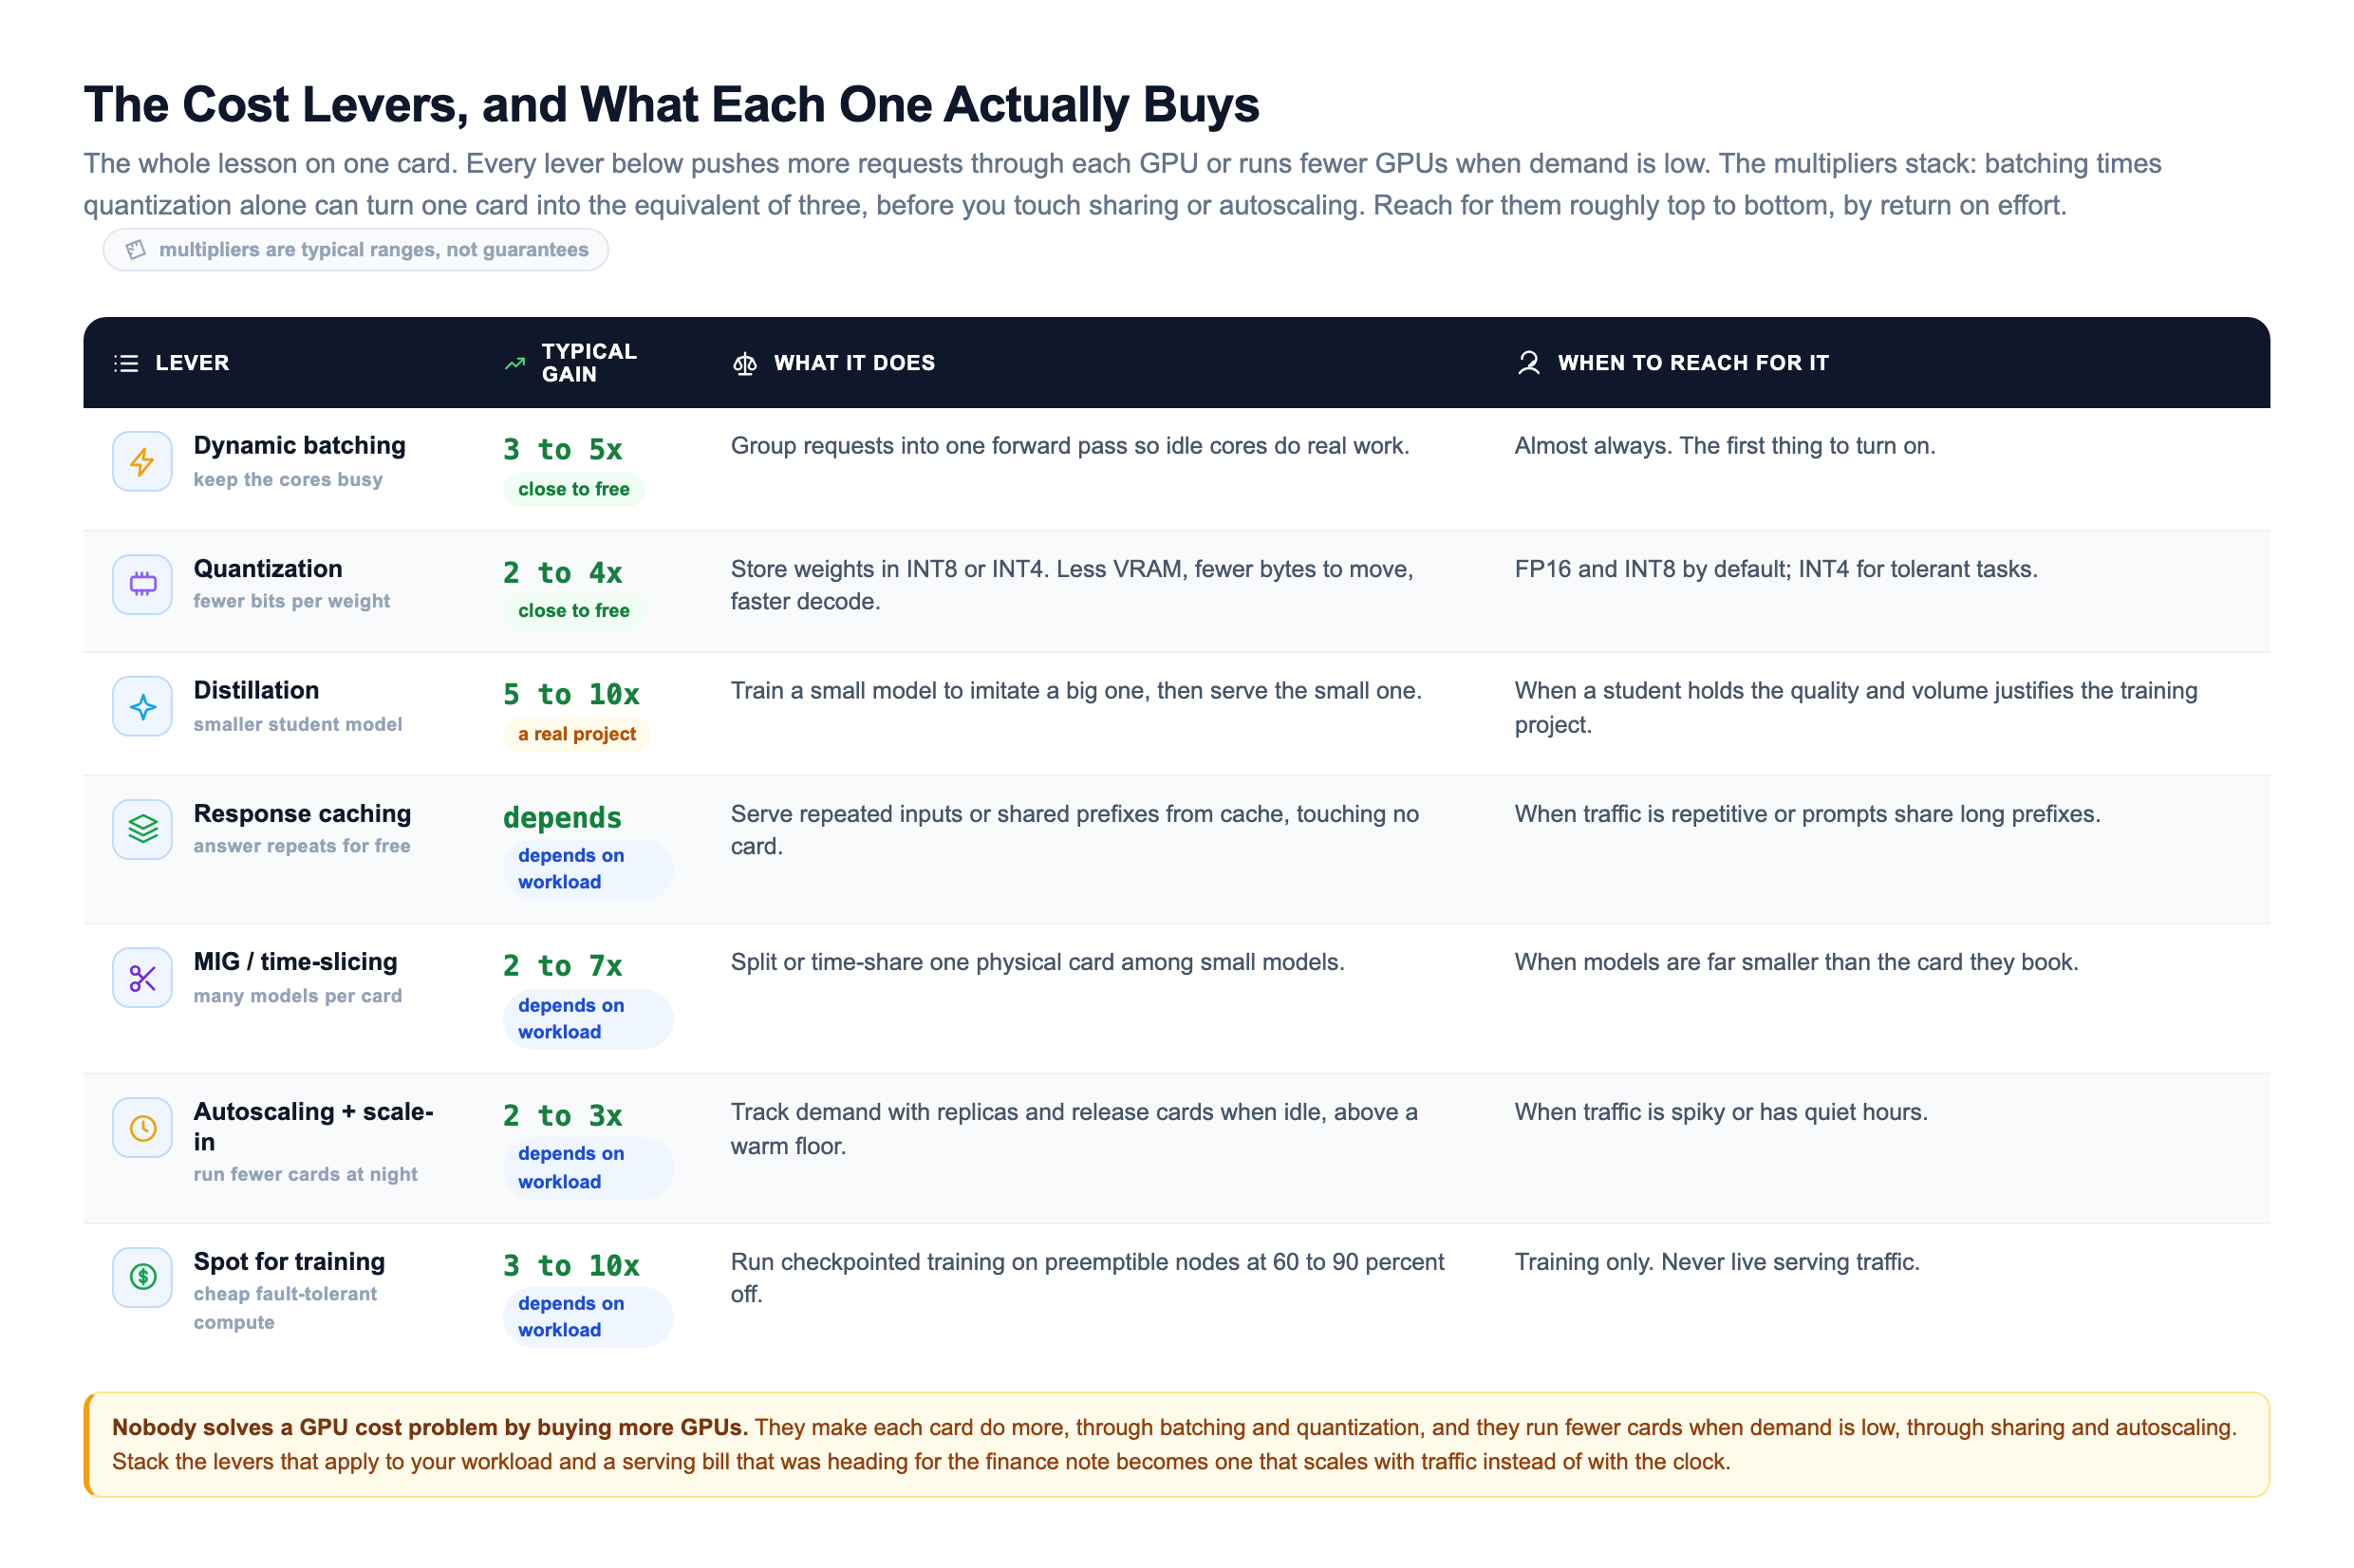
The order matters, and the multipliers stack. Batching and FP16 quantization are close to free and you should almost always do both, and together they can turn one card into the equivalent of three before you touch anything else. Distillation is a real project with training cost up front but permanent serving savings. depends entirely on how repetitive your traffic is. Stack the ones that apply to your workload and a single GPU can often do the work you thought needed three or four.
Telling Kubernetes to Give a Pod a GPU
None of this matters if the platform cannot even place your model on a GPU. On , a GPU is a countable resource, requested the same way you request CPU or memory. The catch is that a GPU cannot be fractionally shared by default: a pod either gets a whole card or it gets none. Here is a serving deployment that asks for one GPU, paired with an autoscaling policy driven by GPU load rather than CPU.
apiVersion: apps/v1
kind: Deployment
metadata:
  name: model-server
spec:
  replicas: 2
  template:
    spec:
      containers:
        - name: triton
          image: registry.internal/model-server:2026-07-11
          resources:
            limits:
              nvidia.com/gpu: 1        # one whole GPU per replica
              memory: "24Gi"
          readinessProbe:
            httpGet: { path: /v2/health/ready, port: 8000 }
            initialDelaySeconds: 120    # weights take time to load into VRAM
            periodSeconds: 5
---
# Scale on GPU load, not CPU. GPU work is invisible to CPU metrics.
apiVersion: keda.sh/v1alpha1
kind: ScaledObject
metadata:
  name: model-server-scaler
spec:
  scaleTargetRef:
    name: model-server
  minReplicaCount: 1                    # a warm floor to hide cold starts
  maxReplicaCount: 12                   # ceiling set by GPU quota + budget
  cooldownPeriod: 300                   # wait before scaling down
  triggers:
    - type: prometheus
      metadata:
        query: avg(DCGM_FI_DEV_GPU_UTIL)  # real GPU utilization
        threshold: "70"
Read the important lines. The nvidia.com/gpu: 1 request is the whole game: it tells the scheduler this pod needs a physical GPU, so Kubernetes only places it on a node that has a free one. The initialDelaySeconds: 120 on the readiness probe exists because loading gigabytes of weights into VRAM is slow, and you do not want traffic routed to a replica that is still loading. And the autoscaler scales on DCGM_FI_DEV_GPU_UTIL, actual GPU utilization from NVIDIA's metrics exporter, because a fully loaded GPU can show almost no CPU usage. Scale on CPU here and you would never scale up at all, because the work that matters is invisible to the CPU-based signal a normal web autoscaler watches.
Sharing One Card: Stop Wasting a Whole H100
That "whole card or none" default is a problem the moment your model is small. A model that needs 7 GB still books all 80 GB of an H100 and every one of its cores, and you pay for the rest sitting idle. Modern NVIDIA cards give you two ways out, and they trade off differently.
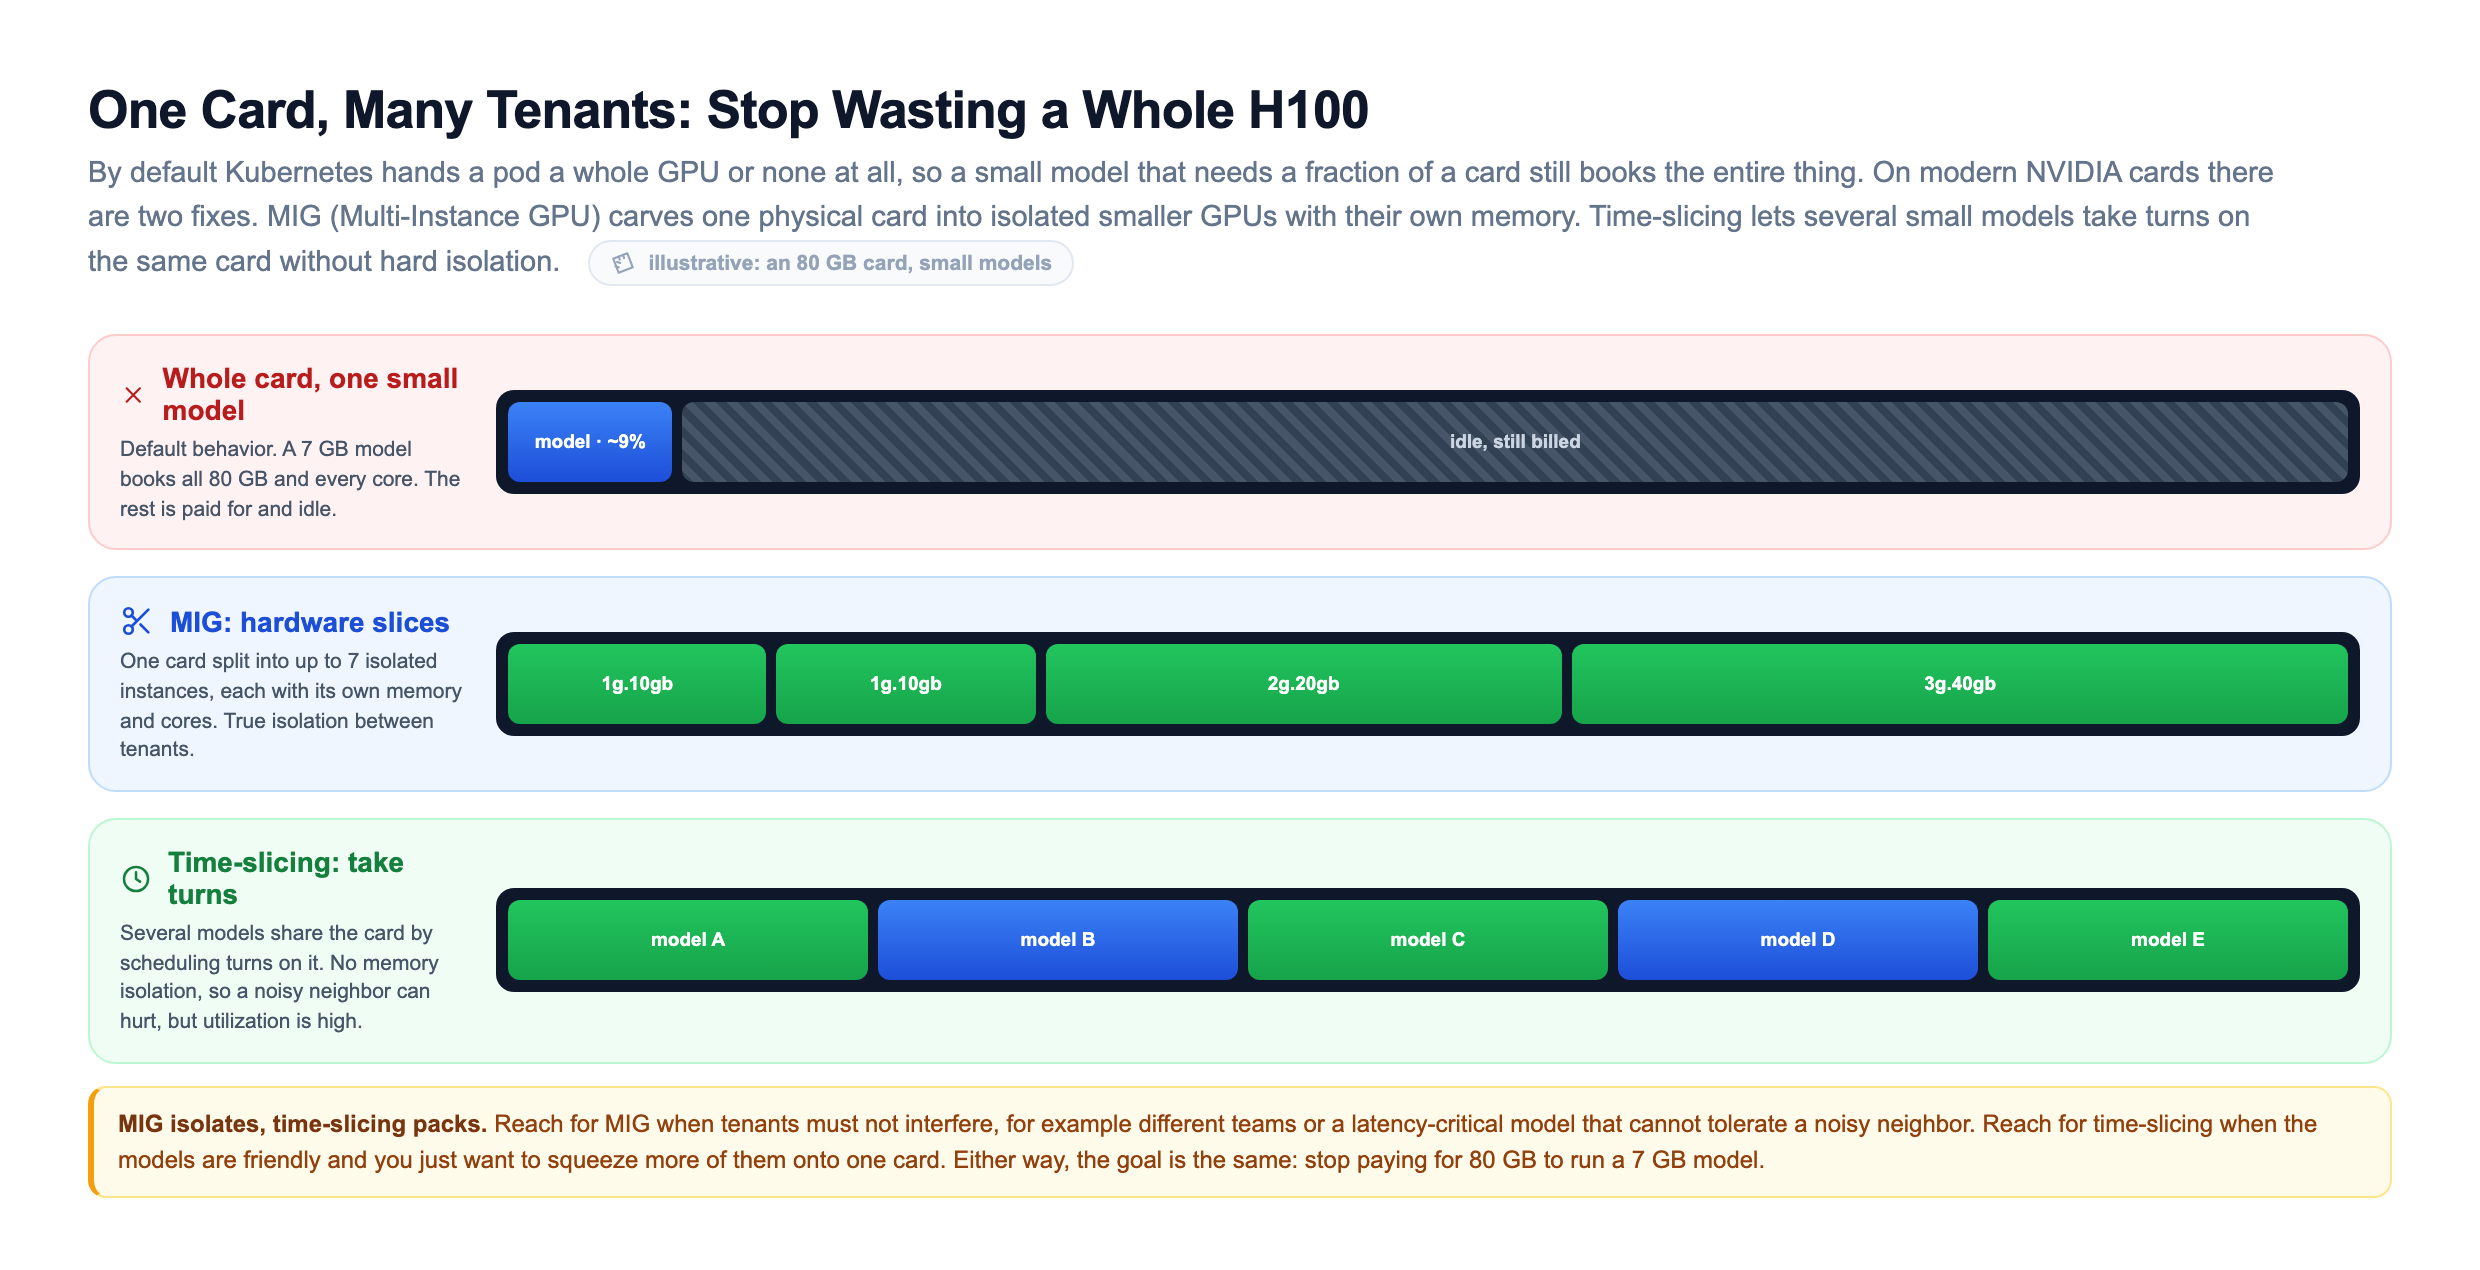
MIG, short for Multi-Instance GPU, carves one physical card into as many as seven isolated smaller GPUs, each with its own slice of memory and cores. The isolation is real hardware isolation, so one tenant cannot starve another. Time-slicing is looser: several models take turns on the same card without hard memory isolation, which packs more of them on but lets a noisy neighbor hurt the others. Reach for MIG when tenants must not interfere, for example different teams or a -critical model that cannot tolerate a noisy neighbor. Reach for time-slicing when the models are friendly and you just want to squeeze more of them onto one card. Either way, the goal is the same: stop paying for 80 GB to run a 7 GB model.
NVIDIA built MIG precisely because large customers were wasting A100s and H100s on models too small to fill them. It is multi-tenancy solved in hardware, and on a platform serving many small models it is one of the highest-leverage cost tools you have.
Bin-Packing: The Scheduler Decides How Many Nodes You Rent
Sharing a single card is one half of the packing problem. The other half is how models are spread across nodes. GPU nodes are the bins and your models are the items, and how the scheduler packs them decides how many expensive nodes you keep switched on.
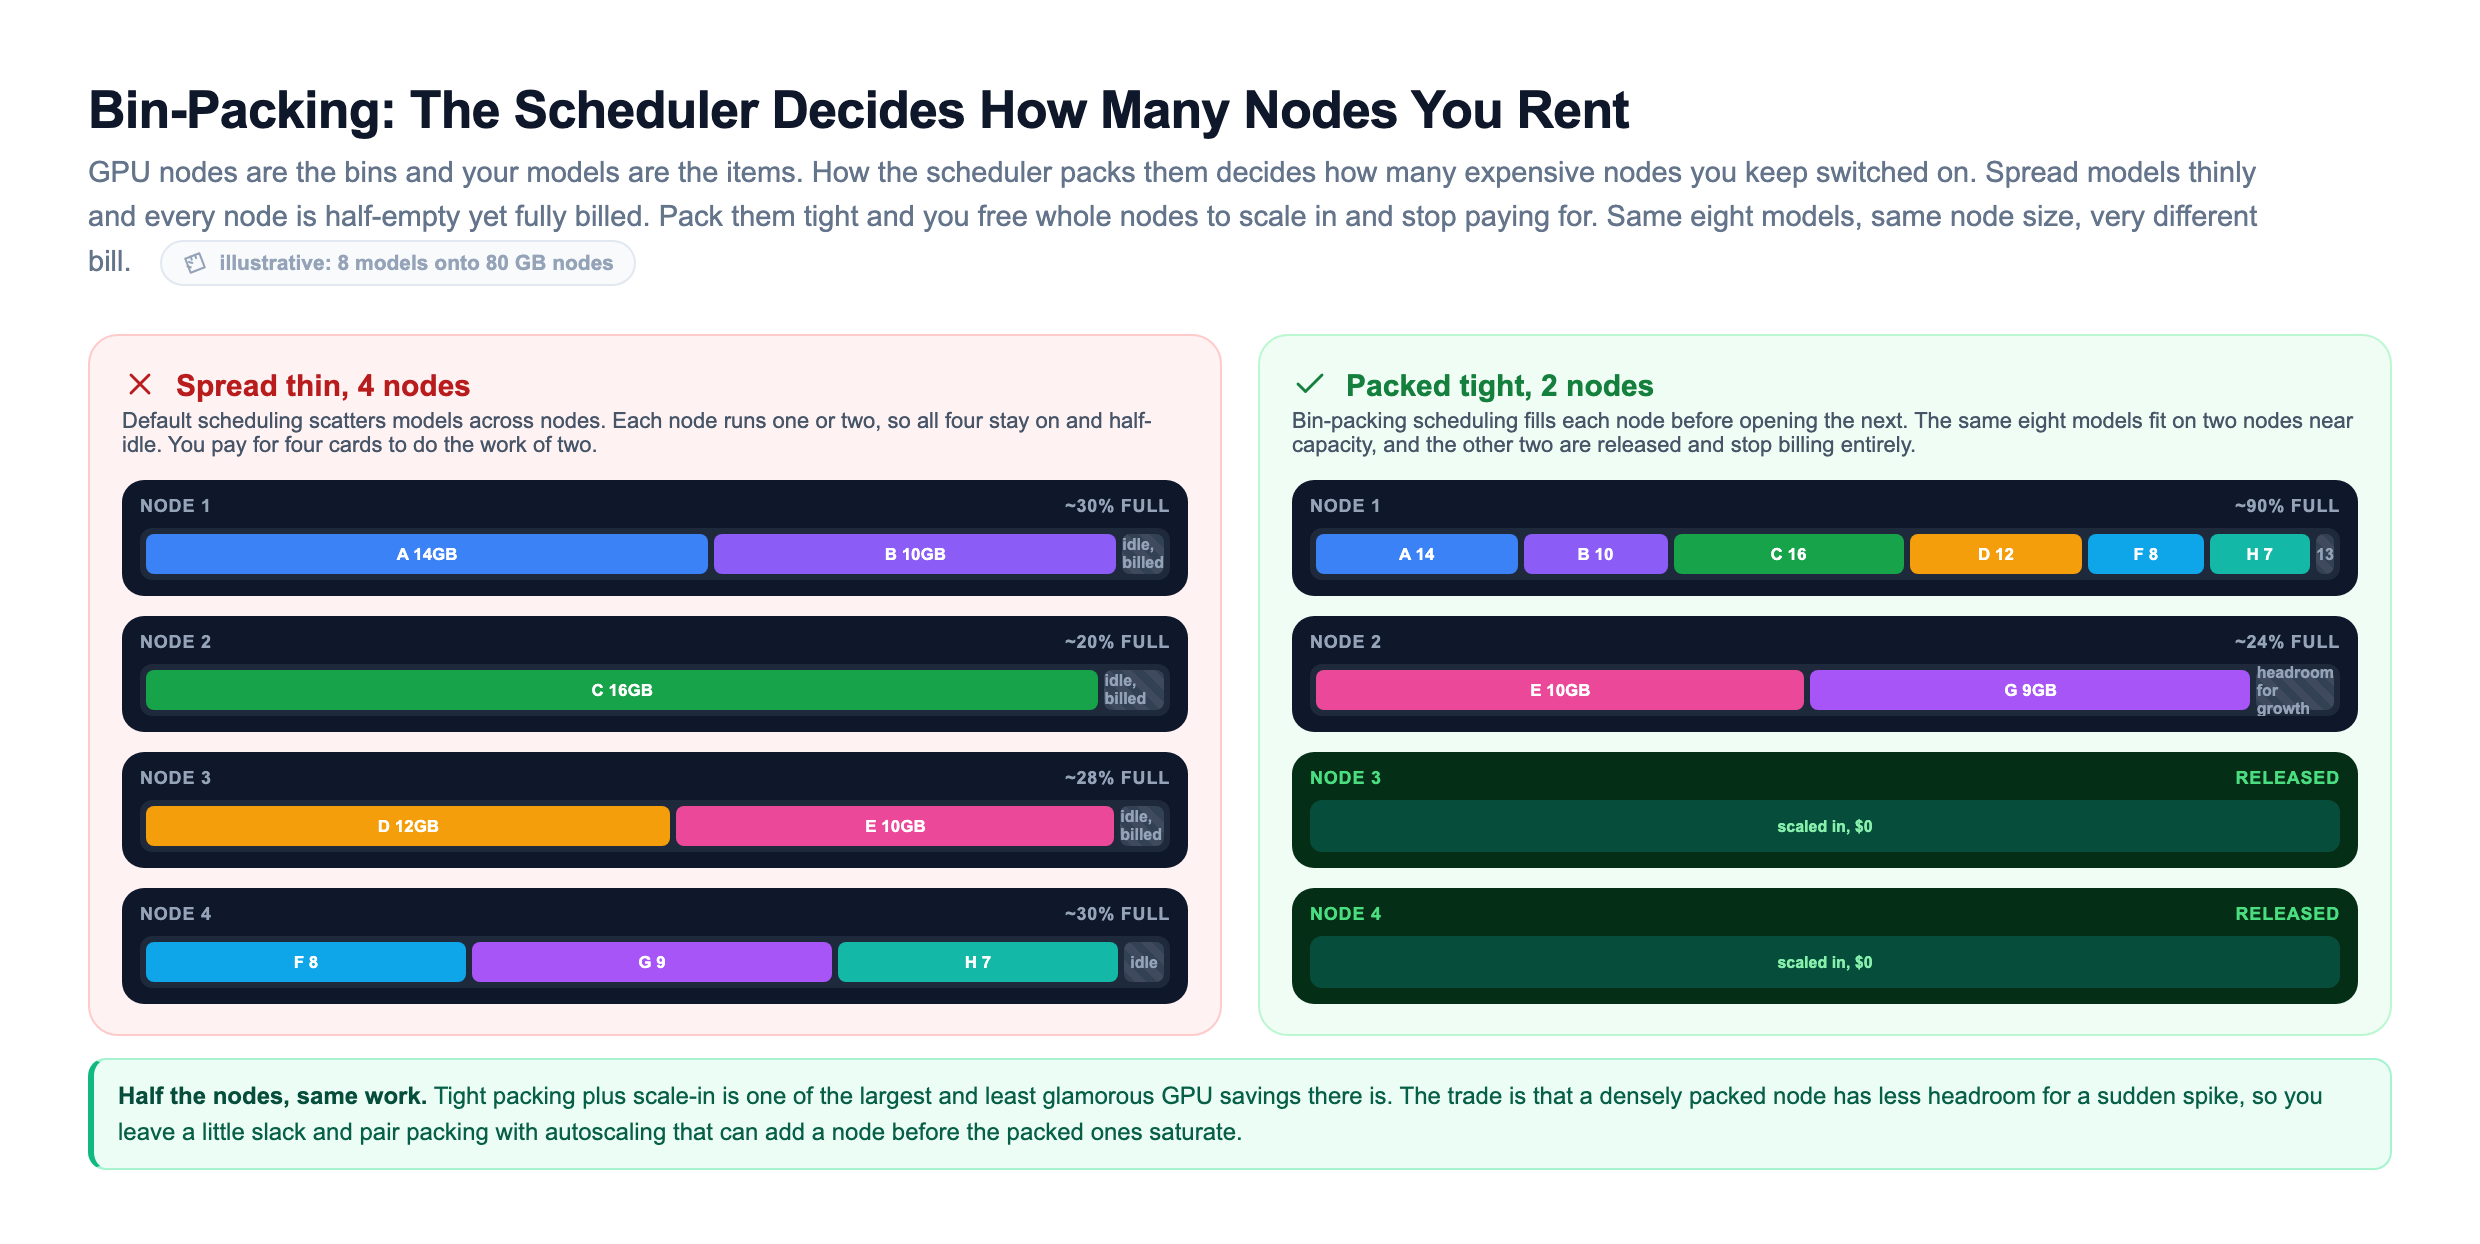
Spread models thinly and every node is half-empty yet fully billed, so you pay for four cards to do the work of two. Pack them tight, filling each node before opening the next, and the same eight models fit on two nodes near capacity while the other two are released and stop billing entirely. Tight packing plus scale-in is one of the largest and least glamorous GPU savings there is. The trade is that a densely packed node has less headroom for a sudden spike, so you leave a little slack and pair packing with autoscaling that can add a node before the packed ones saturate. This is a scheduling decision, not a code change, which is what makes it easy to leave on the table and easy to win once you notice it.
Scale Out or Scale Up, and How to Split a Big Model
When one GPU is genuinely not enough, you can go in two directions, and they solve different problems. Horizontal scaling means more replicas of the same GPU behind a . This buys throughput and scales elastically with traffic, so you add replicas for the busy hours and drop them at night. What it does not do is make a single request faster, and it cannot help at all if the model does not fit on one card to begin with. Vertical scaling means a bigger GPU, from L4 to A100 to H100, or a multi-GPU node with the model split across cards. This is what lets a large model fit at all, and a stronger card can cut per-request latency, but it is lumpy and expensive and eventually you hit the biggest card that exists.
When a single model is too large for any card you can buy, you split it, and there are three distinct ways to spread the work across GPUs.
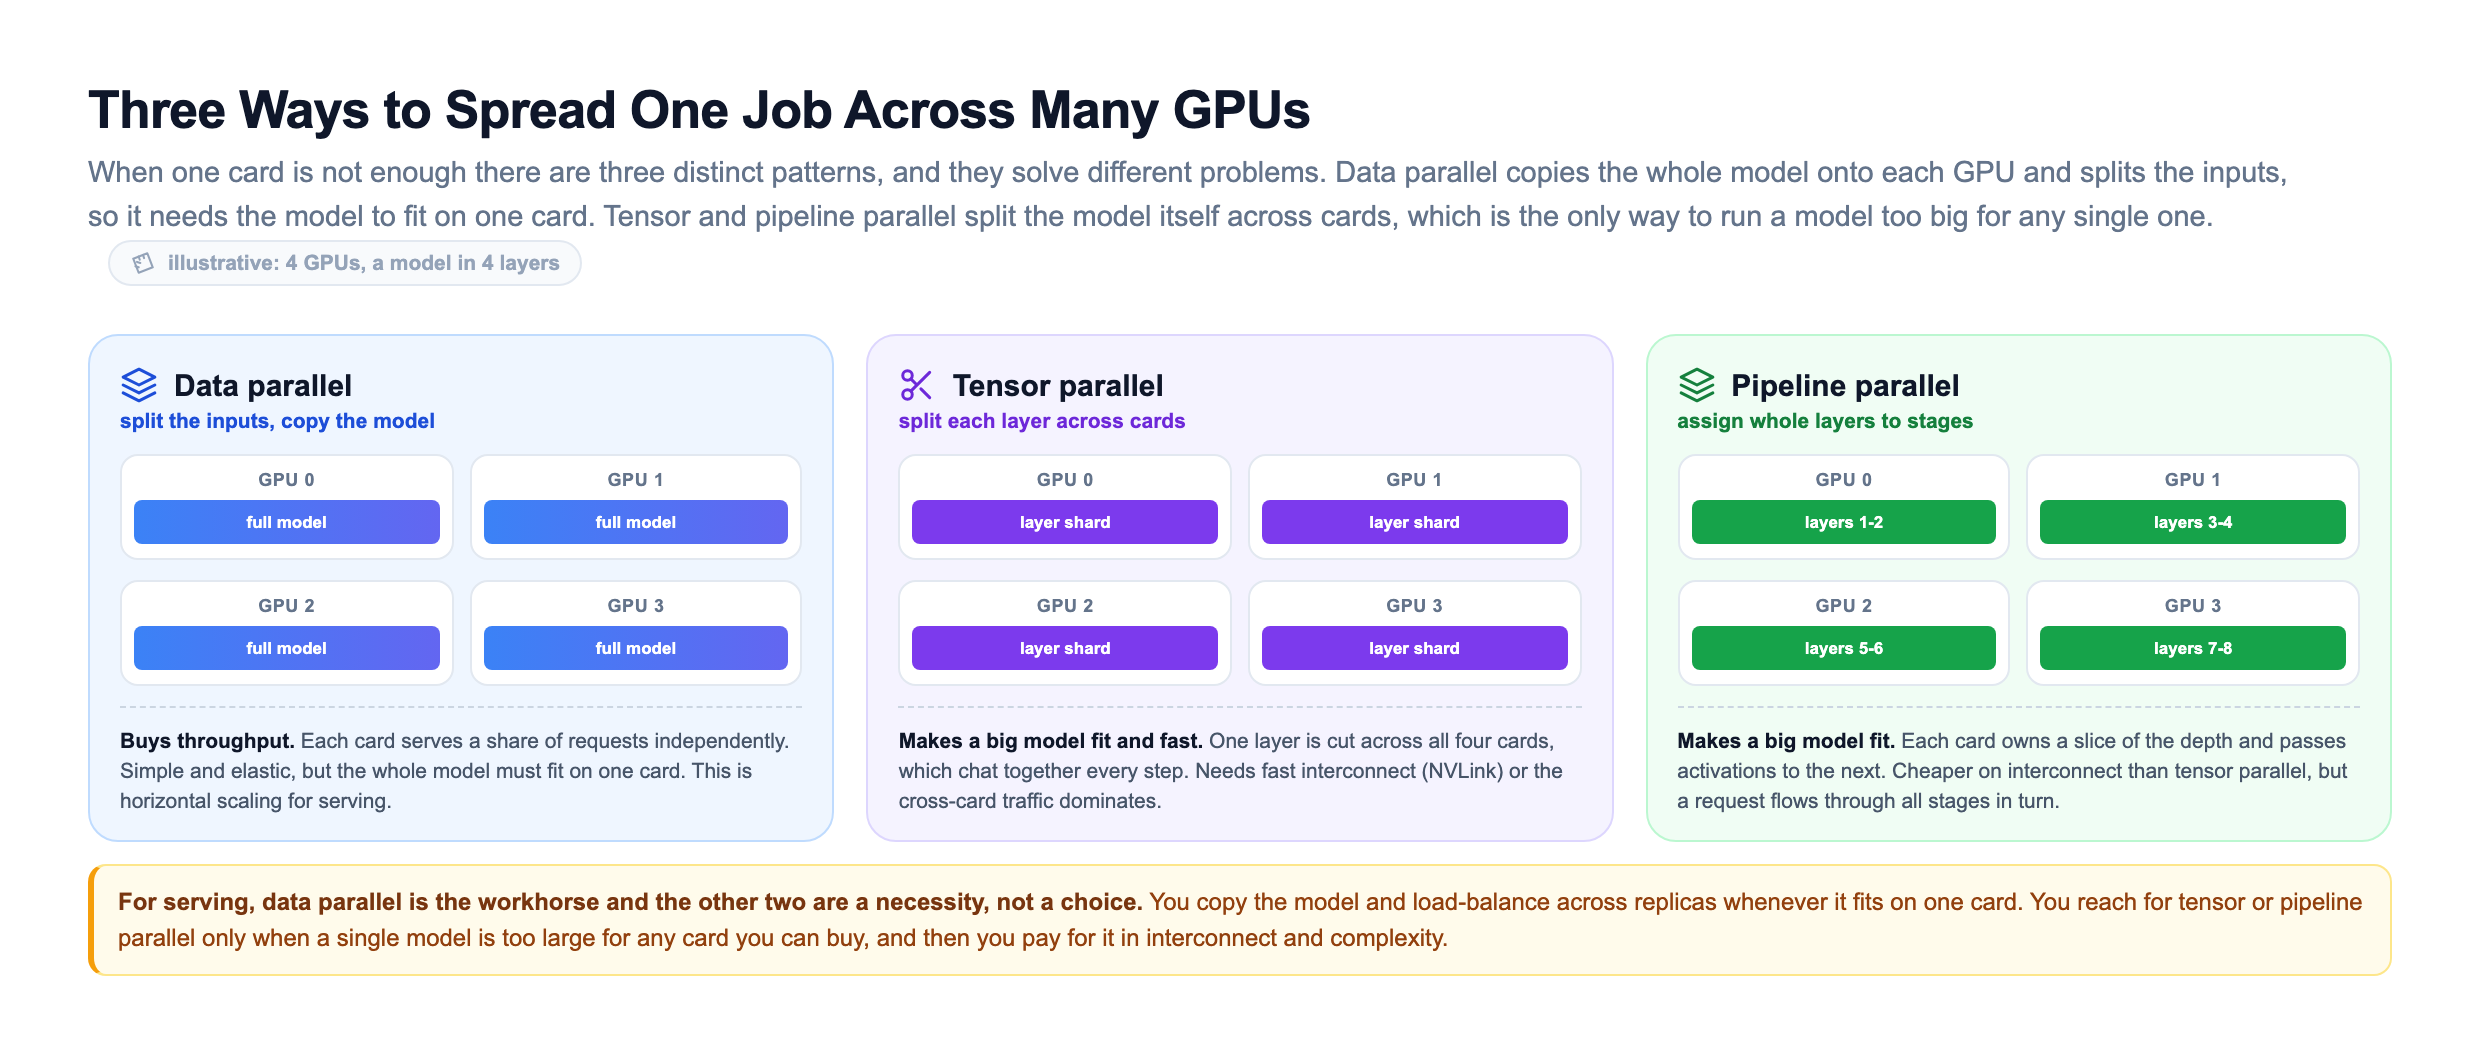
Data parallel copies the whole model onto each GPU and splits the inputs, which is really just horizontal scaling for serving: each replica handles a share of requests independently, but the model must fit on one card. Tensor parallel and pipeline parallel split the model itself, which is the only way to run a model too big for any single card. Tensor parallel cuts each layer across cards that must talk on every step; pipeline parallel gives each card a slice of the depth and passes activations along. For serving, data parallel is the workhorse and the other two are a necessity, not a preference: you reach for them only when the model will not fit, and then you pay for it in interconnect and complexity.
Interconnect is the word to underline, because splitting a model only pays off if the cards can talk fast enough.
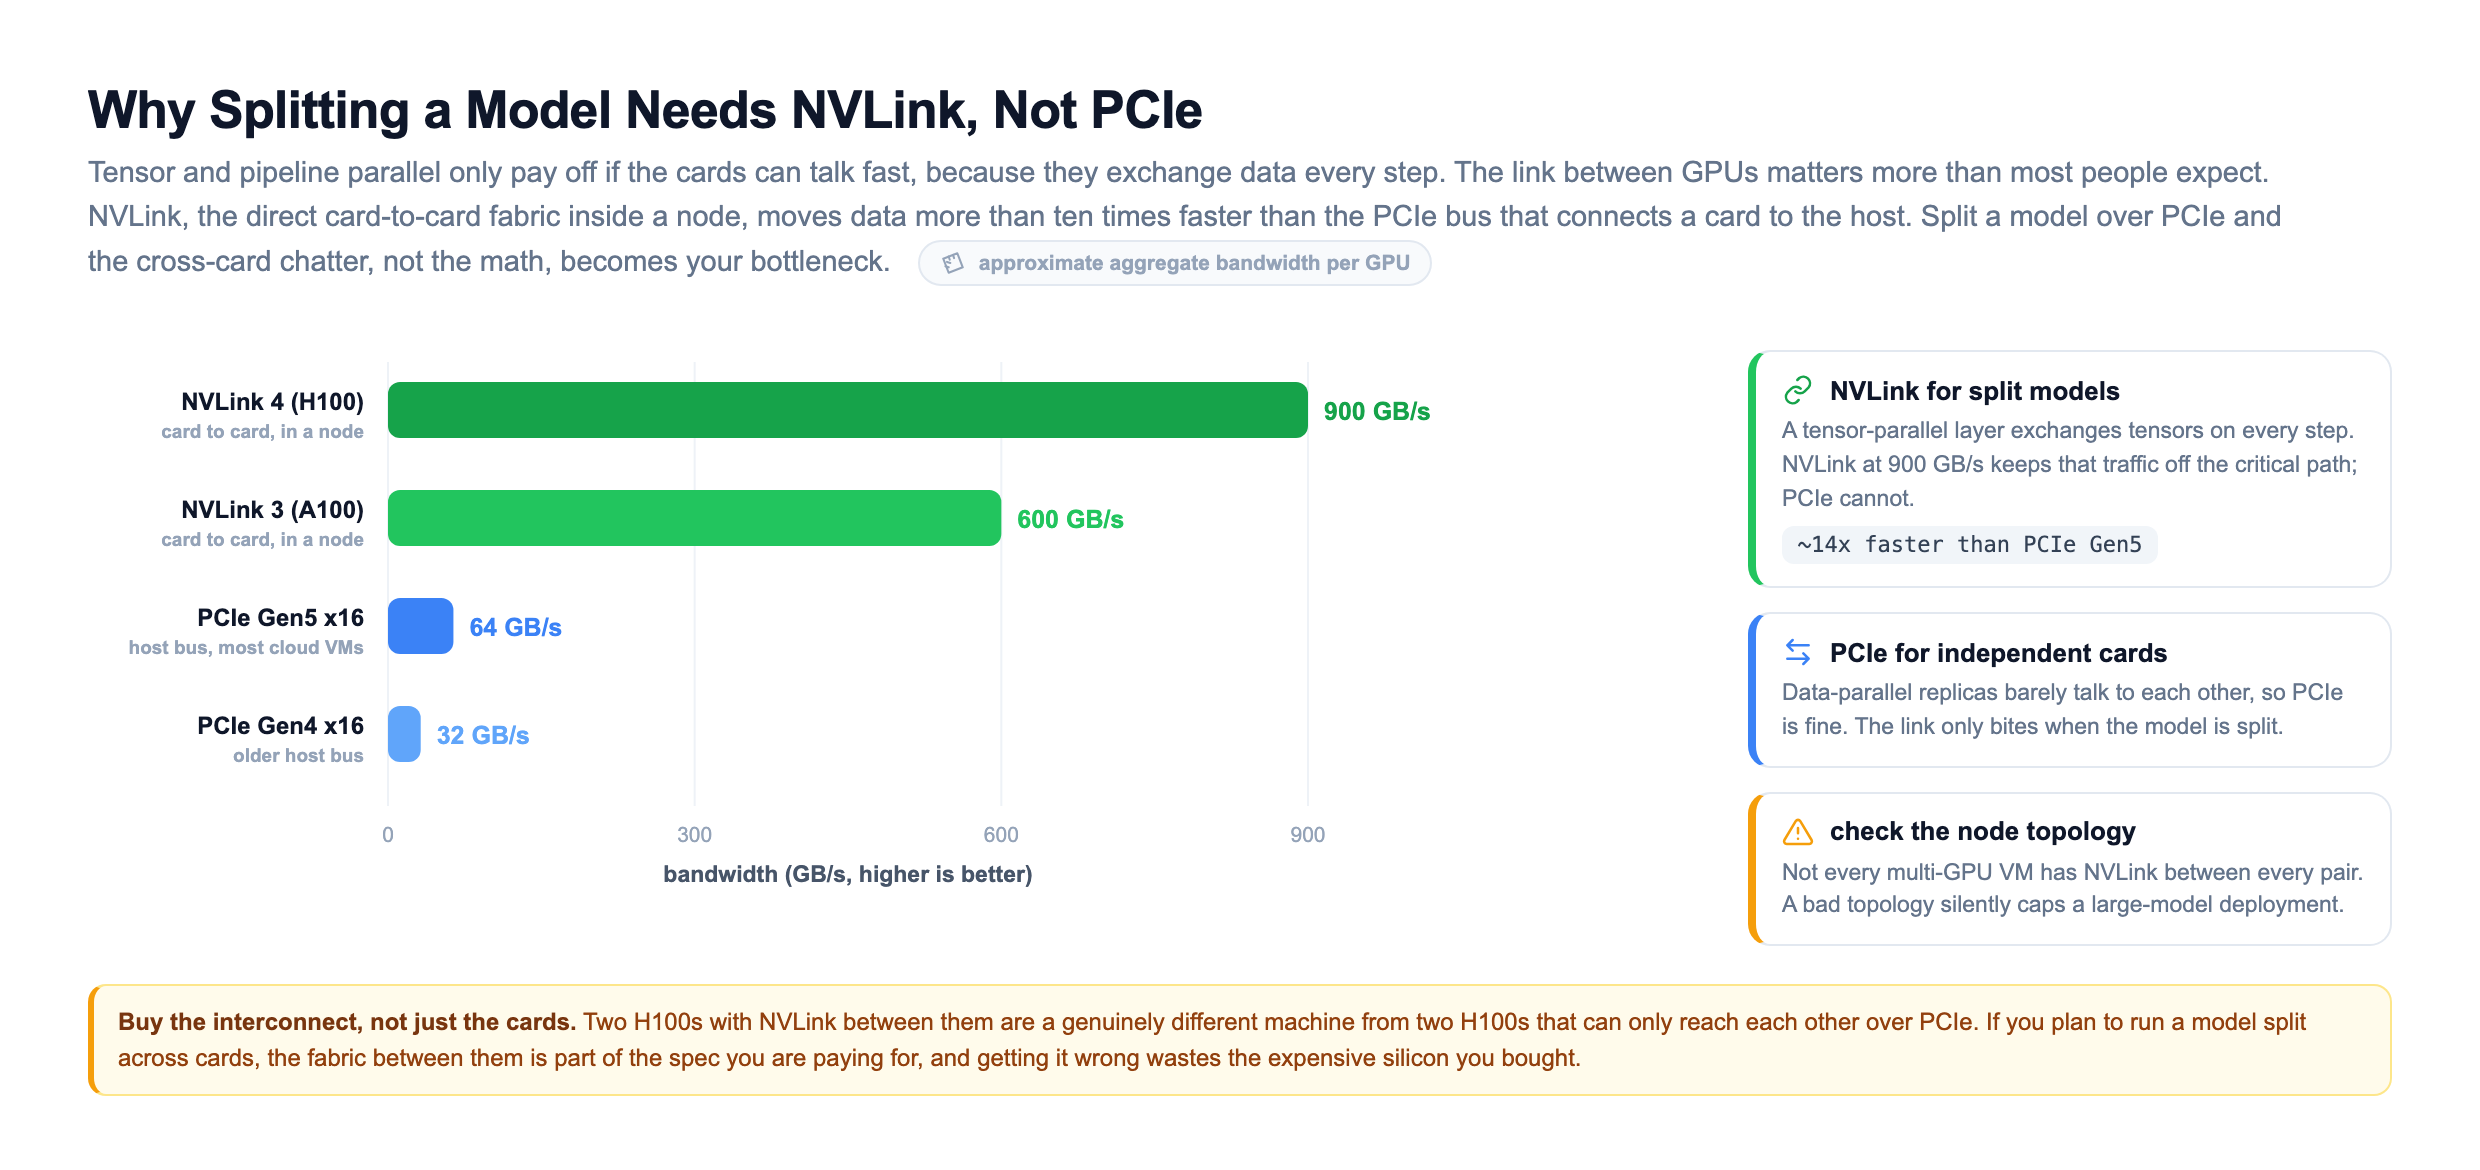
NVLink, the direct card-to-card fabric inside a node, moves data more than ten times faster than the PCIe bus that connects a card to the host. A tensor-parallel layer exchanges tensors on every step, and NVLink keeps that traffic off the critical path where PCIe cannot. Two H100s with NVLink between them are a genuinely different machine from two H100s that can only reach each other over PCIe. If you plan to split a model across cards, the fabric between them is part of the spec you are paying for, and getting it wrong quietly caps the expensive silicon you bought.
Picking a Card: Sticker Price Is Not Cost Per Inference
The instinct when the bill is high is to reach for the cheapest card. That instinct is usually wrong, and understanding why is the difference between a serving bill that scales and one that surprises you. What matters is not the hourly price, it is dollars per inference: the hourly price divided by how many inferences that card actually completes in an hour.
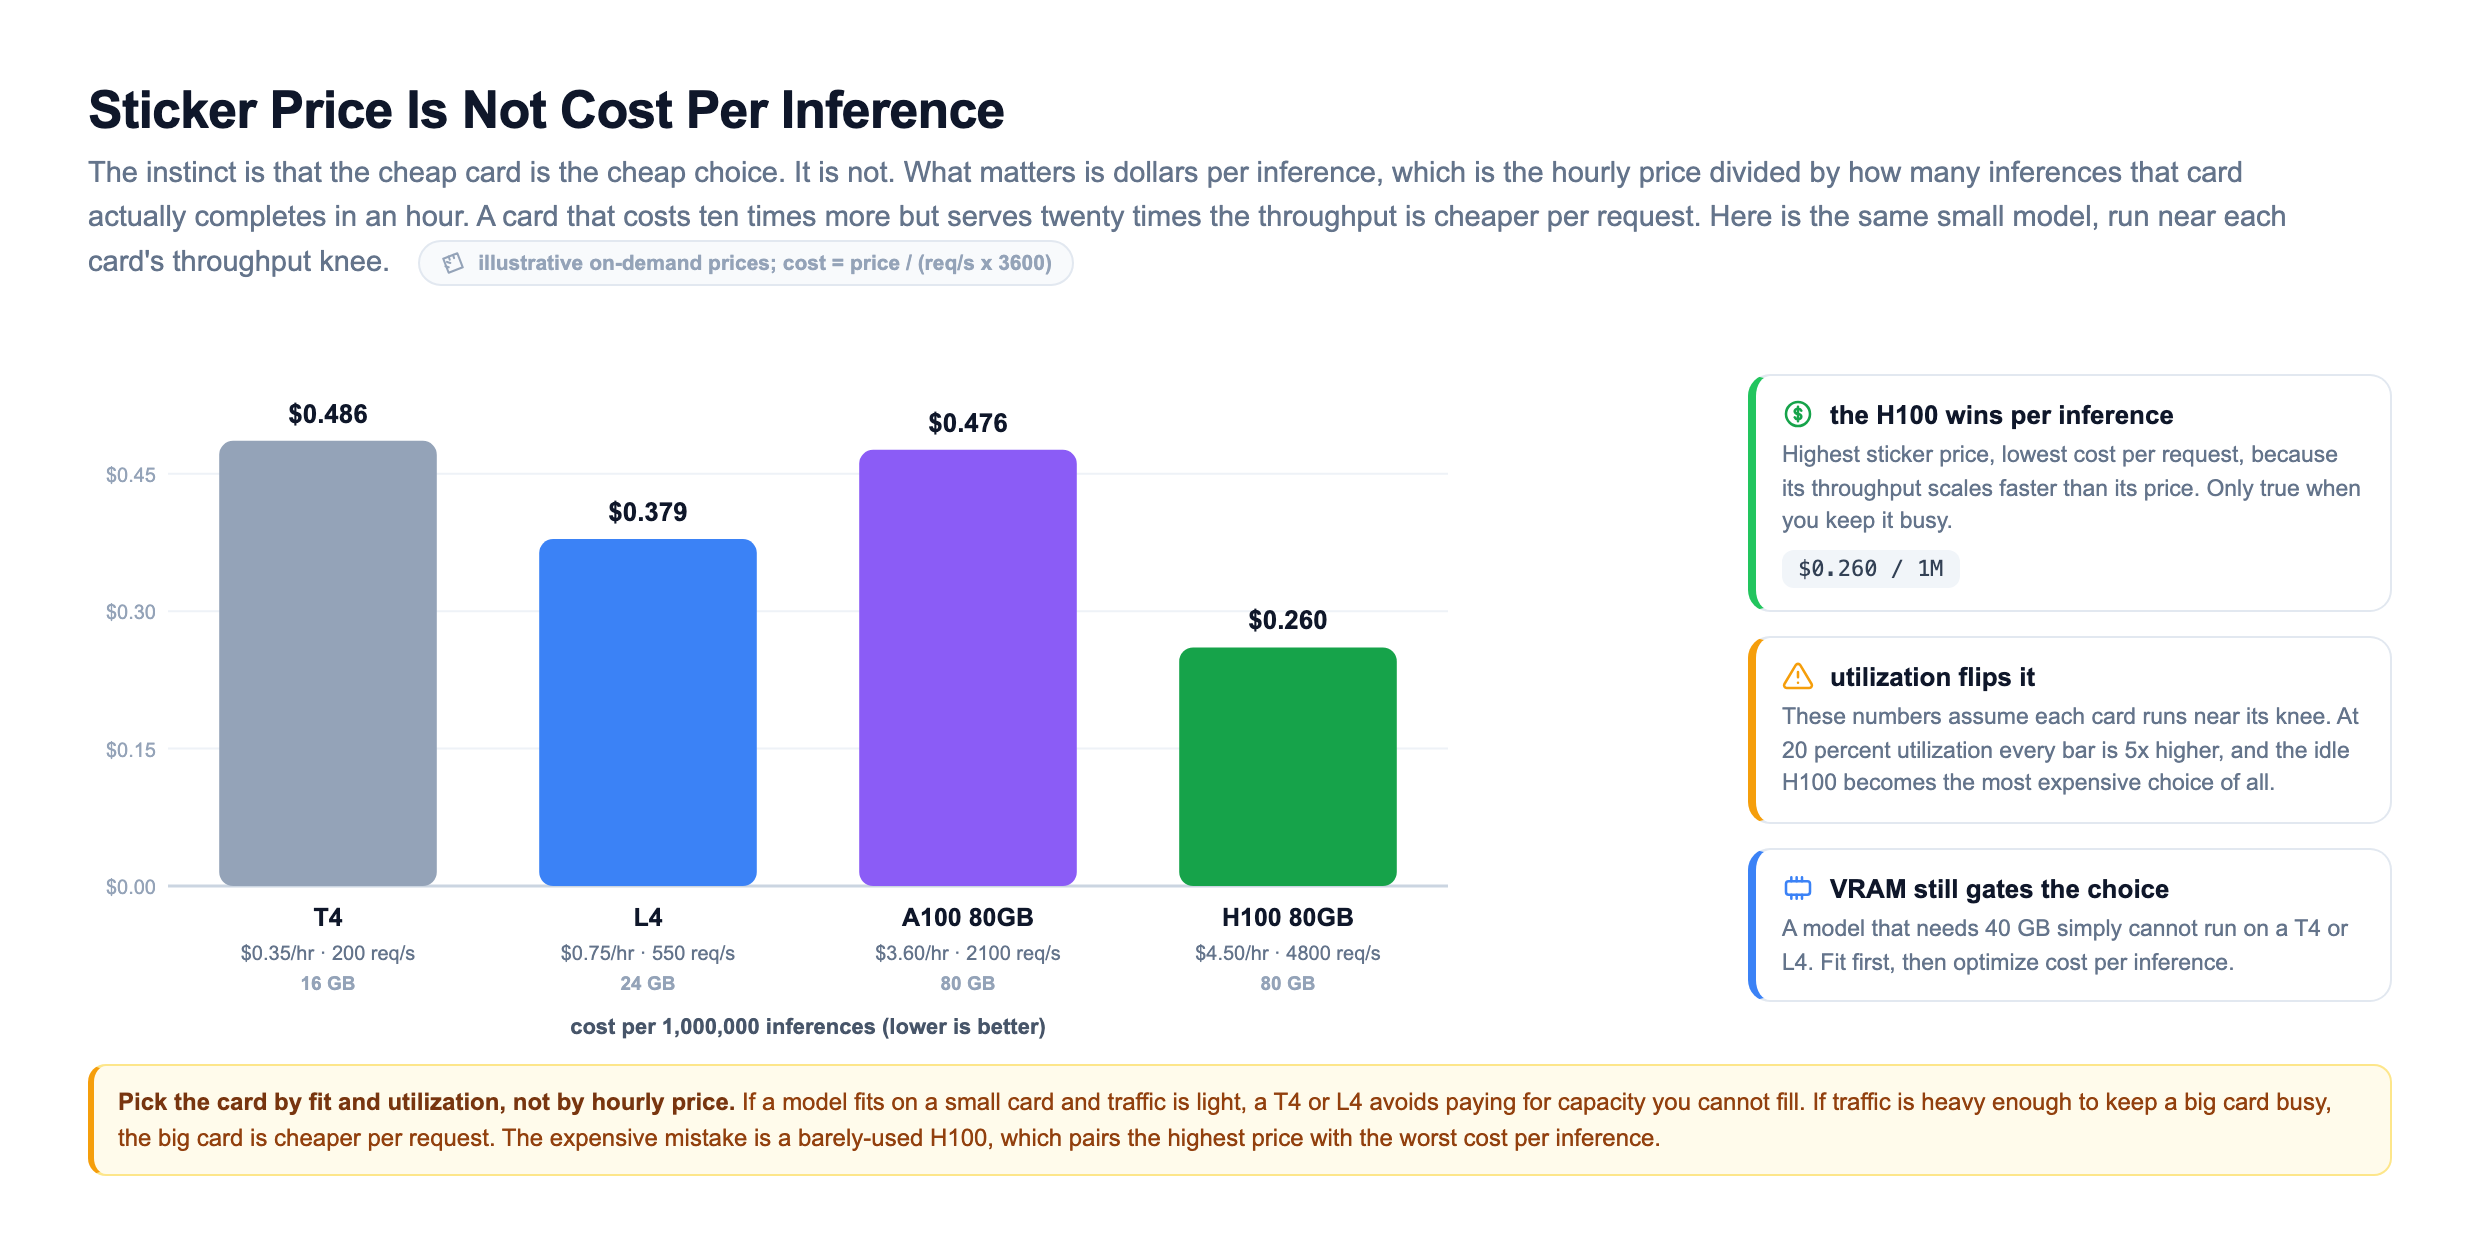
Run the numbers and the H100, the most expensive card by the hour, is the cheapest per request, because its scales faster than its price. But read the caveat, because it is the whole point: those numbers assume each card runs near its throughput knee. At 20 percent utilization every bar is five times higher, and a barely-used H100 becomes the single most expensive choice you could make, pairing the highest hourly price with the worst cost per inference. And VRAM still gates the decision before cost does. A model that needs 40 GB simply cannot run on a T4 or an L4, so you fit first and optimize cost per inference second.
The practical rule: pick the card by fit and by how busy you can keep it, not by hourly price. If a model fits on a small card and traffic is light, a T4 or L4 avoids paying for capacity you cannot fill. If traffic is heavy enough to keep a big card busy, the big card is cheaper per request. The expensive mistake is the idle premium card.
Autoscaling GPUs, the Cold-Start Tax, and Spot
Horizontal scaling is only cheap if the replica count actually tracks demand, which means autoscaling. But GPU autoscaling has a problem that CPU autoscaling does not: adding a replica is slow and expensive to warm up. A stateless web pod is ready in a second. A GPU replica has to find a scarce GPU node, pull a multi-gigabyte CUDA image, and load gigabytes of weights into VRAM before it can answer anything, commonly two to three minutes.
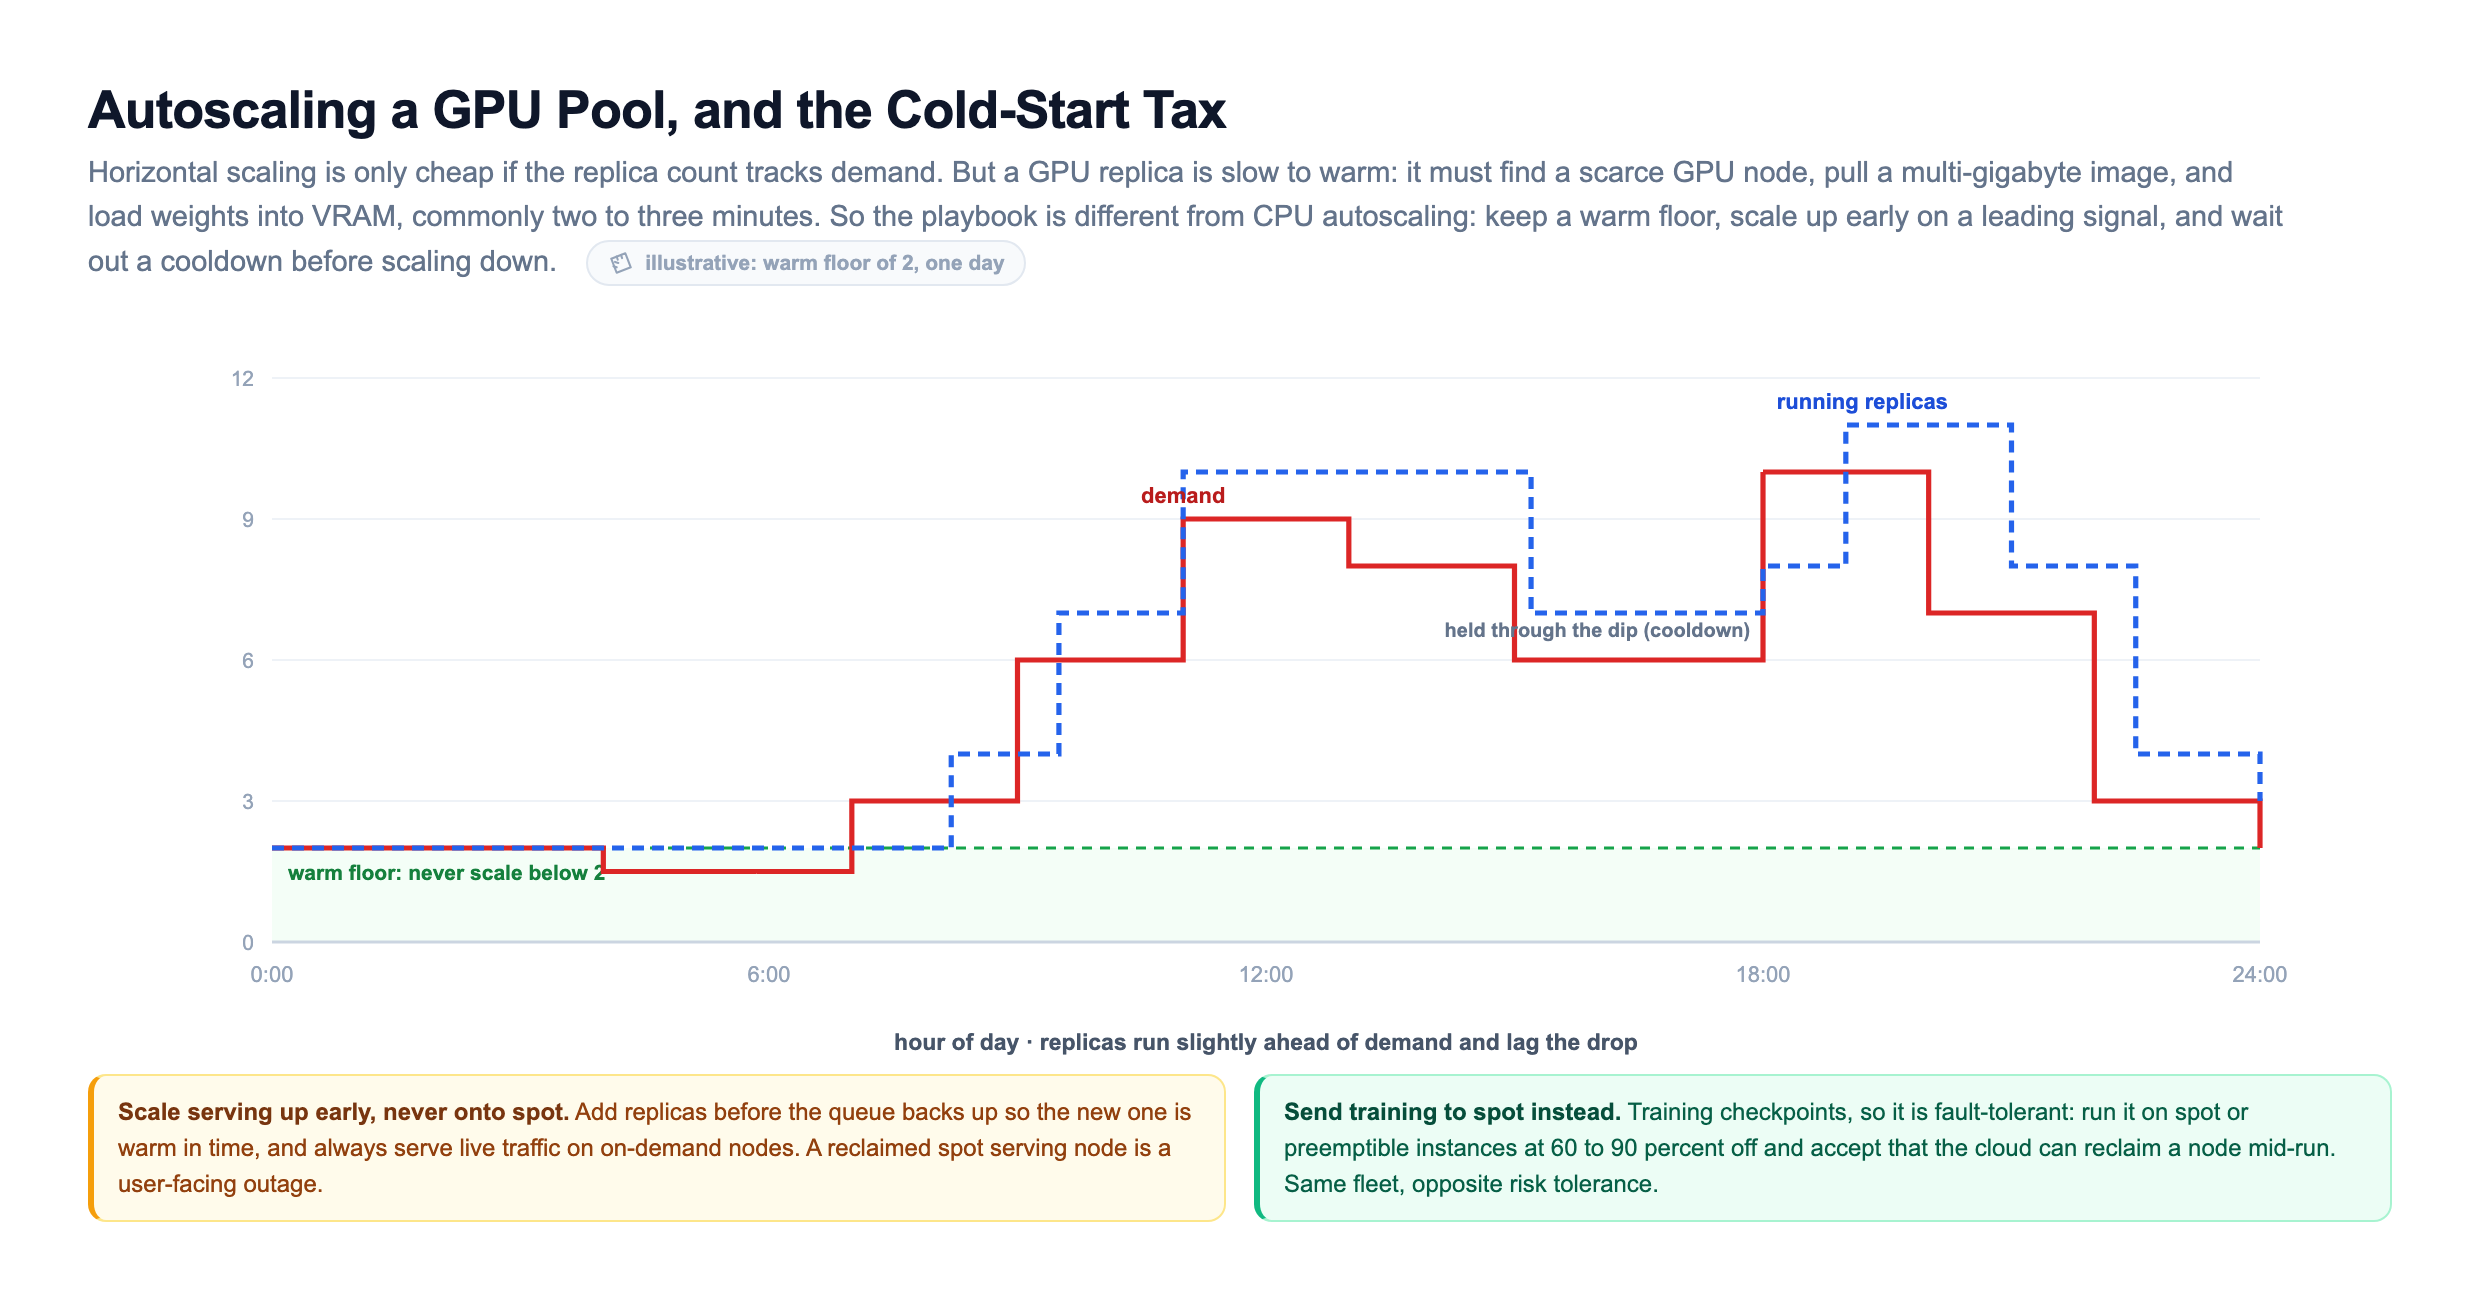
If you wait until the queue is already on fire to scale up, users feel the pain for the whole warm-up. So GPU autoscaling has a distinct playbook: keep a minimum warm floor of replicas so the next user is never greeted by a full cold start, scale up early on a leading signal such as headroom or queue depth rather than waiting for saturation, cache images on the node pool, and wait out a cooldown before scaling down so a brief lull does not cost you a cold start on the next spike.
Two more cost levers live around autoscaling. For training, which is fault-tolerant because it checkpoints, you run on spot or preemptible instances at sixty to ninety percent off, and you accept that the cloud can reclaim them mid-run. You almost never serve live traffic on spot, because a reclaimed serving node is a user-facing outage. Same fleet, opposite risk tolerance: aggressive spot for training, on-demand with a warm floor for serving.
Do the Math Yourself: A Sizing and Cost Calculator
Everything above rests on two calculations you should be able to do in your head: does the model fit in VRAM, and what does an inference cost once you account for . Here is both as code you can run and change. Adjust the parameter count, the precision, and the batching multiplier and watch what fits and what it costs.
The output makes the two rules concrete. Fit is a hard gate set by VRAM, so a card either qualifies or it does not. Among the cards that qualify, cost per inference is a throughput game, and the batching multiplier moves it more than the choice of card does. Set BATCH_GAIN back to 1 and every cost figure jumps, which is the numerical version of the earlier point: the batch window, not the hardware, is often the single biggest dial on the bill.
A Decision Map, and How the Heavy Users Keep the Bill Sane
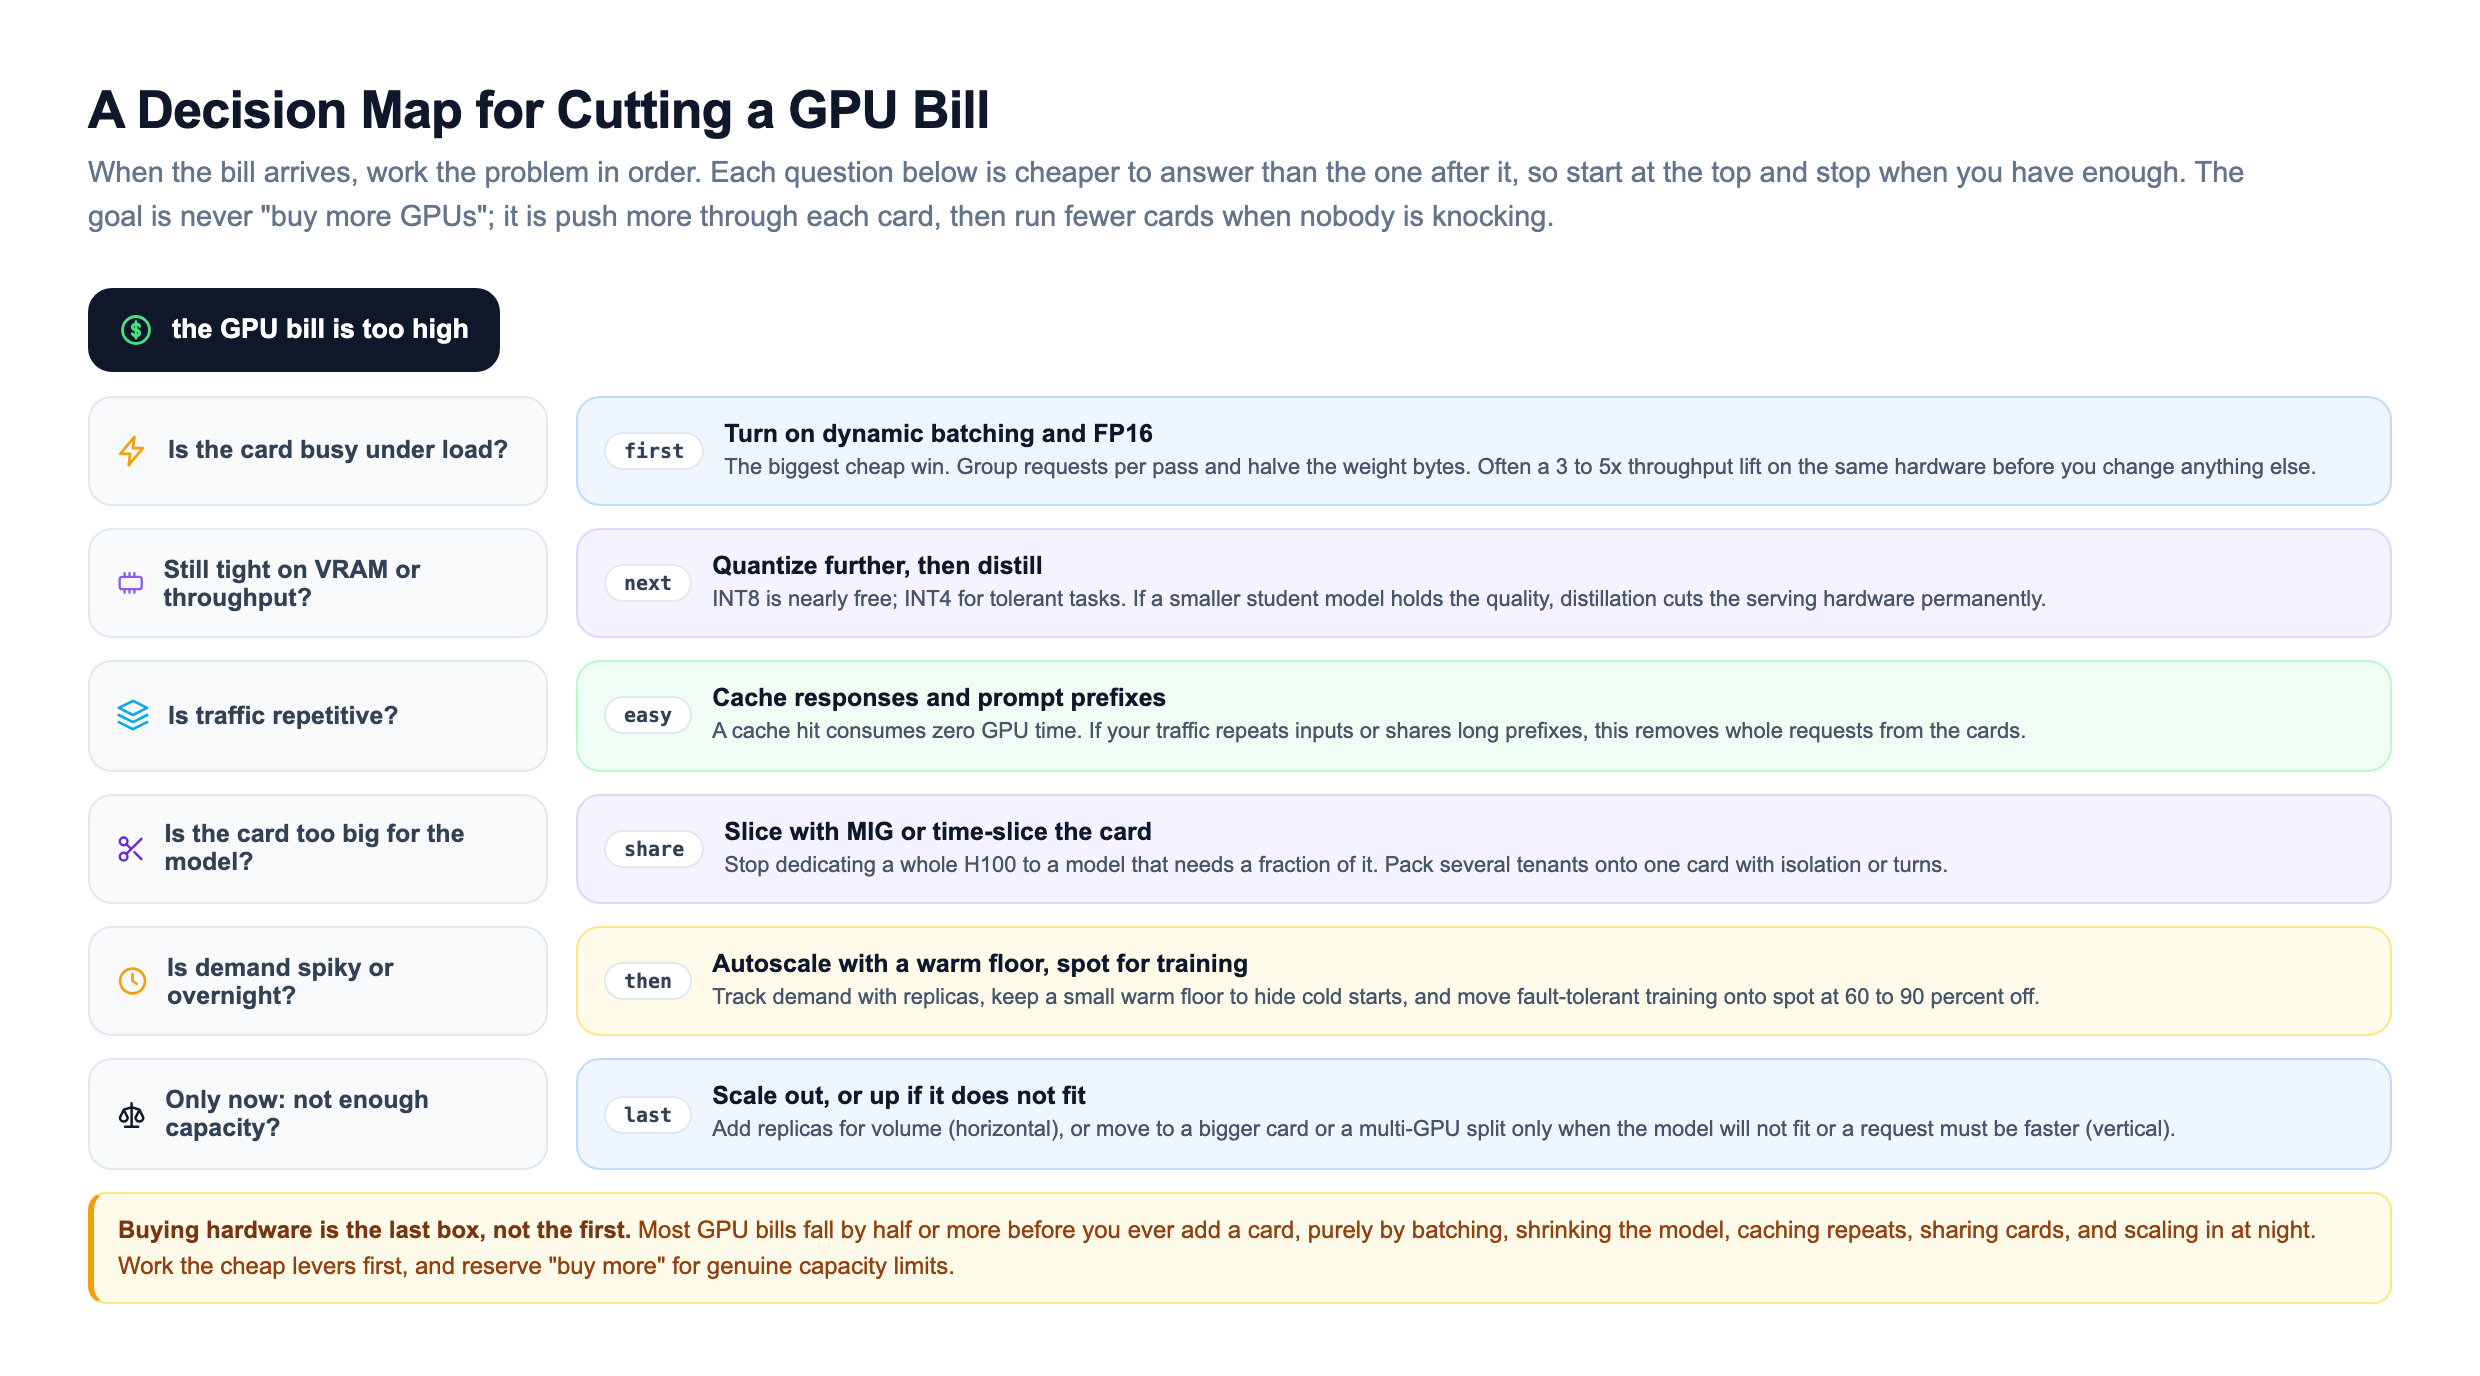
Put it all together and you get an order of operations. When the bill arrives, work the cheap levers first and reserve buying hardware for last, because most GPU bills fall by half or more before you ever add a card.
None of this is theoretical. Every company serving models at scale has fought this exact fight. Character.AI wrote publicly about serving enormous volumes of language-model traffic affordably, and their toolkit is precisely this lesson: aggressive INT8 quantization, attention tricks that shrink the , and heavy caching of shared prompt prefixes so repeated context does not re-run on the GPU. They reported cutting serving cost per request by more than an order of magnitude, which is what made a free consumer chat product economically possible at all.
OpenAI, Anthropic, and other LLM providers lean on , where new requests join an in-flight batch token by token instead of waiting for a fixed window, keeping the GPUs saturated even under uneven traffic. It is dynamic batching taken to its logical extreme for autoregressive generation. Netflix, Uber, and DoorDash, serving thousands of smaller recommendation and ranking models rather than giant LLMs, focus on packing many models onto shared GPUs and on autoscaling down hard during off-peak hours, because at their model count, idle GPUs are the whole game.
The common thread across all of them is the same. Nobody solves a GPU cost problem by simply buying more GPUs. They make each card do more, through batching and , and they run fewer cards when demand is low, through sharing and autoscaling. That is the entire discipline of scaling GPU infrastructure, and it is why the number that ties this lesson together is requests per second per dollar. Take a card that costs two dollars an hour and naively serves 40 requests per second: that is 20 requests per second per dollar-hour. Turn on FP16 and dynamic batching and the same card can push 200 or more requests per second, five times the value on the exact same hardware. That multiplier, not the choice of card, is usually the difference between a serving bill that scales and one that gets you the note from finance.
Knowledge Check
Knowledge Check
4 questions - Score 80% to pass
Why must a model's weights fit in the GPU's VRAM for serving?
Why should a GPU serving autoscaler scale on GPU utilization or queue depth rather than CPU usage?
What is the trade-off that dynamic batching makes?
A small model runs on an H100 that stays at about 15 percent utilization all day. Why is this often the most expensive choice per inference?