Three Decisions, Not One
The previous lesson counted what lazy loading costs: one slow request per distinct key, paid by a real user who gets nothing for their wait. Eager loading is the standard answer. Load the cache in advance and nobody has to be the first.
Loading is the easy part. The hard part is that a warming job has to decide what to load, and that decision has consequences nobody usually looks for.
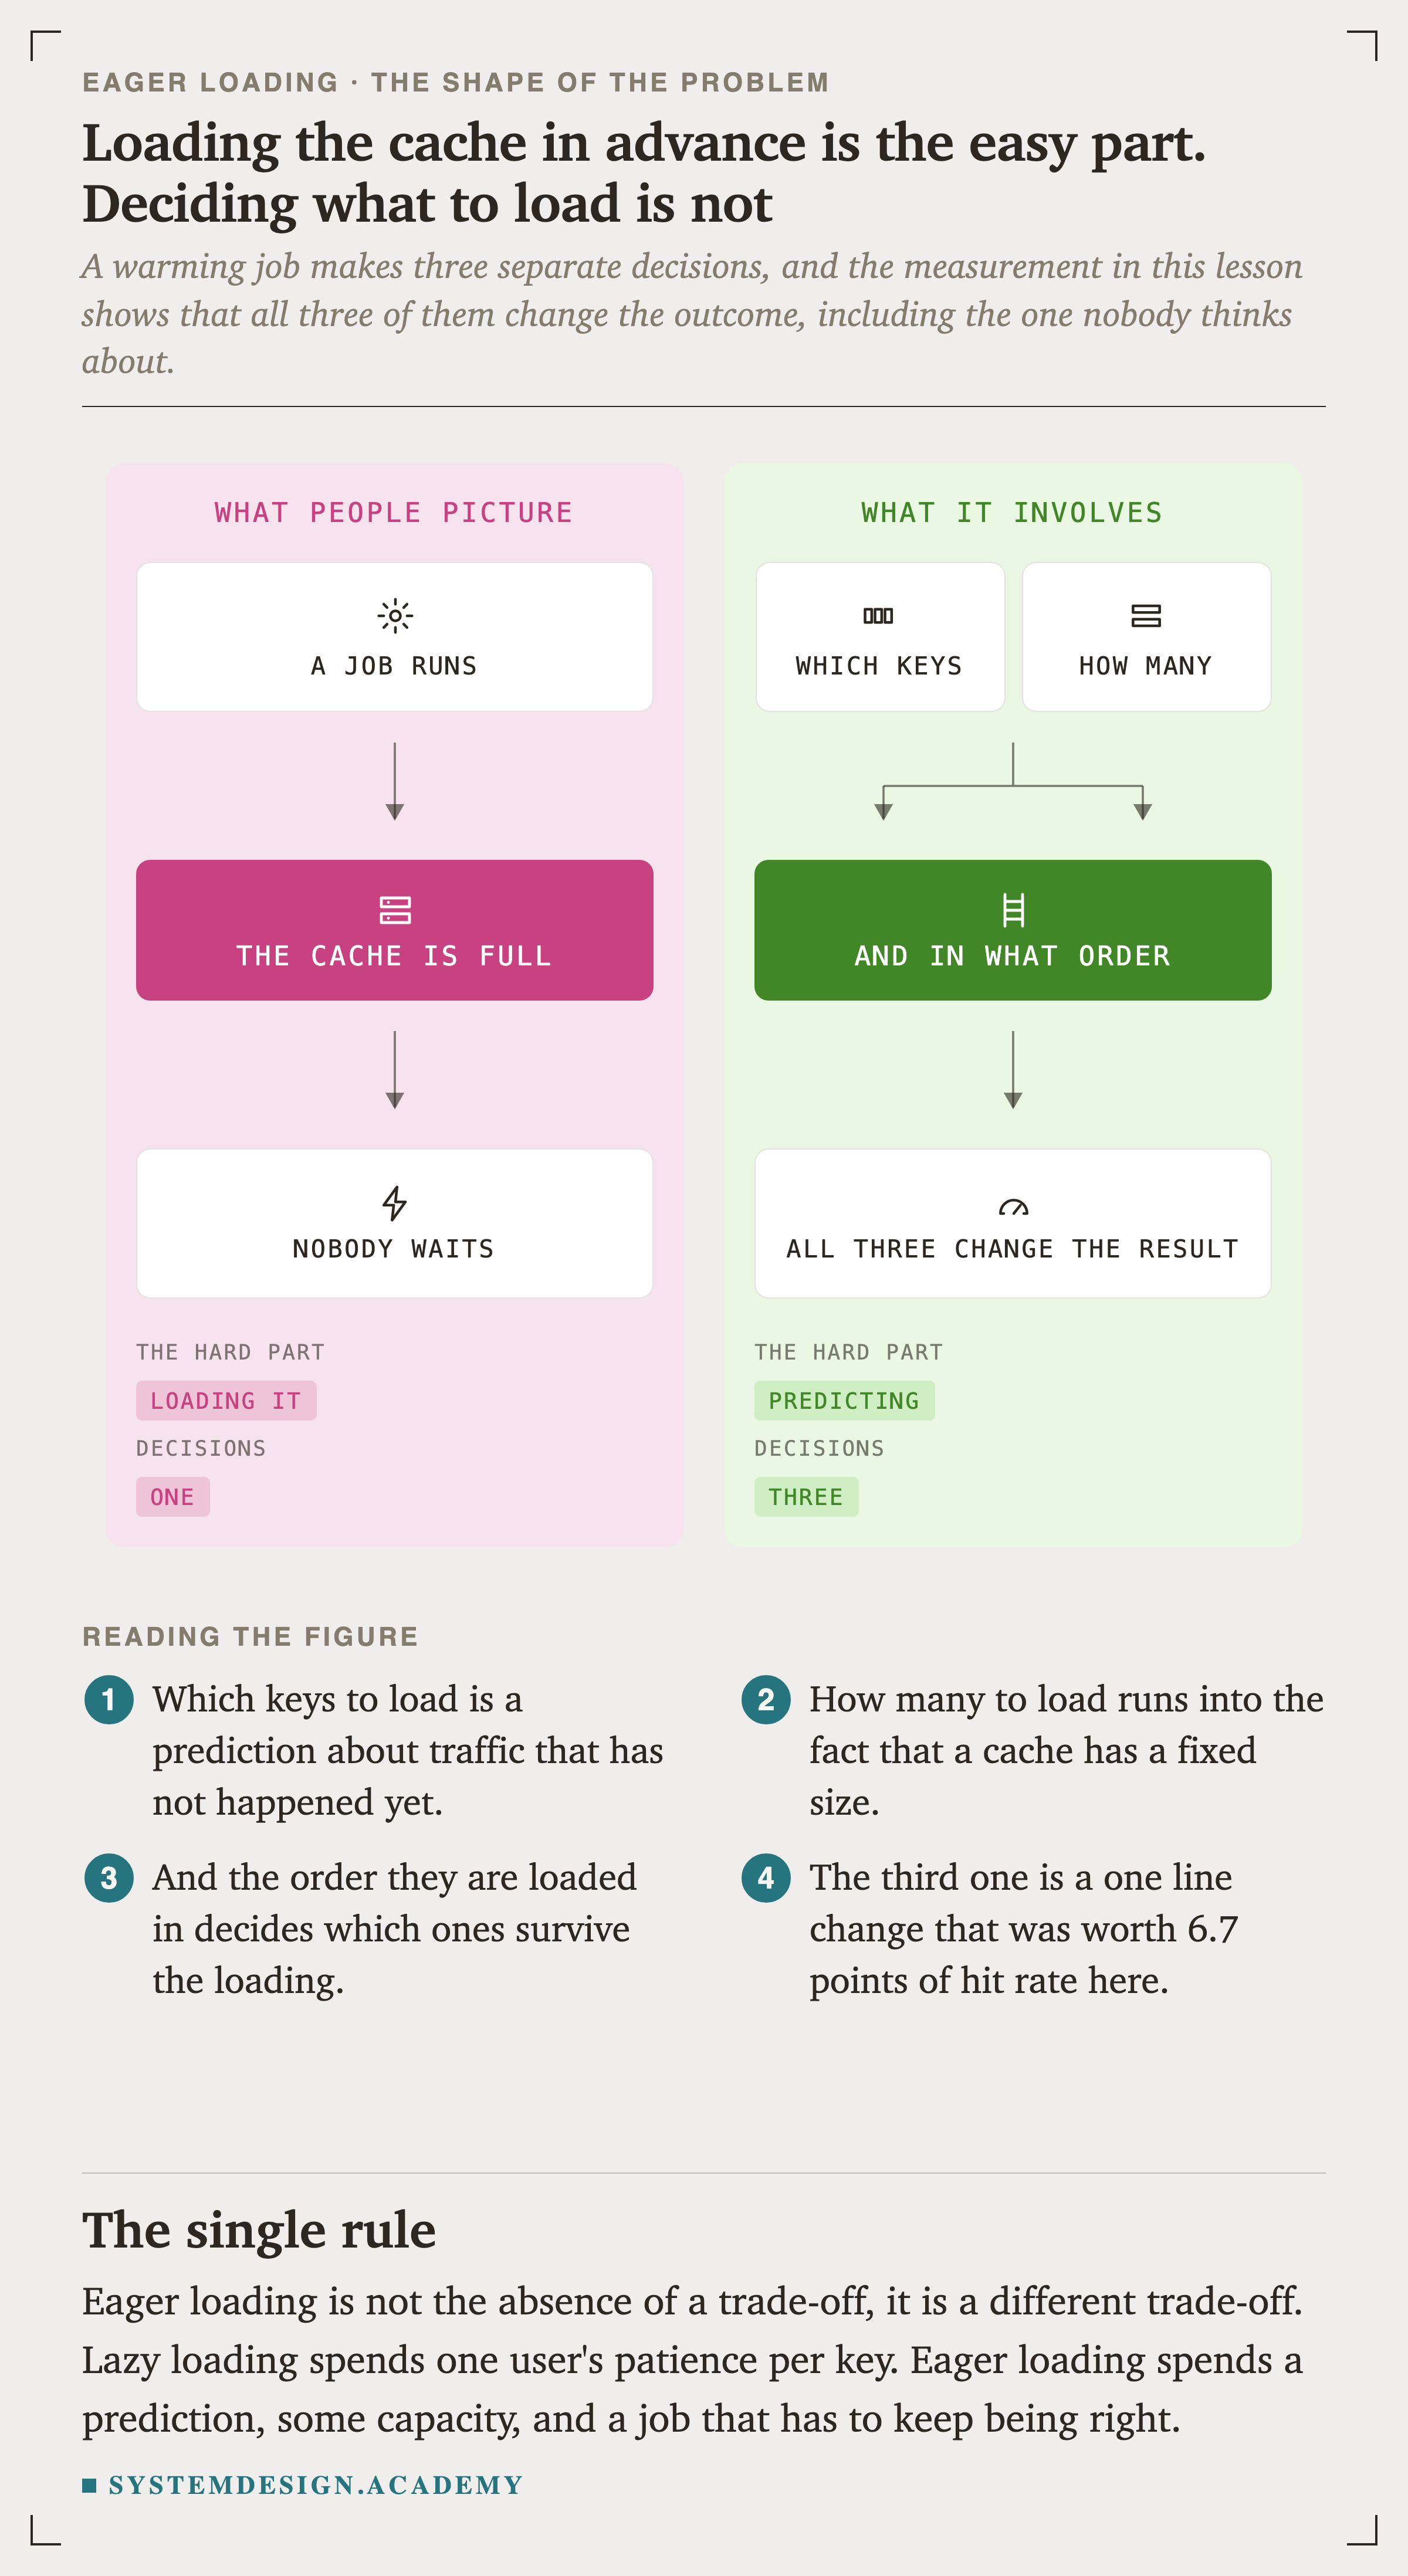
Which keys is a prediction about traffic that has not happened yet. How many runs into the fact that a cache has a fixed size. And the order they are loaded in decides which of them survive the loading, which is the one nobody thinks about.
Everything below comes from one measurement. A catalogue of twenty thousand items, an LRU cache holding two thousand of them, a hundred and twenty thousand requests on day one, an overnight shift in what is popular, and another hundred and twenty thousand on day two. The warming job counts day one and loads the top N keys before day two starts, which is the best prediction anyone could make at that moment.
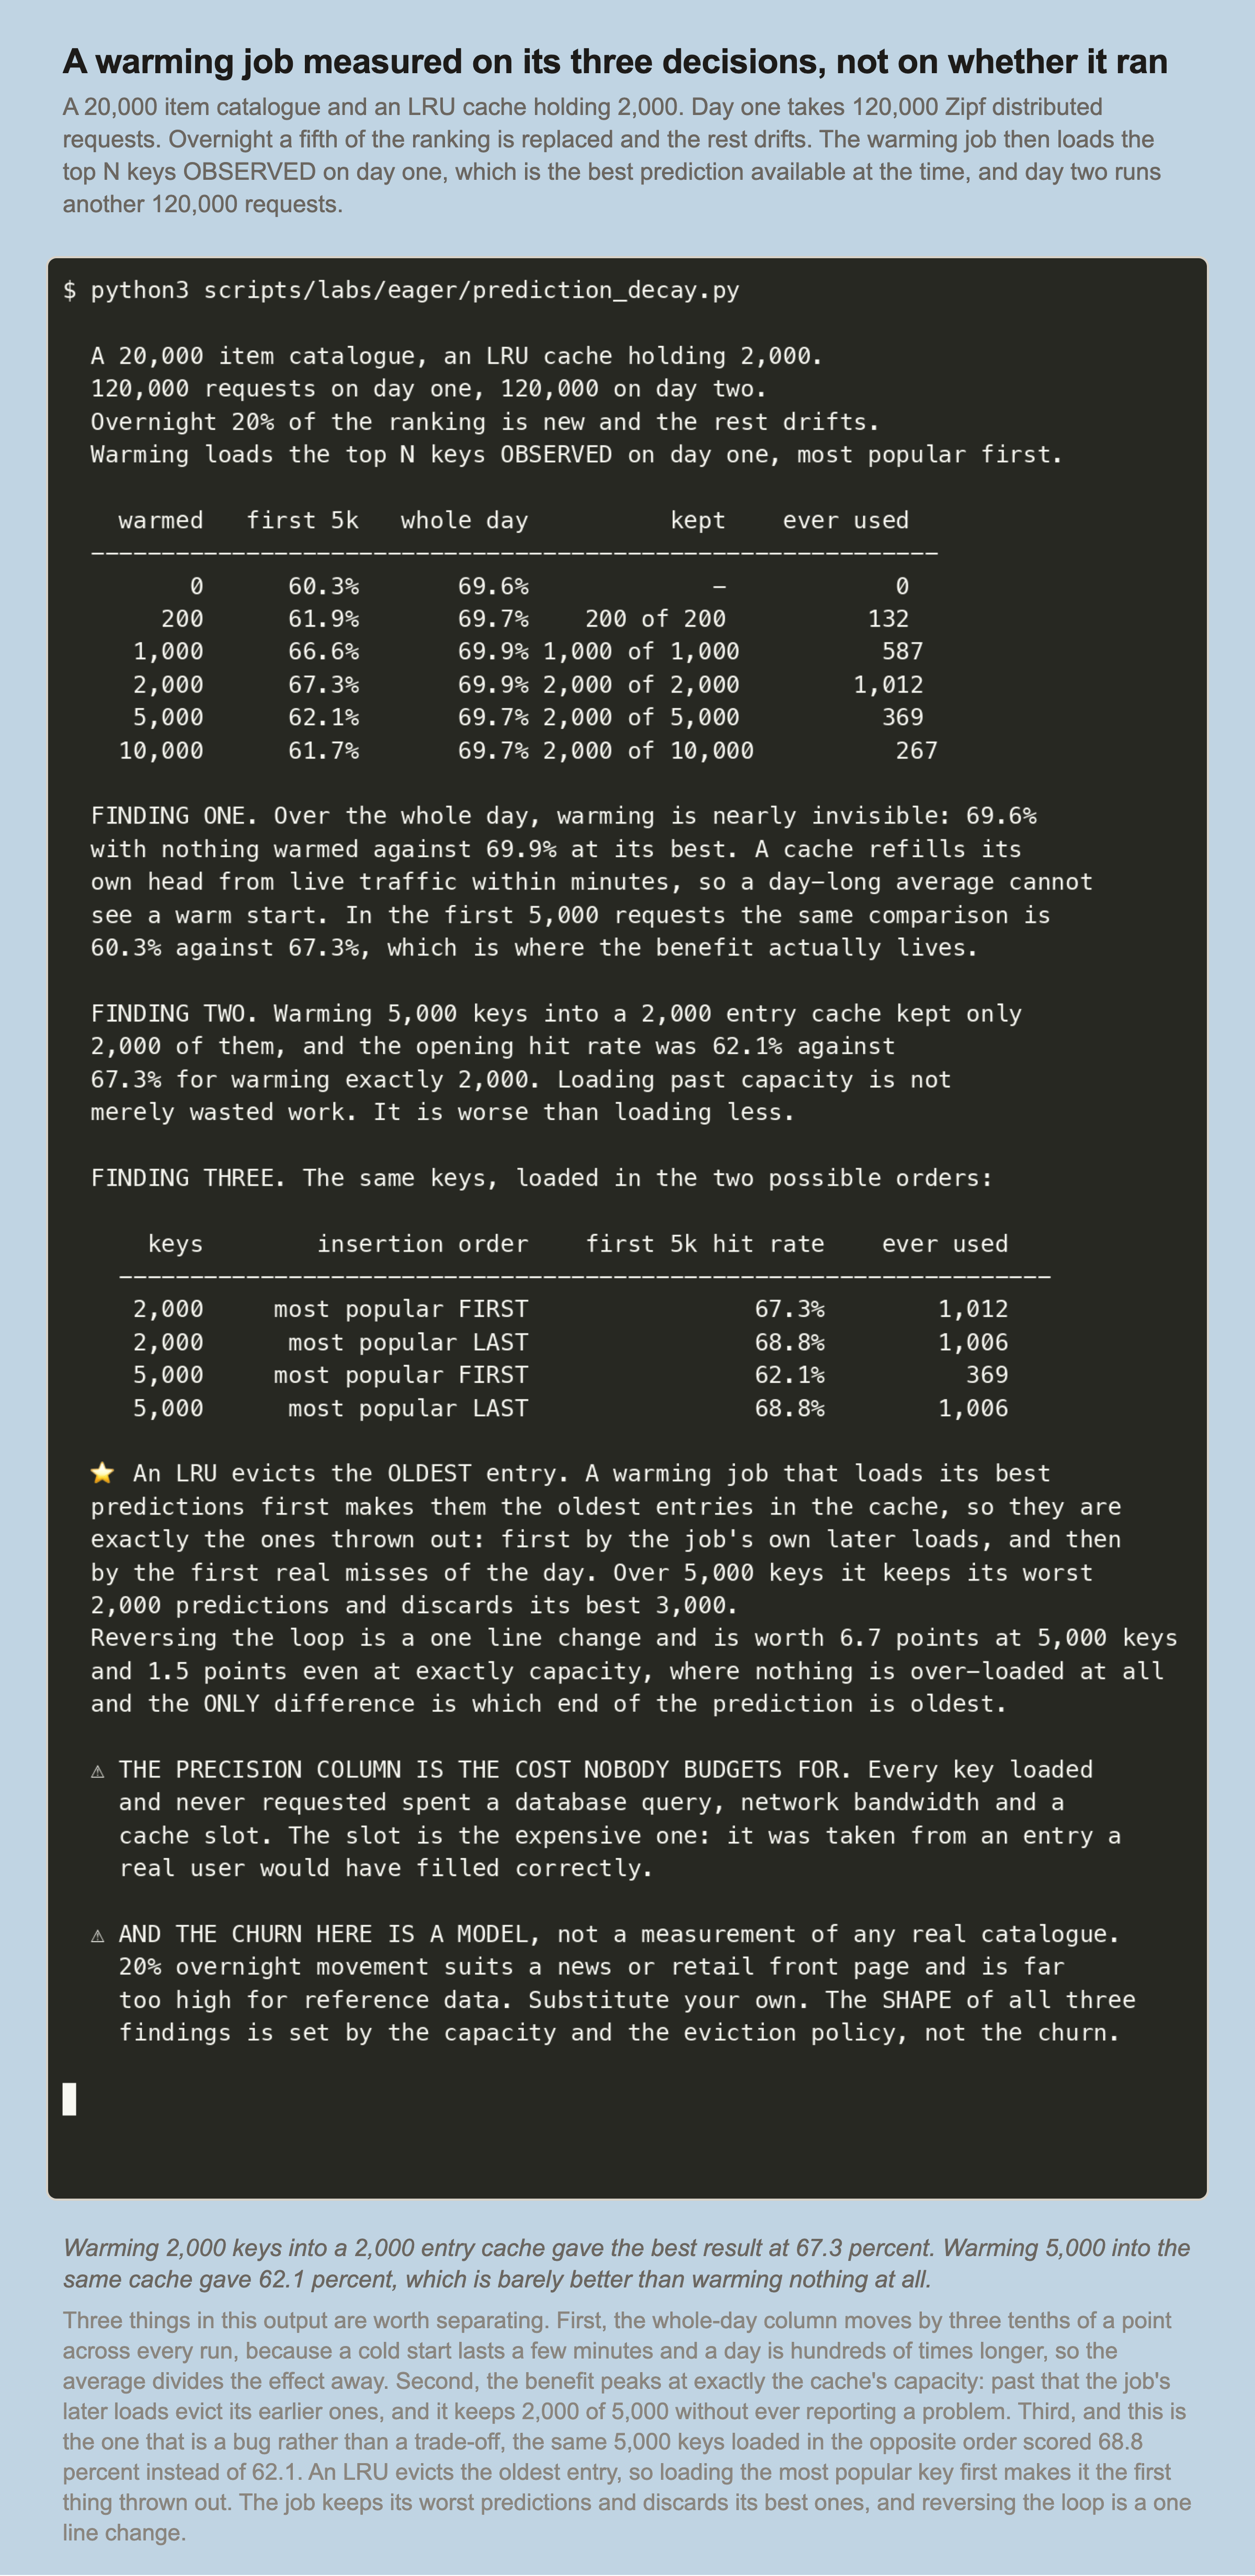
The three findings in the output are independent of each other. One is about the window you measure over, one is about capacity, and one is about a single line in the loading loop.
The First Thing To Get Right Is The Window
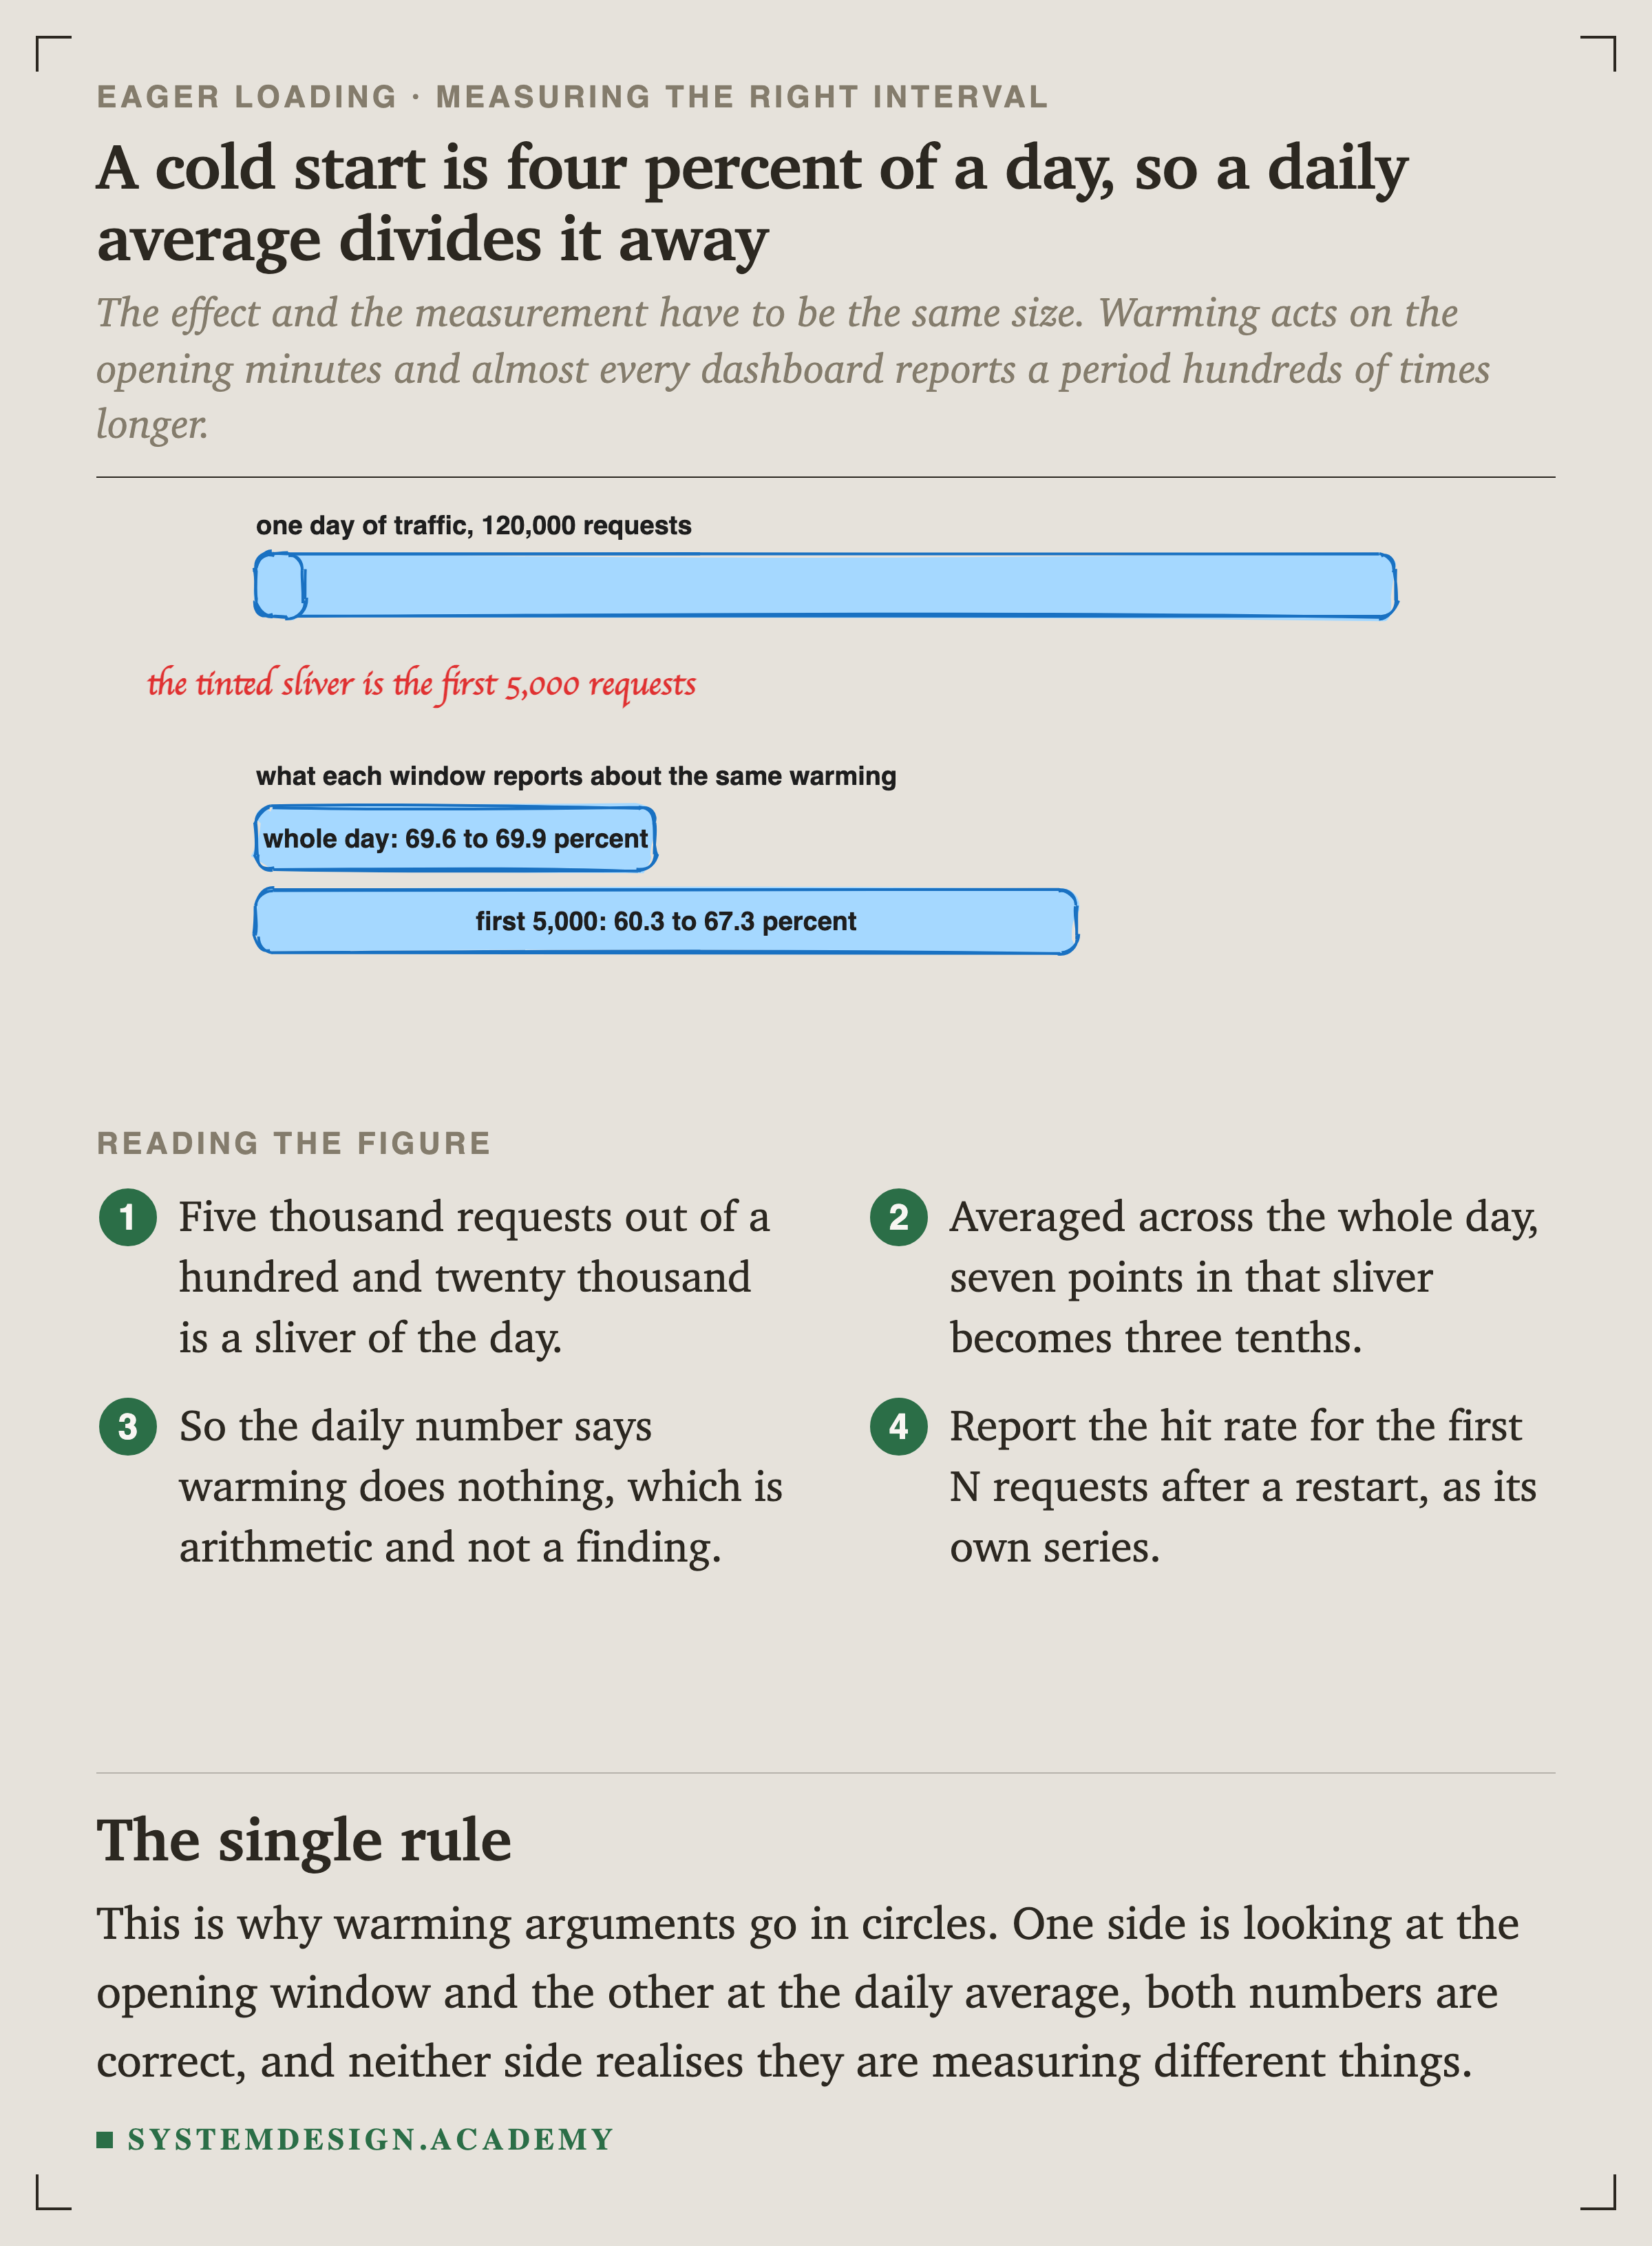
Before any of the results mean anything, the interval has to be right, because the obvious interval makes warming look pointless.
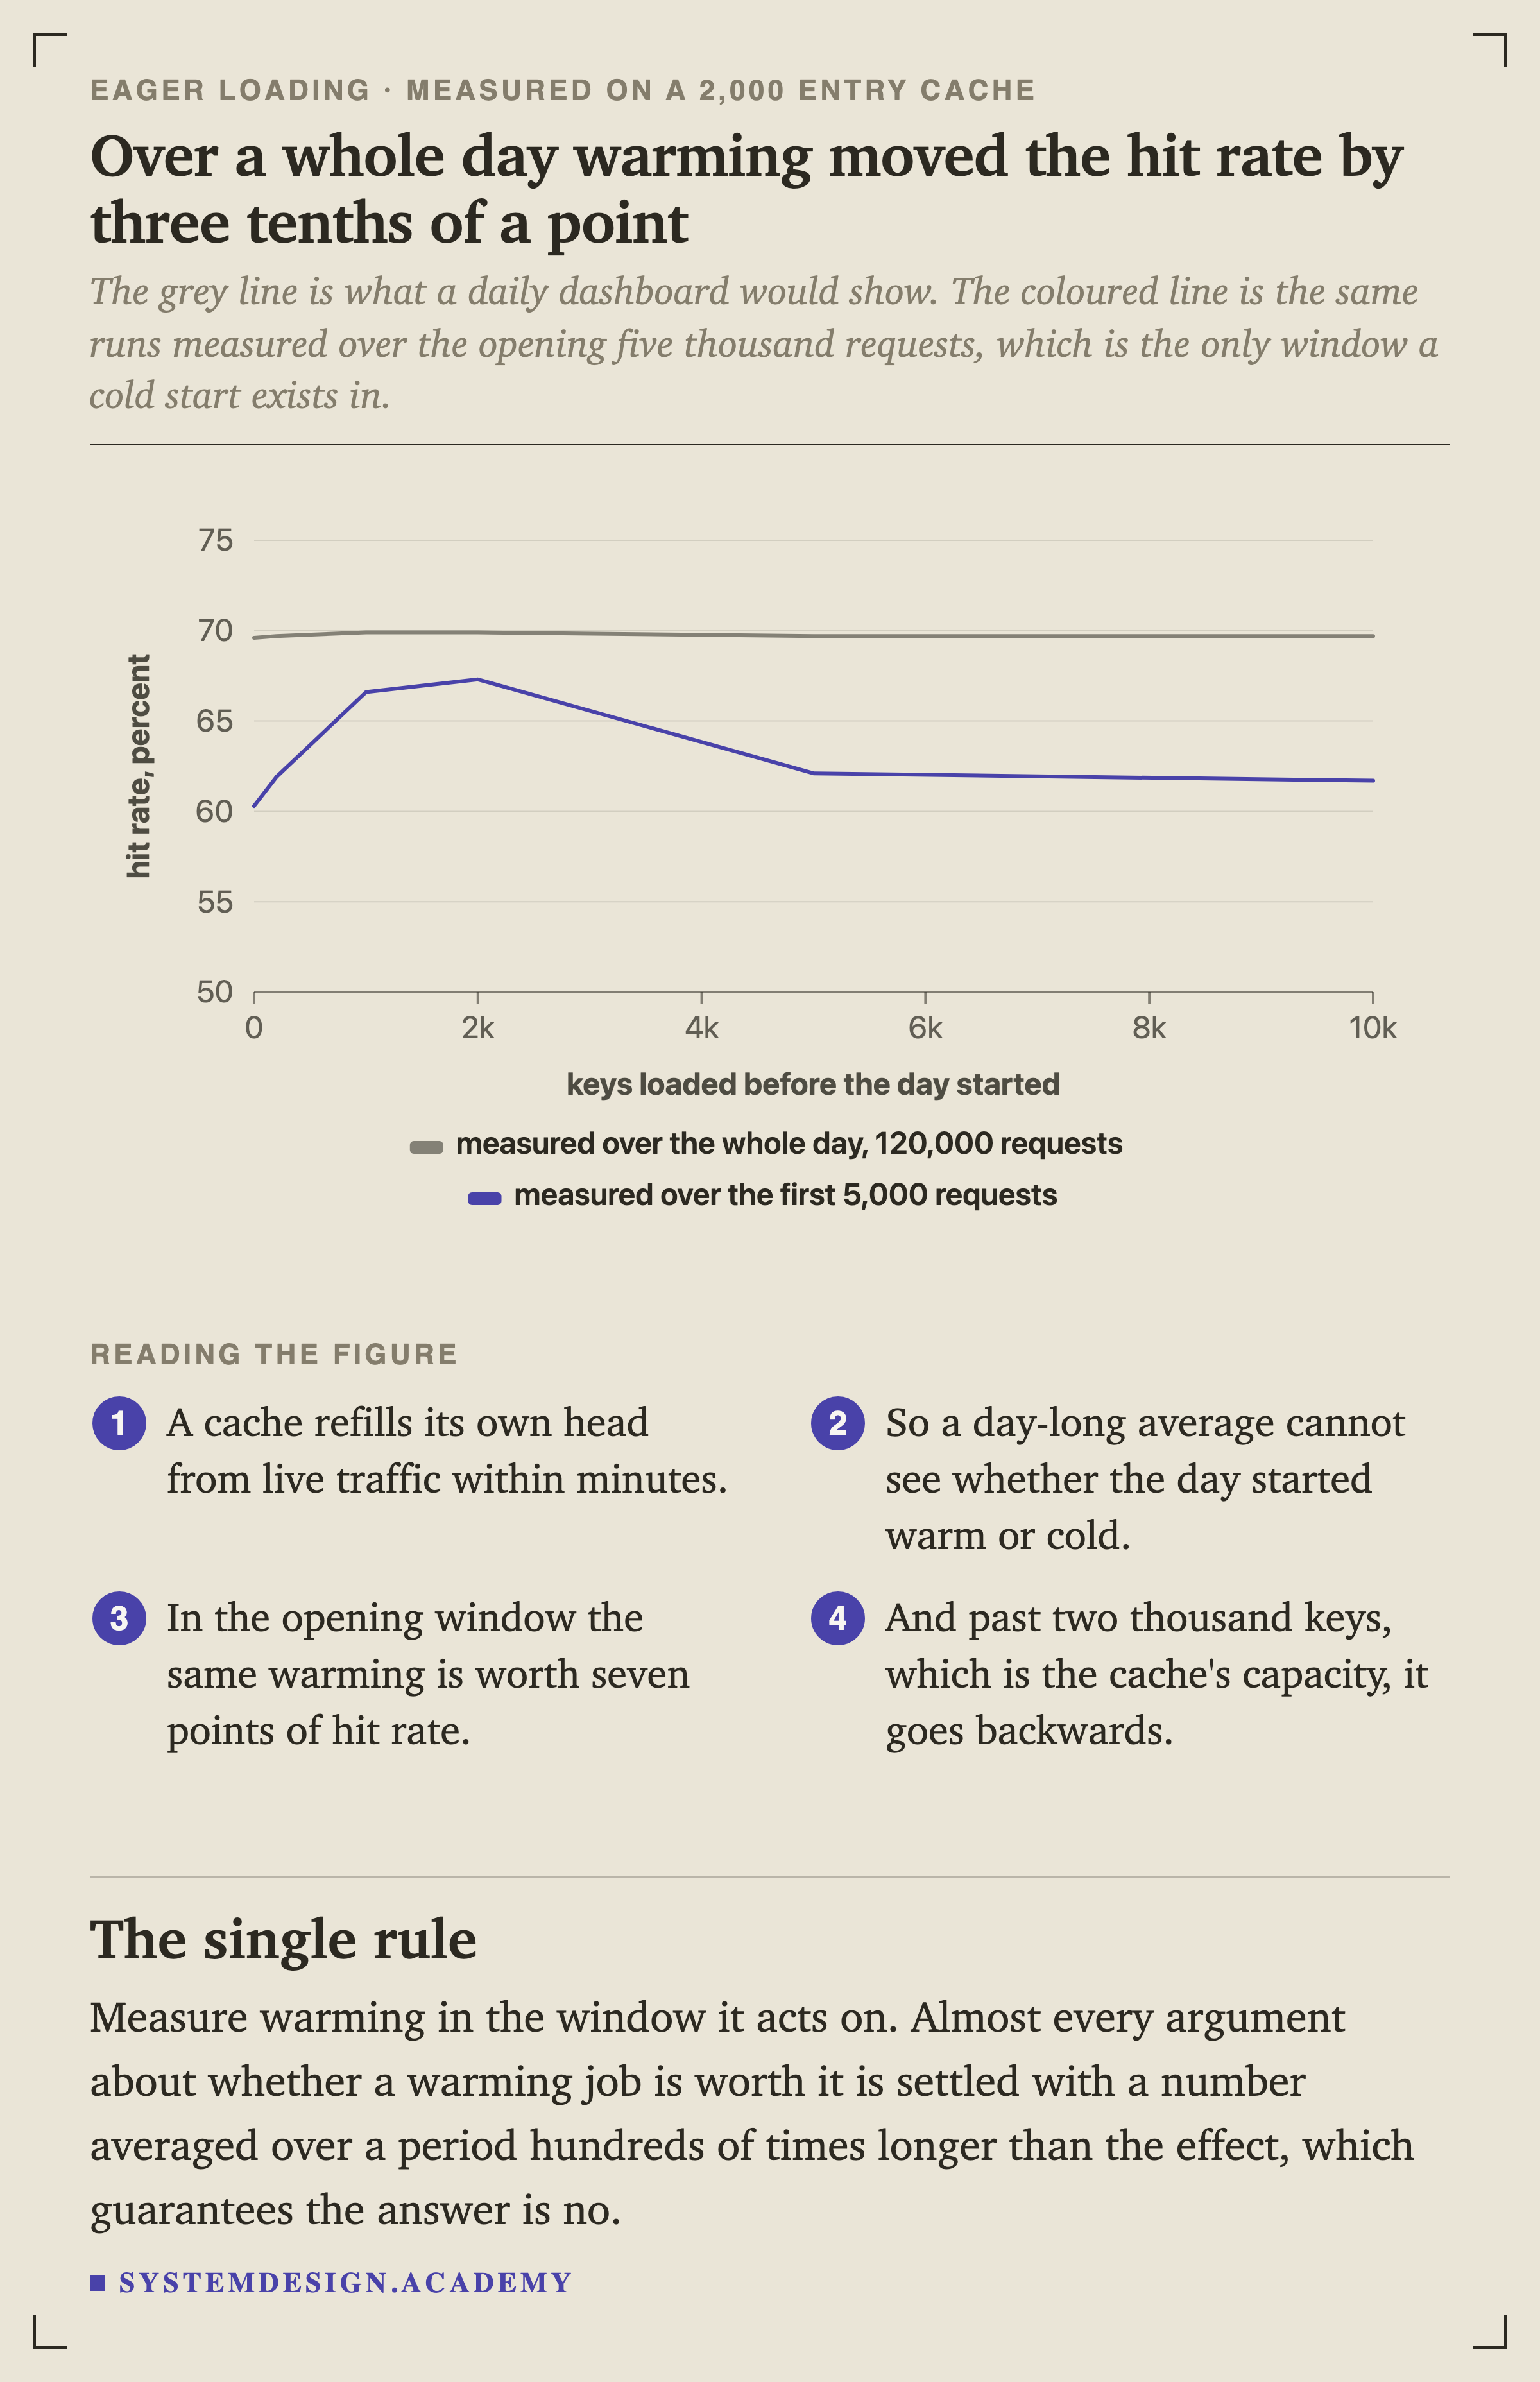
The grey line is what a daily dashboard shows. The coloured line is the same runs measured over the opening five thousand requests, which is the only interval a cold start exists in.
A cache refills its own head from live traffic within minutes. That was the finding in the previous lesson, where the first five thousand requests took the hit rate to fifty-nine percent on their own. So by the time a day is over, the difference between starting warm and starting cold has been averaged against hundreds of times more traffic than the effect ever touched.