The Line Nobody Reads
Five lessons have printed EXPLAIN output and pointed at one word of it. The rest of the line is the planner showing its working, and it is where every plan decision comes from.
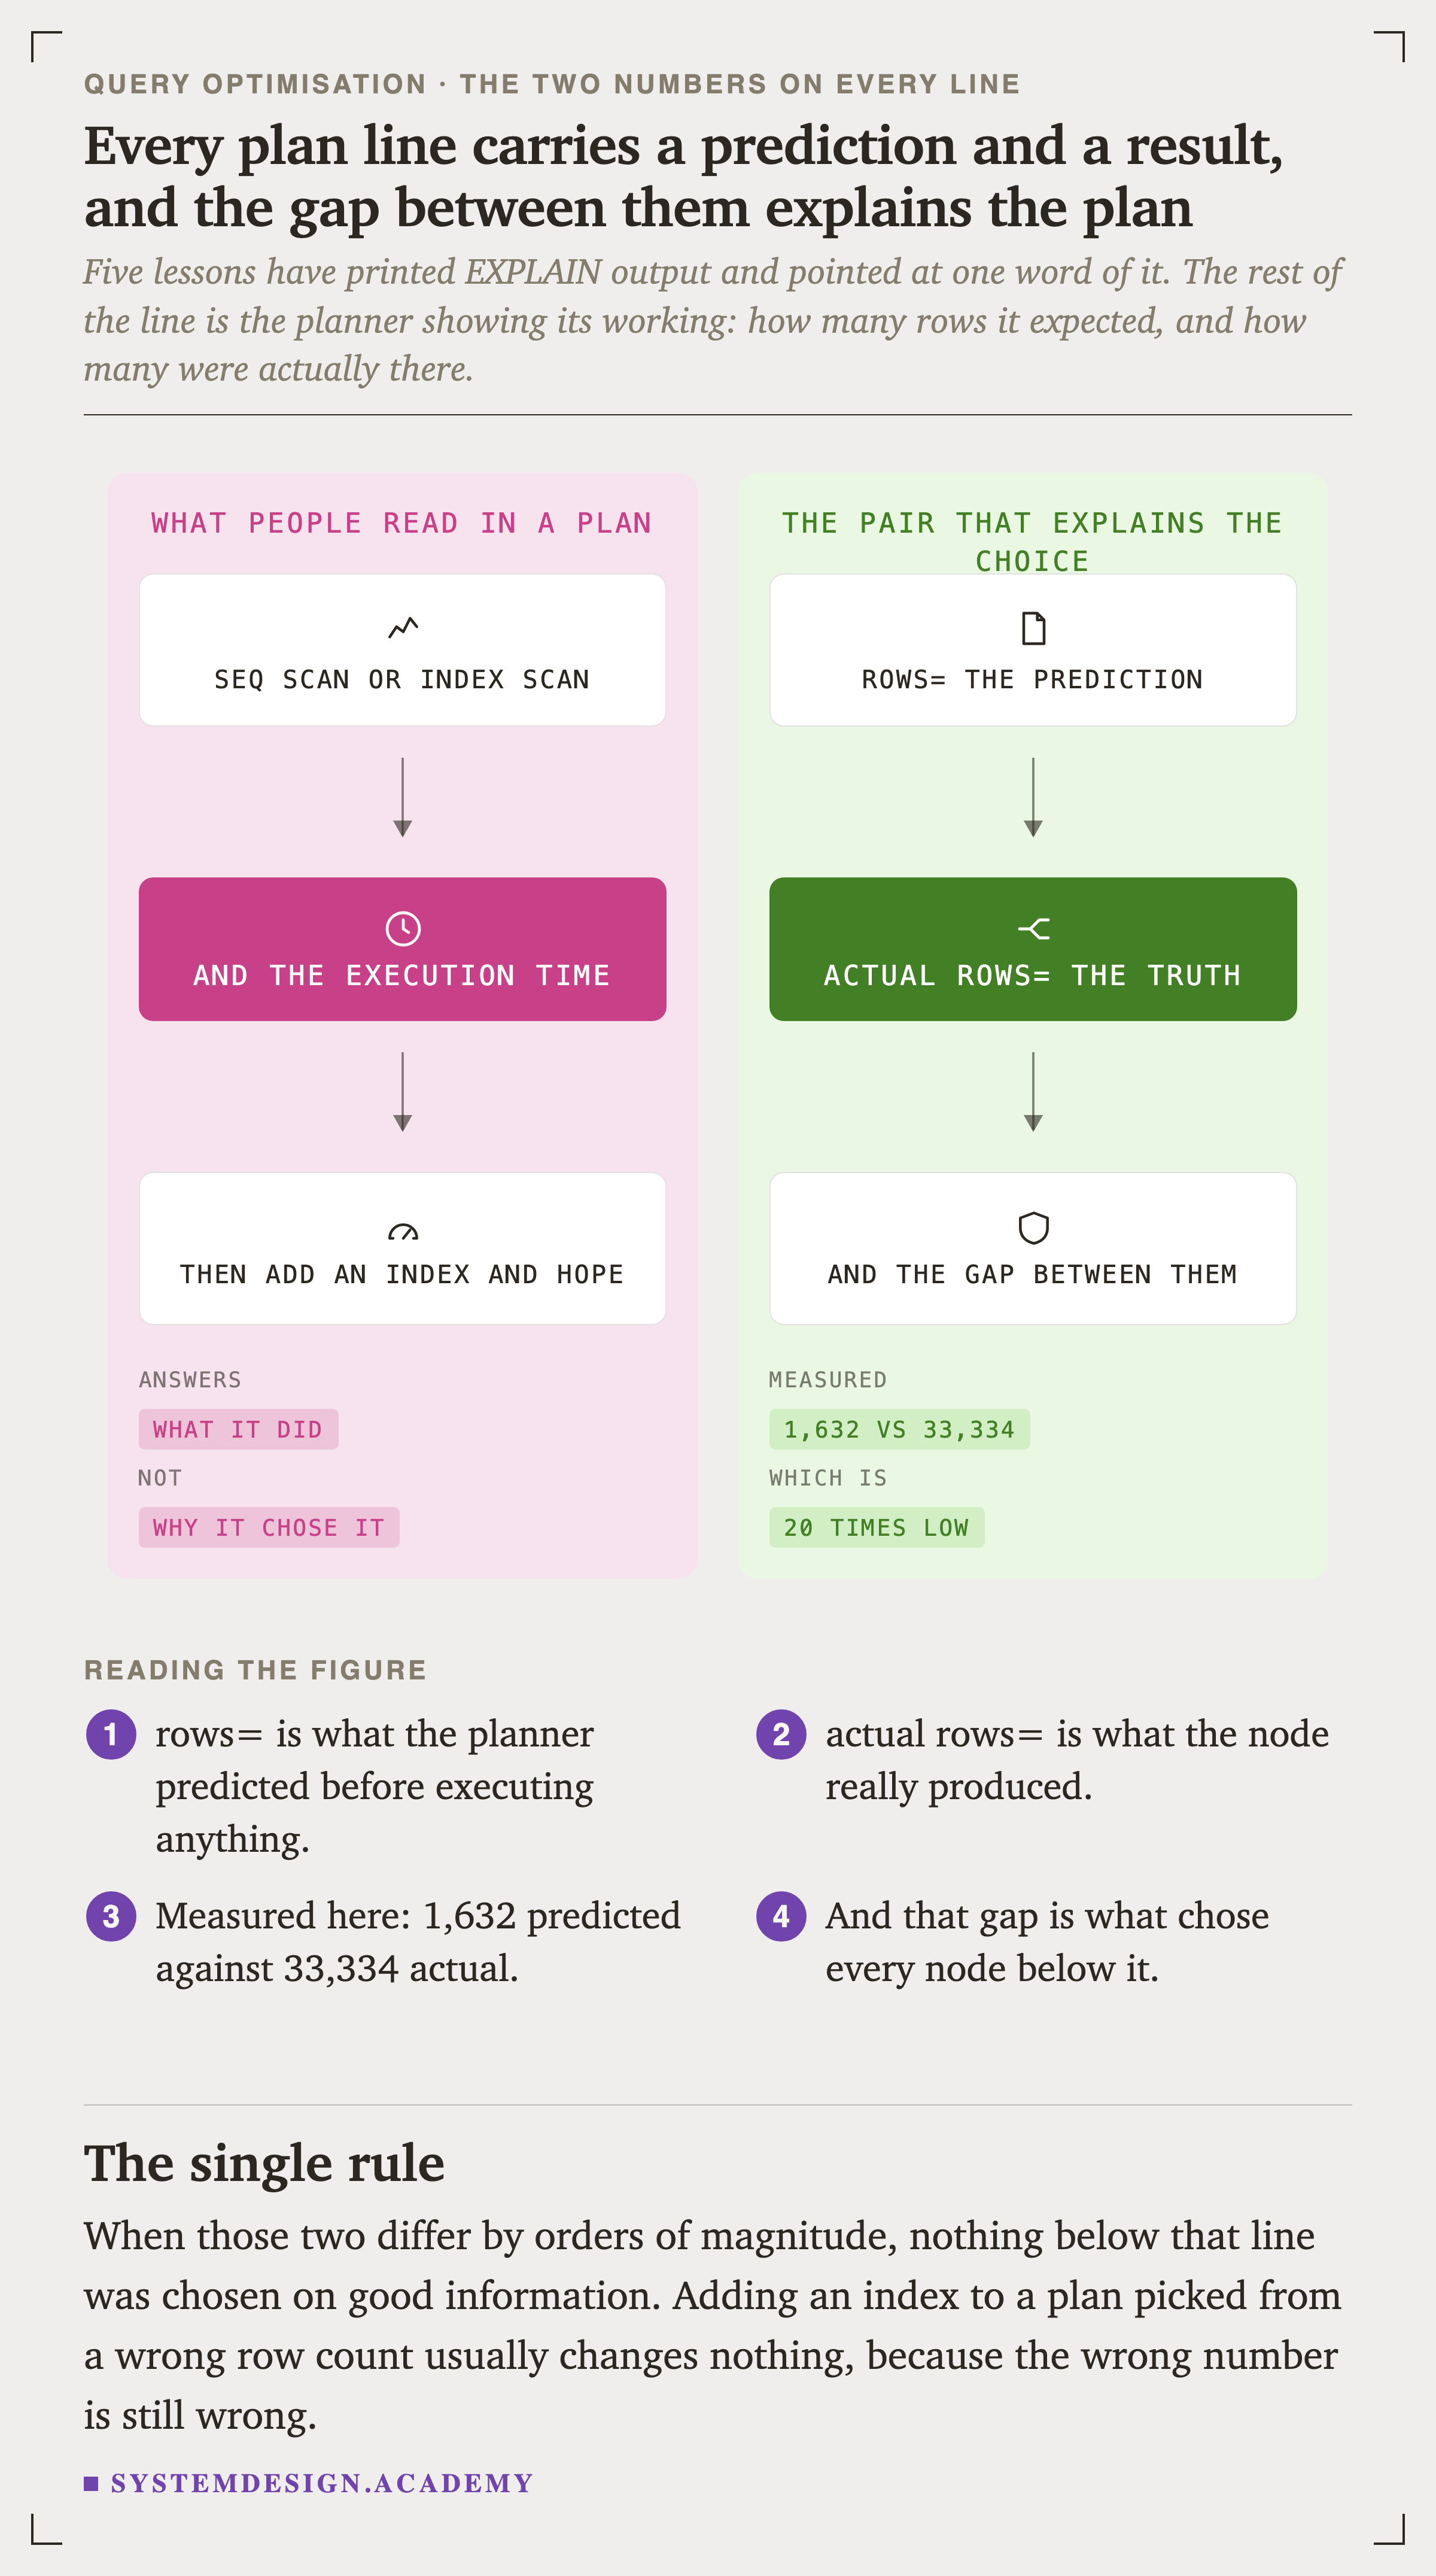
rows= is what the planner expected before executing anything. actual rows= is what the node really produced.
When those two differ by orders of magnitude, nothing below that line was chosen on good information. Adding an index to a plan picked from a wrong row count usually changes nothing.
What The Planner Predicted
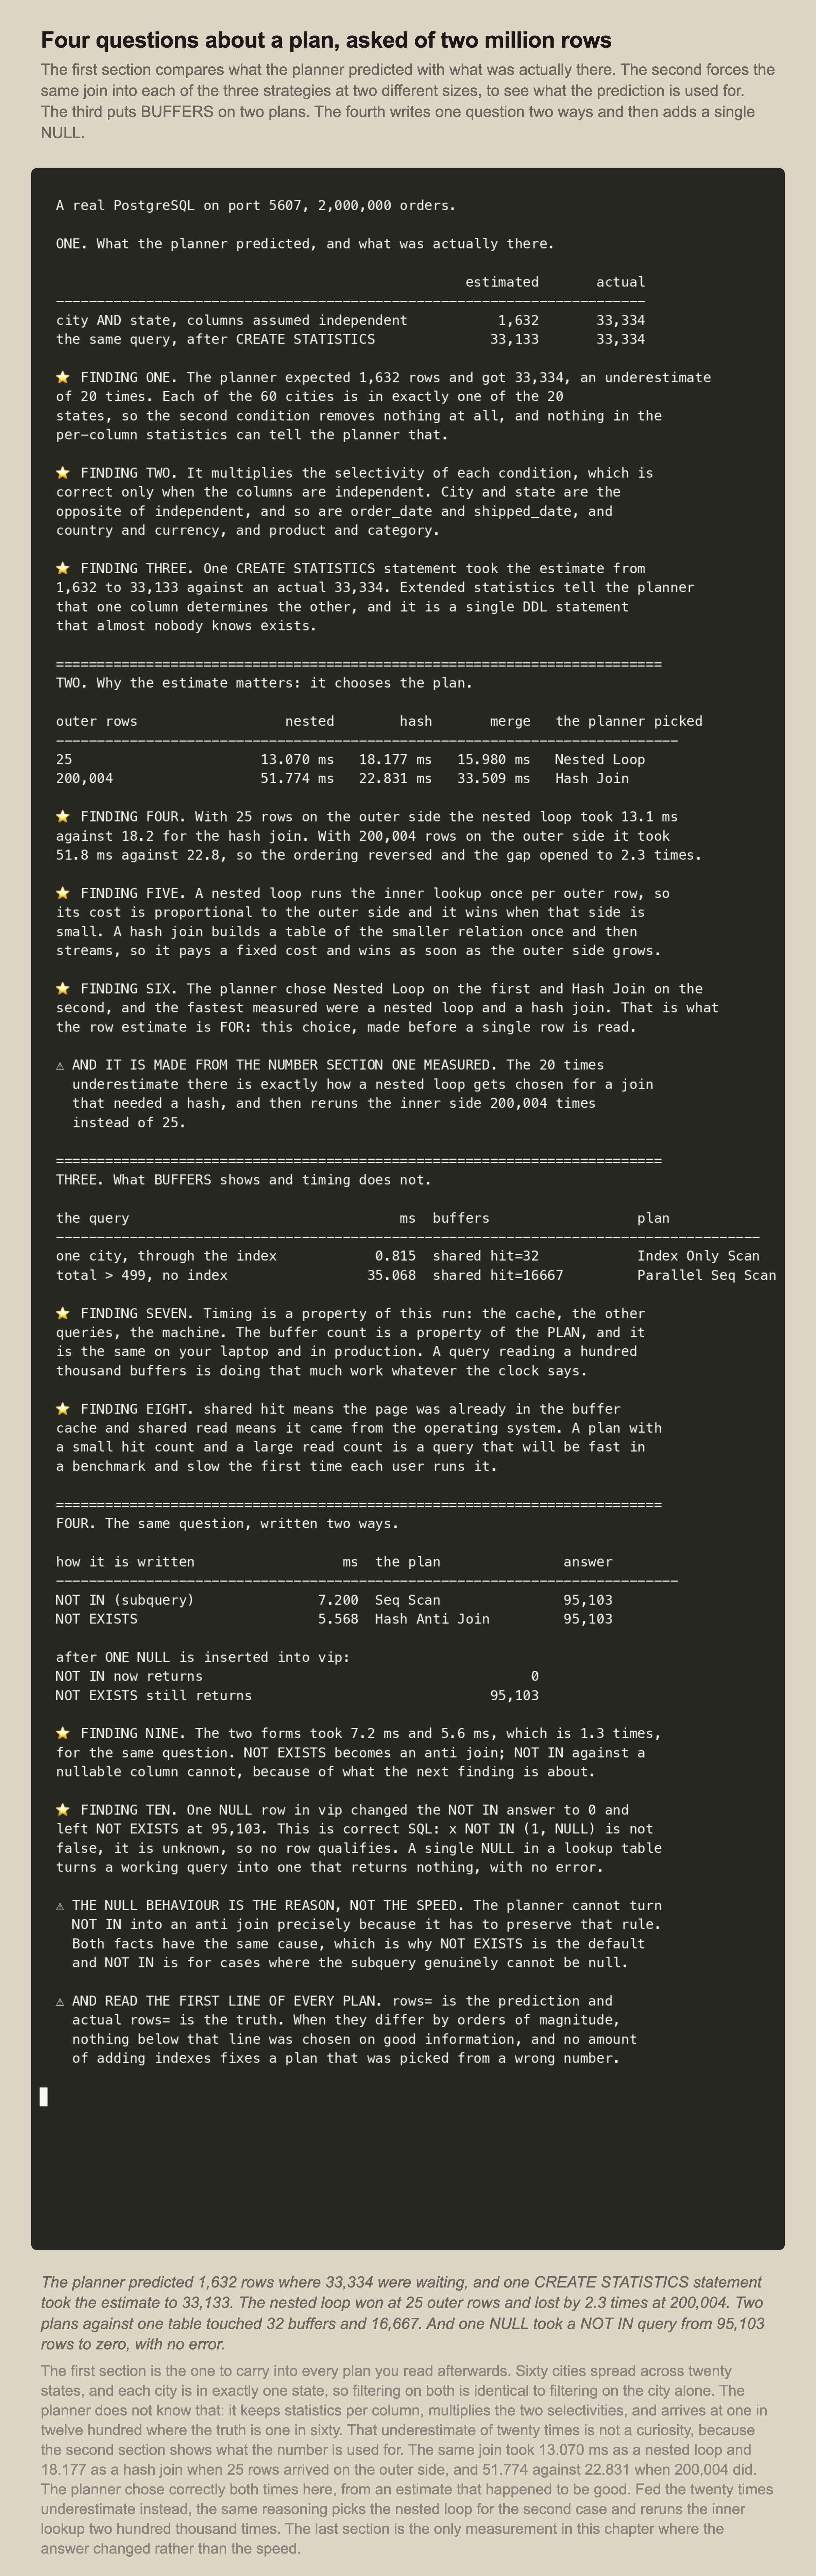
Every plan here is a real plan from EXPLAIN with ANALYZE and BUFFERS, against a PostgreSQL the lab starts and tears down.
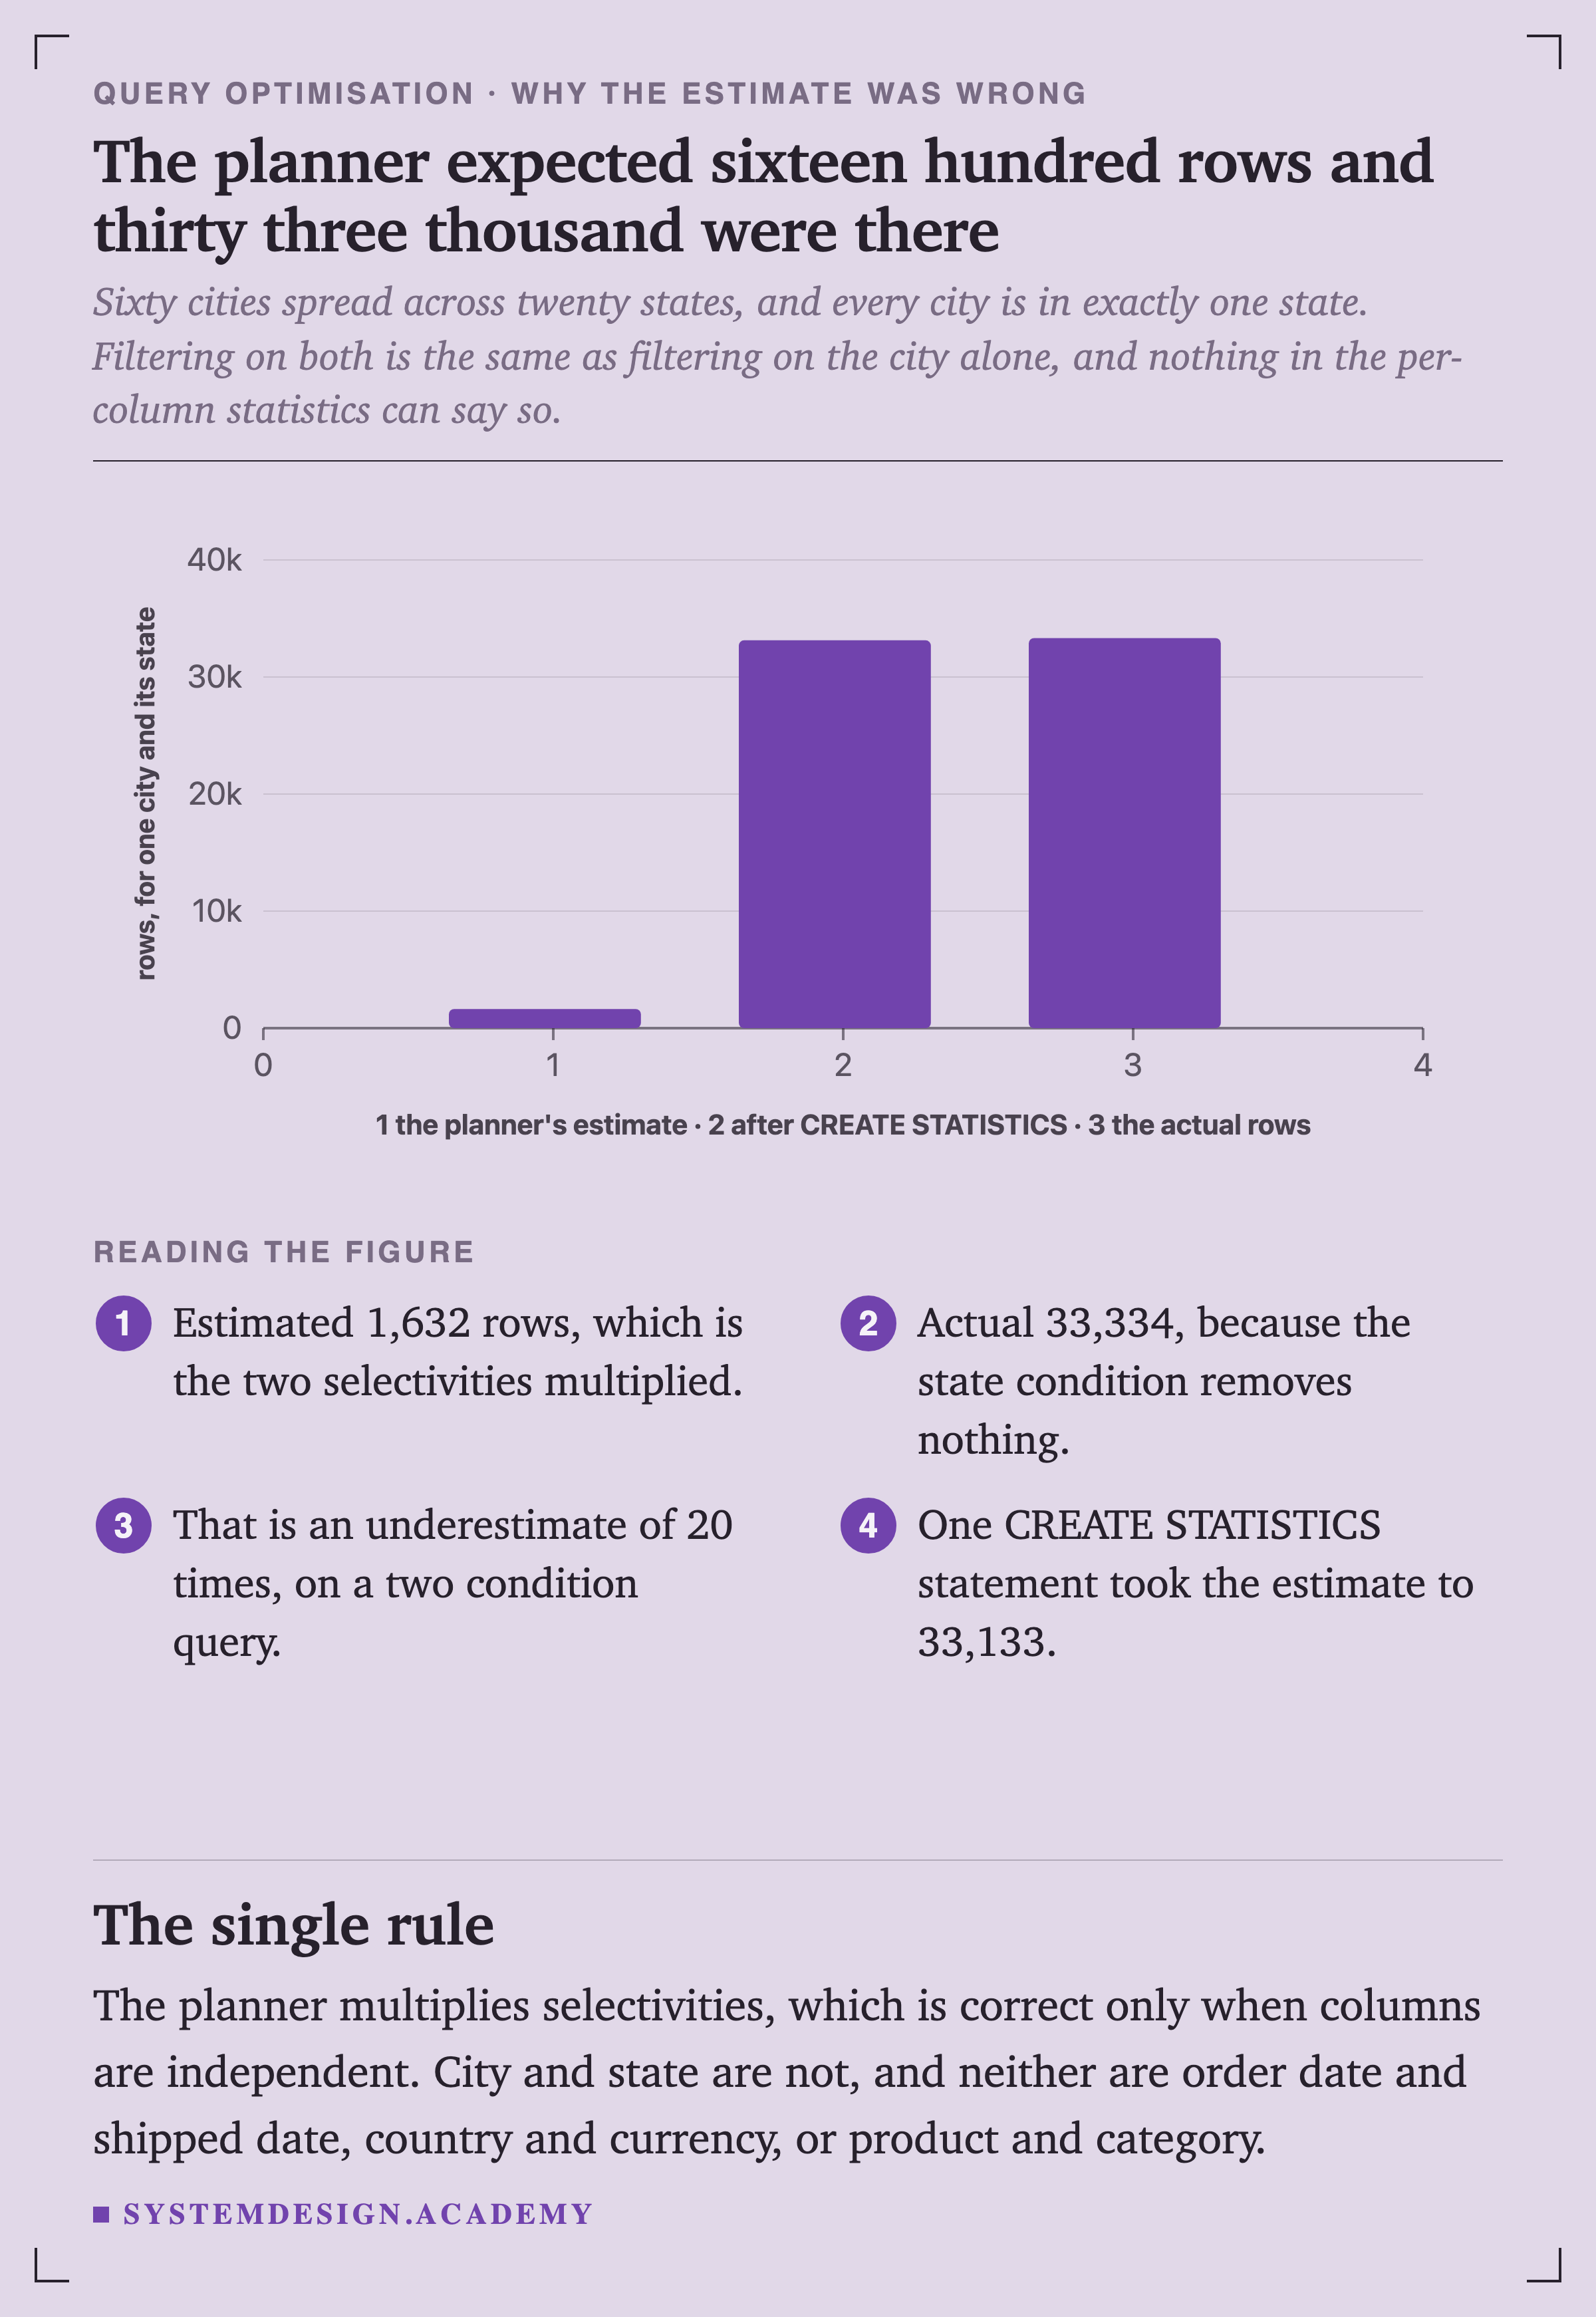
Sixty cities spread across twenty states, and every city is in exactly one state. Filtering on both is the same as filtering on the city alone.
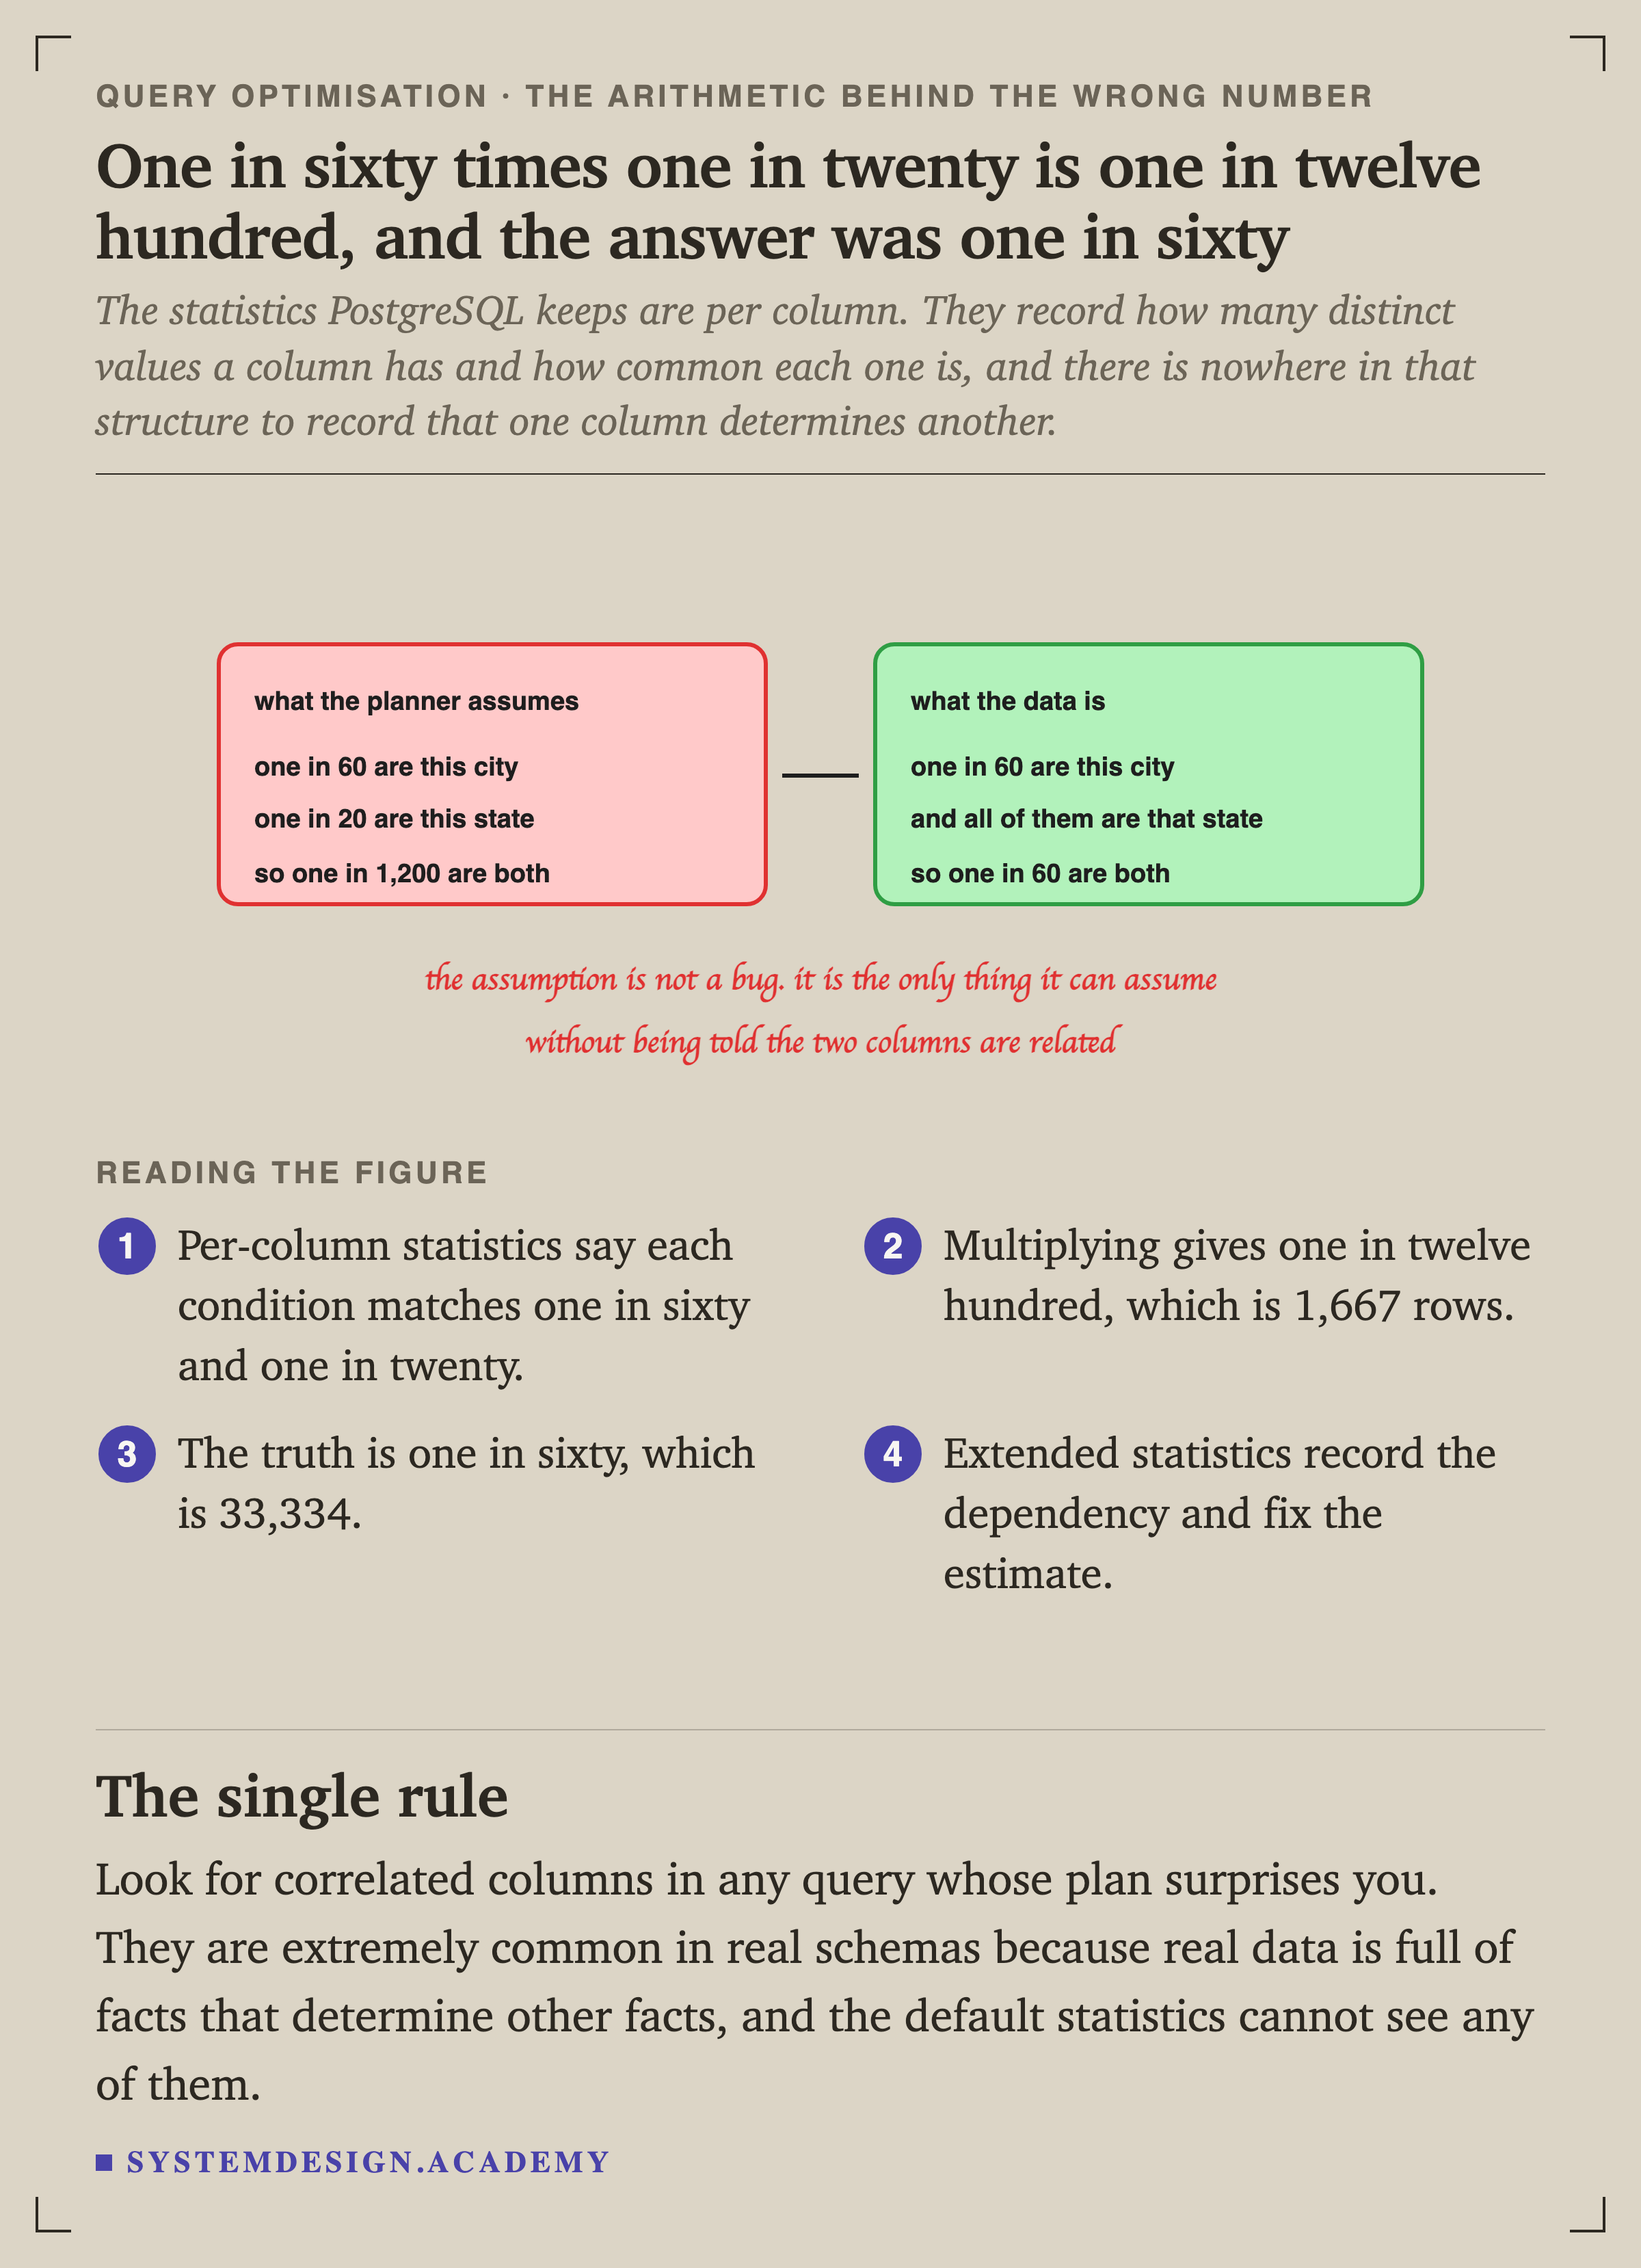
The statistics PostgreSQL keeps are per column. There is nowhere in that structure to record that one column determines another.
Correlated columns are everywhere in real schemas, because real data is full of facts that determine other facts. Order date and shipped date, country and currency, product and category are all the same shape.