The Team That Built a Dashboard and Still Could Not Say What Was Wrong
The dashboard is green. Average helpfulness 4.2, average correctness 4.4, tone 4.5, each scored by an LLM judge reading every reply on a 1 to 5 scale. Two weeks after launch the support agent still feels off to everyone who uses it, and nobody can say more than that. The green numbers and the felt wrongness cannot both be right, and the numbers are winning the argument only because they are numbers.
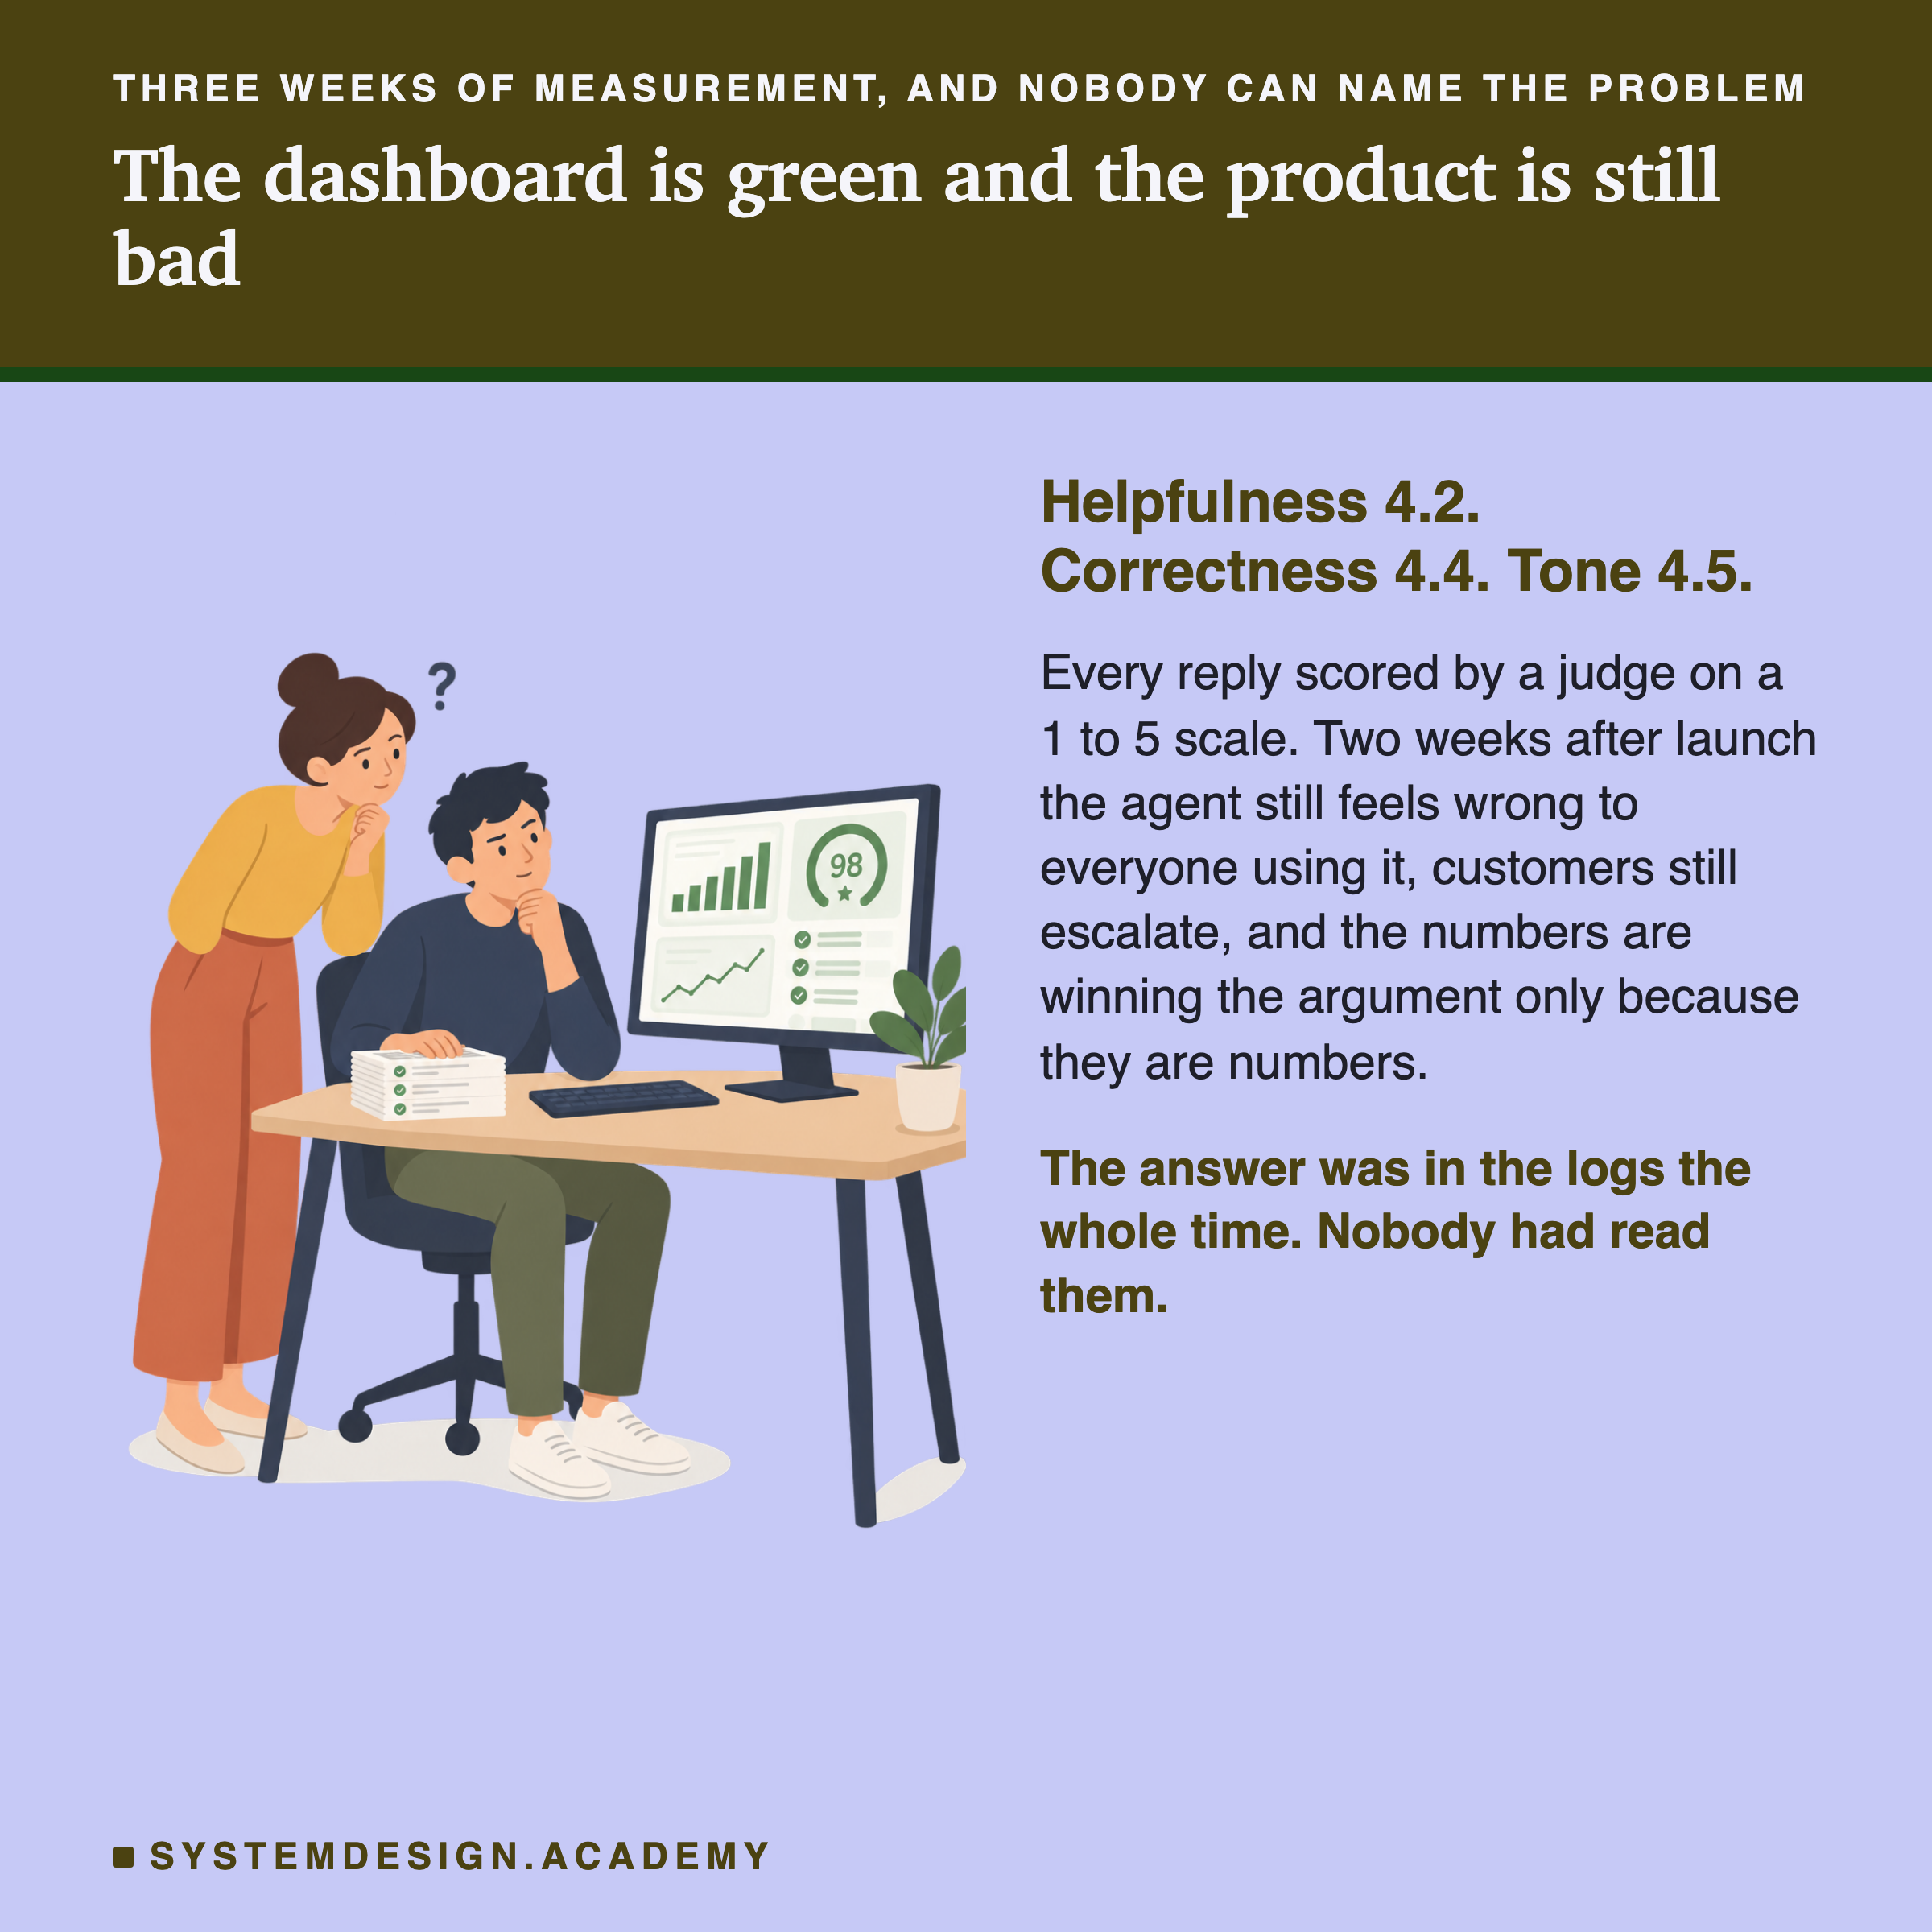
The agent is still bad. Customers still escalate. The dashboard says 4.2 and the support queue says otherwise, and now the team trusts the dashboard less than they trust the queue. They spent three weeks building measurement infrastructure and they still cannot answer the one question that matters: what, specifically, is this thing getting wrong, and how often?
Here is the part that stings. The answer was sitting in the logs the entire time. They had thousands of real traces, the actual inputs and the actual replies, and nobody had read them. They jumped straight to metrics because reading transcripts by hand felt like the unglamorous part, the part a real engineer automates away. So they automated away the one step that would have told them what to measure.
A metric is an answer to a question. If you have not read your failures, you do not yet know the question, so every metric you pick is a guess dressed up as rigor.
The deeper problem is that they tried to leap from a feeling to a number without building anything to carry them across. Evaluation lives between two worlds. On one side is the qualitative work of a human reading messy outputs and forming a judgment in words. On the other is the quantitative world of counts and dashboards. There is a crossing between them, and skipping it drops you in the water.
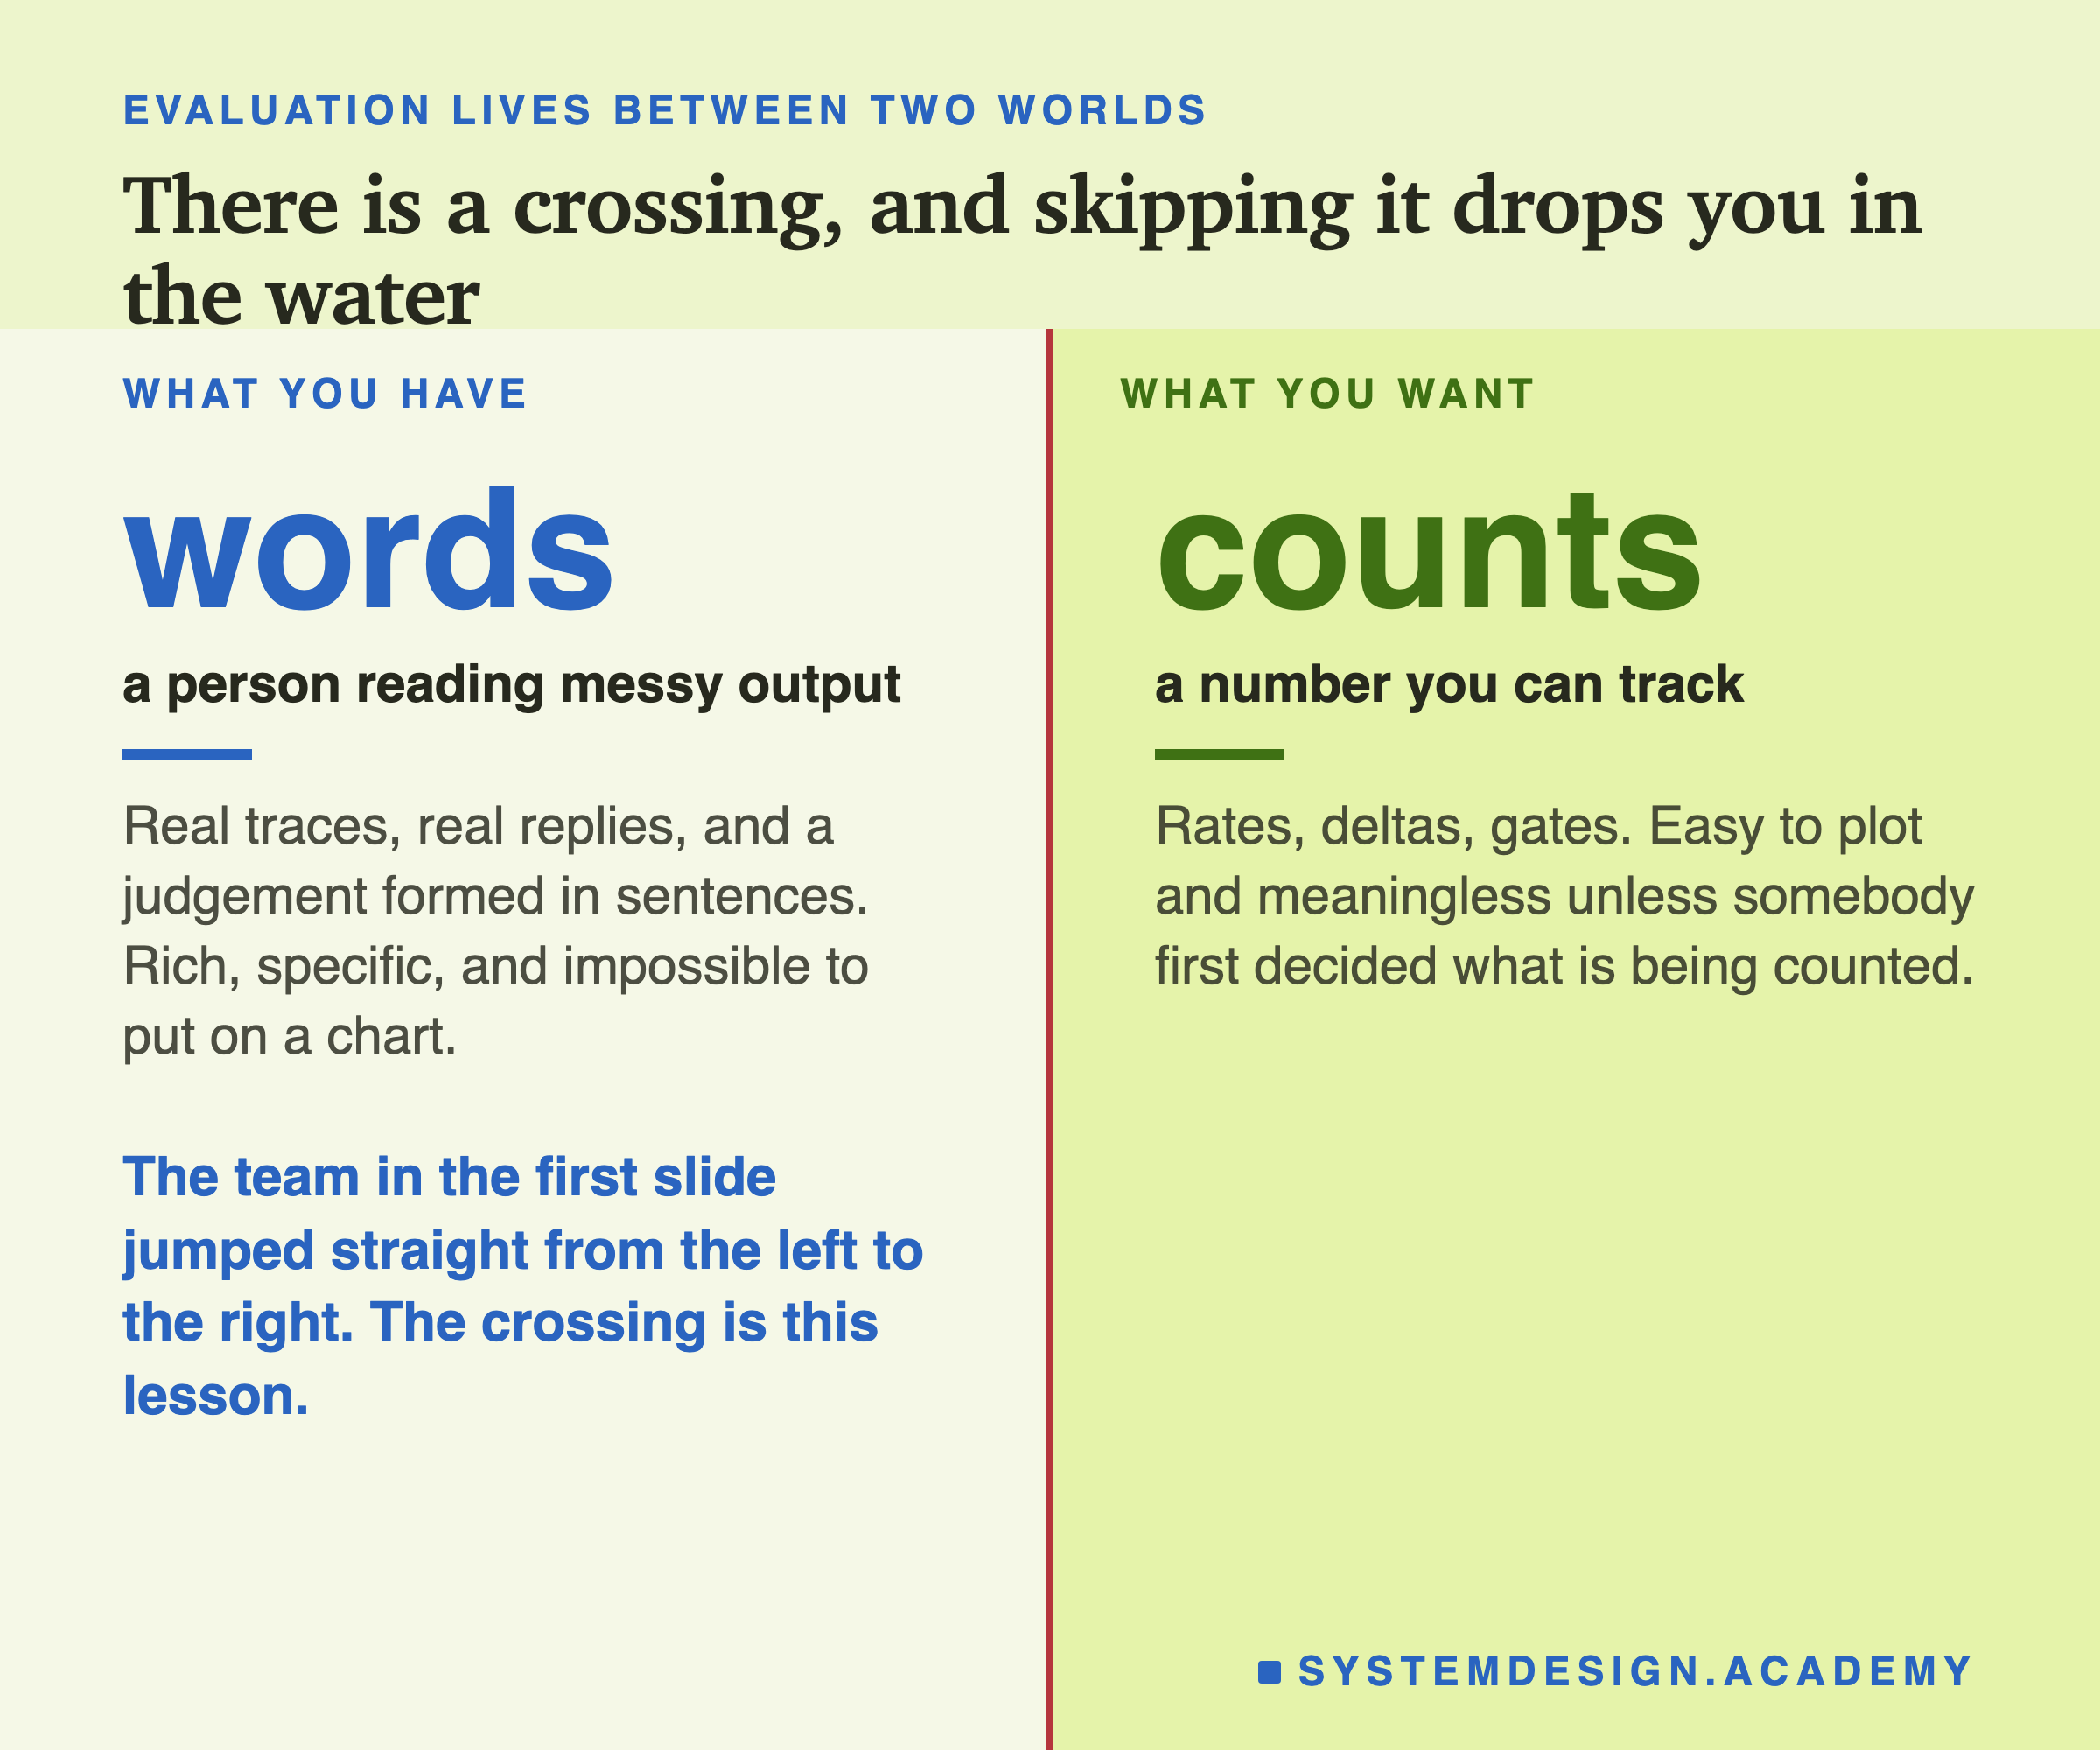
This lesson is about the crossing they skipped. Before you build a single metric or dashboard, you read real failures, by hand, and you let them tell you what your evals should measure. Hamel Husain teaches this to teams for a living, and he is blunt about the ratio. Most of the real work in evals, on the order of 60 to 80 percent, is this reading and analysis. The infrastructure is the rest. The infrastructure is the easy 20 percent, and it is worthless pointed at the wrong target.
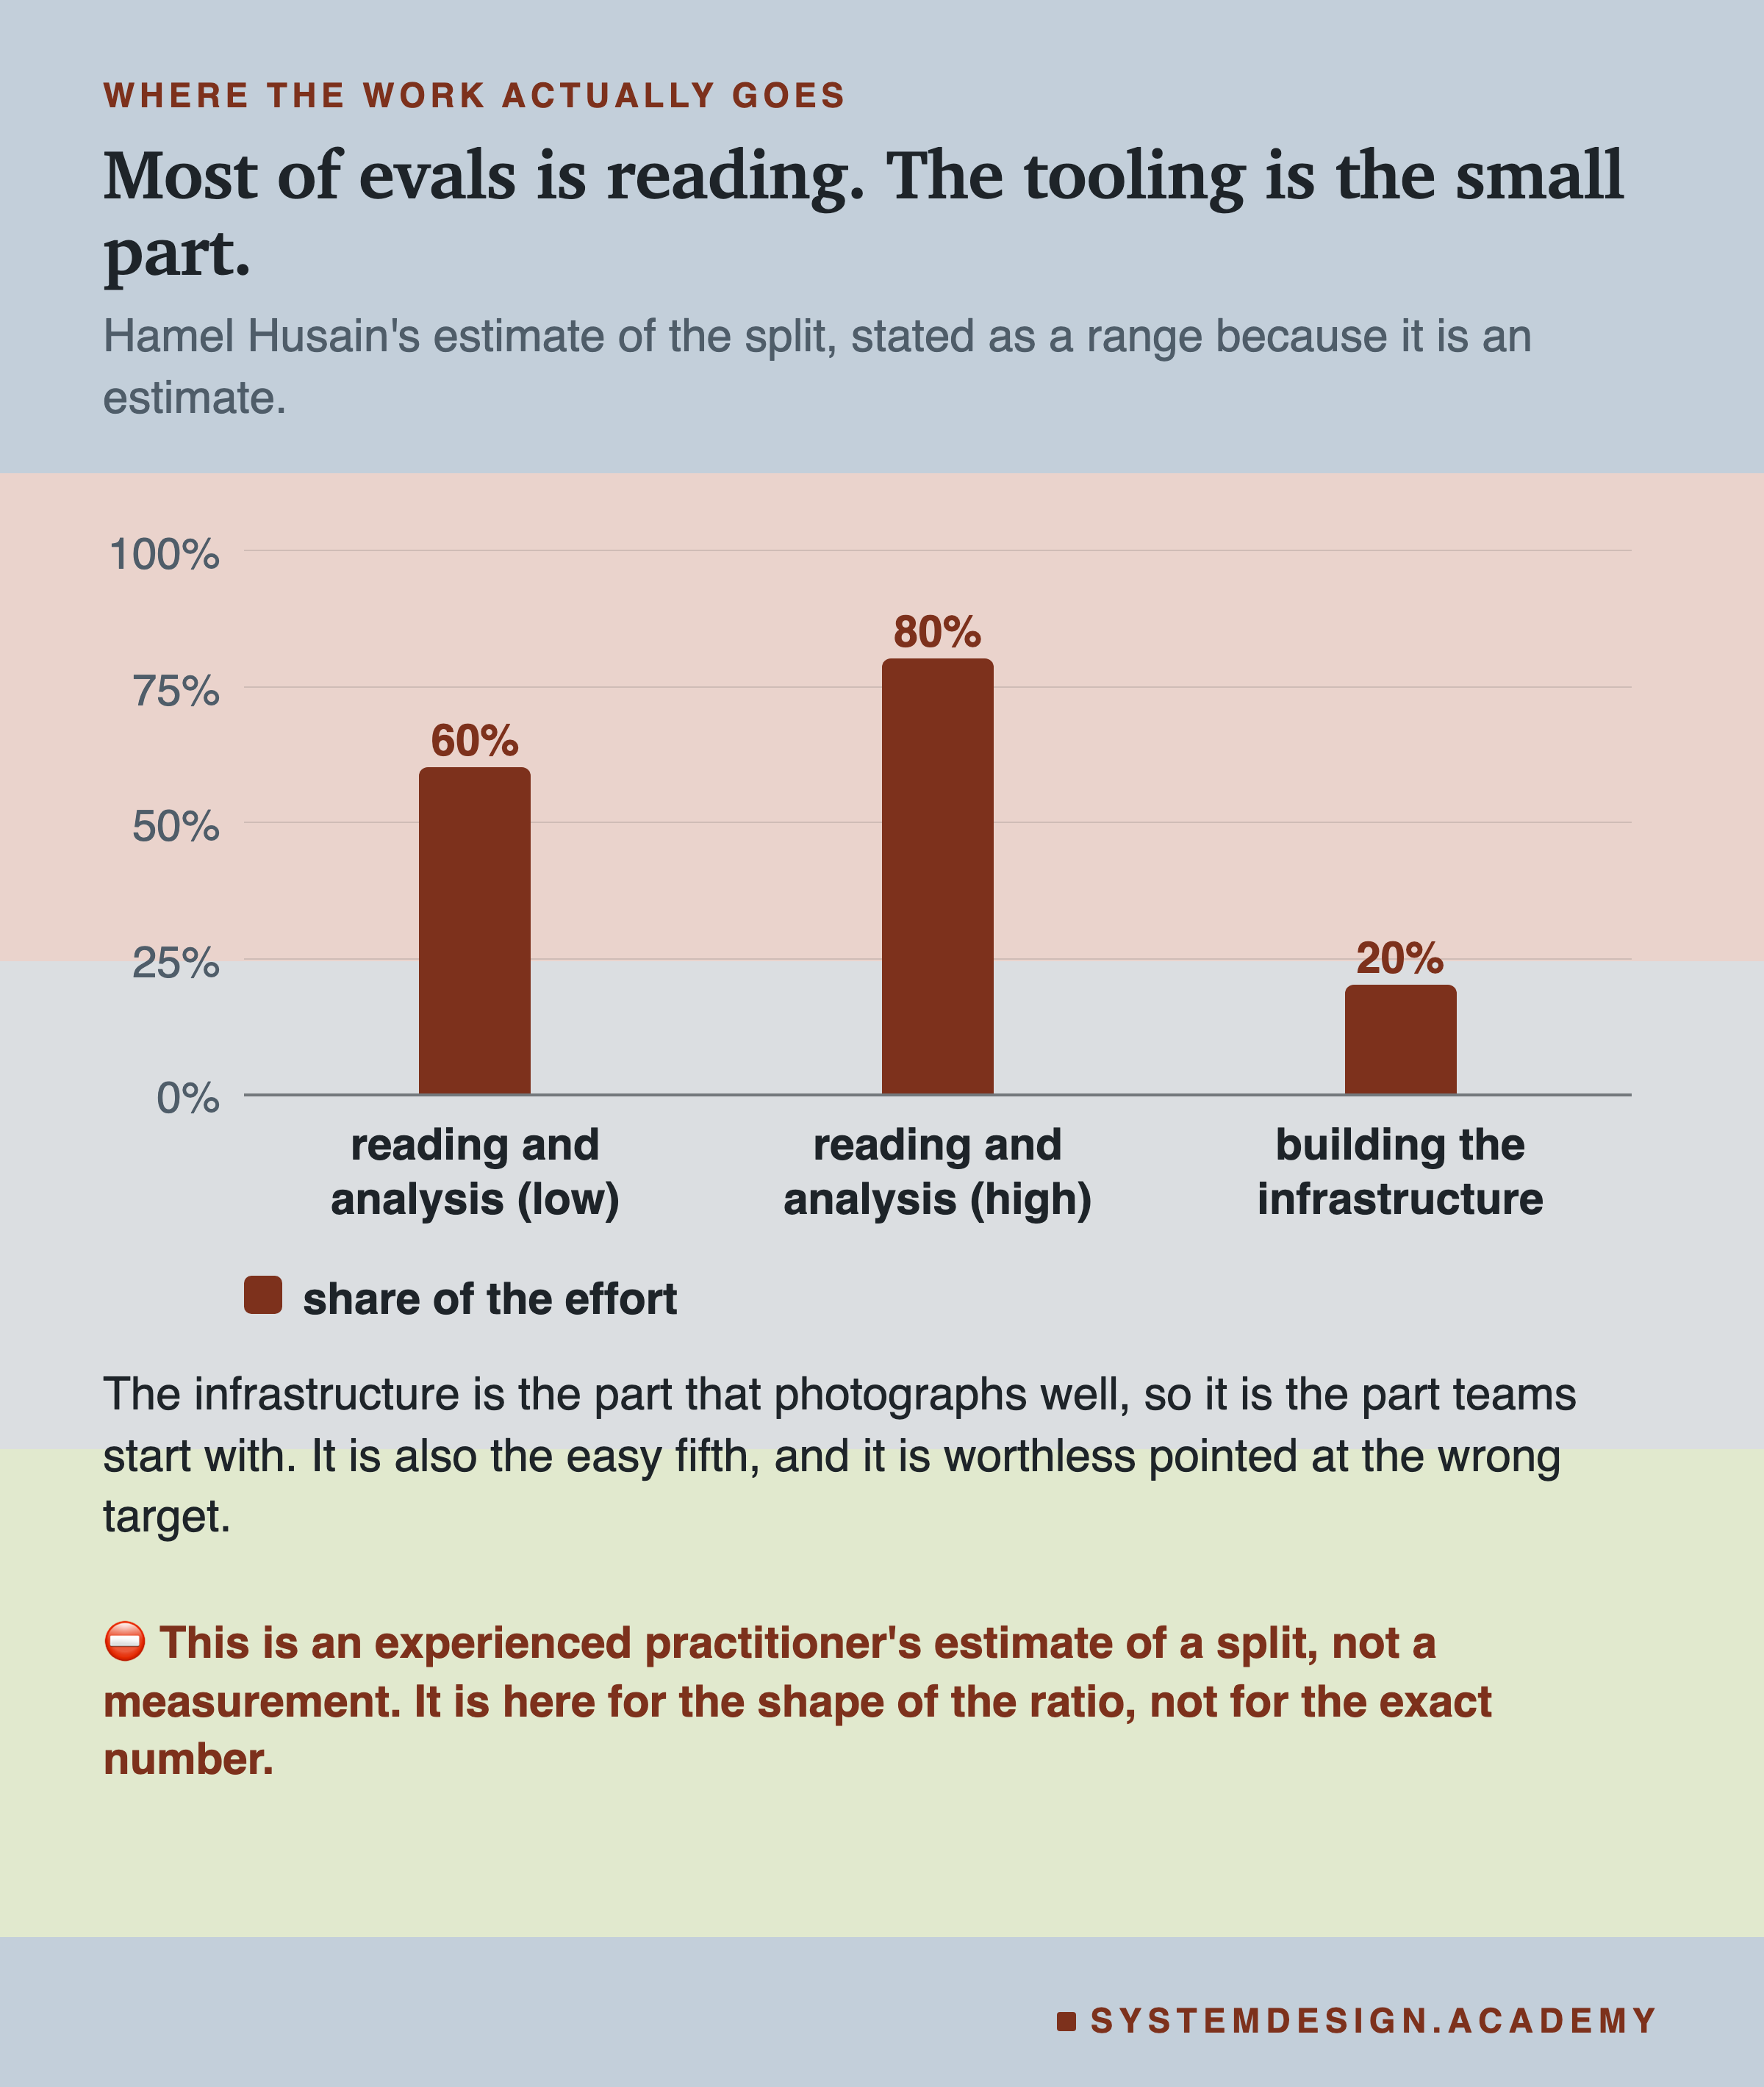
Sit with the ratio for a second, because it is the opposite of how most teams plan the work. The part you can put in a sprint ticket, the judge and the dashboard and the CI wiring, is the small end. The part with no ticket, sitting and reading your own output, is most of it. That is also why it gets skipped: it does not look like engineering while you are doing it.