A Fuel Gauge That Never Complains
Imagine you drive an old car whose fuel gauge has a loose wire. Nothing warns you. The needle still points somewhere, the engine still runs, and every time you glance down the dashboard shows you a number. One day the needle has sat at half a tank for a week of long drives. Another day it points far past full, to a mark that is not even printed on the dial. The car does not stop you. It keeps driving until the tank is really empty, and then it stops in the middle of the road.
Looking back, there were signs. A needle that does not move for a week of driving is odd. A needle past the end of the dial is impossible. You did not need to know how much fuel was really in the tank to notice either of those. You only needed to know what a normal needle looks like.
A model that has learned from examples is like that gauge. It always shows a number. When one of its inputs breaks, it does not stop and it does not warn you. This lesson asks the question the driver should have asked: which simple checks, run every day on what the model is given and what it answers, would have noticed the break before the real answers came in? I tested six such checks against seven kinds of break. Four of them did well. One of them raised an alarm every single day, broken or not. And the worst break got past all six.
Where This Lesson Starts
This is the fourth lesson of the chapter, and it uses the same public data and the same model as the first three: two years of hourly bike rentals in Washington, D.C., and a program that guesses how many bikes will be rented in an hour. The first lesson set up a fair test, trained on the past and scored on the future, where the program missed by 44.07 bikes an hour on average. The second lesson showed how the world moves under a model and how the newest month of real answers tells you so. The third lesson broke one input at a time at serving time and measured the damage: from almost none to about five times the error.
Lesson 3 ended on a problem. The damage was real, but it only showed up once the true counts were known and compared with the guesses. In a real service the true counts come later: hours later for bikes, weeks later for a loan, sometimes never. Until then, all you have is what the model was given and what it said.
So this lesson looks at that window. Before any real answer arrives, what can you check, what does each check catch, how often does it raise a false alarm, and what gets past all of them? I measured it, day by day, on the same 145 test days.
Eight Words for This Lesson
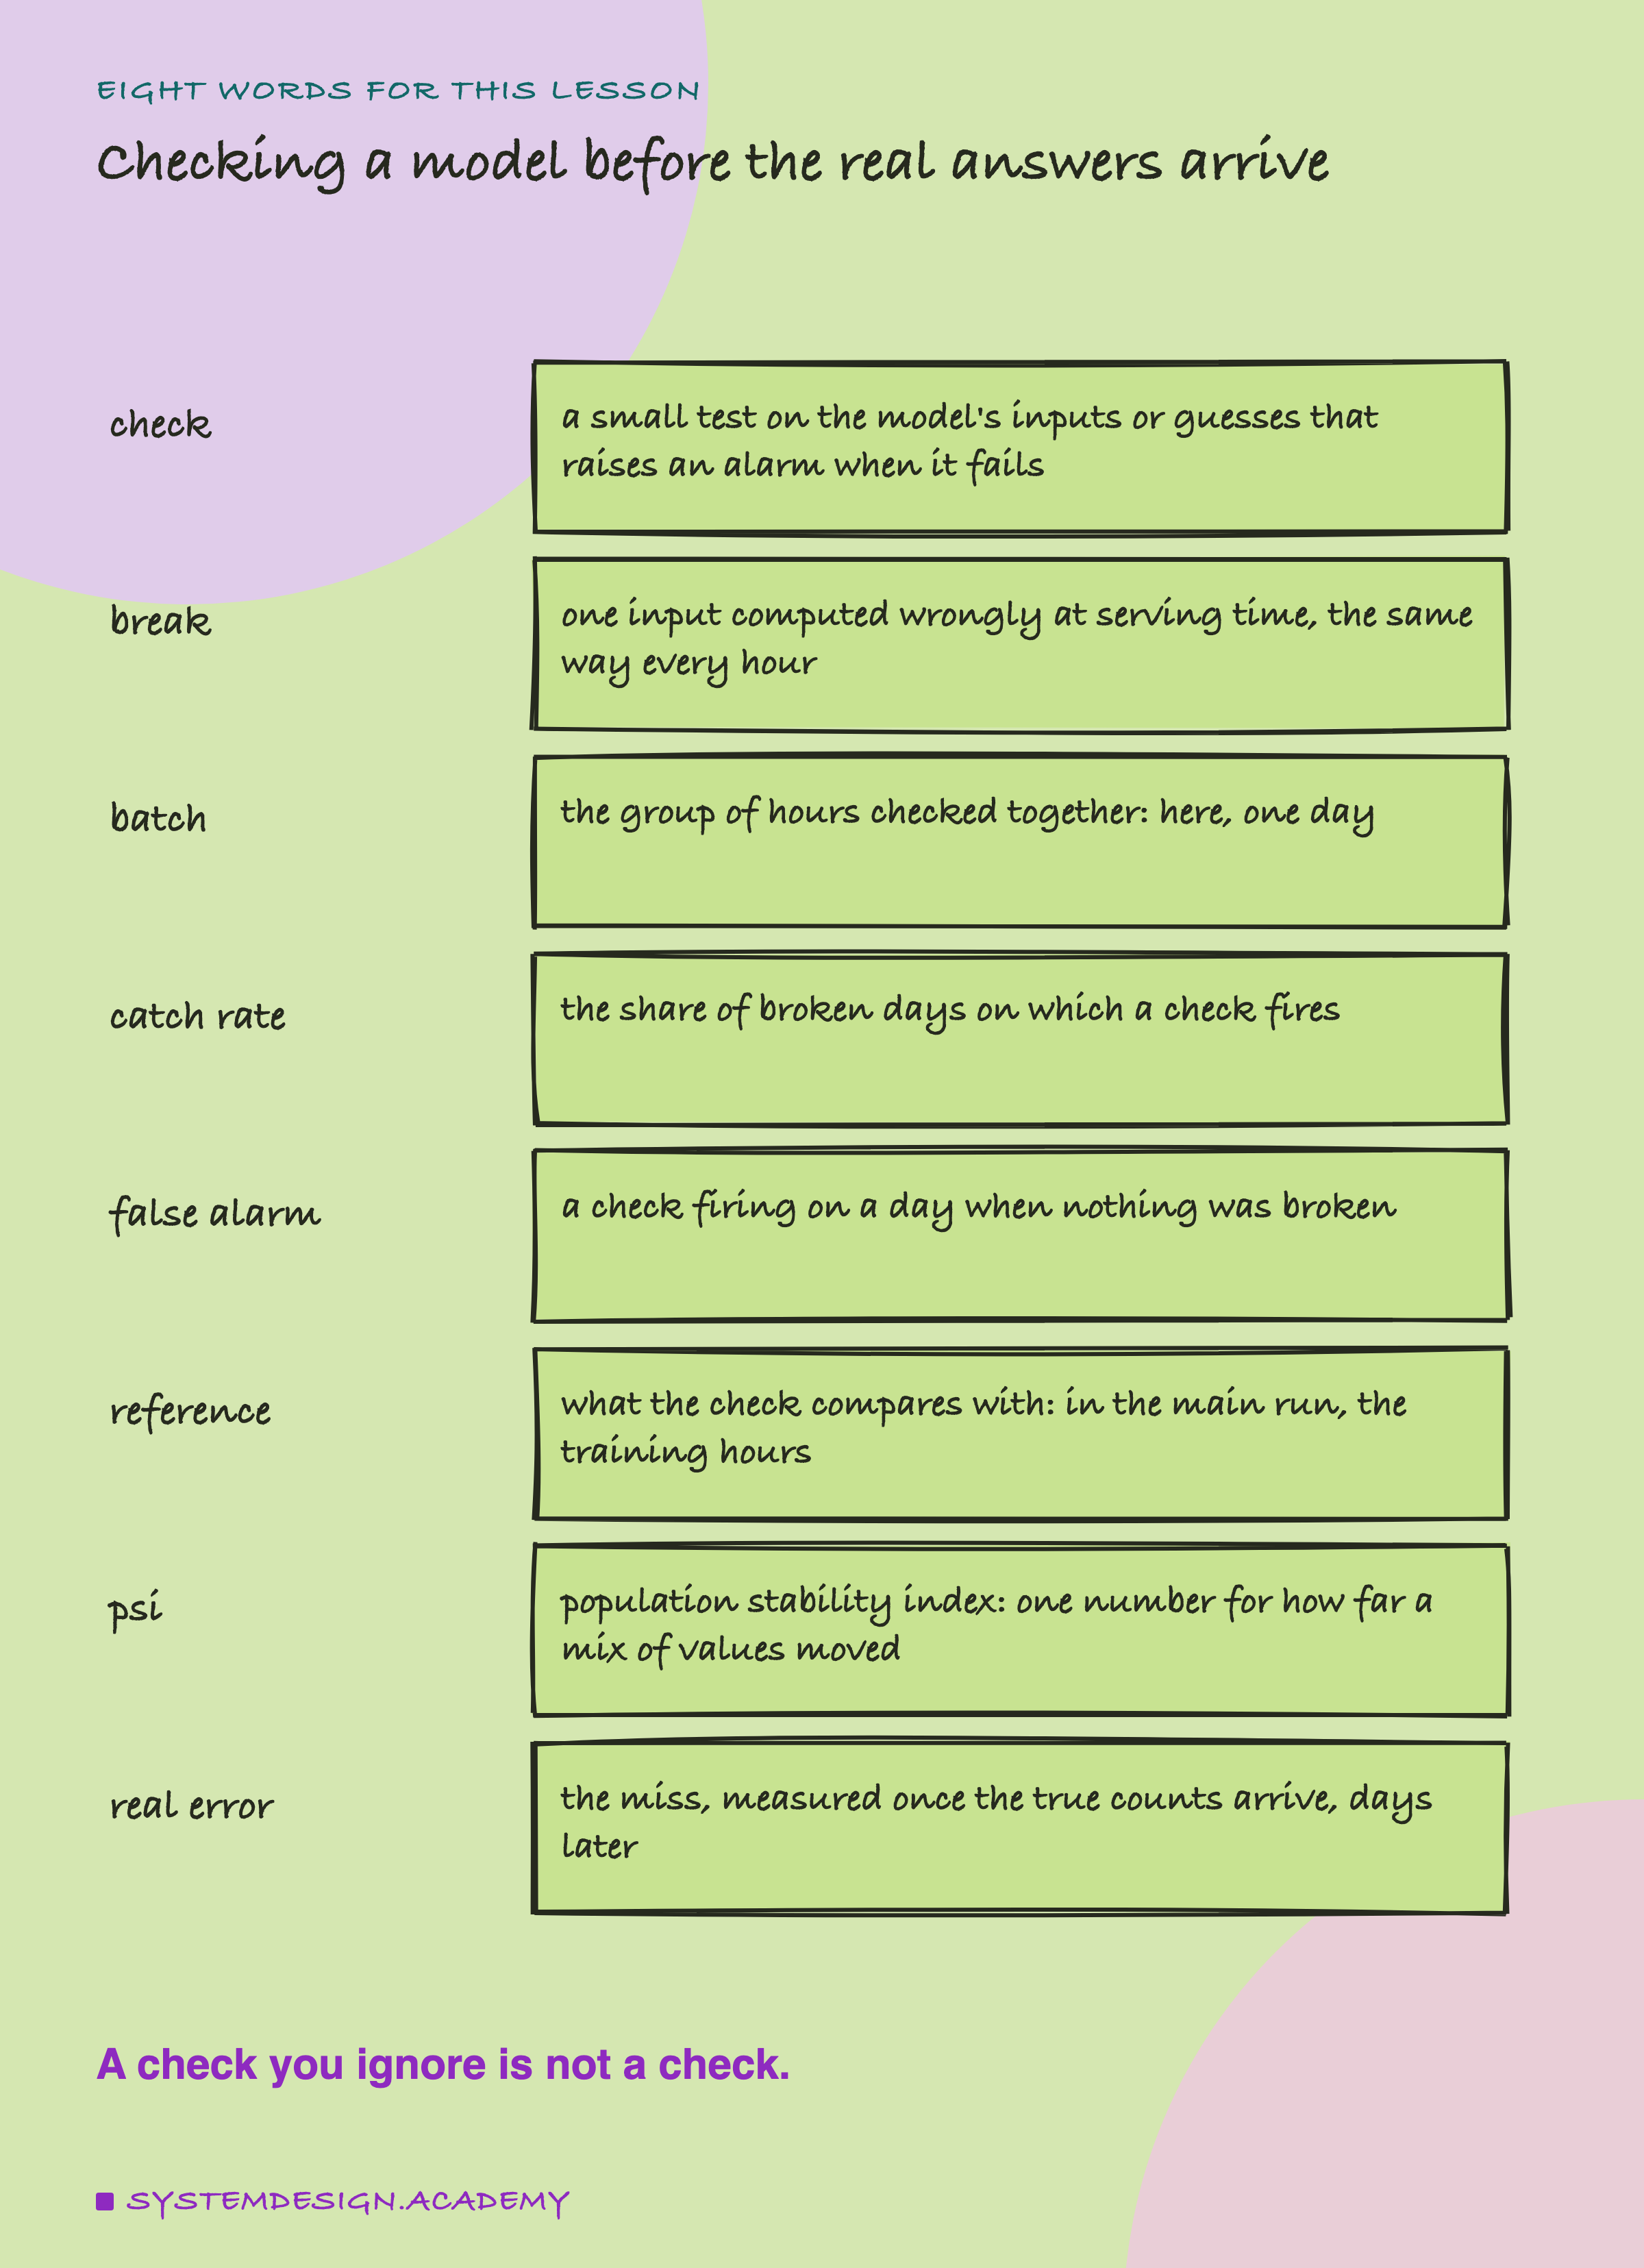
A check is a small test that runs on what the model is given or what it answers, and raises an alarm when something looks wrong. A break here means one input computed wrongly at serving time, the same wrong way for every hour, as in lesson 3. The hours a check looks at together are a batch; here a batch is one day. When a check raises an alarm on a batch, I say it fires.
Two numbers describe any check. Its catch rate is the share of broken days on which it fires: 1.00 means every broken day. Its false alarm rate is the share of days on which it fires although nothing was broken. A good check has a high catch rate and a low false alarm rate. To decide what is normal, each check compares the day with a reference, and in the main run the reference is always the training hours.
One check has a name that needs its own explanation. The population stability index, shortened to psi, is a single number that says how far the mix of values in a column moved: how the share of hours in each band of temperature, say, differs between the reference and today. Zero means the same mix. Last, the real error is the miss you can only measure after the true counts arrive. As in the earlier lessons it is the MAE (mean absolute error: the average size of the miss, in bikes an hour), often read with the signed error (the same average with the minus sign kept, so it shows whether the guesses lean too high or too low).
Why a Model Fails Silently
The first thing to understand is why a broken input does not simply crash the service. The diagram follows one serving call.
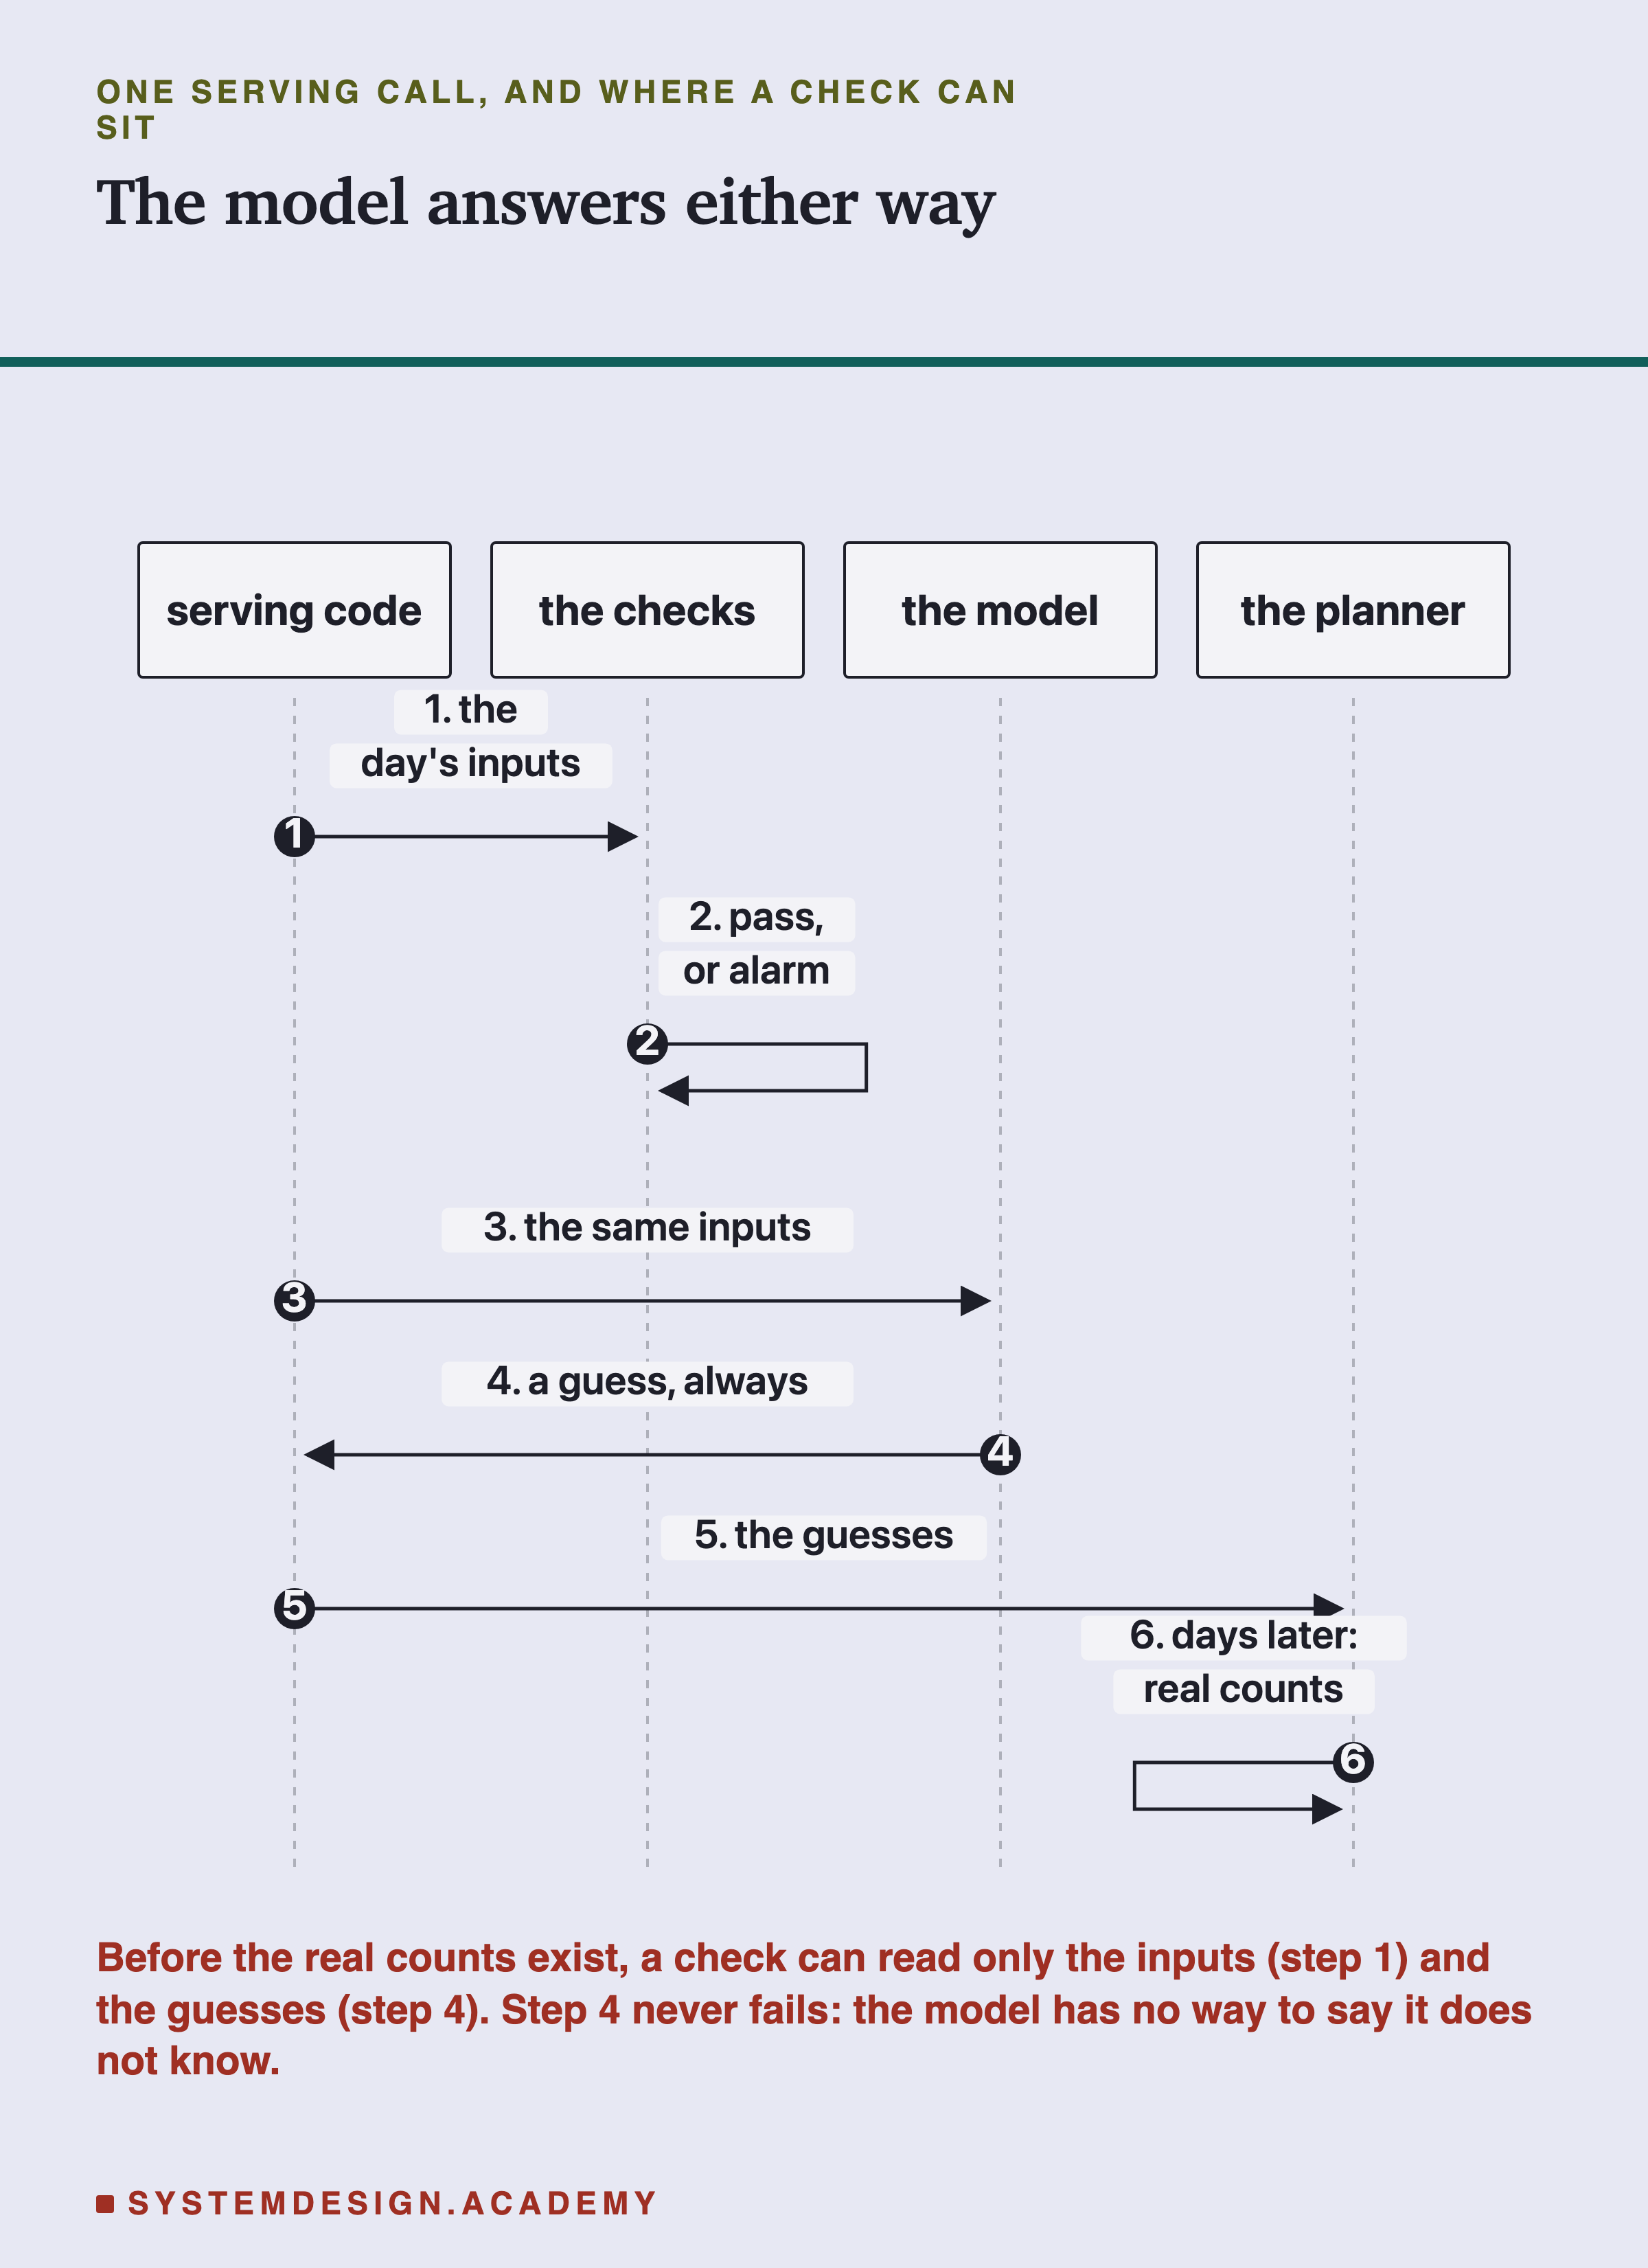
The serving code builds the inputs and sends them to the model. The model does arithmetic on whatever numbers arrive and sends back a guess. It has no idea what the numbers mean, so it has no way to notice that "hour 8" really means 3 in the morning, or that a temperature of 91 is in the wrong unit. It never answers "I do not know". So the service keeps running, the dashboard keeps filling up, and nobody is told. That is what failing silently means: the failure is real, but nothing makes a sound.
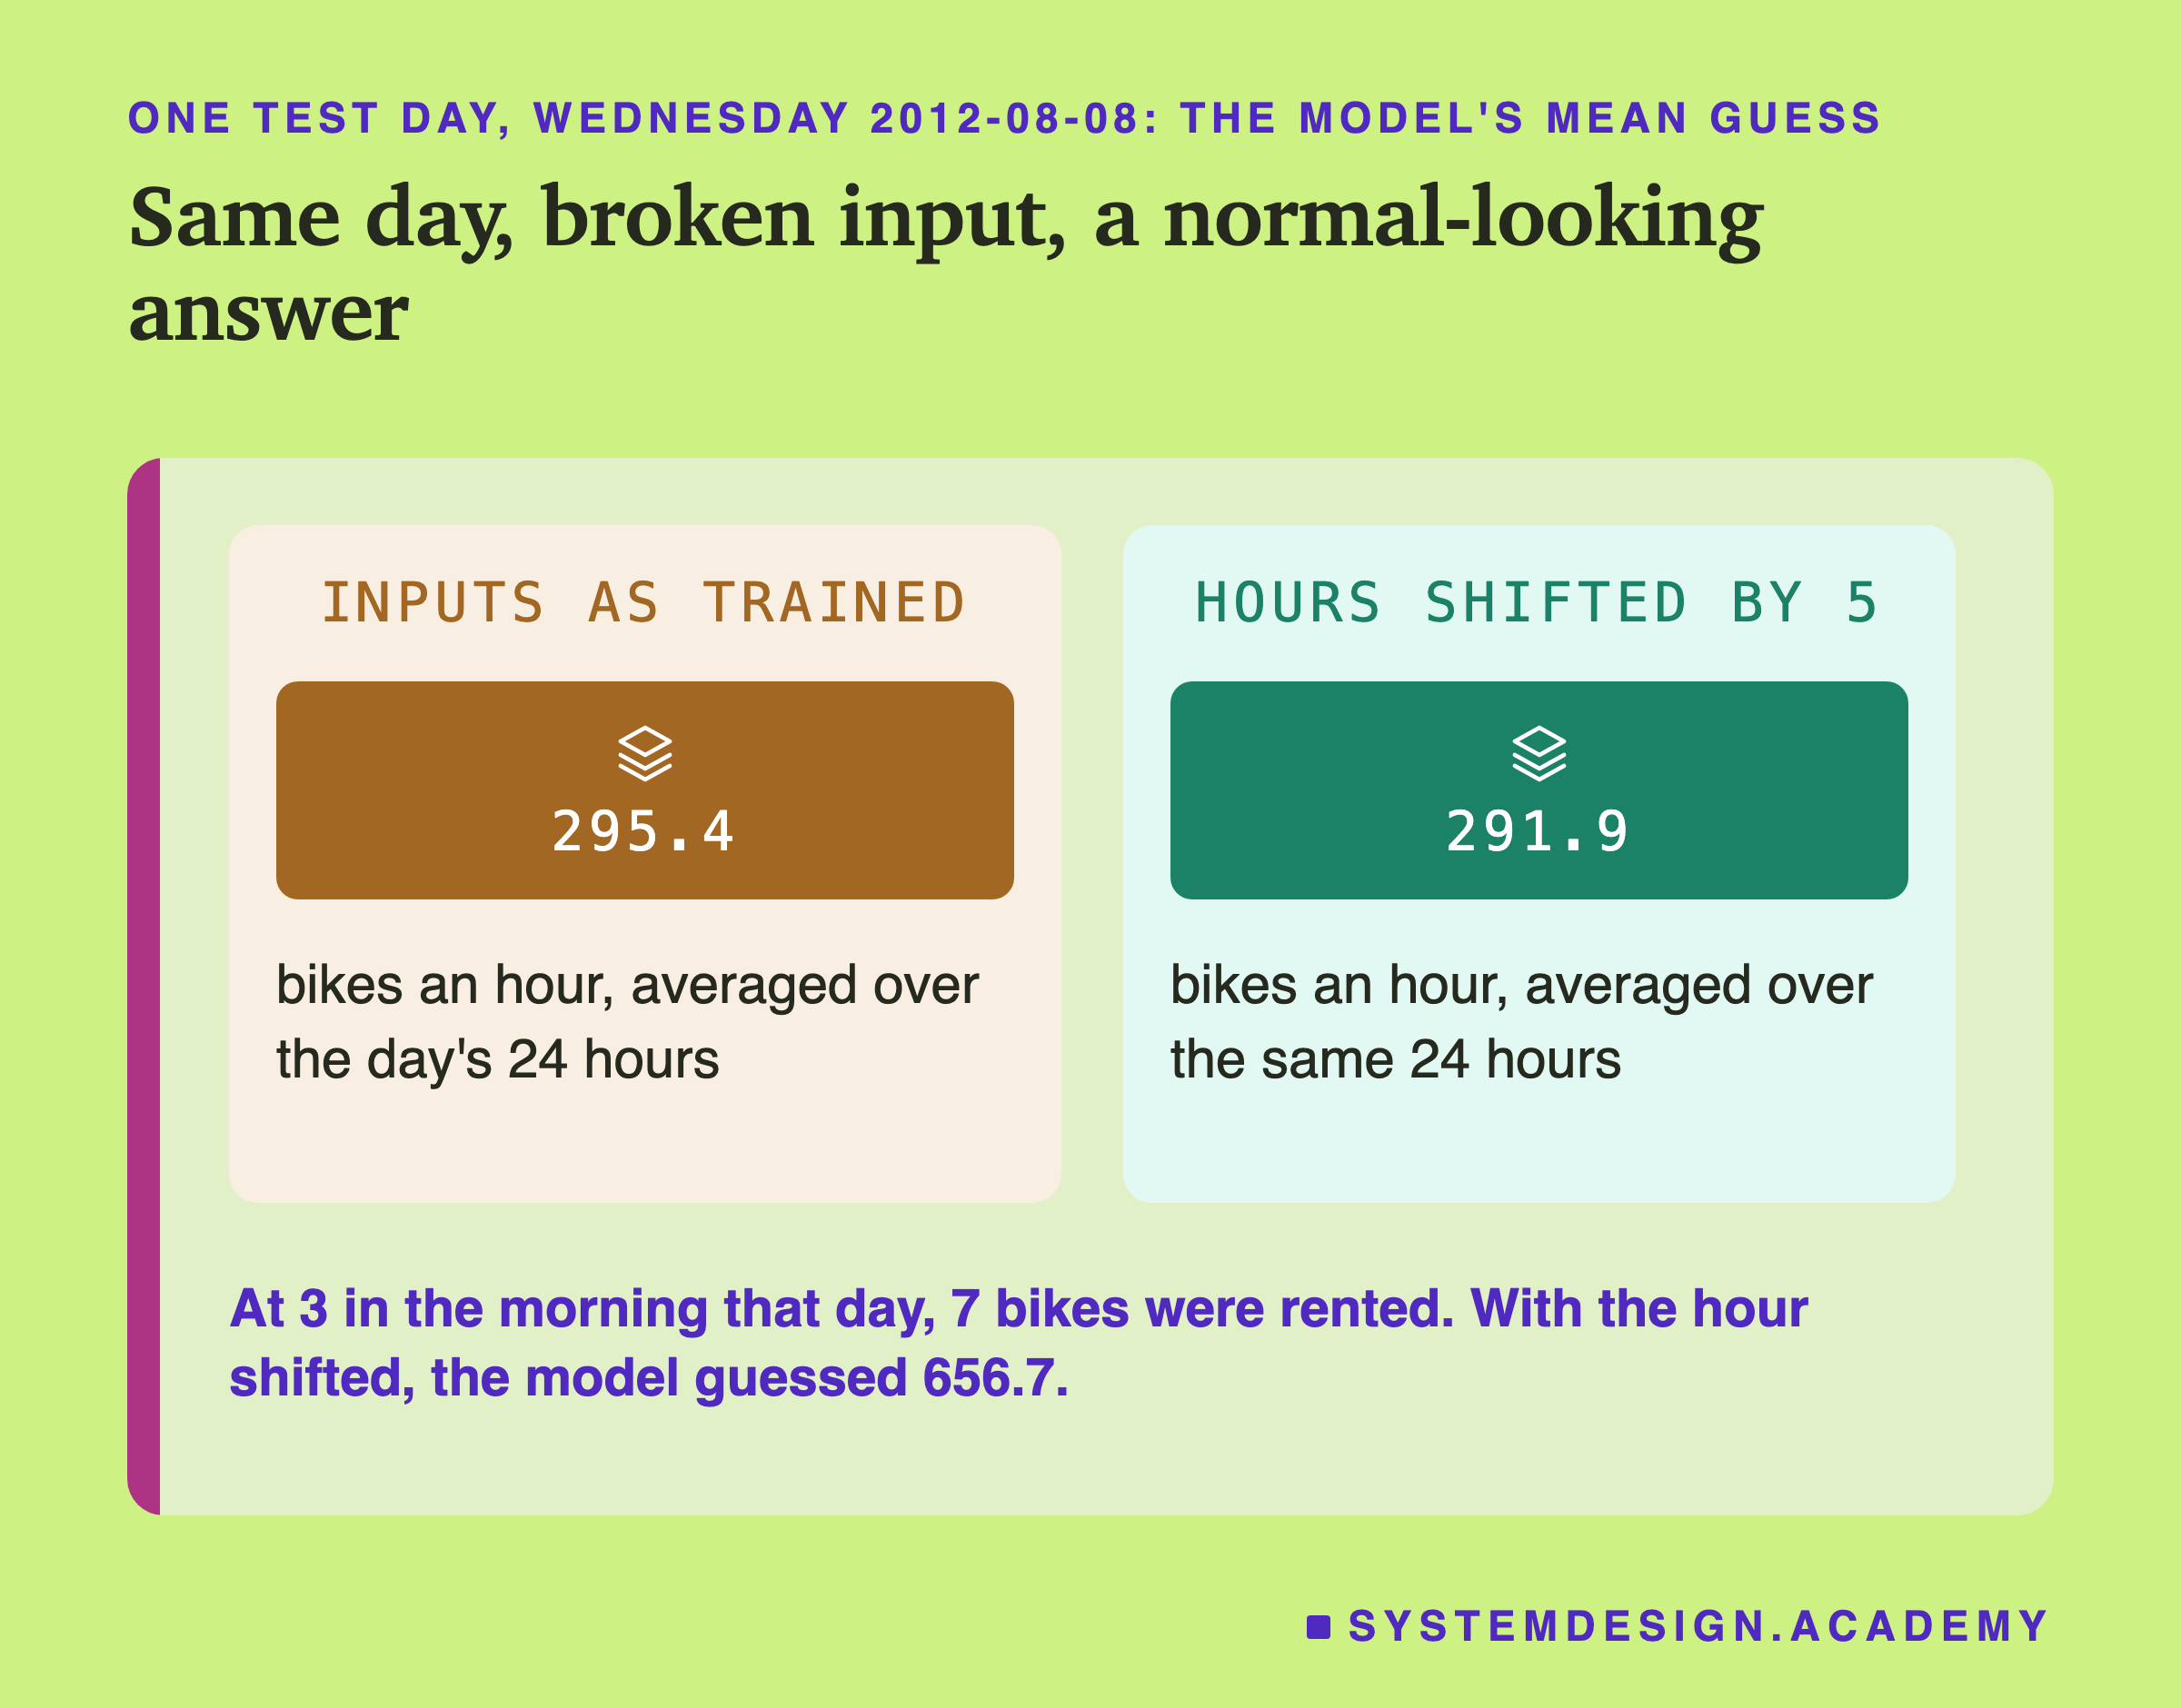
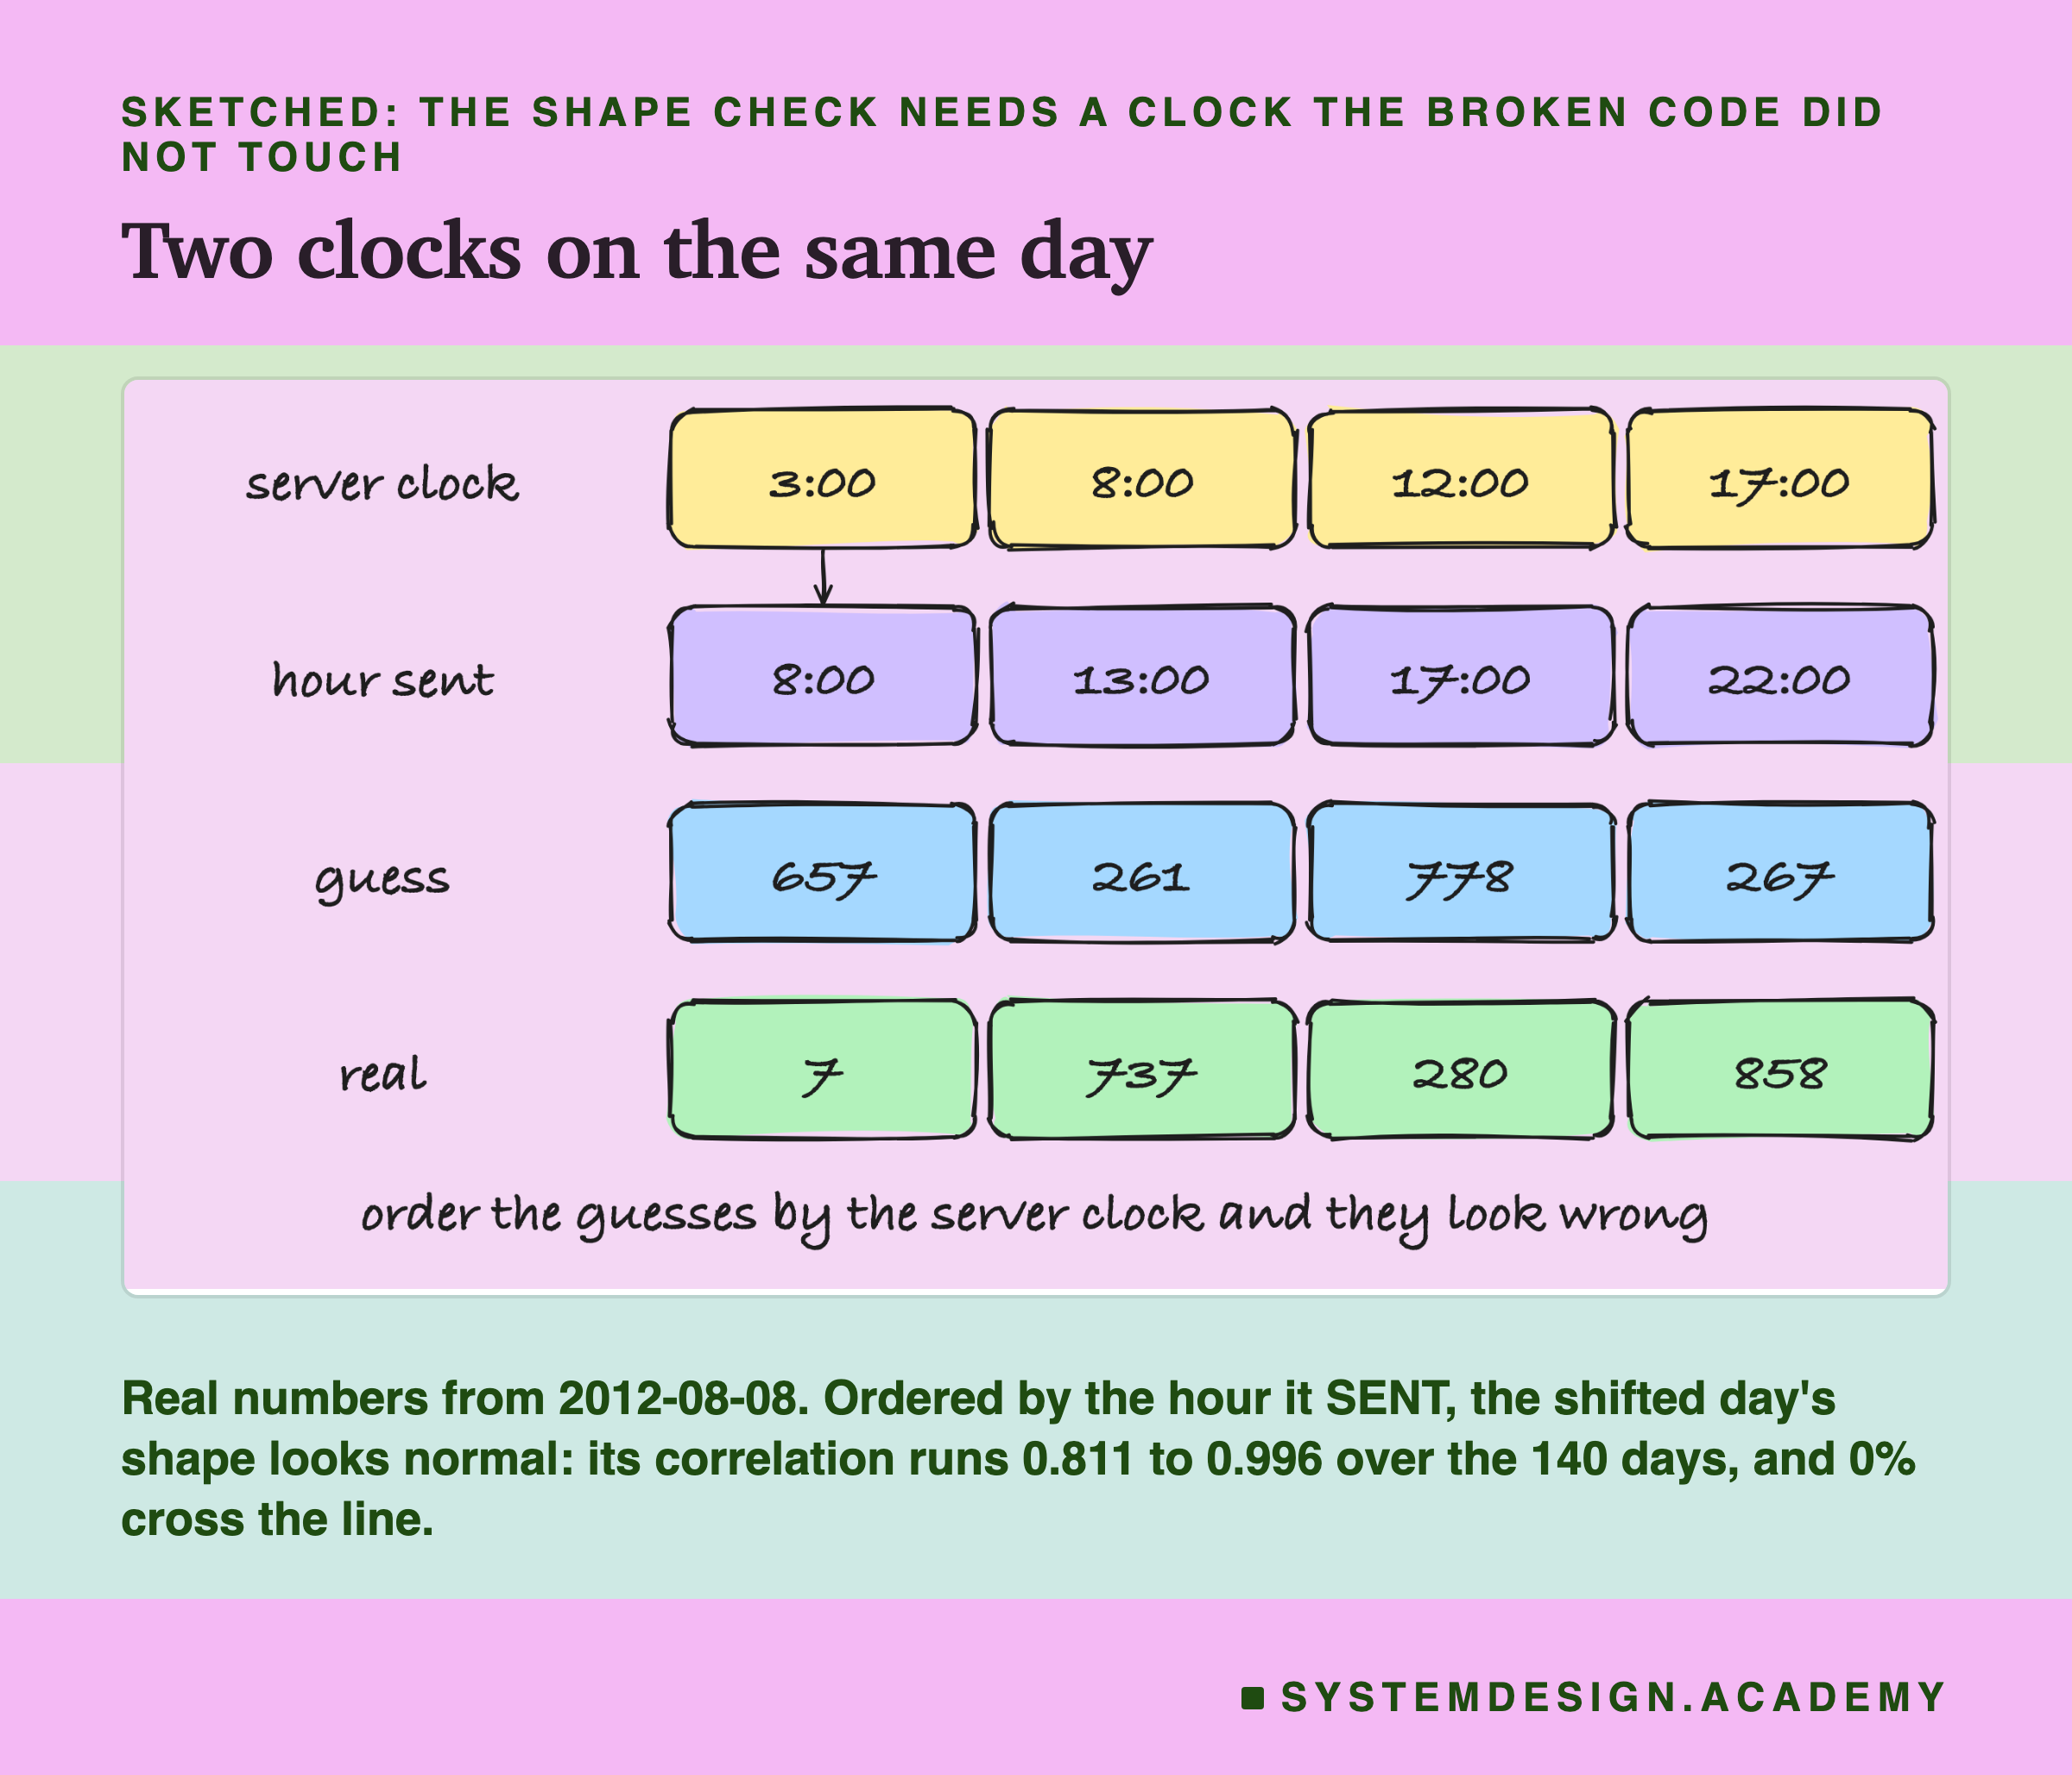
Here is one real day from the test, Wednesday 8 August 2012. With the inputs as in training, the model's guesses averaged 295.4 bikes an hour over the day. With the hour input shifted by 5, they averaged 291.9. Almost the same. A person looking at the daily total would see nothing strange. Yet at 3 in the morning, when 7 bikes were rented, the shifted model guessed 656.7, because it thought it was 8 in the morning, the peak of the commute. The day's average hides that for a simple reason: a shifted full day still asks about each of the 24 hours once, only at the wrong times, so it gets nearly the same set of guesses in the wrong places. The shifted guess at 3 in the morning, 656.7, is close to the unshifted guess at 8, 656.1, and the average of the set barely moves.
Seven Breaks, One at a Time
The lab broke the serving inputs in seven ways. Six are lesson 3's, and one is new.
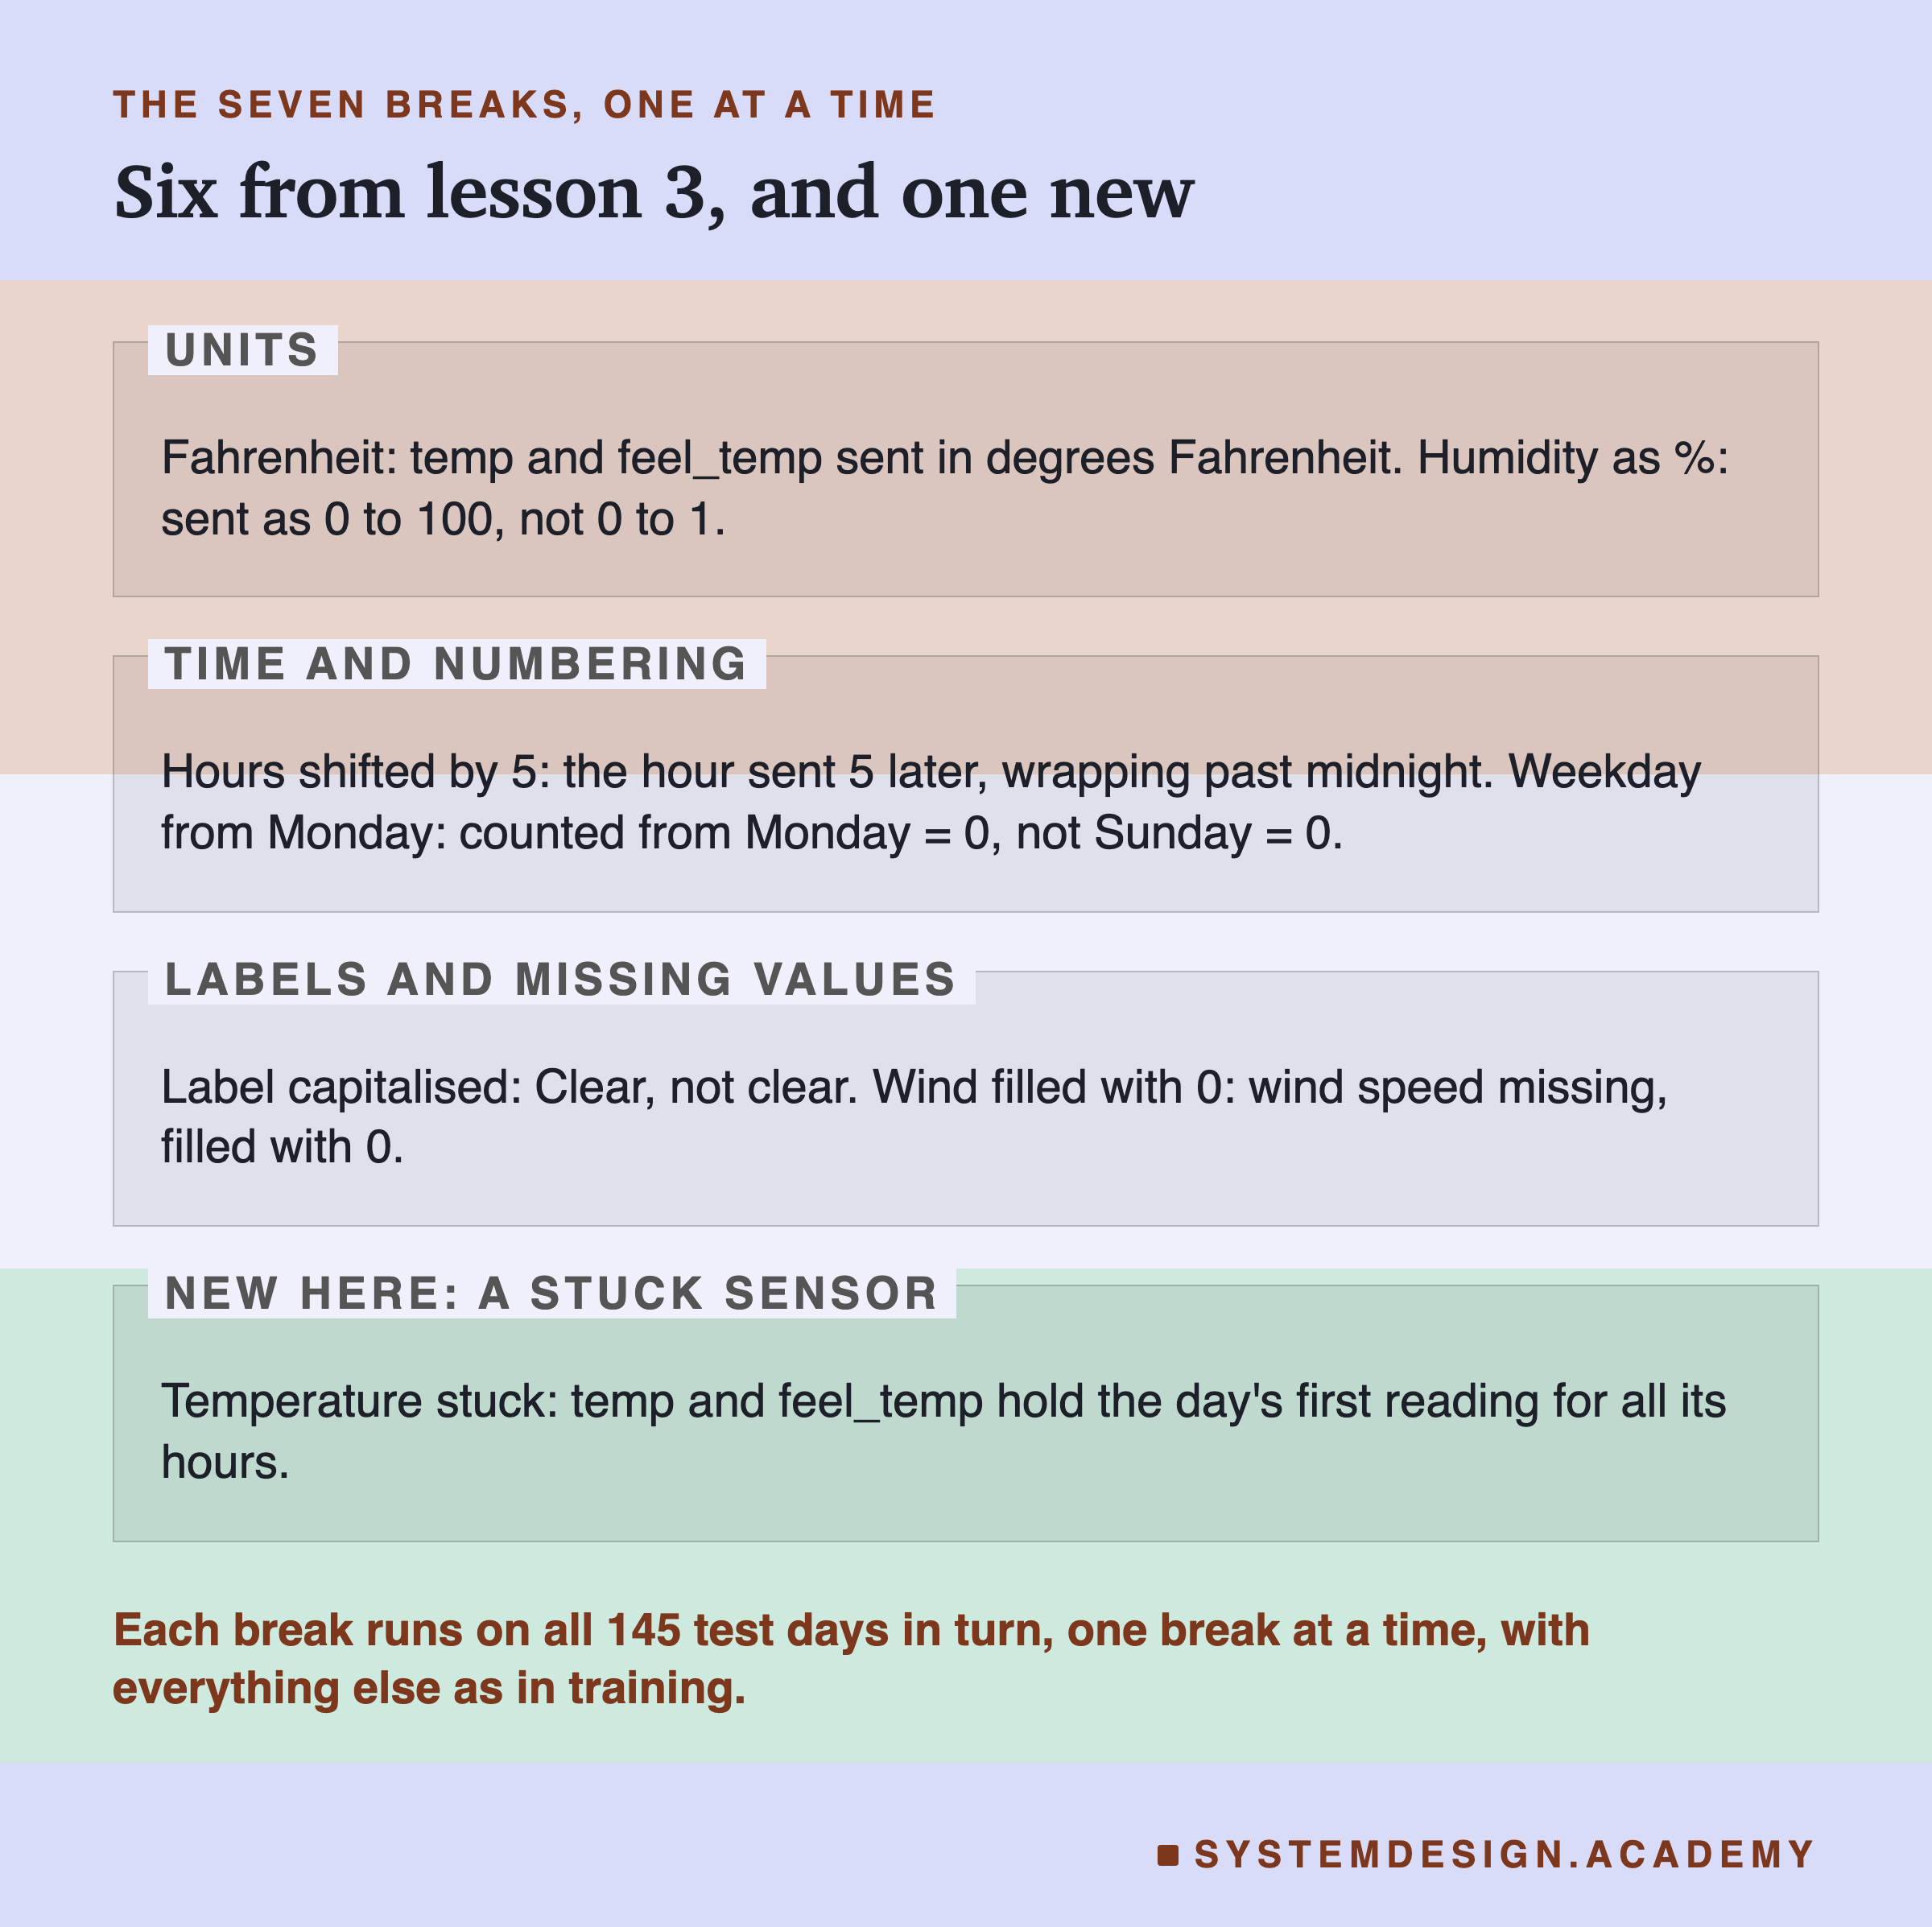
The unit breaks send the temperature in Fahrenheit and the humidity as a percentage. The numbering breaks shift the hour by 5 and count the weekday from Monday instead of Sunday. The label break sends "Clear" where training saw "clear". The missing-value break fills a missing wind speed with 0. The new one is a stuck sensor: the temperature and "feels like" temperature hold the day's first reading for every hour of the day, the way a thermometer does when its data stops updating and the last value keeps being repeated.
A note on a name. Lesson 3 called the hour break utc_hours, because it was meant to copy a server that sends the hour in UTC, the world's reference time, instead of local time. It adds a fixed 5 hours. As lesson 3's follow-up showed, this is not true UTC for most of the test: Washington was 4 hours behind UTC until 4 November 2012 and 5 hours after, so the fixed +5 is right for only the last part of the test. In this lesson I call it what it is, hours shifted by 5. Lesson 3's follow-up also measured the version with the correct offset: its average miss was 199.49, and as a later slide shows, its hours stay between 0 and 23 just the same.
Six Checks That Need No Real Answer
Each check below looks only at one day's inputs, or at the model's guesses for that day, and at the training hours. None of them needs the true counts.
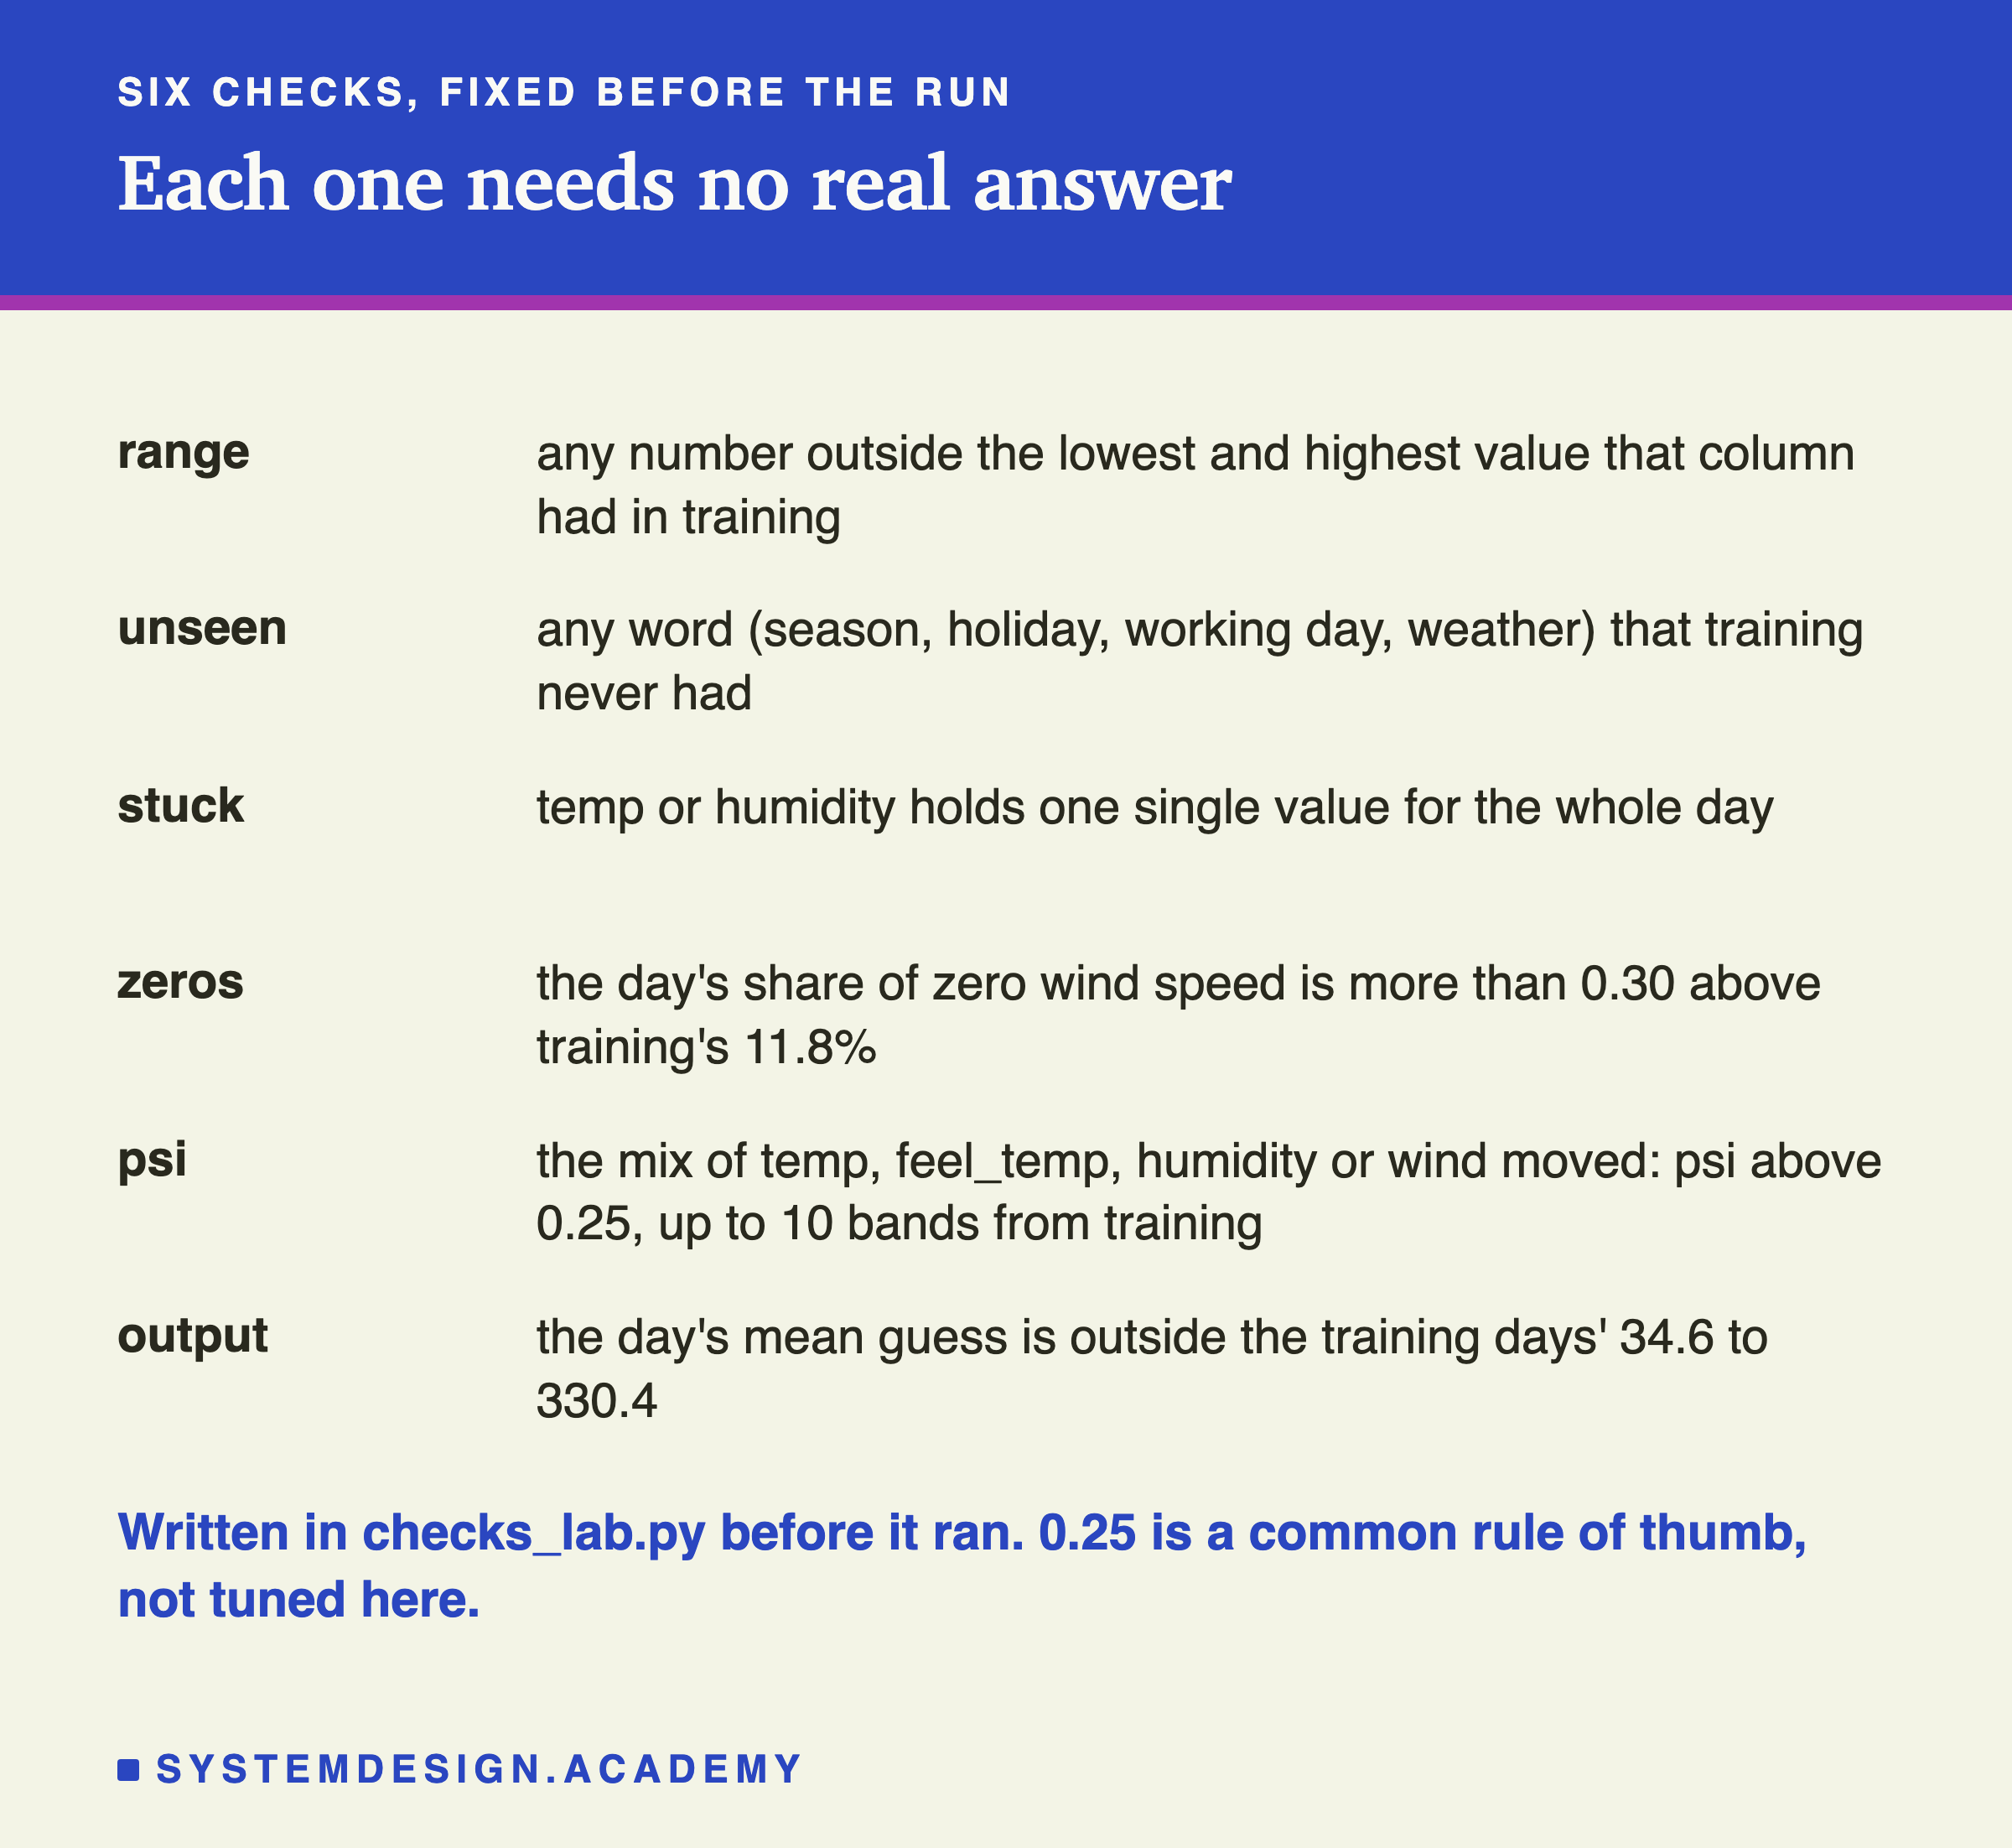
Range fires if any number is below the lowest or above the highest value that column ever had in training. Unseen fires if any word column holds a word that training never had. Stuck fires if the temperature or the humidity holds one single value for the whole day. Zeros fires if the share of hours with a wind speed of exactly 0 is more than 0.30 above the training share, which was 11.8%.
psi fires if, for any of the four weather columns, the mix of values moved by more than 0.25. To compute it, the training values of a column are cut into bands, each holding about a tenth of the training hours. Temperature, feels-like temperature and humidity get 10 bands (their edges are the deciles); wind speed gets 9, because so many hours have a wind speed of exactly 0 that two edges fall on the same value. Then, for each band, take today's share of hours in it and the training share, and the band adds (today's share minus the training share) times the log of (today's share divided by the training share). The log grows very fast as a share gets close to zero, so a band that empties counts heavily. A share of exactly zero would make the log impossible to take, so an empty band is given a share of 0.01%. That choice sets the size of the number, but, as a later slide shows, not whether a clean day crosses 0.25. The line of 0.25 is a common rule of thumb that you will find in many monitoring guides. I used it as it is and did not tune it.
Output is the one check on the model's answers rather than its inputs. It fires if the day's mean guess falls outside the range of daily mean guesses over the training days, 34.6 to 330.4 bikes an hour.
What the Lab Ran
I wrote the design at the top of the lab file, checks_lab.py, before I ran it, and the chapter plan, CHAPTER-PLAN.md, records it the same day ("CHECKS LAB (batch 4) designed before running").
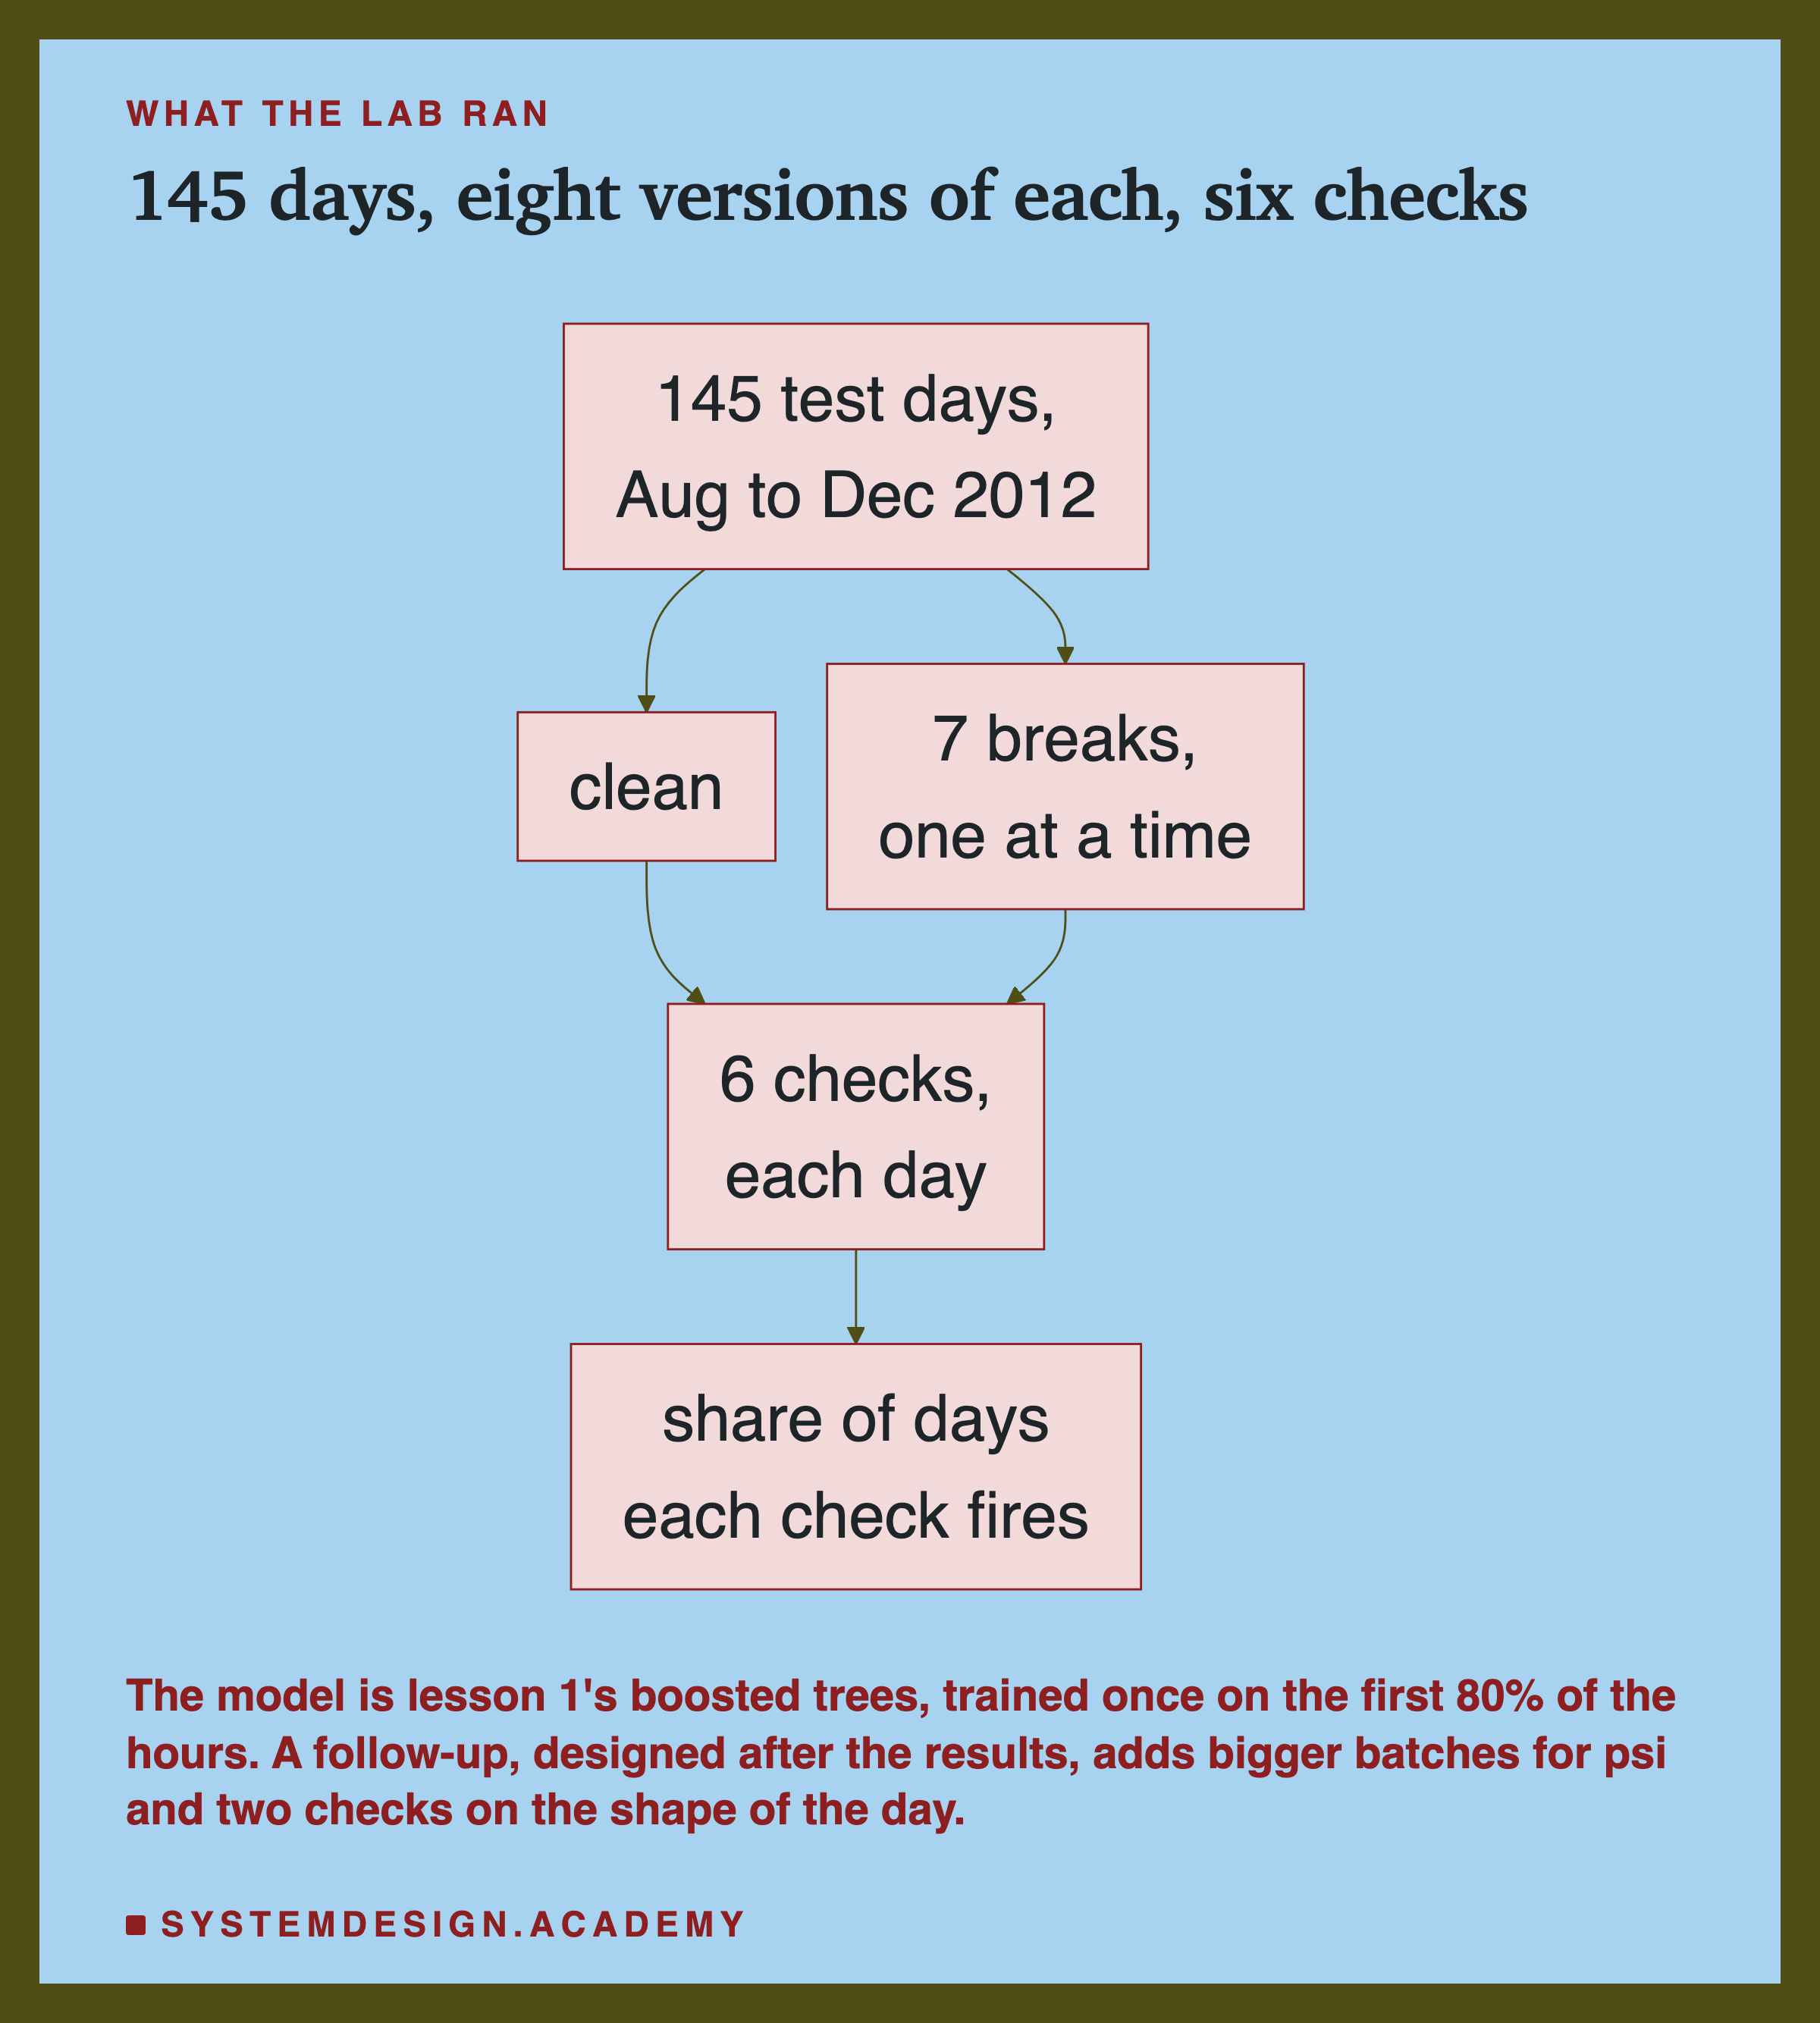
The model. The same boosted trees as lessons 1 and 3: scikit-learn's HistGradientBoostingRegressor, default settings, random_state=0, trained once on the first 80% of the hours in time order. A decision tree guesses a number by asking a chain of yes-or-no questions about the inputs; boosting adds up many small trees, each one correcting the errors of the ones before.
The days. Production is the last 20% of the hours, from 12 noon on 7 August 2012 to the end of December 2012, served as one batch per calendar day. The file has no date column, so the days are rebuilt as in the earlier lessons: a new day starts each time the weekday changes. Days with fewer than 12 hours are left out, which leaves 145 test days. 140 of them have all 24 hours.
What was measured. For the clean inputs and for each of the seven breaks, each check was run on each of the 145 days, and the lab stored the share of days on which it fired. On the clean inputs that share is the false alarm rate; under a break it is the catch rate. It also stored "any check": the share of days on which at least one of the six fired. No test of statistical significance was declared: there is one model and one test period, so the numbers describe this run.
What came later. The report's explanations, which days raised false alarms, why psi behaved as it did, and a follow-up with new checks were all added after I saw the results. Each is labelled that way where it appears.
Which Check Caught Which Break
Here is the whole result, from the lab's stored file, results/checks.json. Each cell is the share of the 145 days on which that check fired under that break.
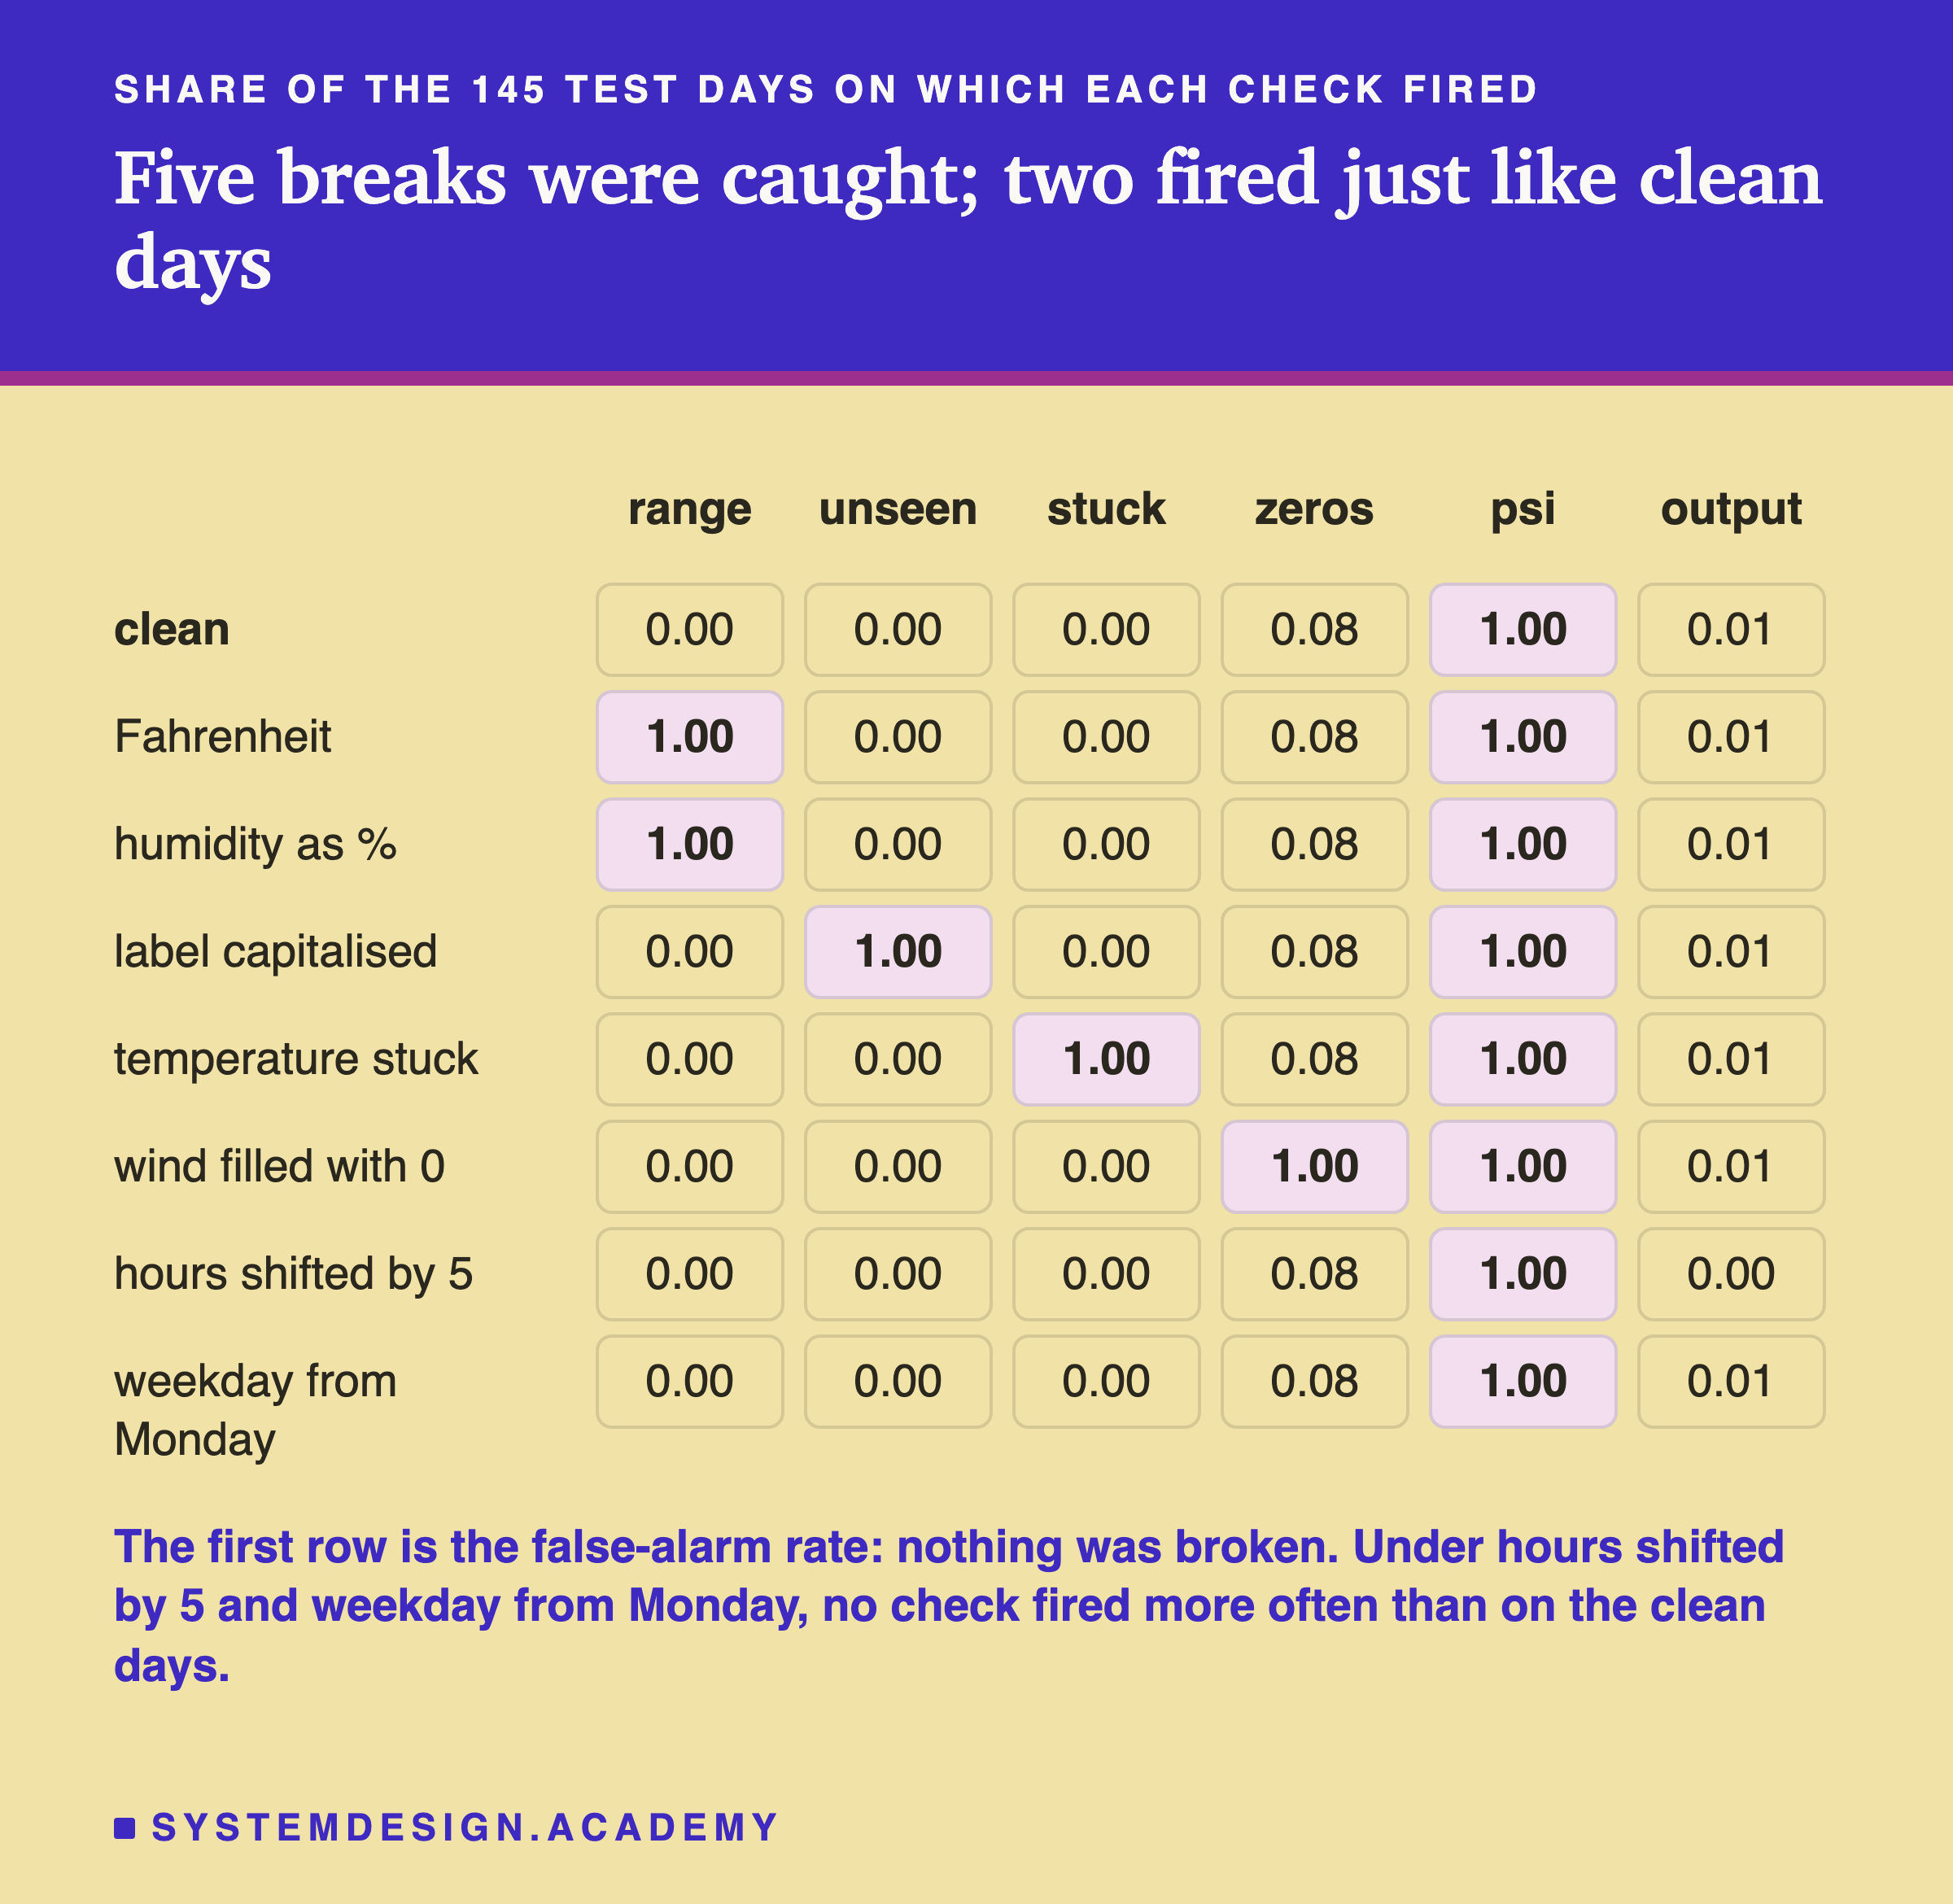
Read the first row first. It is the clean inputs, so every alarm there is a false alarm. Range, unseen and stuck never fired on a clean day. Zeros fired on 0.08 of them, which is 12 days of 145. Output fired on 0.01, one day. And psi fired on 1.00: every single clean day.
Now the breaks. Range caught both unit breaks on every day: Fahrenheit and humidity as a percentage both send values no training hour ever had. Unseen caught the capitalised label on every day. Stuck caught the stuck temperature on every day. Zeros caught the missing wind speed on every day. Each of these four checks caught the one break it was built for, with no false alarms except the 12 calm days of zeros.
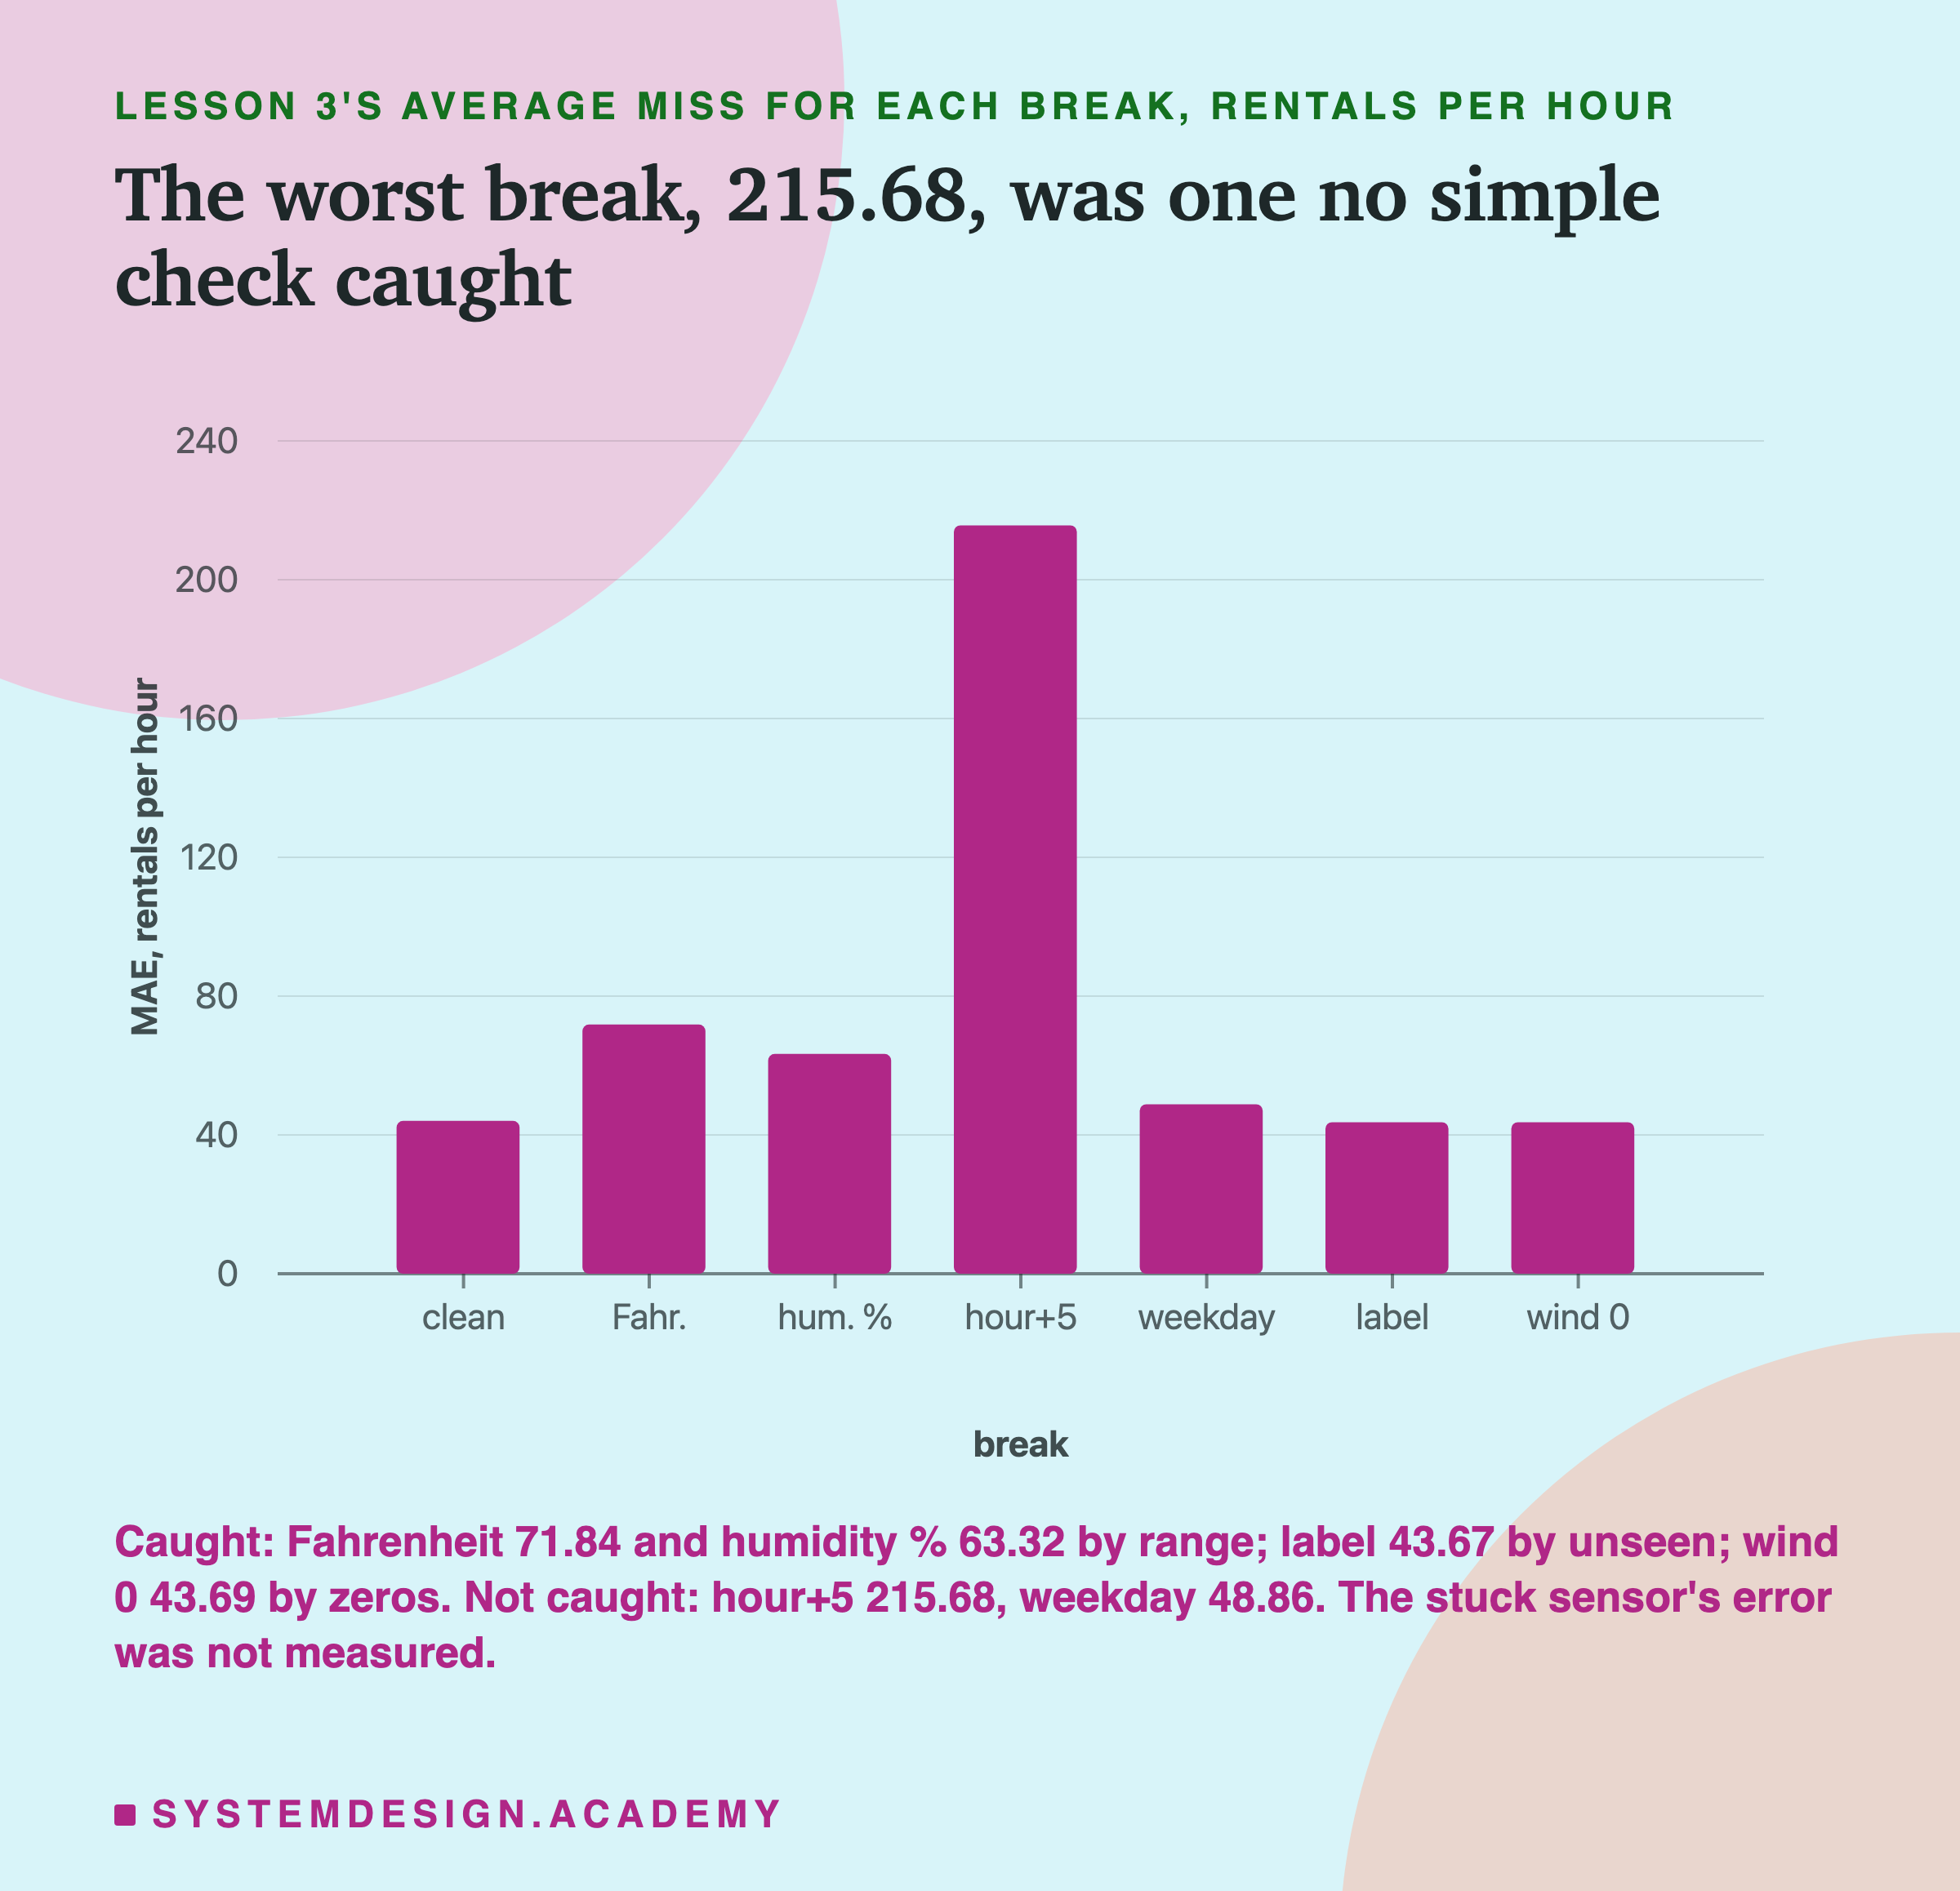
Now put the damage from lesson 3 beside it (the same model on the same test hours). The two breaks that no useful check caught are the hours shifted by 5, which raised the average miss from 44.07 to 215.68, the worst in the lab, and the weekday counted from Monday, which raised it to 48.86. Under both, no check fired more often than on the clean days: range, unseen and stuck 0.00, zeros 0.08 on the same calm days, psi 1.00, and output 0.00 and 0.01. The worst break in the lab looked, to every check, like a normal day. The stuck temperature was not part of lesson 3, and the lab did not store its guesses, so I cannot say how much it cost.
What a False Alarm Costs
A false alarm is not free. Someone gets a message, stops what they are doing, opens a dashboard and looks for a problem that is not there. If that happens often, people learn to ignore the message, and then the check is worth nothing even on the day it is right. So after the results I read every false alarm, one by one.
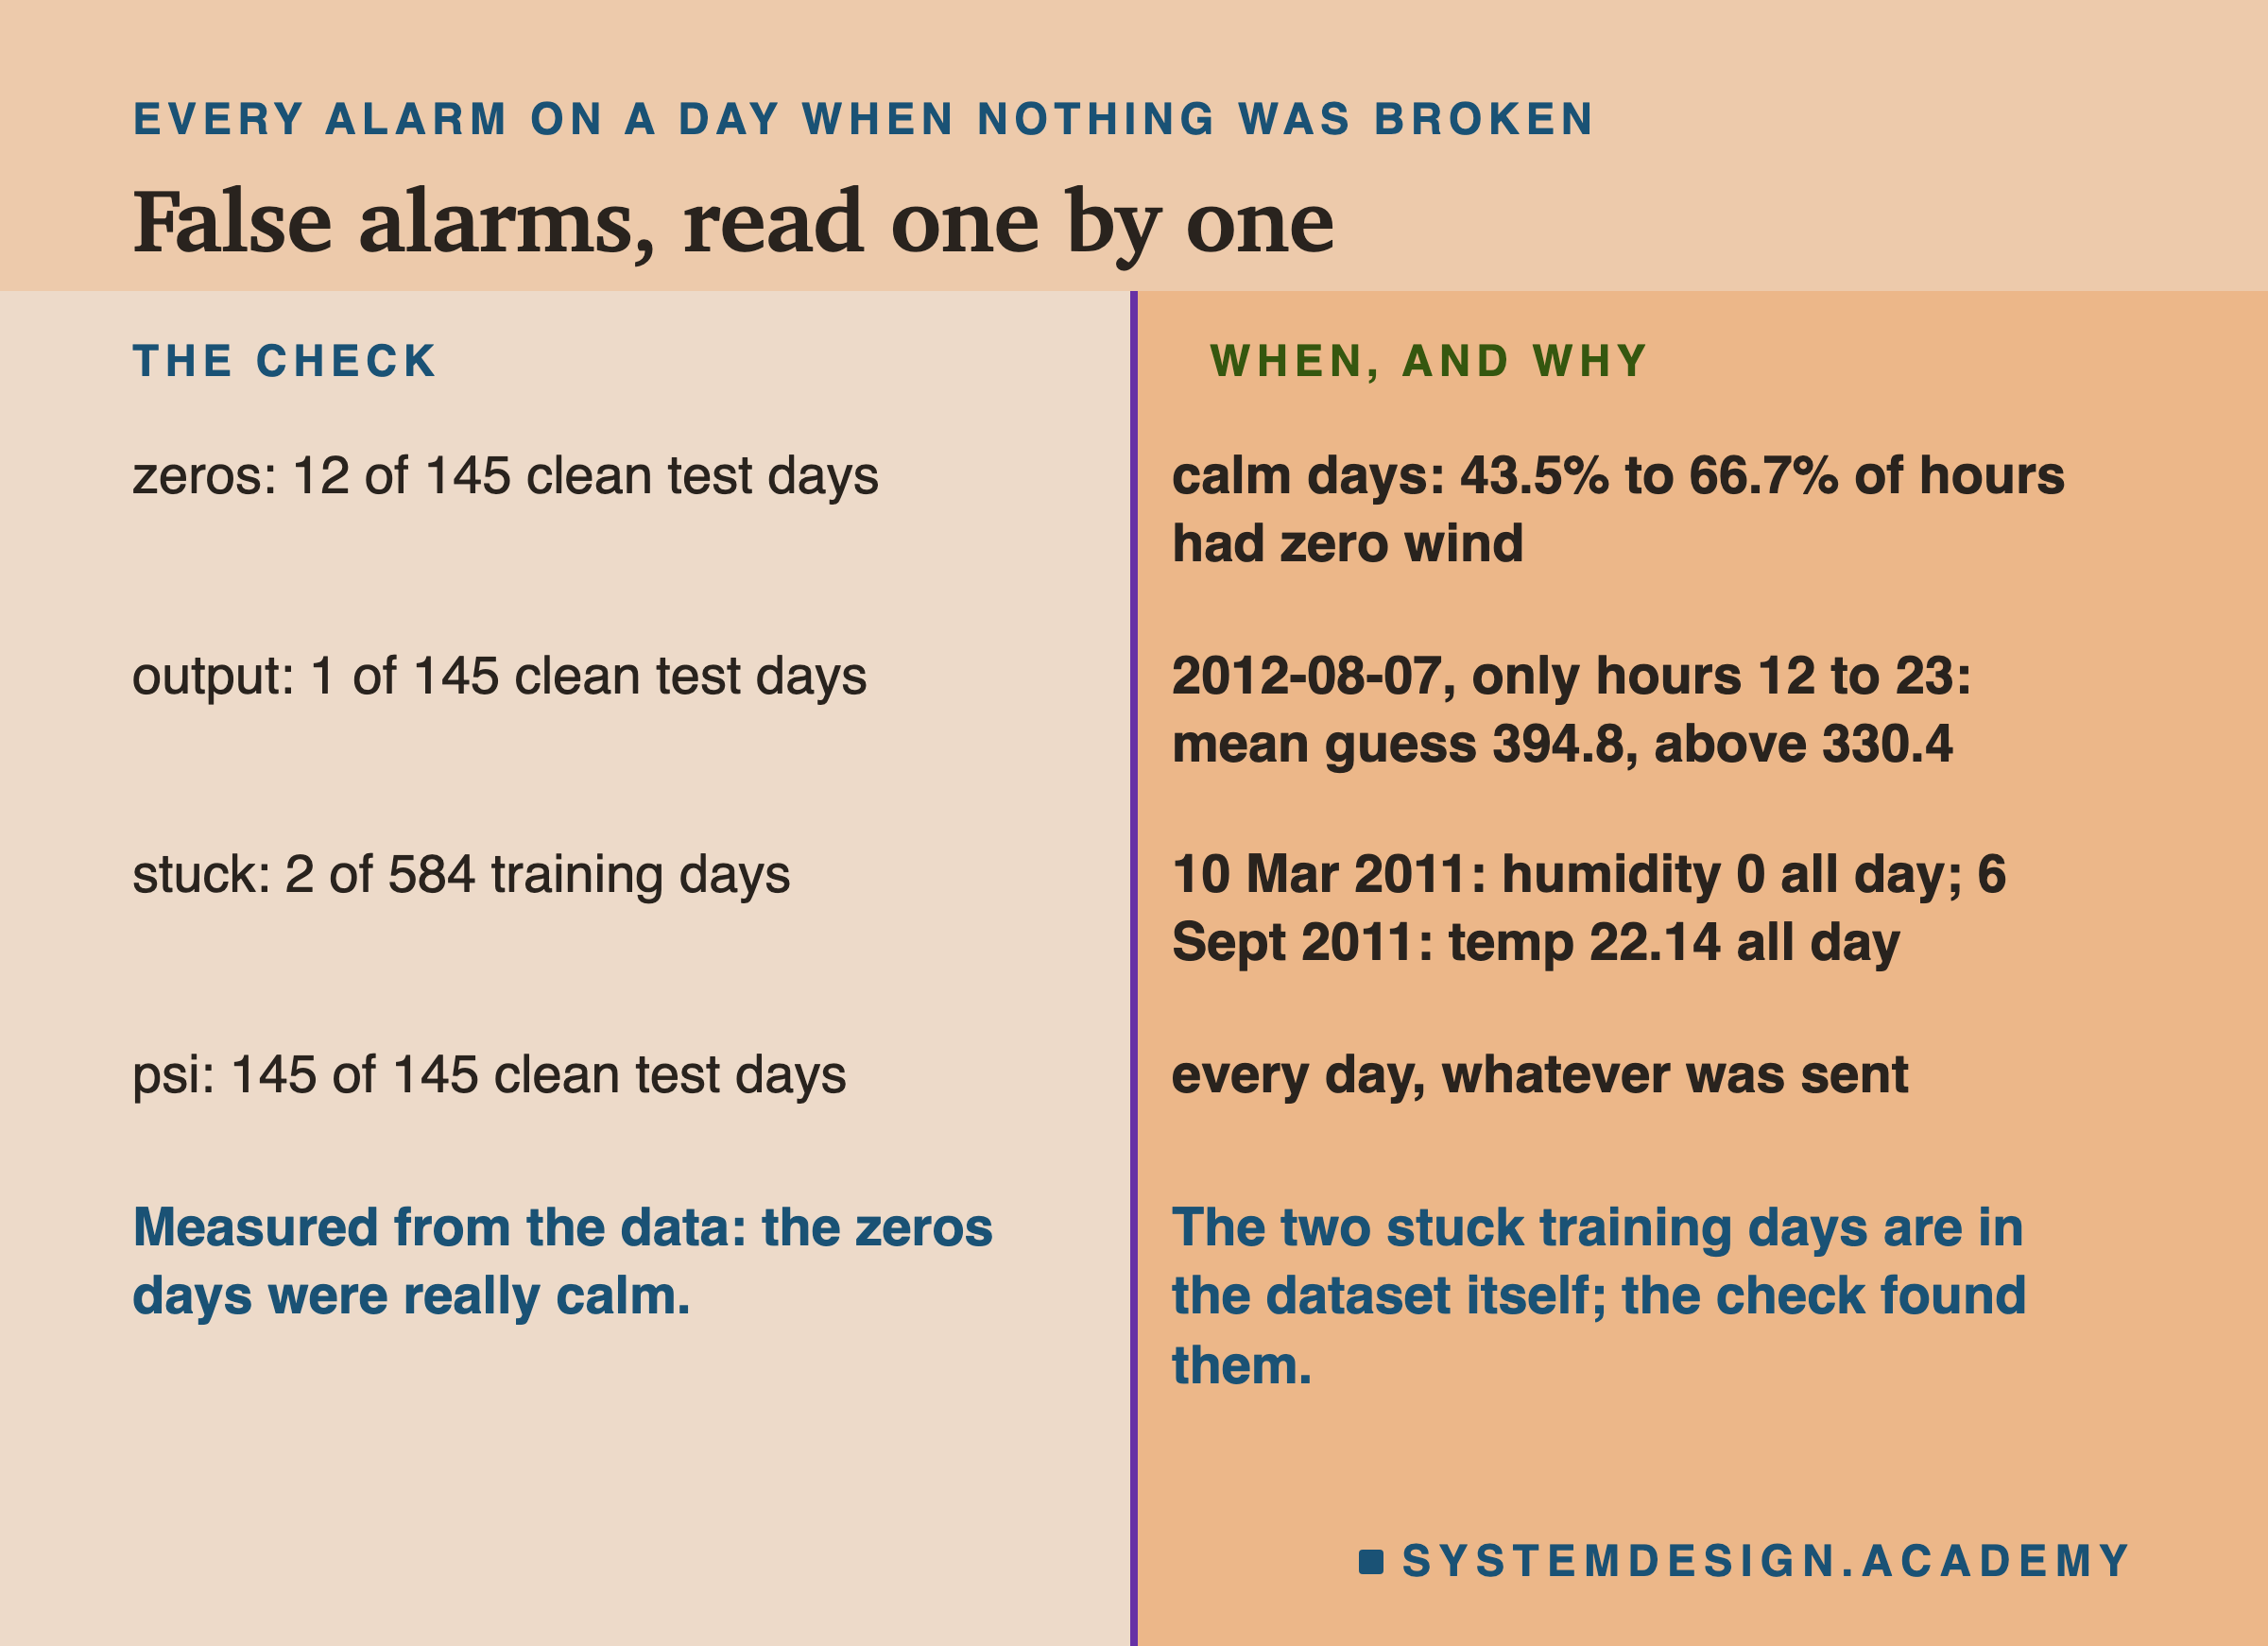
Zeros fired on 12 clean days. Every one was a calm day, when between 43.5% and 66.7% of the hours really had a wind speed of 0. Nothing was broken; the weather was still. Output fired on one clean day, 7 August 2012, the first day of the test. That day holds only the hours from 12 noon to 11 at night, the busiest part of any day, so its mean guess, 394.8, was above the highest training day. The check was right that the day looked unusual. It was a half day, not a broken one.
Stuck never fired on a clean test day, but the lab also measured how often it would have fired on the training days. The answer was 2 of 584, and those two are worth knowing about. On 10 March 2011 the humidity is 0 for all 22 hours of the day, and on 6 September 2011 the temperature is 22.14 for all 23 hours. A humidity of 0 is not a real reading for a whole day in Washington. One possible reason, and it is a guess, is that the readings were missing and stored as 0. Either way, the check found two real problems in the public data itself.
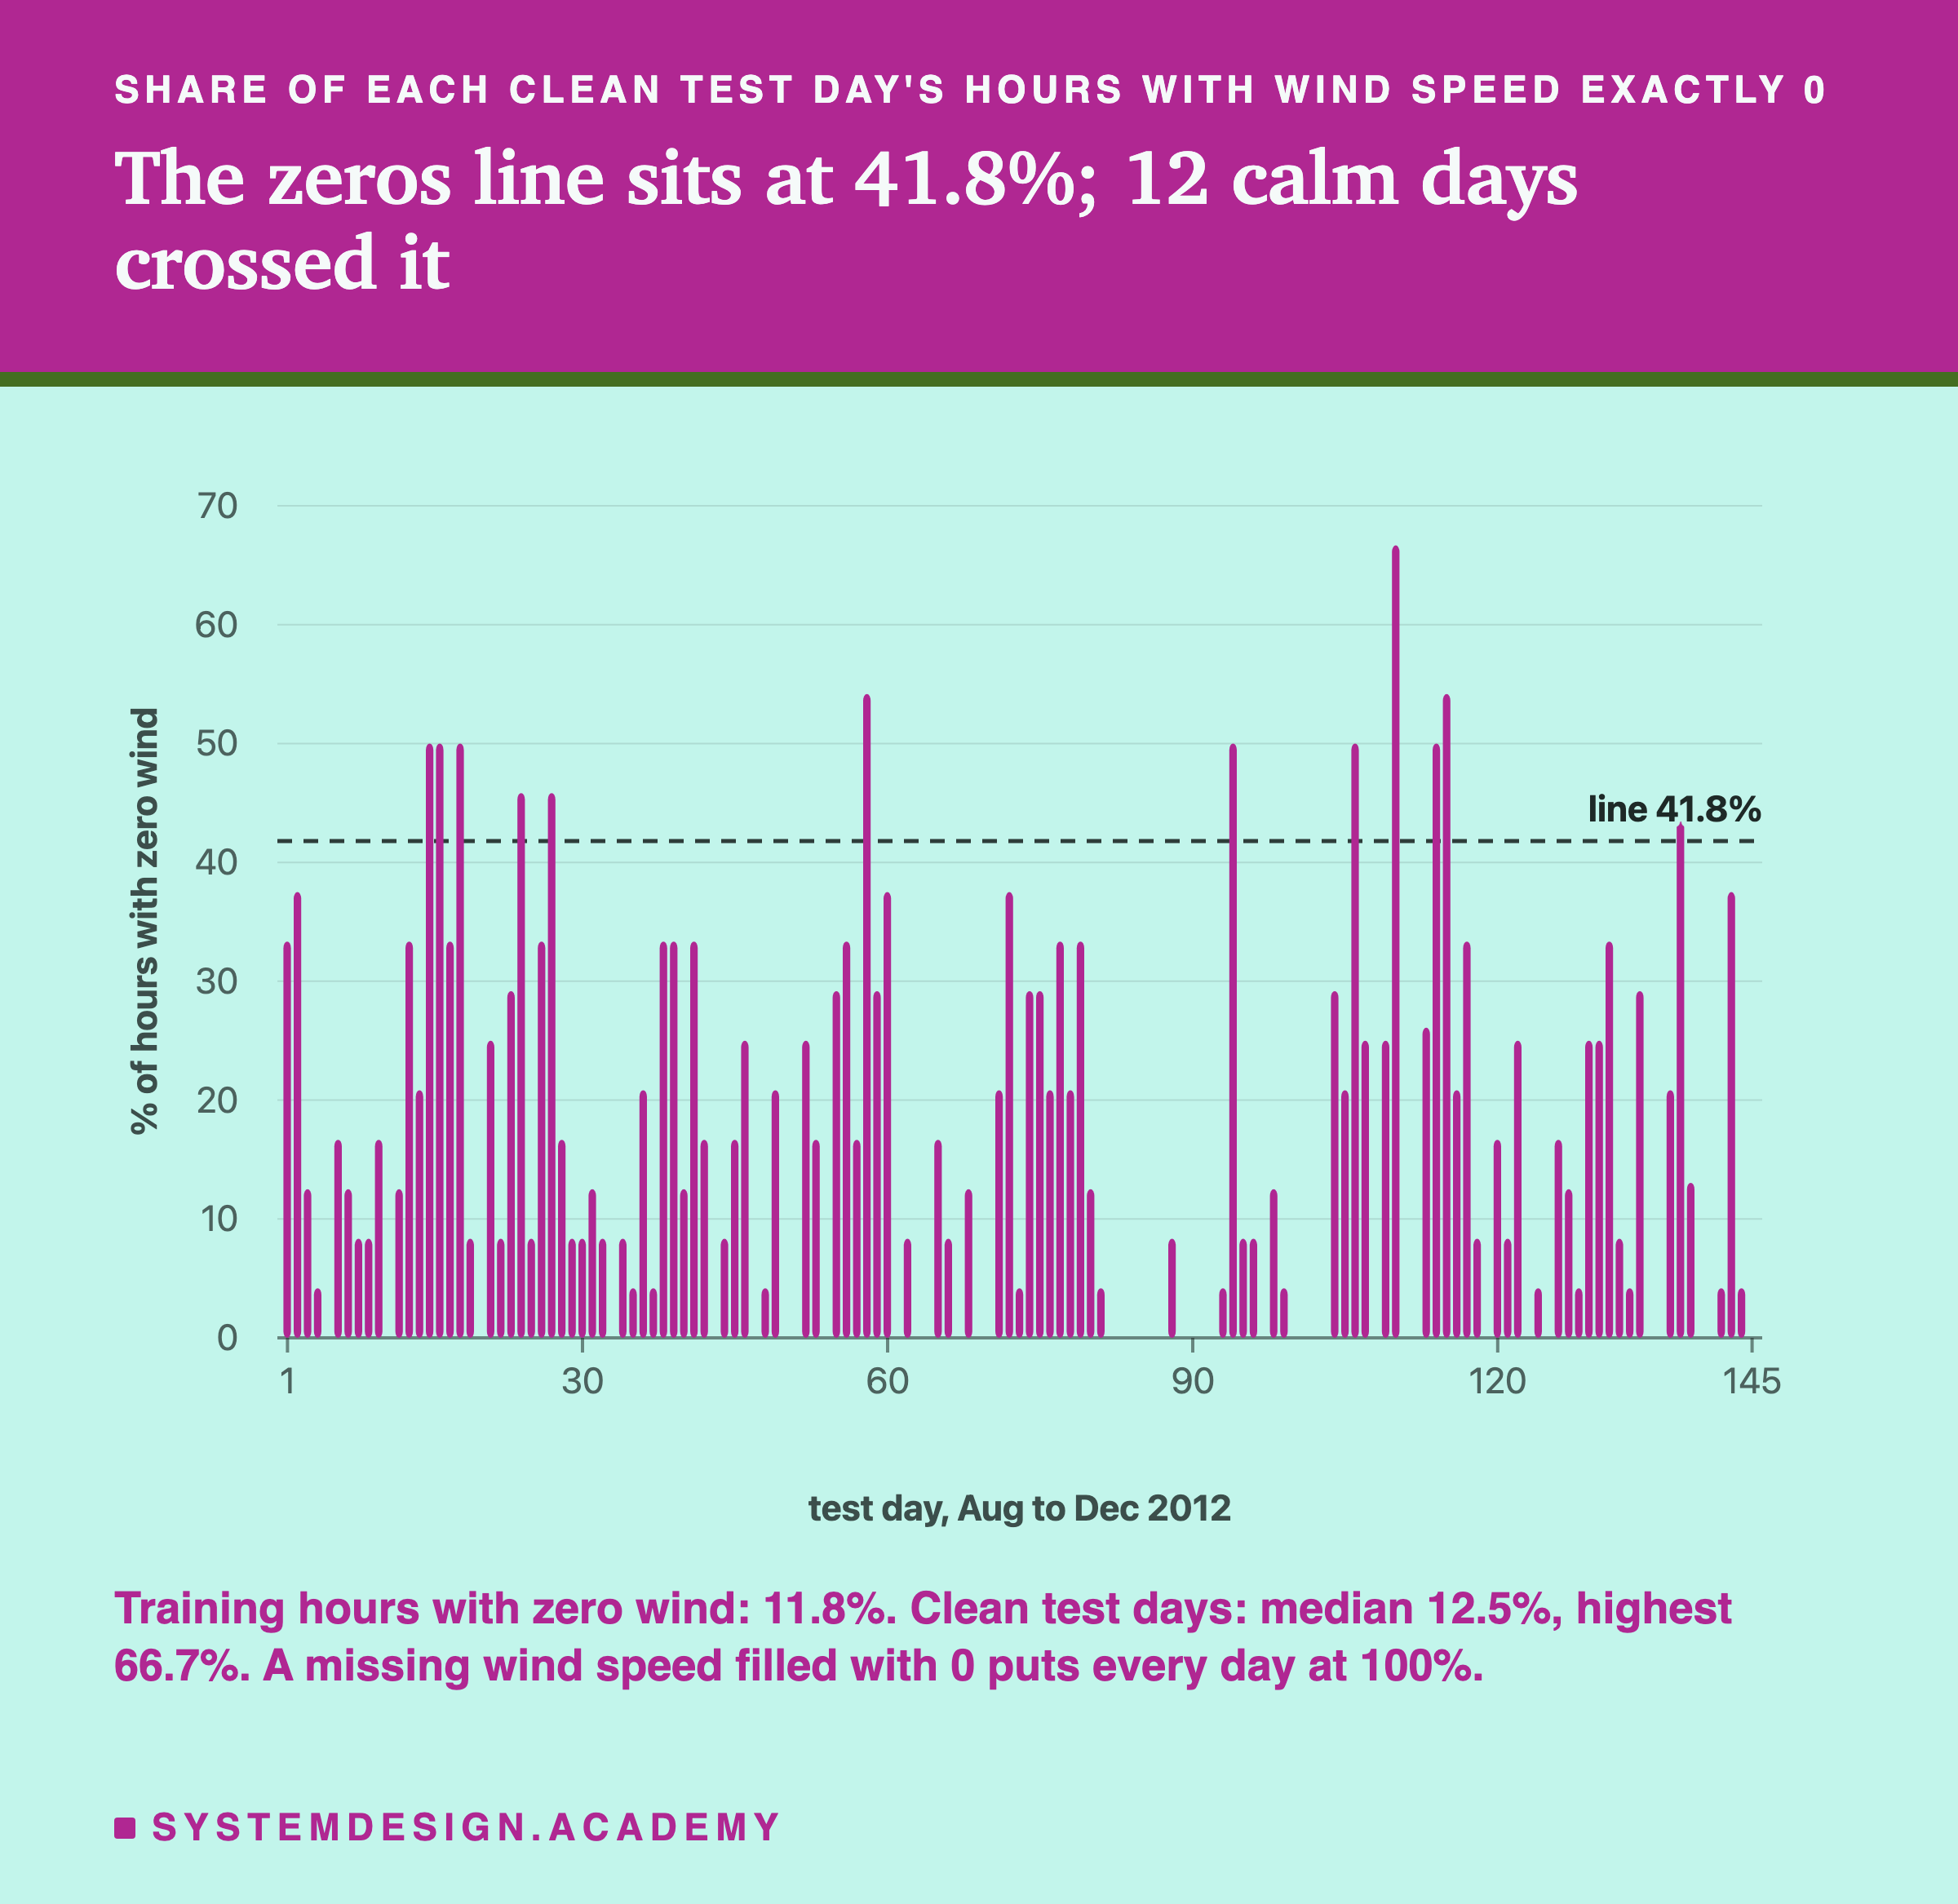
The chart shows what choosing the zeros line costs. A missing wind speed filled with 0 puts every day at 100%, far above any line you could choose. Calm days go up to 66.7%. The line of 0.30 above training (41.8%) sits between them and catches the break on every day, at the cost of 12 false alarms in 145 days, about one every 12 days. The playground later on lets you move that line and watch both numbers change.
The Distribution Check Raised an Alarm Every Day
Now the check that failed. As designed before the run, psi fired on every one of the 145 clean days. A check that fires every day tells you nothing, so, as designed, it is useless here. I am not hiding this result: it is the most useful thing the lab found about psi. Everything on this slide was worked out after I saw it.
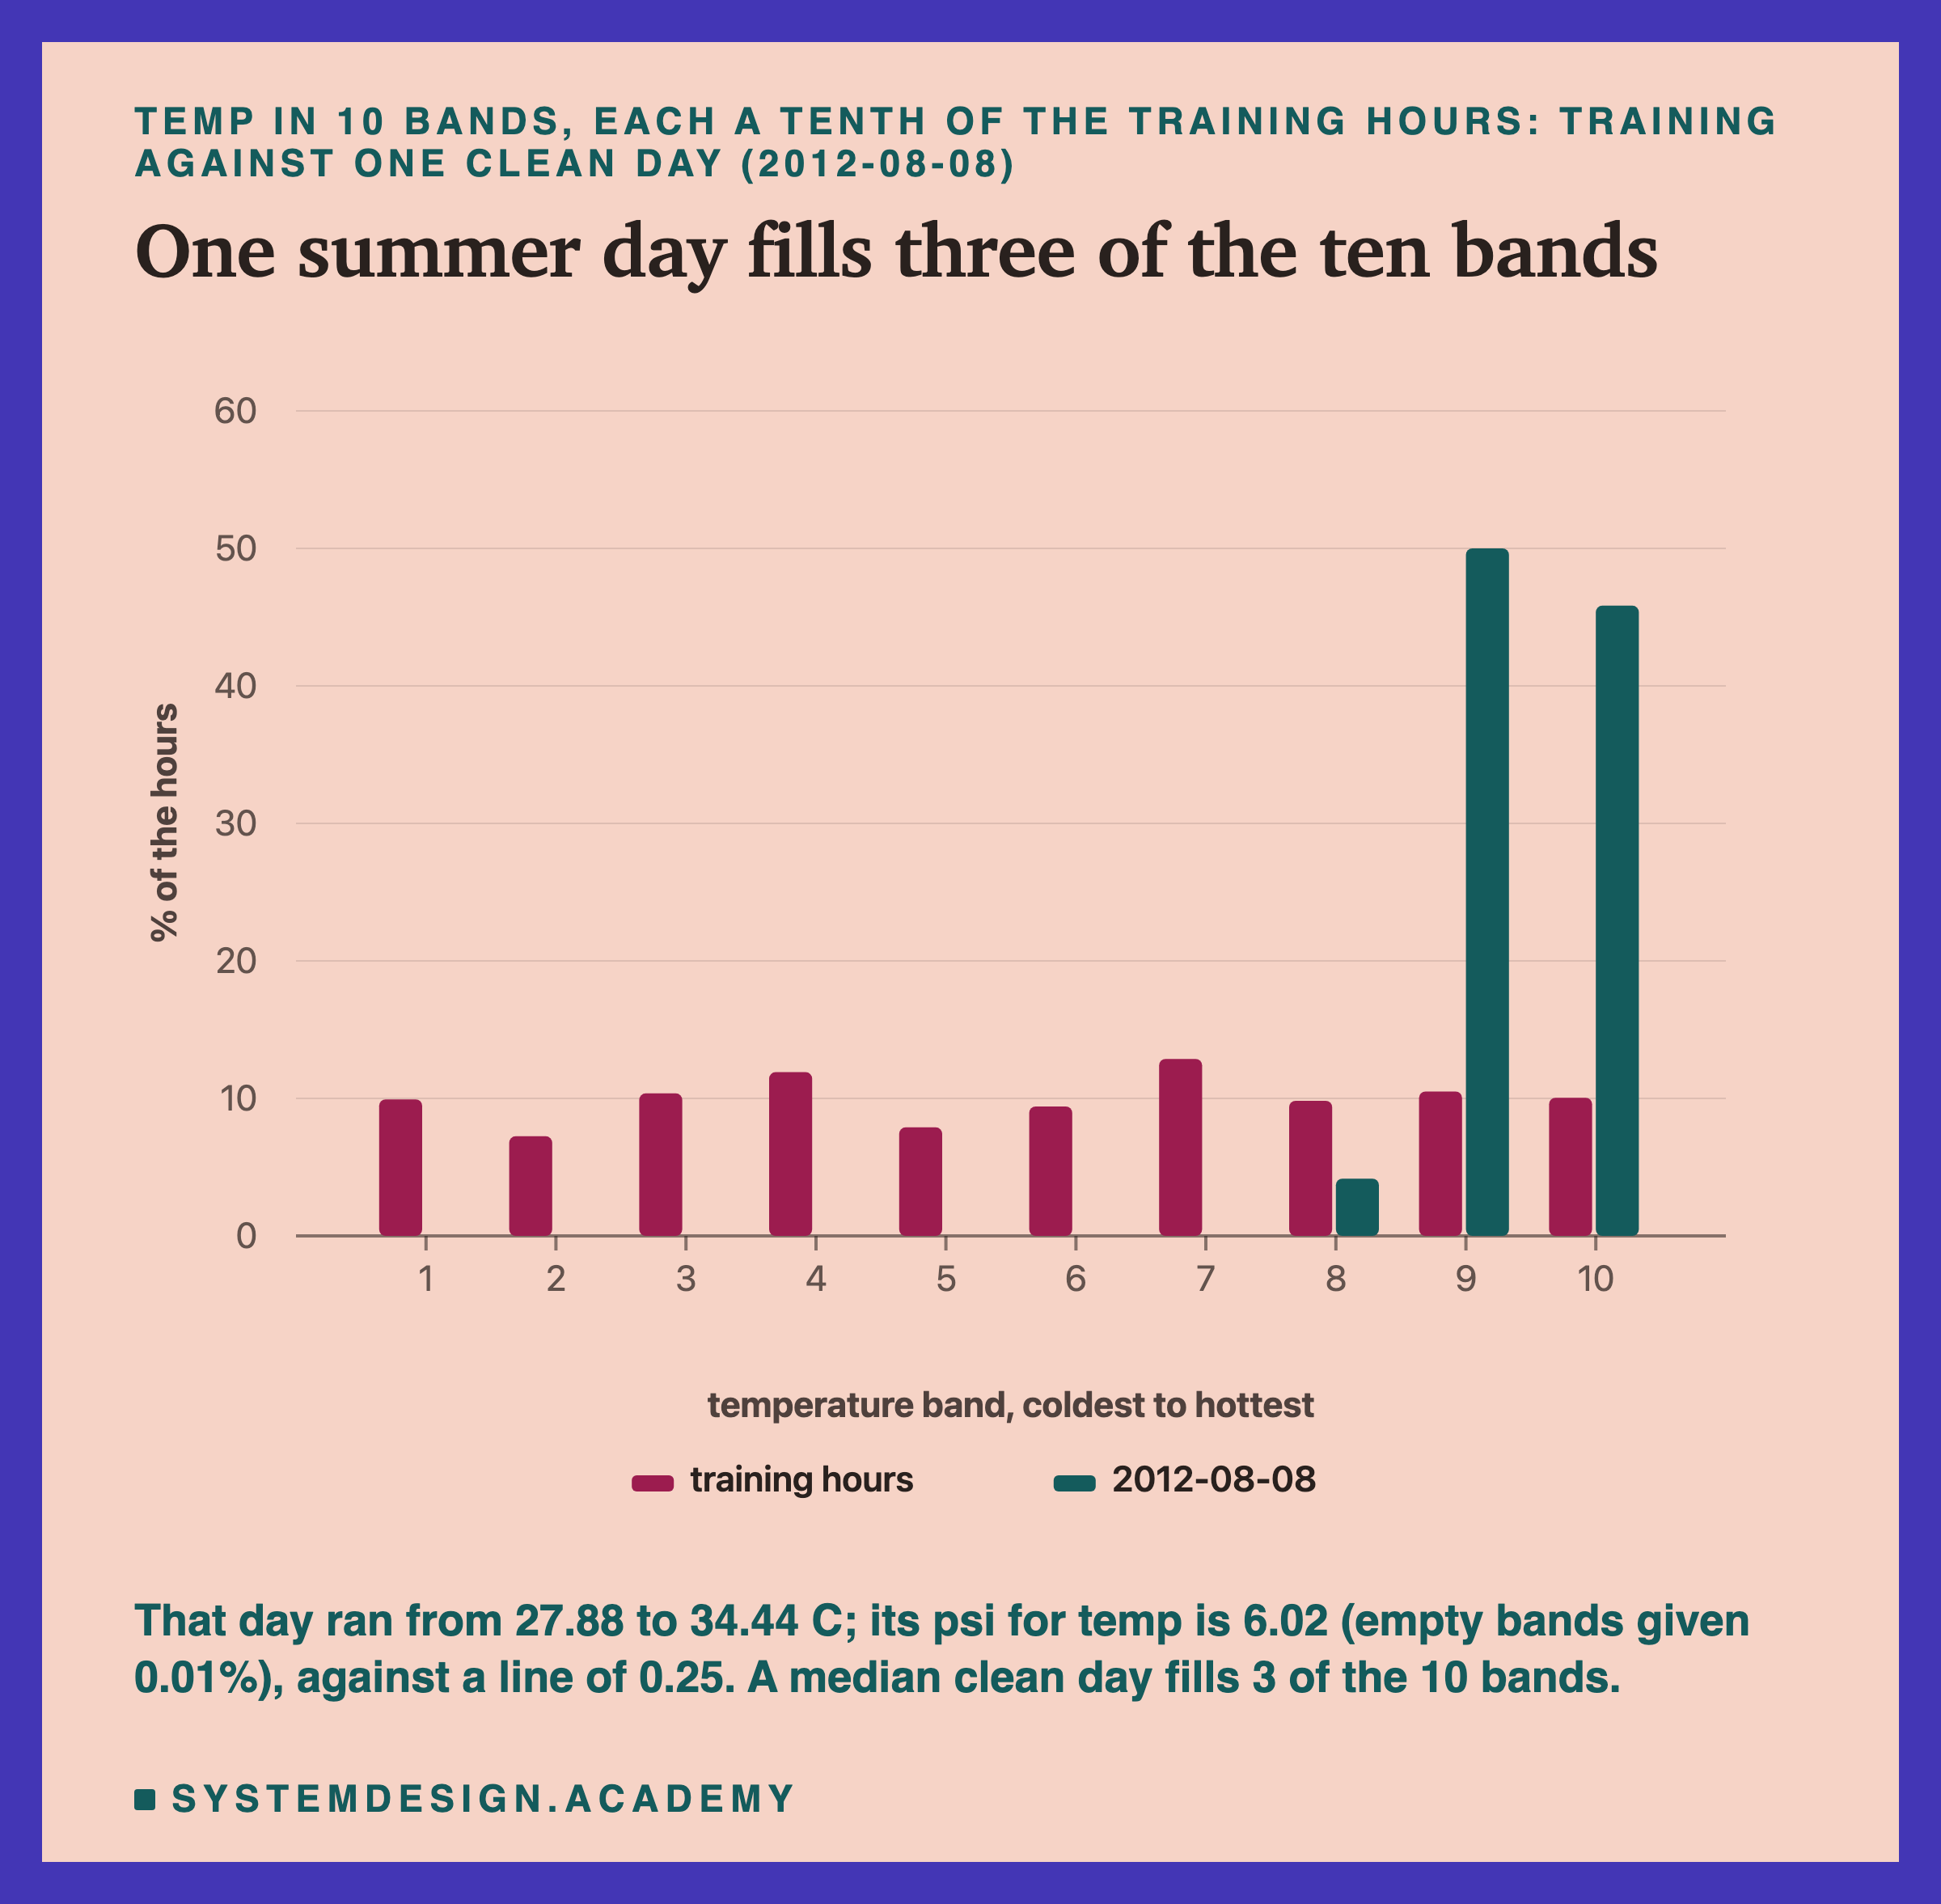
The chart shows why. The training hours run from January 2011 to August 2012, through every season, so each temperature band holds about a tenth of them. One summer day, 8 August 2012, ran from 27.88 to 34.44 degrees. All its hours fall in the three hottest bands, and none in the other seven. Measured against a whole year and a half, one day is always going to look like a huge move, because one day only has one day's weather. With empty bands given 0.01%, its psi for temperature was 6.02, against a line of 0.25.
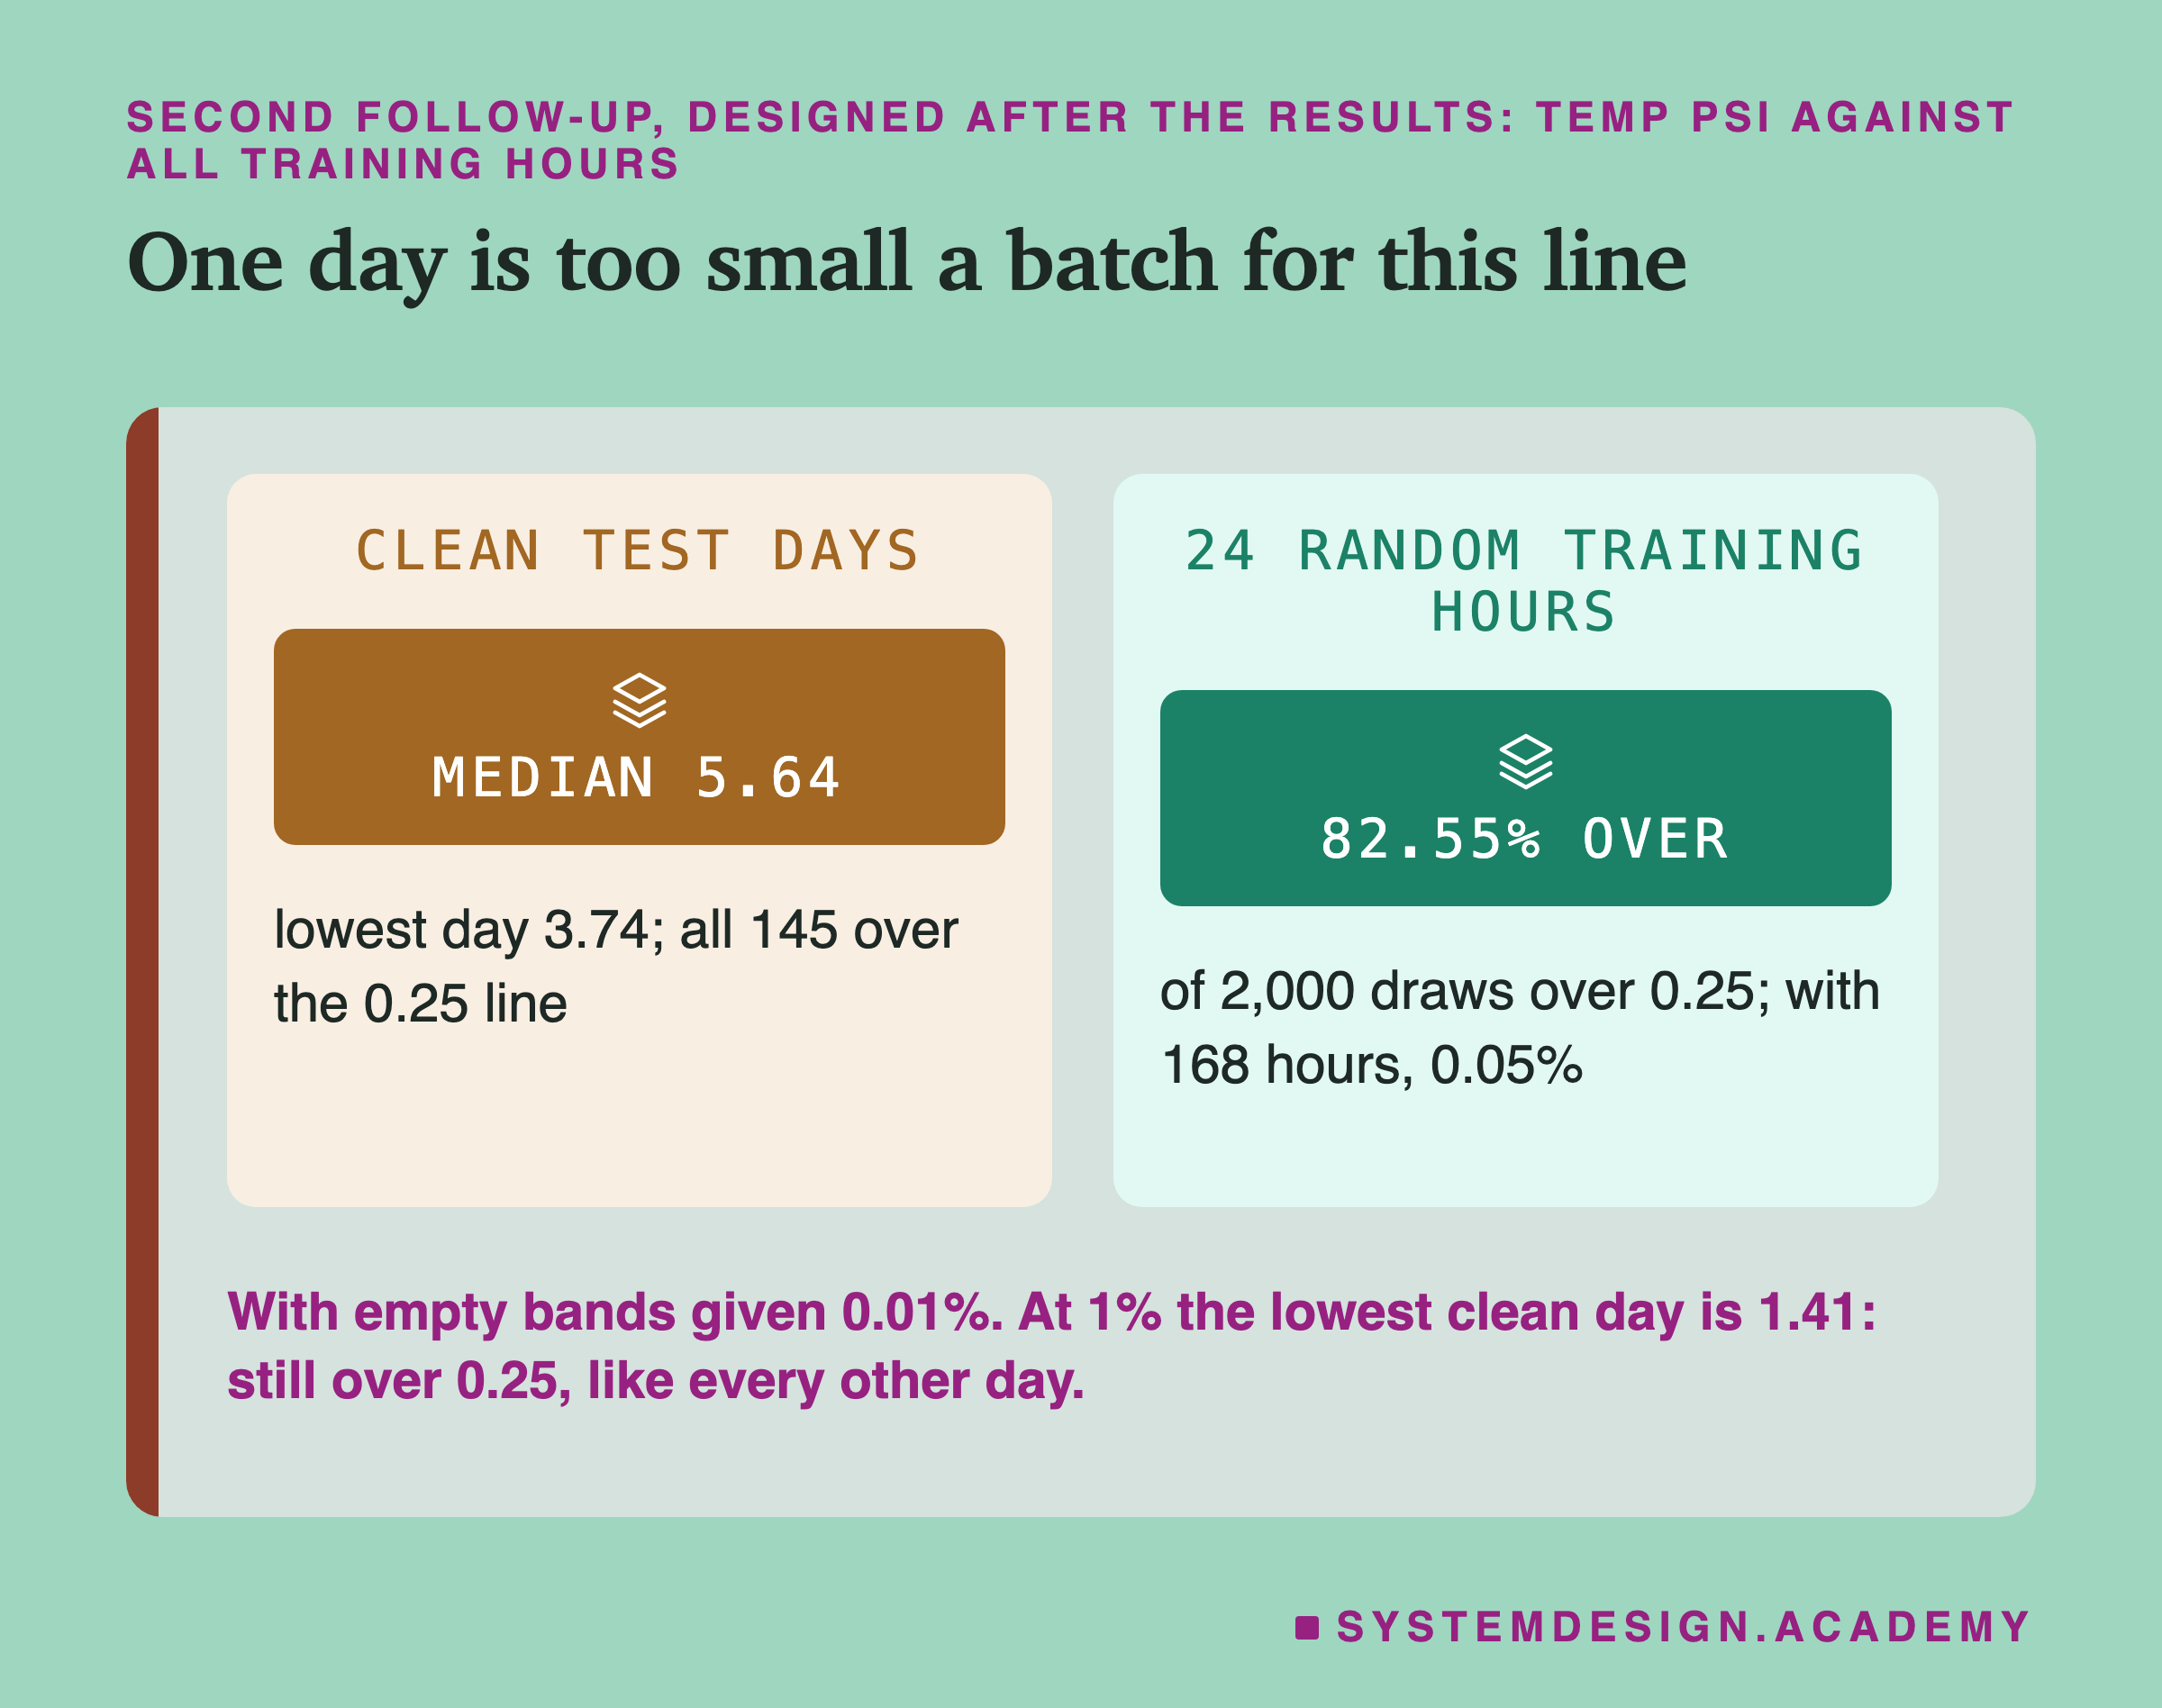
It is not one odd day. With empty bands given 0.01%, the median clean day's psi for temperature was 5.64, and the lowest of all 145 days was 3.74. Humidity and "feels like" temperature were over the line on every day too, and wind speed on 142 of them. By contrast, all 3,476 test hours taken together scored 0.14 for temperature, under the line. So the line itself is not the problem. The problem is the comparison: psi's rule of thumb assumes the batch you check and the reference describe the same kind of period. One day against a year and a half is not that.
A second follow-up, designed after the results and prompted by a review of this lesson, measured two reasons separately. Its design is the psi_size mode of , and its results are in . First, . It drew 24 hours at random from the training hours themselves, 2,000 times, so that no season or weather could differ from the reference, and computed psi against all the training hours. The temperature psi crossed 0.25 in 82.55% of the draws, and at least one of the four columns crossed it in 99.65%. Twenty-four values cannot fill 10 bands evenly, so even hours taken from the reference itself look as if the mix moved. With 168 random hours (a week), only 0.05% of the draws crossed the line, and with 720 (a month), none did. So at one day this line fires on almost any batch; at a week or a month, random hours stay under it, and a batch that crosses it there really is different from the reference.
A Follow-Up: Bigger Batches, Same-Season Reference
The obvious repair is to make the batch and the reference describe the same kind of period: a bigger batch, against a reference from the same time of year. I tried that in a follow-up, designed after the main results and written into checks_lab.py under followup before it ran. Its results are in results/checks_followup.json.
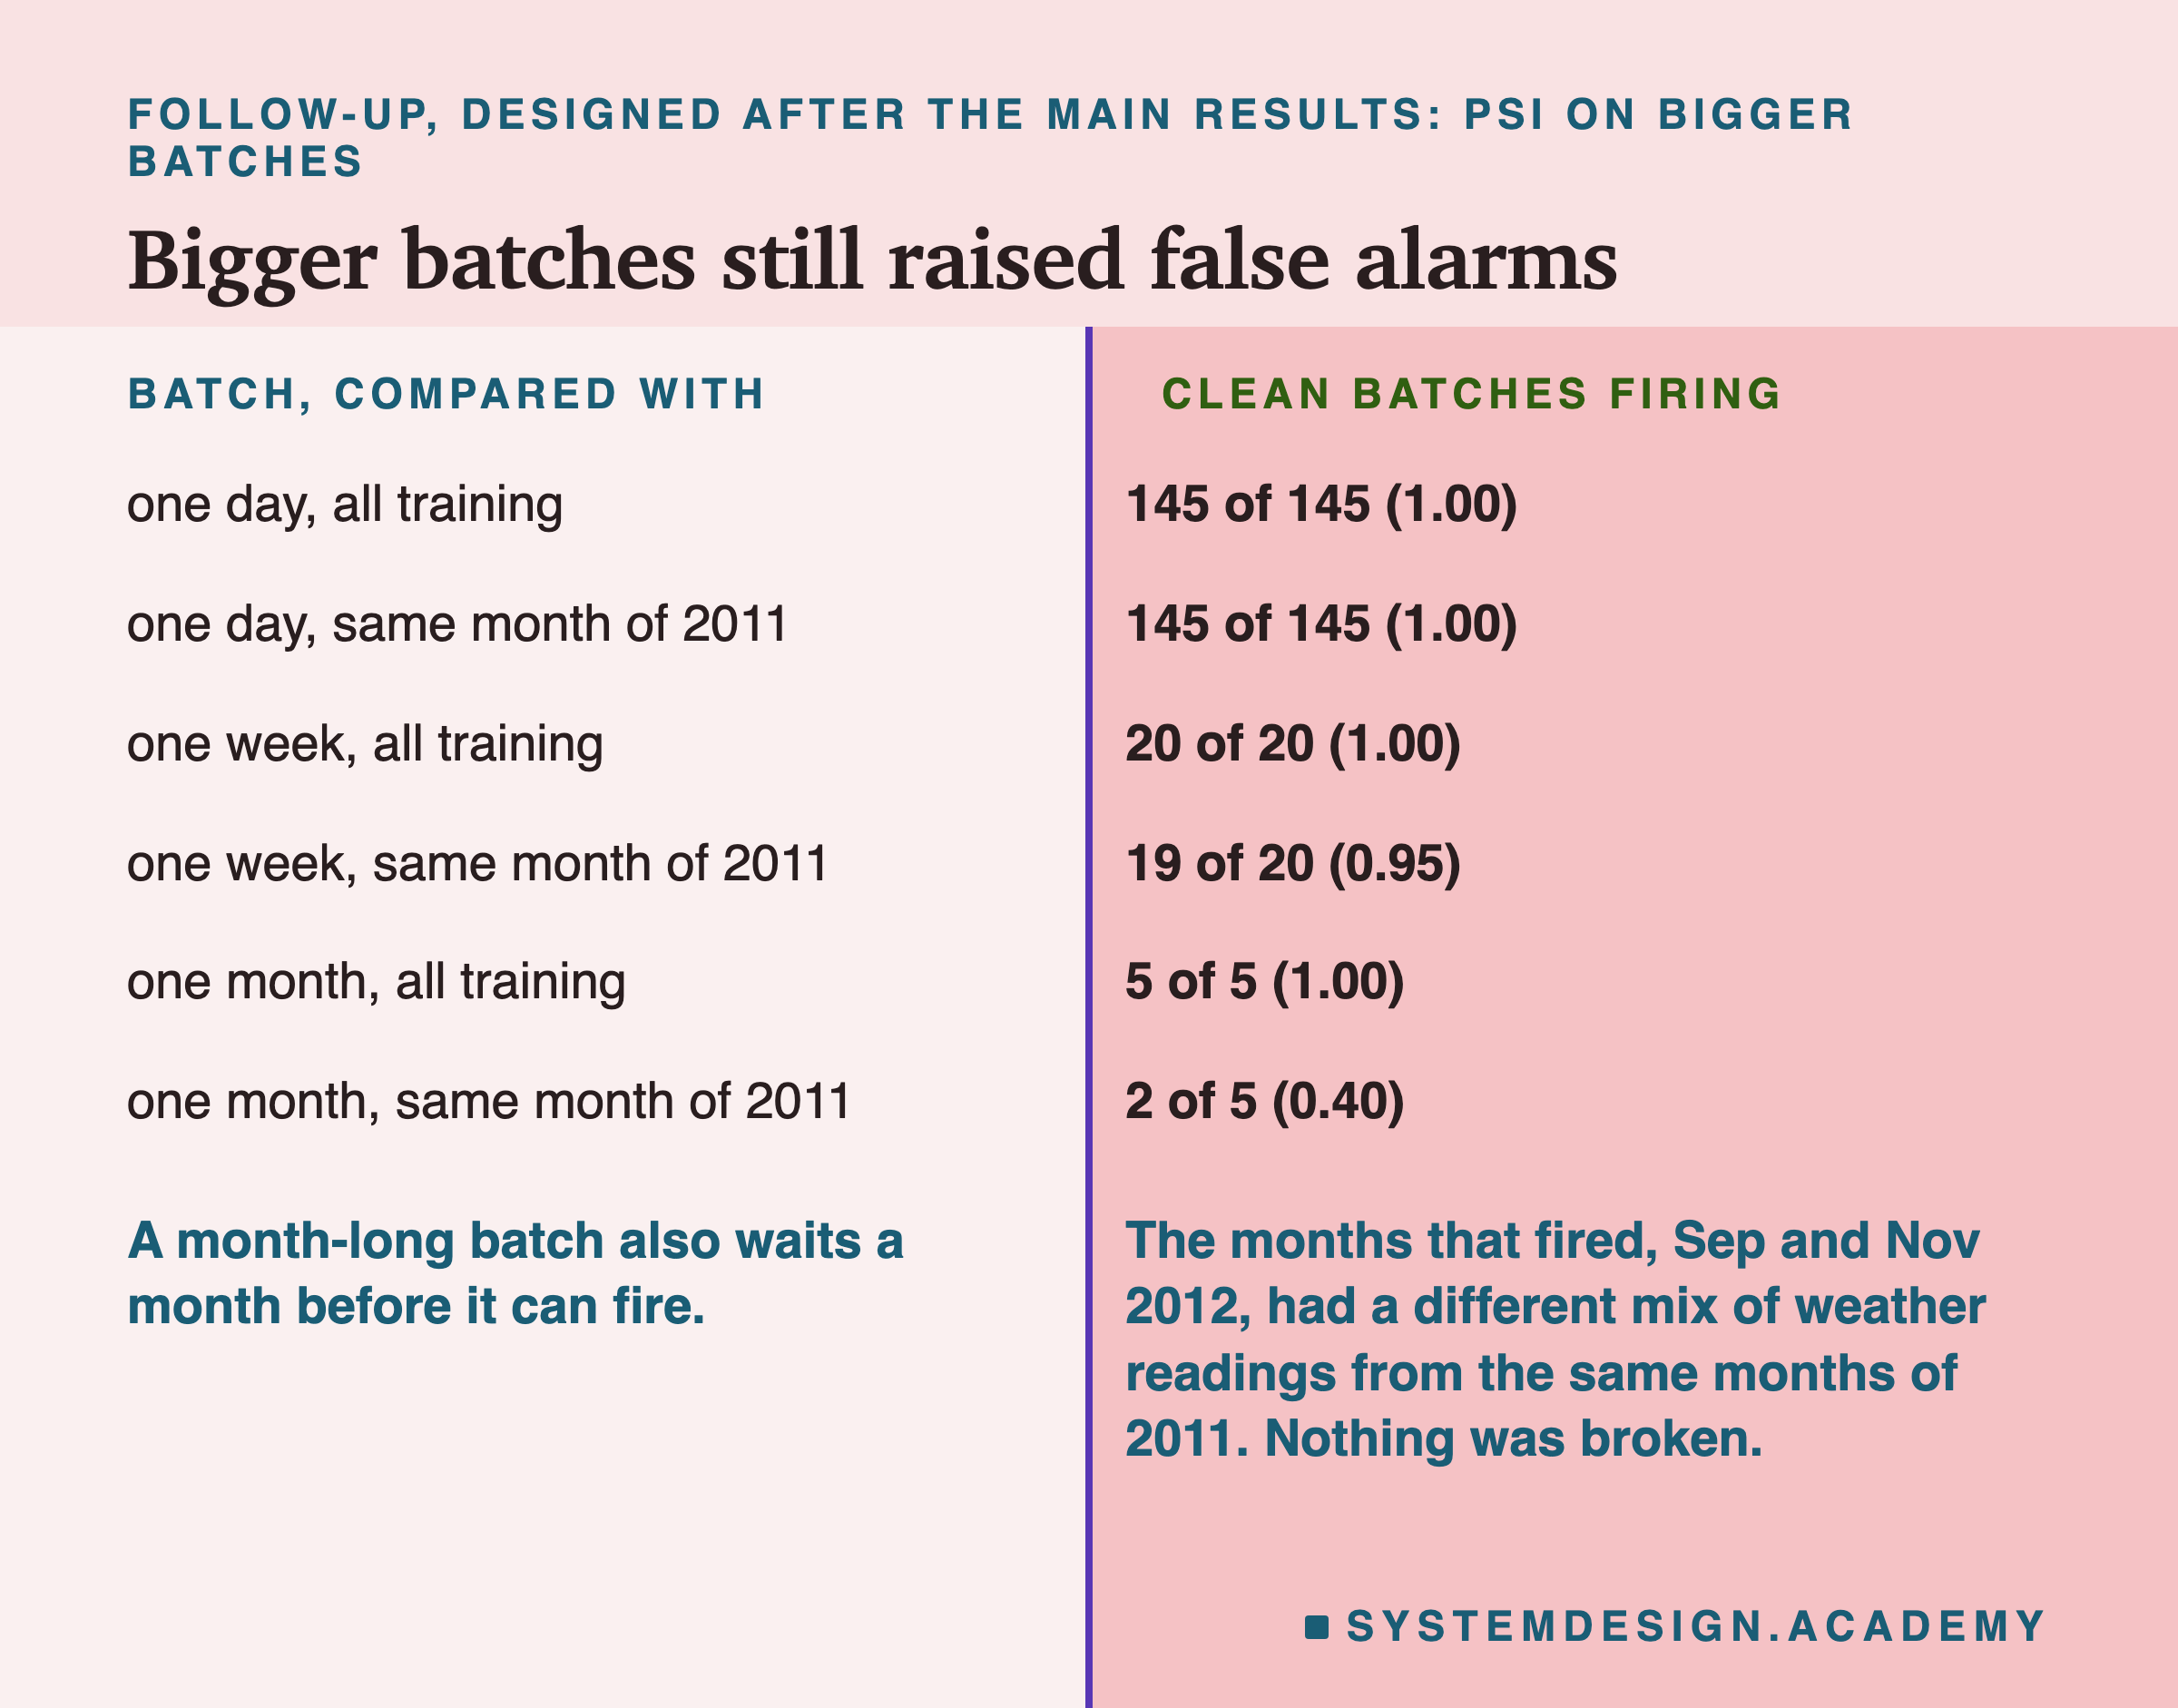
Each batch (one day, seven days, or one calendar month) was compared with two references: all the training hours, as before, and only the hours of the same calendar month one year earlier, in 2011. Against all training hours, every batch size still fired on every clean batch. Against the same month of 2011, one day still fired every time, one week fired on 19 of 20 weeks, and one month on 2 of 5 months.
The two months that fired were September and November 2012. For September the humidity psi was 0.87; for November the temperature psi was 0.67 and humidity 1.01. Those months really did have different weather from the same months a year before. psi measured that correctly. But it is not a break, and a check cannot tell a real change in the weather from a broken sensor by psi alone. The second follow-up backs this up: a month of random training hours never crossed the line, so what fired on the clean months was a real change in the weather.
To be fair to psi, the same monthly check against the same month of 2011 did separate some breaks: it fired on 5 of 5 months under Fahrenheit, humidity as a percentage, wind filled with 0 and the stuck temperature, against 2 of 5 clean months. Under the hour shift, the weekday shift and the capitalised label it fired on 2 of 5, the same as clean.
So even the fairest version here raised an alarm on 2 of 5 clean months, and a monthly check only speaks once a month, long after a break has done its damage. I read this as: psi on raw weather is a way to describe how the world is moving (the subject of a later lesson in this chapter), not a quick alarm for broken inputs. That is my reading of one dataset, not a rule. At a day or a week it fired on almost every clean batch as well as the broken ones, so there its alarms carried no information.
The Worst Break Hides Inside the Normal Range
The hours shifted by 5 did the most damage in lesson 3, and nothing here caught it. The reason is simple once you look at what was sent.
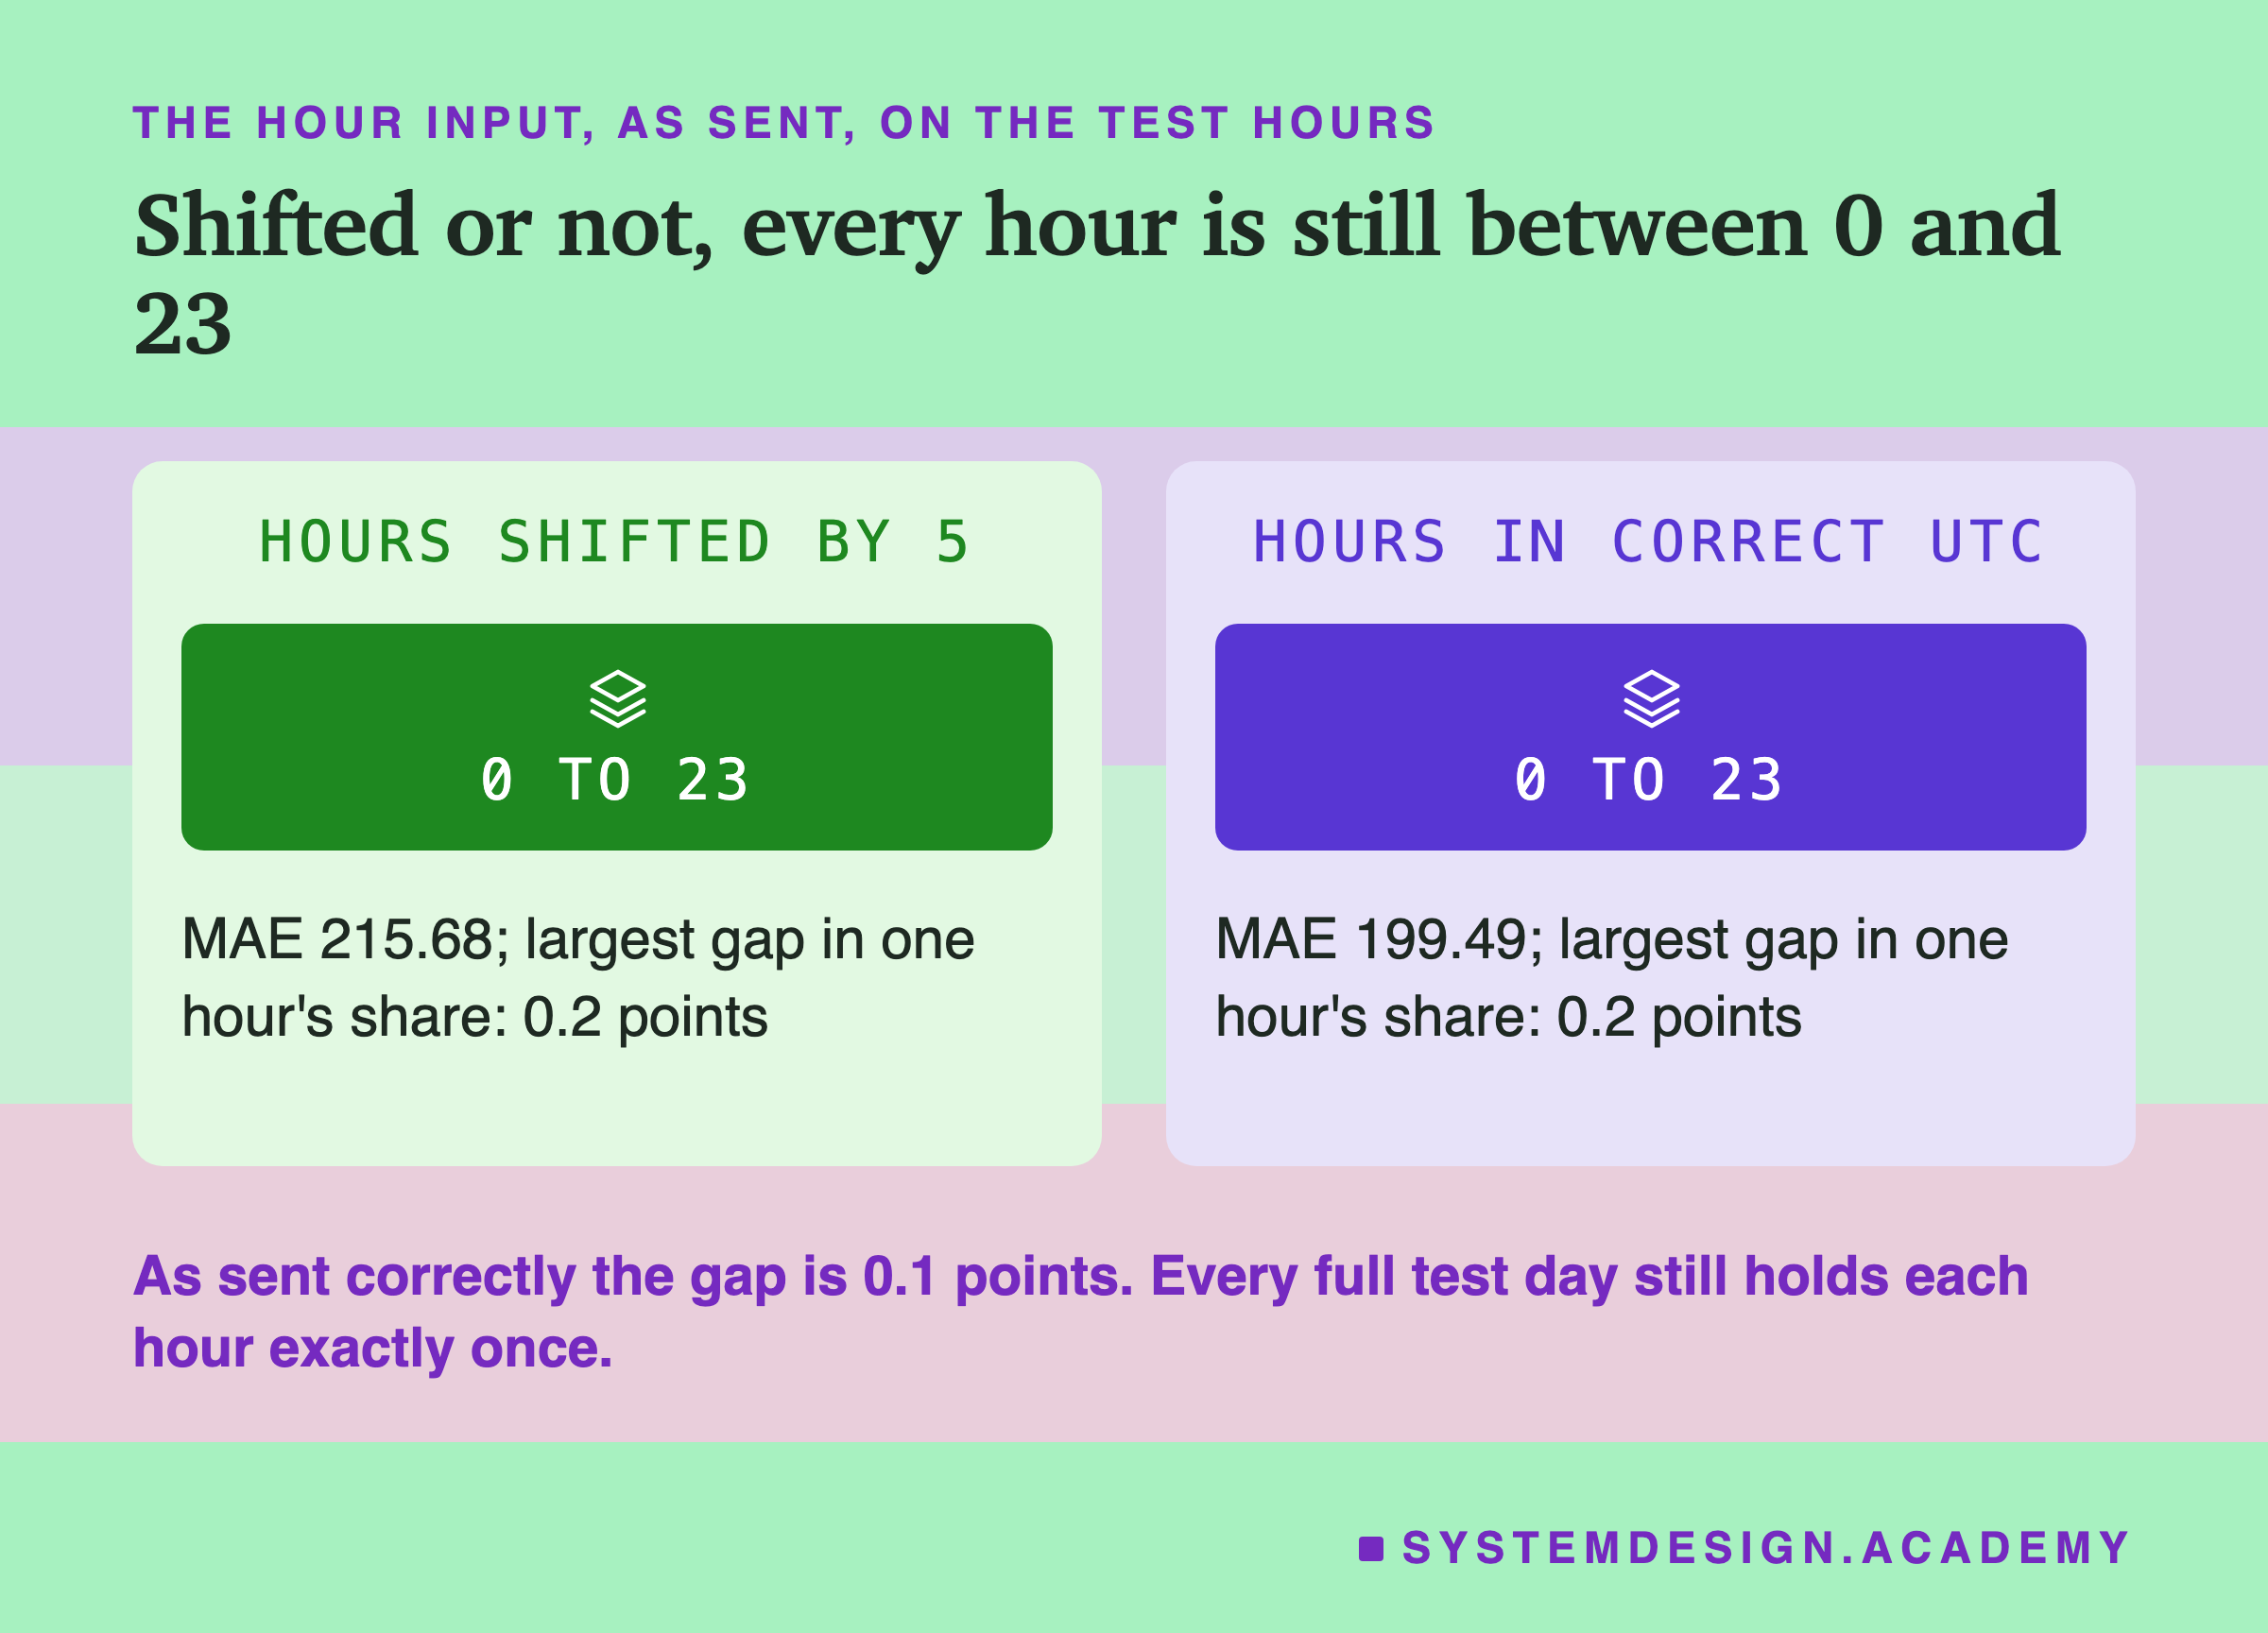
Shifted by 5, the hour still runs from 0 to 23, exactly like the real hour, so the range check has nothing to see. The correct-UTC version, with 4 hours for most of the test and 5 after 4 November, also runs from 0 to 23. I checked both from the data. Each full test day still holds each of the 24 hours exactly once, just in the wrong places. So the mix of hours over a day or over the test hardly changes: the largest difference in the share of any single hour, compared with training, was 0.2 percentage points for both shifted versions, against 0.1 when the hour is sent correctly. (A percentage point is the plain difference between two percentages: 4.3% against 4.1% is 0.2 points.)
That is why this break is so dangerous. Every one of the checks in the main run looks at values one column at a time: is this number too big, is this word new, does this column hold one value, has its mix changed. The shifted hour passes all of those, because each value on its own is perfectly normal. What is wrong is how the hour relates to the moment the request was made. No check on one column alone can see that.
The weekday counted from Monday has the same property. Its values still run from 0 to 6. It cost less, 48.86 against 44.07, with 40.4% of the guesses moving by more than 10 bikes, and nothing in this lesson caught it, including the follow-up checks on the next slide.
A Follow-Up: Checking the Shape of the Day
If the shifted hour is only visible in how the hour relates to the time of day, a check has to look at that relation. The follow-up tried two such checks. I designed them after the main results, knowing which break they had to catch, so they are not a fair trial of anything: they show that a check aimed at this break can exist, and what it needs.
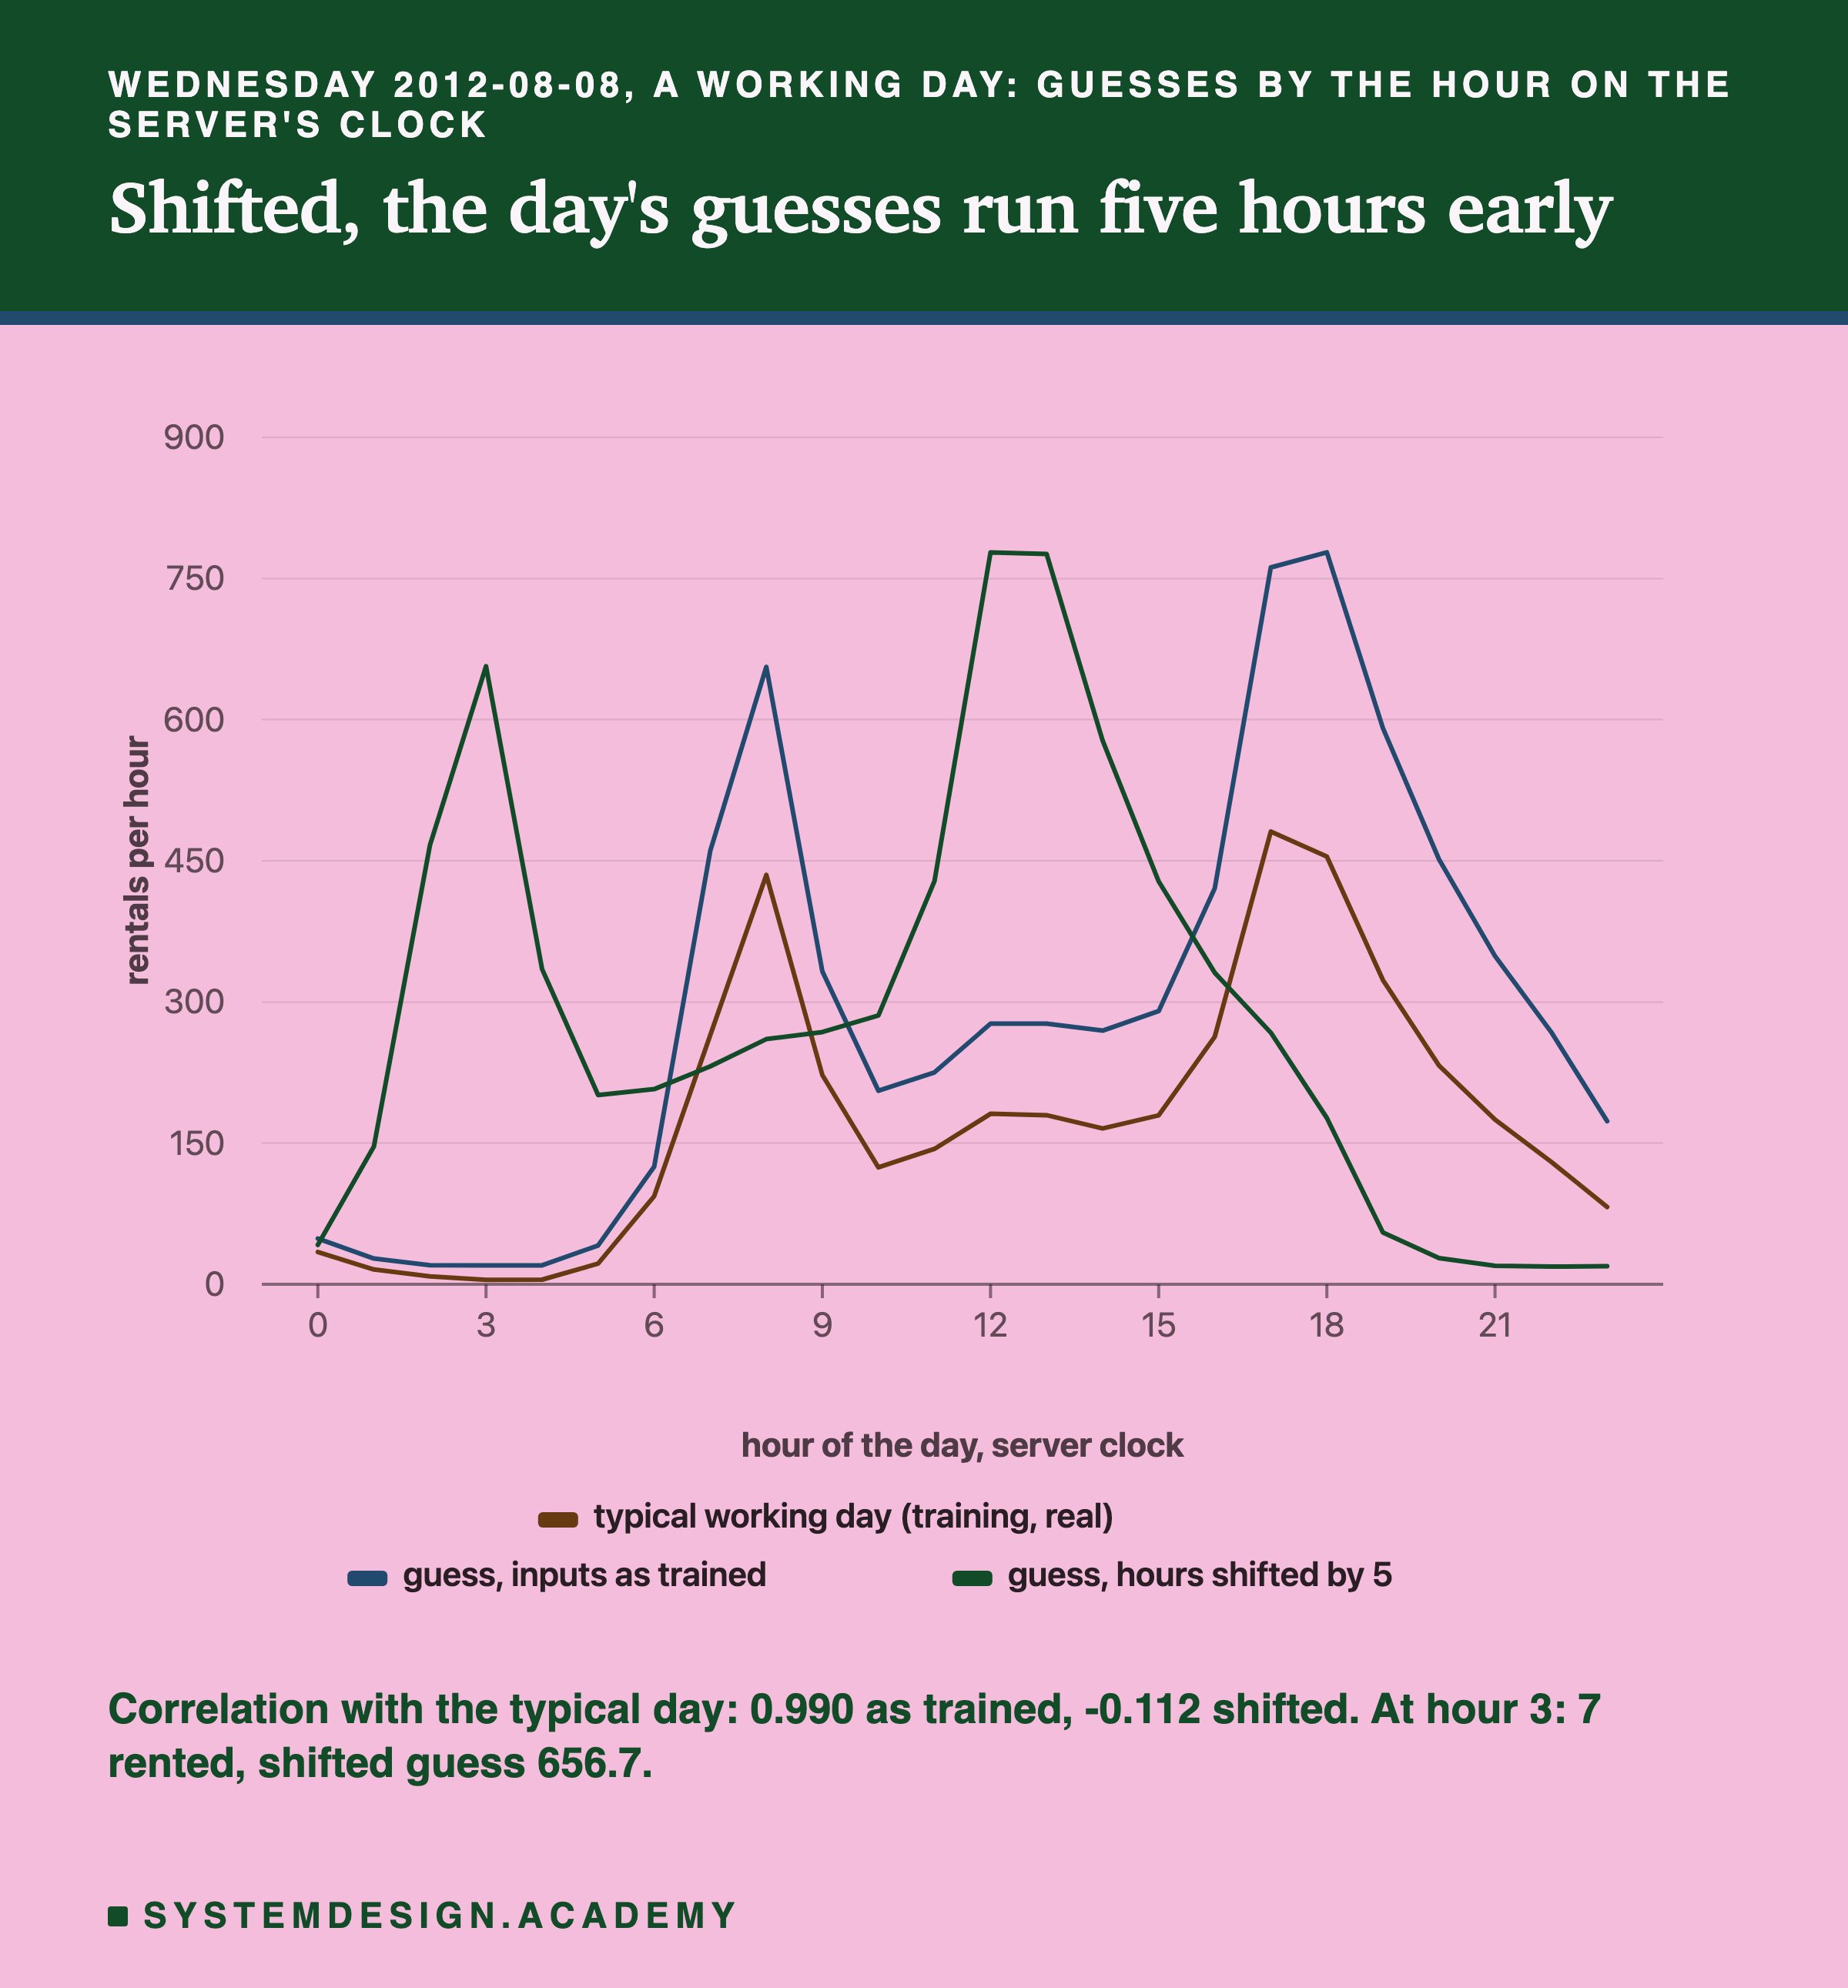
Both checks line up the day's 24 guesses by the hour on the server's own clock: the time each request really arrived, which the serving code did not compute. The shape check measures how closely that line of guesses follows a typical day, using the training hours' average real count for each hour, on working days or days off to match. The measure is the correlation: 1 means the two lines rise and fall together, 0 means no relation, below 0 means they move opposite ways. It fires below 0.732. That line comes from the model's guesses on its own 514 training days: the same correlation, computed for each of those days, was below 0.732 on only 1 day in 100 (this is called the 1st percentile). The peak check fires if, on a working day, the day's largest guess is not at 7, 8 or 9 in the morning or 4 to 7 in the evening, the commute hours in the training data.
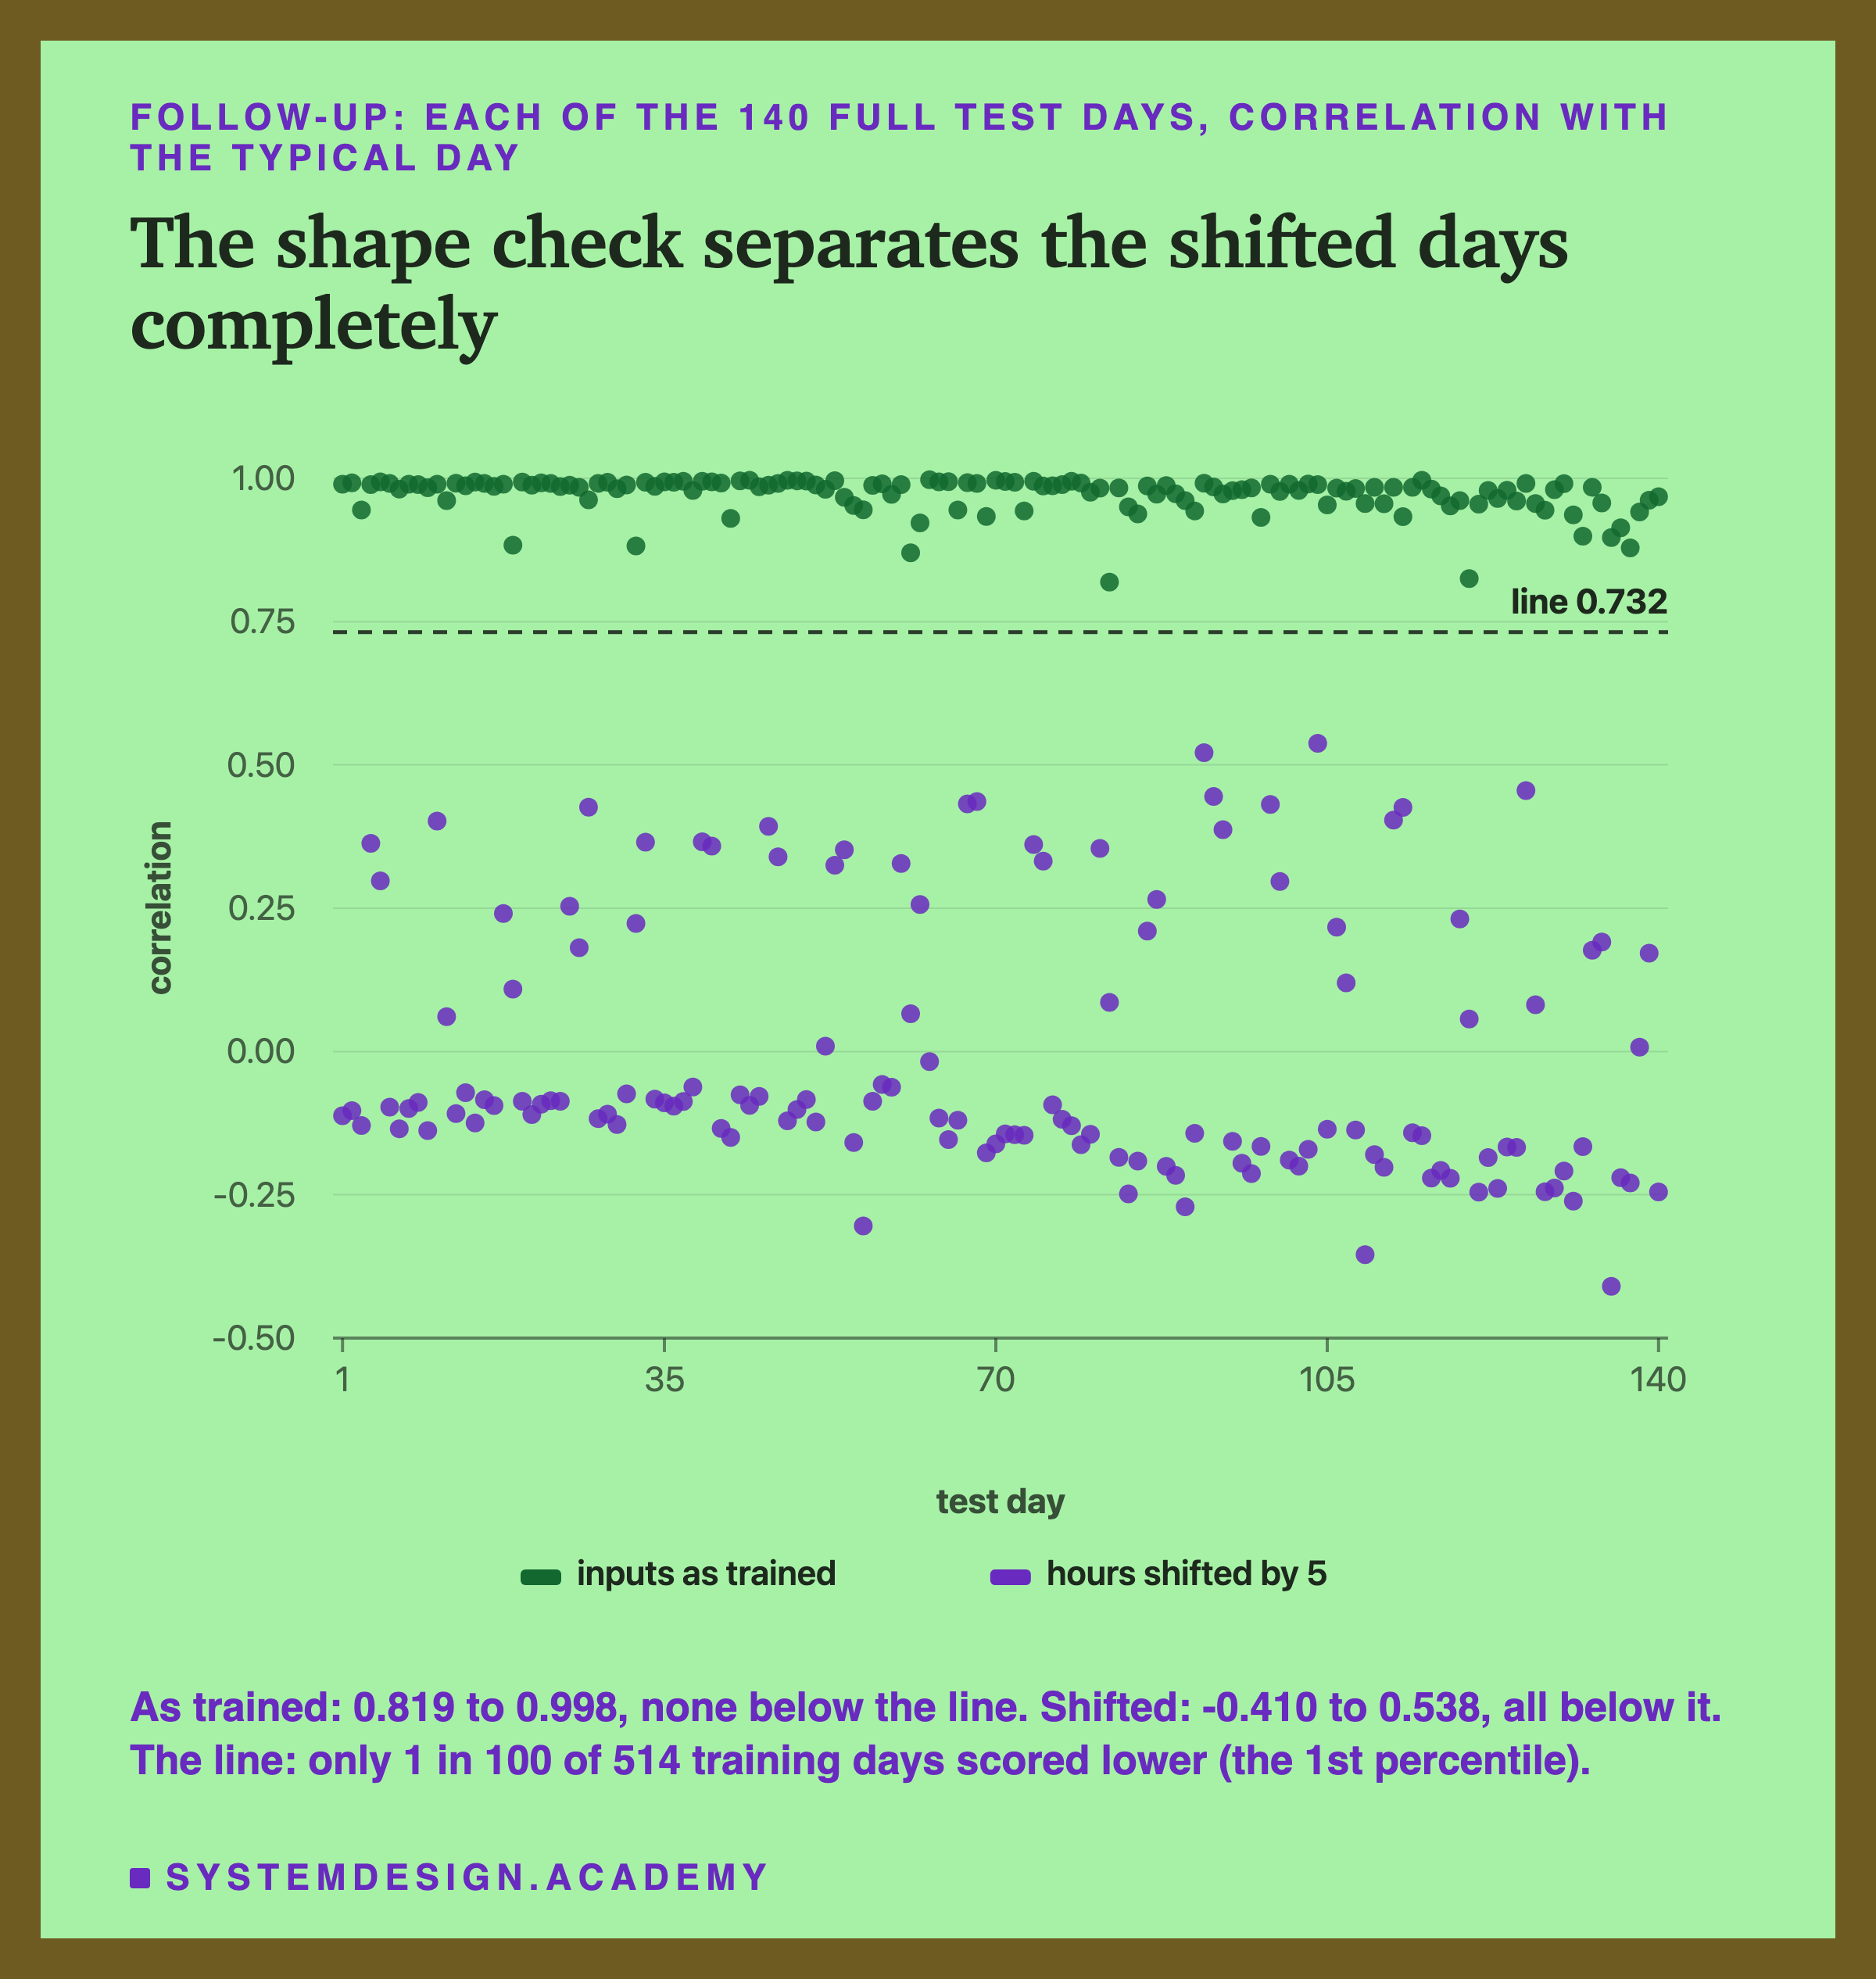
The shape check fired on all 140 full days under both shifts, by 5 and in correct UTC; the peak check, which only looks at working days, fired on all 94 of them. On clean days neither fired at all. On training days the shape check would have fired on 1.2% of them (it was set to about 1%), and the peak check on none of 348 working days. With the hours shifted by 5, the day's biggest guess landed at 3 in the morning or at 12 or 13, never at a commute hour. None of the other breaks moved either check, including the weekday from Monday.
Layered Checks, Then the Real Error
No single check caught everything here. So the practical answer is layers, cheapest first, and then the one number no break can hide from forever.
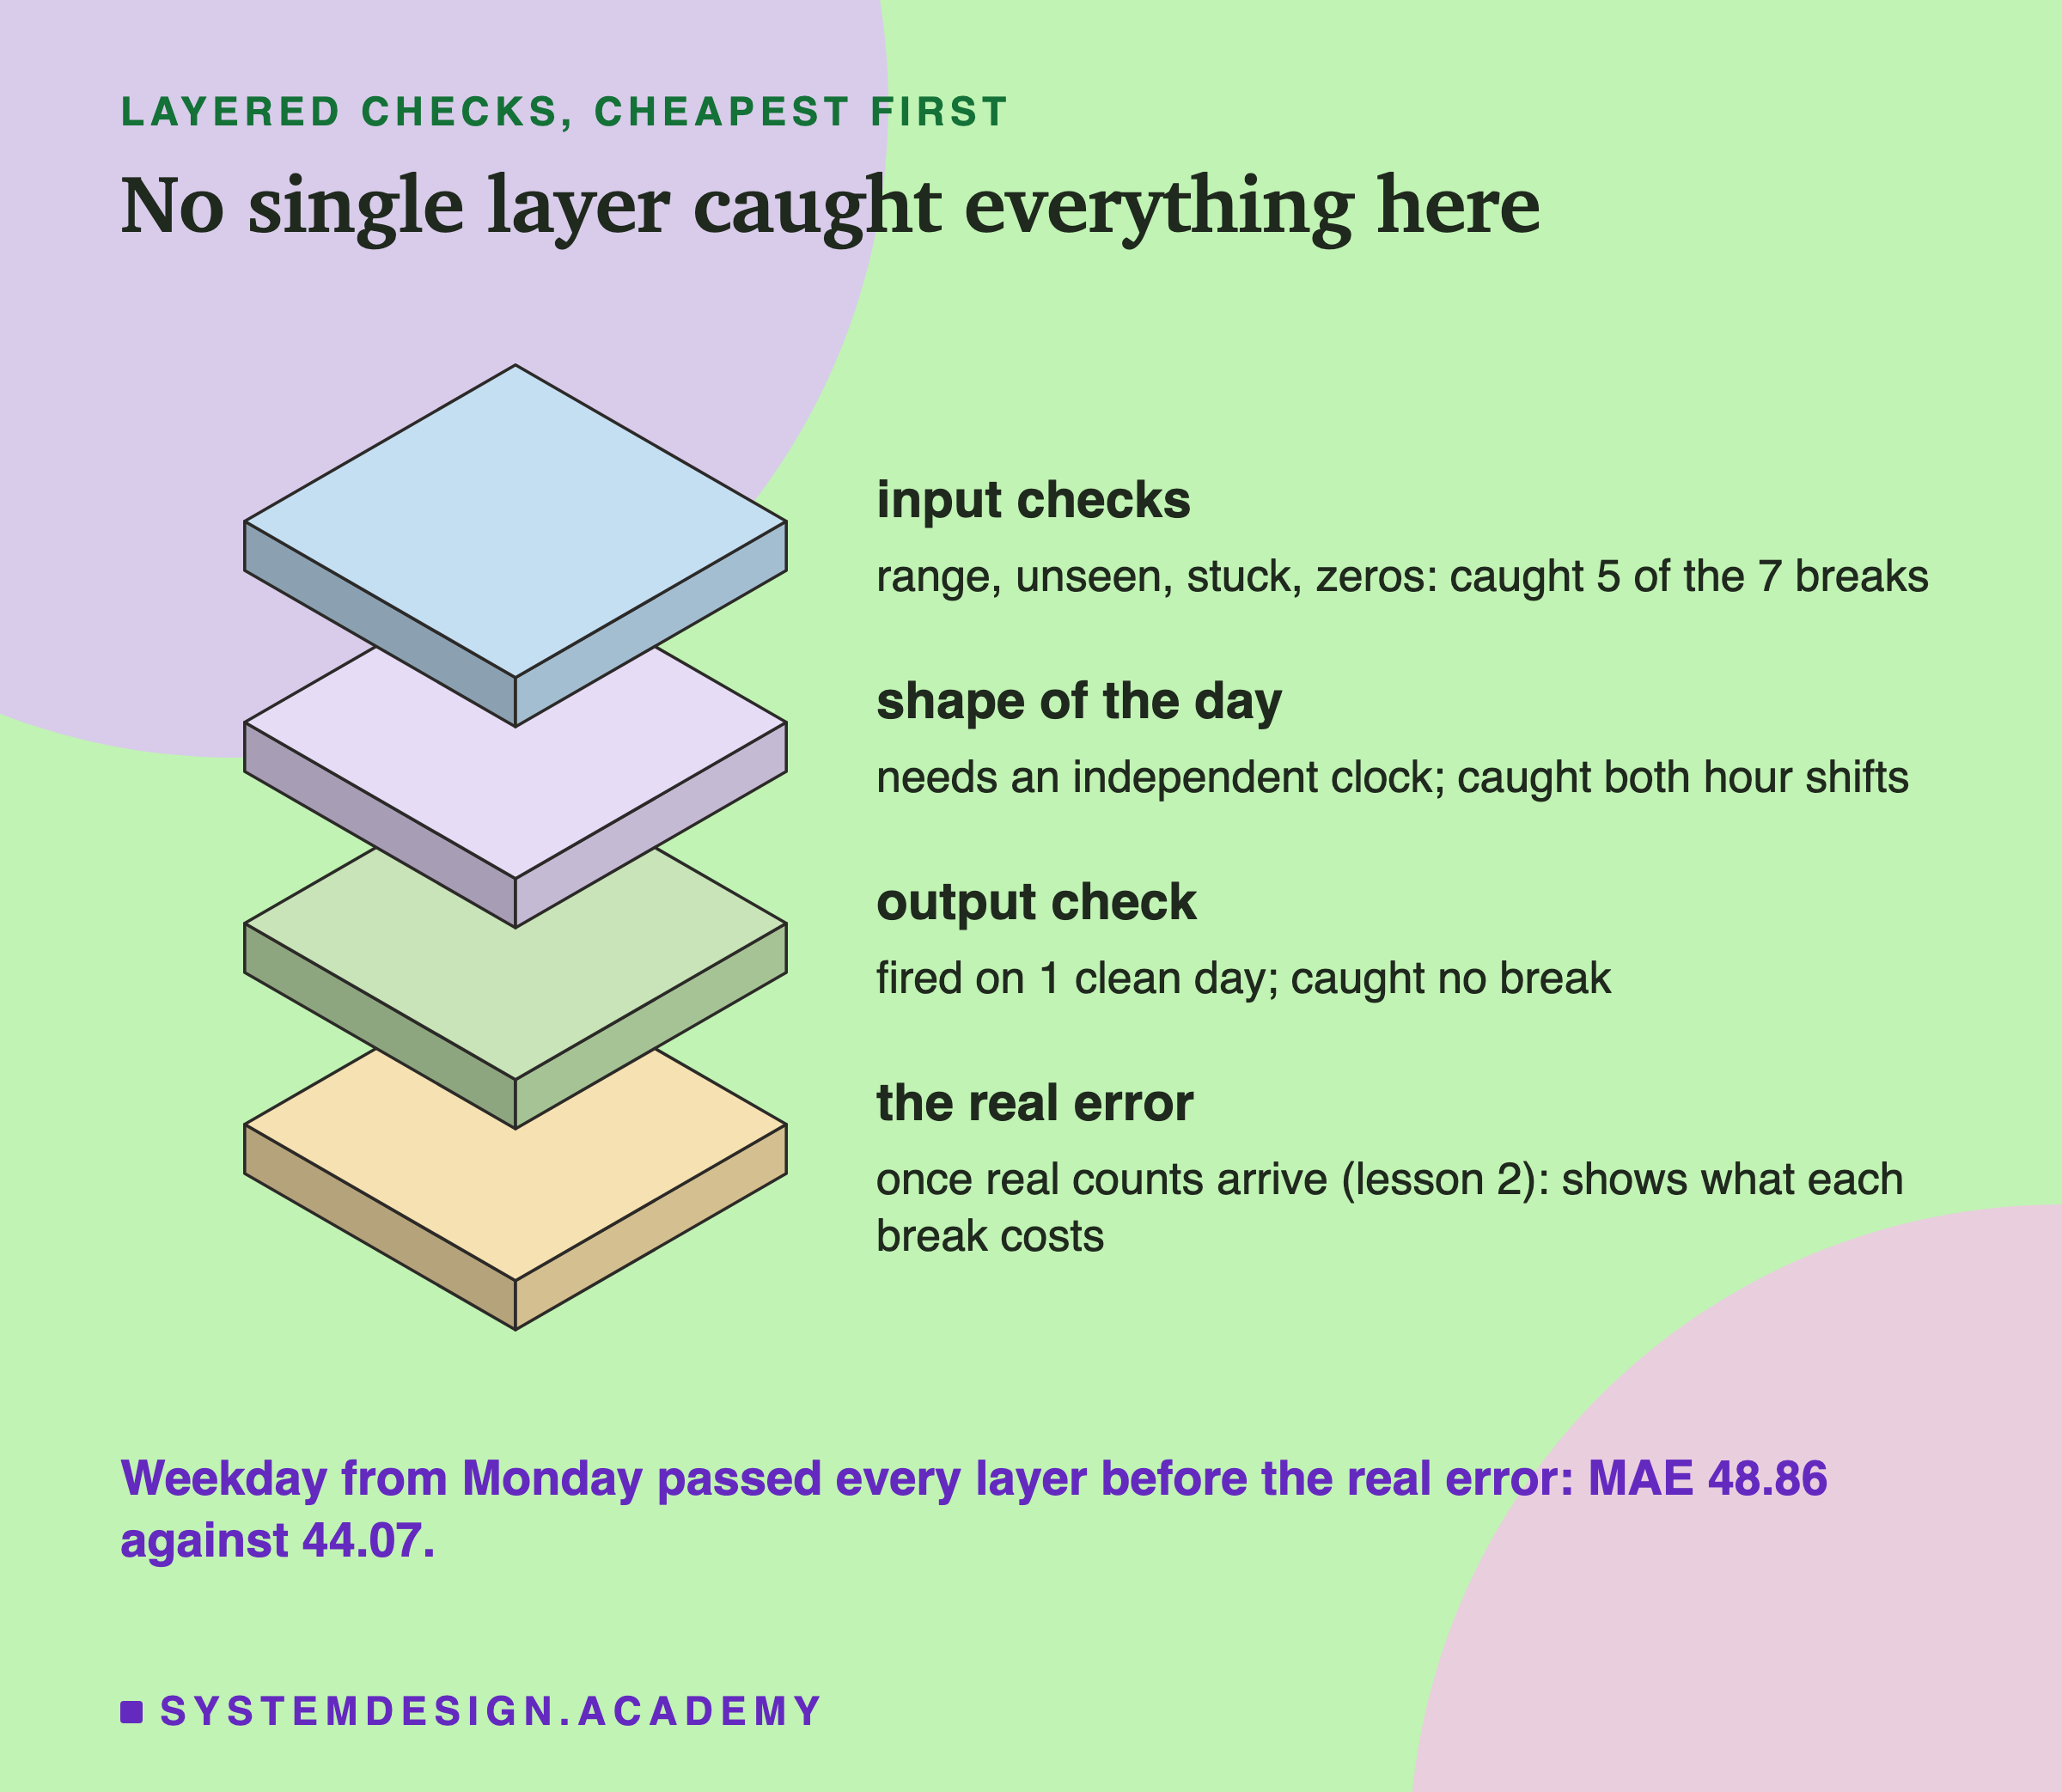
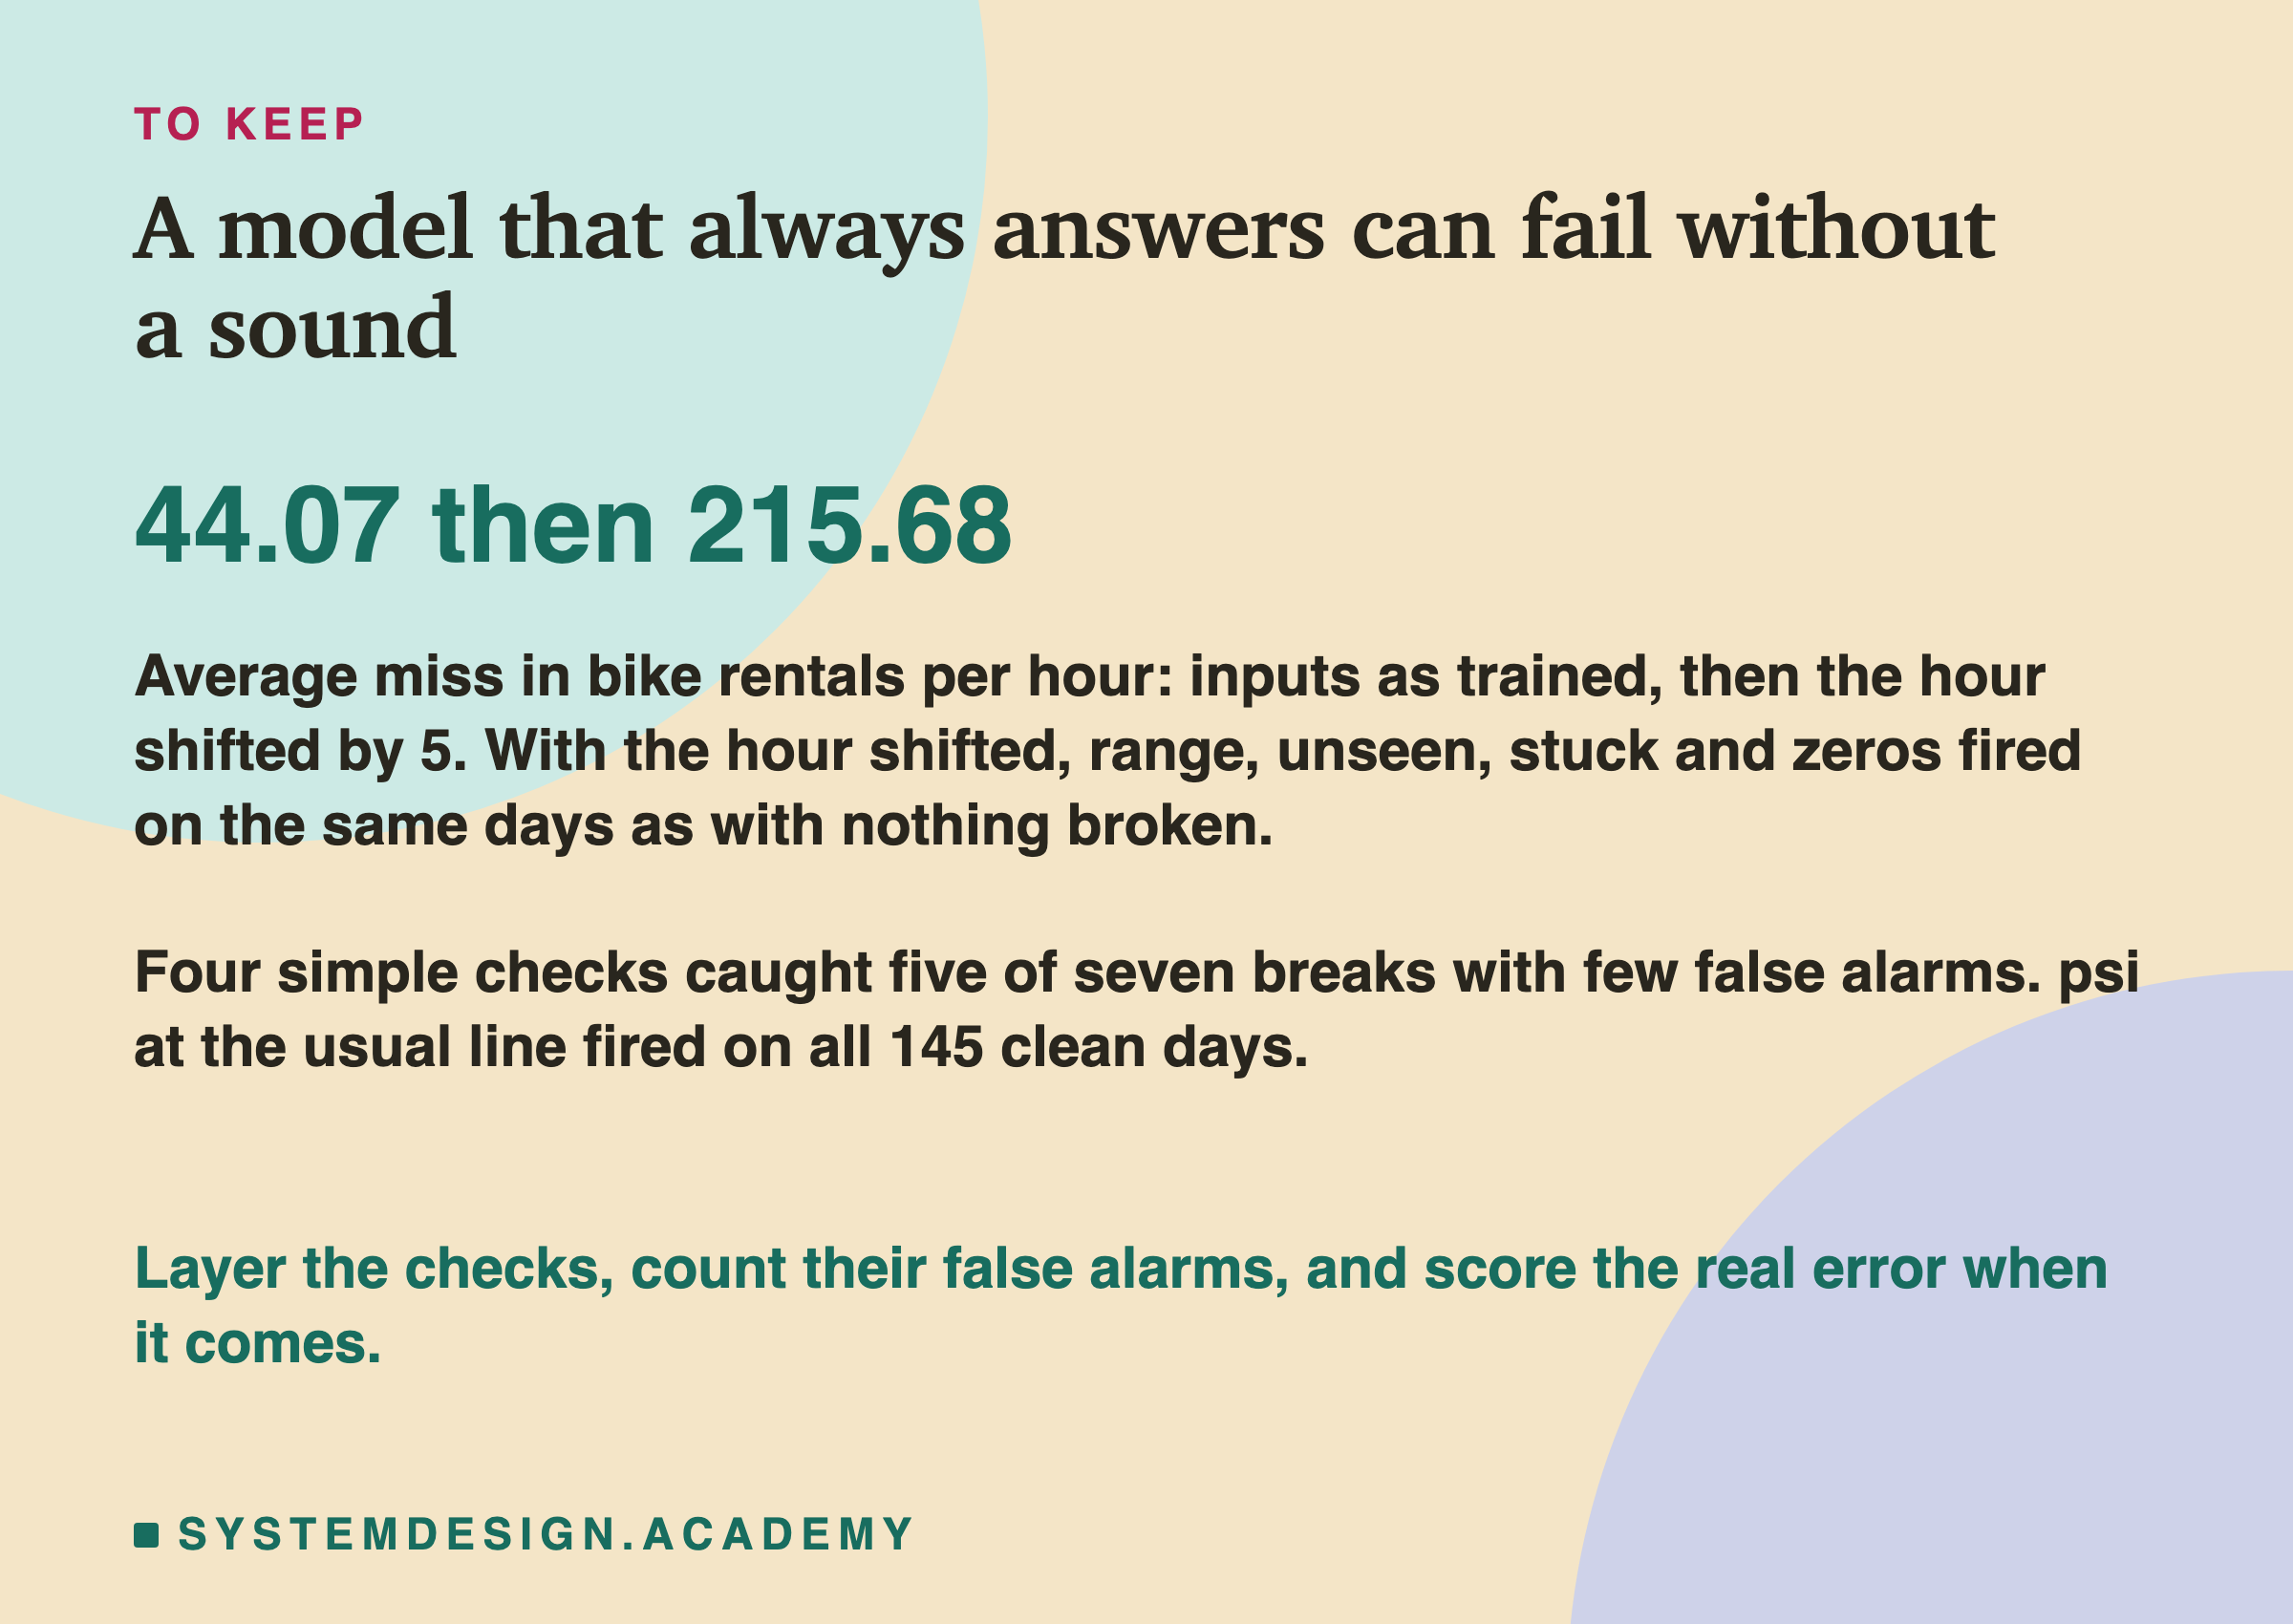
The input checks are cheap and, here, reliable: range, unseen, stuck and zeros caught 5 of the 7 breaks on every day, and between them raised 12 false alarms in 145 days, all from zeros on calm days. The shape of the day caught both hour shifts in the follow-up, but only with a clock the serving code does not compute, and I designed it knowing what to look for. The output check here caught nothing: its one alarm was a half day. The mean of a day's guesses barely moves when a full day's hours are only moved around, as the 295.4 against 291.9 showed.
The real error is the last layer. When the true counts arrive, score the model on them, as lesson 2 did with the newest labelled month: the MAE and the signed error against the error you accepted at launch. For the hours shifted by 5, that number would have jumped from 44.07 to 215.68, and nothing could hide it. The weekday from Monday passed every other layer, and only this one would show it, as a rise from 44.07 to 48.86.
The real error has limits too. Lesson 3 showed two breaks, the capitalised label and the wind filled with 0, where the average error hardly moved while up to 22% of the guesses changed. For those, the input checks were the only layer that noticed anything. That is why you need both: checks that look at inputs before the answers arrive, and the real error once they do.
Try It Yourself
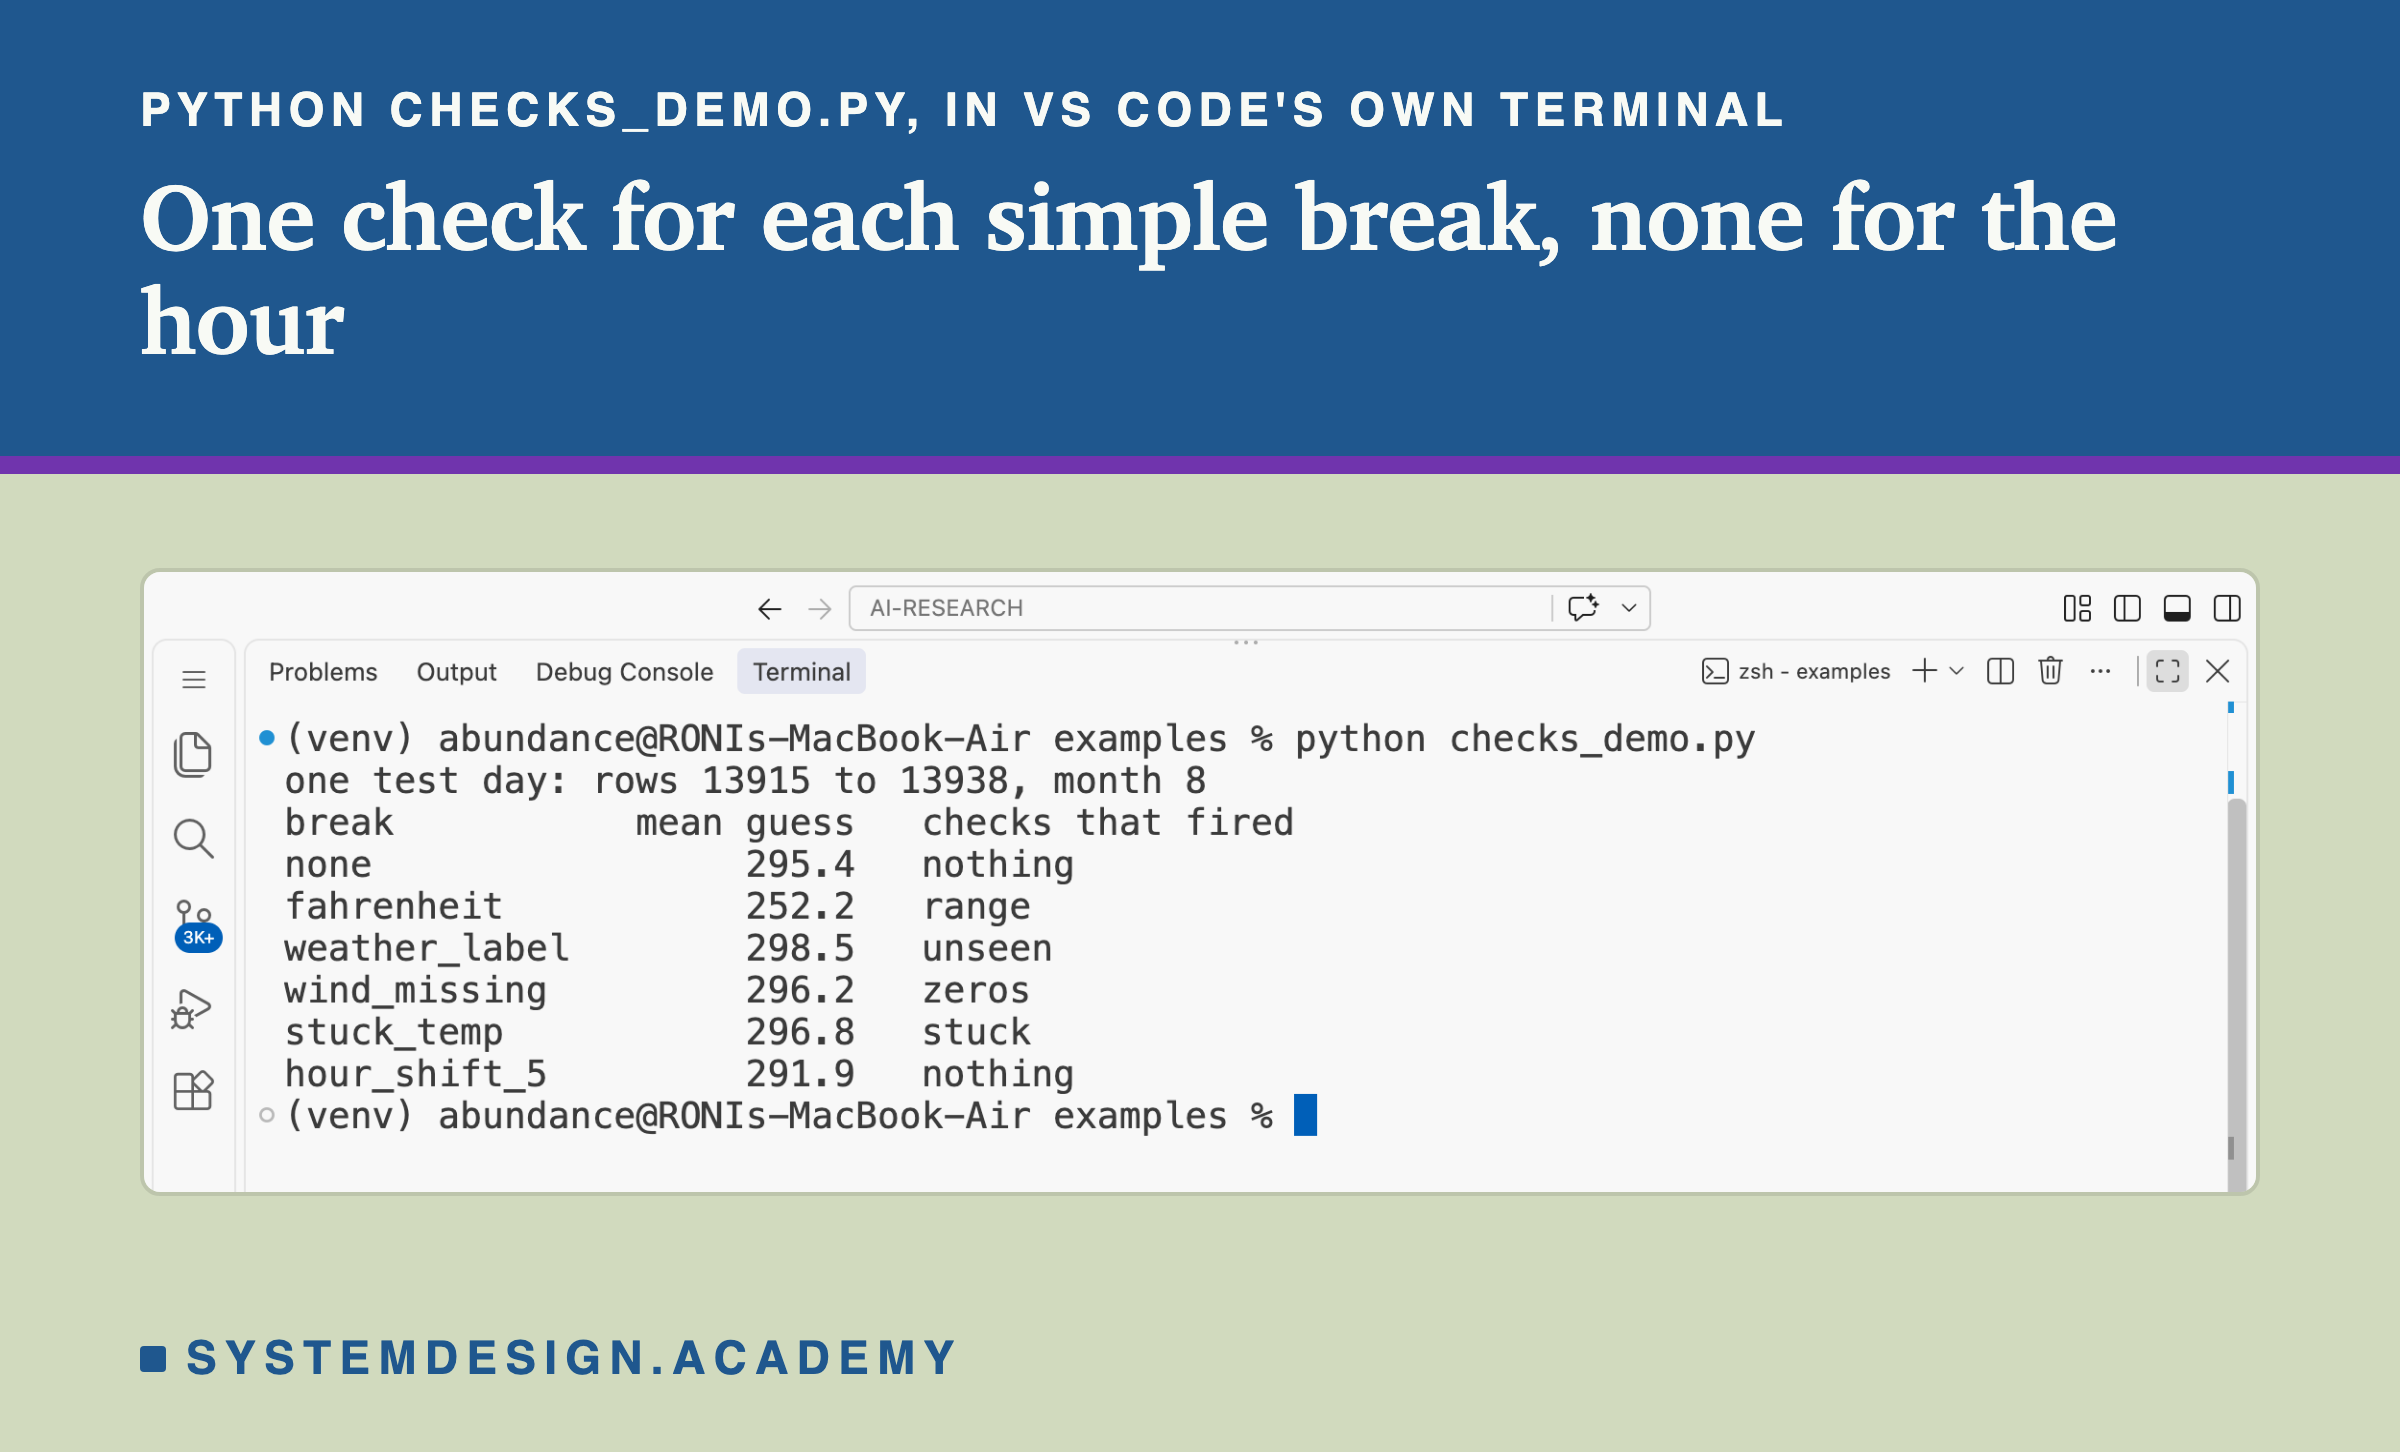
This script is a small version of the lab. It downloads the same data, trains the boosted trees once, takes the first full day of the test, and runs four of the checks on it: first clean, then broken five ways. For each version it prints the model's mean guess for the day and the checks that fired. It does not need a GPU.
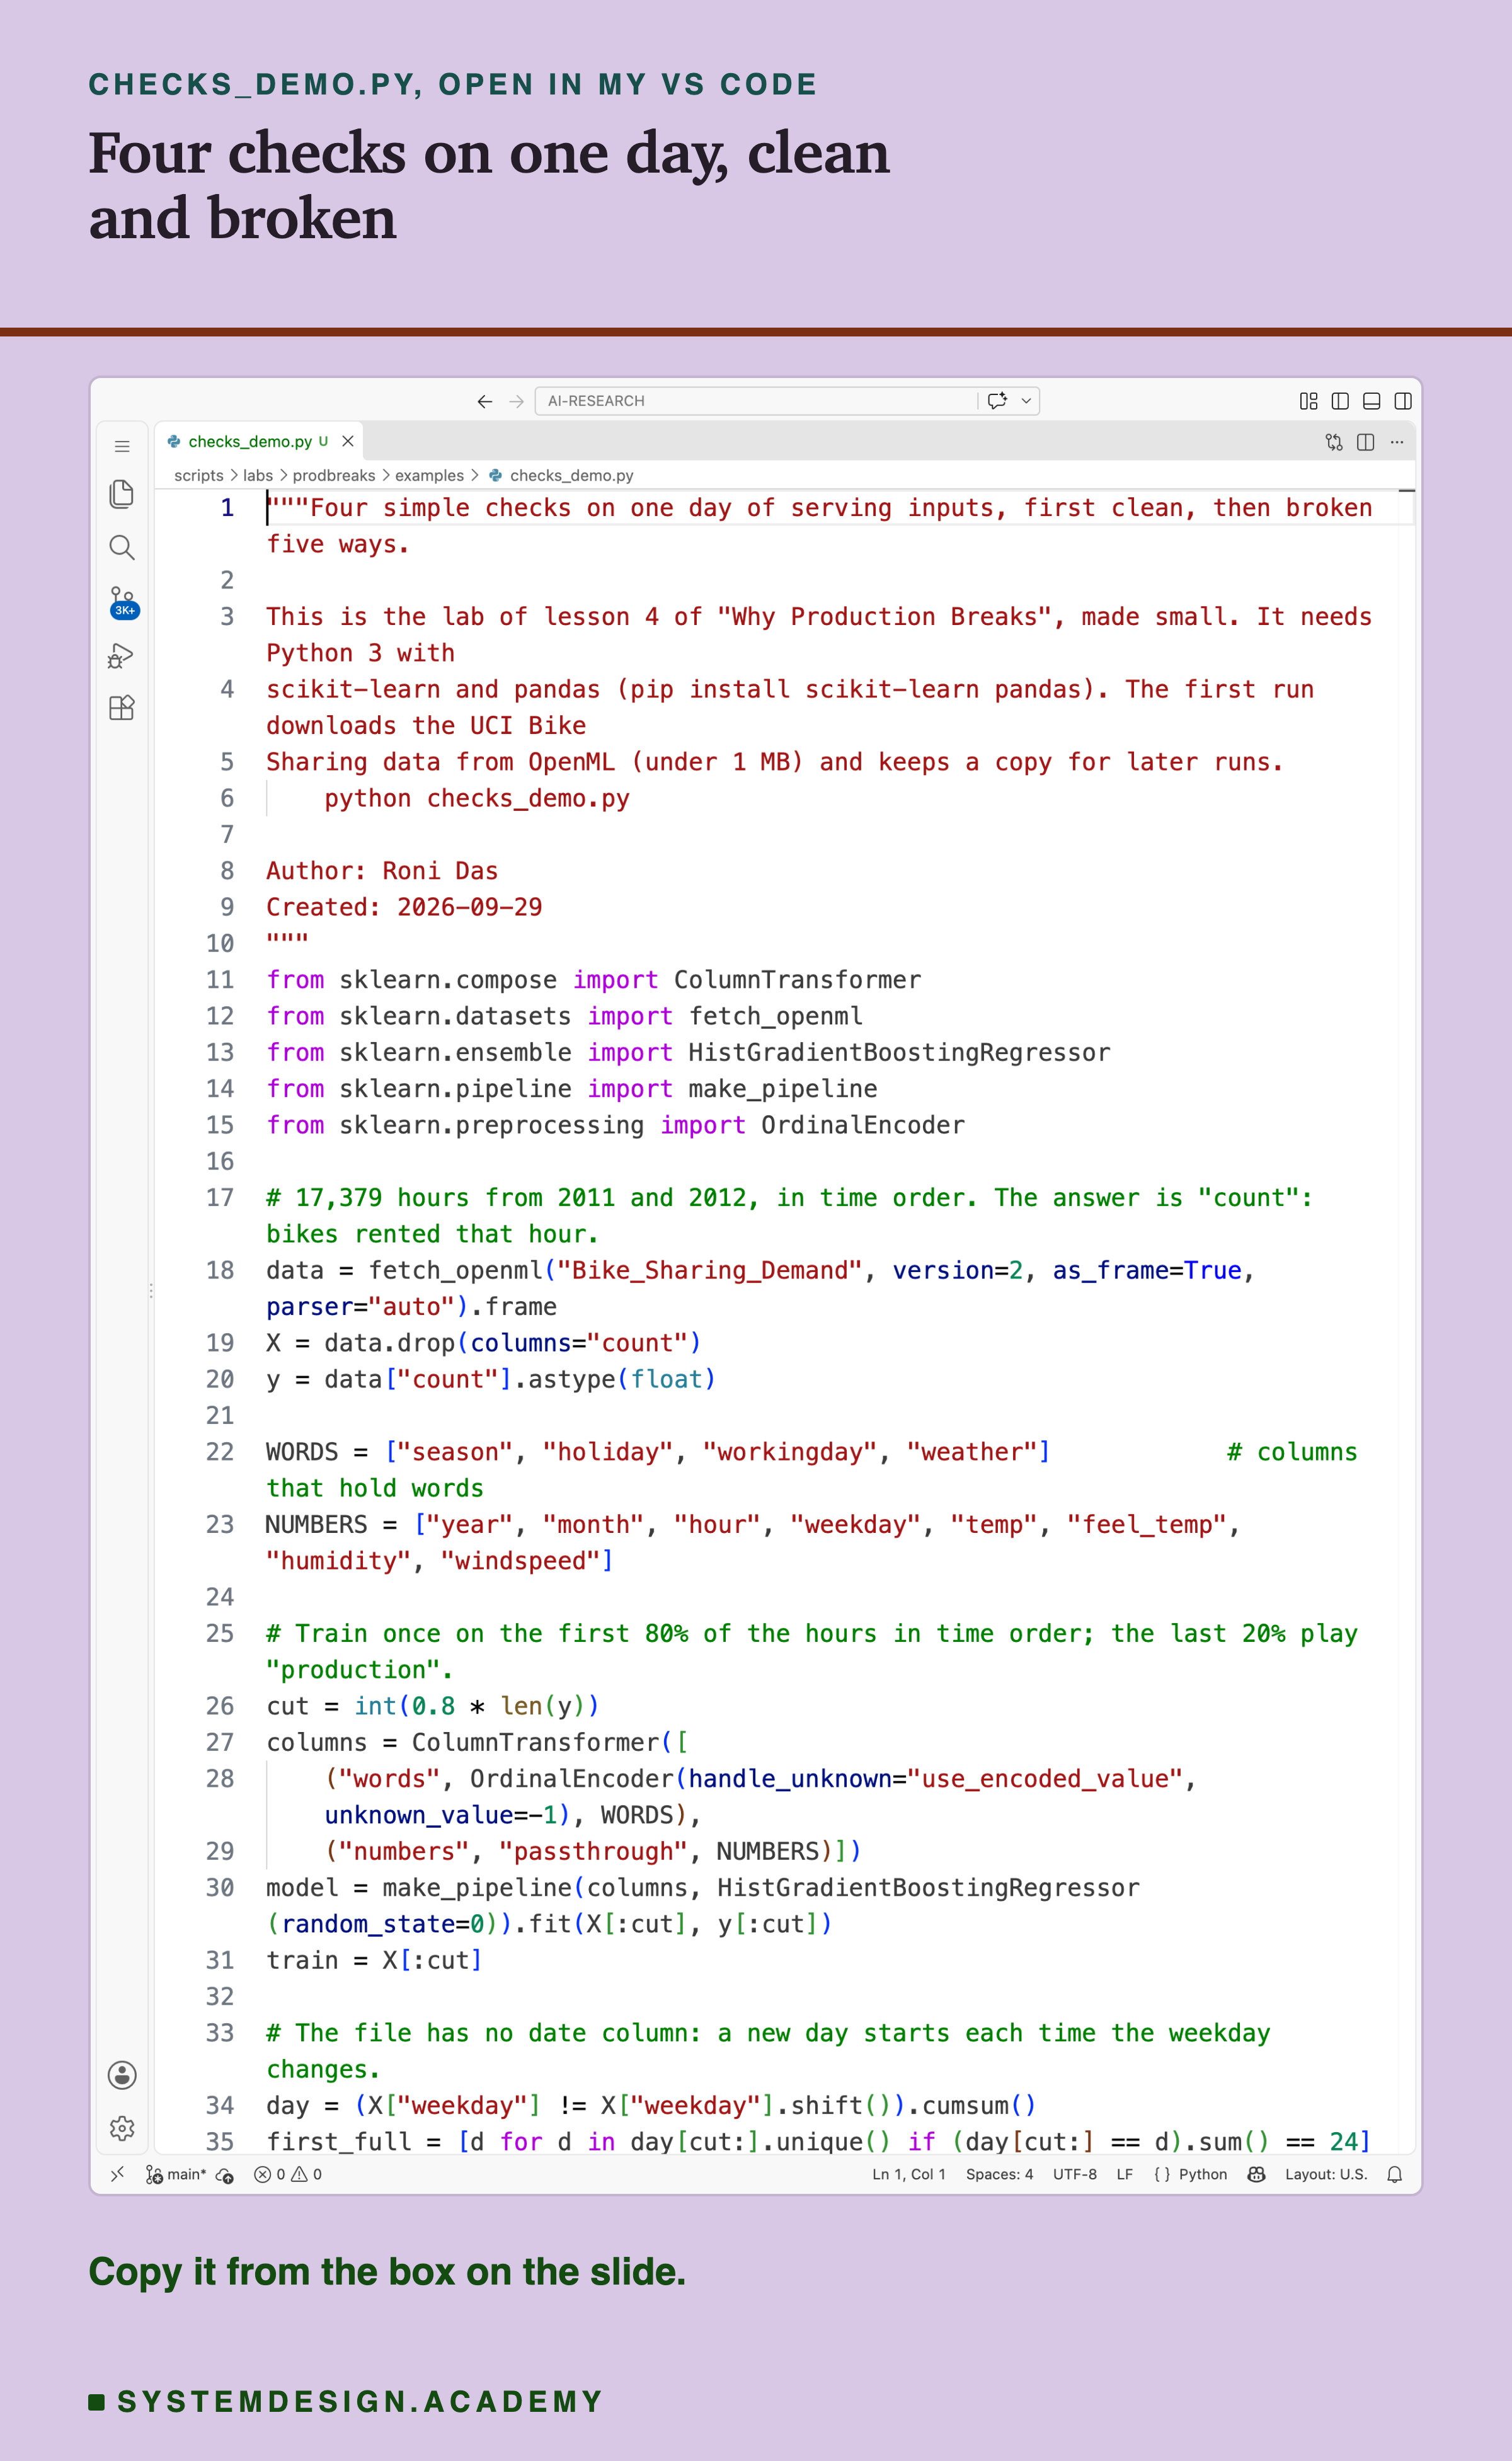
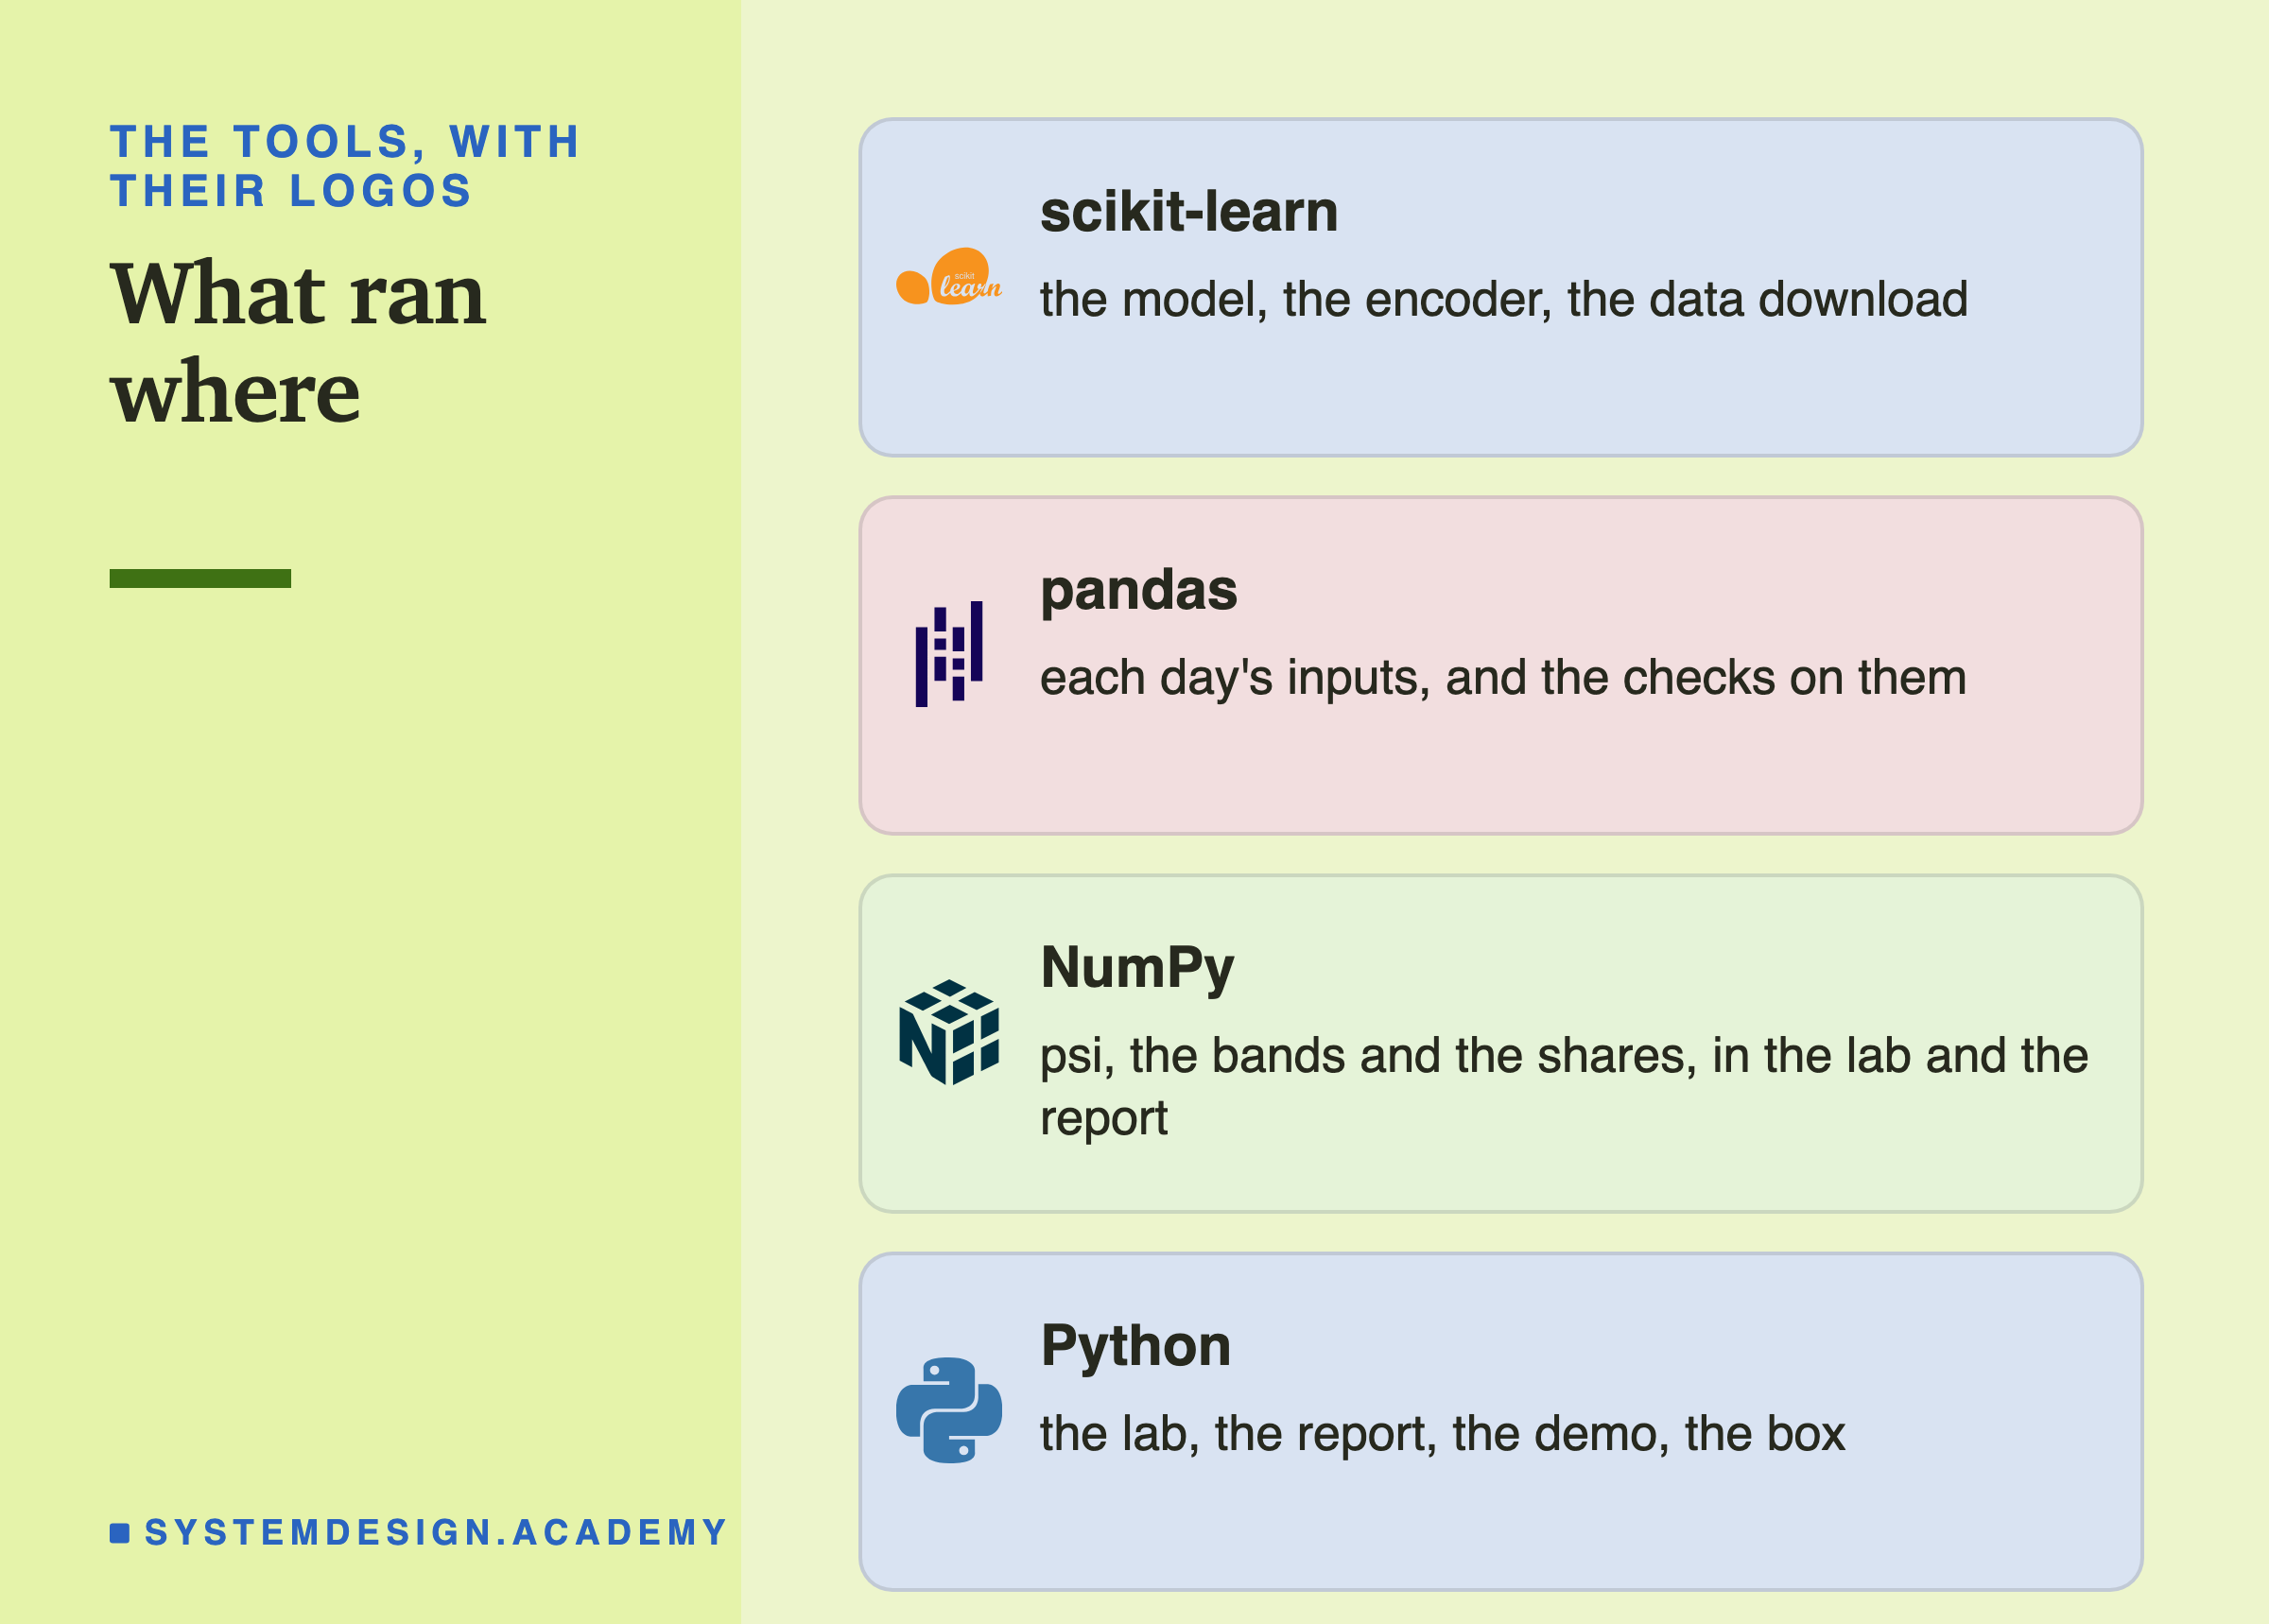
Before you run this lab. You need Python 3 and two libraries: pip install scikit-learn pandas. scikit-learn holds the model, the encoder and the download; pandas holds the table and runs the checks. The first run downloads the Bike Sharing data from OpenML, so it needs an internet connection once; scikit-learn keeps a copy in a folder in your home directory (scikit_learn_data) for later runs. I ran it with scikit-learn 1.9.1 on a Mac. scikit-learn runs the same way on Windows and Linux, but I have not checked the numbers there, and another version of scikit-learn may give slightly different decimals.
"""Four simple checks on one day of serving inputs, first clean, then broken five ways.

This is the lab of lesson 4 of "Why Production Breaks", made small. It needs Python 3 with
scikit-learn and pandas (pip install scikit-learn pandas). The first run downloads the UCI Bike
Sharing data from OpenML (under 1 MB) and keeps a copy for later runs.
    python checks_demo.py

Author: Roni Das
Created: 2026-09-29
"""
from sklearn.compose import ColumnTransformer
from sklearn.datasets import fetch_openml
from sklearn.ensemble import HistGradientBoostingRegressor
from sklearn.pipeline import make_pipeline
from sklearn.preprocessing import OrdinalEncoder

# 17,379 hours from 2011 and 2012, in time order. The answer is "count": bikes rented that hour.
data = fetch_openml("Bike_Sharing_Demand", version=2, as_frame=True, parser="auto").frame
X = data.drop(columns="count")
y = data["count"].astype(float)

WORDS = ["season", "holiday", "workingday", "weather"]            # columns that hold words
NUMBERS = ["year", "month", "hour", "weekday", "temp", "feel_temp", "humidity", "windspeed"]

# Train once on the first 80% of the hours in time order; the last 20% play "production".
cut = int(0.8 * len(y))
columns = ColumnTransformer([
    ("words", OrdinalEncoder(handle_unknown="use_encoded_value", unknown_value=-1), WORDS),
    ("numbers", "passthrough", NUMBERS)])
model = make_pipeline(columns, HistGradientBoostingRegressor(random_state=0)).fit(X[:cut], y[:cut])
train = X[:cut]

# The file has no date column: a new day starts each time the weekday changes.
day = (X["weekday"] != X["weekday"].shift()).cumsum()
first_full = [d for d in day[cut:].unique() if (day[cut:] == d).sum() == 24][0]
served = X[cut:][day[cut:] == first_full]                         # one day, 24 hours


def broken(kind):
    # the serving code gets ONE input wrong, the same way for every hour of the day
    z = served.copy()
    if kind == "fahrenheit":                                      # Fahrenheit, not Celsius
        z["temp"] = z["temp"] * 9 / 5 + 32
        z["feel_temp"] = z["feel_temp"] * 9 / 5 + 32
    elif kind == "weather_label":                                 # "Clear", not "clear"
        z["weather"] = z["weather"].astype(str).str.capitalize()
    elif kind == "wind_missing":                                  # missing, filled with 0
        z["windspeed"] = 0.0
    elif kind == "stuck_temp":                                    # sensor stuck all day
        z["temp"] = z["temp"].iloc[0]
        z["feel_temp"] = z["feel_temp"].iloc[0]
    elif kind == "hour_shift_5":                                  # the hour moved by 5
        z["hour"] = (z["hour"] + 5) % 24
    return z


def checks(z):
    # four checks that need no real answers, only the day's inputs and the training rows
    fired = []
    if any(((z[c] < train[c].min()) | (z[c] > train[c].max())).any() for c in NUMBERS):
        fired.append("range")                                     # a value training never had
    if any((~z[c].astype(str).isin(set(train[c].astype(str)))).any() for c in WORDS):
        fired.append("unseen")                                    # a word training never had
    if z["temp"].nunique() == 1 or z["humidity"].nunique() == 1:
        fired.append("stuck")                                     # one value all day
    if (z["windspeed"] == 0).mean() - (train["windspeed"] == 0).mean() > 0.30:
        fired.append("zeros")                                     # far more zeros than usual
    return fired


print(f"one test day: rows {served.index[0]} to {served.index[-1]}, month {served.month.iloc[0]}")
print(f"{'break':<15}{'mean guess':>11}   checks that fired")
for kind in ["none", "fahrenheit", "weather_label", "wind_missing", "stuck_temp", "hour_shift_5"]:
    z = broken(kind)
    guess = model.predict(z).mean()                               # the model answers anyway
    print(f"{kind:<15}{guess:>11.1f}   {', '.join(checks(z)) or 'nothing'}")
The Lab Report
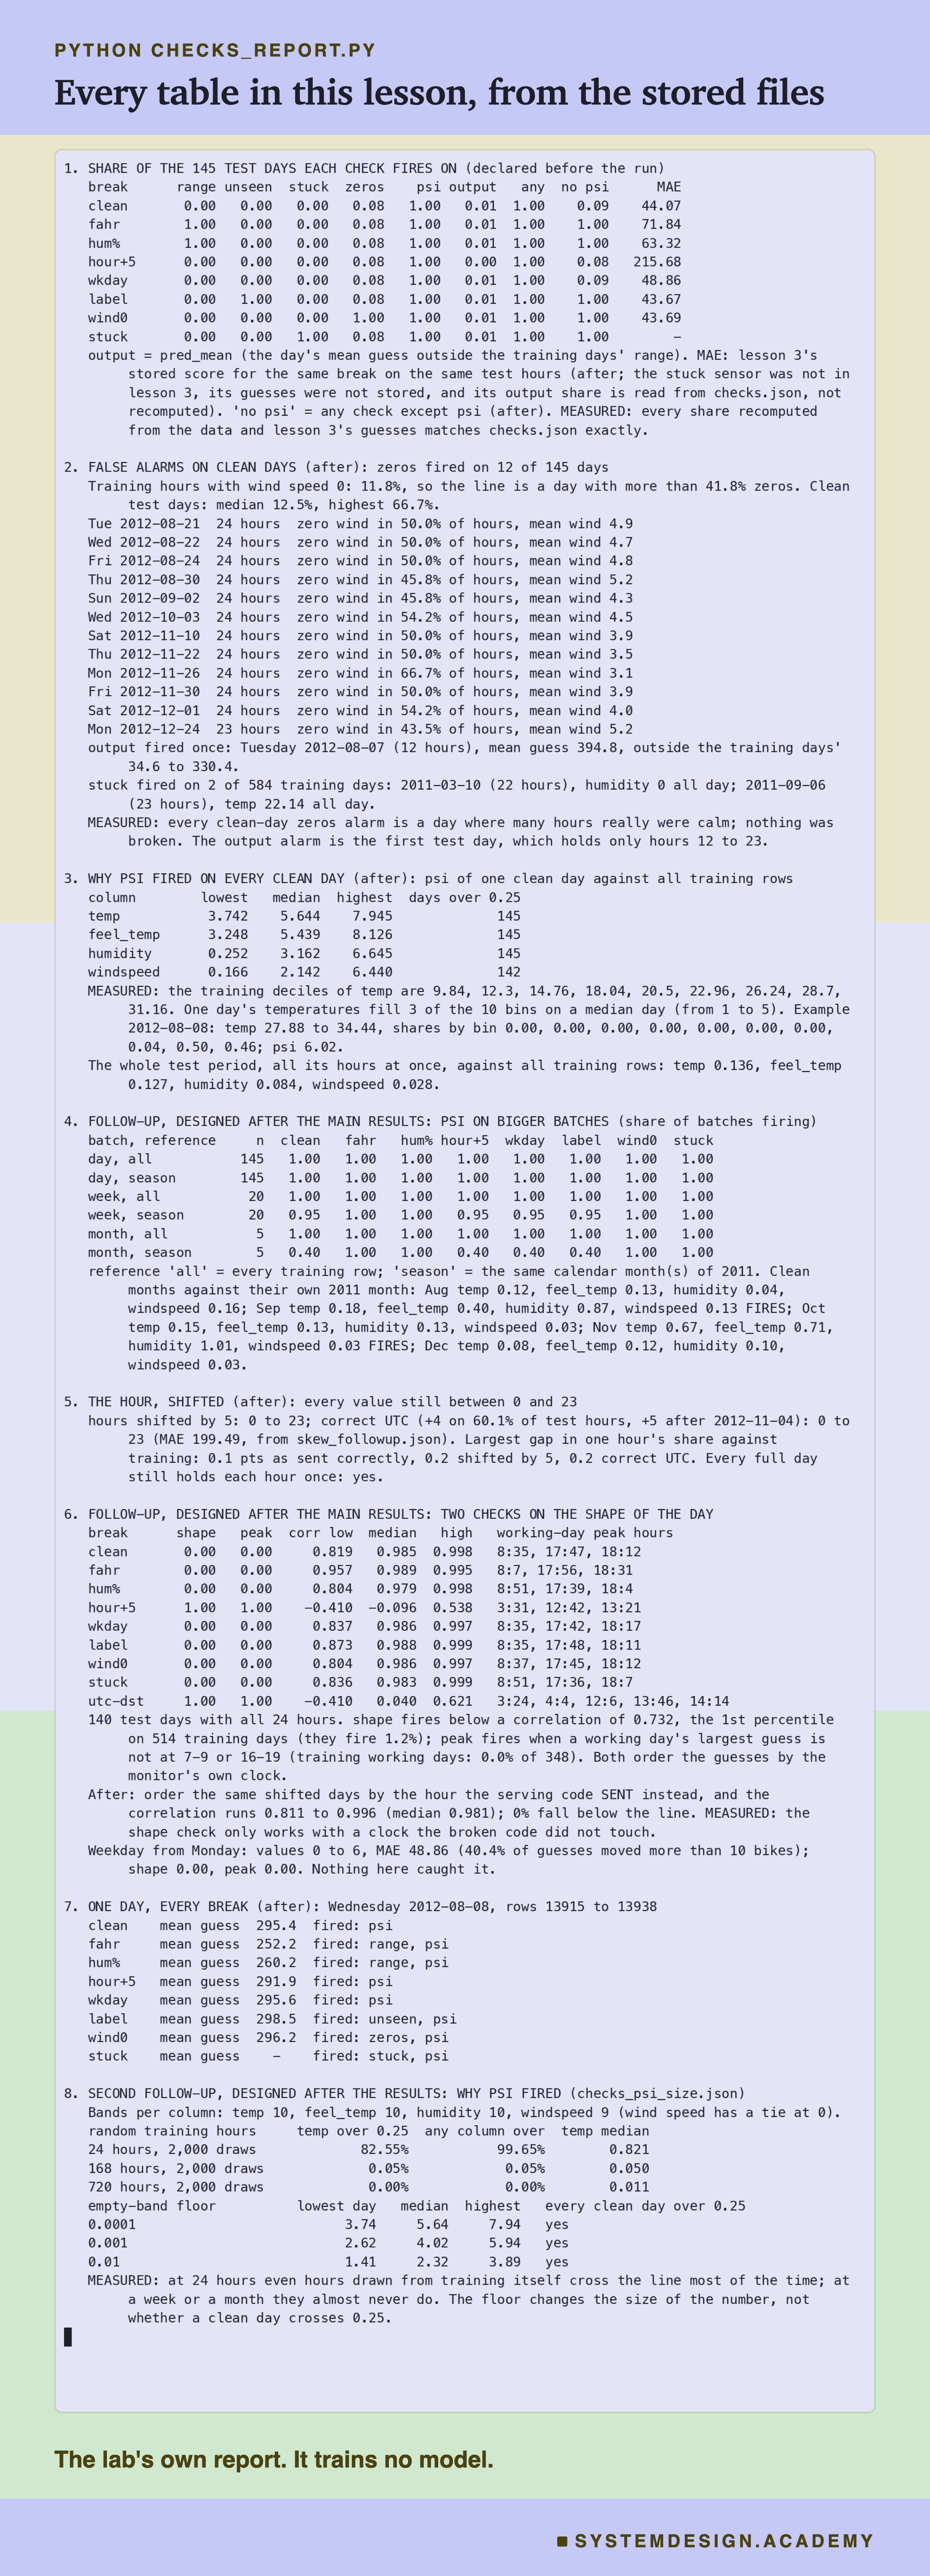
The report lives in scripts/labs/prodbreaks/checks_report.py. It reads the lab's stored files, results/checks.json and results/checks_followup.json, lesson 3's stored guesses in results/skew.json, and the Bike Sharing data itself from scikit-learn's local copy. It trains no model.
Before it prints anything, it checks the files against the data. It recomputes the five checks that need no model (range, unseen, stuck, zeros and psi) on every day and every break straight from the data, and recomputes the output check from lesson 3's stored guesses. Every share must match checks.json exactly, or the report stops. They all match. The one number it cannot recompute is the output check under the stuck temperature, because those guesses were never stored; the report takes it from checks.json and says so. It also checks the follow-up's stored correlations against its own, and the second follow-up's clean-day psi at a 0.01% share against its own recomputed values.
The json mode writes the numbers to results/fl-report.json, which the figures read. The mode checks the student script's stored run, and the mode writes the playground below and checks that it gives the same shares as the lab.
Tune the Checks Yourself
This box has no model in it. It holds the real serving inputs of the 145 test days (hour, weekday, temperature, "feels like" temperature, humidity, wind and weather label for every hour), what the checks know about the training hours, and the same breaks and checks as the lab. The output check needs the model, so it is not here. It runs in your browser.
As it is, the box prints the share of days each check fires on under each break. The numbers are the lab's: the report's box mode checks every one against checks.json and they match exactly.
Now change the lines. Set ZERO_LINE = 0.20 and run it again: zeros now fires on 28 of the 145 clean days instead of 12. Set it to 0.40 and it fires on 3, and it still catches the missing wind speed on every day. Try PSI_LINE = 3: with the lab's FLOOR = 0.0001 (an empty band given 0.01%), psi still fires on every clean day, because even the calmest day scored 3.74 for temperature. Now also set FLOOR = 0.01: at a line of 3, psi fires on 21 of the 145 clean days; put the line back to 0.25 and it fires on all 145 again. To look at one day, try checks(one_day(1)) for the clean 8 August, or checks(one_day(1, 'hour_shift_5')) to see the shifted hour pass. psi(one_day(1)['temp'], 'temp') gives that day's temperature psi at the lab's floor, 6.02. You can also write your own check inside checks and run table() to see its catch rates and false alarms side by side.
The Code, Part by Part
Loading and training. fetch_openml("Bike_Sharing_Demand", version=2, as_frame=True) downloads the data (or reads the local copy). The model is lesson 1's pipeline: an OrdinalEncoder turns the four word columns into number codes, with unknown words mapped to -1, and HistGradientBoostingRegressor(random_state=0) is the boosted trees. It is trained once, on the first 80% of the hours.
Picking one day. The file has no date column, so (X["weekday"] != X["weekday"].shift()).cumsum() numbers the days: the count goes up by one each time the weekday changes. The script takes the first test day with all 24 hours.
The breaks. broken copies the day and changes one input the same wrong way for every hour: Fahrenheit, a capital letter on the label, the wind speed set to 0, the temperature held at its first reading, or the hour moved by 5 and wrapped past midnight with % 24.
The checks. checks needs only the day and the training rows. Range compares every number column with train[c].min() and train[c].max(). Unseen asks whether each word appears in the set of training words. Stuck asks whether temperature or humidity has one unique value (nunique() == 1). Zeros compares the day's share of zero wind with the training share. Each check that fails adds its name to the list.
The model answers anyway. is the day's mean guess. It is printed for every version, broken or not, because the model always returns a number.
How to Set Up Checks on a Model You Cannot Yet Score
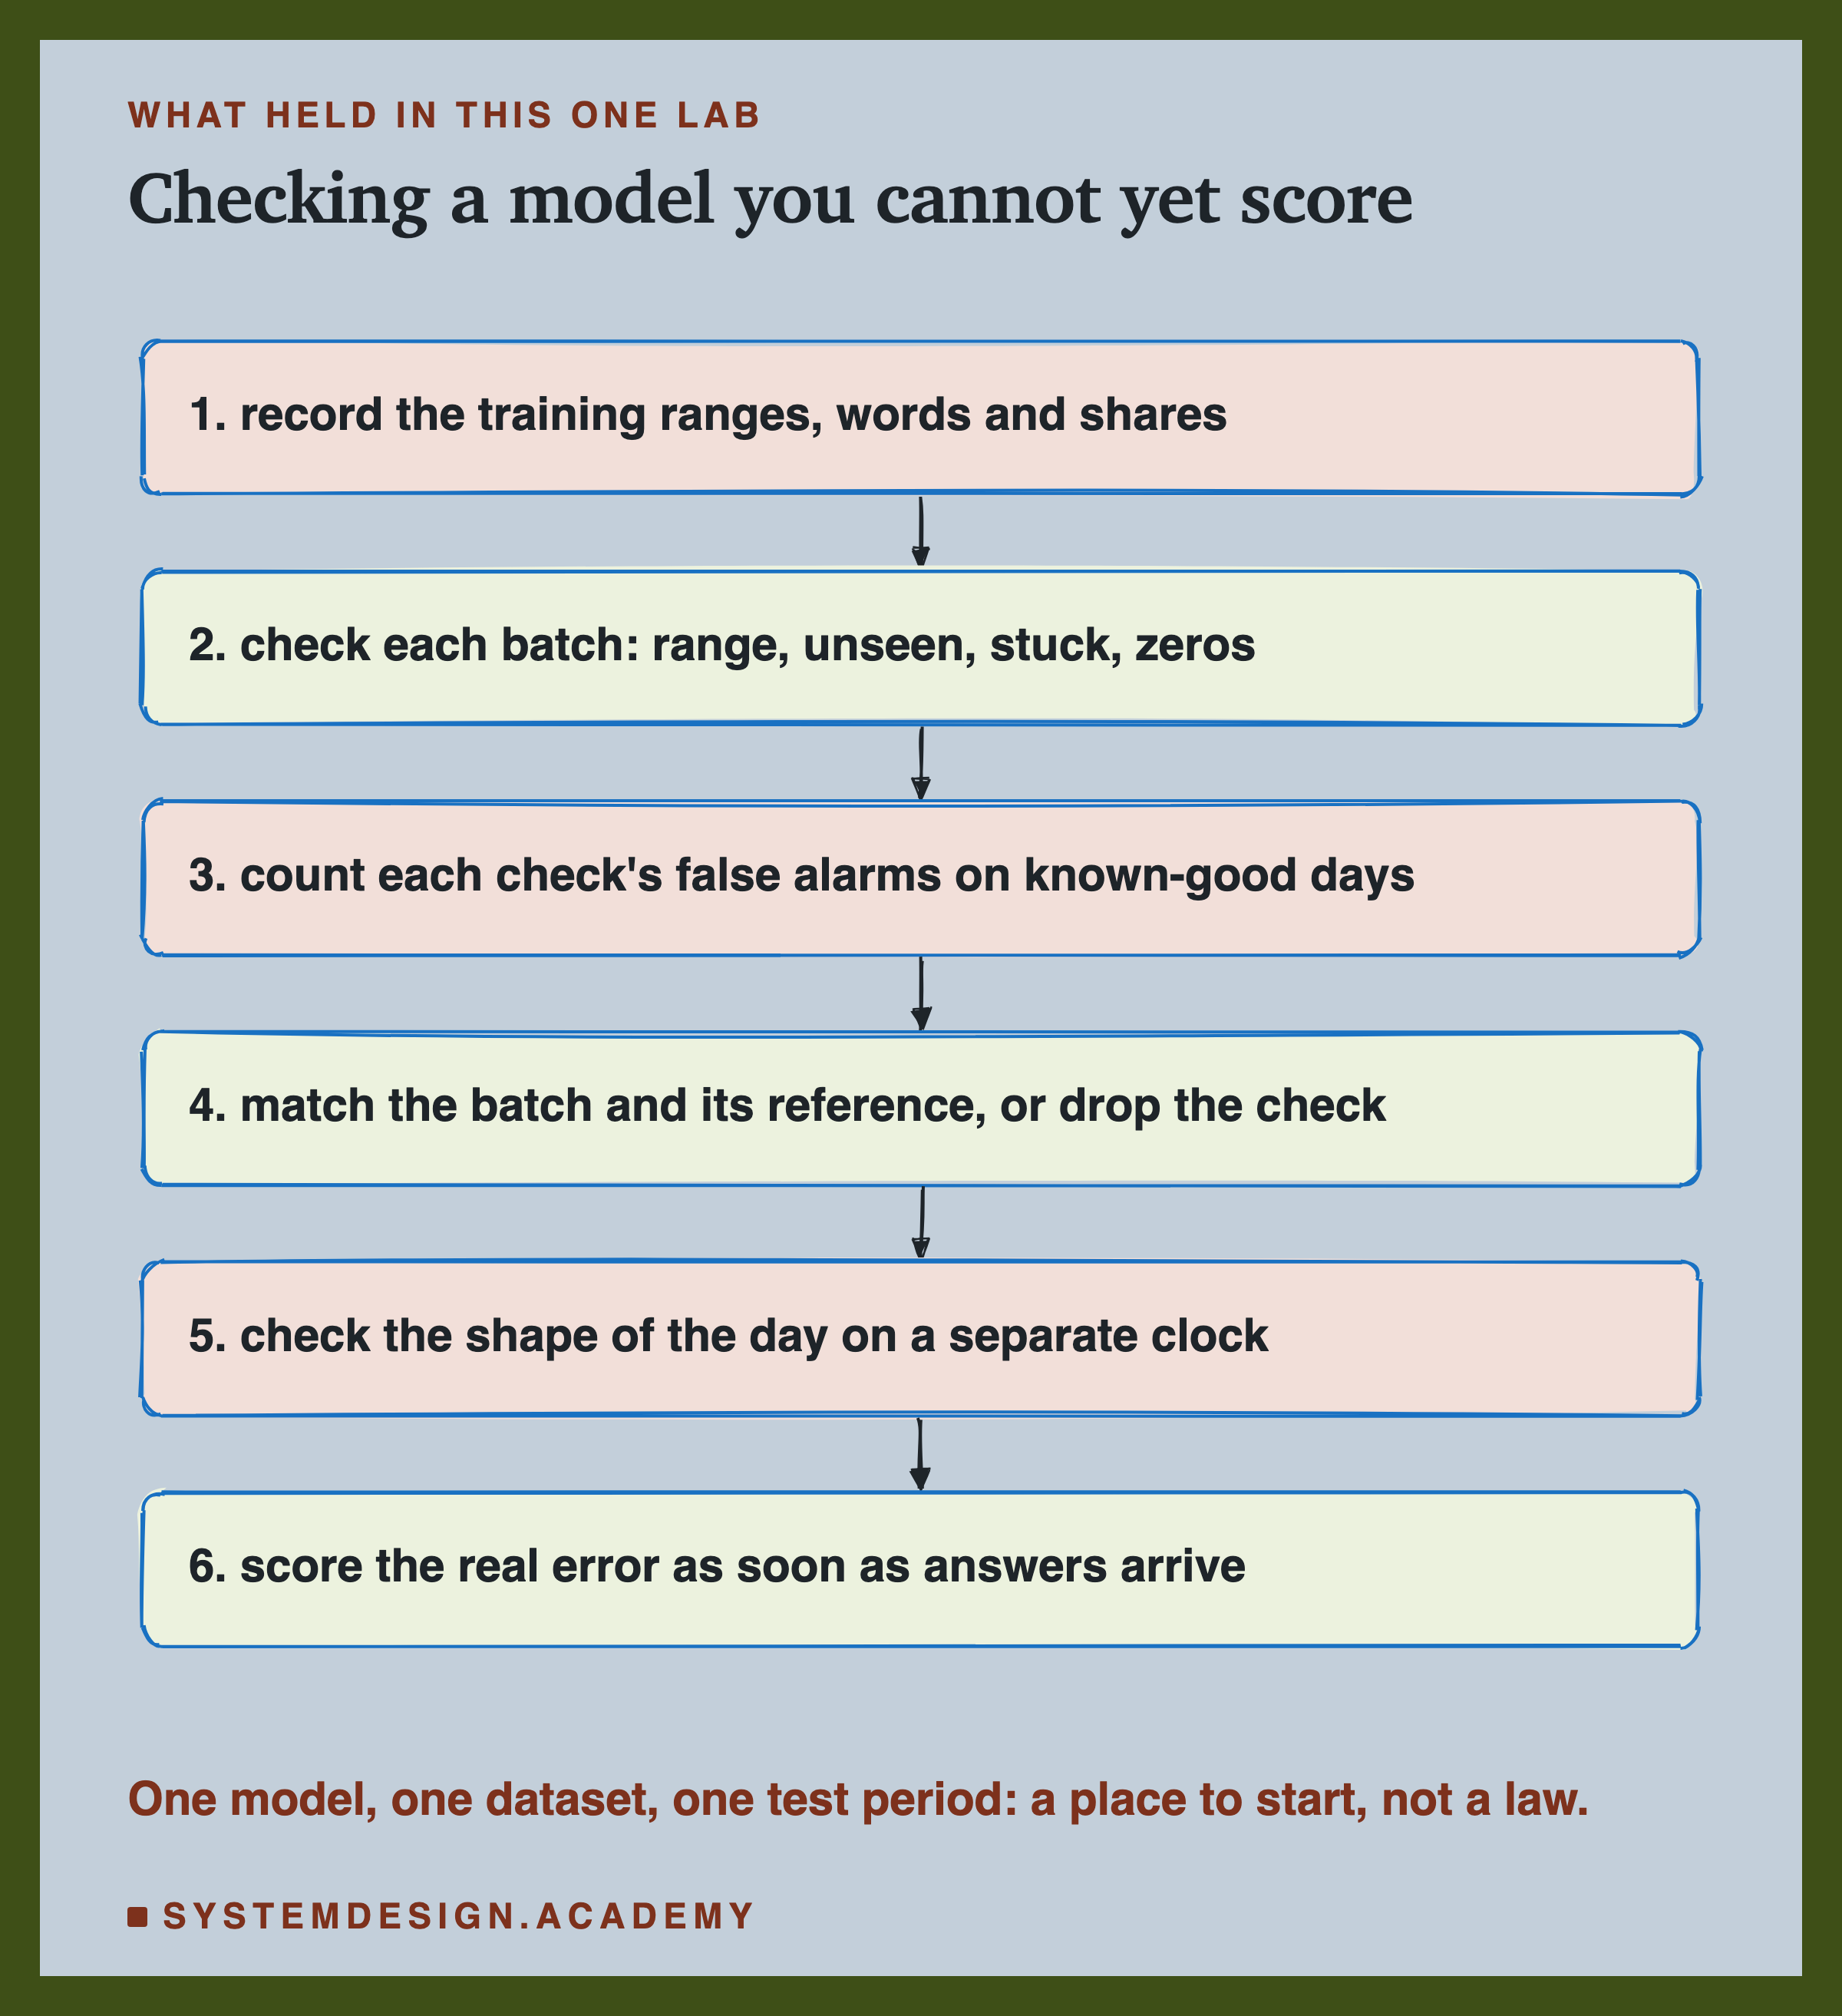
Record what training looked like. When you train, save each input's lowest and highest value, the set of words in each word column, and the share of special values such as 0. It is a few lines of code and a small file. Every input check needs it.
Check each batch of inputs before you trust the answers. Range, unseen, stuck and zeros are cheap and caught 5 of 7 breaks here on every day. Run them on every batch the model serves.
Count false alarms on days you know were good. Run every check on your training data or on a stretch of clean serving days before it goes live, and write down how often it fires. Here that showed zeros firing about once every 12 days and psi every day. A check that fires too often gets ignored.
Match the batch and its reference, or drop the check. A psi on one day against a year and a half of training was always going to fire: even 24 random training hours crossed its line in 82.55% of draws, against 0.05% for a week. If you use distribution checks, choose the batch and the reference so that a clean batch passes, and measure that it does.
Keep one clock the serving code does not compute. Log the time each request arrived, from the server itself. Then you can check the shape of the day, and compare any time input the serving code built with the real time.
Score the real error as soon as answers arrive. It is the only layer that sees every break that costs you anything on average. Compare it with the error you accepted at launch, as lesson 2 did with the newest labelled month.
When Each Check Helps, and When It Does Not
Use range checks when a broken input is likely to produce impossible values. Unit changes are the classic case: Fahrenheit and percentages both left the training range on every day here, with no false alarms. They cost almost nothing. Do not rely on them for time zones, numbering changes or shifted scales that stay inside the range; those passed untouched.
Use unseen-value checks on every word column. A new spelling, a new category, an upper-case letter: all show up at once. Here the capitalised label was caught every day, while its average error hardly moved (44.07 to 43.67). Expect real new words from time to time (a new product type, a new city), so decide who looks at them.
Use stuck and zero checks when sensors, feeds or defaults can fail. They caught their breaks every day. The stuck check even found two suspicious days in the training data. Zeros needs a line tuned to how often zero is real: here calm days gave 12 false alarms at the line I chose.
Use distribution checks such as psi to watch the world move, not as a quick alarm. As designed here, psi fired every day. Even on monthly batches against the same month a year before, it fired on 2 of 5 clean months, because the weather really did differ. It is a tool for a later lesson's question, how far today is from training.
Do not trust an output check to find broken inputs. On 8 August the day's mean guess moved by 3.5 bikes when the hour was shifted, while single hours were off by hundreds. A check that no single guess is below zero would have flagged lesson 3's 54 negative Fahrenheit guesses; I did not test it here. The day-mean check here did not catch Fahrenheit: it fired on 0.01 of the days, the same as clean. Do not let a quiet output check reassure you.
Do not skip the real error. Every check here missed something. The weekday from Monday passed them all.
What These Numbers Can and Cannot Tell You
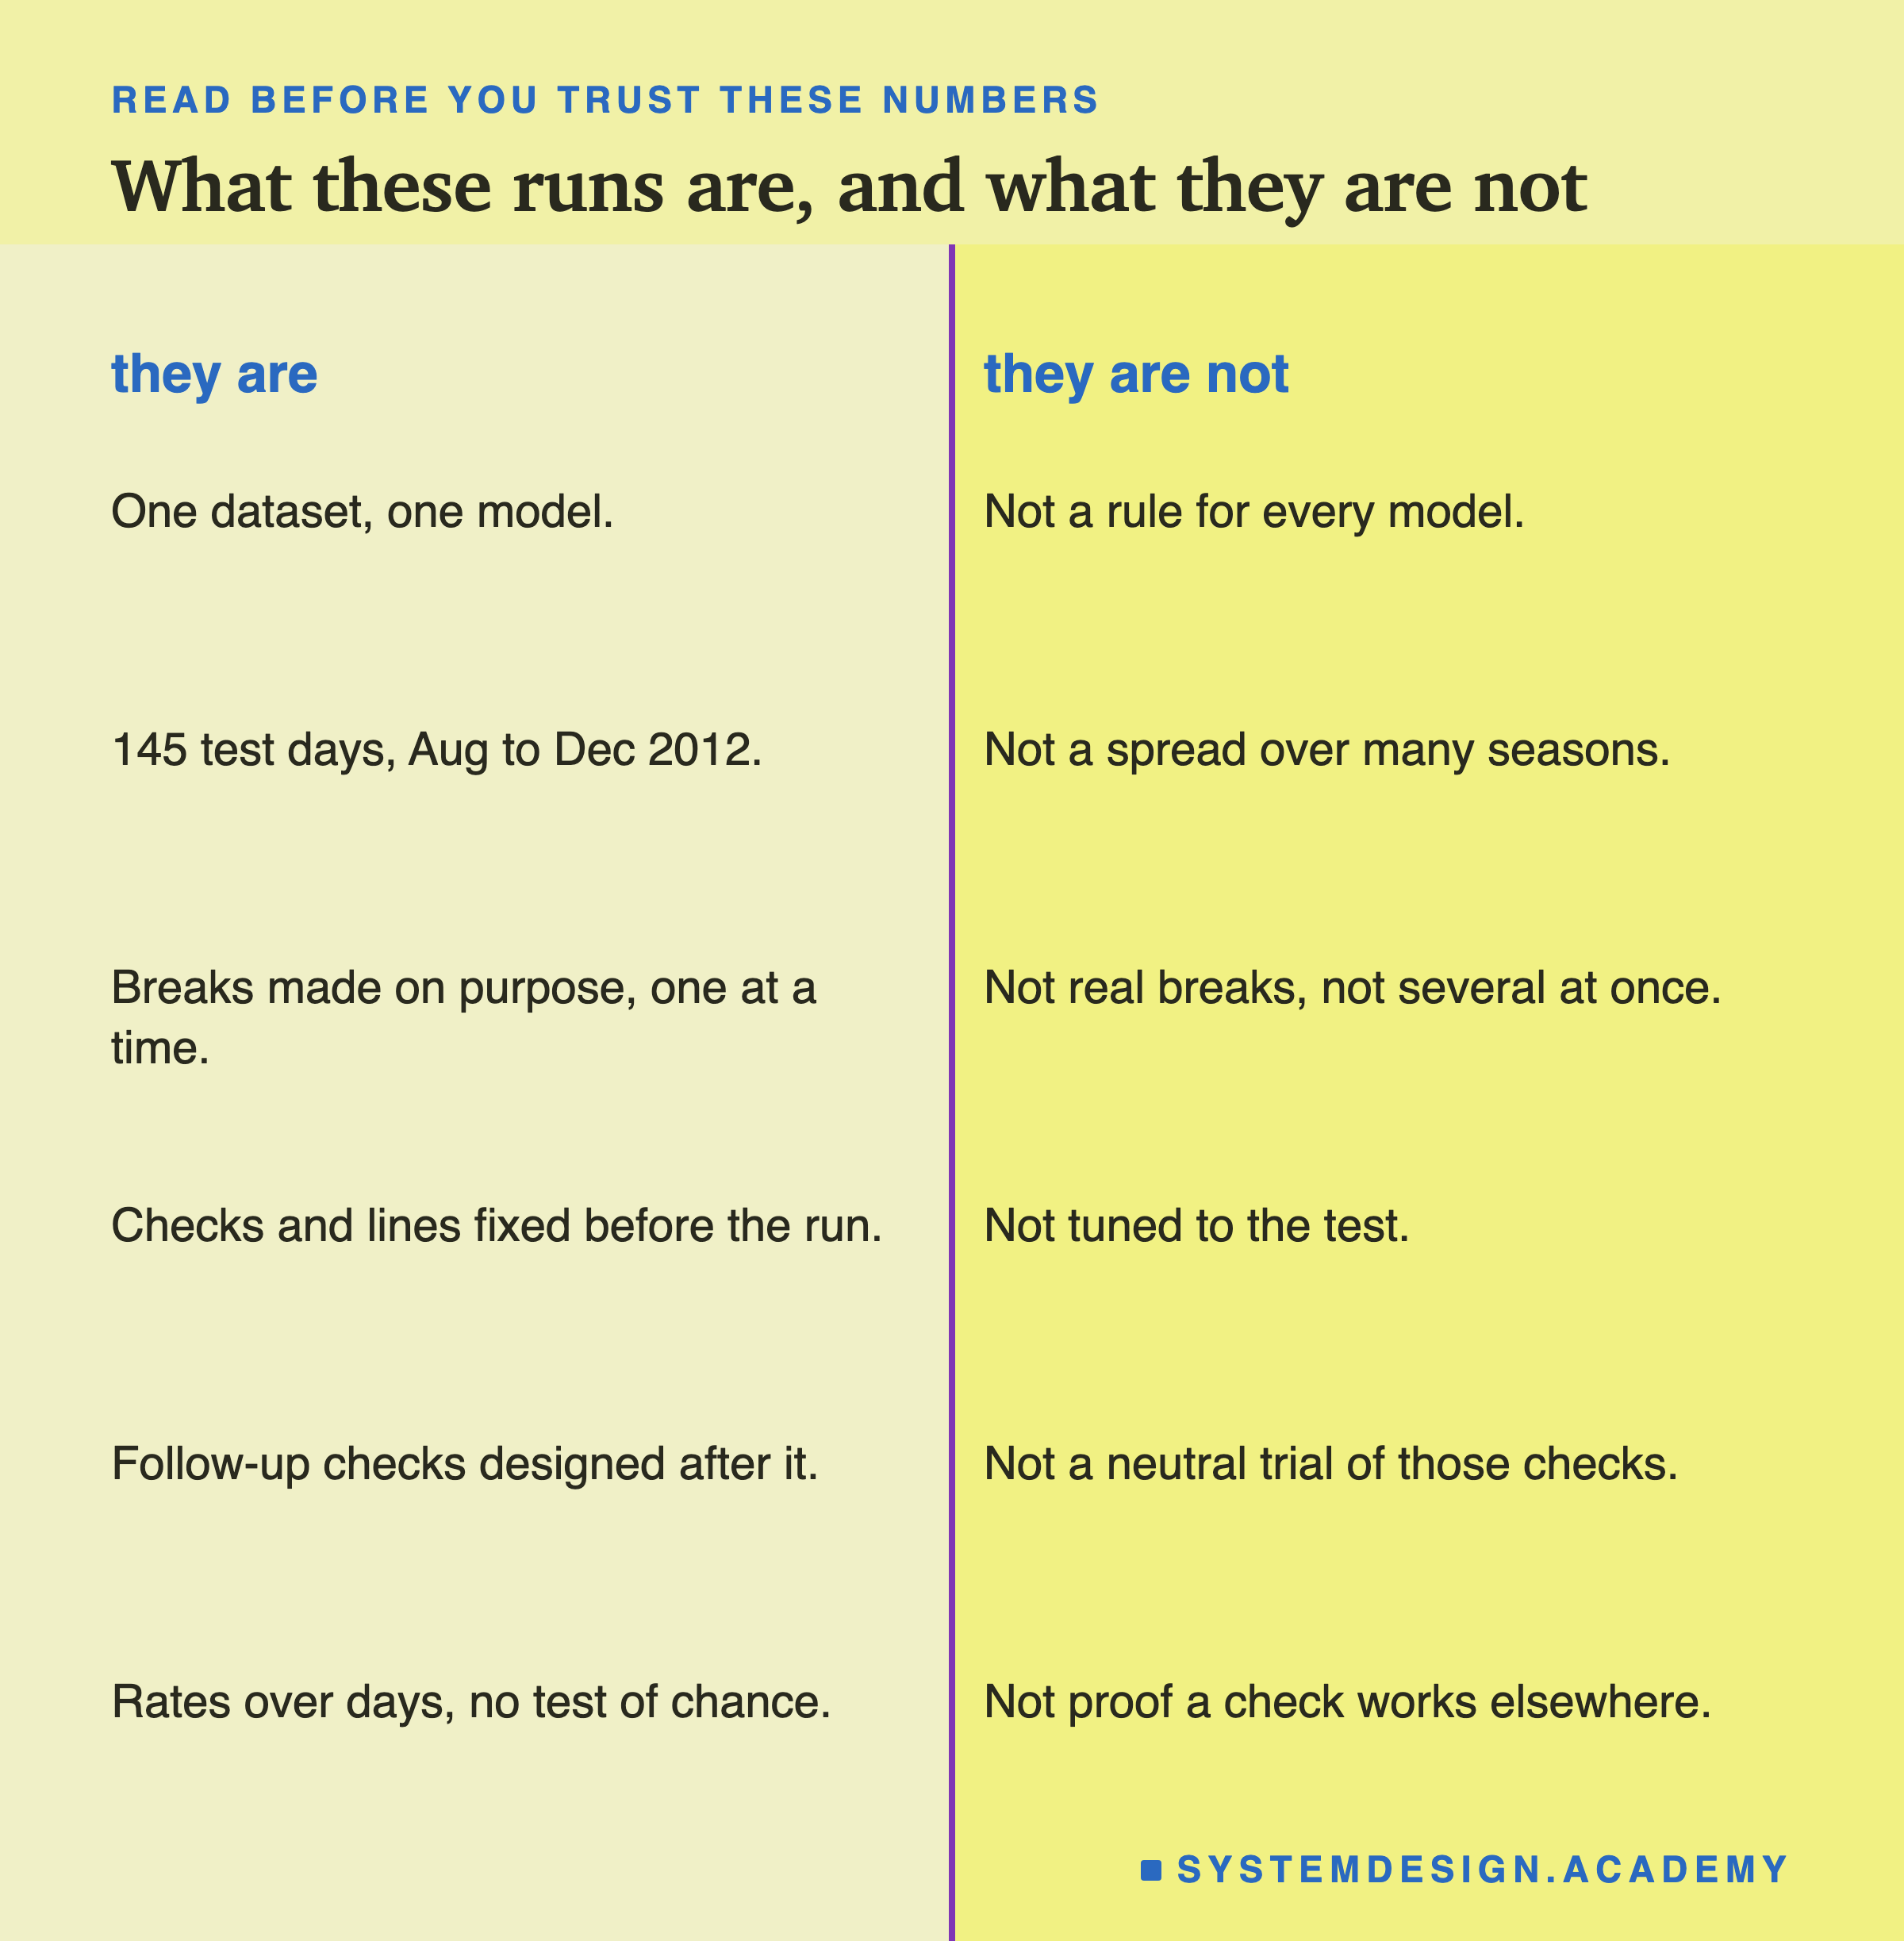
One dataset, one model, one test period. Hourly bike rentals in one city, the boosted trees of lesson 1, and 145 days from August to December 2012. The catch rates of 1.00 and 0.00 are clean here partly because each break was applied to every hour of every day in the same way. Real breaks often start in the middle of a day or affect only some requests, and would be harder to see.
The breaks were made on purpose, one at a time. I chose them, and I built the new stuck sensor myself. Real services break in many other ways, sometimes several at once.
The checks and lines were fixed before the main run and not tuned. A different line would change the false alarm rates, as the playground shows. psi's 0.25 is a common rule of thumb, used as found.
The follow-ups came after the results. The second psi follow-up (random draws and the empty-band share), the bigger psi batches and the shape and peak checks were designed after I saw the main results, and the shape and peak checks were aimed at a break I already knew about. They show such a check can work here, with an independent clock. They are not a fair test of those checks against unknown breaks.
Some numbers were not measured. The lab did not store the guesses for the stuck temperature, so its cost is unknown. The explanations of false alarms were read from the data after the run; the reason for the humidity of 0 on 10 March 2011 is a guess.
What to Do Next
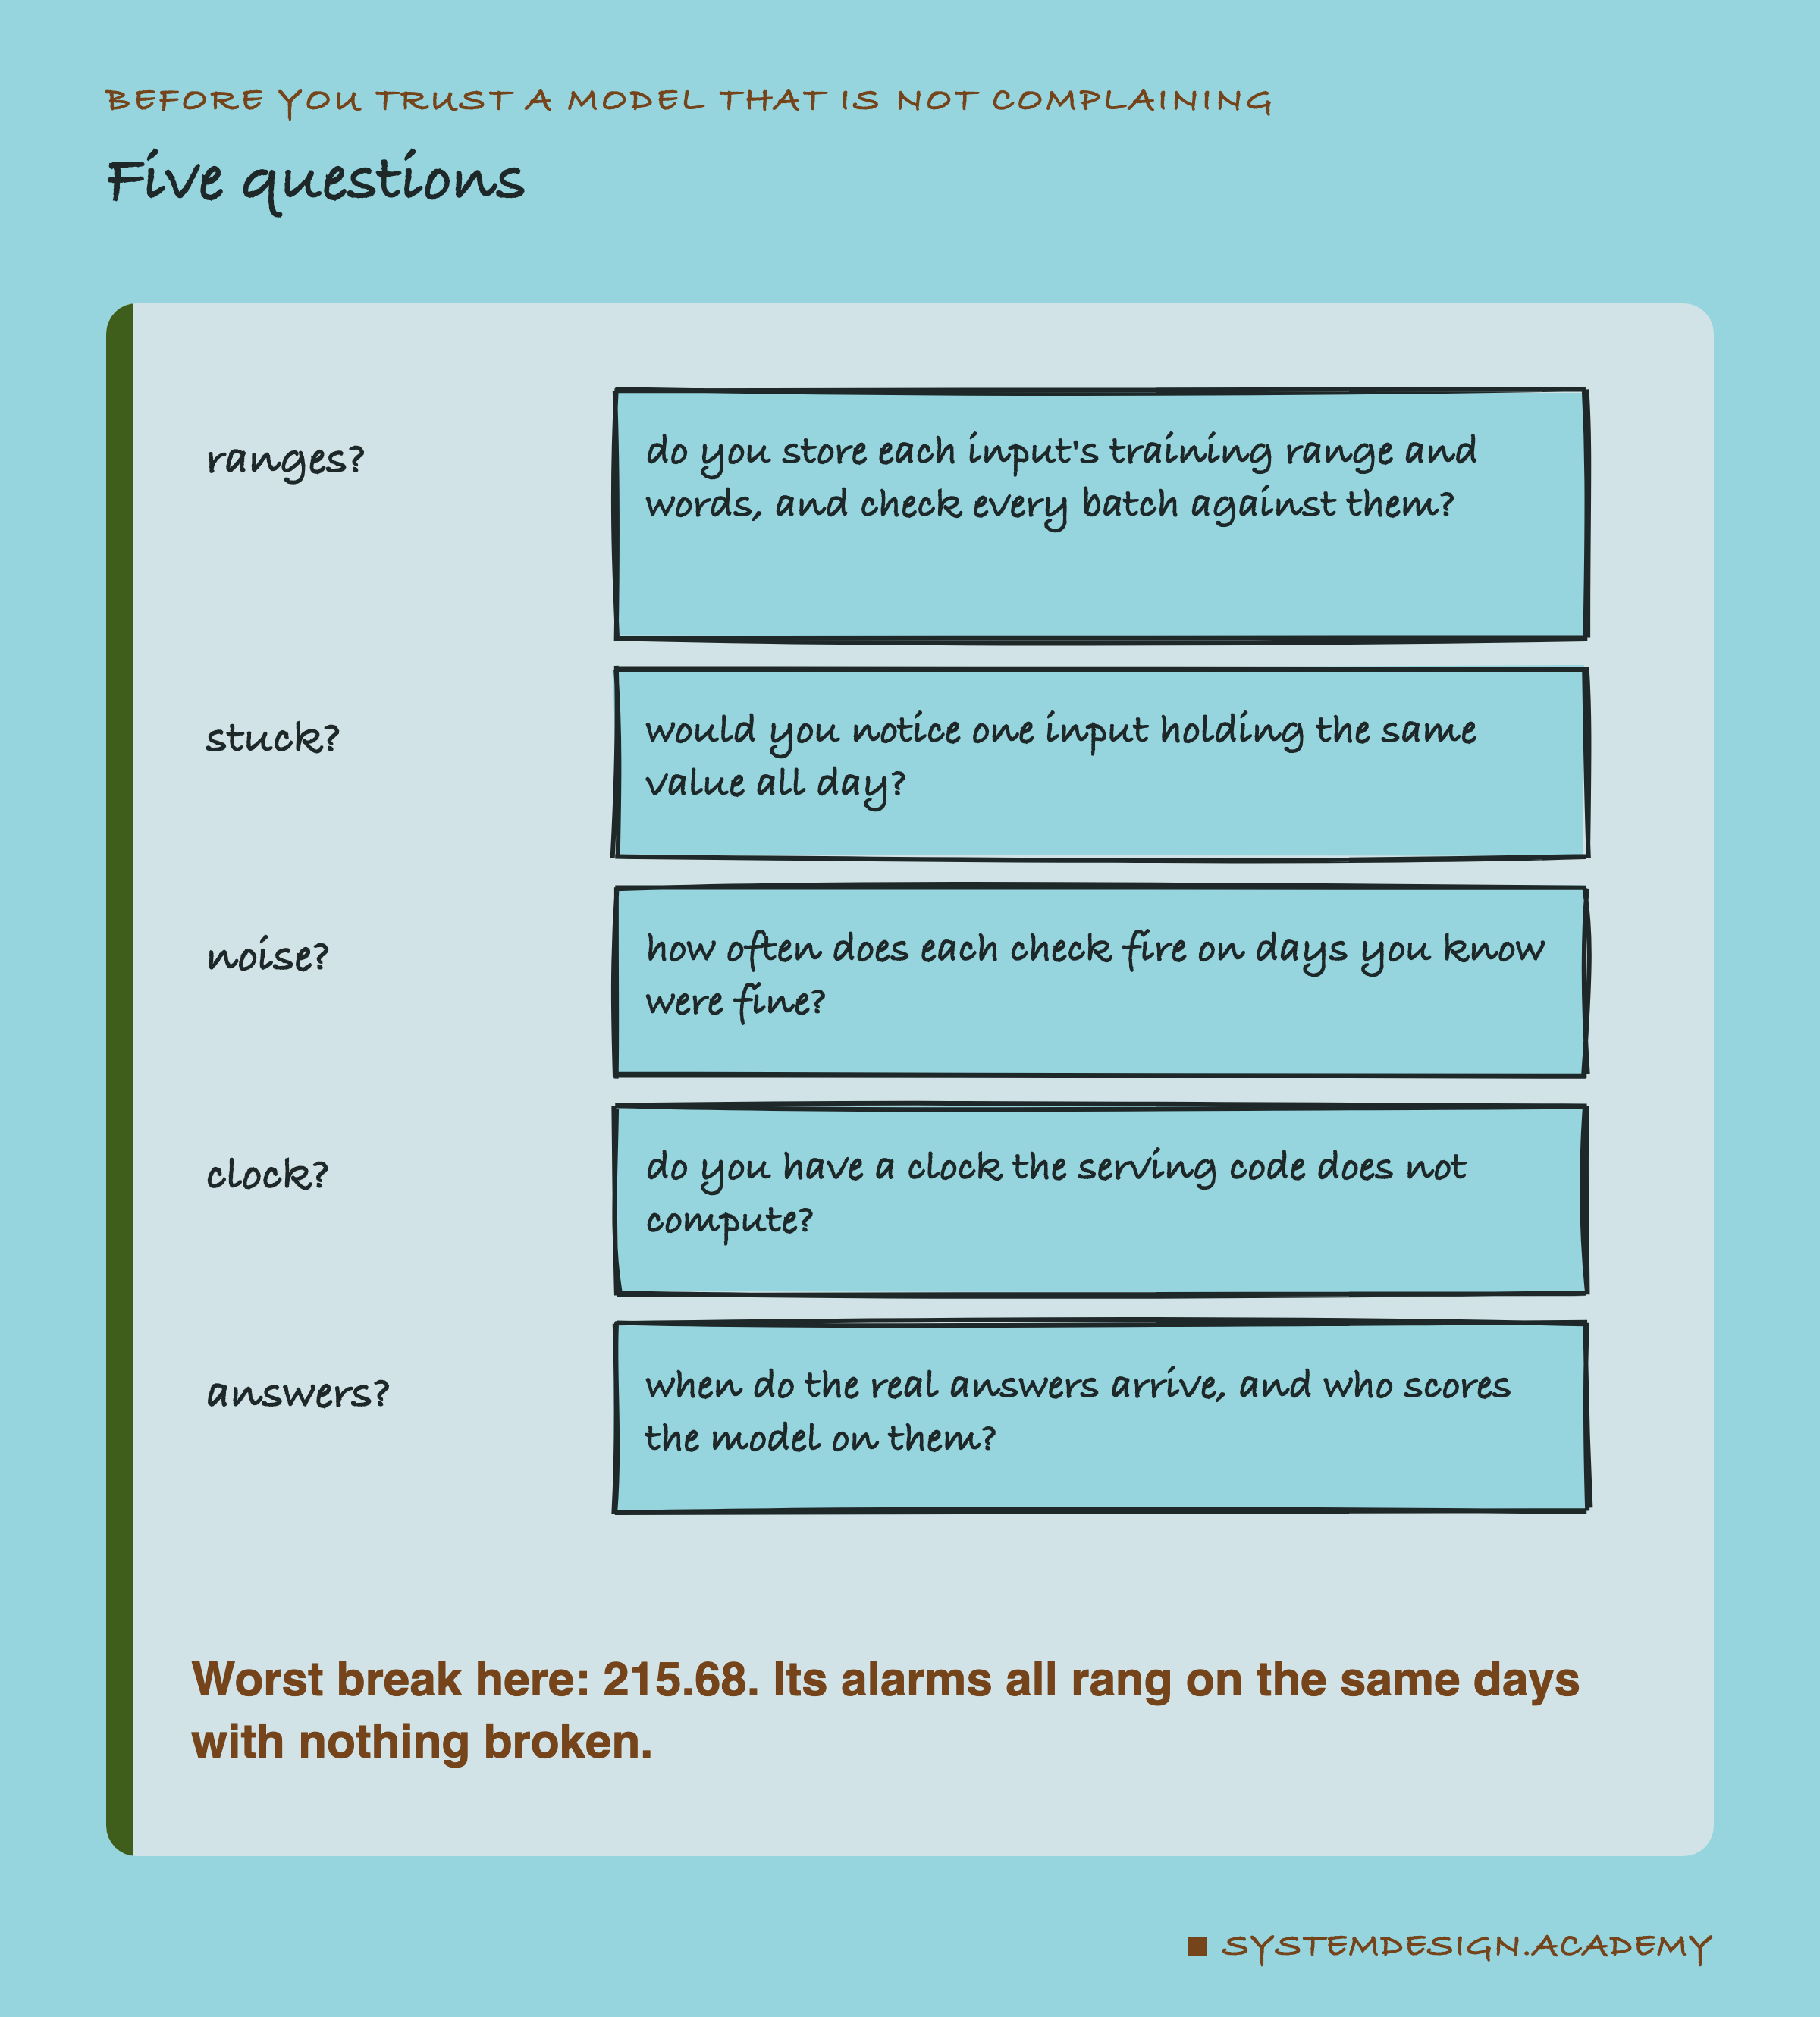
Take a model you or your team runs today and find out what happens between the moment it answers and the moment the real answers arrive. Is anything checked at all? If not, start with the cheapest layer: save the training ranges and words, and check every batch against them. Then run your checks on a stretch of days you know were fine, and count the false alarms before anyone gets an alarm from them.
Then look for the break this lesson could not catch with simple checks: an input that stays in range but means something different. Time inputs are a good place to start. Make sure you log a time the serving code does not compute, and check at least one time input against it.
A later lesson in this chapter goes back to psi and its relatives, and asks the question psi is really built for: month by month, do measures of how far the inputs moved line up with how far the real error moved?
Knowledge Check
Knowledge Check
4 questions - Score 80% to pass
The hour input was shifted by 5 at serving time. Why did range, unseen, stuck and zeros miss it?
psi with the 0.25 line fired on all 145 clean days. What does that tell you?
The zeros check fired on 12 of 145 clean days. What were those days, when read one by one?
The follow-up shape check caught every shifted day. What did it depend on?