The Scale That Is Too Good
A small grocery sells rice in bags marked 1 kilogram. For years the shopkeeper checked them on an old kitchen scale with a needle. Every bag read 1 kilogram, and every customer was happy.
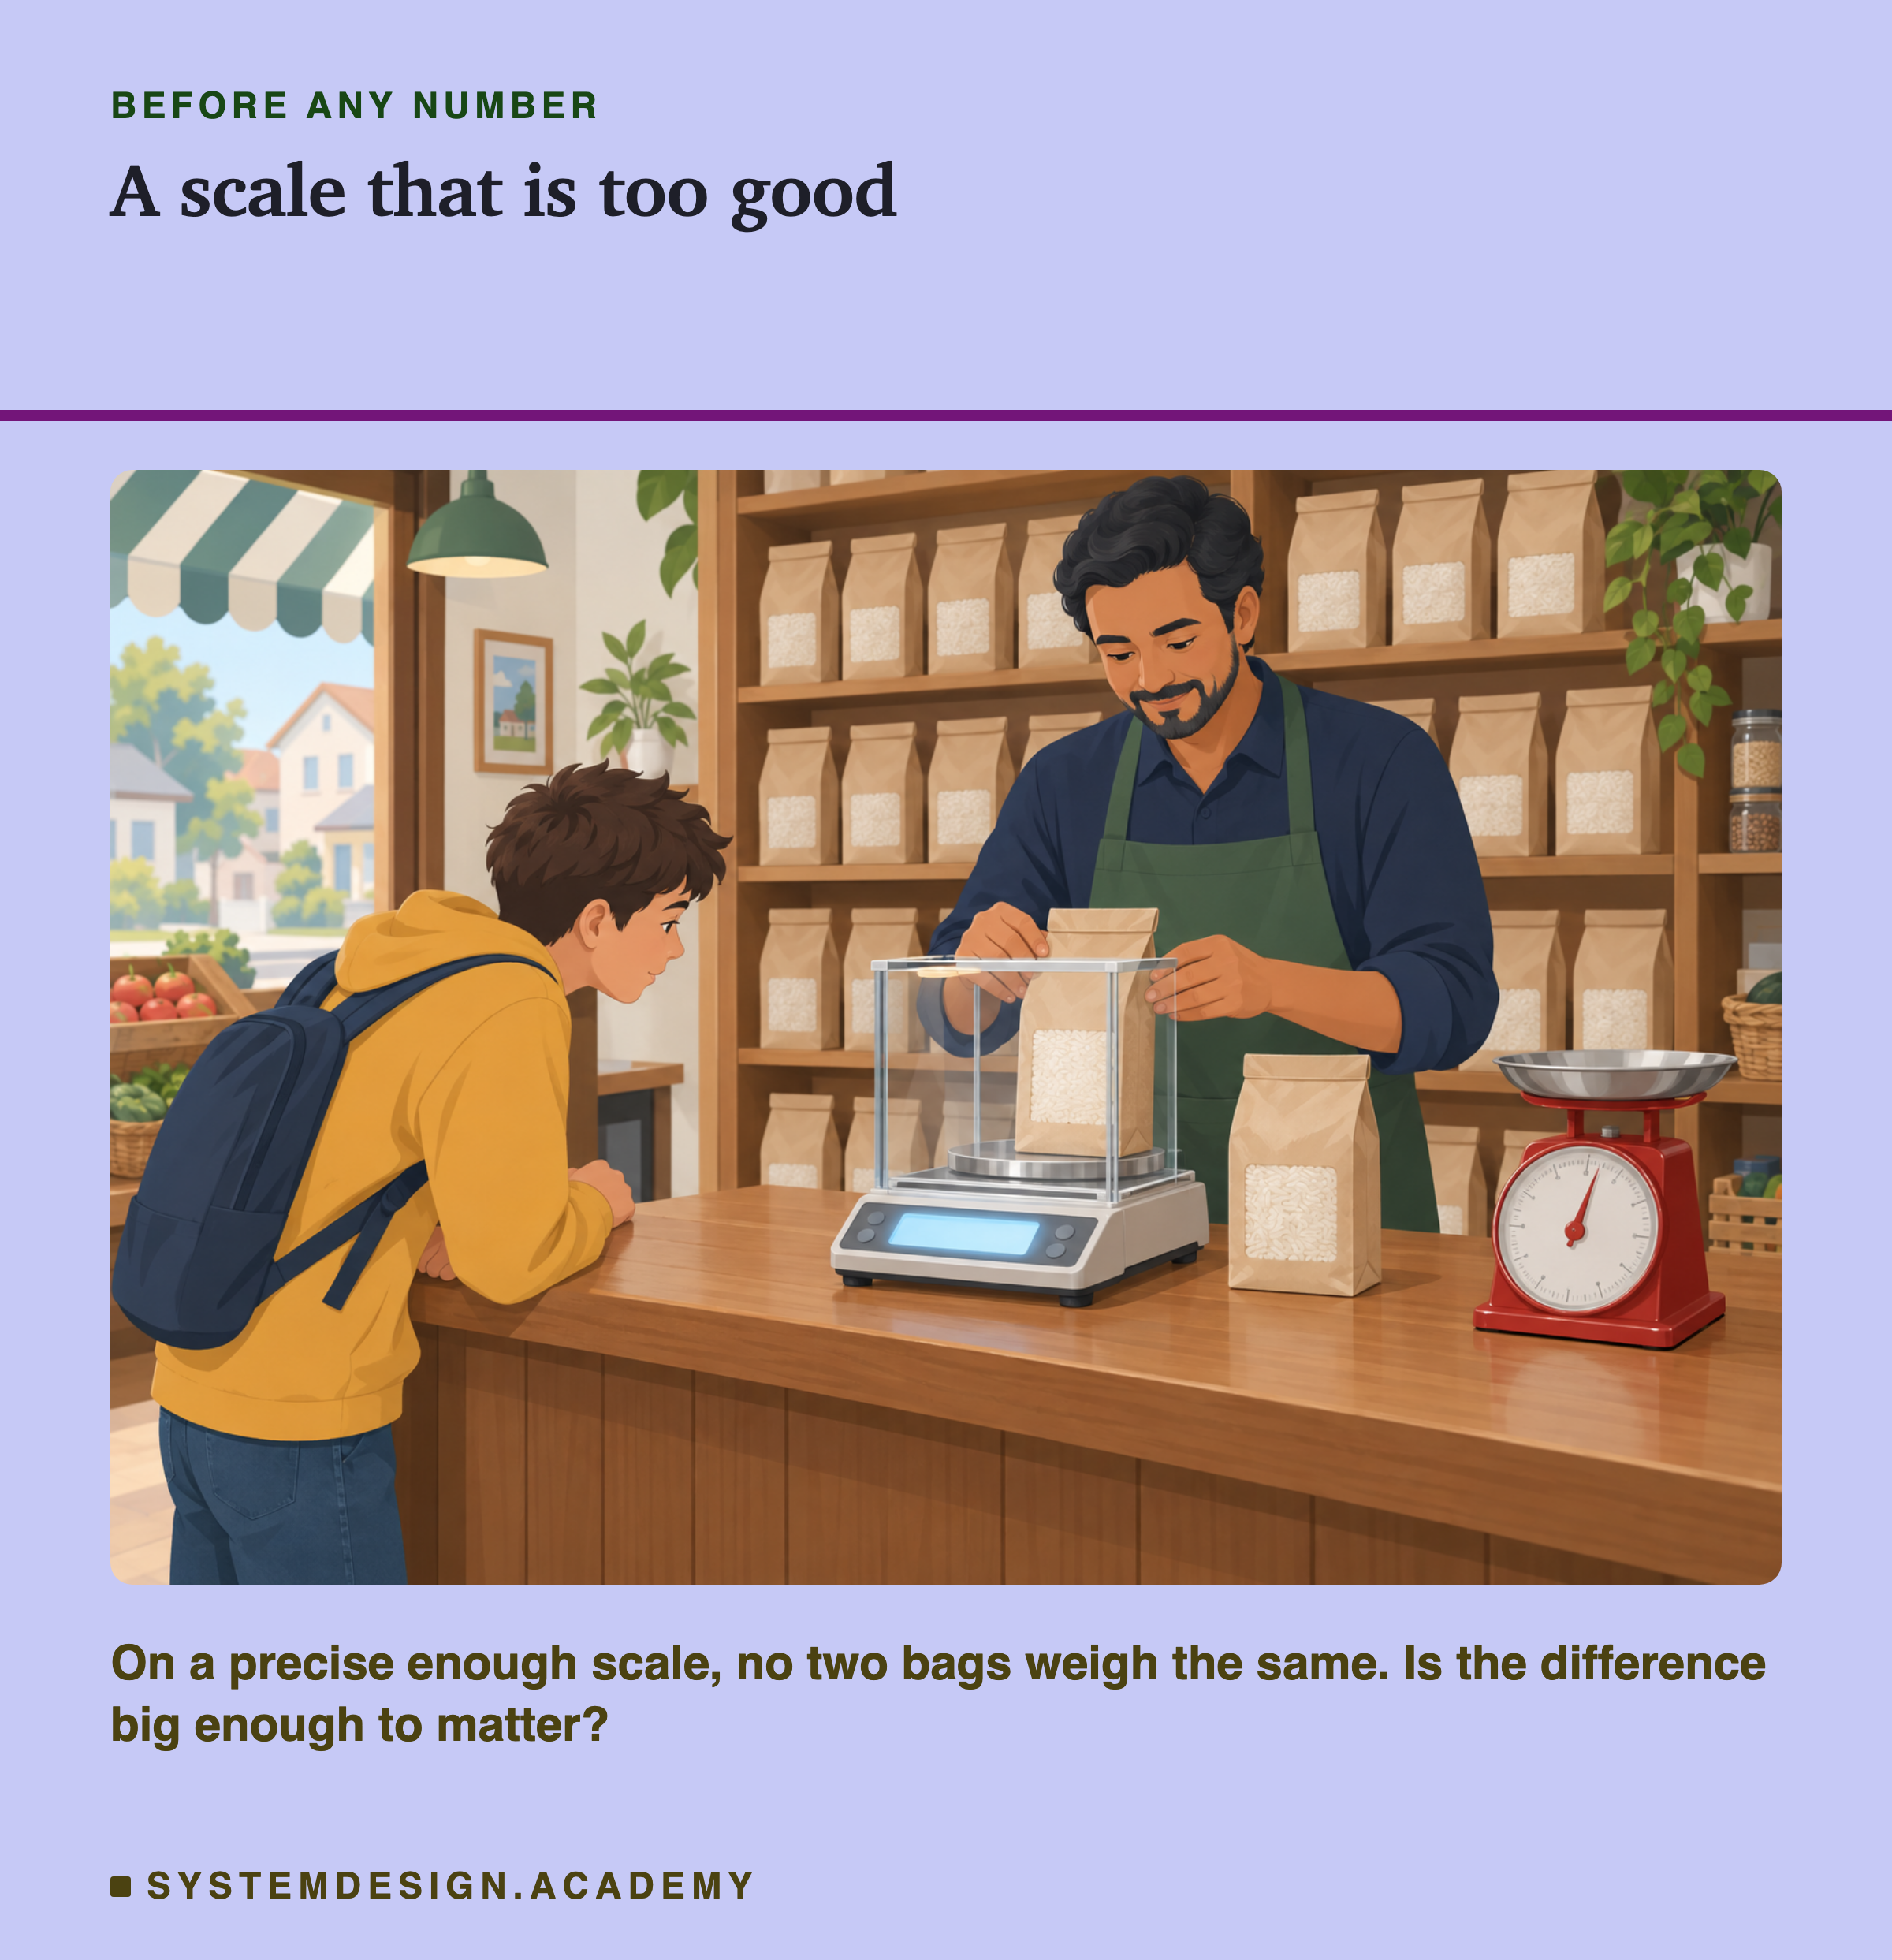
Then he bought a laboratory scale that measures to a hundredth of a gram. Now no two bags weigh the same. One is 1,000.31 grams, the next 999.87. Every pair he compares is "different".
Nothing changed in the rice. The new scale is simply so precise that it finds a difference every time. The useful question is no longer "are these two bags different?". It is "are they different enough to matter to a customer?".
There is a second trap in the shop. Suppose he weighs one bag twenty times and writes down twenty numbers. He has not learned anything about twenty bags. He has learned about one bag, twenty times.
Both traps are waiting inside the drift tests a team uses to watch a model. This lesson measures them.
Where This Lesson Starts
This is lesson 4 of the chapter on watching a model after it goes live. The model is the same one as in lessons 1 to 3. It reads six numbers about each customer of a real online shop and gives a score for how likely they are to buy again in the next 30 days. It went live on 1 July 2011, and I replay its 162 nights, one by one, up to 9 December 2011.
In lesson 3 I kept the test fixed and changed what tonight's table was compared with. I found that no reference can fix a test on a column that counts days, such as tenure, the days since a customer's first order. So this lesson looks only at the four columns that do not count days:
- frequency: how many orders a customer placed that were not returns;
- money: pounds spent, with returns taken off;
- return share: the share of their order lines that were returns, from 0 to 1;
- products: how many different products they have bought.
Now I keep the reference fixed and change the other two things: the test, and the number of rows it is given. Lesson 3 used one shape test, PSI. Many teams use two others, the KS test and the Wasserstein distance. They behave very differently as the number of rows grows, and the reason is the subject of this lesson.
I also build on monitoring and drift detection, which named these tests in words.