One Copy, and a Network Between You and It
The local cache lesson ended with a problem: every instance holds its own copy, so they disagree, and the window grows as you add instances. A shared cache solves that completely, by having exactly one copy.
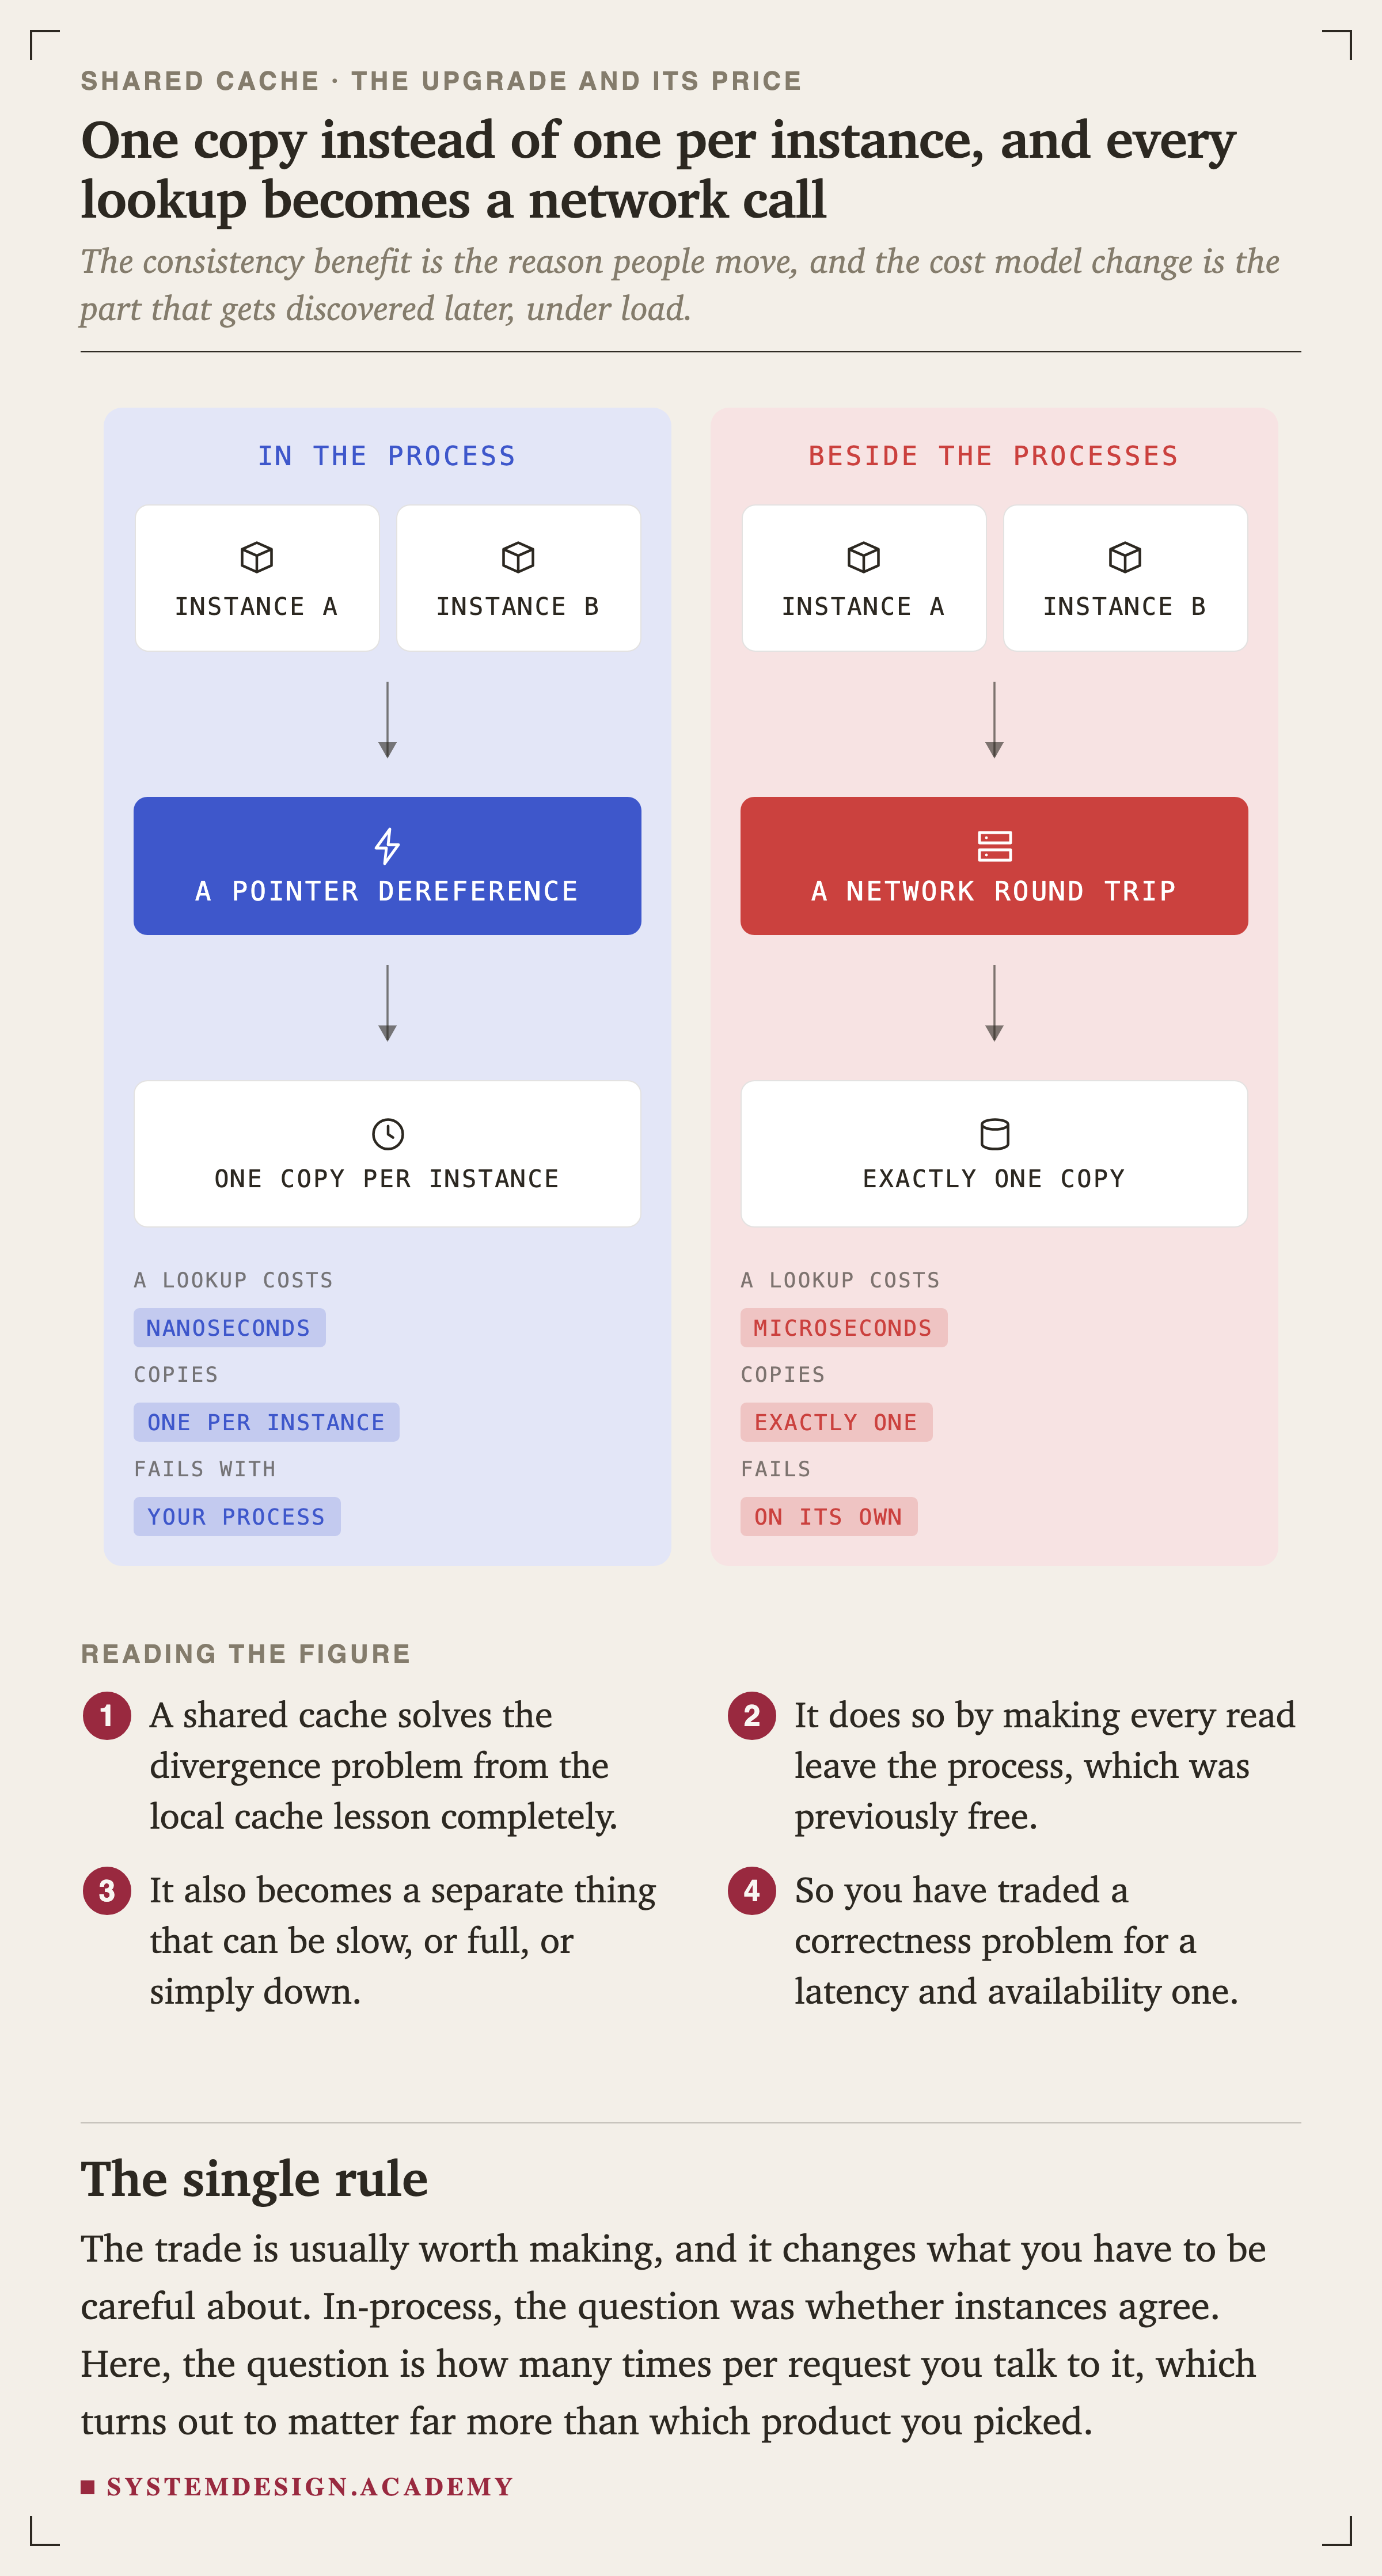
The consistency benefit is the reason people move. The cost model change is the part that gets discovered later, under load, and it is what this lesson is about.
How You Ask Decides What It Costs
The script is at scripts/labs/sharedcache/roundtrips.py. It starts a real and fetches the same hundred keys three different ways.
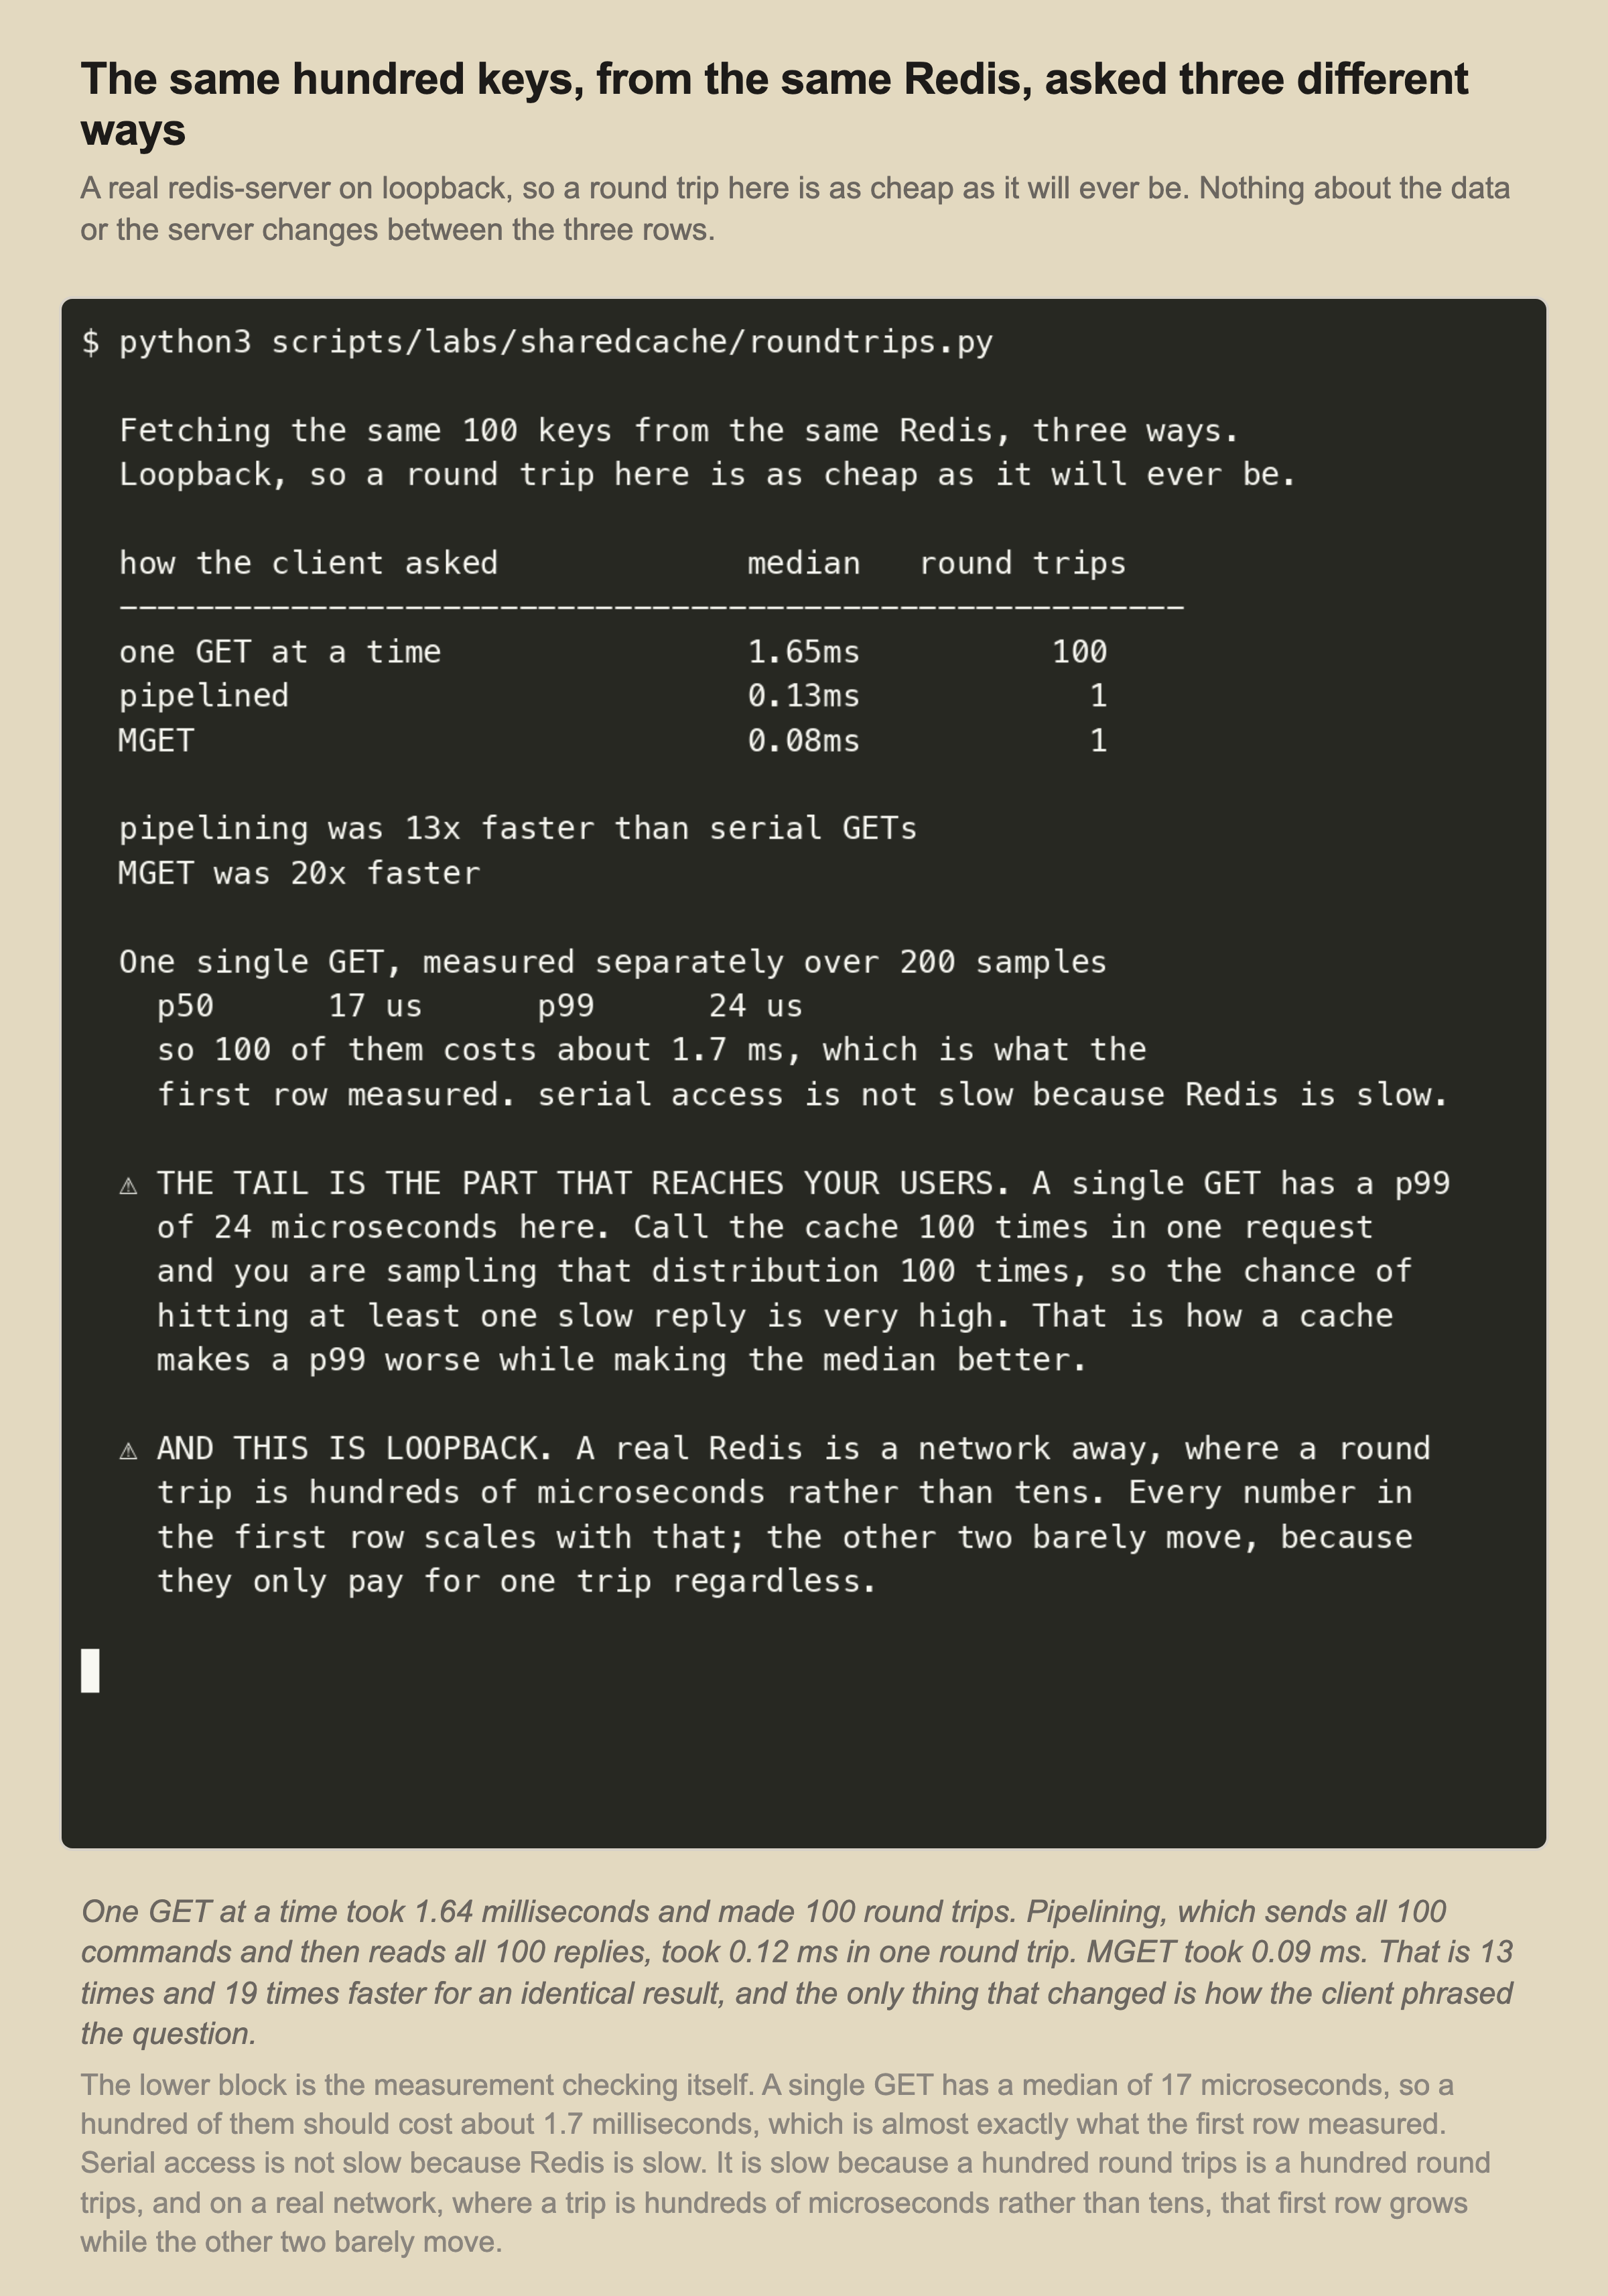
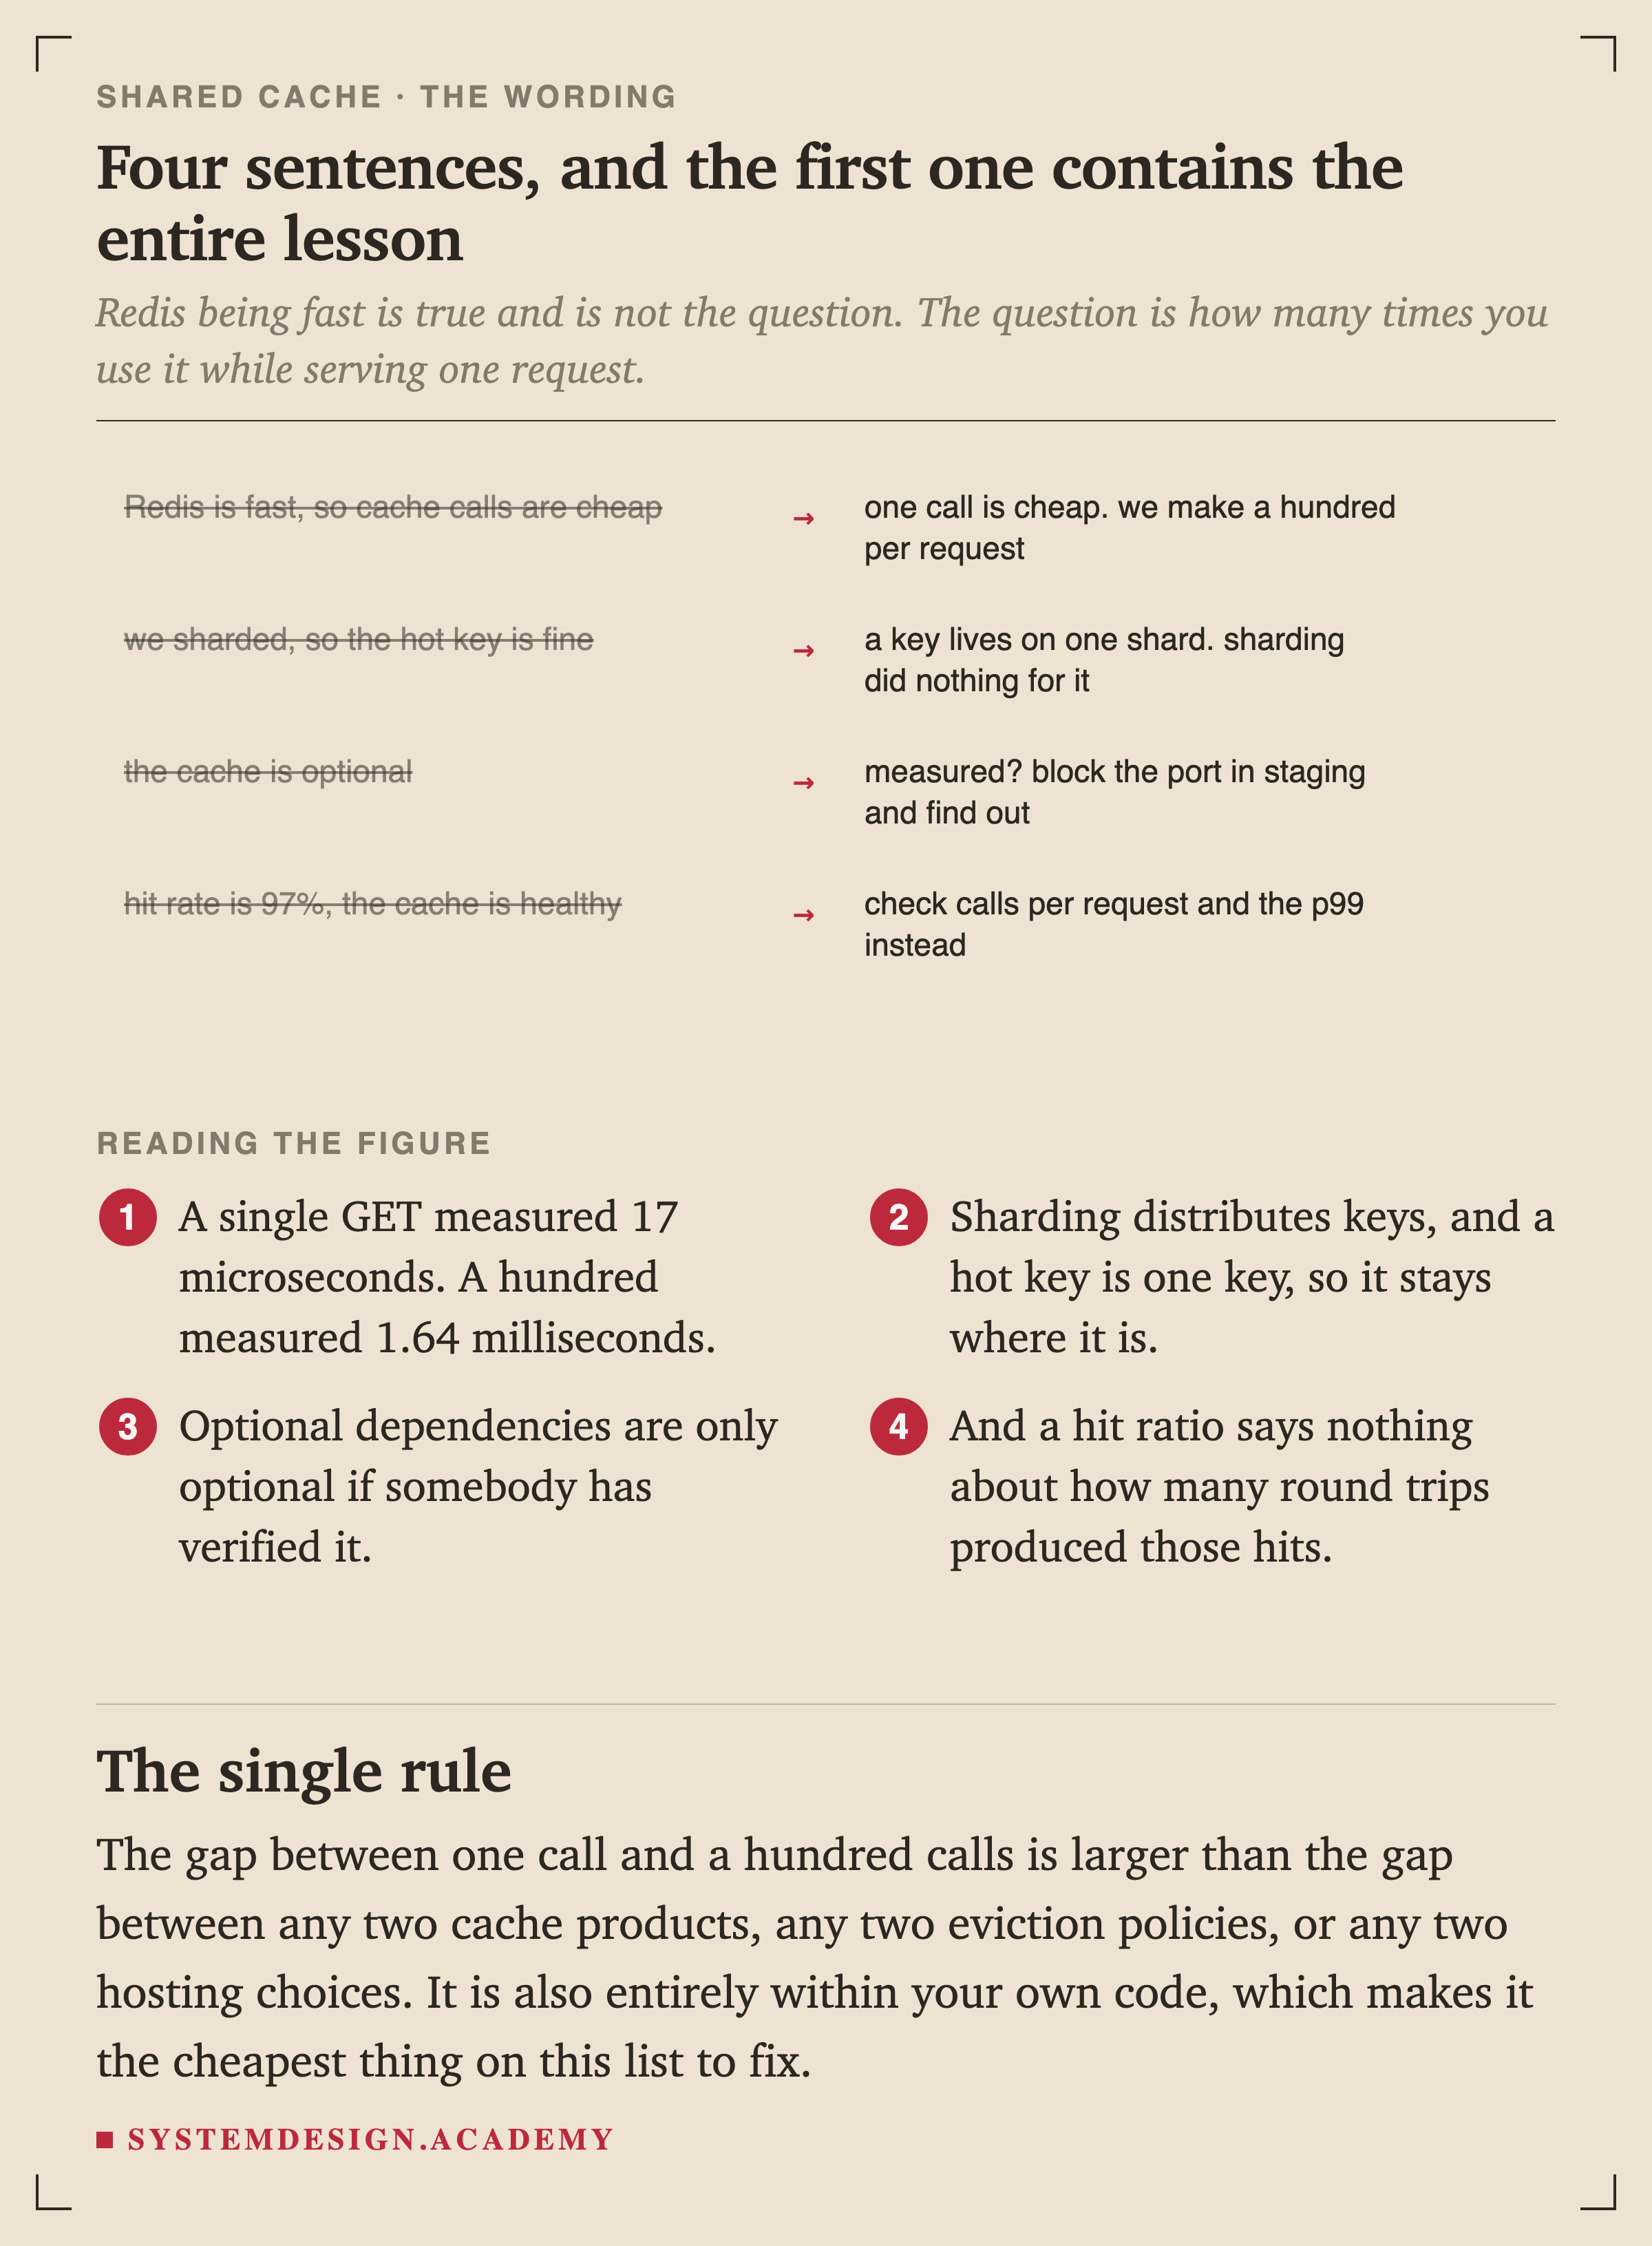
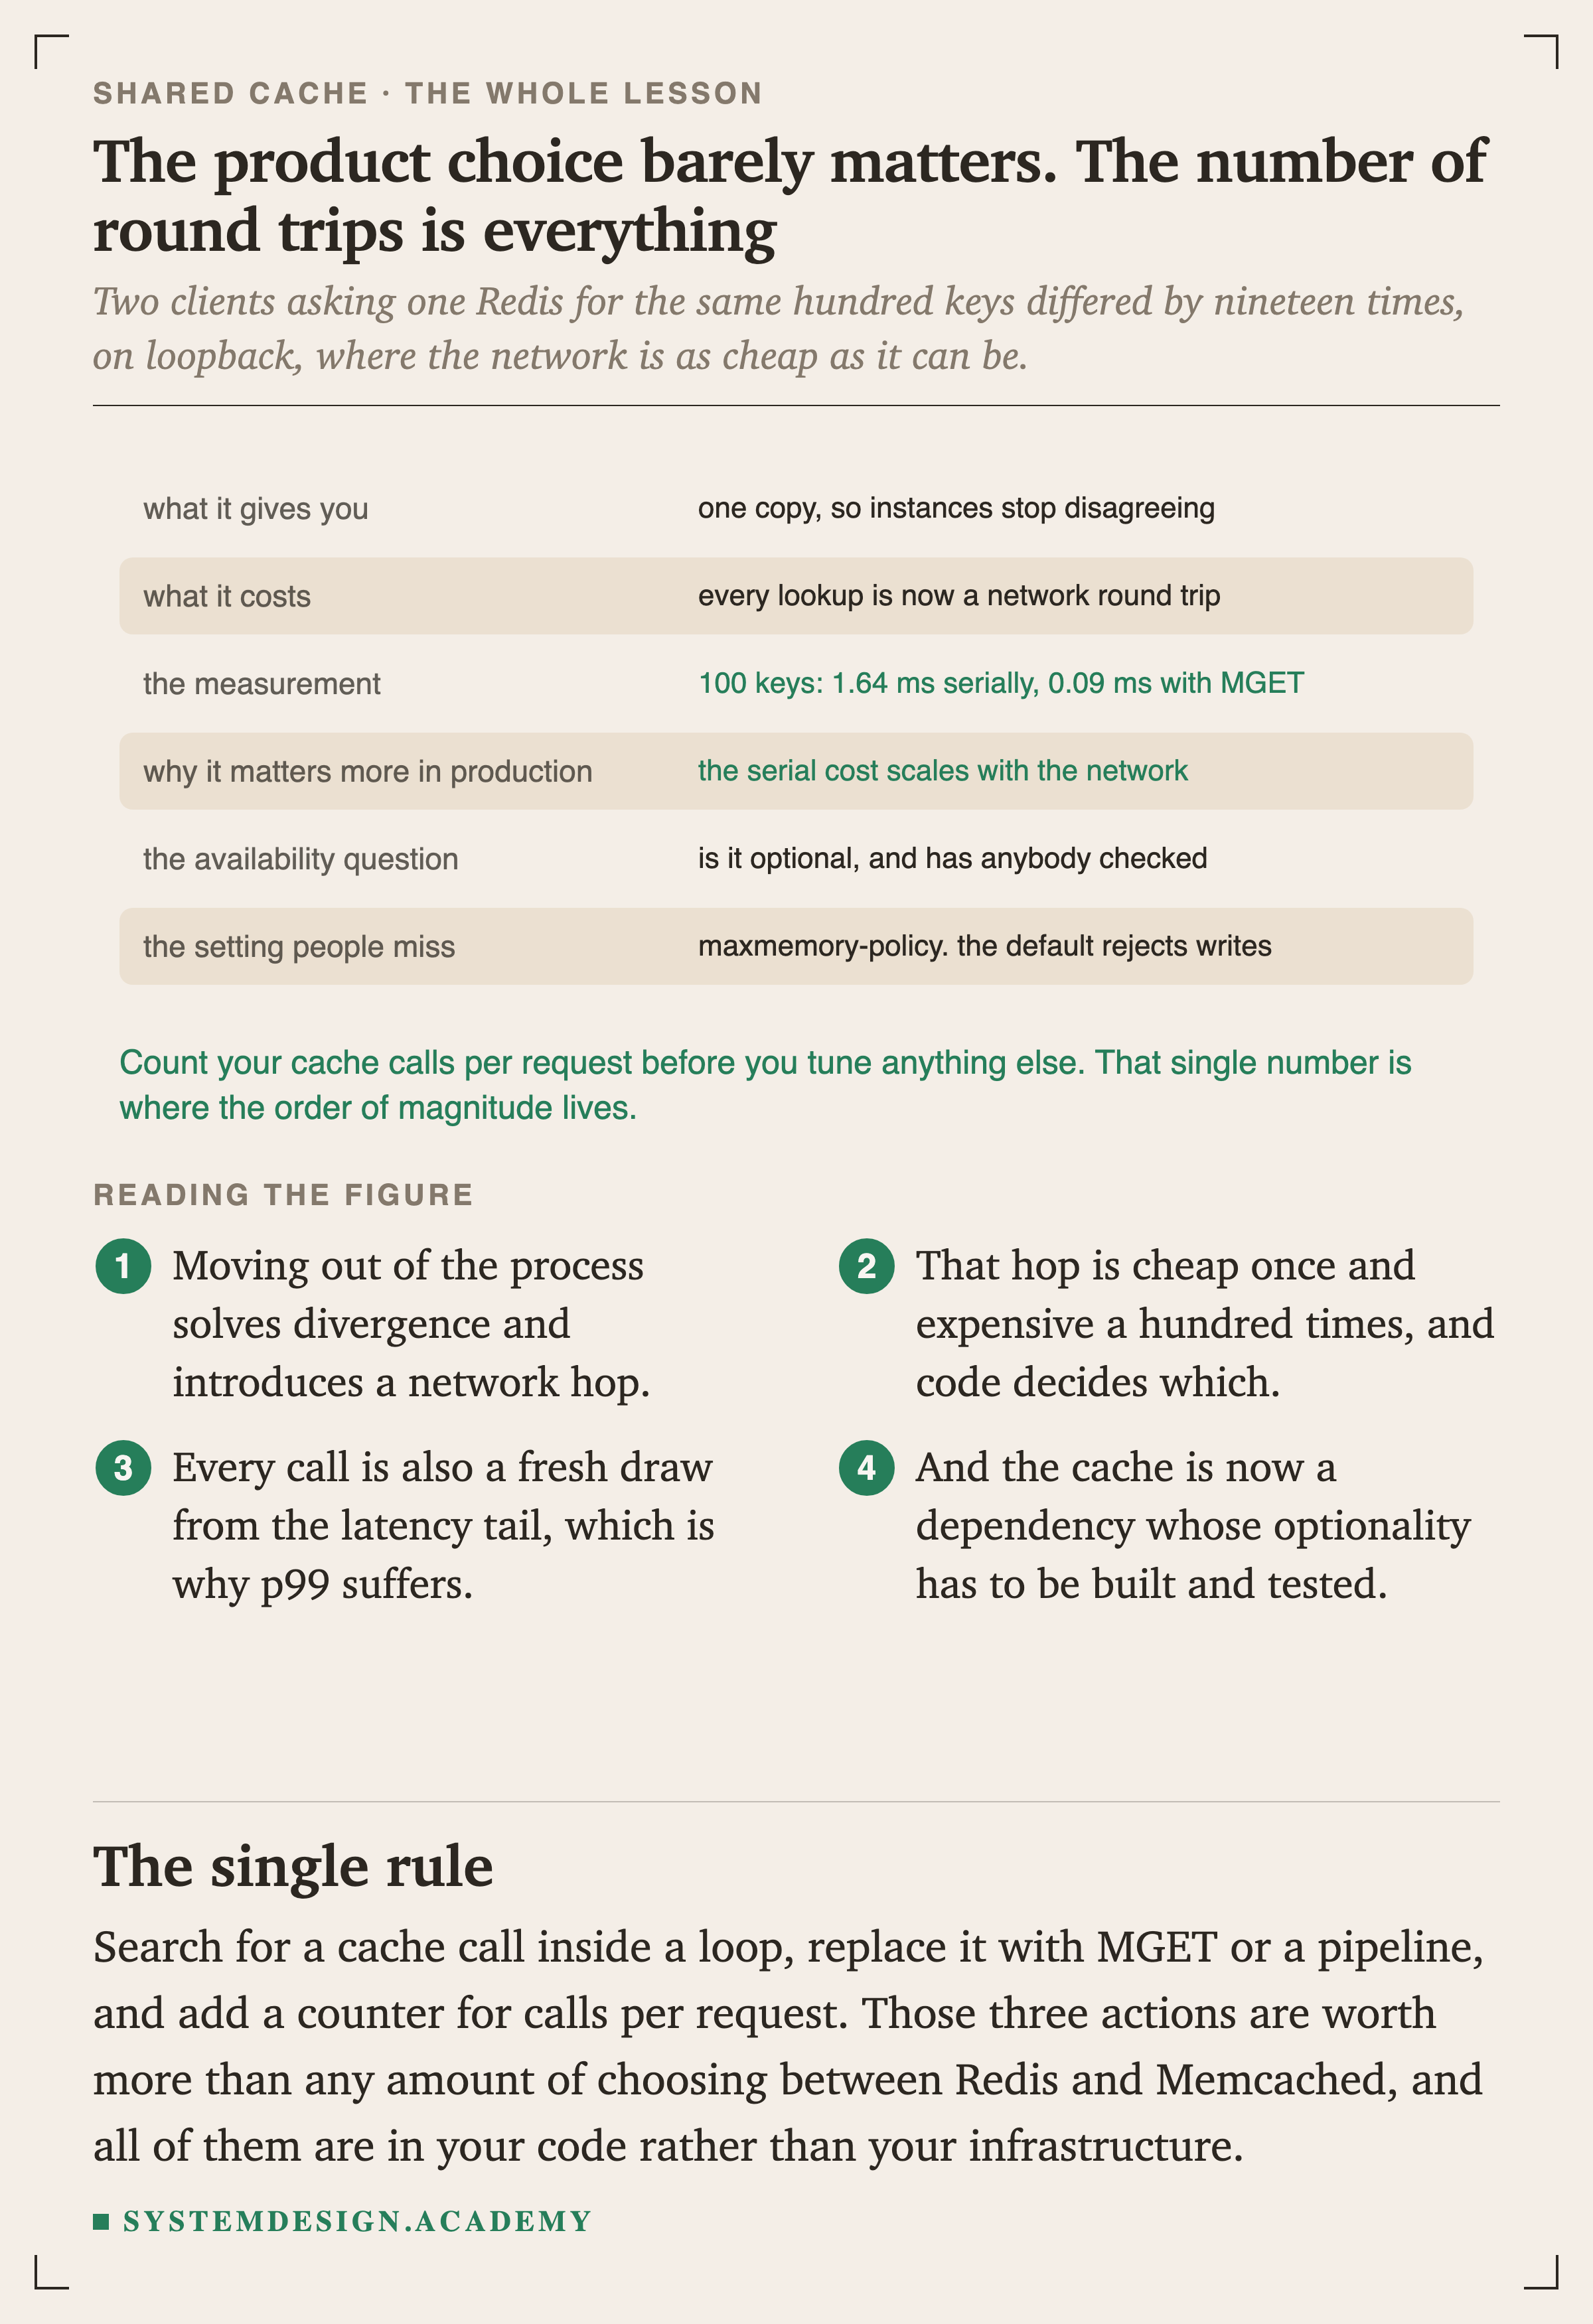
Serial access is not slow because Redis is slow. A single GET measured 17 microseconds at the median, and a hundred of those is 1.7 milliseconds, which is almost exactly what the first row shows. The arithmetic checks the measurement.

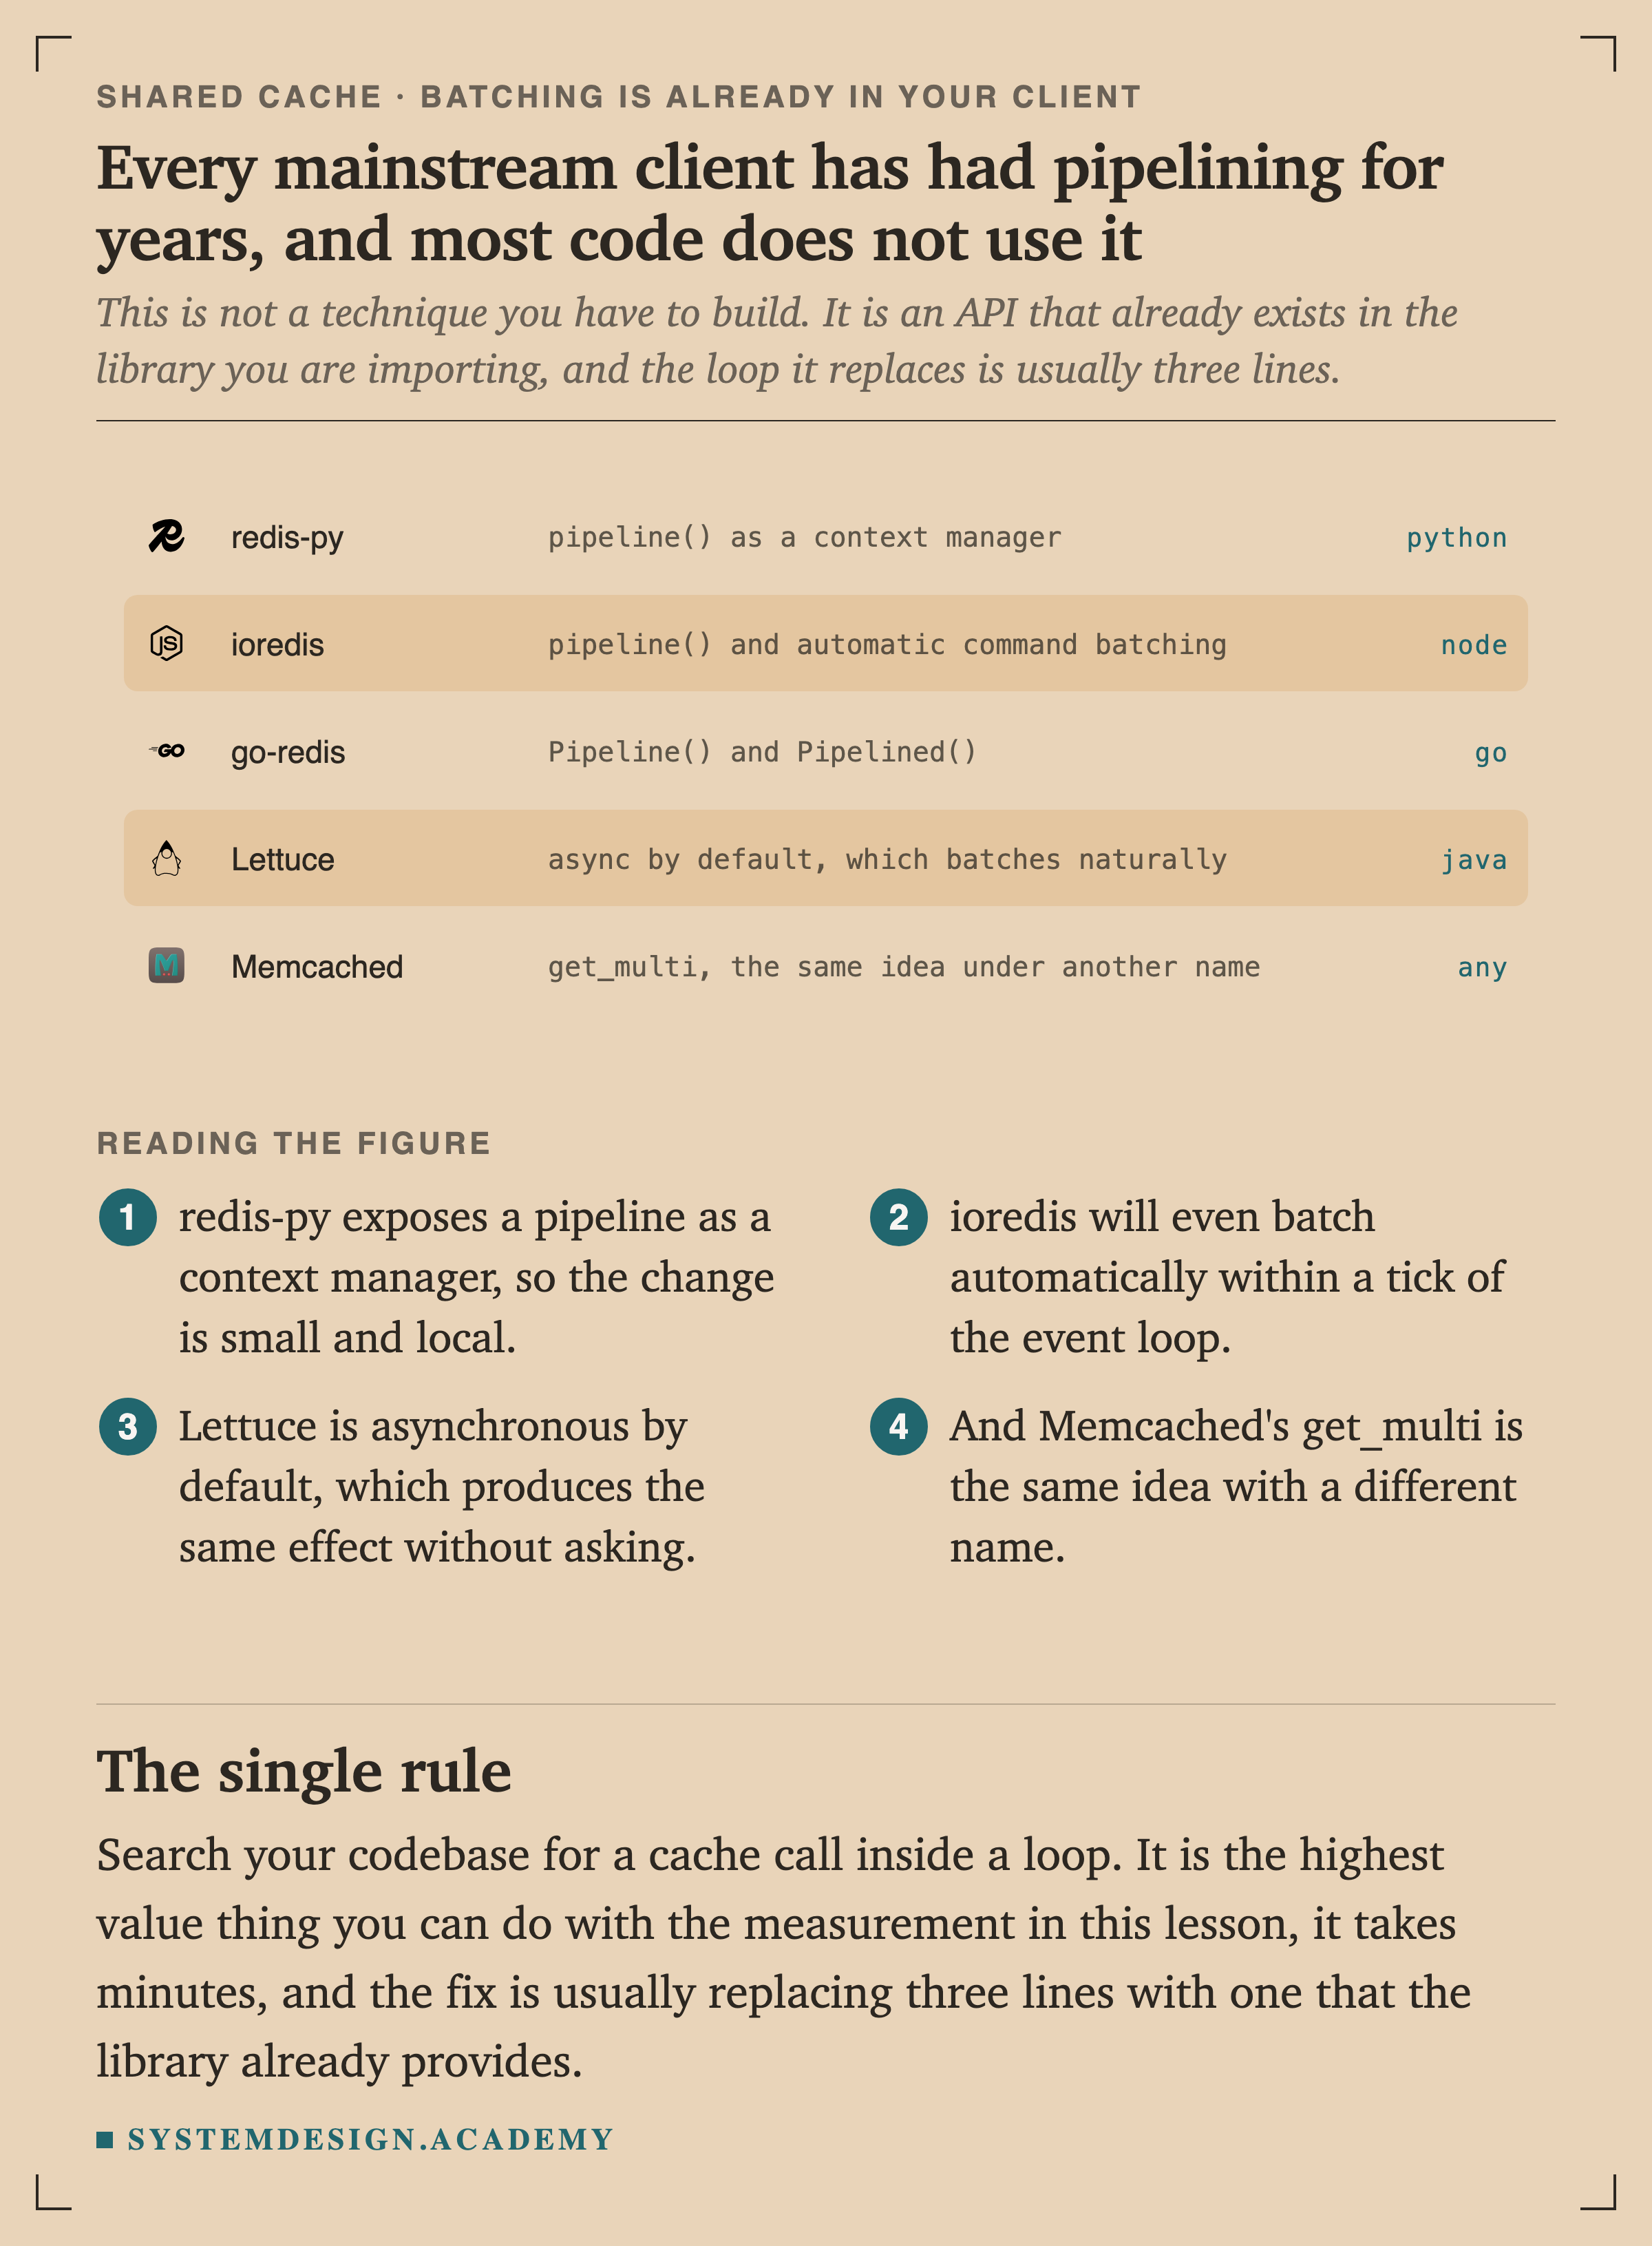
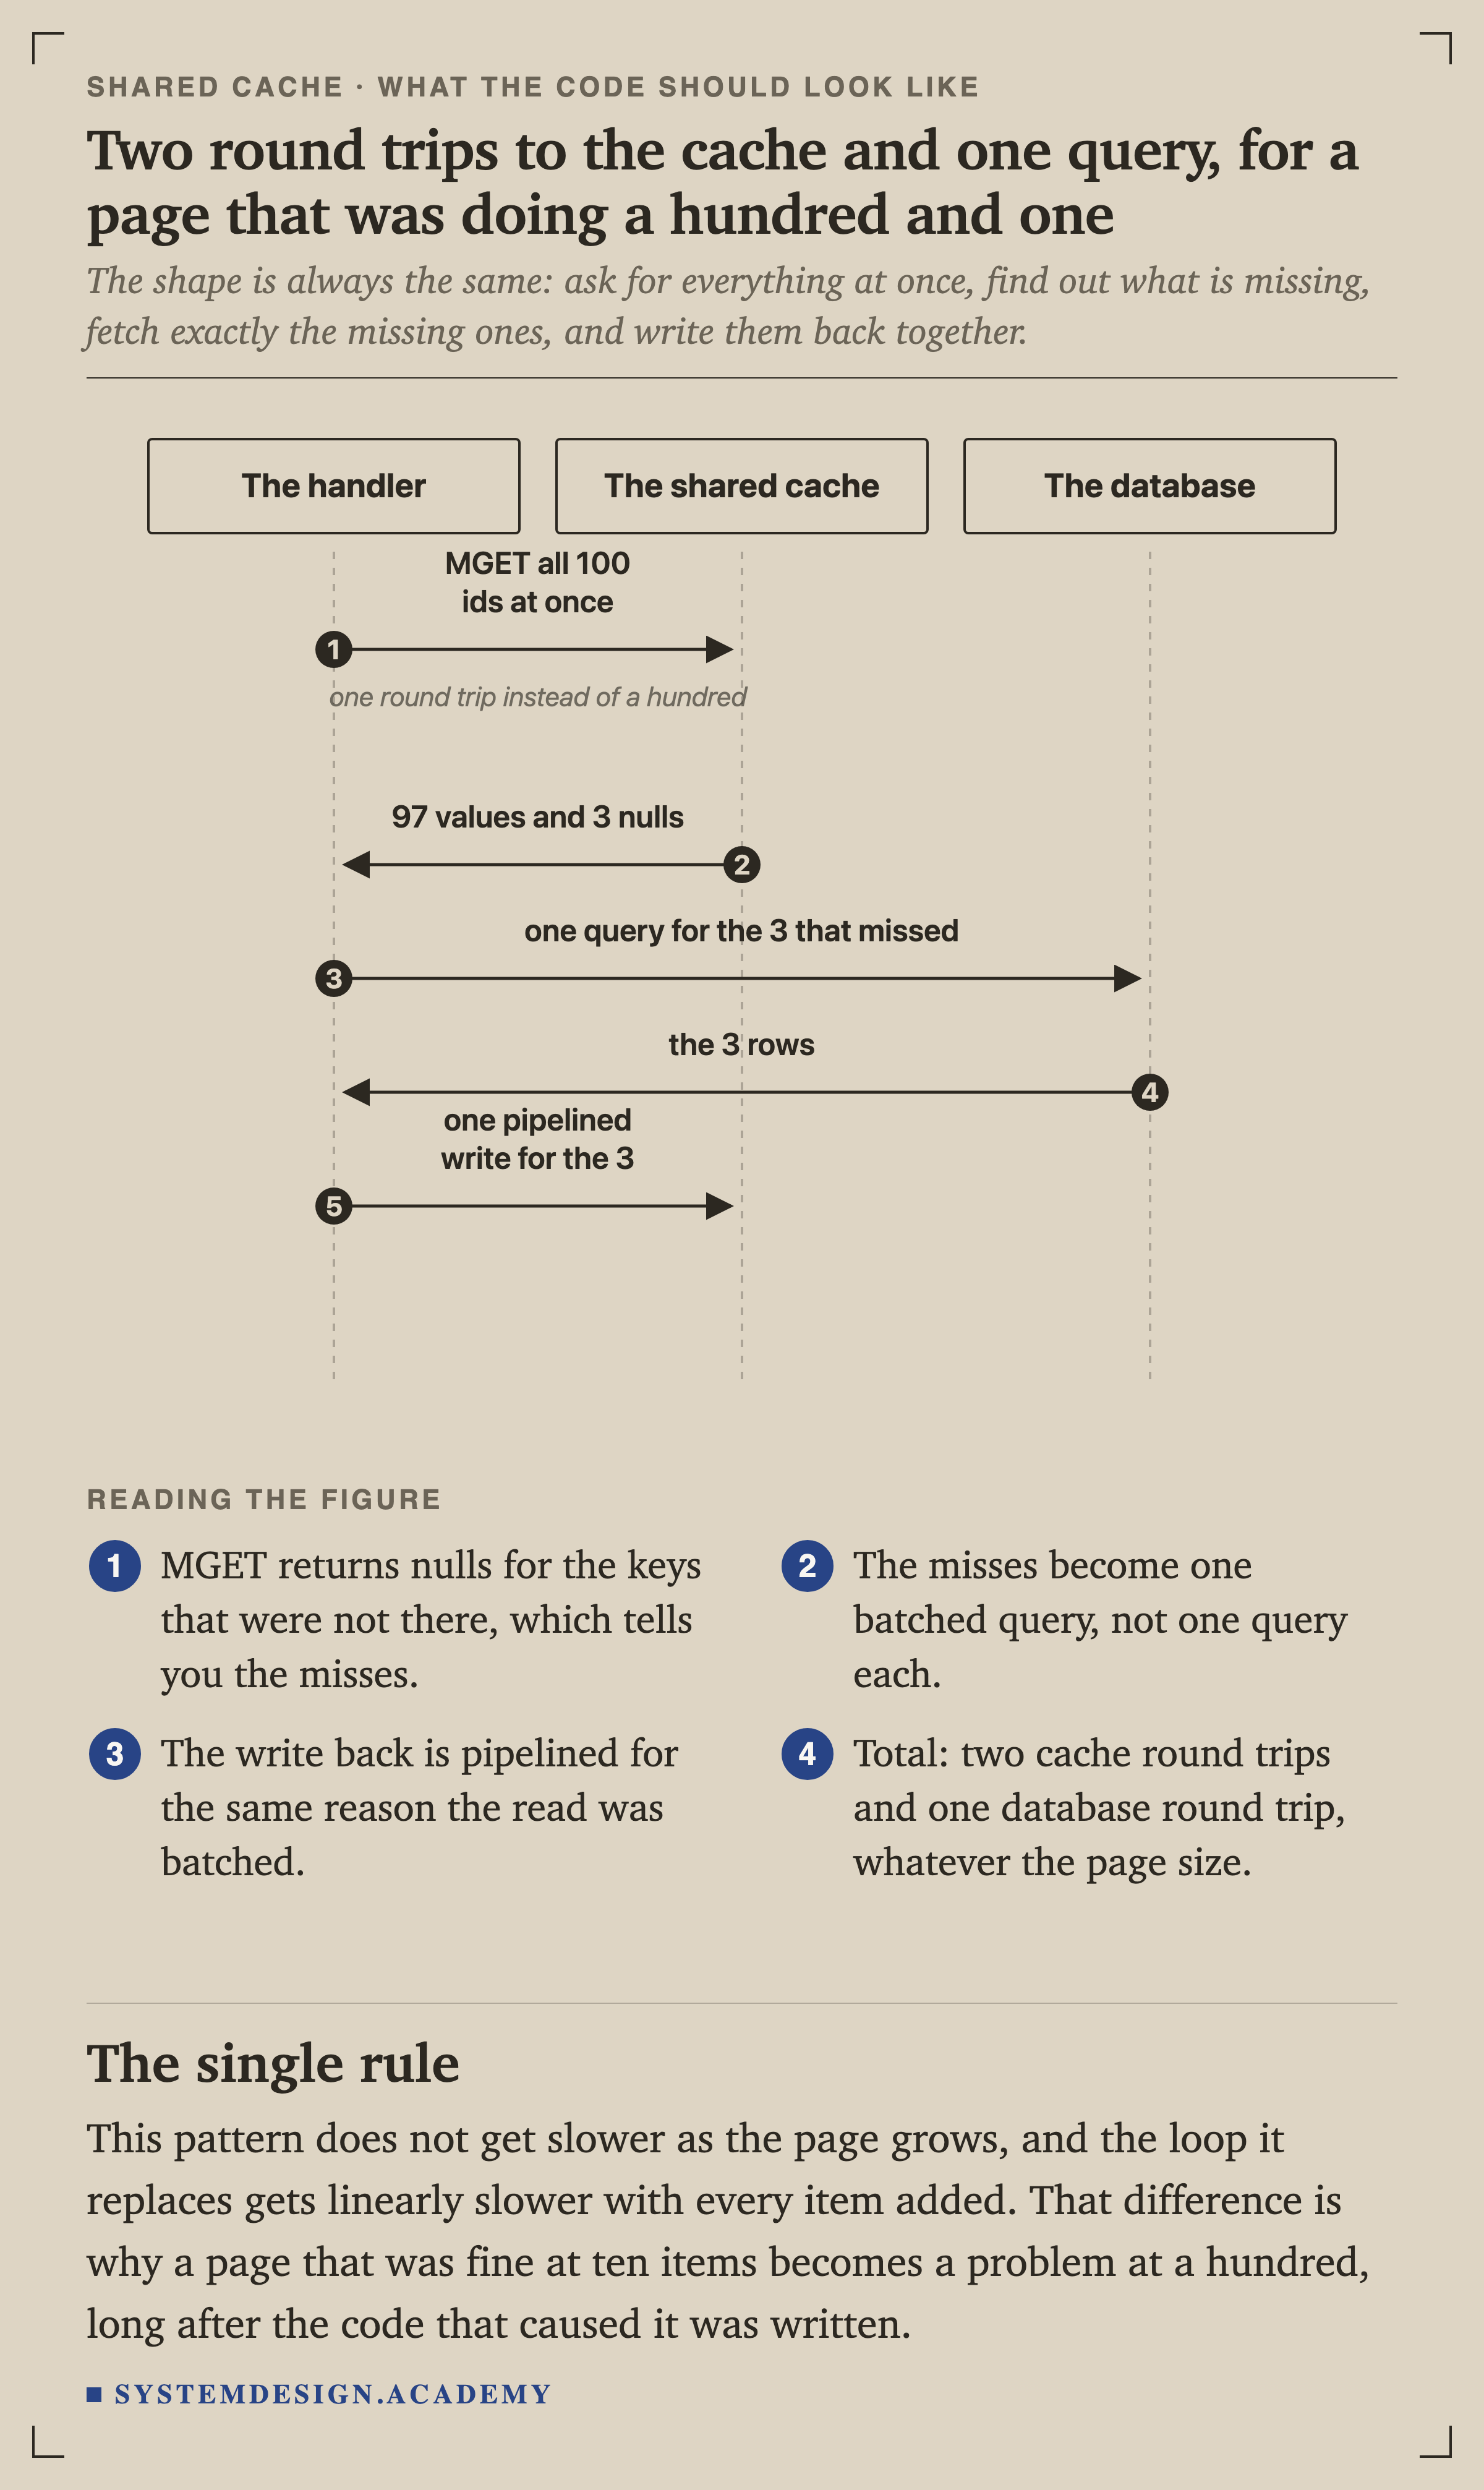
Pipelining sends all one hundred commands and then reads all one hundred replies. MGET asks for all of them in a single command. Both are one round trip, and both are a line of application code.
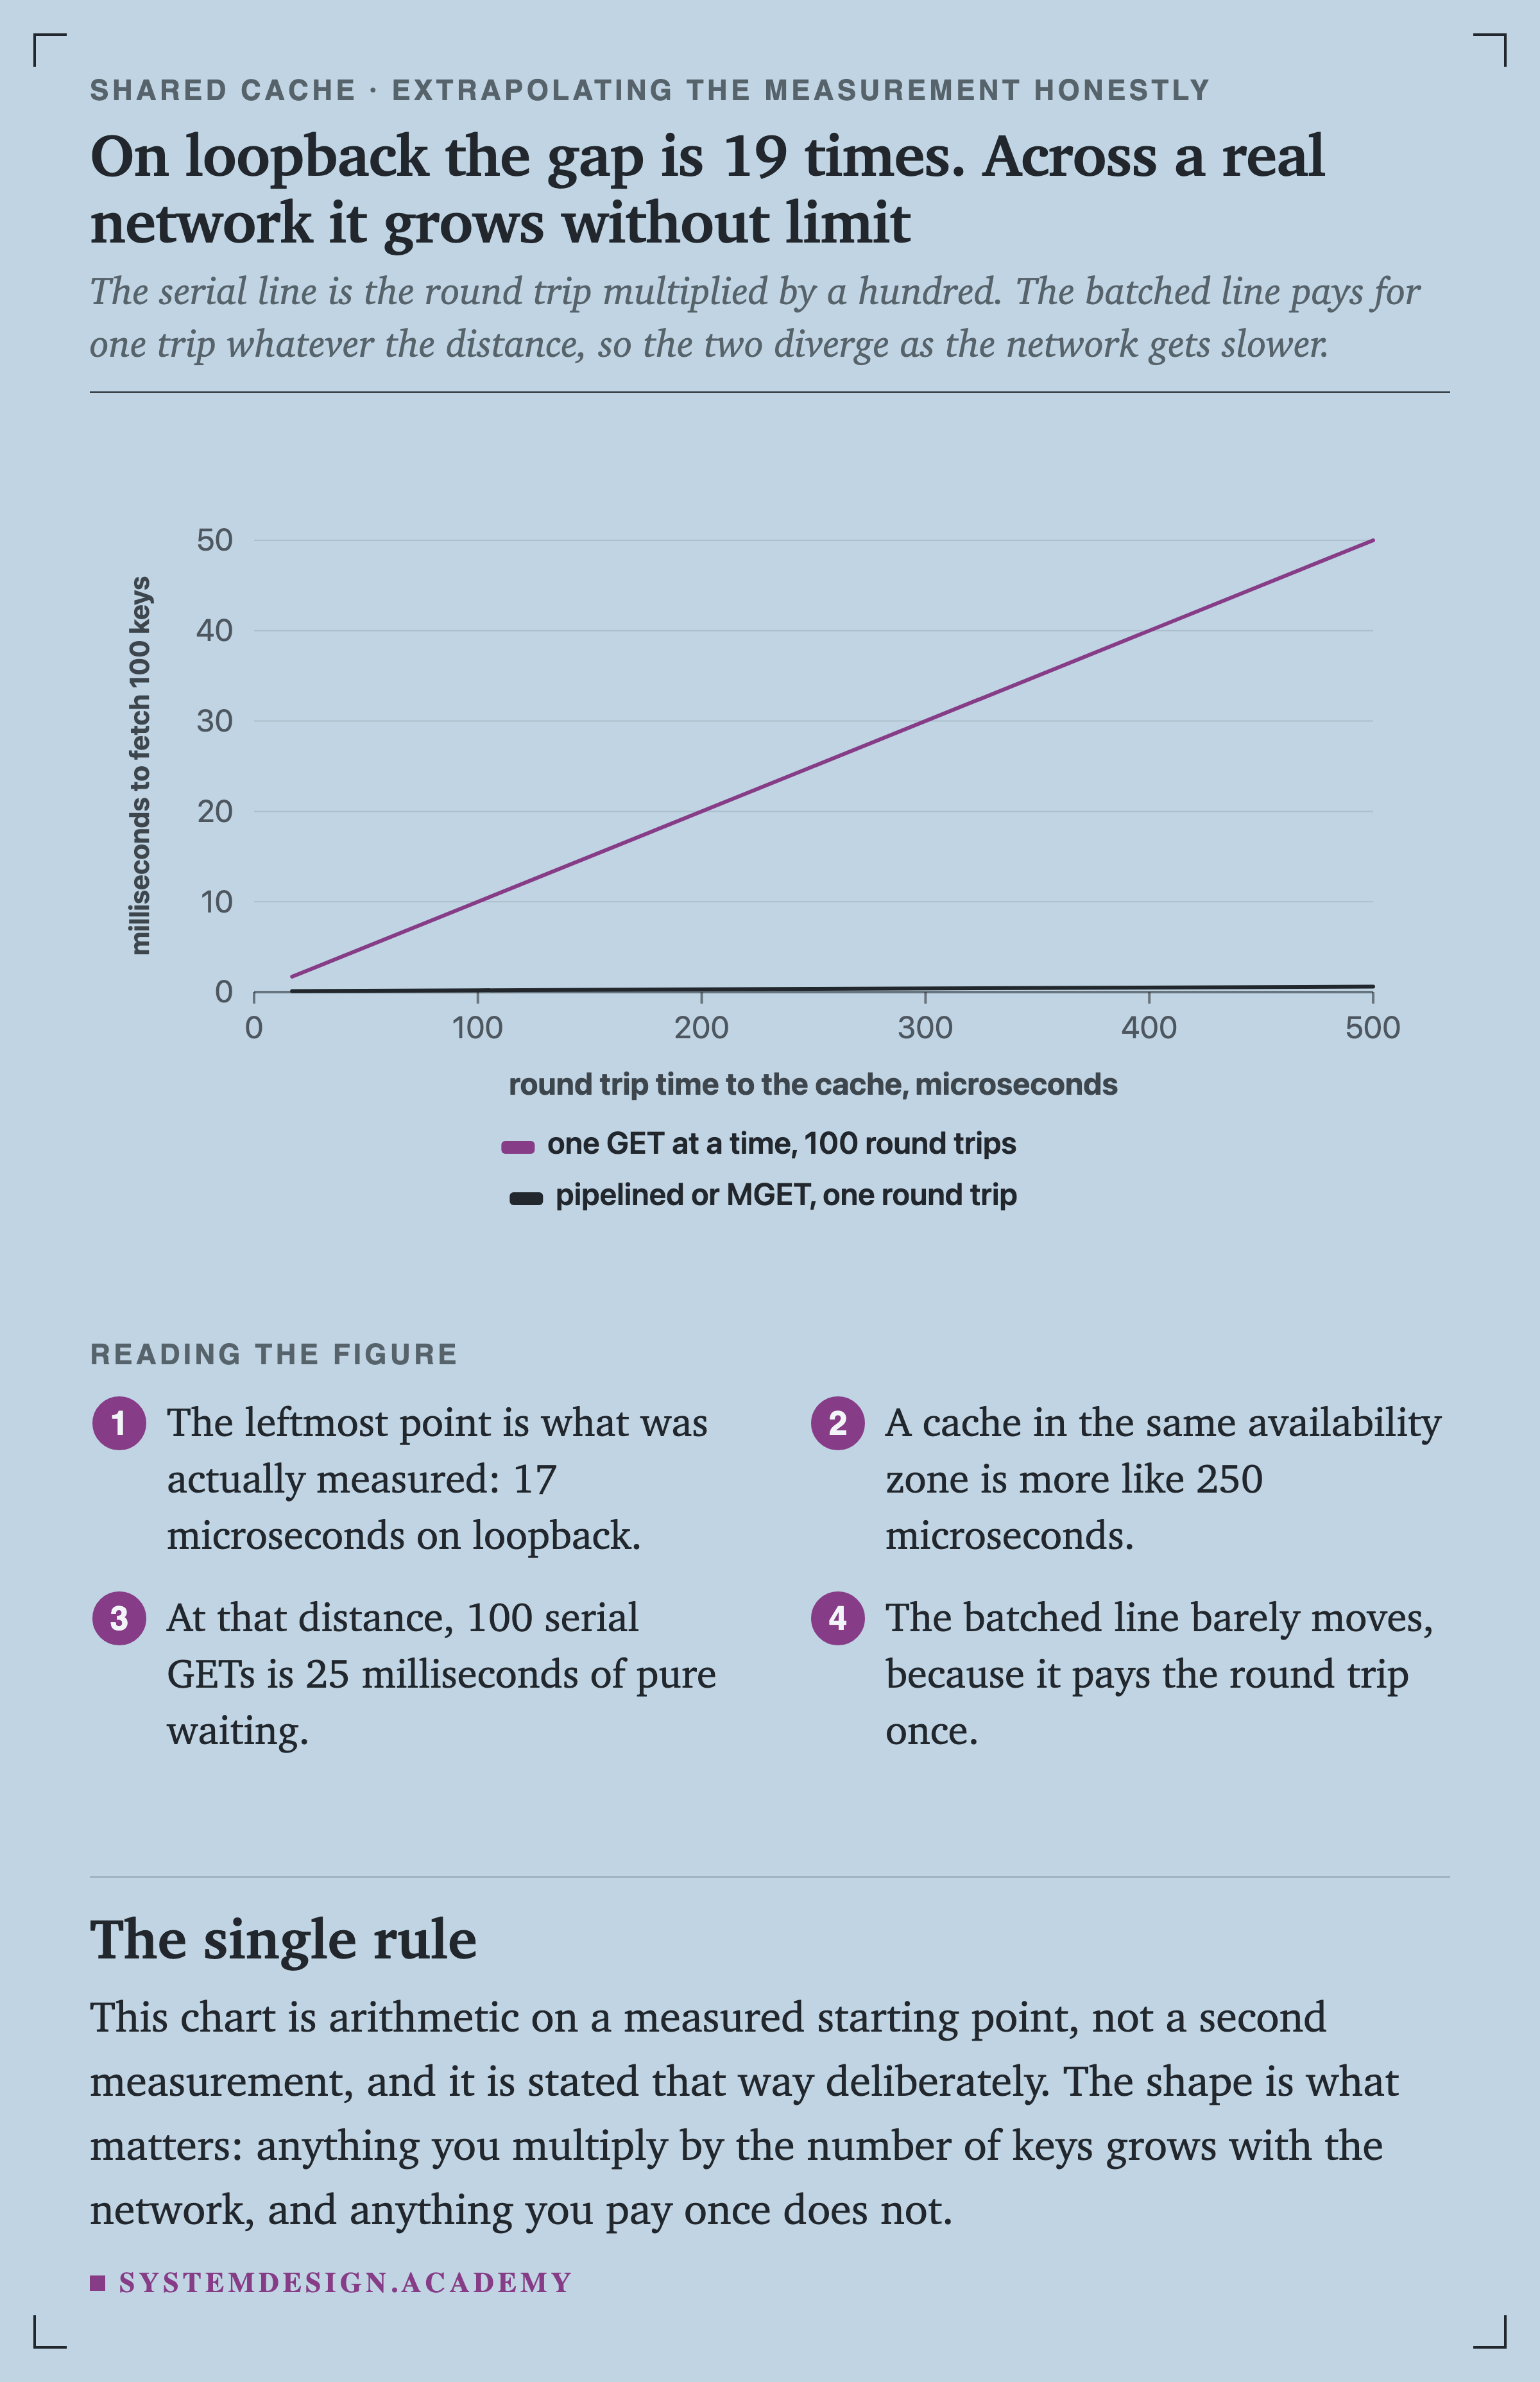
This chart is arithmetic on a measured starting point, not a second measurement, and it is stated that way deliberately. Anything you multiply by the number of keys grows with the network, and anything you pay once does not.
The Shape of the Mistake
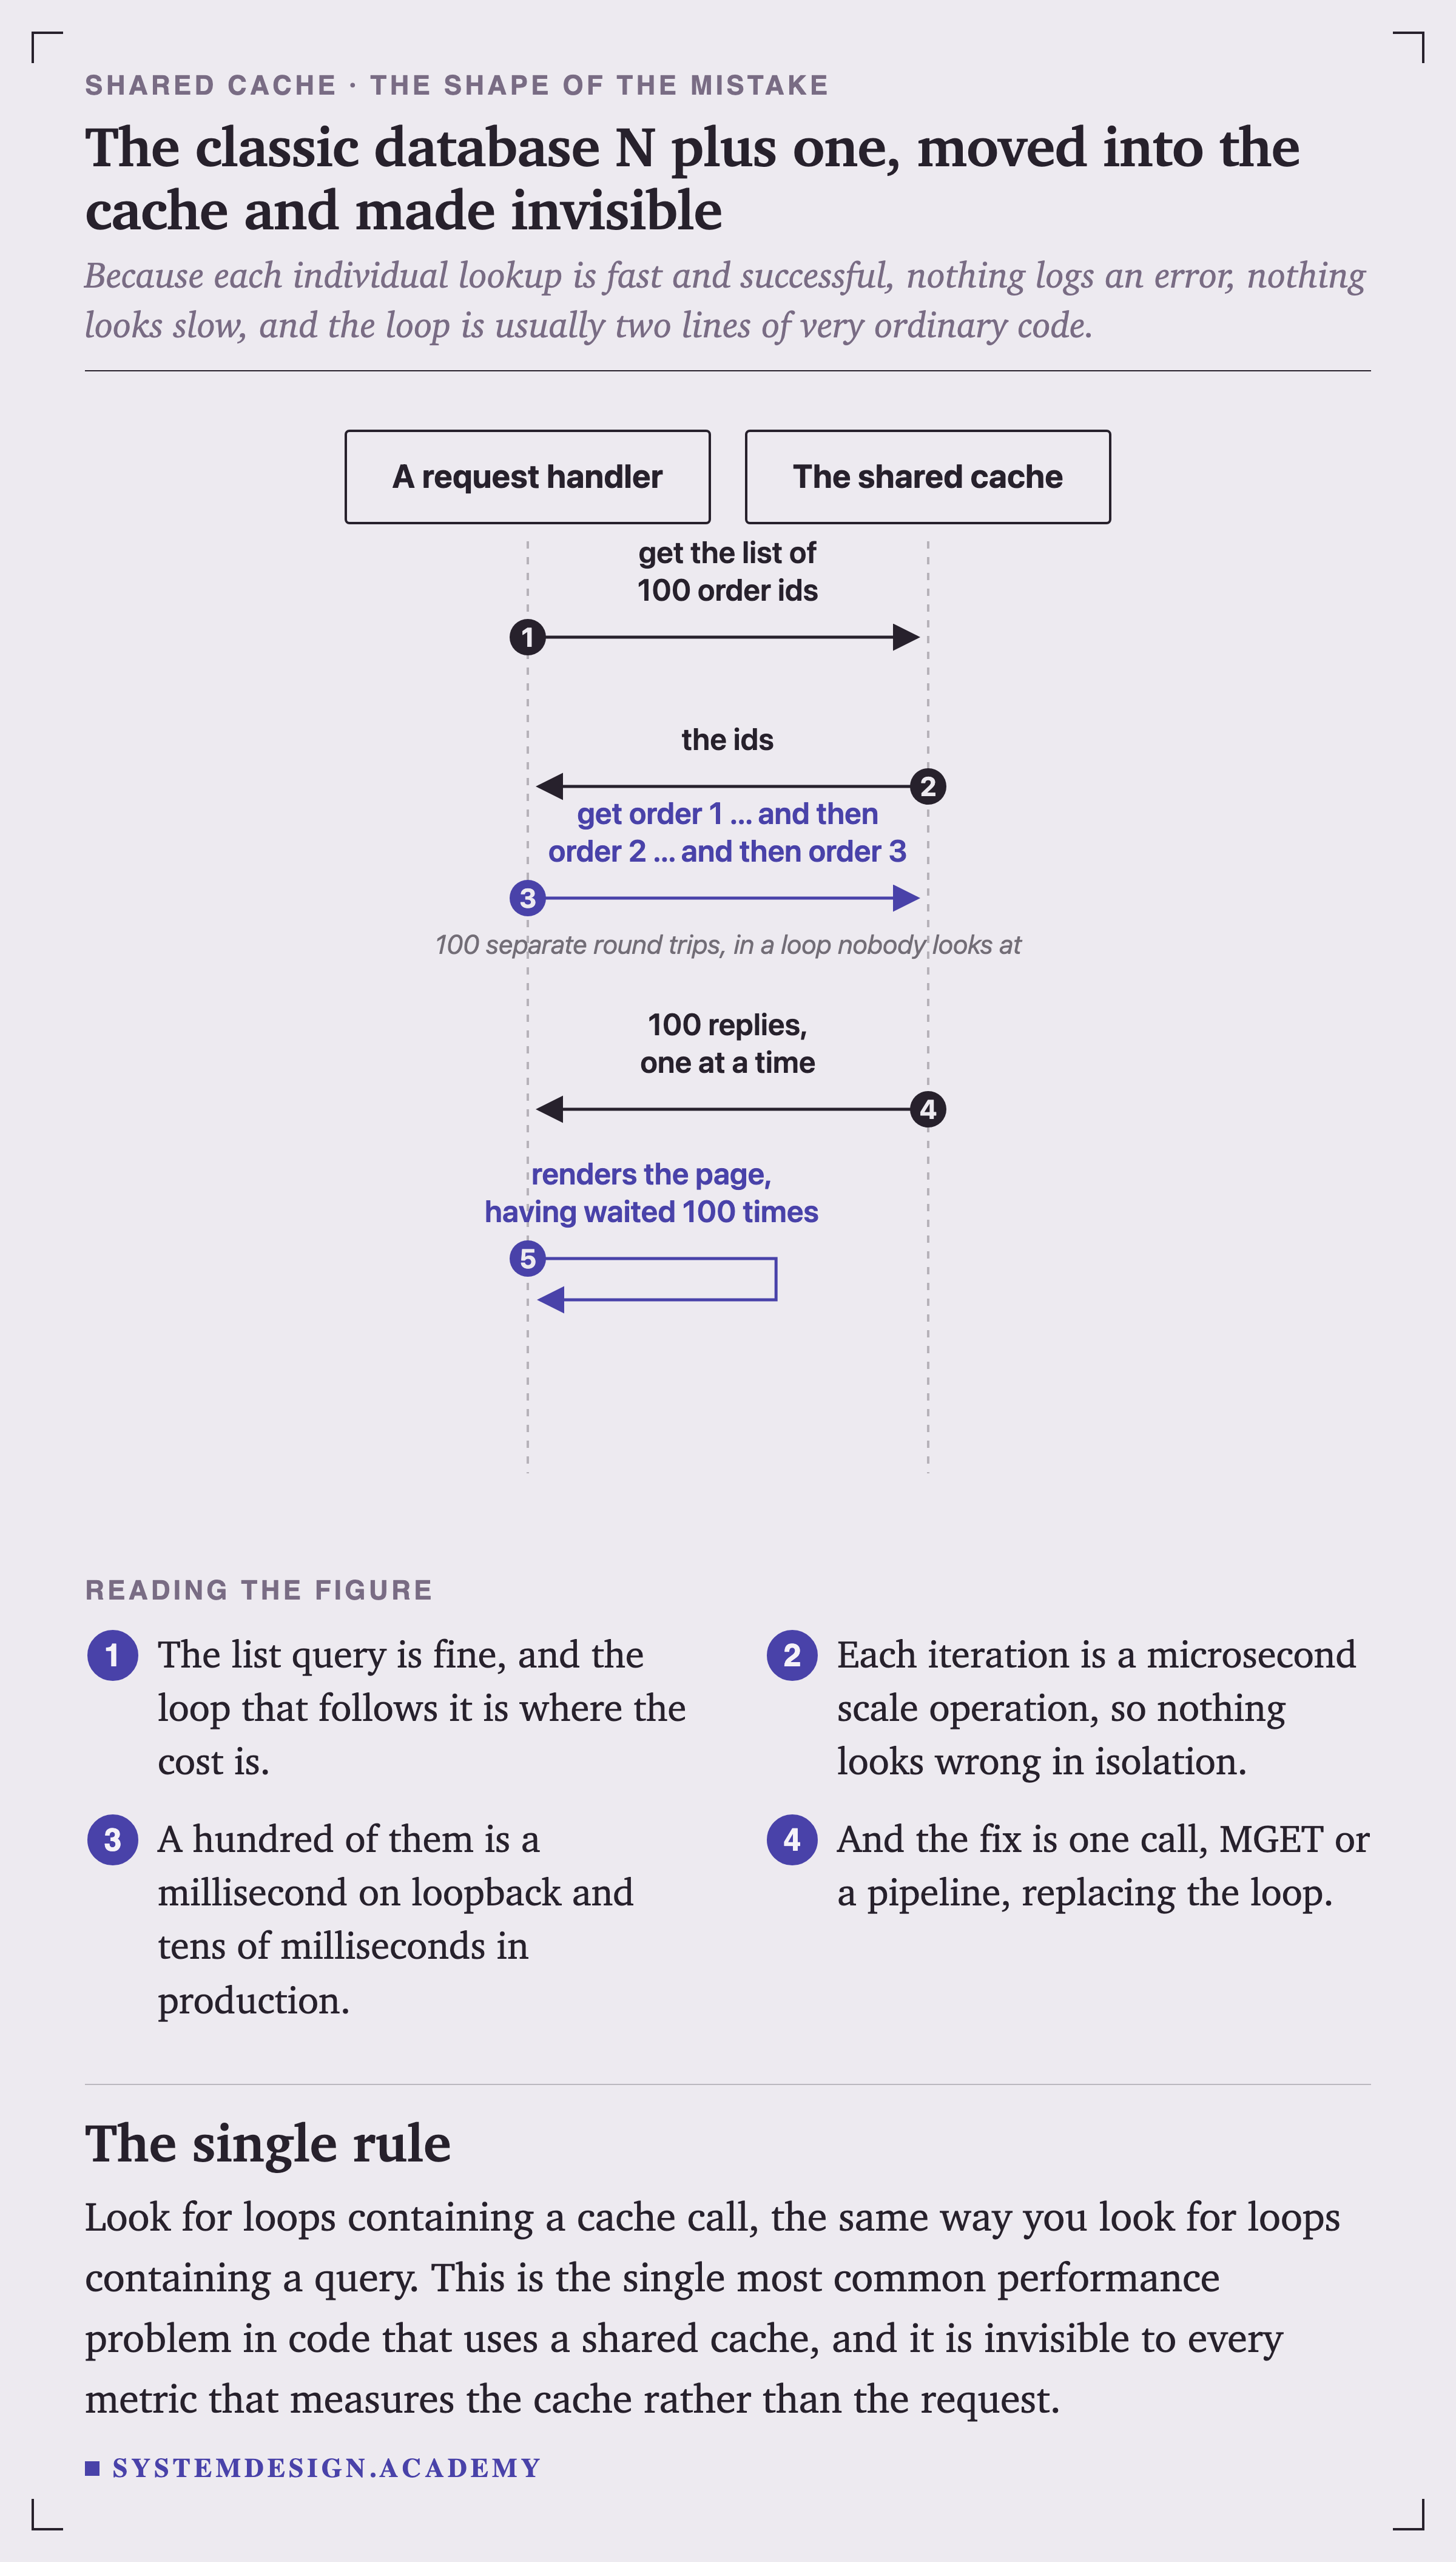
Each individual lookup is fast and successful, so nothing logs an error and nothing looks slow. The loop is usually two lines of very ordinary code, and it is the single most common performance problem in code that uses a shared cache.
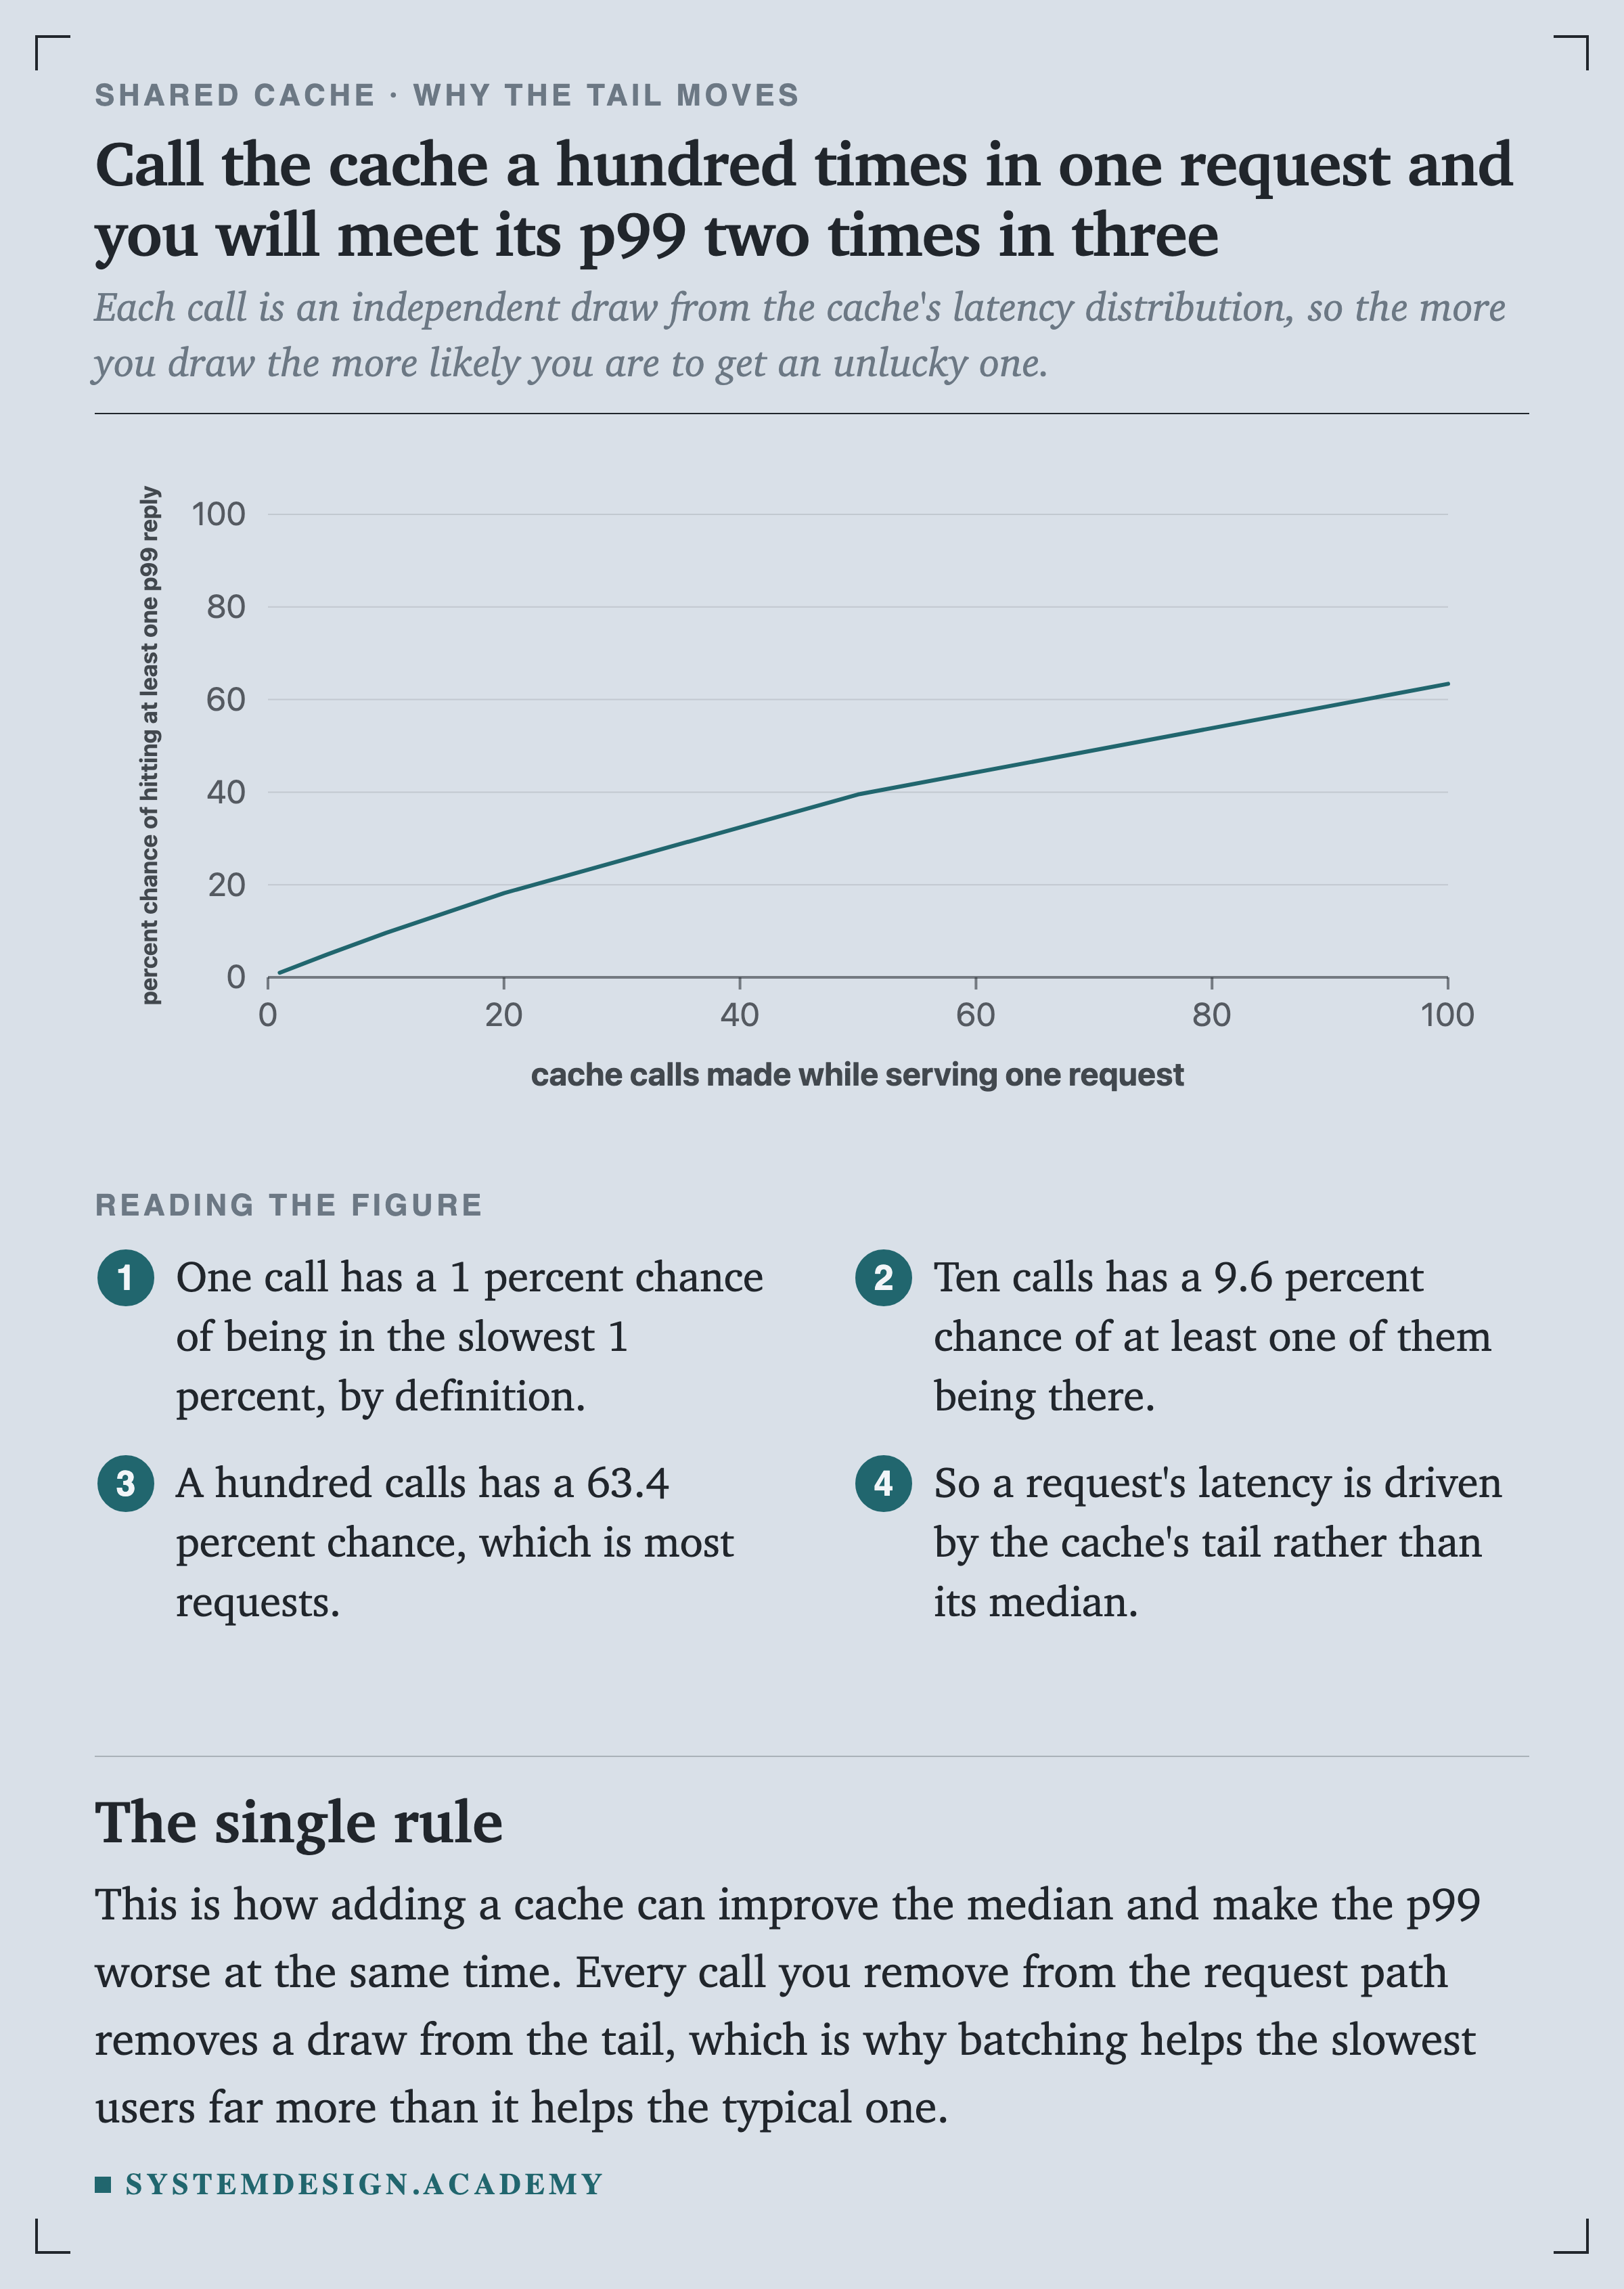
Each call is an independent draw from the cache's distribution. This is how adding a cache can improve the median and make the p99 worse at the same time, and why batching helps the slowest users most.
Redis, Memcached, and One Thread
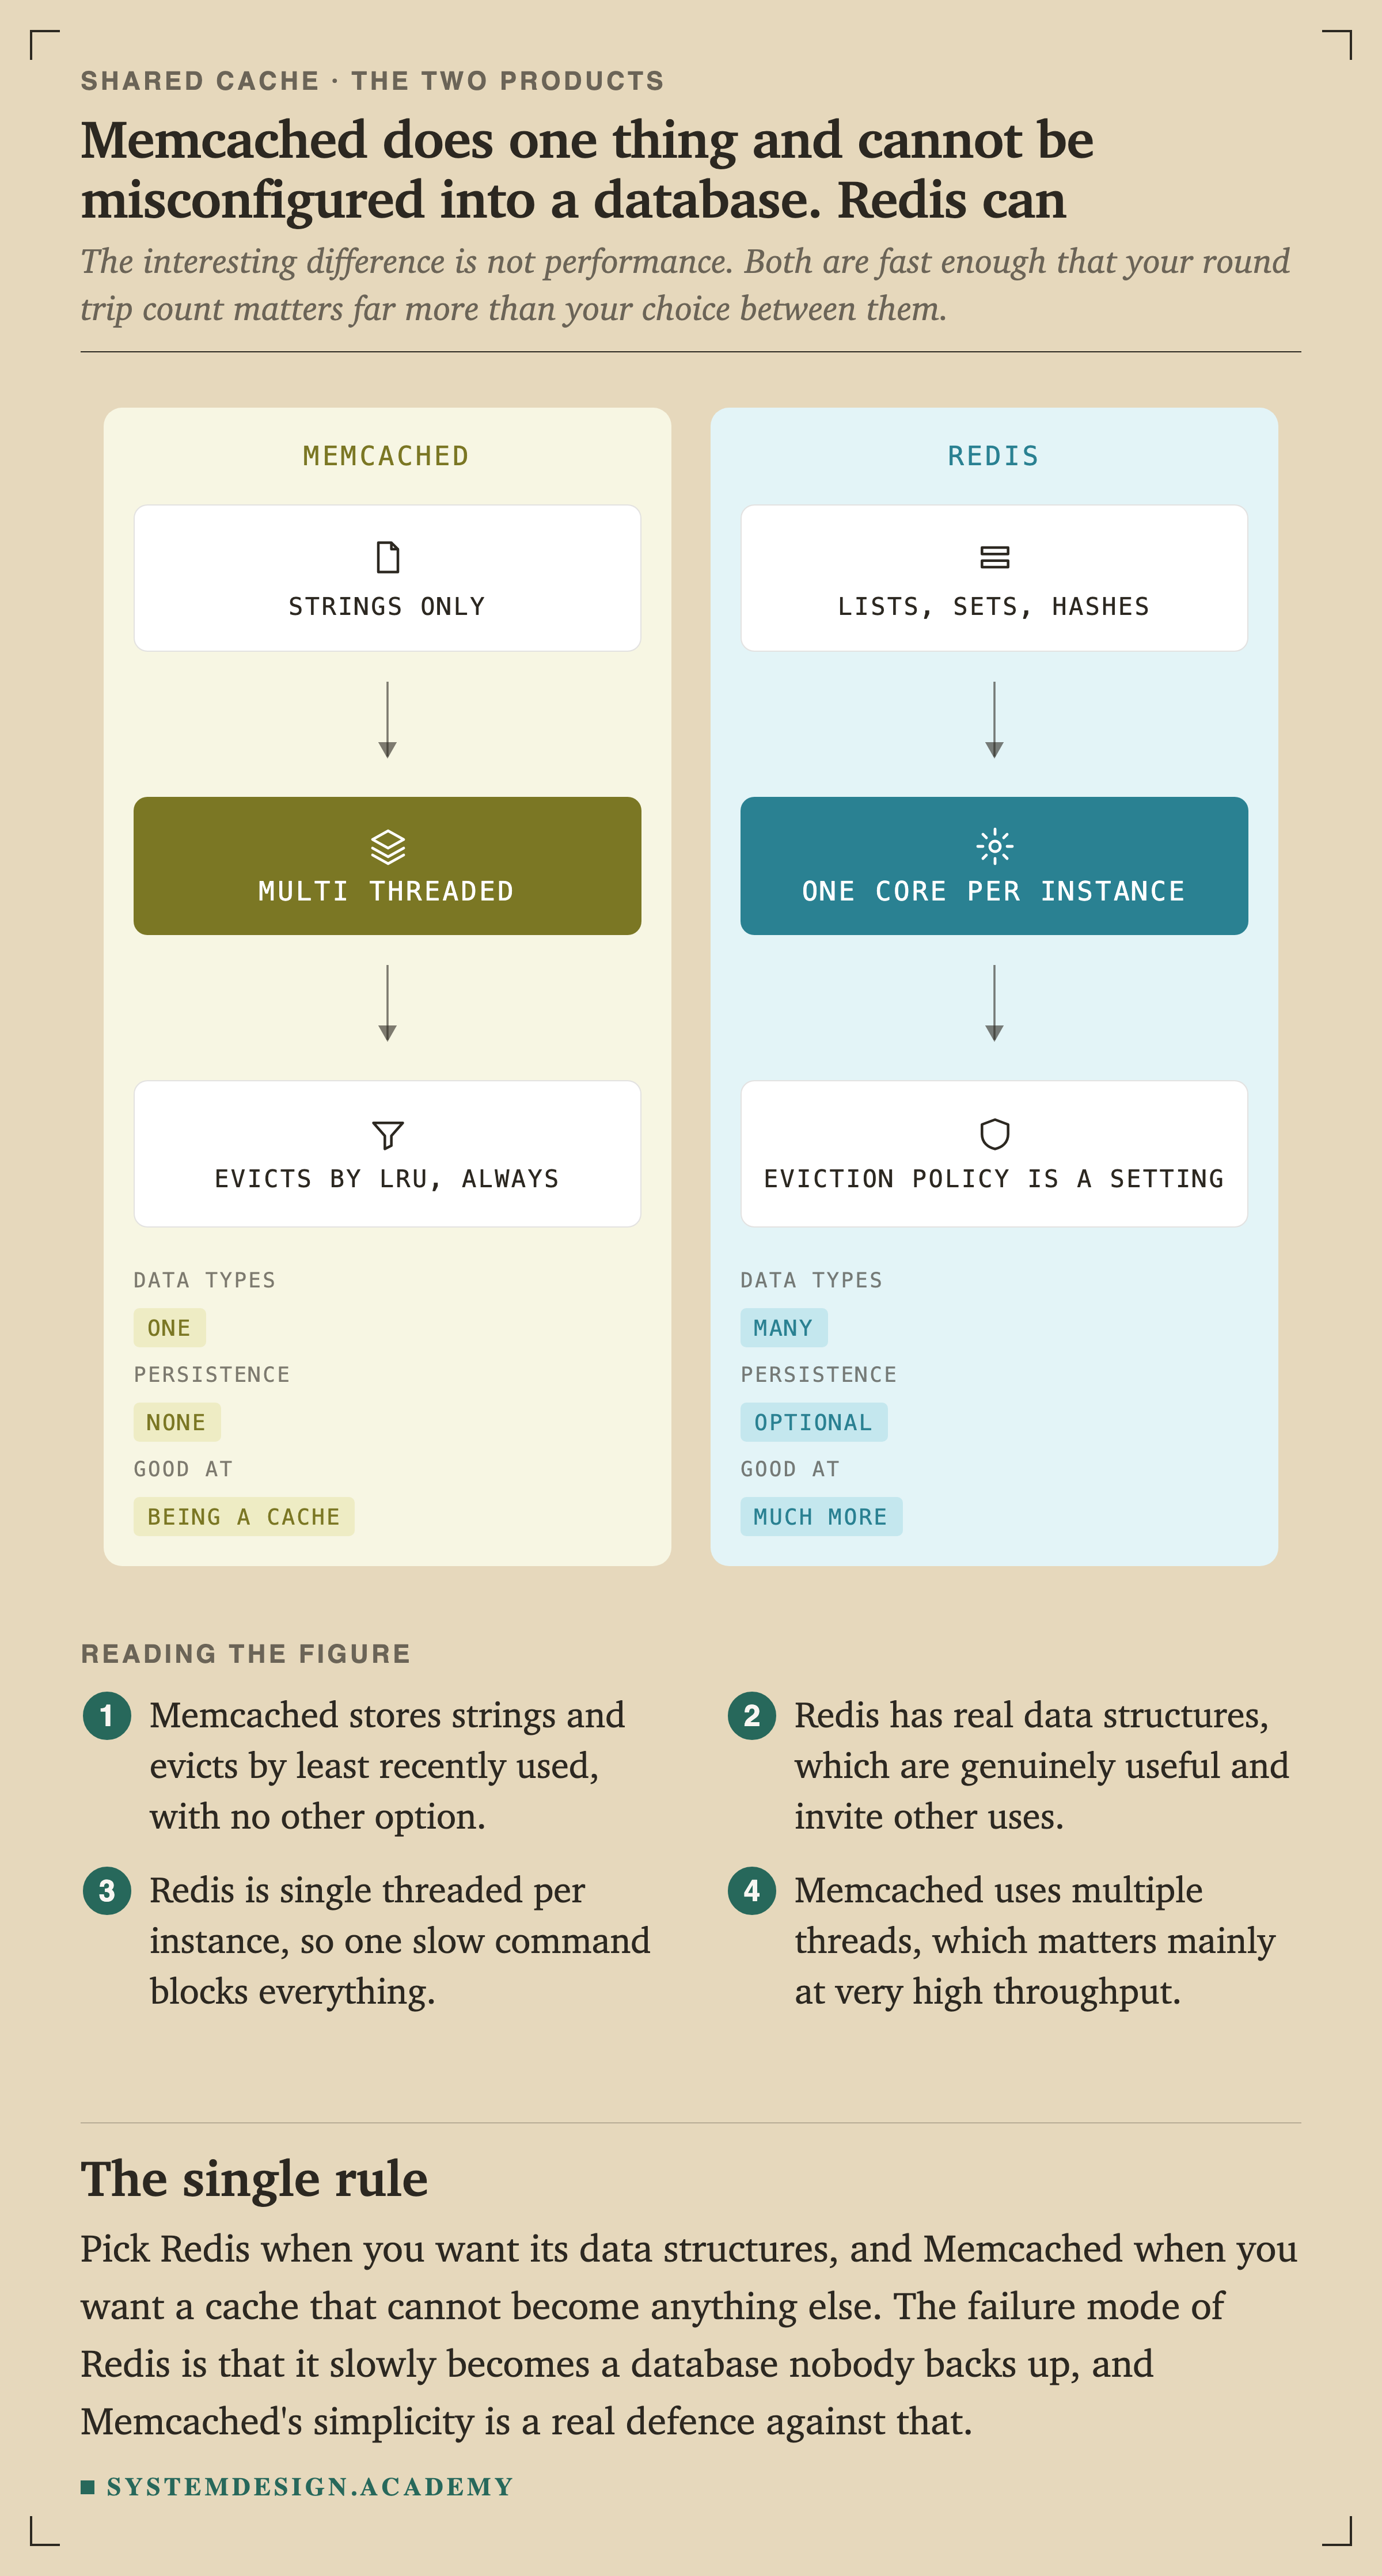
The interesting difference is not performance. Both are fast enough that your round trip count matters far more than your choice between them. The failure mode of is that it slowly becomes a database nobody backs up.
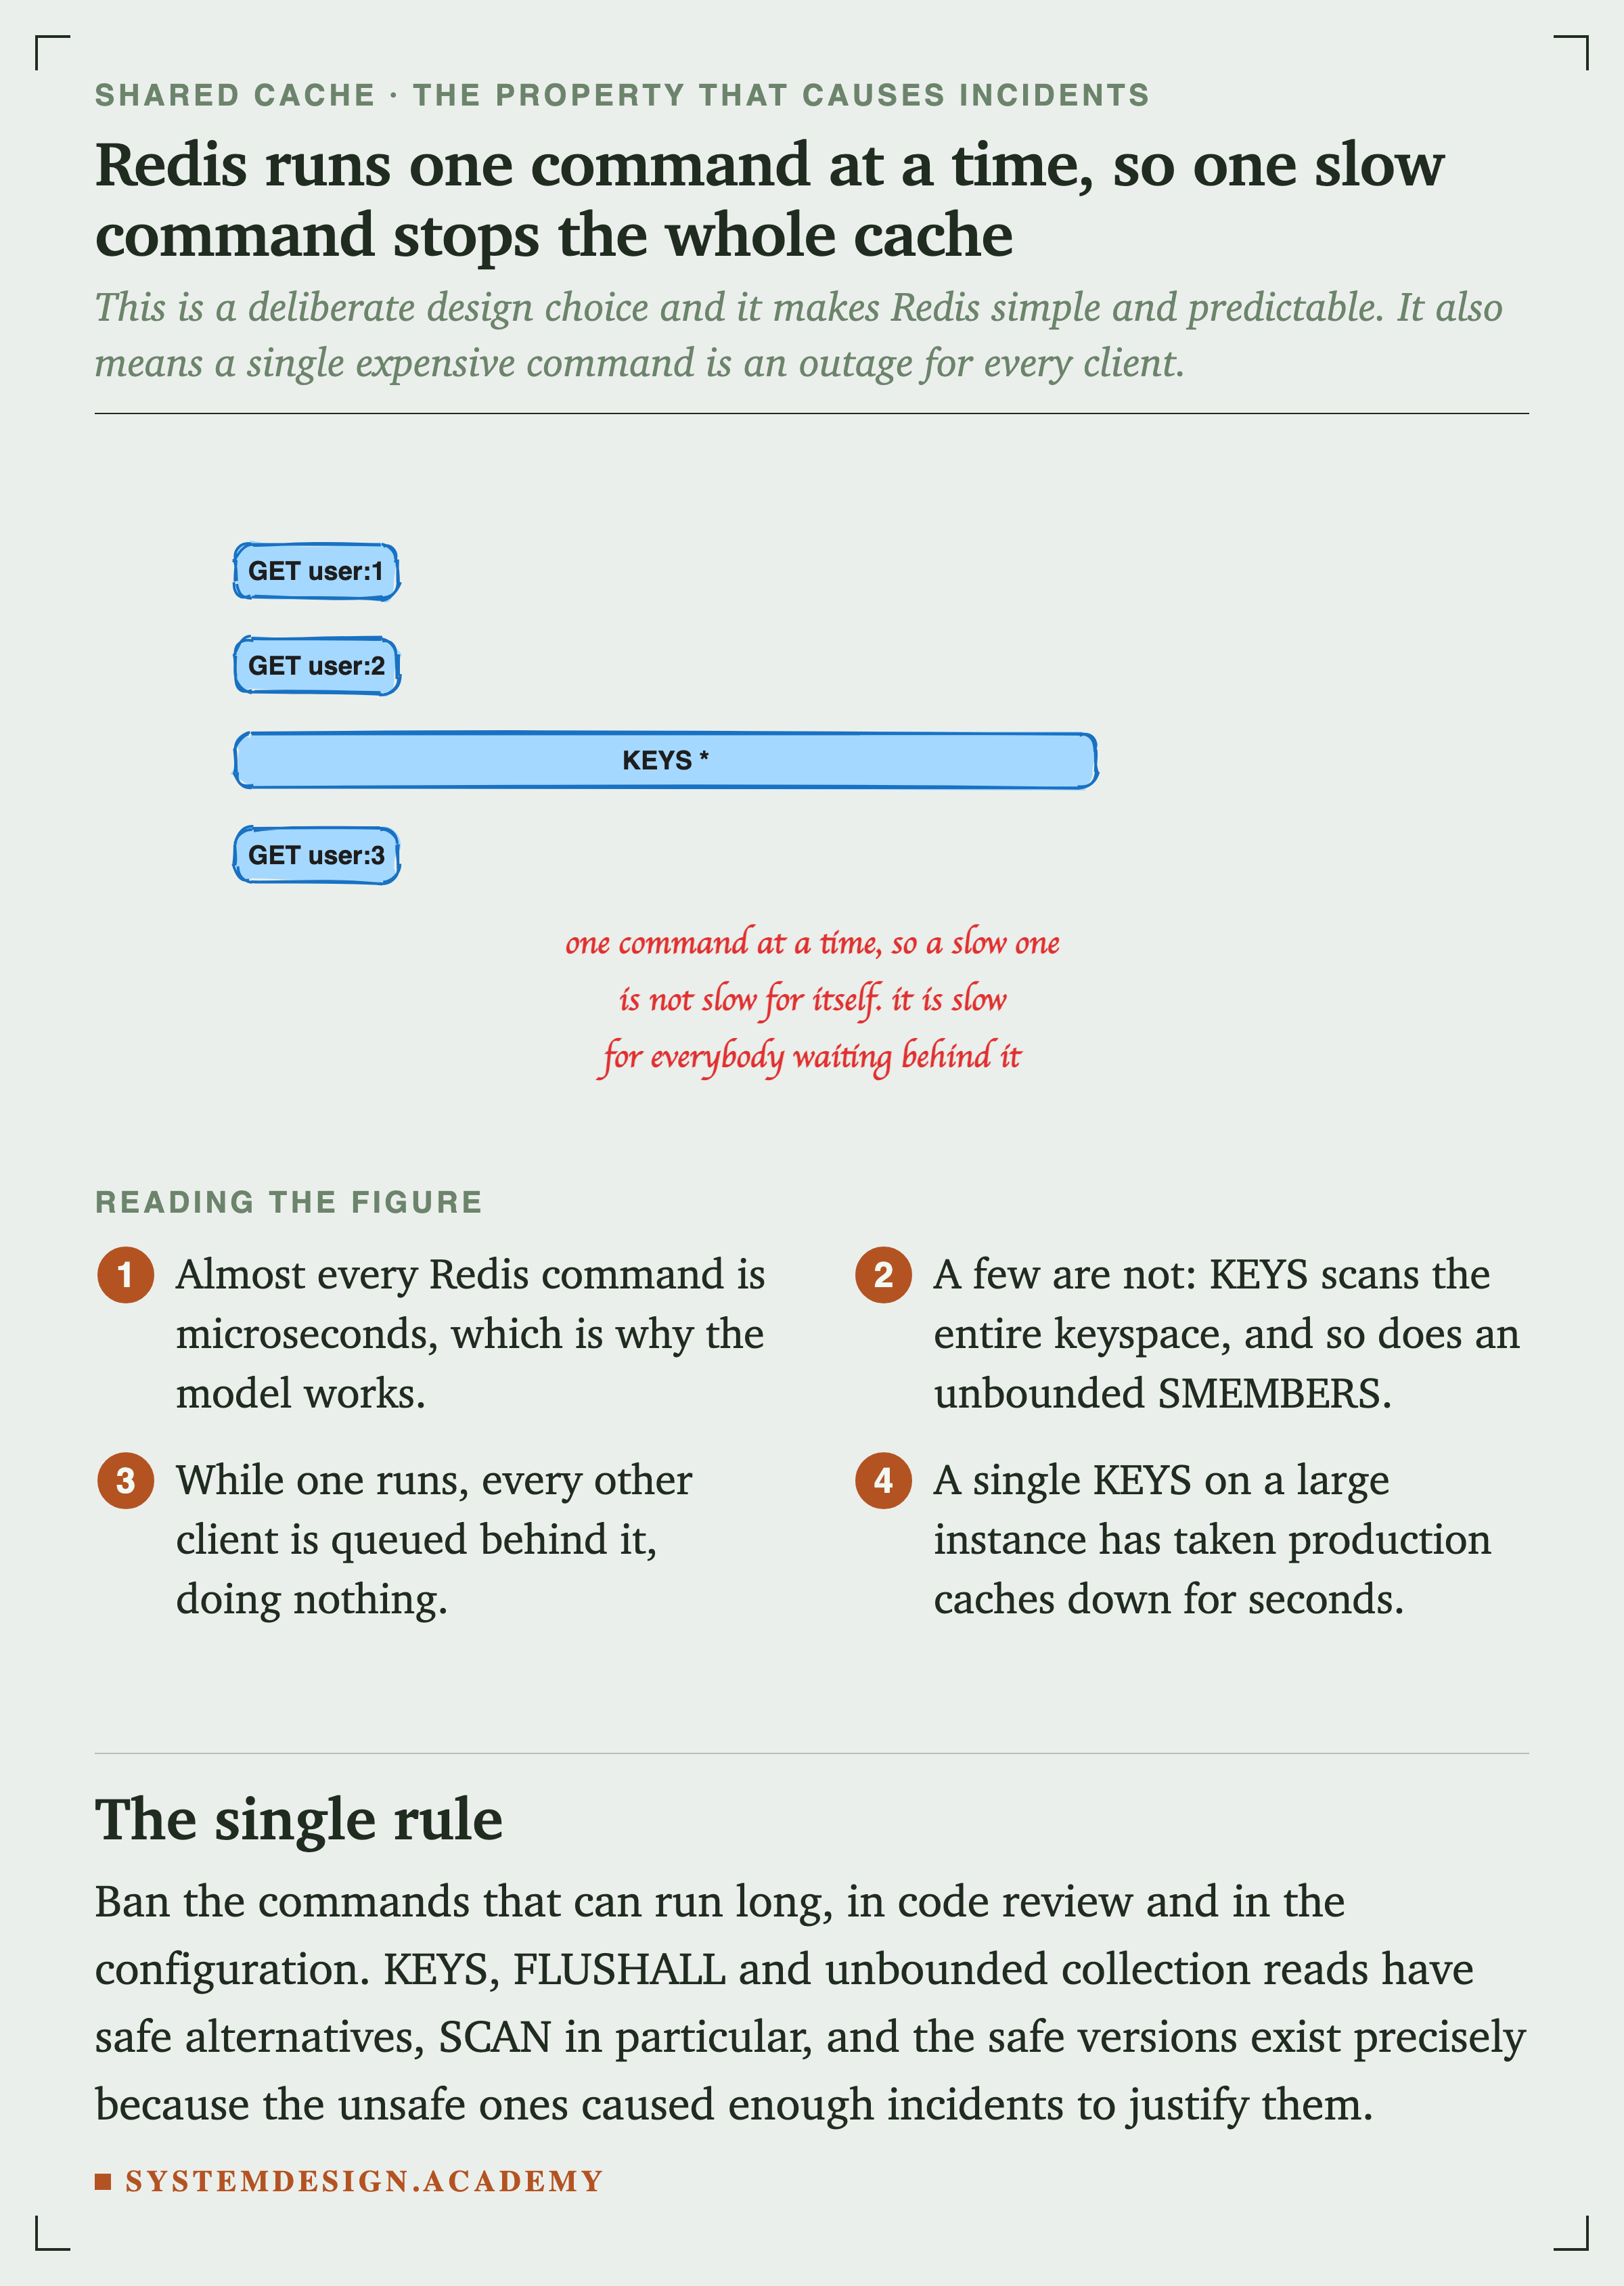
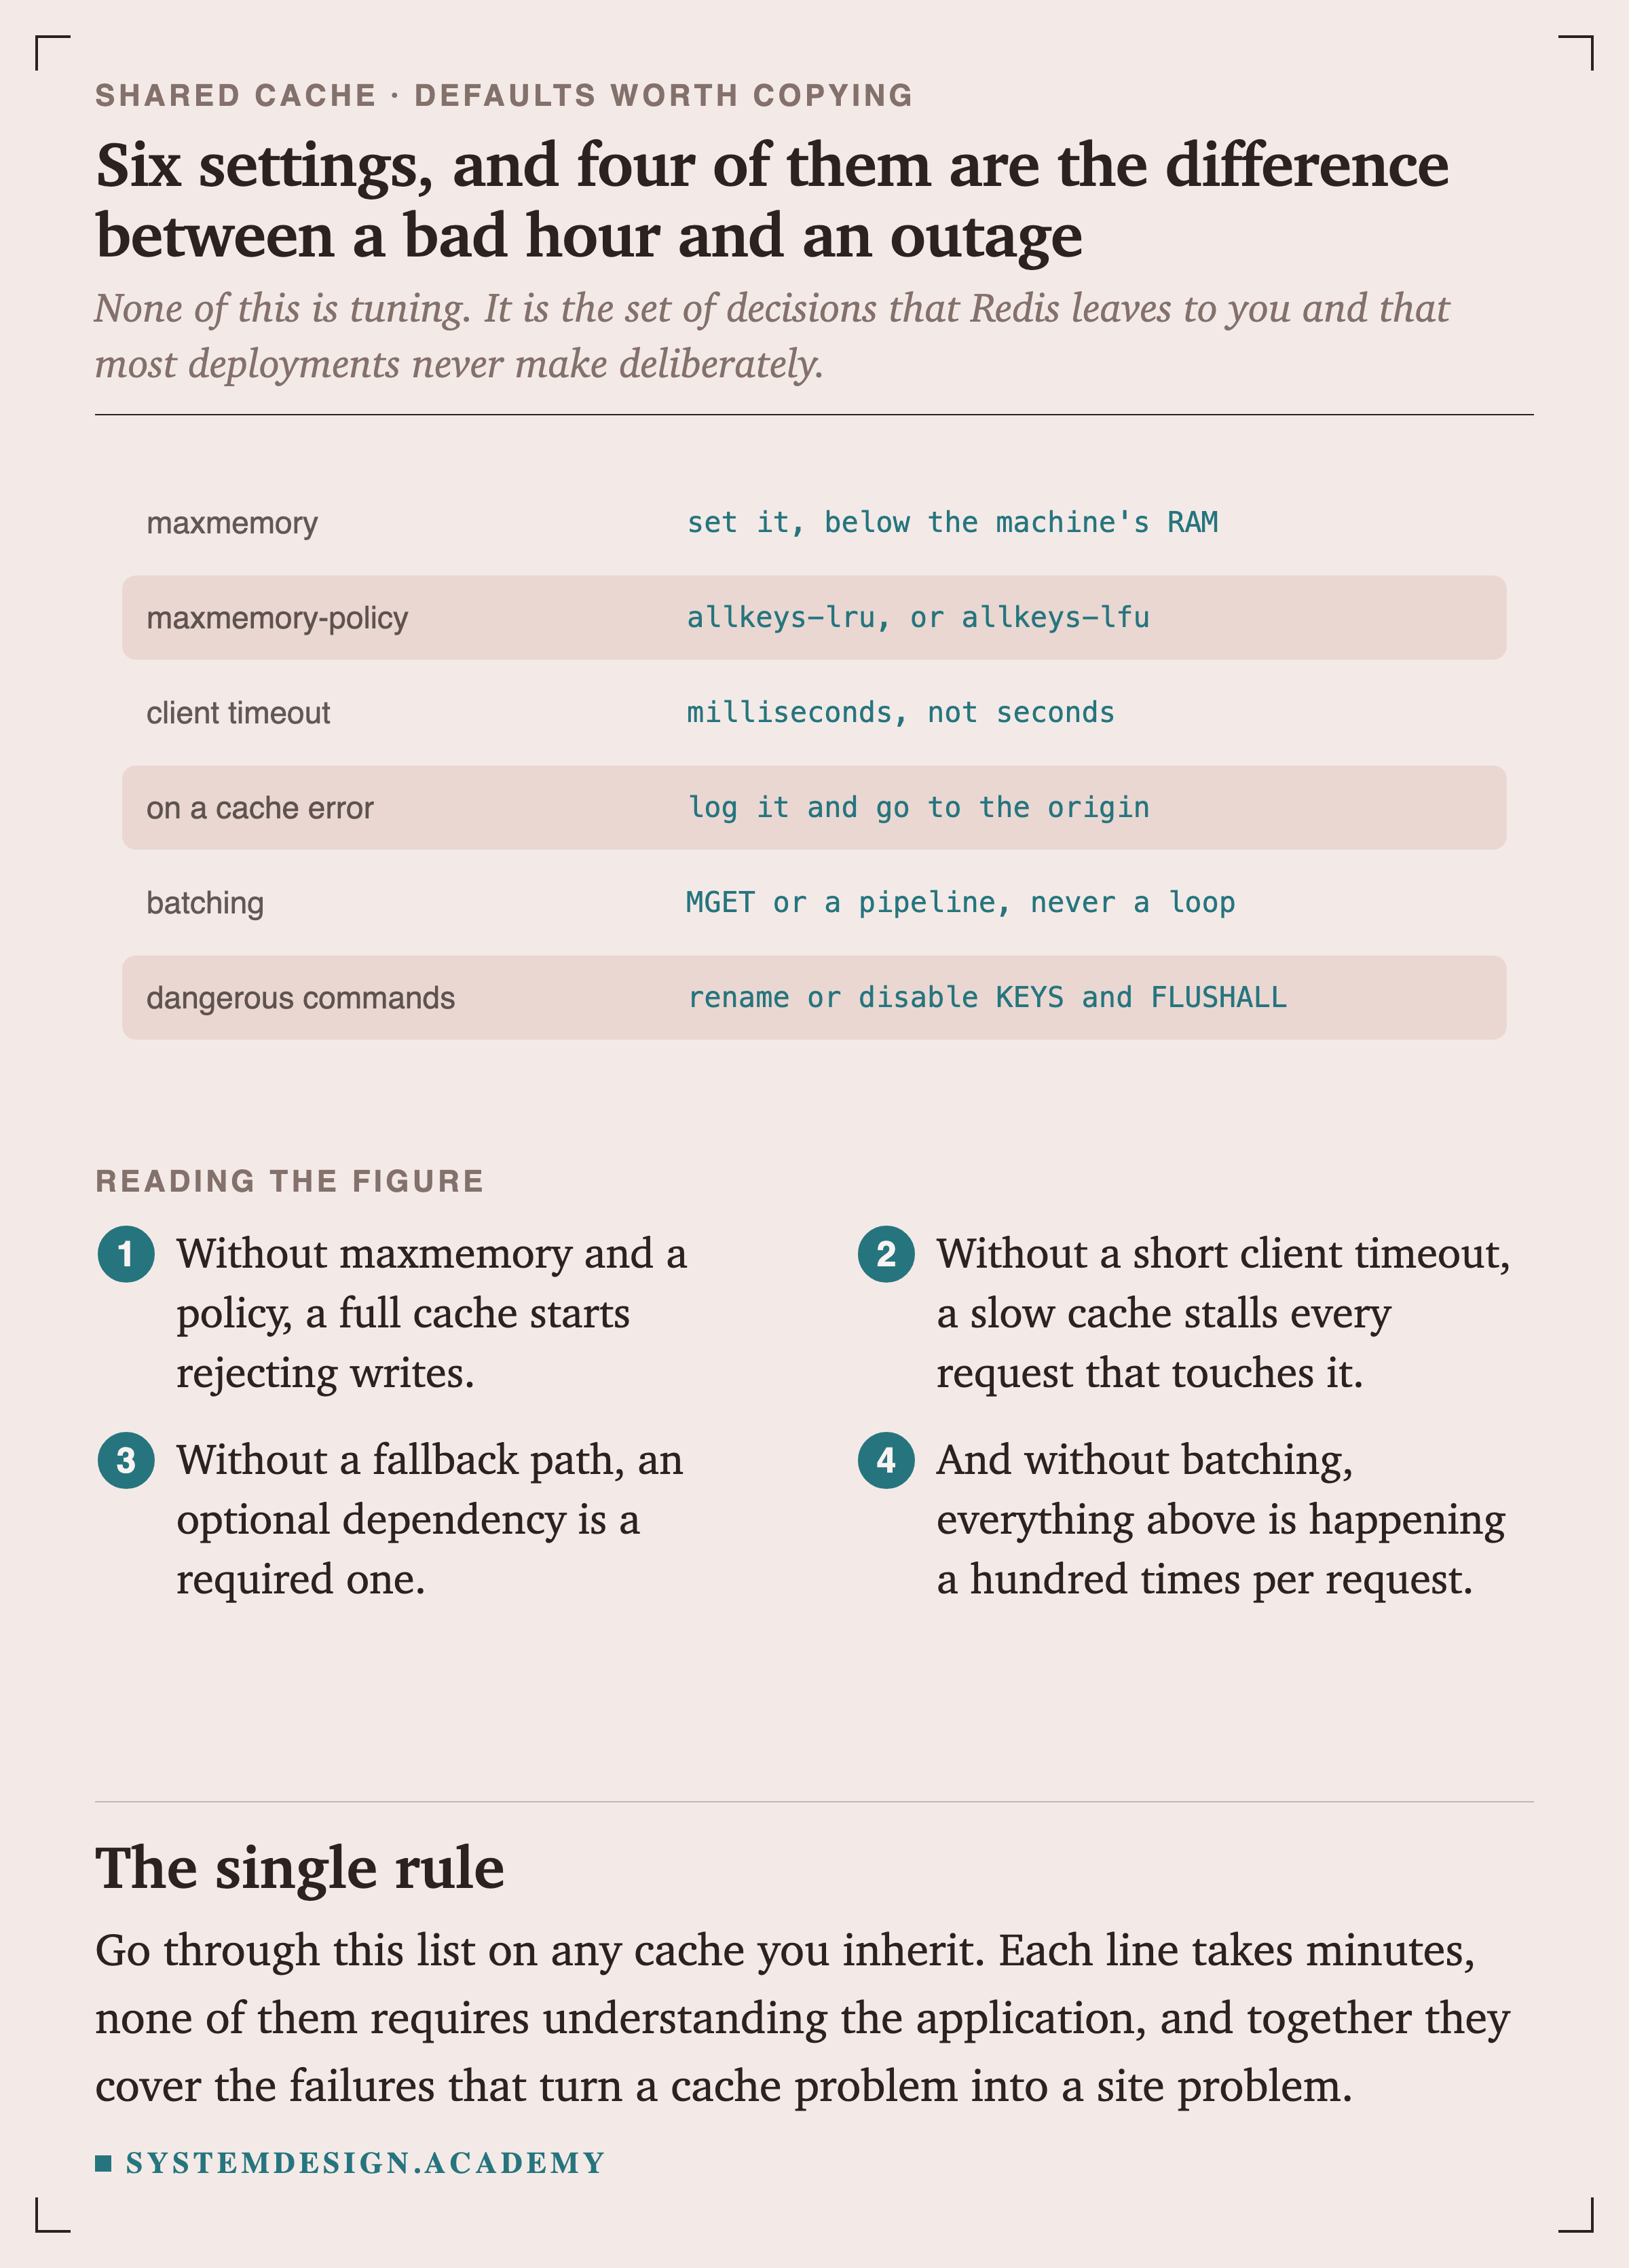
Almost every Redis command is microseconds, which is why the model works. A few are not: KEYS scans the entire keyspace. A single KEYS on a large instance has taken production caches down for seconds.
Sharding, Hot Keys and Failure
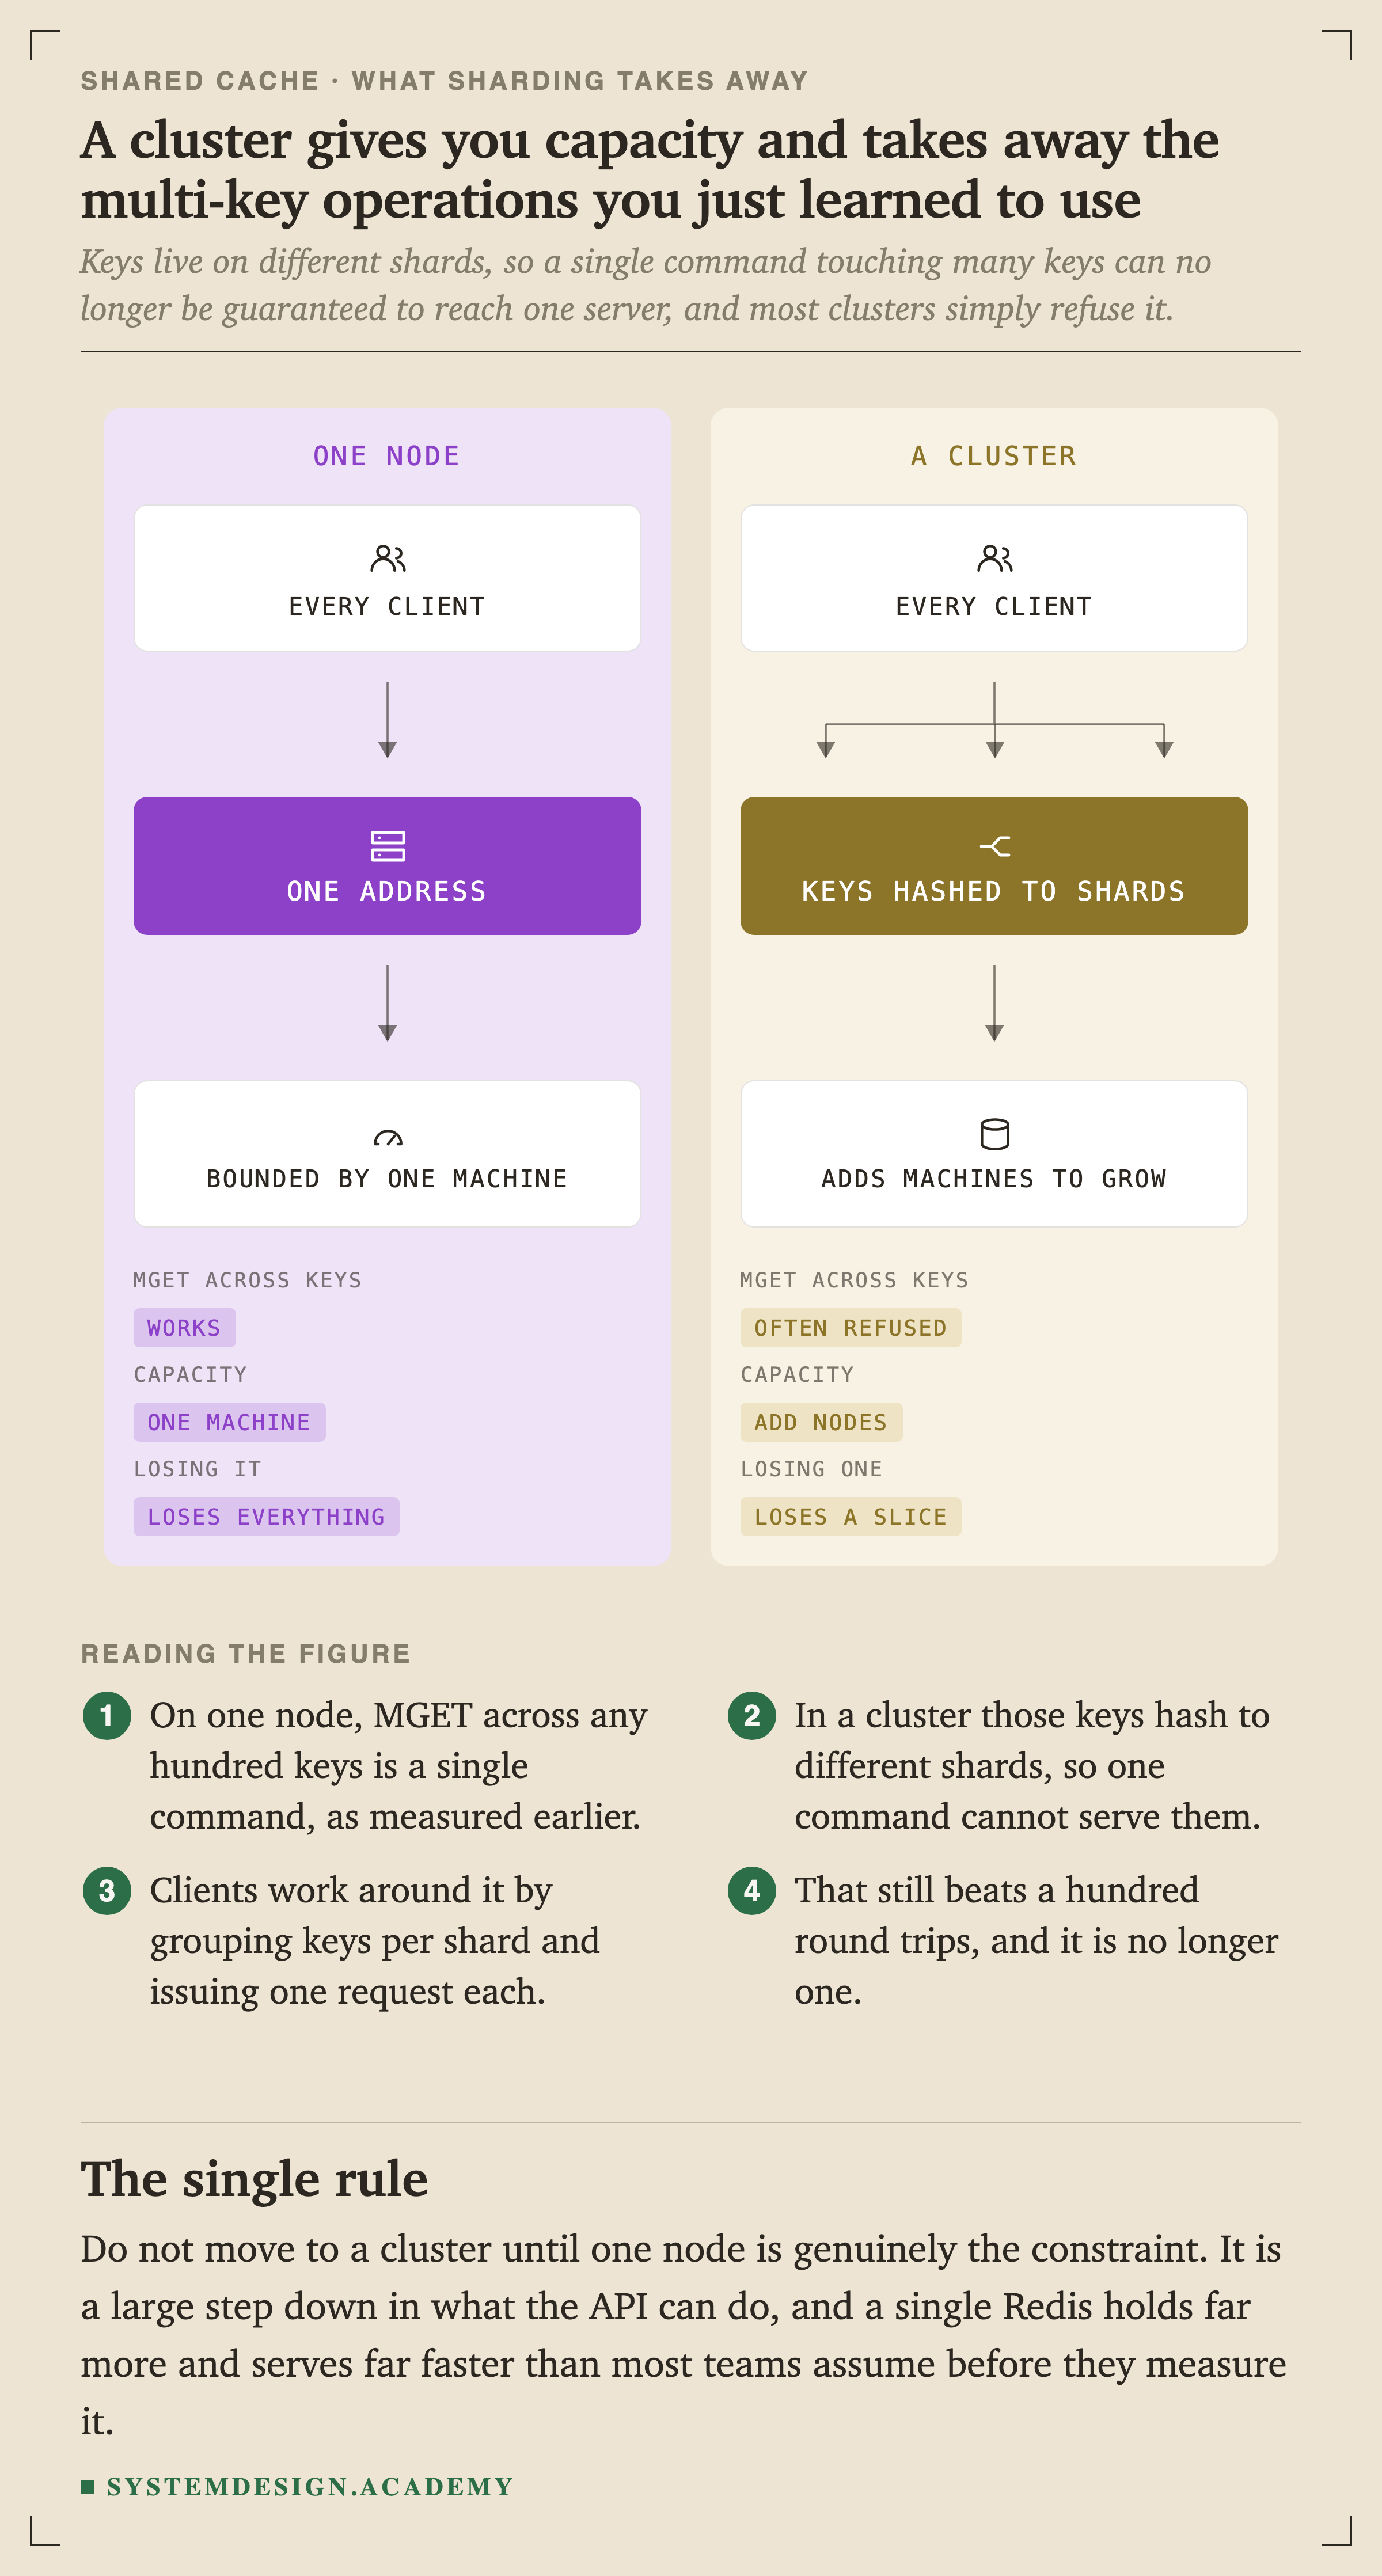
Keys live on different shards, so a single command touching many keys cannot be guaranteed to reach one server. Do not move to a cluster until one node is genuinely the constraint.
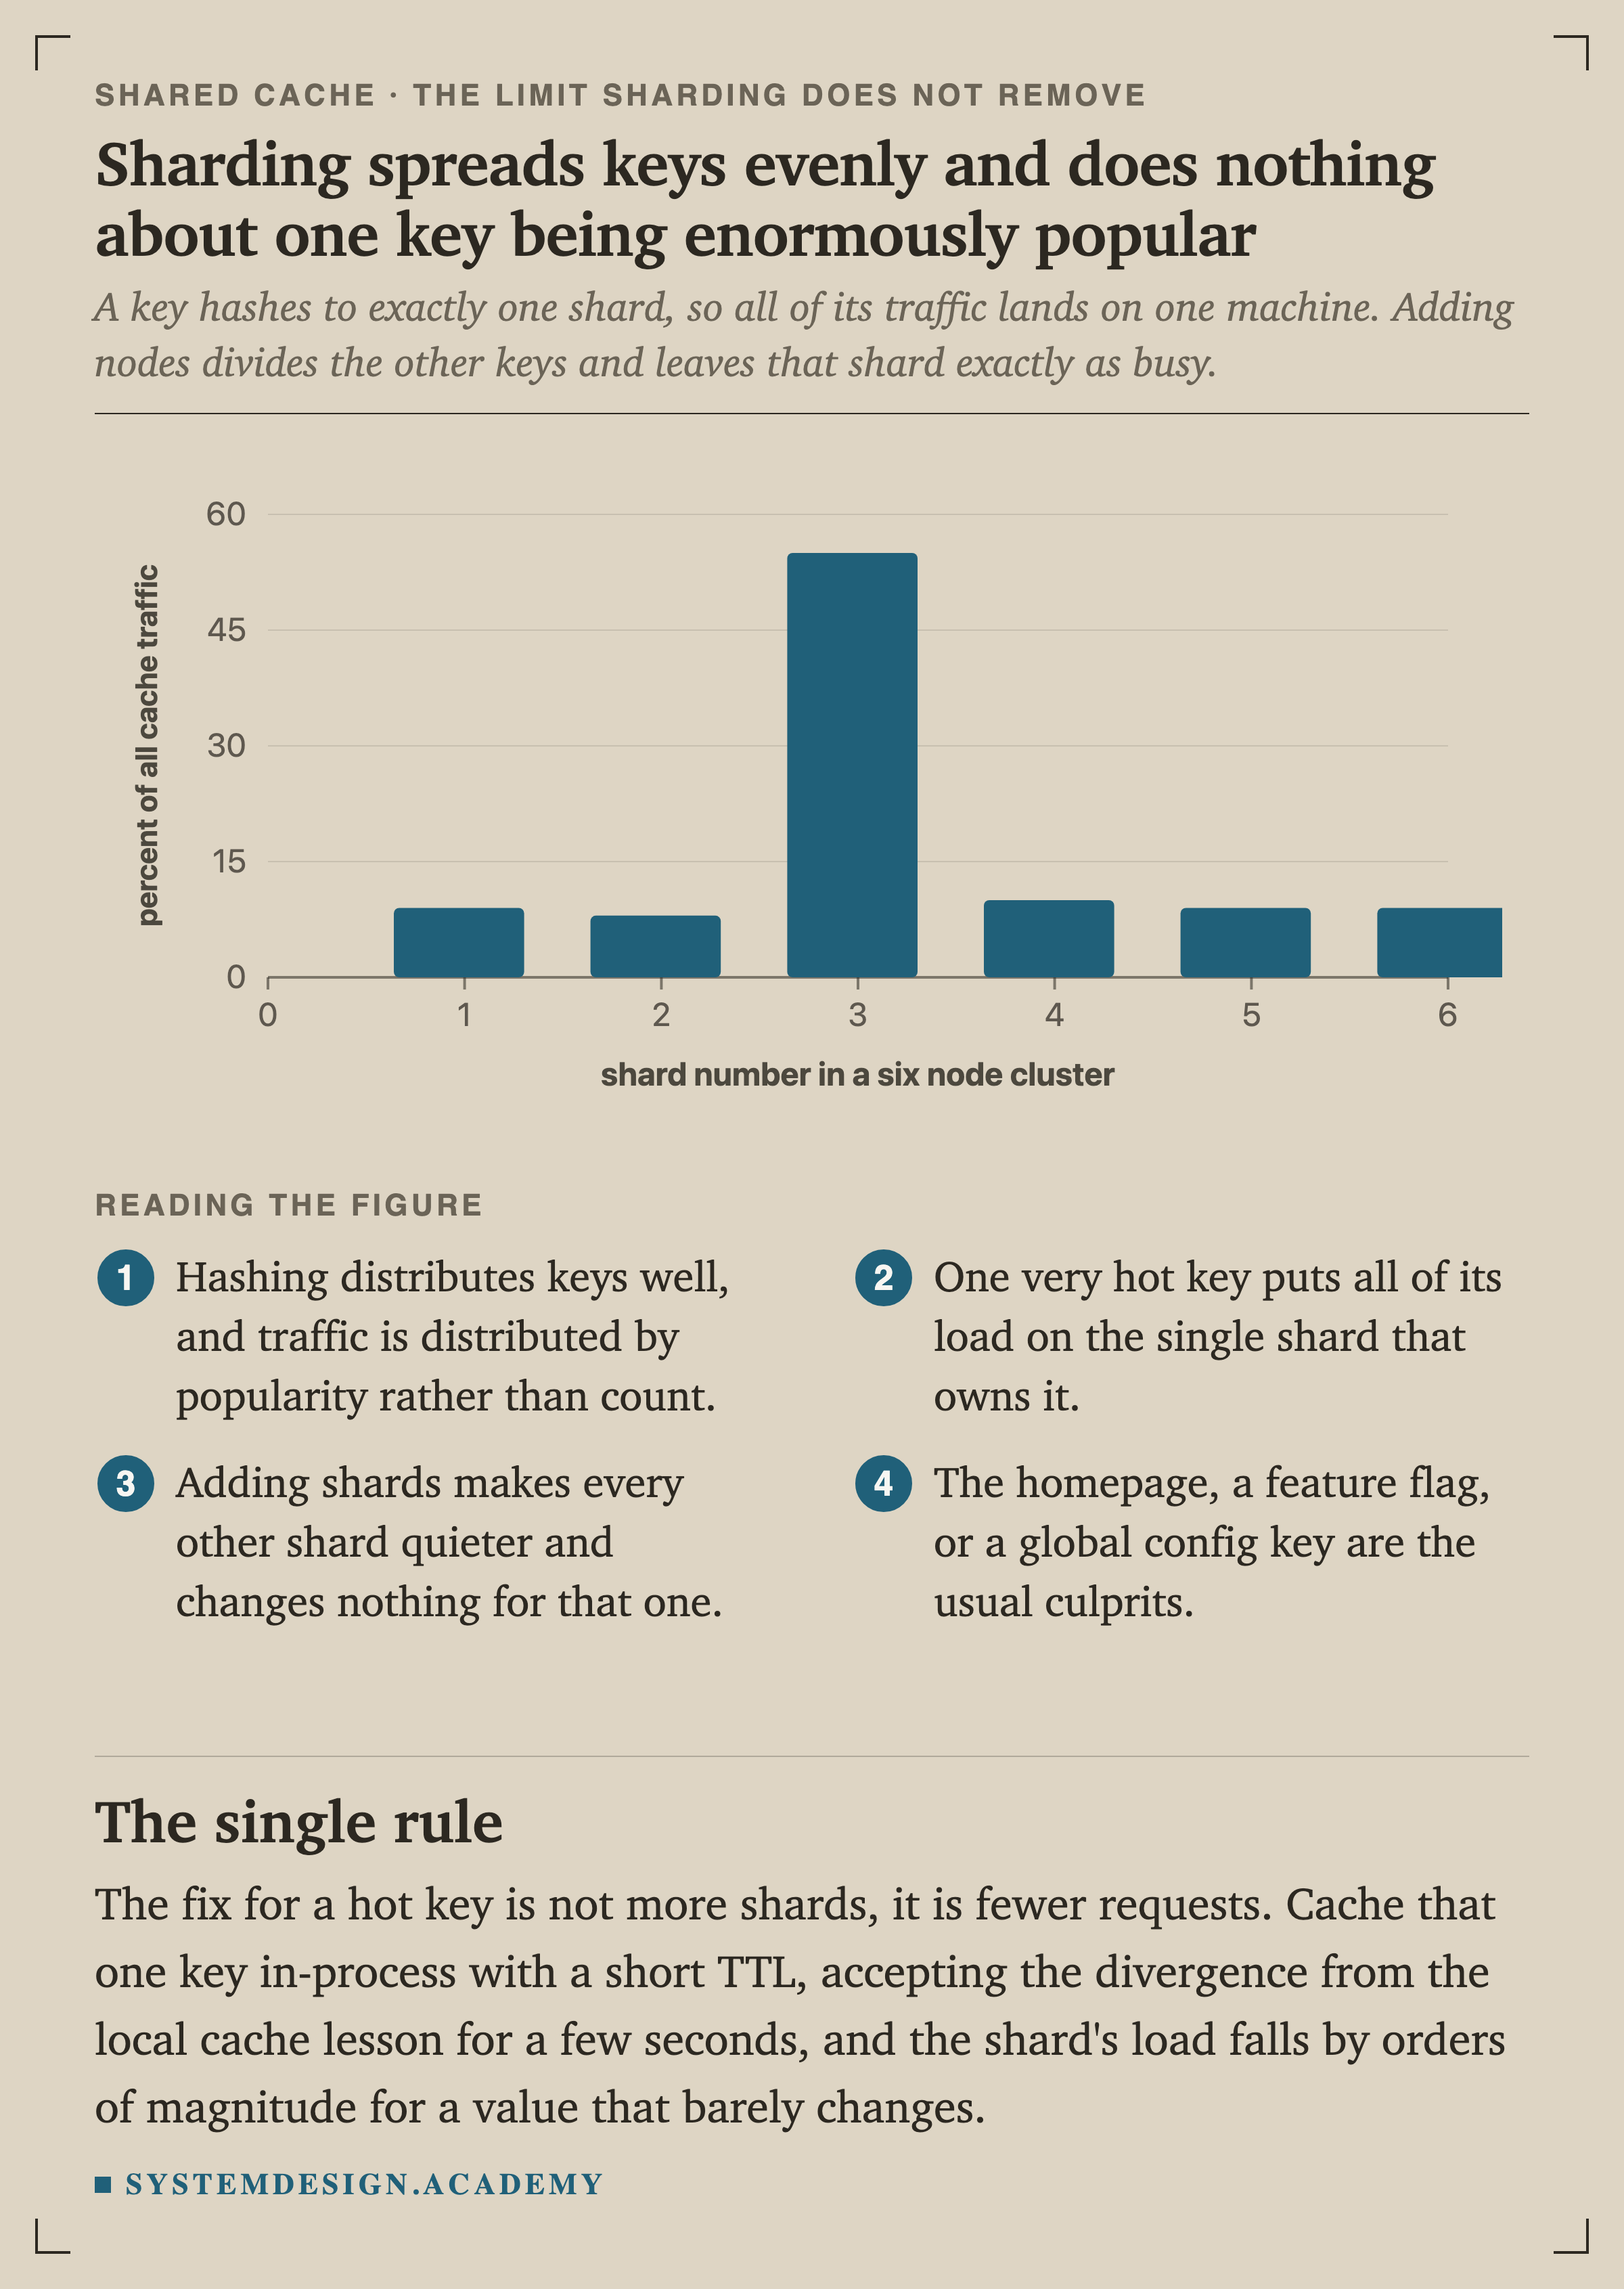
A key hashes to exactly one shard, so all of its traffic lands on one machine. The fix is not more shards, it is fewer requests: cache that one key in-process with a short and the shard's load falls by orders of magnitude.
What to Store, What to Watch
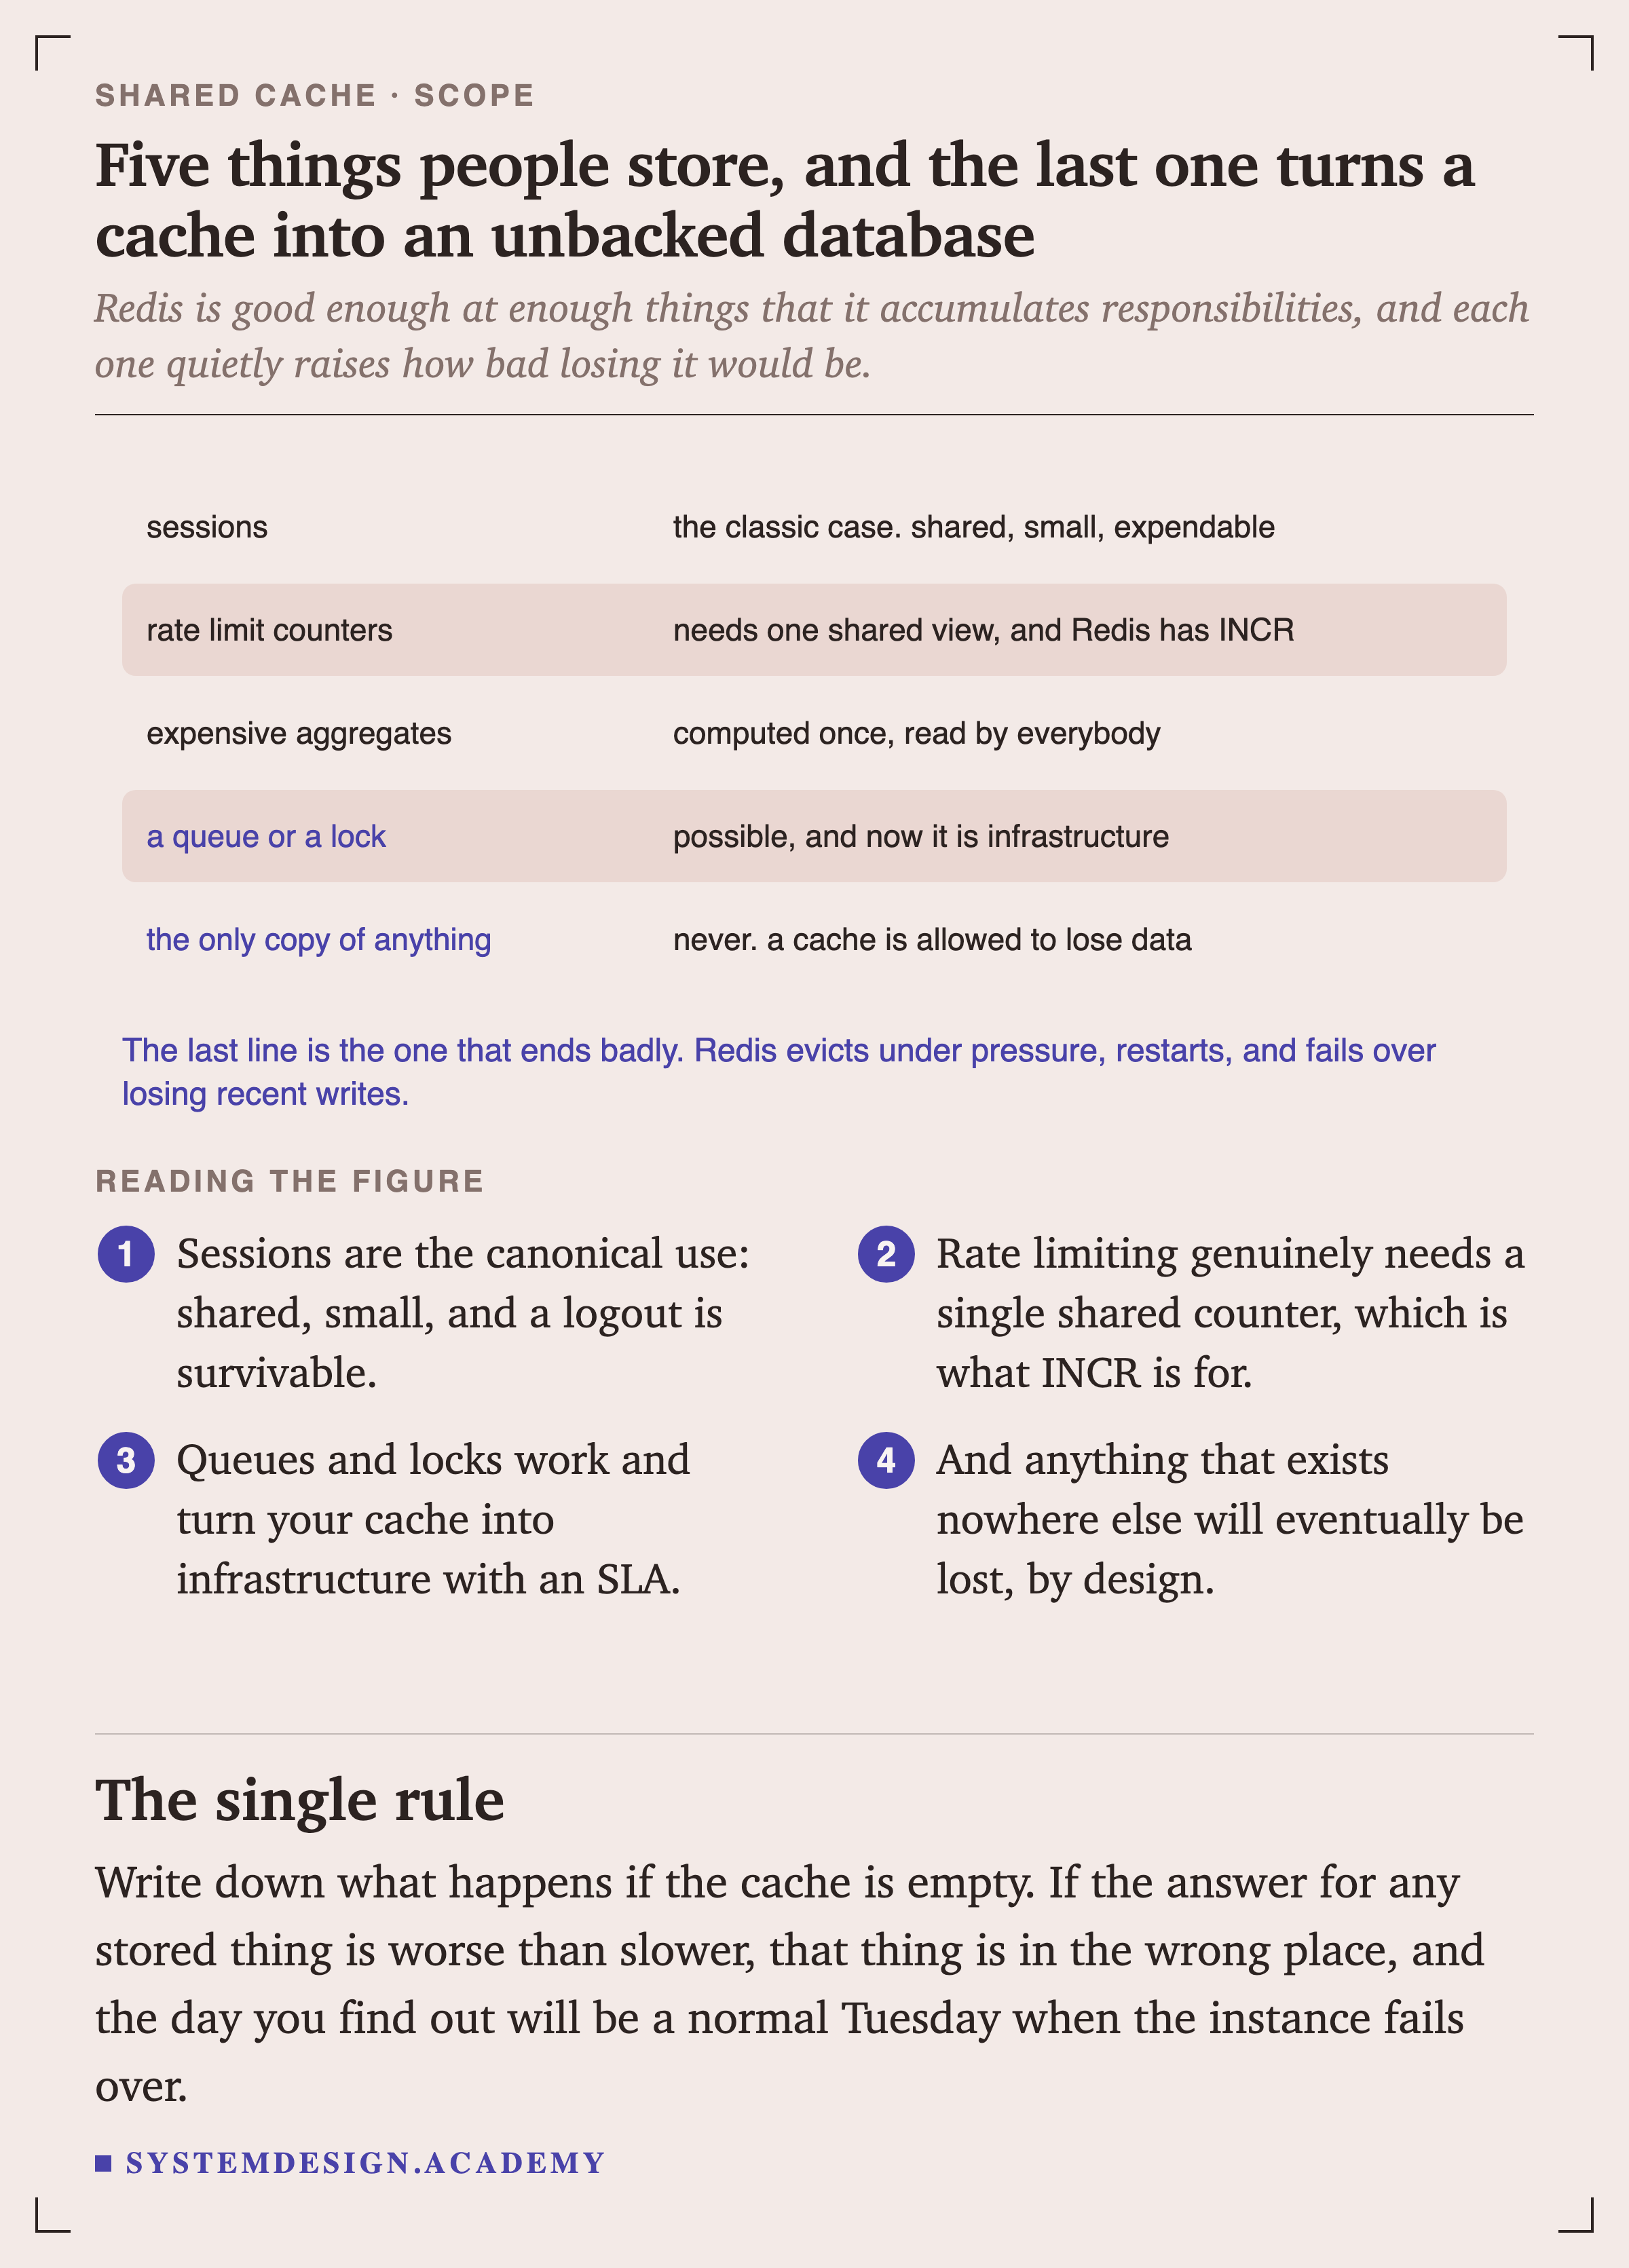
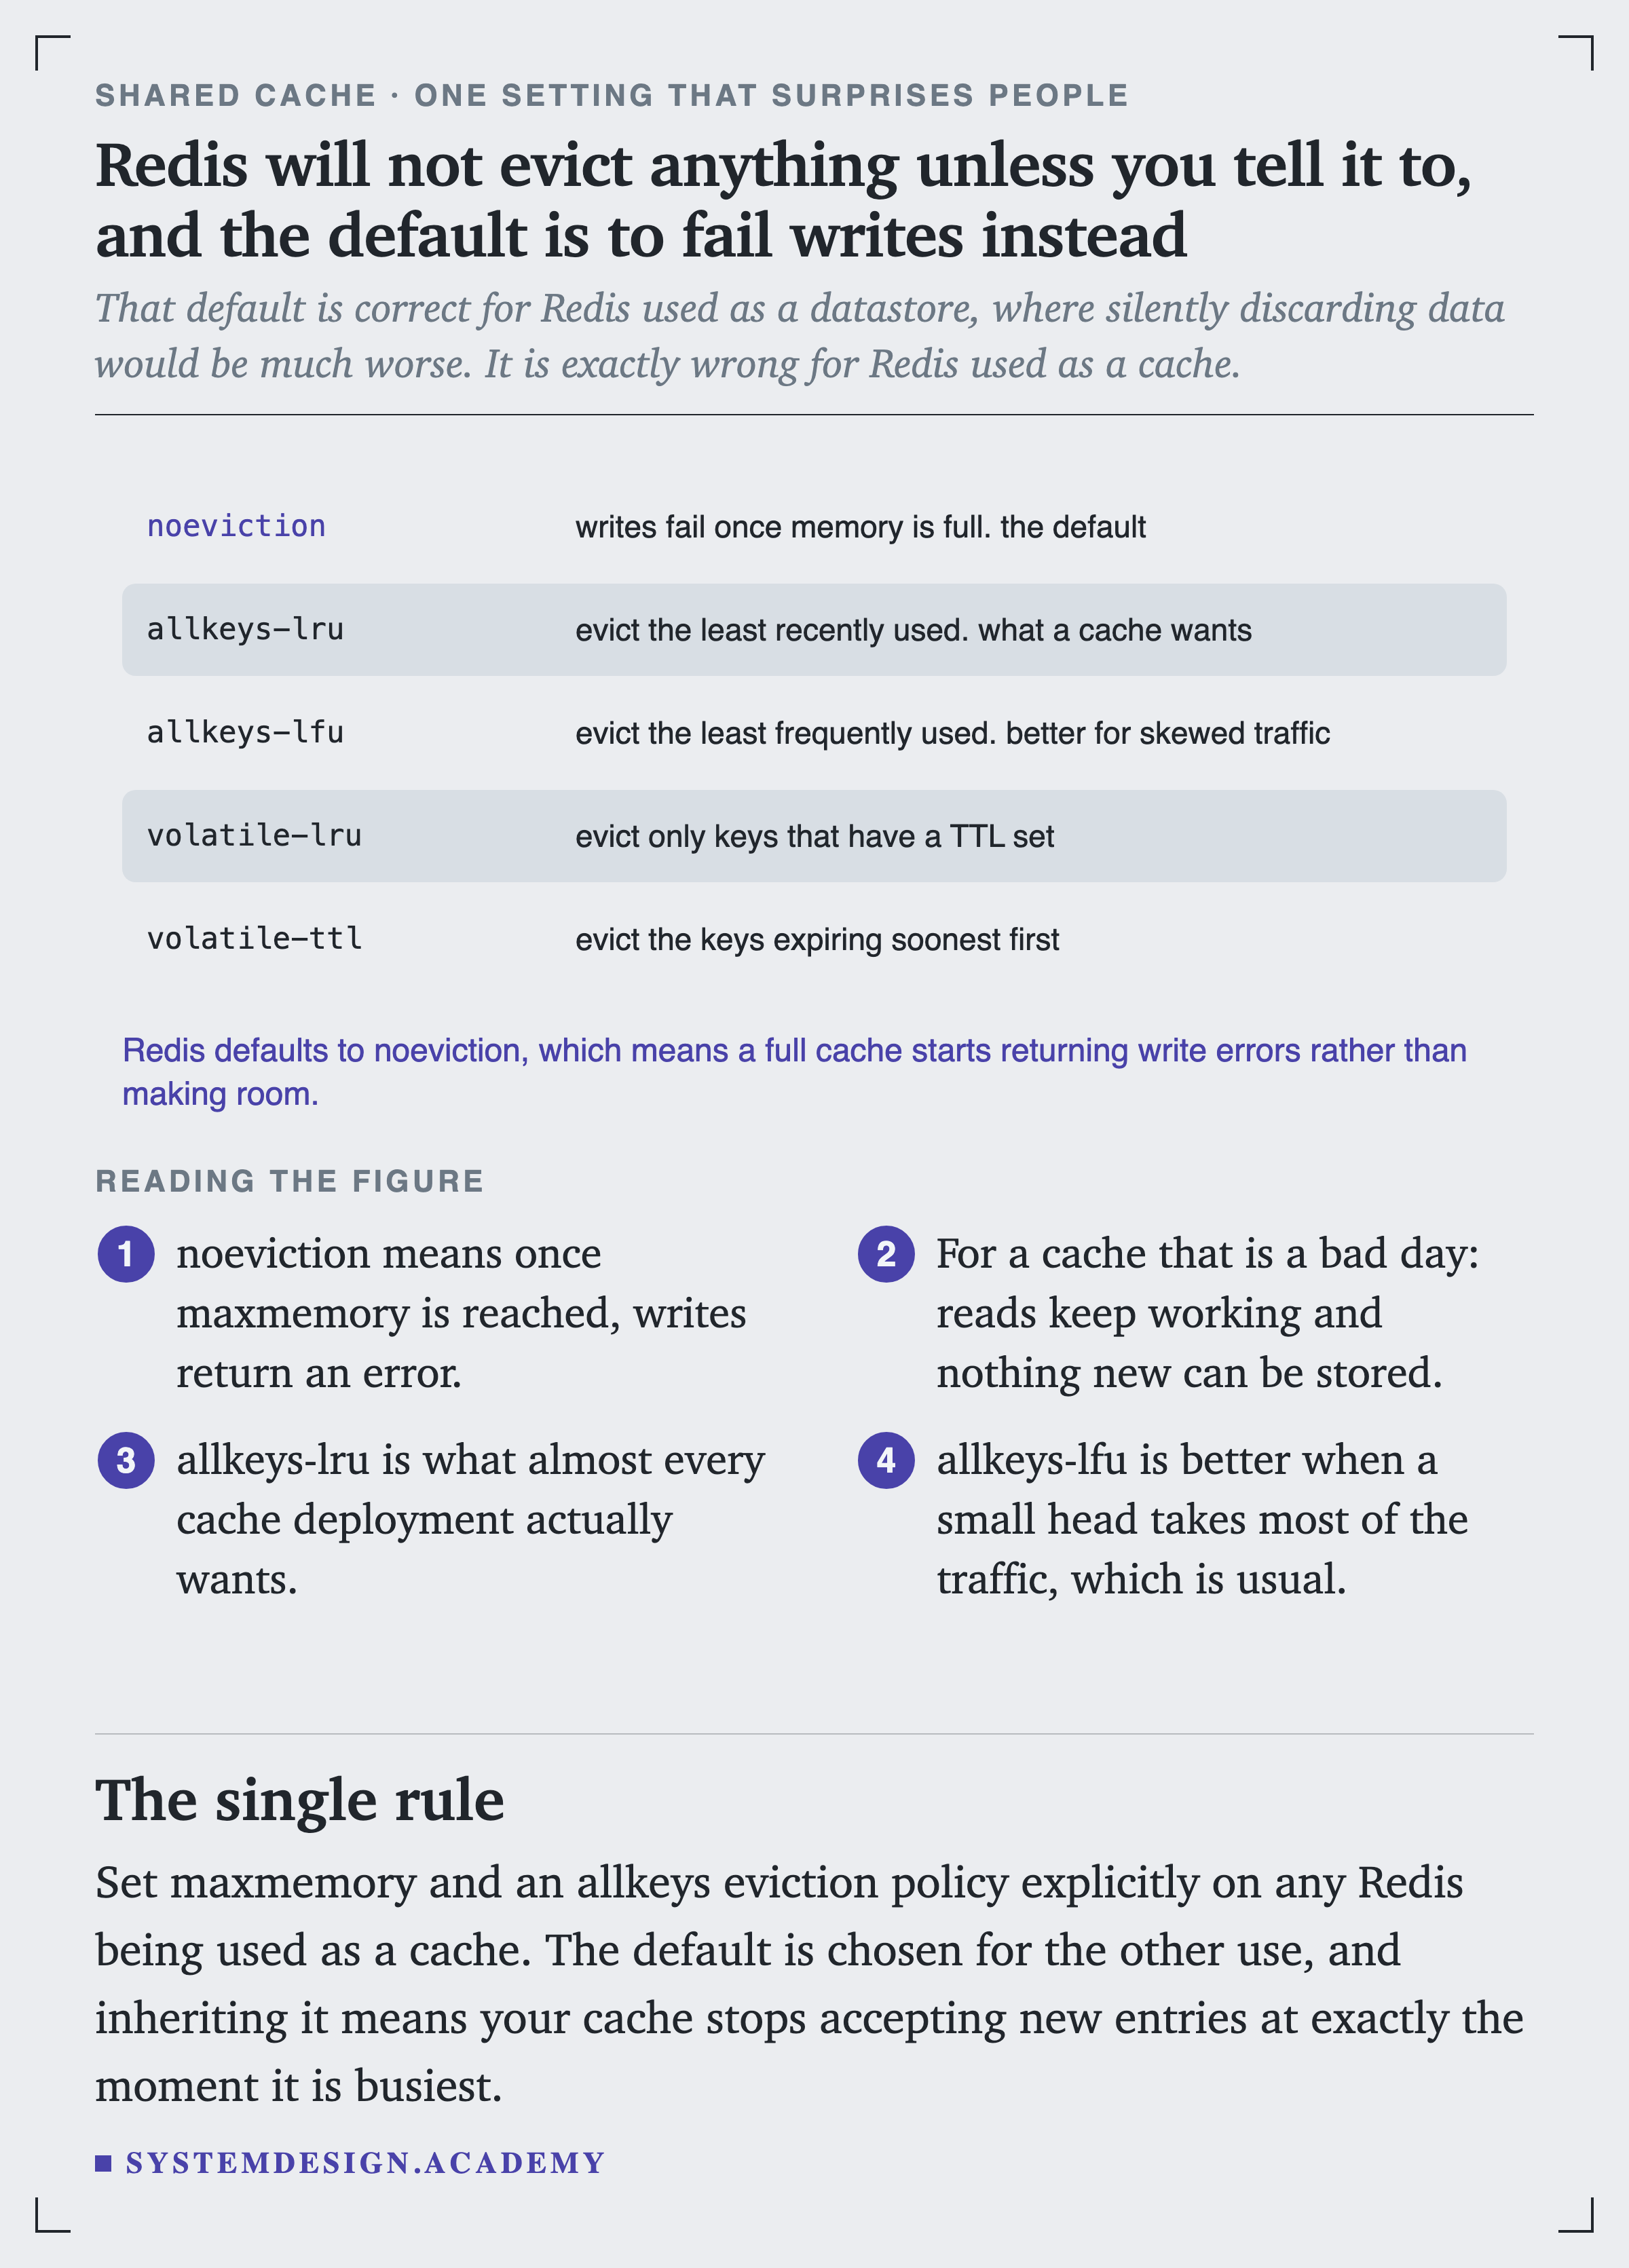
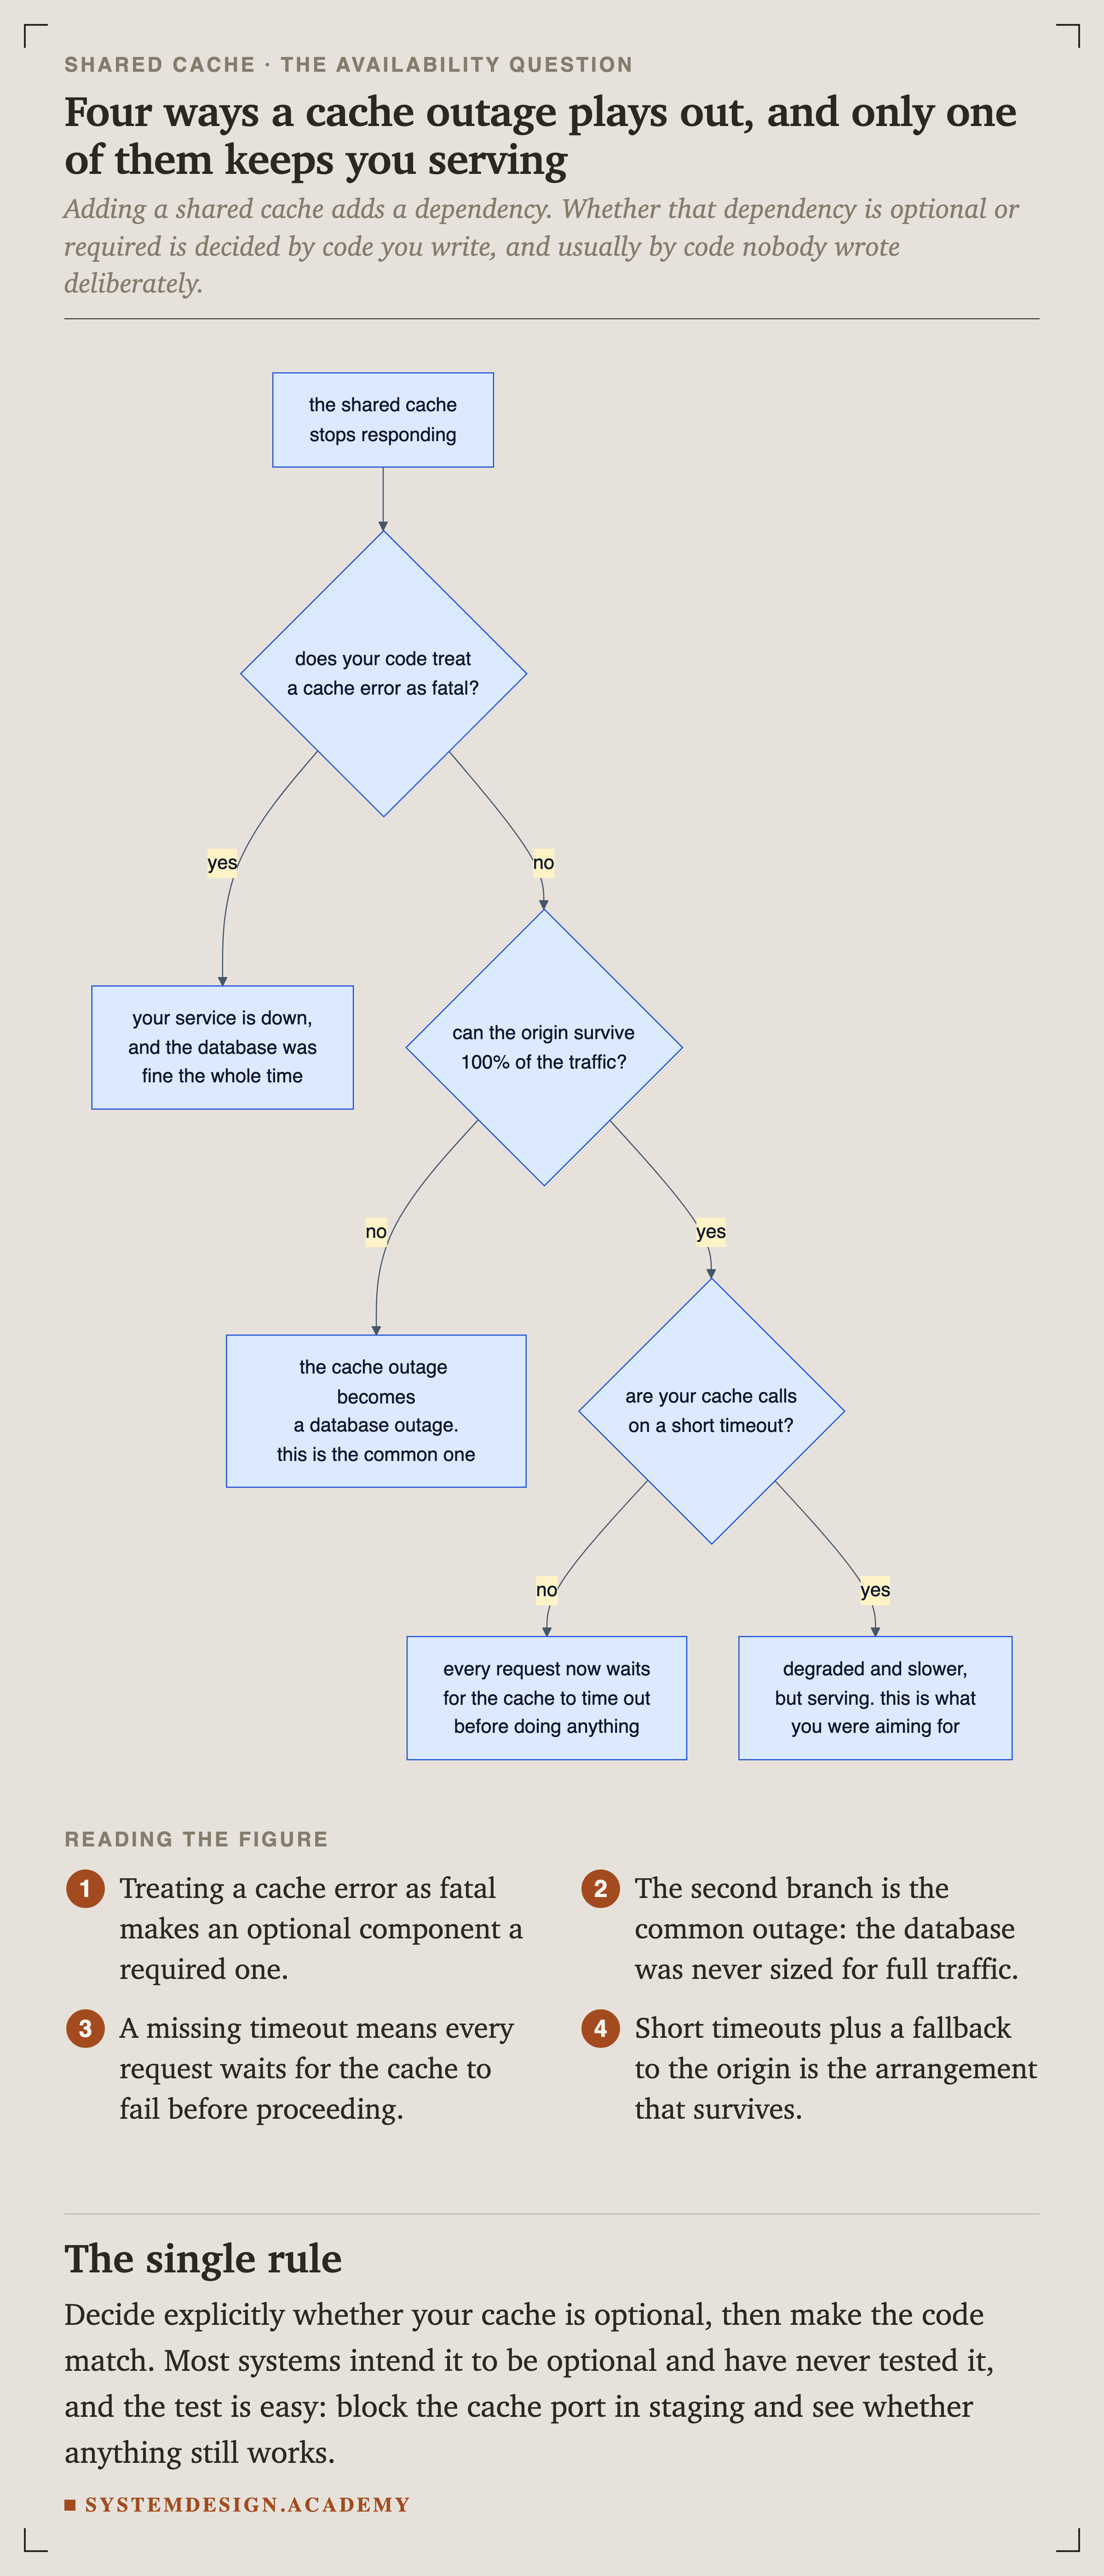
Write down what happens if the cache is empty. If the answer for any stored thing is worse than slower, that thing is in the wrong place, and the day you find out will be a normal Tuesday when the instance fails over.
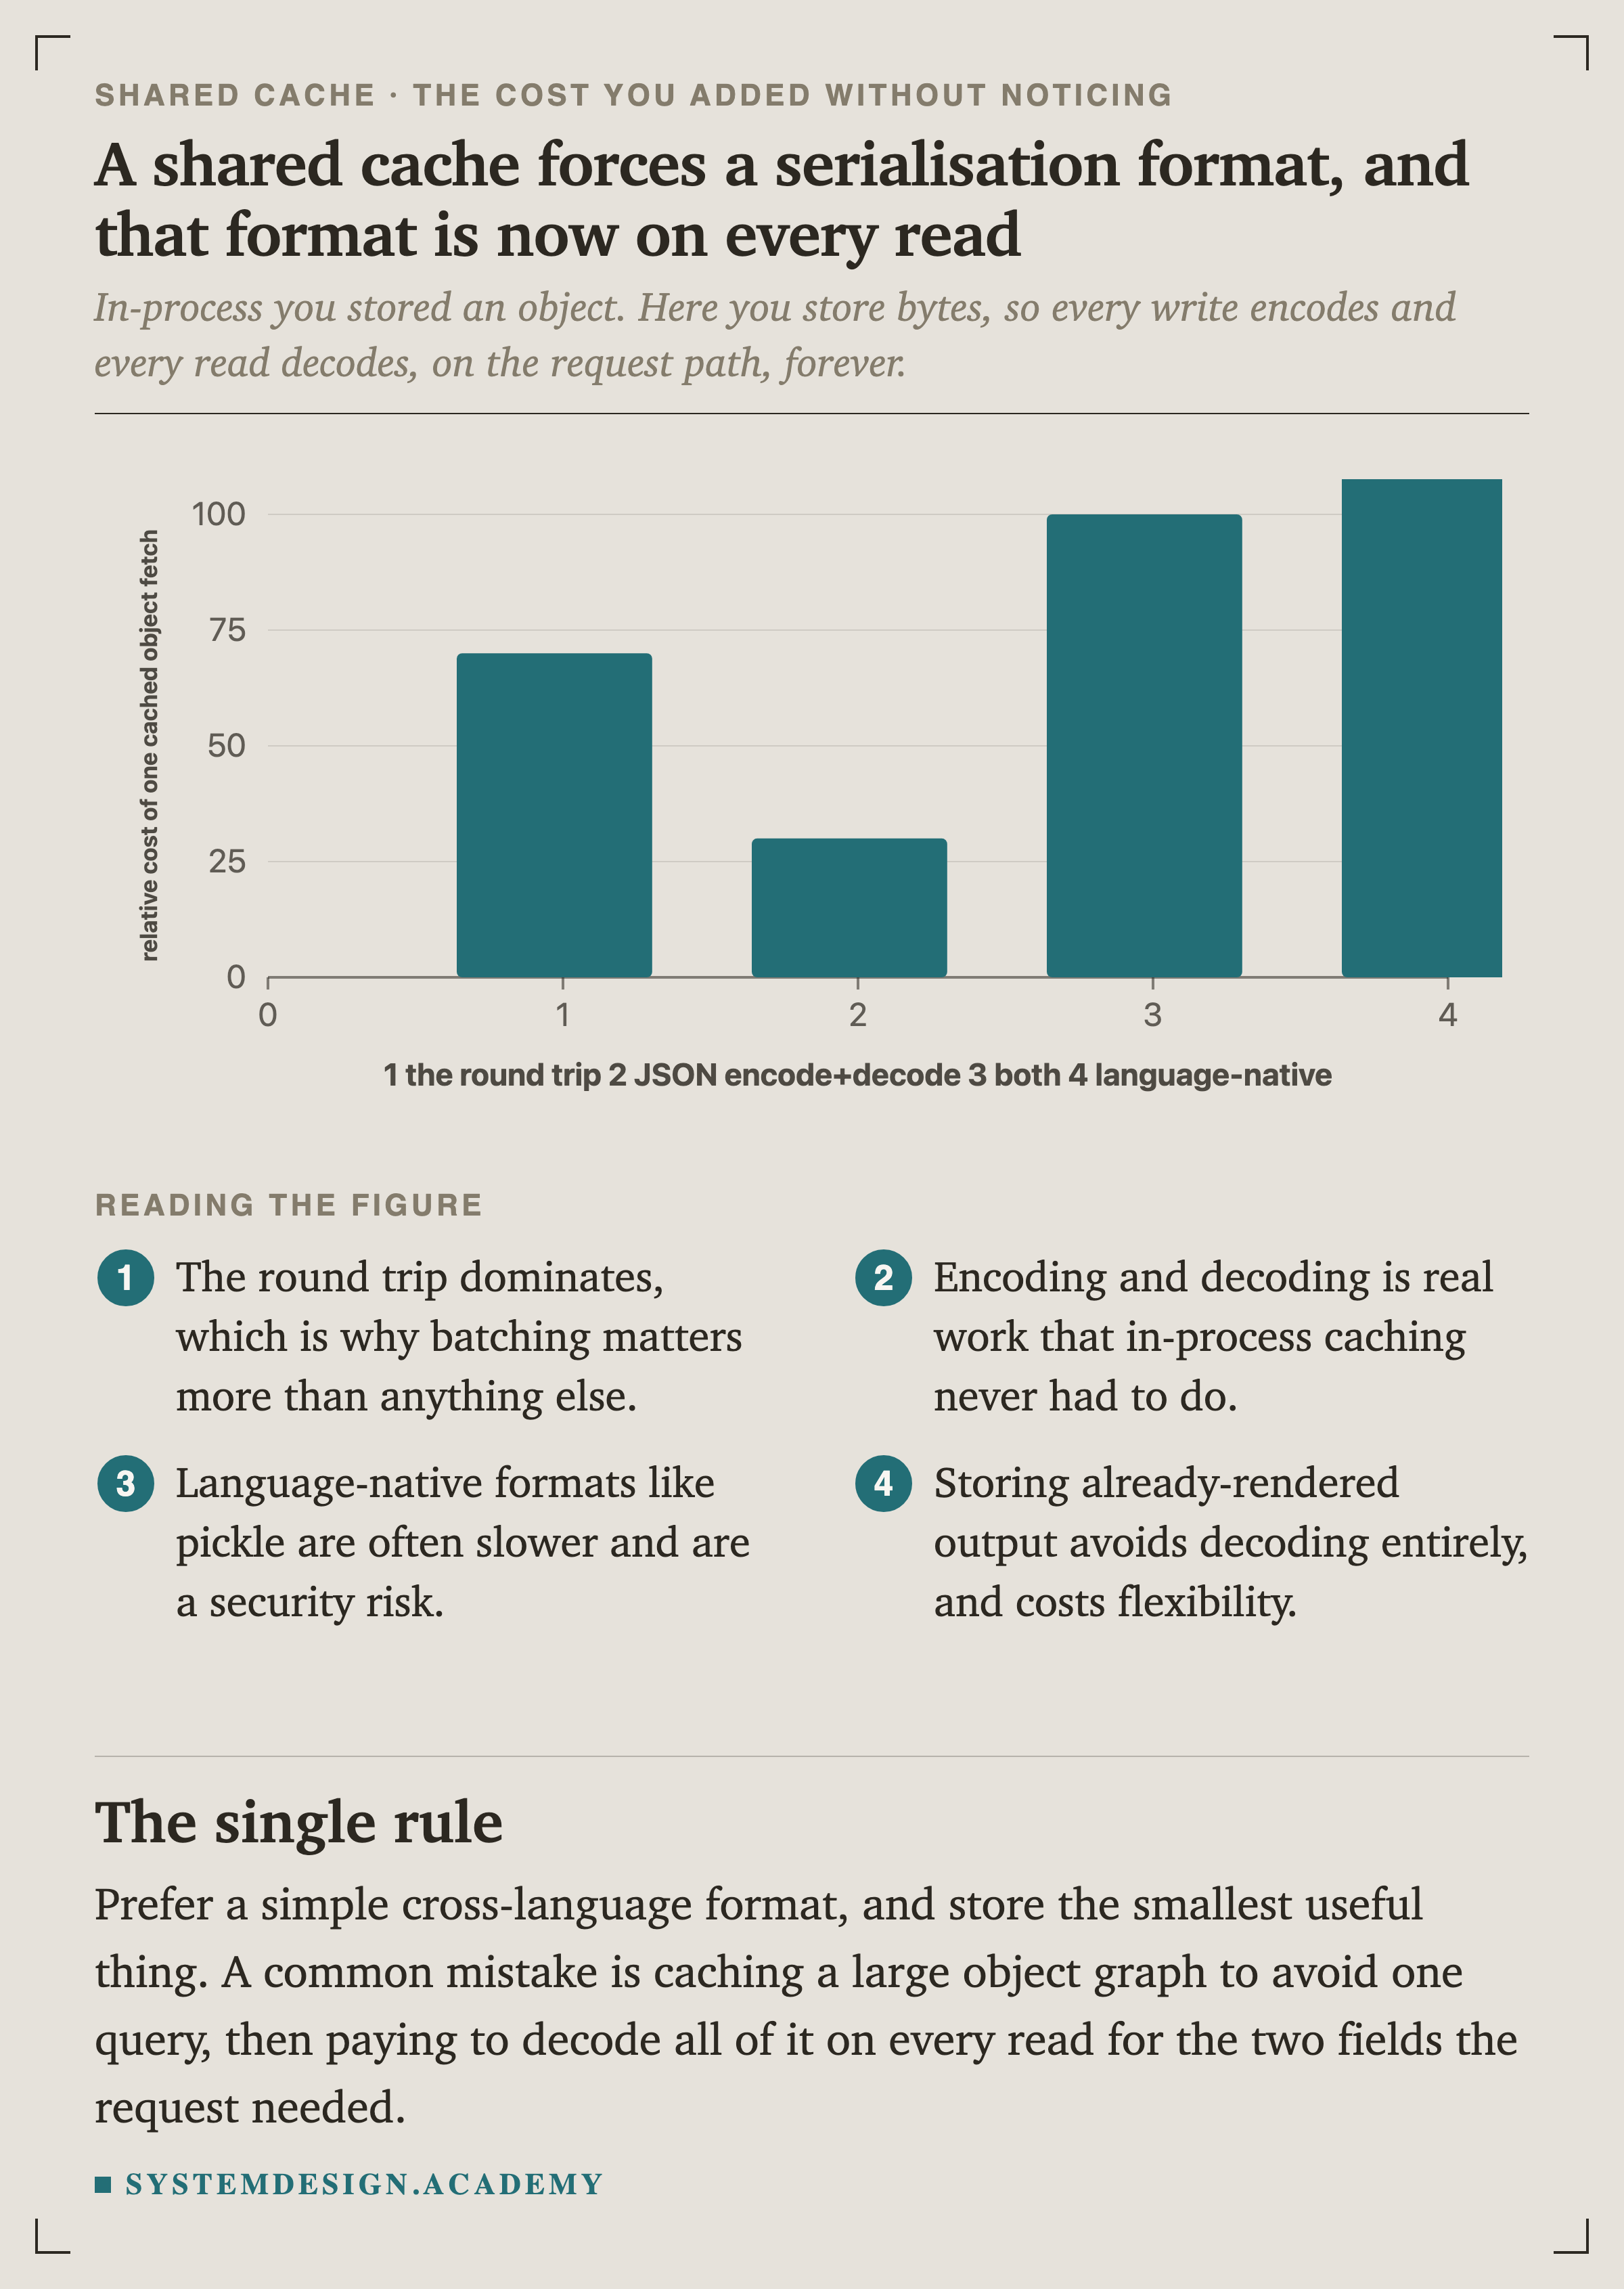
In-process you stored an object. Here you store bytes, so every write encodes and every read decodes, on the request path, forever. Store the smallest useful thing rather than a large object graph you then decode for two fields.
Quick Check
Knowledge Check
4 questions - Score 80% to pass
A page fetches 100 cached items in a loop, one GET each. Measured on loopback, how does that compare to one MGET?
Your cache p99 is in the slowest 1 percent of replies. A request makes 100 cache calls. What is the chance it meets that tail?
One key on your six node Redis cluster is enormously popular and its shard is saturated. What helps?
Your Redis reaches its memory limit. With the default configuration, what happens?