One Command At A Time
The remote cache lesson measured a hit from one client on an idle server. That is the right way to find the floor, and it deliberately leaves out the property that decides how Redis behaves in production.
A Redis server runs one command at a time, in the order the commands arrive.
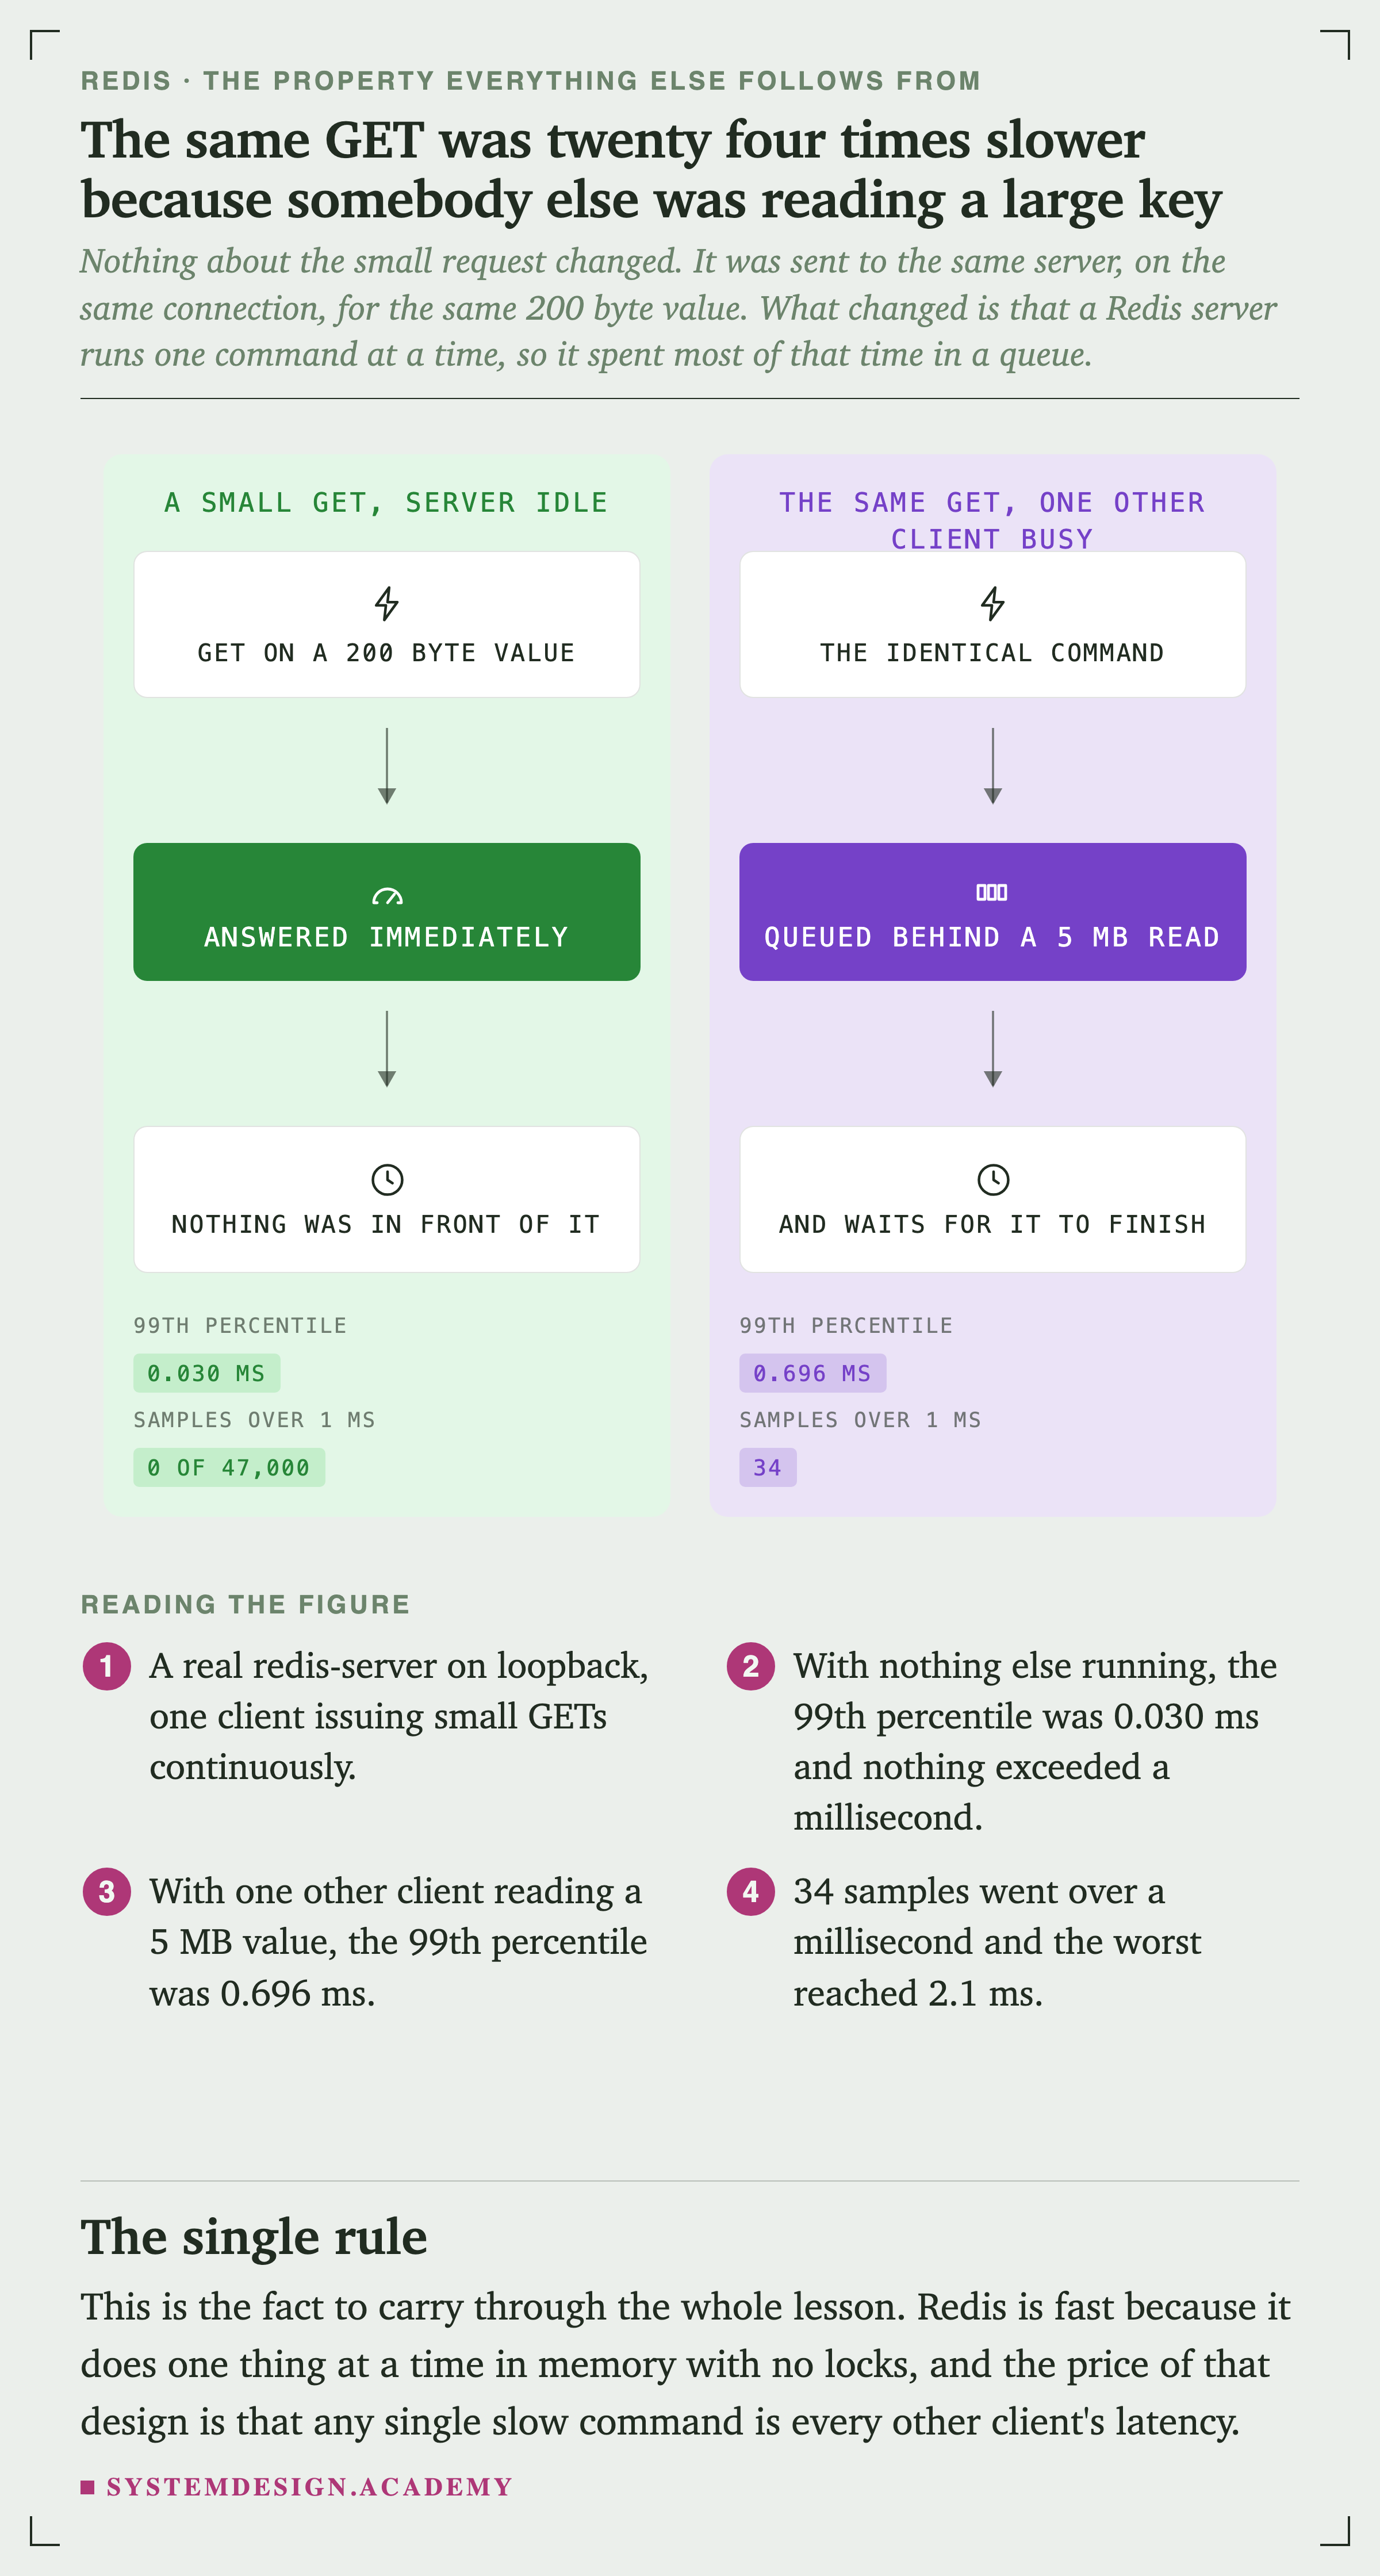
Nothing about the small request changed. It was sent to the same server, on the same connection, for the same 200 byte value. What changed is that it spent most of that time in a queue.
This is the fact to carry through the whole lesson. Redis is fast because it does one thing at a time in memory with no locks, and the price of that design is that any single slow command becomes every other client's .
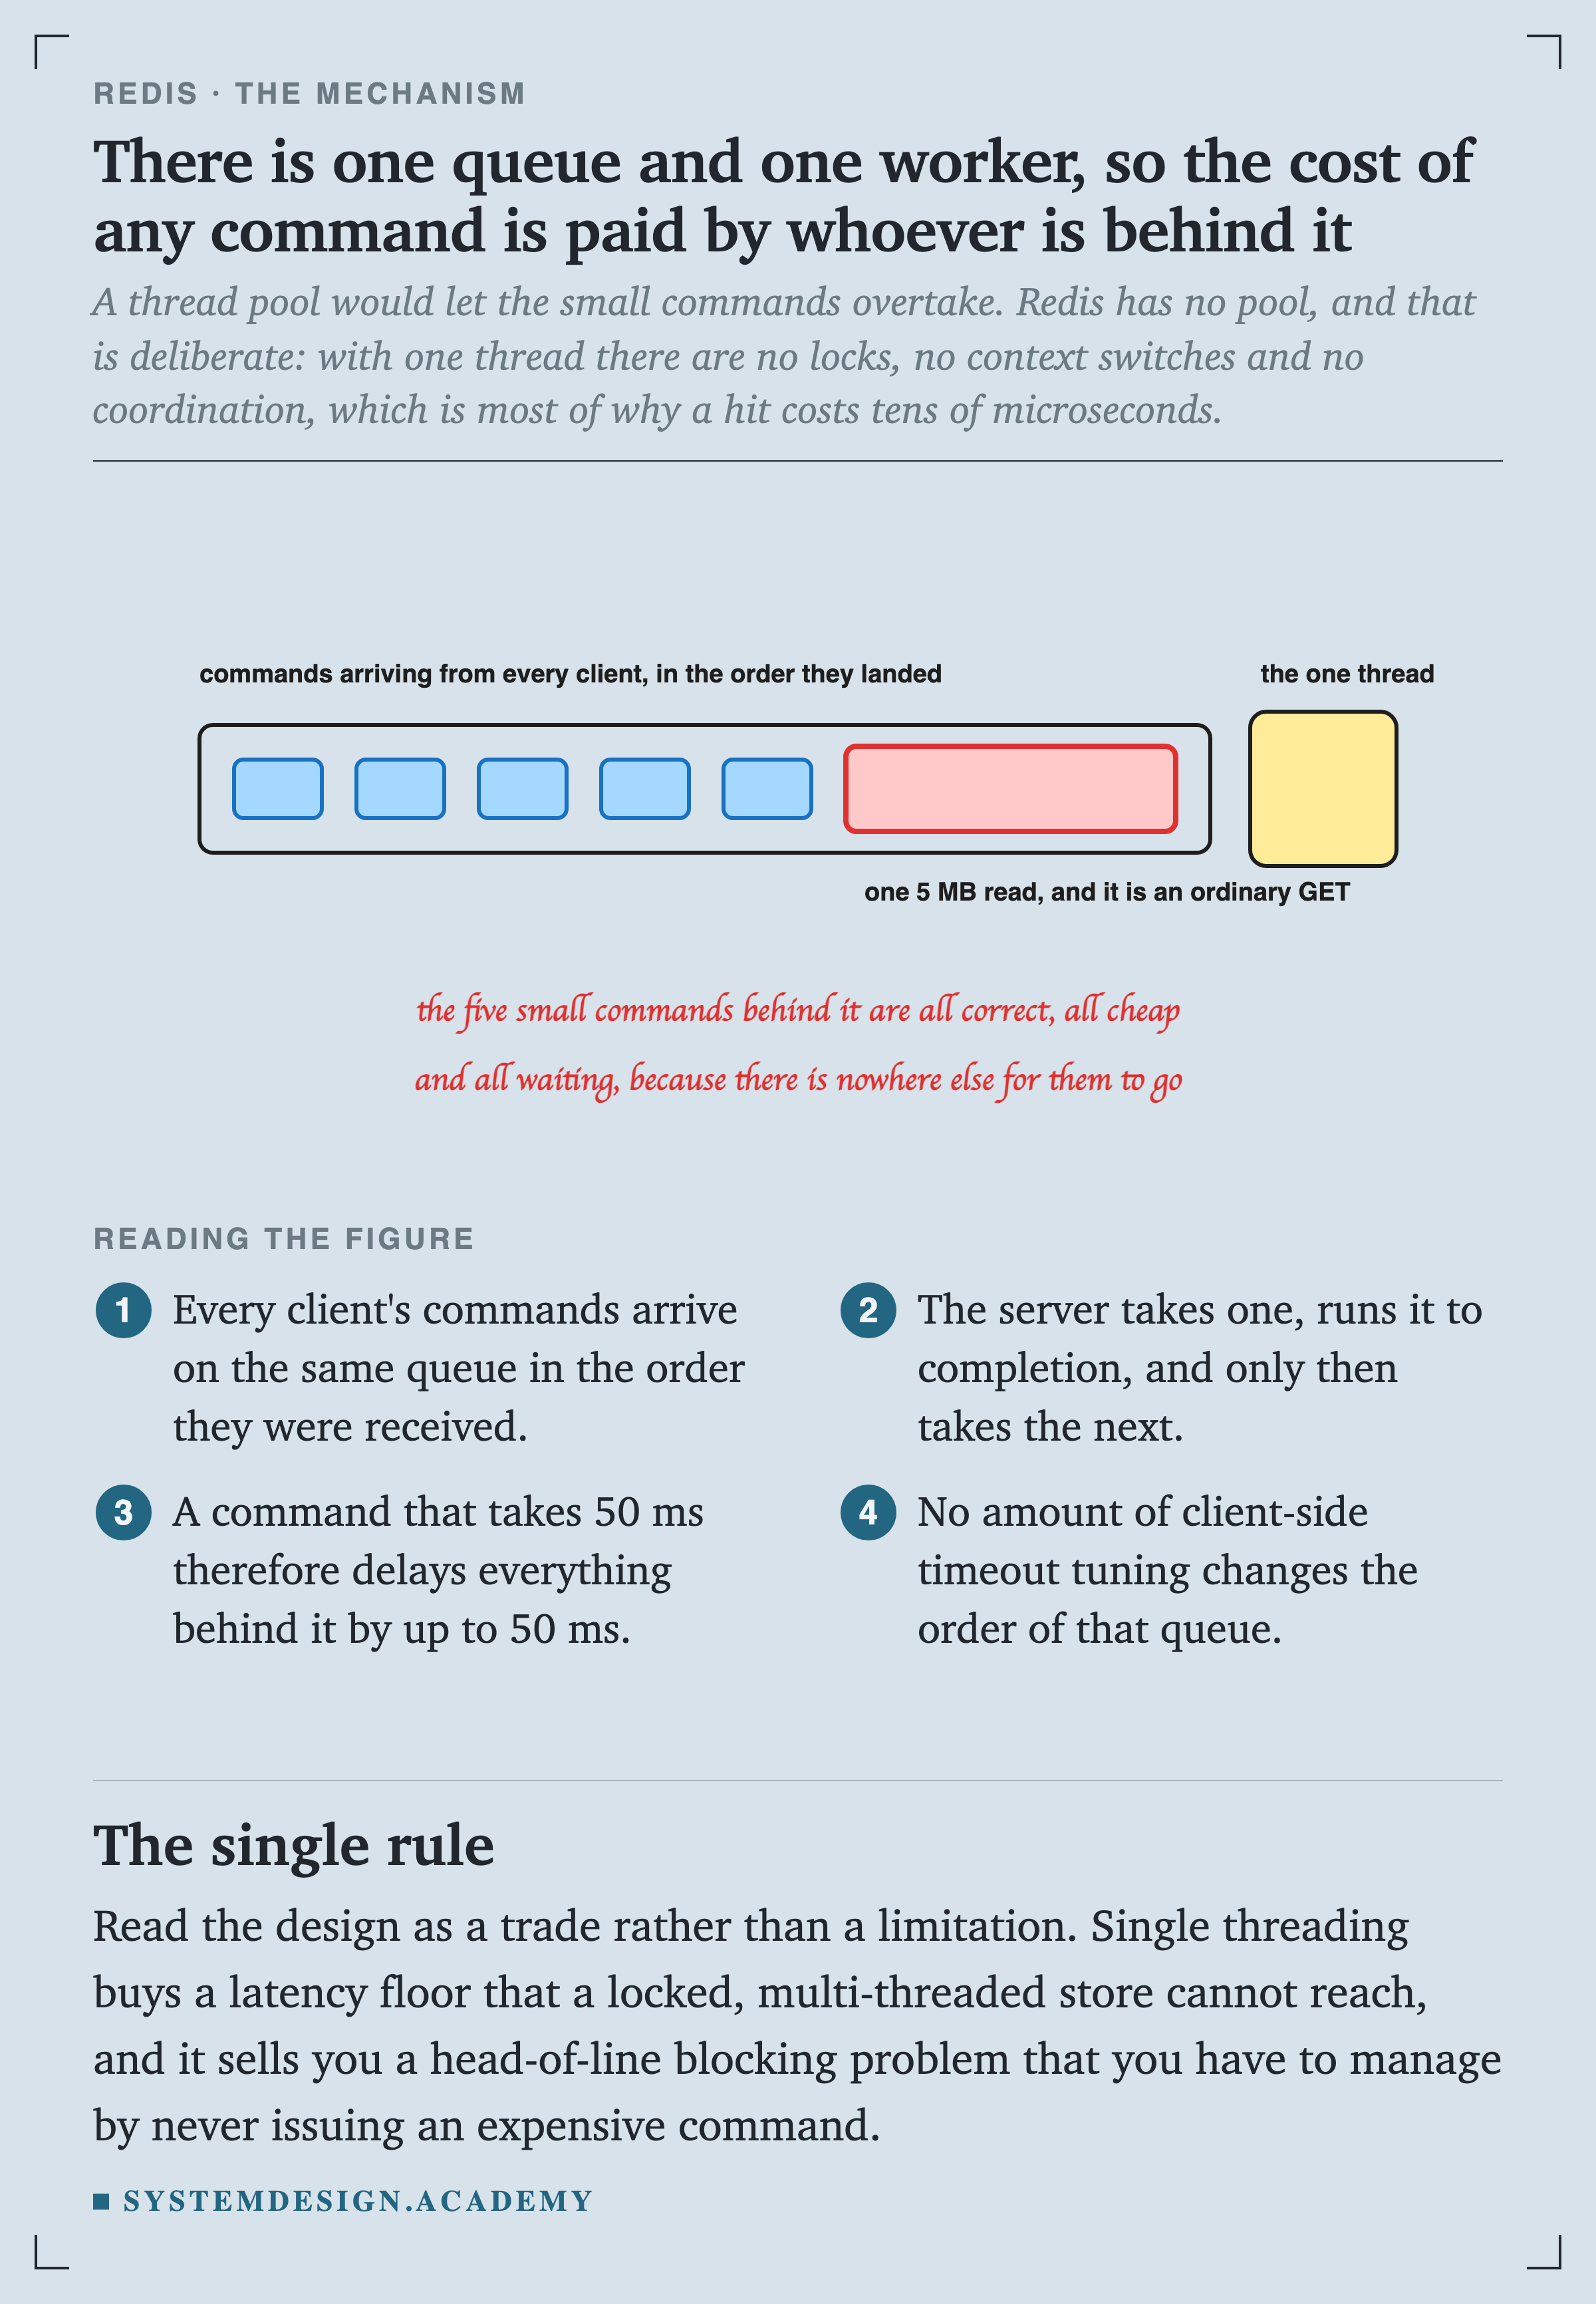
A thread pool would let the small commands overtake. Redis has no pool, and that is deliberate: with one thread there are no locks, no context switches and no coordination.
Read the design as a trade, not a limitation. Single threading buys a latency floor that a locked, multi-threaded store cannot reach, and it sells you a head-of-line blocking problem that you have to manage by never issuing an expensive command.
What The Blocking Looks Like From Outside
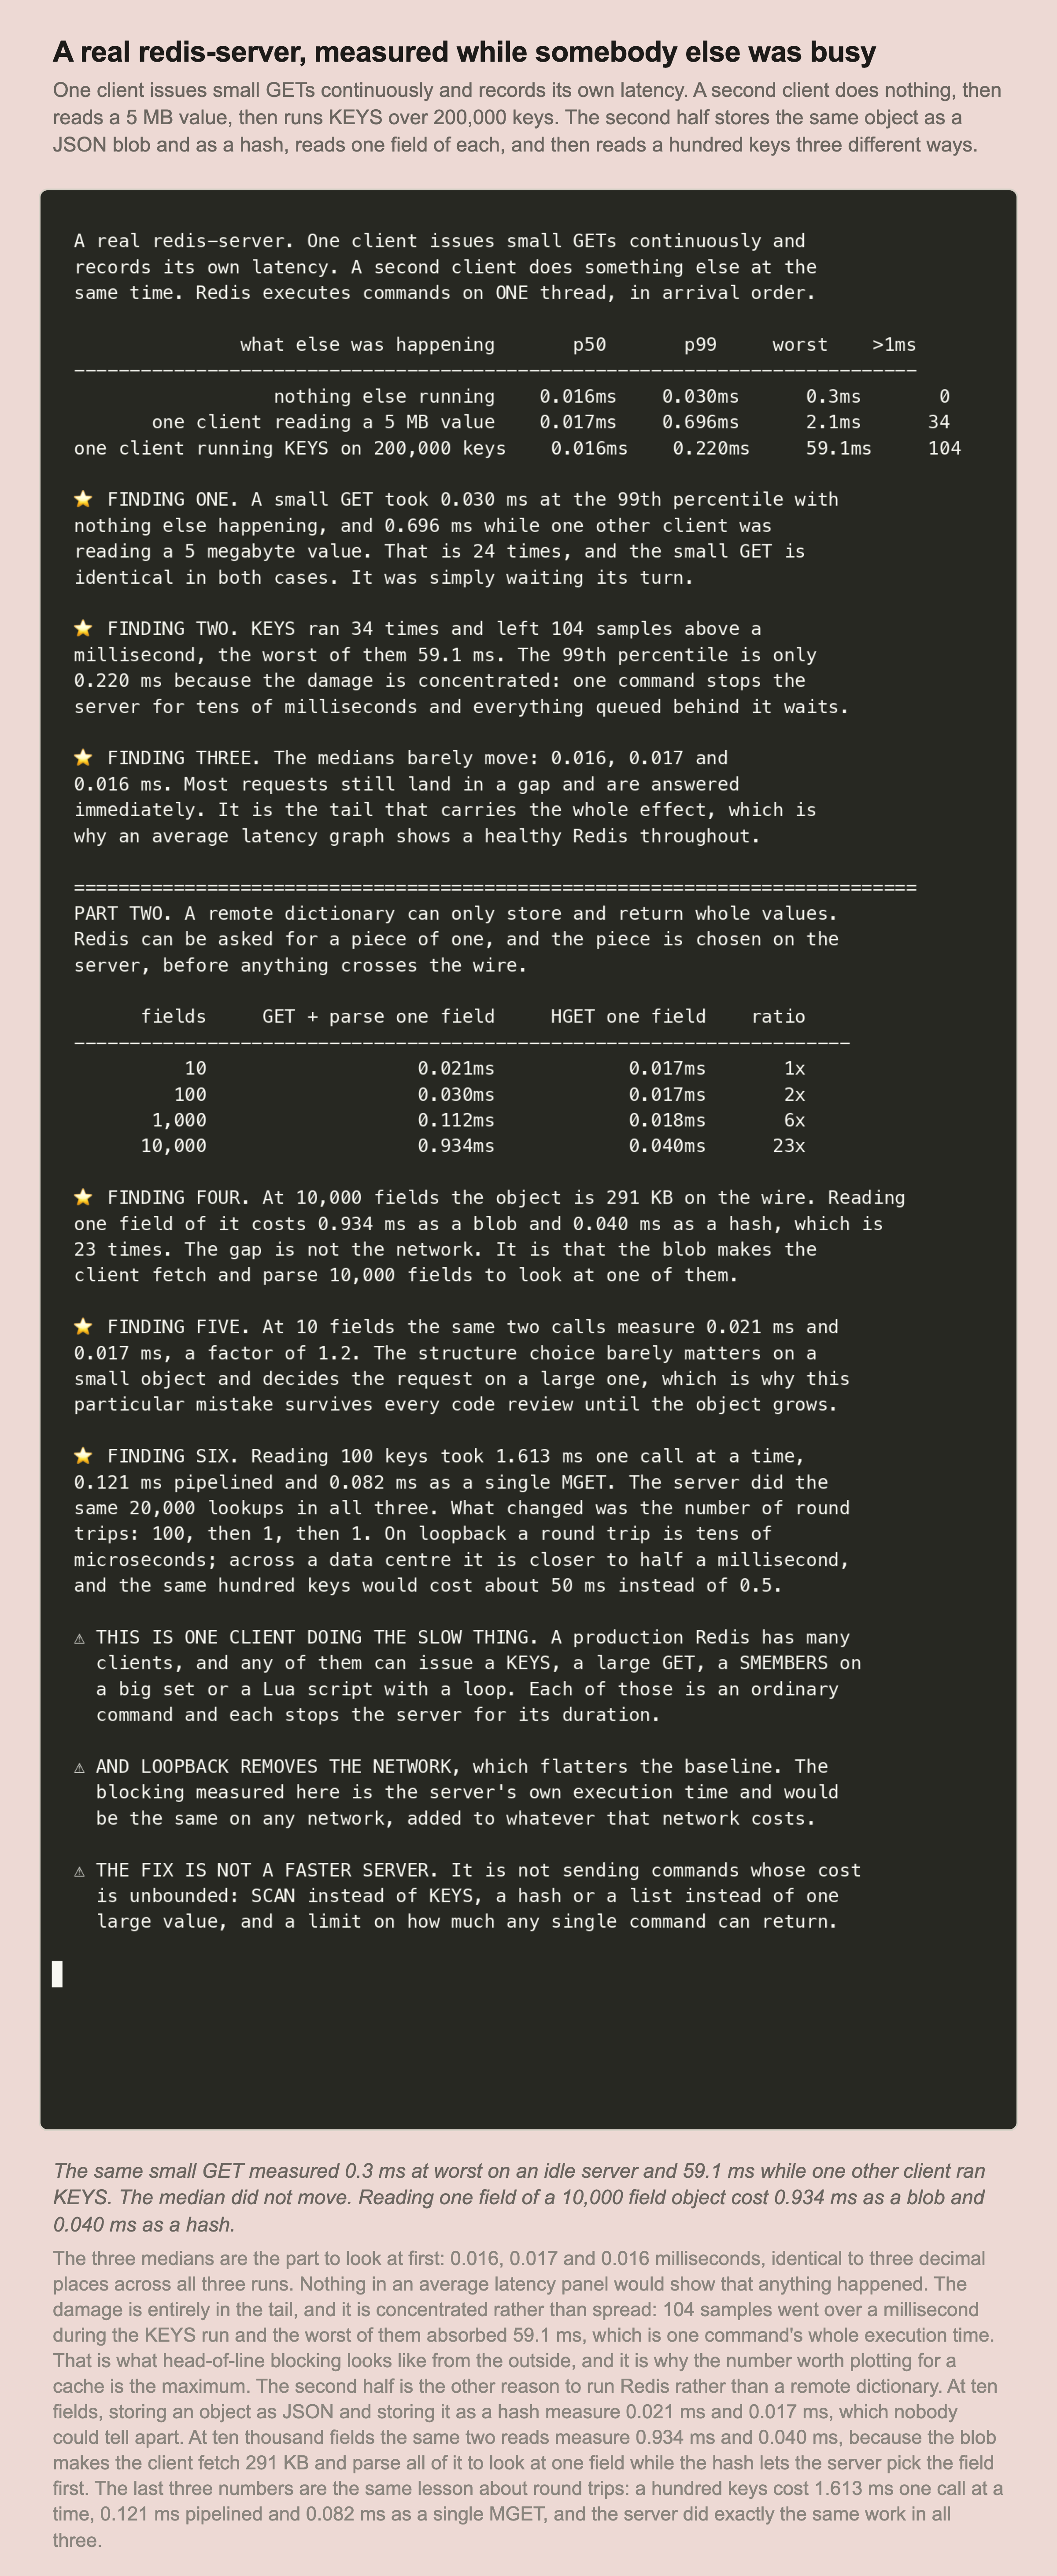
The three medians are 0.016, 0.017 and 0.016 milliseconds, identical to three decimal places. Nothing in an average panel would show that anything happened at all.
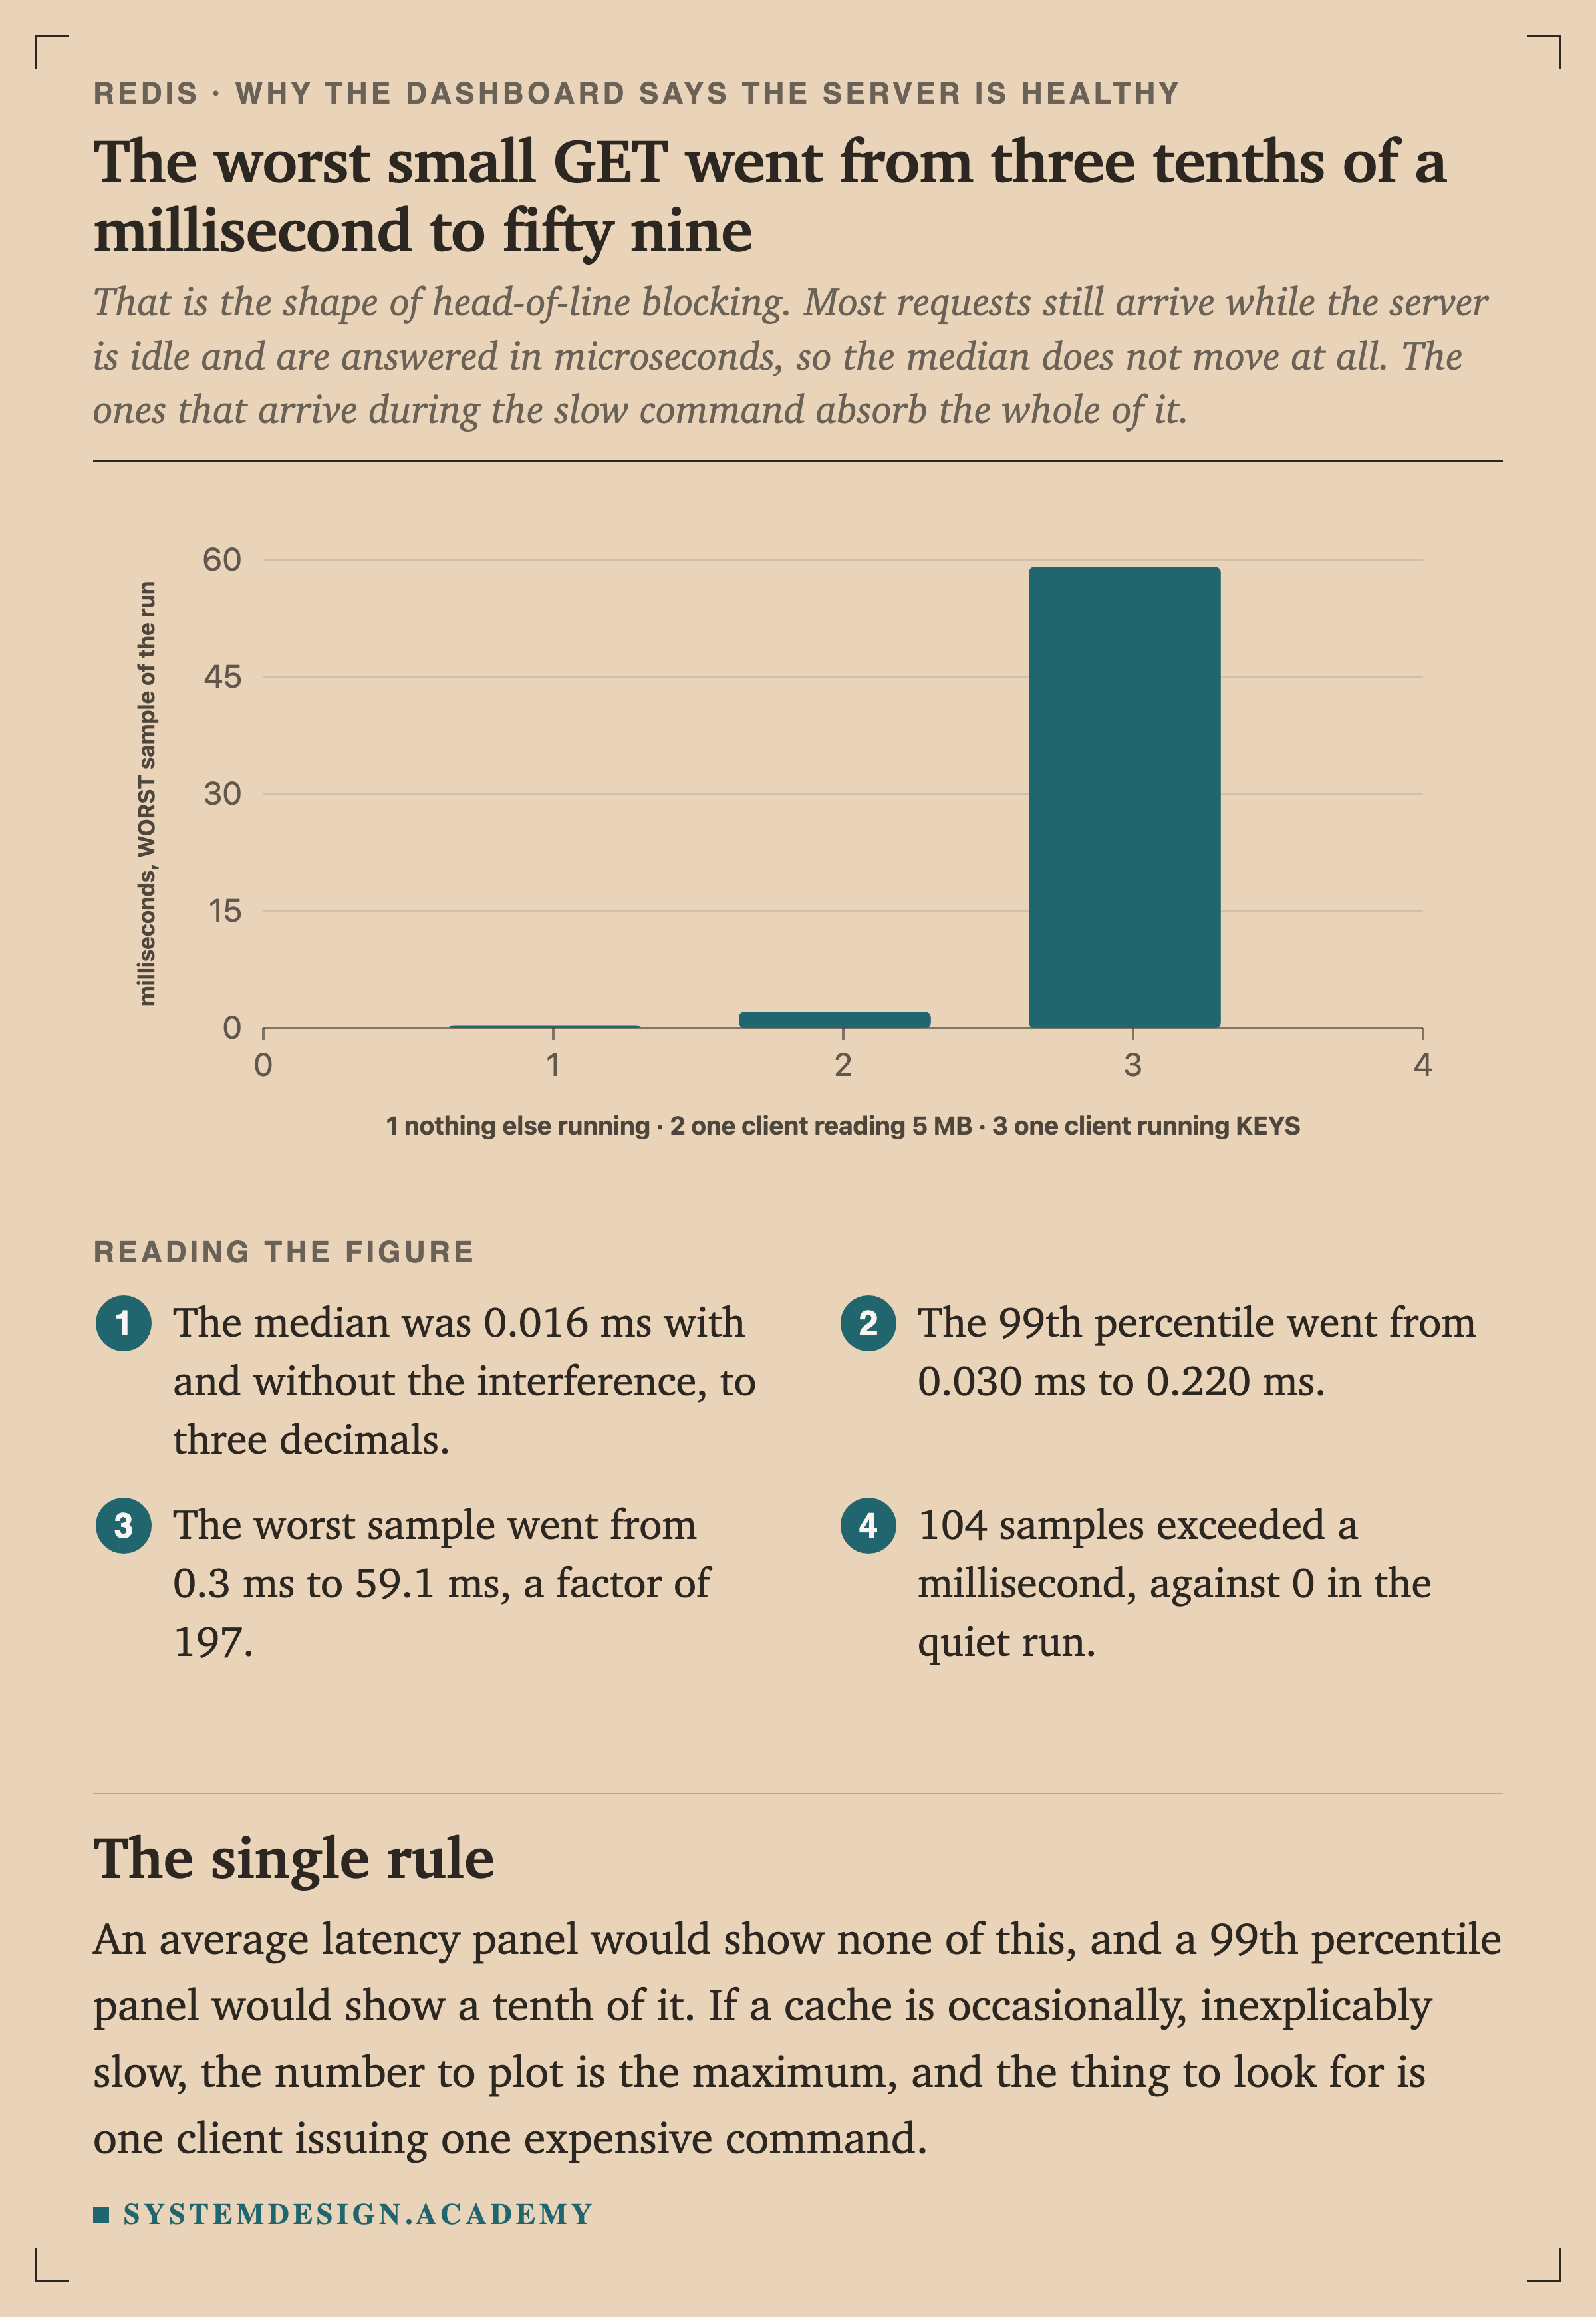
Most requests still arrive while the server is idle and are answered in microseconds, so the median does not move. The ones that arrive during the slow command absorb the whole of it.
An average latency panel would show none of this, and a 99th percentile panel would show a tenth of it. If a cache is occasionally, inexplicably slow, the number to plot is the maximum, and the thing to look for is one client issuing one expensive command.