Healthy And Warm Are Different Things
The eager loading lesson asked what to warm, how many keys, and in what order. This lesson asks a different question with different answers: what does warming look like from the outside, to a running system, on the day something scales out.
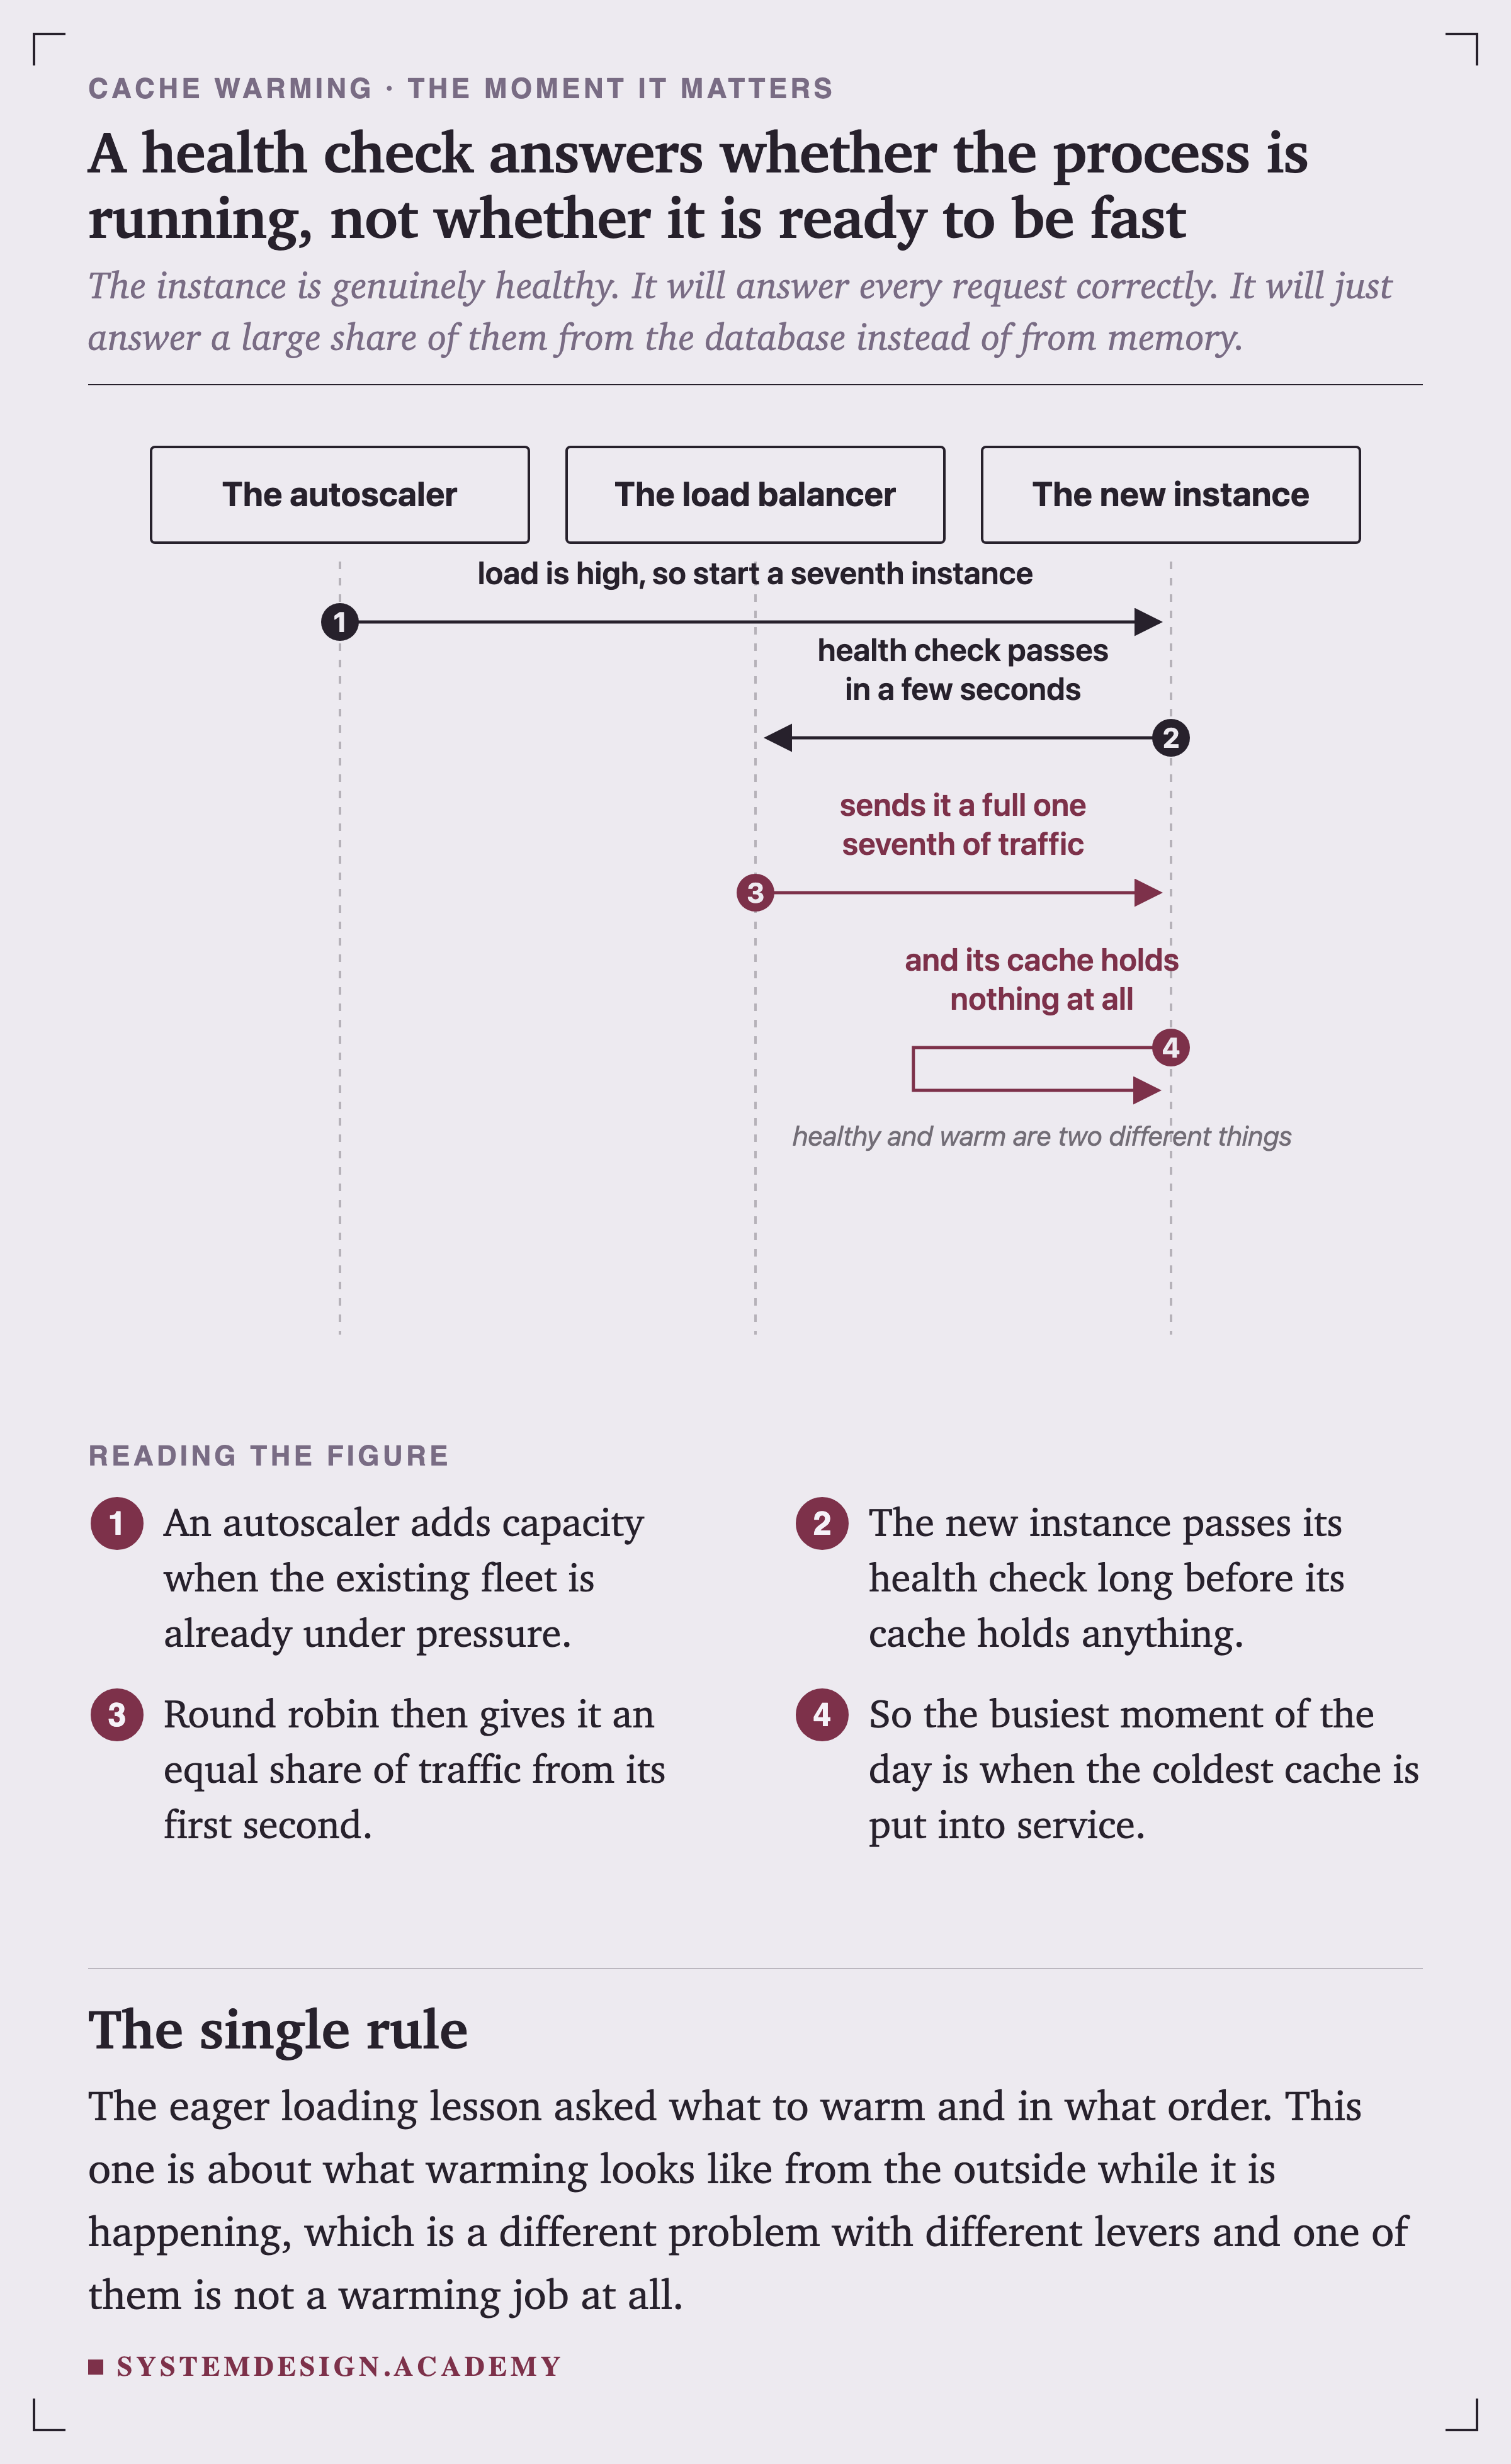
The instance is genuinely healthy. It will answer every request correctly. It will just answer a large share of them from the database instead of from memory.
An autoscaler adds capacity when the fleet is already under pressure, which means the busiest moment of the day is when the coldest cache is put into service.
Two Populations Of Users At The Same Moment
The measurement is six instances each holding a six thousand entry local cache, all warm, serving fourteen hundred requests a second. A seventh joins at second zero holding nothing.
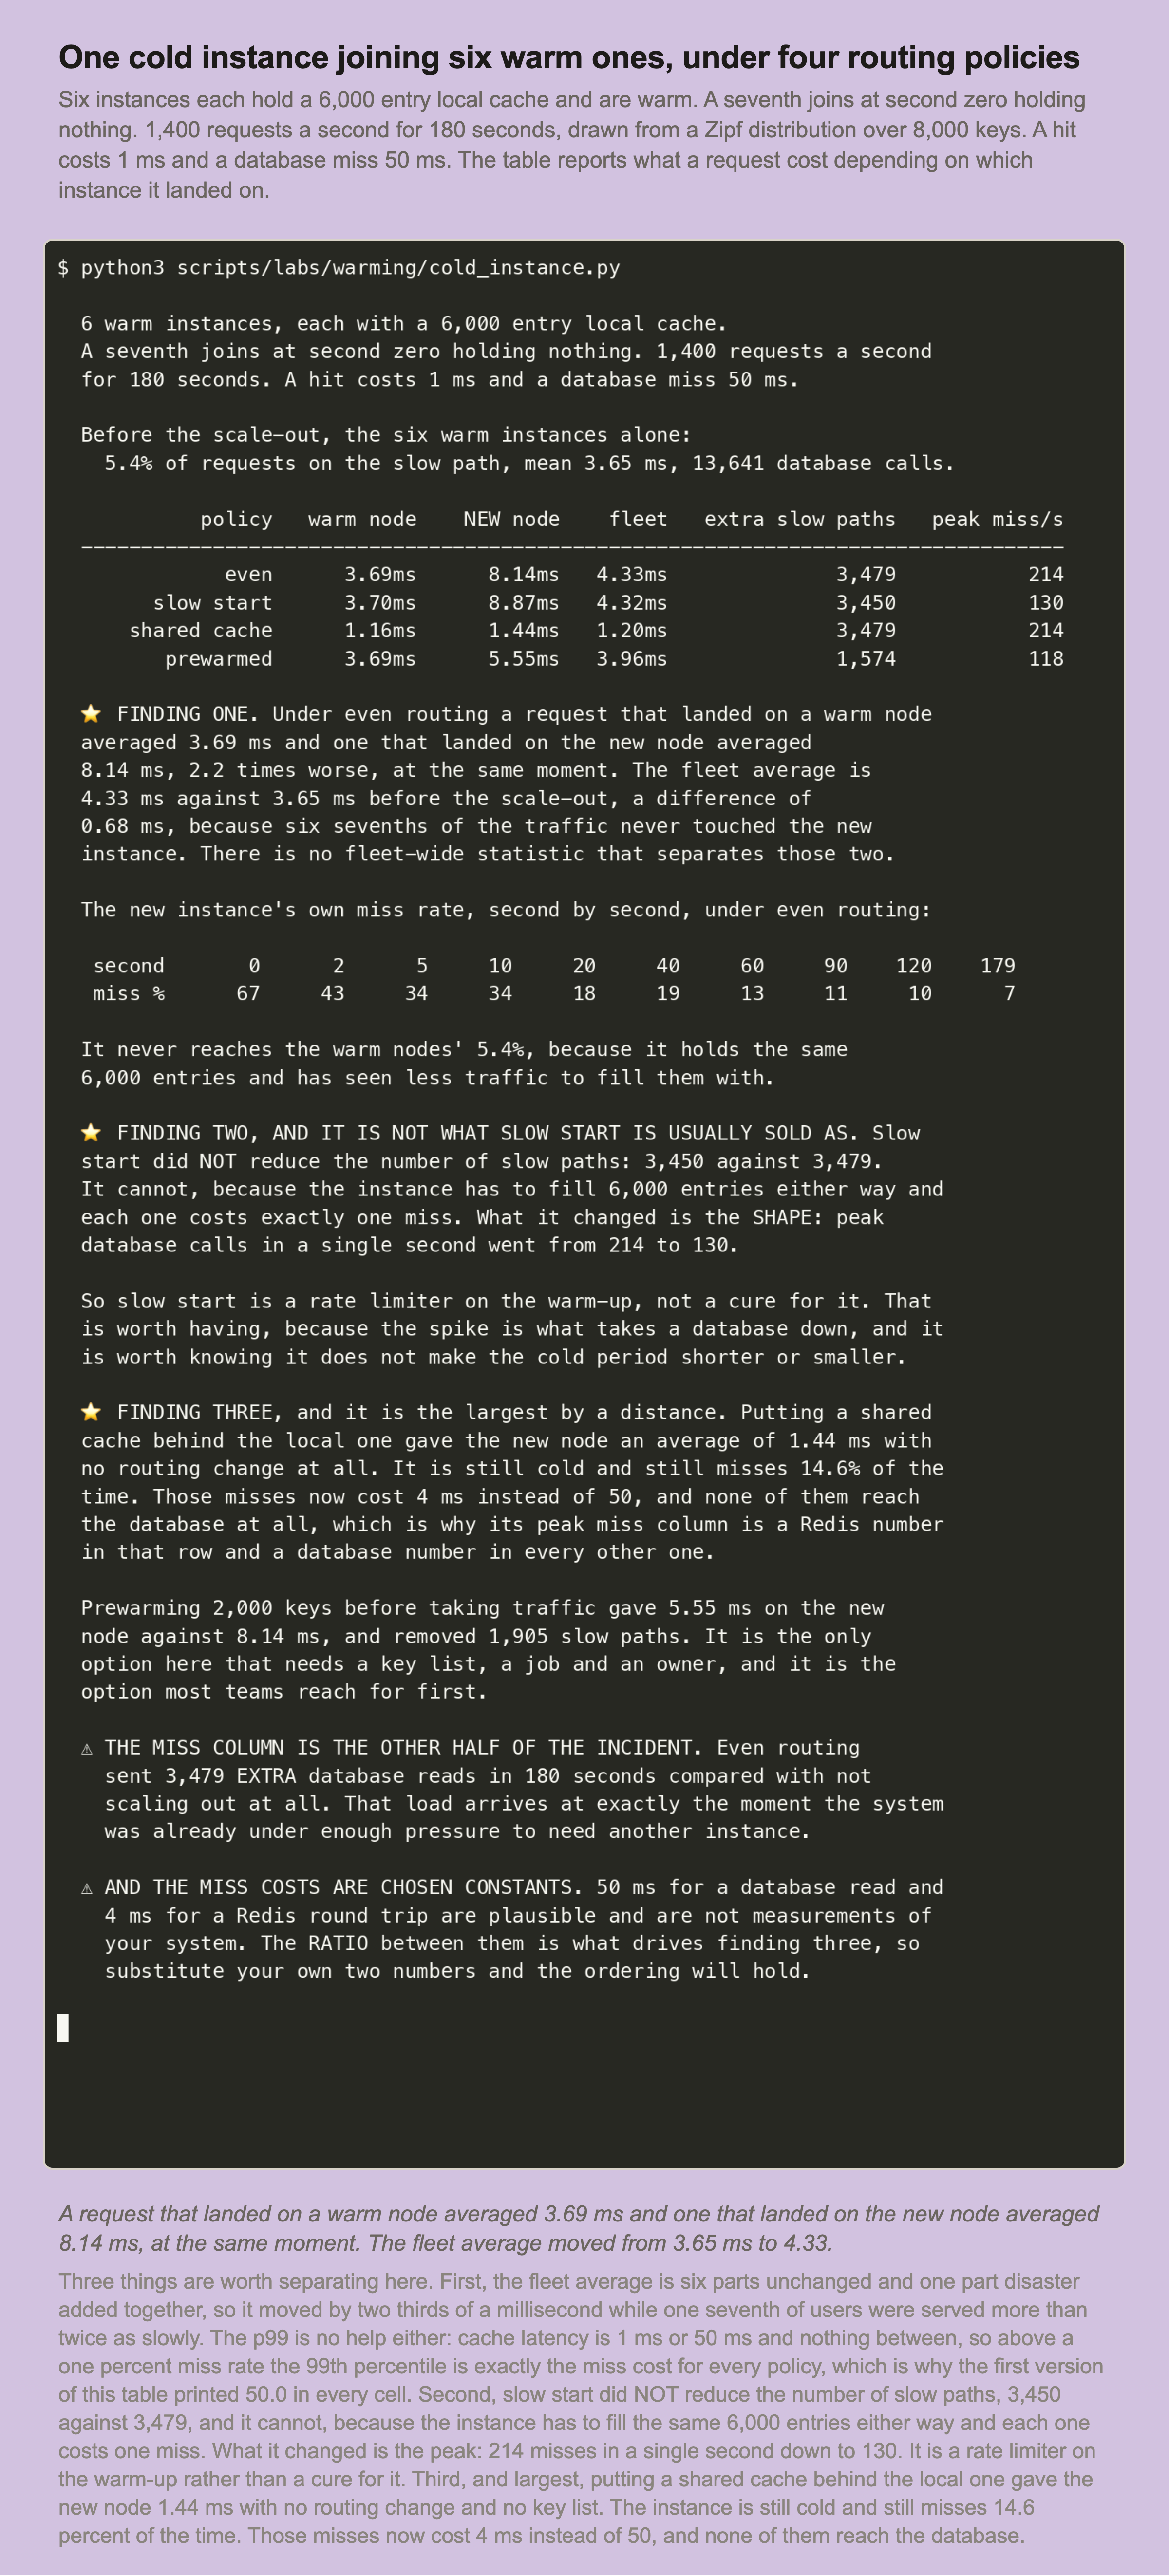
A request that landed on a warm node averaged 3.69 ms and one that landed on the new node averaged 8.14 ms, at the same moment, from the same .
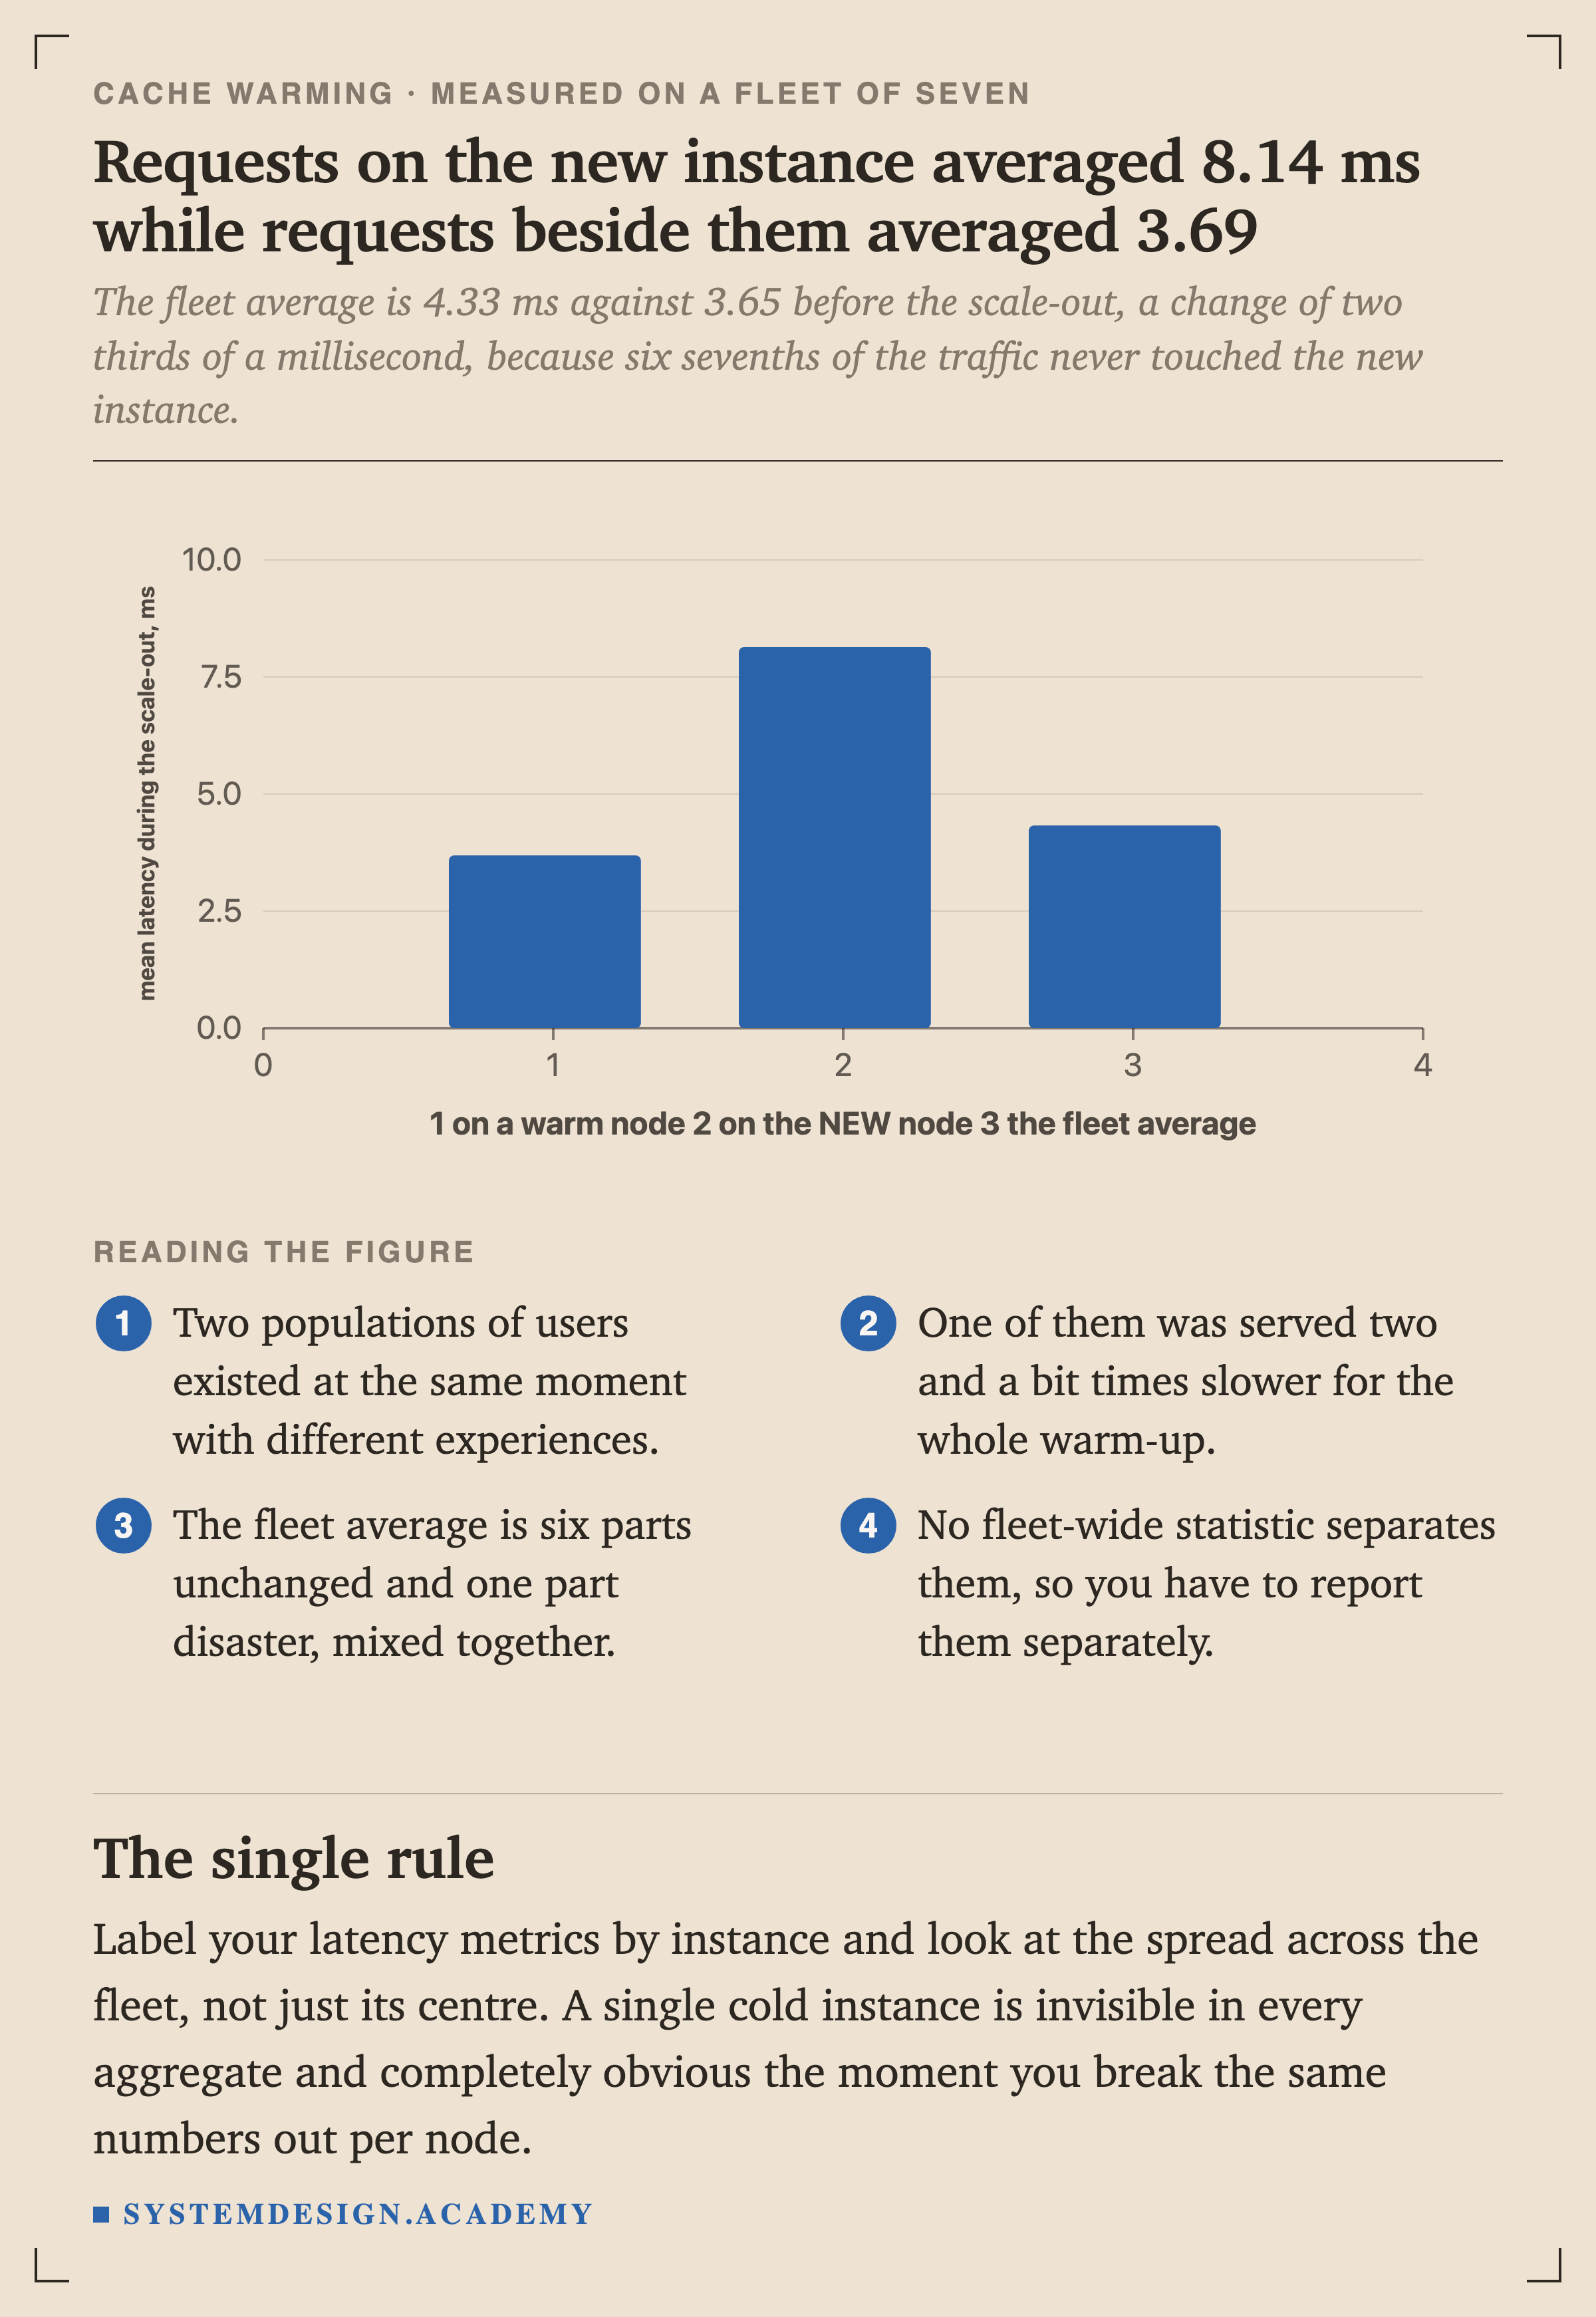
Before the scale-out the fleet averaged 3.65 ms. During it, 4.33. That difference of two thirds of a millisecond is the entire visible effect of one seventh of your users being served more than twice as slowly.
Label your metrics by instance and look at the spread across the fleet, not just its centre. A single cold instance is invisible in every aggregate and completely obvious the moment the same numbers are broken out per node.