Three People and One Laptop
Let me start in a small office.
Three colleagues share one table and one laptop. Each of them has their own notebook with their own notes. Only one person can type on the laptop at a time, so they pass it round.

Now the manager wants more work done at the same table, with the same one laptop, and has two ideas.
Idea one: hire a fourth person. The fourth person brings a fourth notebook and takes a turn at the laptop. But the laptop does not get faster. Each person now waits a little longer for their turn, and passing the laptop round takes time too. If the work is all typing, four people finish no more than three did. They may finish a little less.
Idea two: ask three people to type one short line together. Someone has to call the other two over and wait for them to sit down. Then each gets a third of the line, and everyone waits for the last one to finish. For one short line, that costs much more than typing it alone. For a long report on a table with three laptops, it could be a good idea. On one laptop it never is.
A prediction service has the same two ideas. It can run more worker processes, like more people. Or it can let the model use more threads inside one call, like several people typing one line. In this lesson I measure both, and both together, on a rented machine with exactly one core: the one laptop of the story.
Where This Lesson Starts
This is lesson 5 of the chapter on serving a model. Lesson 2, latency anatomy, took one request apart. Lesson 3, tail latency, looked at the slowest requests. Lesson 4, batching requests, let requests share one model call. All three ran the service as one process, with one thread for the model.
This lesson changes those two numbers. I use the same model, the same service code and the same kind of rented machine as lessons 2 to 4, so I do not explain them again. In short: the model is the features chapter's gradient boosted tree model. It scores one customer of a real online shop, and it scored a test AP of 0.5450. The service is a small FastAPI web service run by uvicorn, and it reads the customer's six features from SQLite. If any of that is new, please read lesson 2 first.
One thing about the machine changes the question. My AWS account is allowed only one virtual CPU of this kind at a time. I checked whether a cheaper "burstable" machine would give me two. It would not: every t4g size has 2 vCPUs, and the same limit covers that family too. So the box has one core. The question in this lesson becomes: on one core, do more workers or more threads help, or do they only get in each other's way?
What a machine with more cores would add, I say in words only. I give no numbers for a machine I did not measure.
The Words You Need First
Please read this slide slowly if any word is new. Every slide after it uses these words.
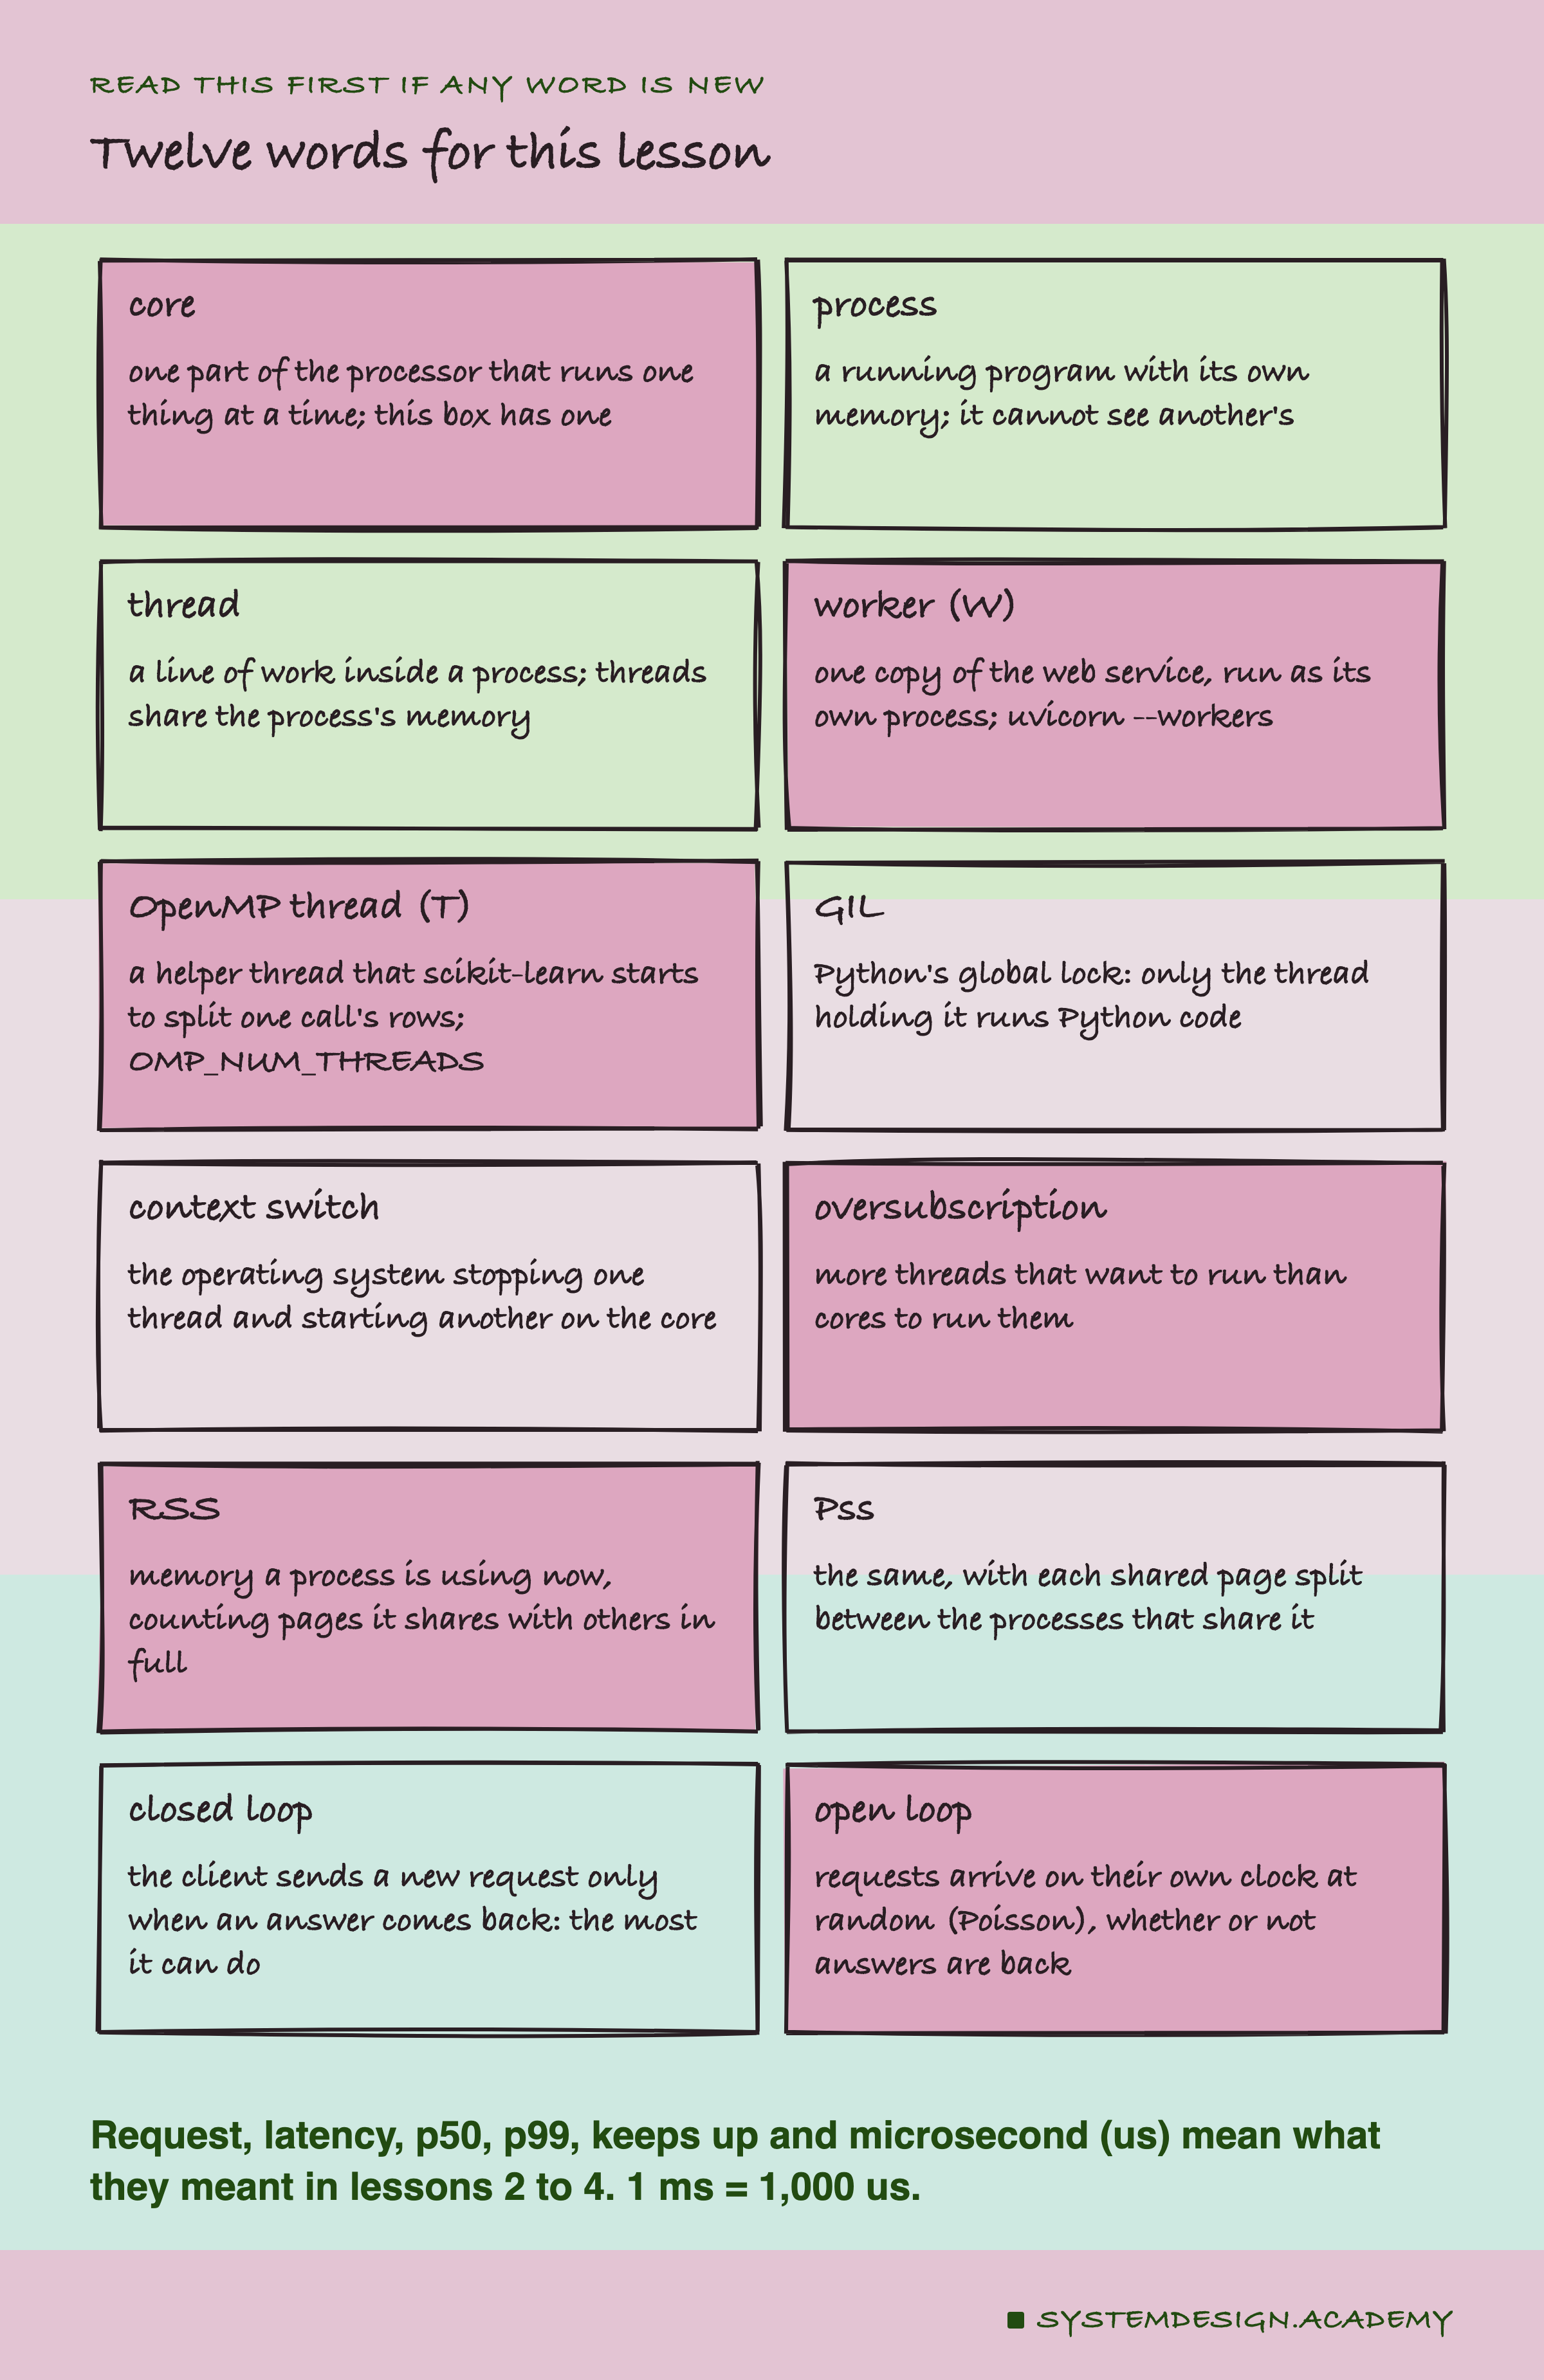
A core is one part of the processor that runs one stream of instructions at a time. It is the laptop in the story. My box has exactly one. A machine with eight cores can run eight things at the same moment.
A process is a running program with its own memory. Two processes cannot read each other's memory, like two people with their own notebooks. A thread is a line of work inside a process. Threads in one process share its memory, like two people reading the same notebook.
A worker is one copy of the web service, running as its own process. uvicorn, the server from lesson 2, starts W of them when you pass --workers W. Each worker loads the model for itself. Inside a worker, one event loop does the work: a single thread that takes the next ready job and runs it to the end before taking another. A job is something like reading a request or answering it.
An OpenMP thread is a helper thread that scikit-learn starts inside one call to predict_proba, to share the call's rows between helpers. OpenMP is a standard way for C code to do this. I set how many with the OMP_NUM_THREADS setting, and I call that number T. A setting of this lab is written W x T. So 4x1 means four workers with one thread each, and 1x4 means one worker whose model calls use four threads.
The GIL, the global interpreter lock, is a lock inside Python. Only the thread that holds it may run Python code. Code written in C can let go of it while it works, so that other threads can run Python in the meantime.
A is the operating system stopping one thread on the core and starting another. means more threads want to run than there are cores to run them, so they wait and switch. On a one-core box, every setting except 1x1 is oversubscribed.
The Headline: On One Core, Nothing Beat One Worker With One Thread
Here is the main result first. Each column is one setting. Each dot is one round: the most answers per second that setting gave, with 16 connections each sending a new request the moment its answer arrived.
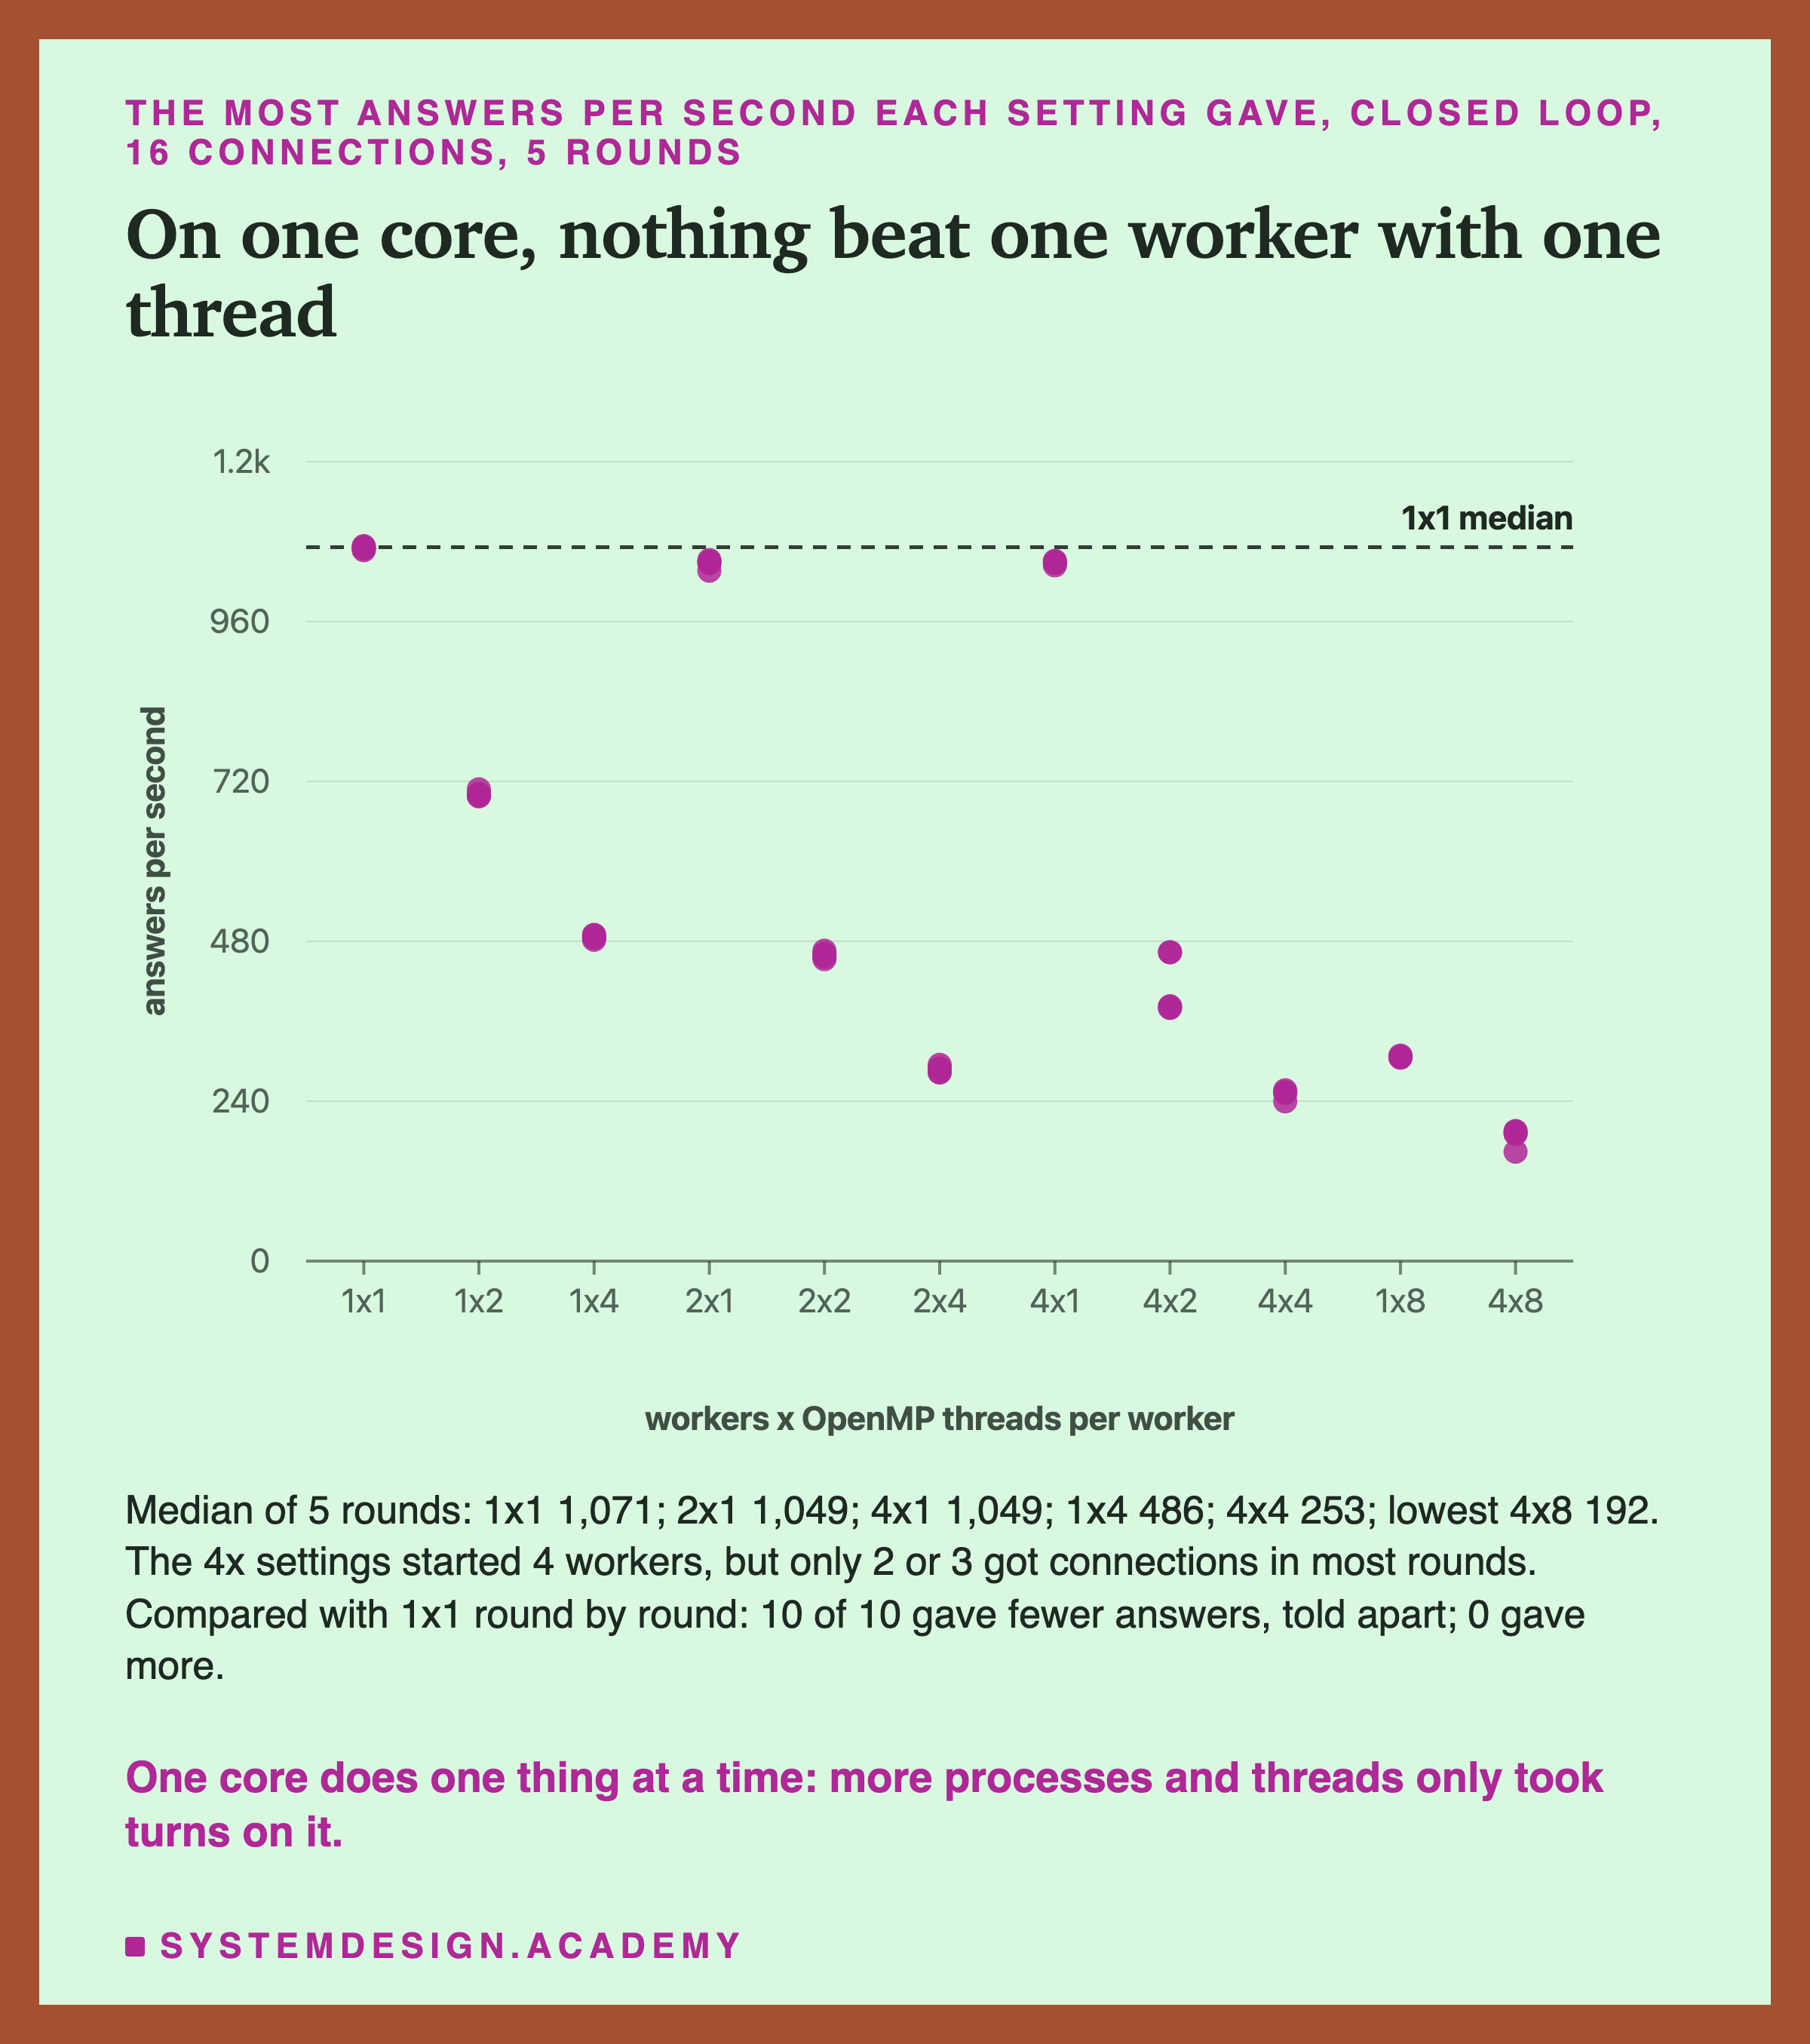
One worker with one thread gave the most: 1,071 answers a second. Every one of the other ten settings gave fewer, and the difference held in all five rounds.
More workers cost a little. Two workers gave 1,049 a second, and four started workers also 1,049, about 0.98 of 1x1. (With four, only 2 or 3 got connections in most rounds; a later slide shows why.) That is a small loss, but it was there in every round. And four workers used 4.14 times the memory.
More OpenMP threads cost a lot. One worker with 2 threads gave 701 a second, with 4 threads 486, and with 8 threads 306. Four started workers with 8 threads each gave 192, only 0.18 of 1x1; 2 of the 4 got connections in four of the five rounds.
Under random arrivals, the threads made the service fall behind. At 646 requests a second, one worker with one thread had a p99 of 7.00 ms. One worker with 4 threads had a queue that never emptied, and a p99 of 2.7 seconds.
So on one core, the best choice was the simplest one: one process and one thread. The rest of the lesson shows where these numbers come from, and why.
How the Lab Was Built
I wrote the lab's design into the docstring of scripts/labs/serving/workers_and_threads.py on 2026-10-04, before any run of this lesson. It names every measurement, every setting, the rule for "told apart from noise", and seventeen guesses.
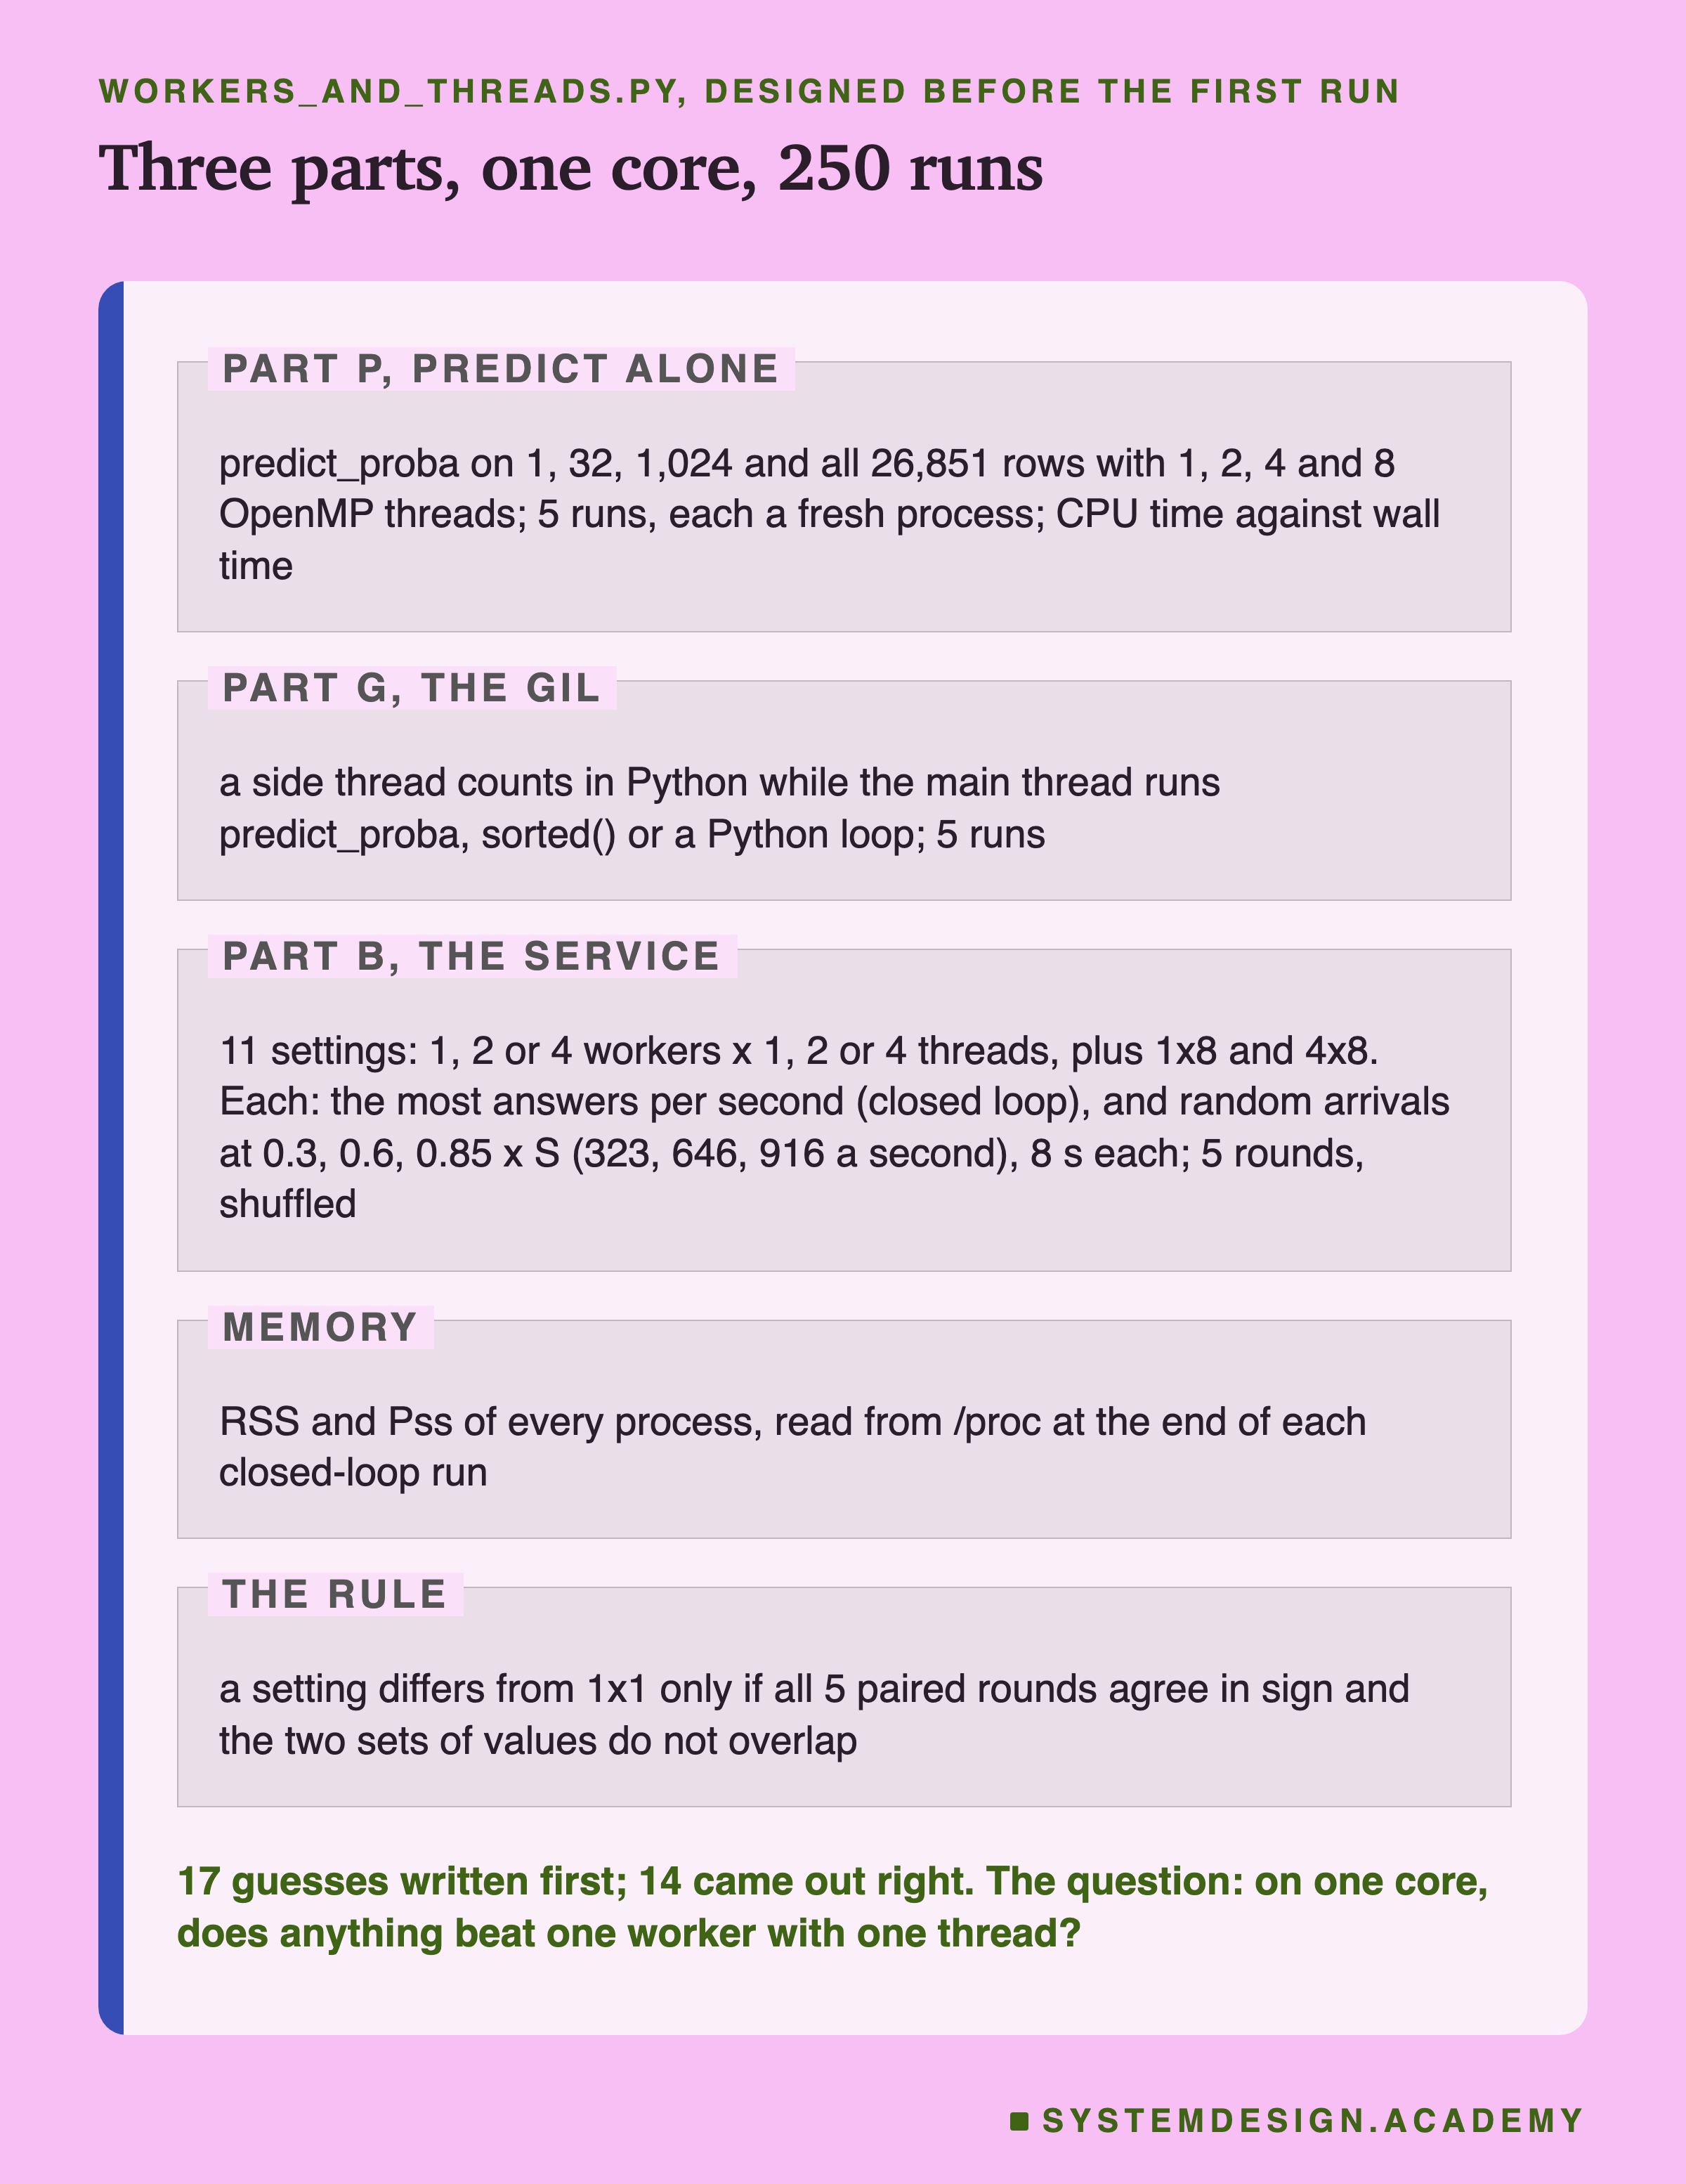
Part P times predict_proba alone, with no web server, with 1, 2, 4 and 8 OpenMP threads. It uses 1 row, 32 rows, 1,024 rows and all 26,851 test rows. Each thread count runs as a fresh Python process, five times, in a shuffled order. It also records how much CPU time the process used during the timed calls, so I can see whether the core was busy or waiting.
Part G checks the GIL. One thread counts in a Python loop. Meanwhile the main thread calls predict_proba on all rows, or sorts a list, or runs its own Python loop. If the counting thread keeps going while the main thread works, the main thread's work let the lock go.
Part B is the service. First I measured S, the most answers per second of 1x1 with a closed-loop client, as in lesson 4. Then each of the 11 settings got a closed-loop run and three open-loop runs, at 0.3, 0.6 and 0.85 times S. That is 44 runs a round, five rounds, in a new random order each round. Within a round, every setting at one rate got exactly the same arrival times and customers. So I could compare each setting with 1x1 on the very same traffic.
The Machine, and the Client That Shares It
Like lessons 2 to 4, every timing comes from a small machine I rented from Amazon Web Services. None comes from my laptop, which is always busy with other work.
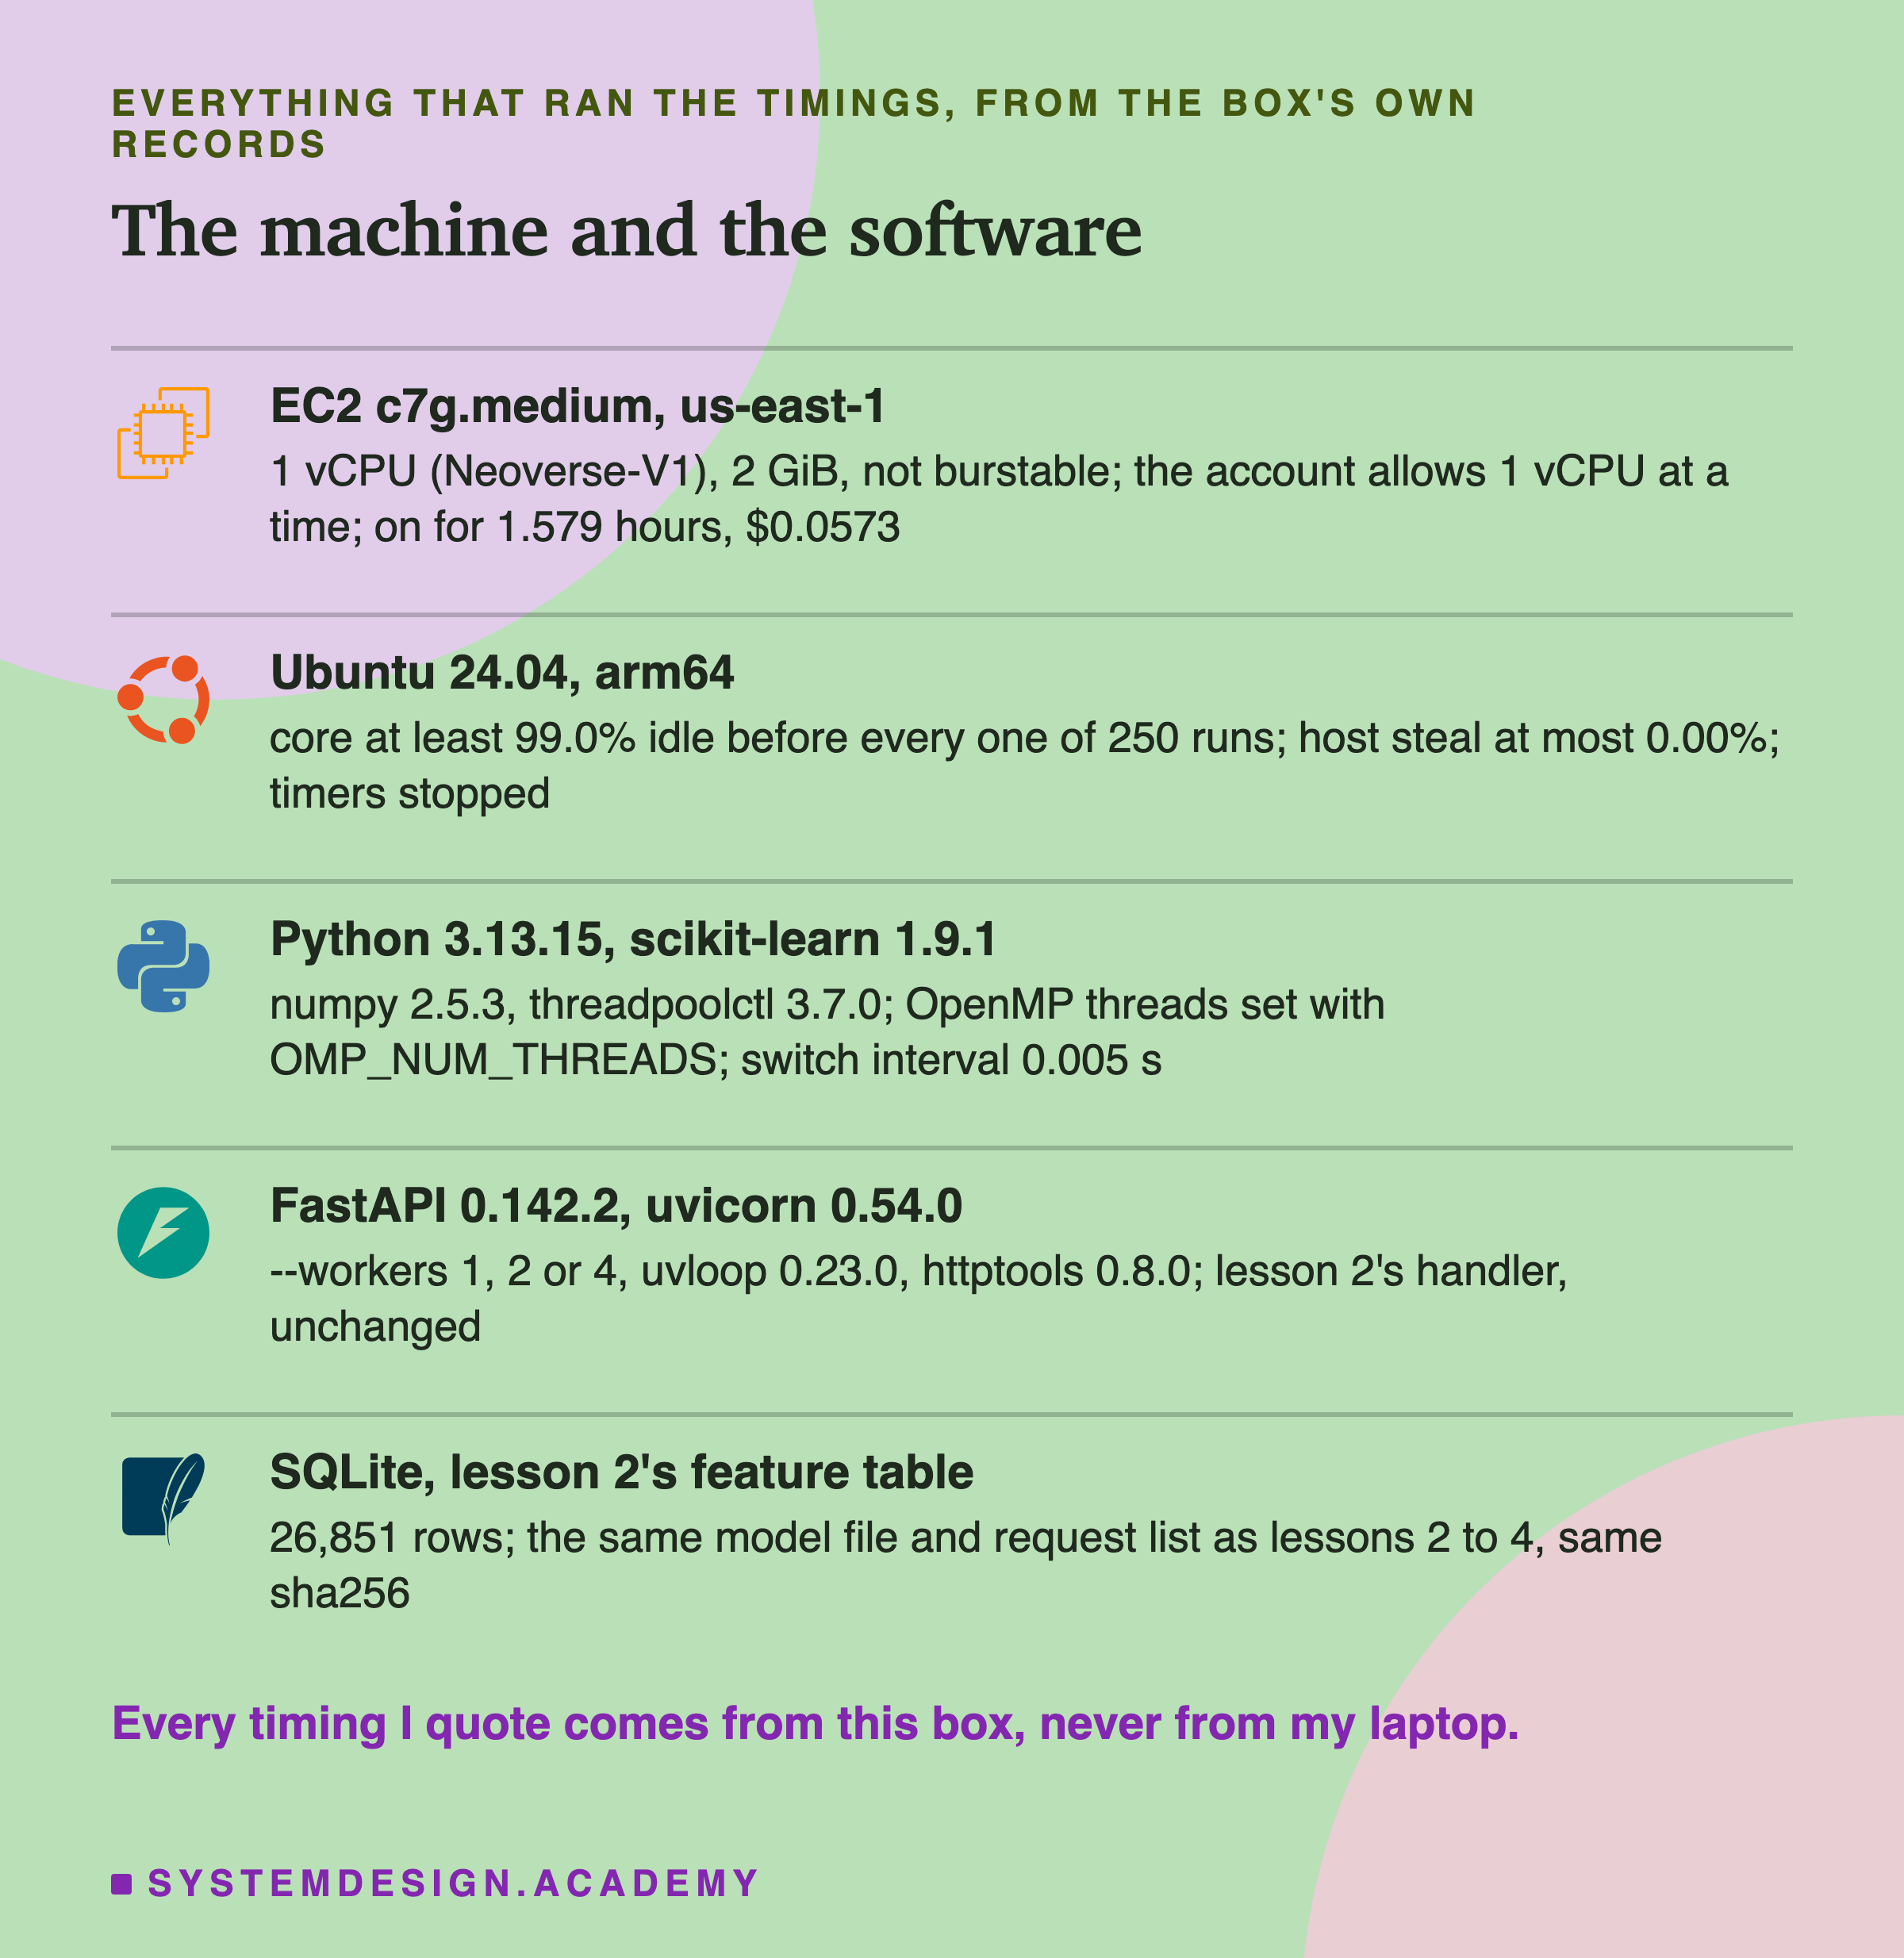
The box is an EC2 c7g.medium. AWS's own API lists it with 1 virtual CPU, 1 core, 2,048 MiB of memory and no bursting. Its AWS page says C7g instances use Graviton3 processors.
A few names in the figure. uvloop is a faster event loop that uvicorn can use in place of Python's own. httptools is a fast reader of messages. Lessons 2 to 4 used both. Steal is time the machine under a rented box gives to other customers' boxes instead of mine; Linux counts it, and here it was 0.00%.
The client and the service share that one core, as in lesson 4. So every answer costs some core time in the client too. In the closed-loop runs of 1x1, the client used about 0.08 of the core. Its work per answer is the same in every setting, so the comparisons between settings are fair. But the absolute numbers are lower than a service would reach with its client on another machine.
Before every run, the service was started and every worker had loaded the model. Then the core had to be at least 95% idle over two seconds before the client began. In all 250 runs it was at least 99.0% idle. The one-minute load average is recorded too, but it decays too slowly to wait for between runs, so it reads high right after a busy run.
The Whole Lab in One Picture
Before the recordings, here is the whole lab as one numbered sequence. The numbers on the arrows match the numbers on the recordings that follow.
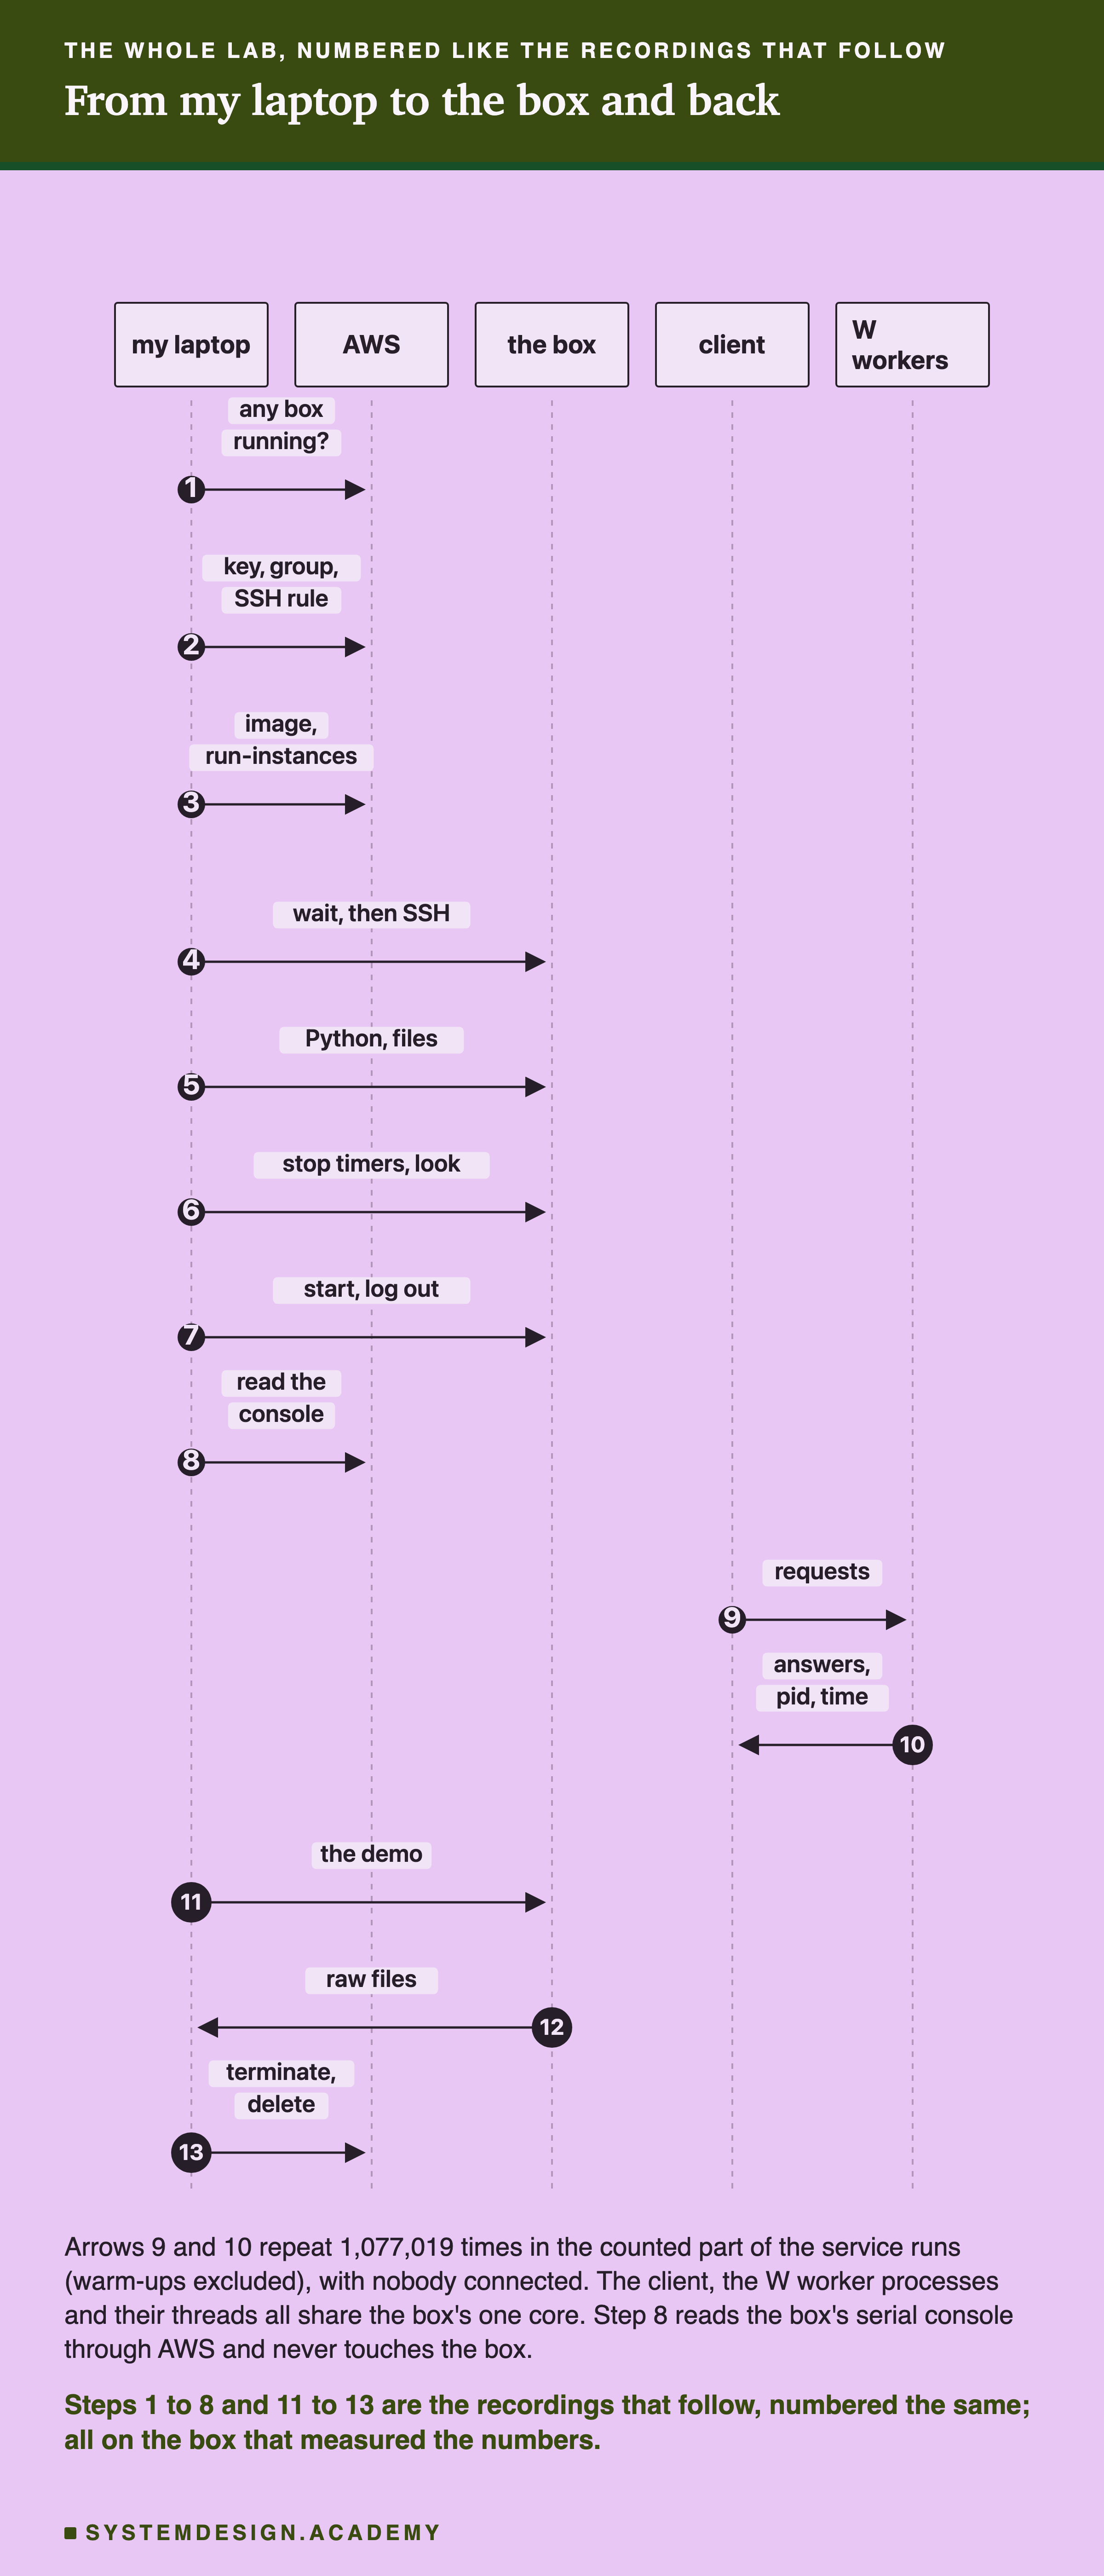
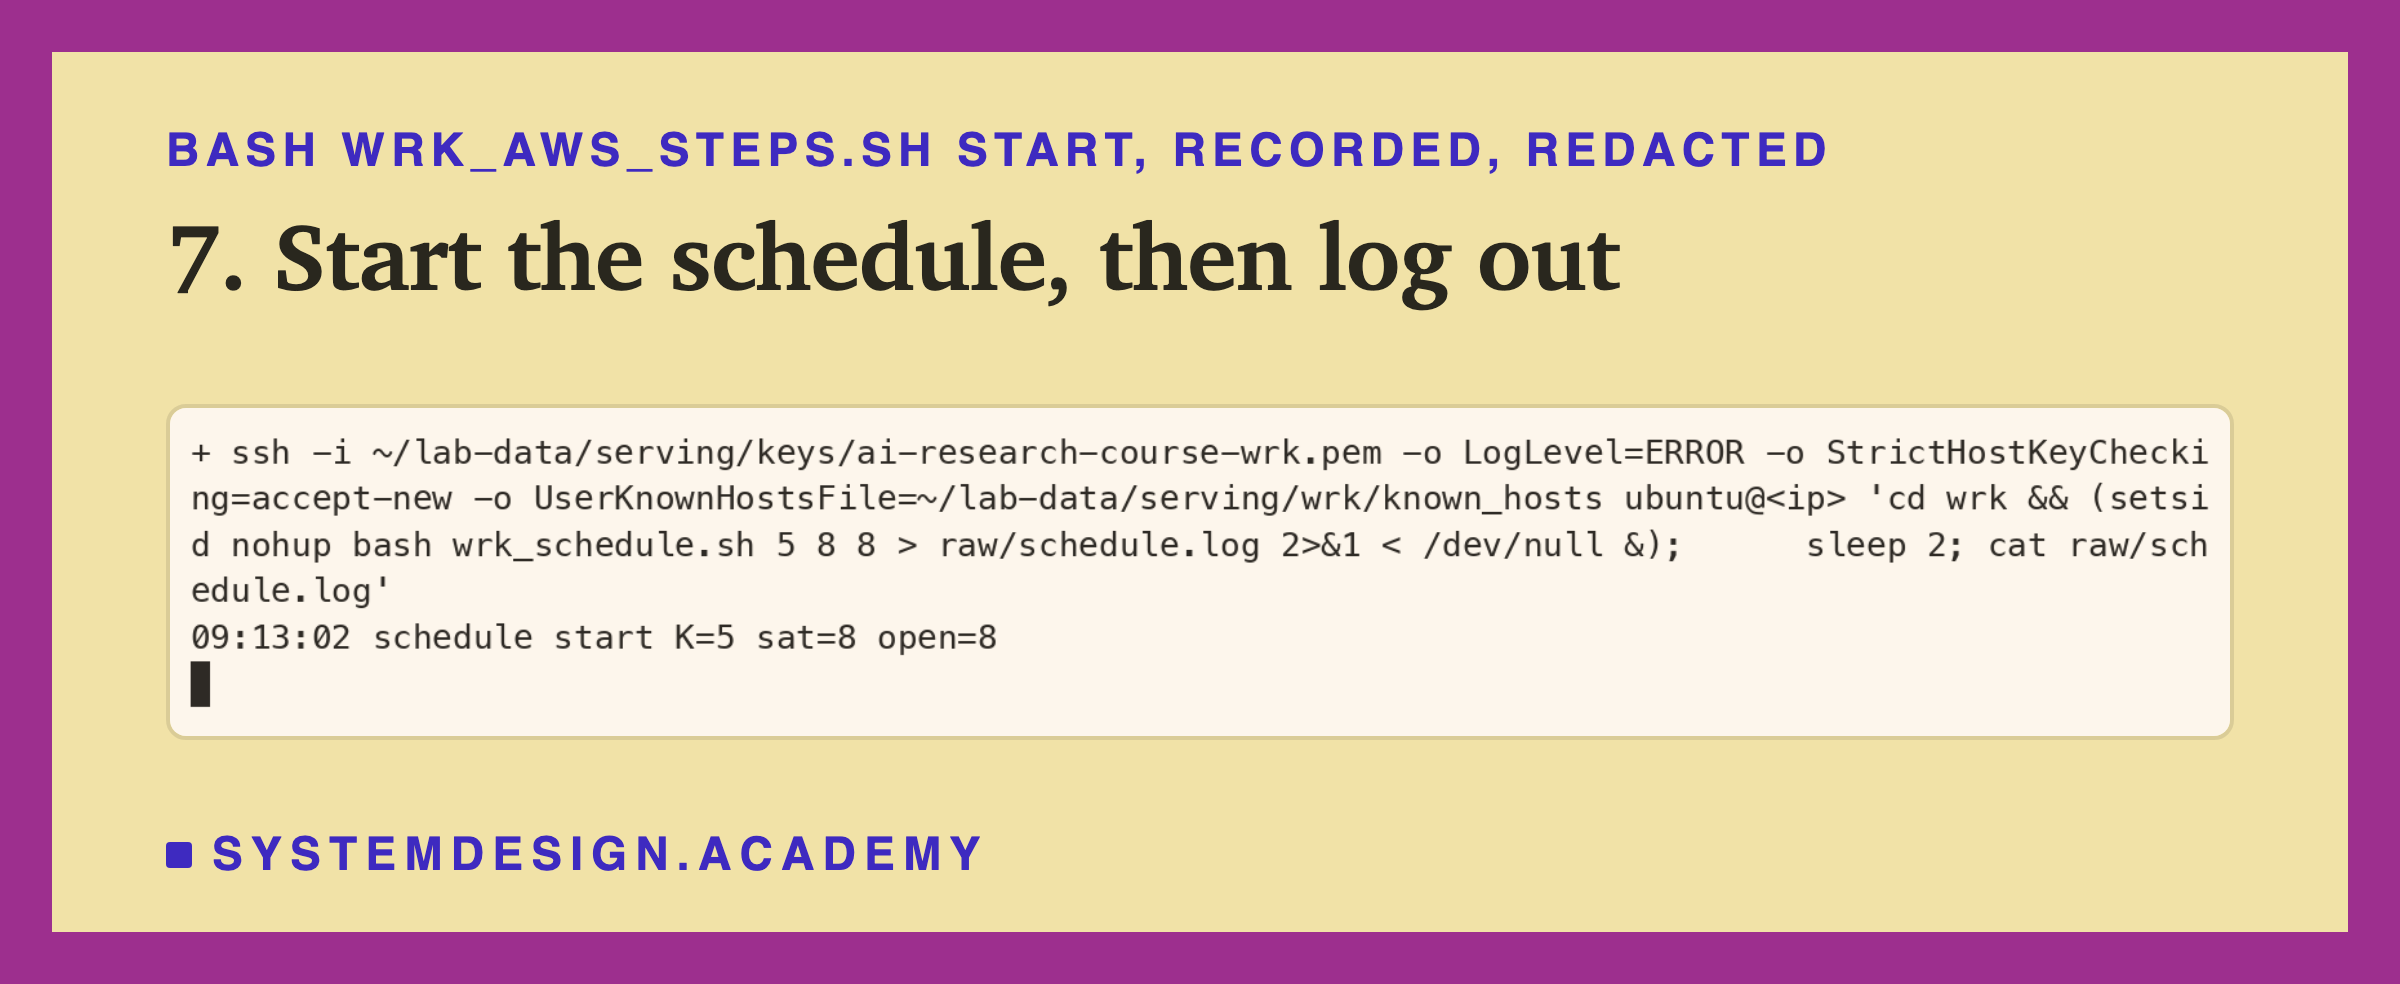
Steps 1 to 7 happen once: check, rent the box, set it up, and start the schedule. Step 8 is how I watched the schedule without touching the box. Arrows 9 and 10 are the timed work: 1,077,019 answers in the counted part of the runs, warm-ups excluded, with nobody logged in. Each answer carries two things lesson 2's answer did not: the id of the worker process that answered, and how long its own predict_proba call took. Steps 11 to 13 come after the schedule: the student demo, the copy of the results back to my laptop, and the deletion of everything.
Build the Lab Box Yourself
The rented box is part of the lab, so I show every step of it. You can rent the same kind of box and run the same schedule. The flow figure numbers the steps, and each recording below carries the same number.
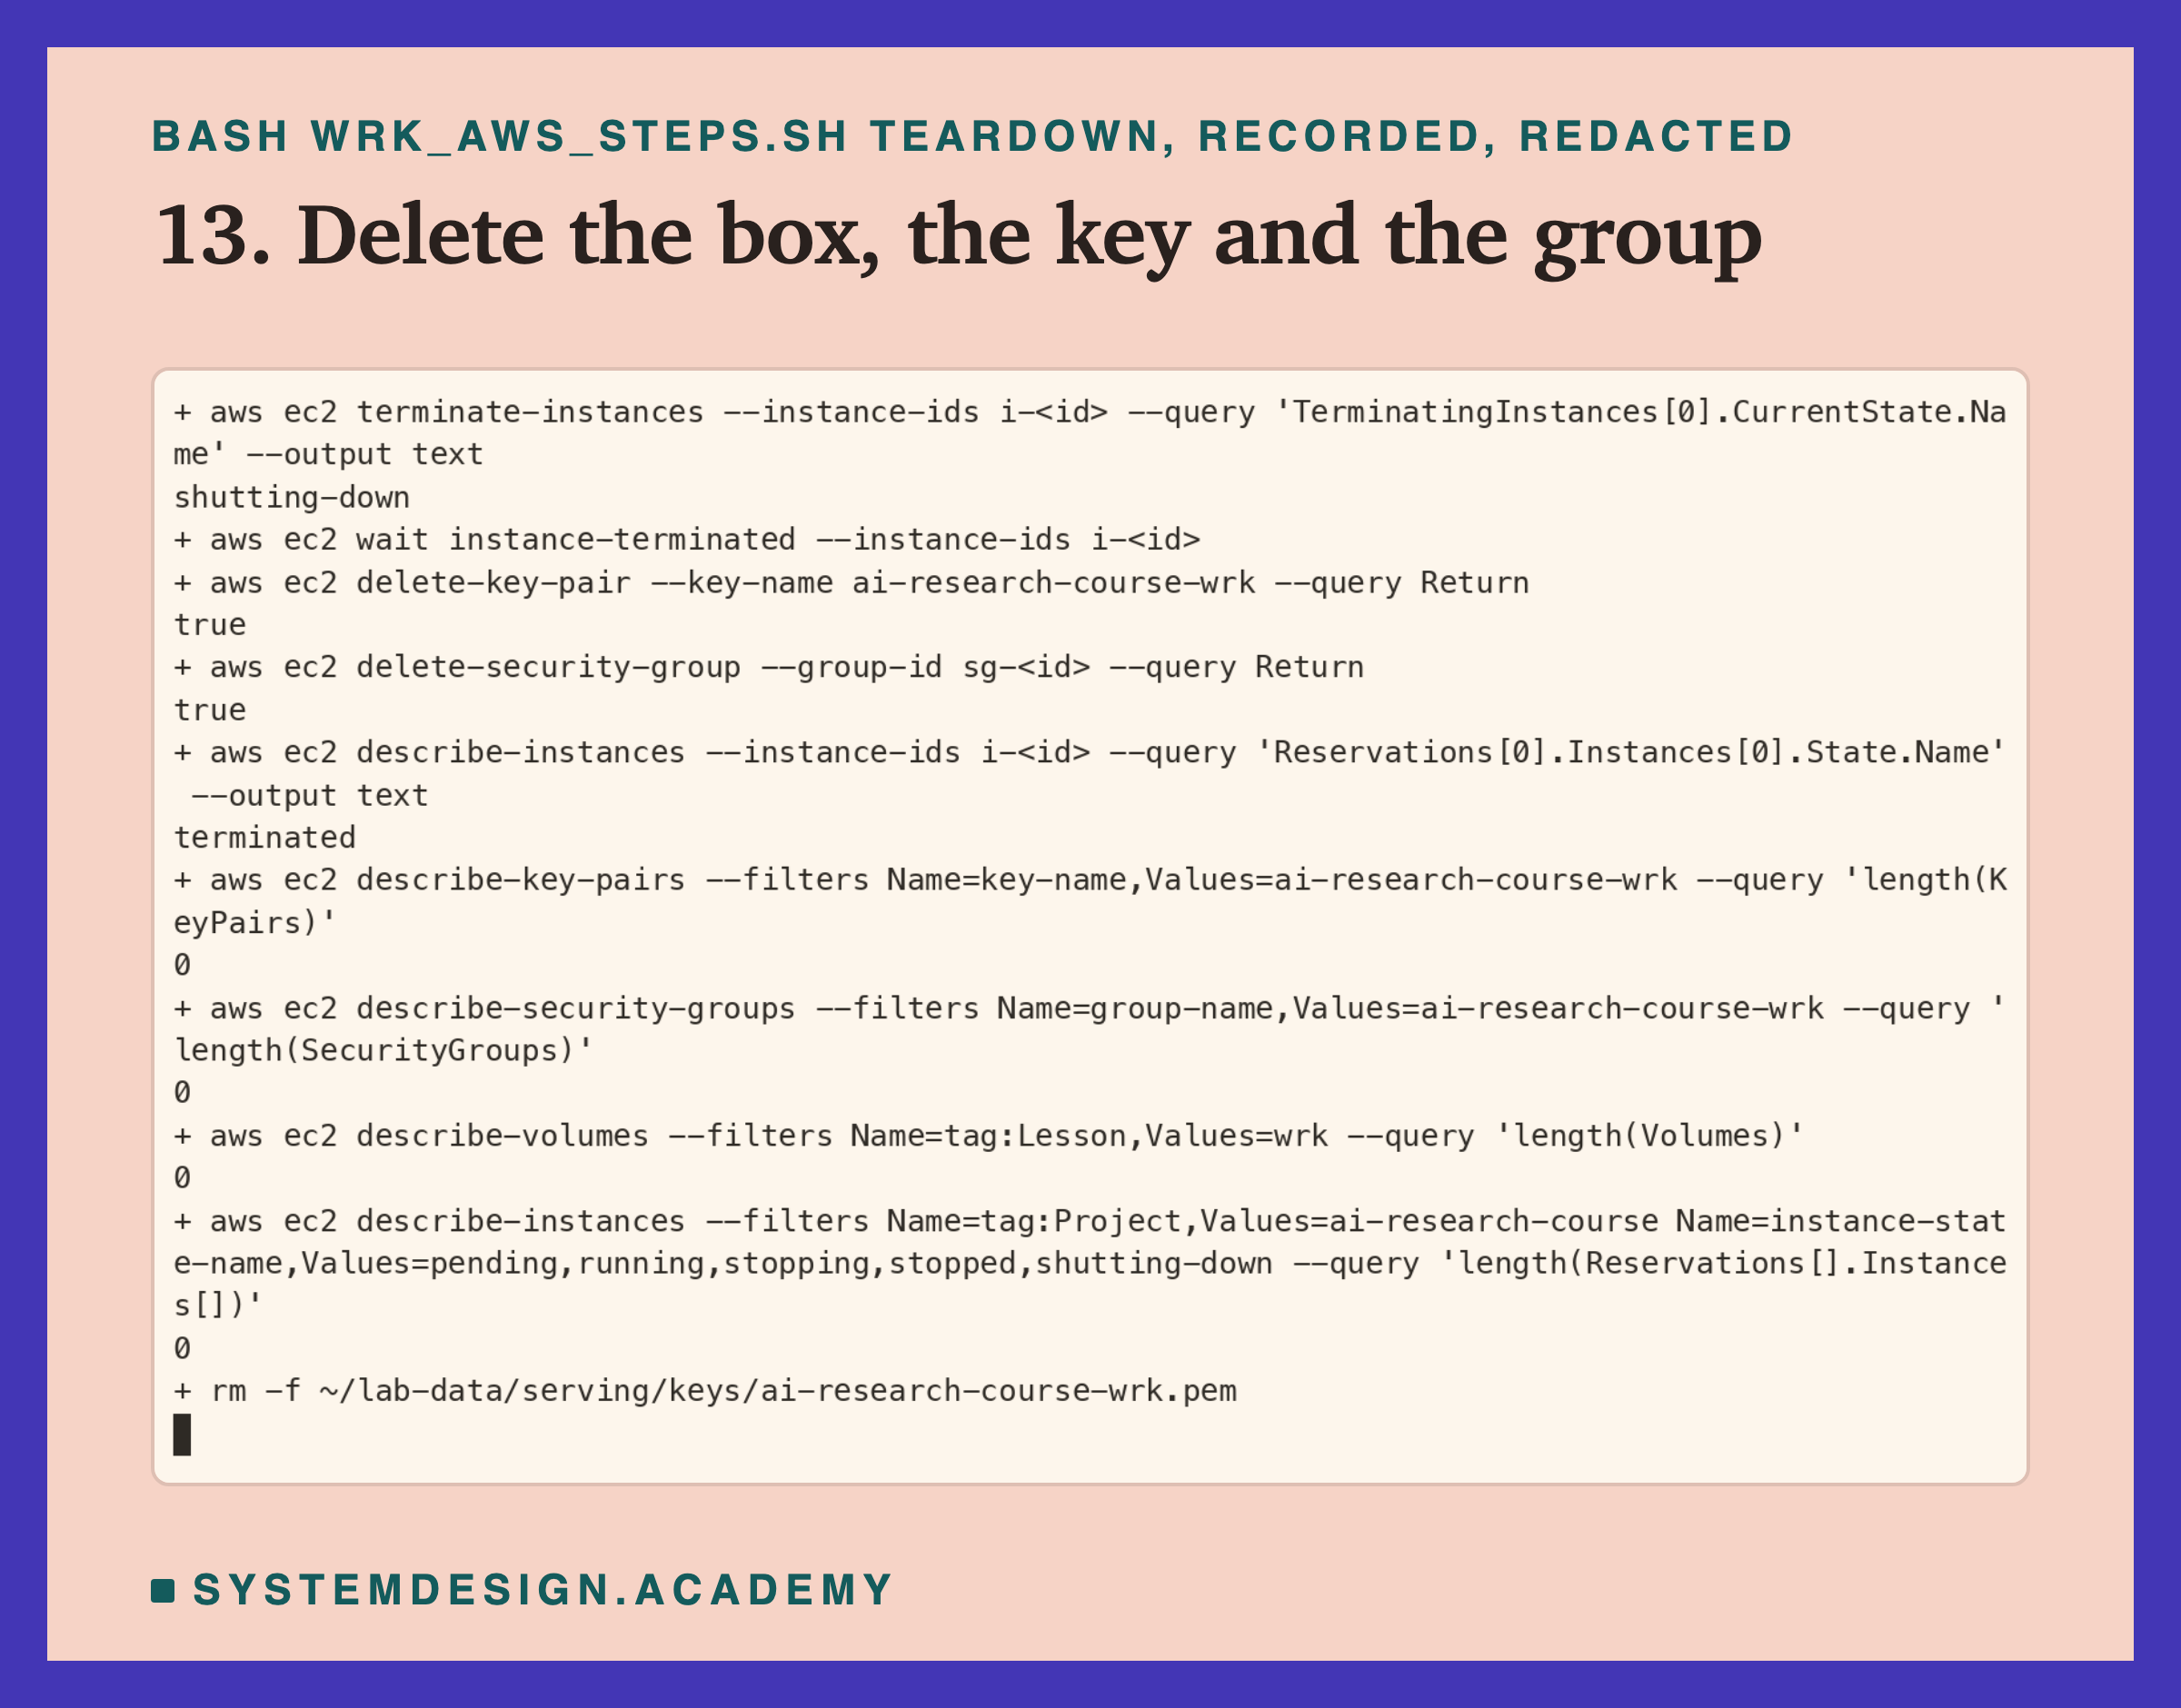
Which box you see. Every recording comes from the box that measured this lesson's numbers. I planned the order so that no recording happened during a timed run, and nobody logged in while the schedule ran. Steps 1 to 7 come before the schedule. Step 8 reads the box from outside without logging in. Steps 11 to 13 come after the schedule finished.
What you need first. An AWS account, the AWS command line tool (aws) set up with your keys, and ssh, scp, rsync and curl. All the steps live in one file, scripts/labs/serving/wrk_files/wrk_aws_steps.sh. You run it from the scripts/labs/serving folder, one step at a time: bash wrk_files/wrk_aws_steps.sh check, then access, and so on. Every code block below is copied word for word from that file.
The blocks use a few names the file sets at its top; run these lines first, from the scripts/labs/serving folder, if you paste the blocks by hand. All of them are copied from the file, except HERE=$PWD: the file works out that folder from its own location, which a pasted line cannot do.
export AWS_DEFAULT_REGION=us-east-1 AWS_PAGER=""
NAME=ai-research-course-wrk
HERE=$PWD
STATE=${WRK_STATE:-$HOME/lab-data/serving/wrk}
KEY=$HOME/lab-data/serving/keys/$NAME.pem
K=${K:-5}; SAT_S=${SAT_S:-8}; OPEN_S=${OPEN_S:-8}
mkdir -p "$STATE" "$HOME/lab-data/serving/keys"
SSHO=(-o LogLevel=ERROR -o StrictHostKeyChecking=accept-new -o "UserKnownHostsFile=$STATE/known_hosts")
[ -f "$STATE/id" ] && ID=$(cat "$STATE/id")
[ -f "$STATE/ip" ] && IP=$(cat "$STATE/ip")
[ -f "$STATE/sg" ] && SG=$(cat "$STATE/sg")
  B=/home/ubuntu/wrk
Steps 1 to 3: Check, Lock the Door, Rent the Box
Step 1: is any other course box running? My account allows one box of this kind at a time, and another lesson may be using it. So the first command counts the course's boxes that are not yet deleted. It must print 0.
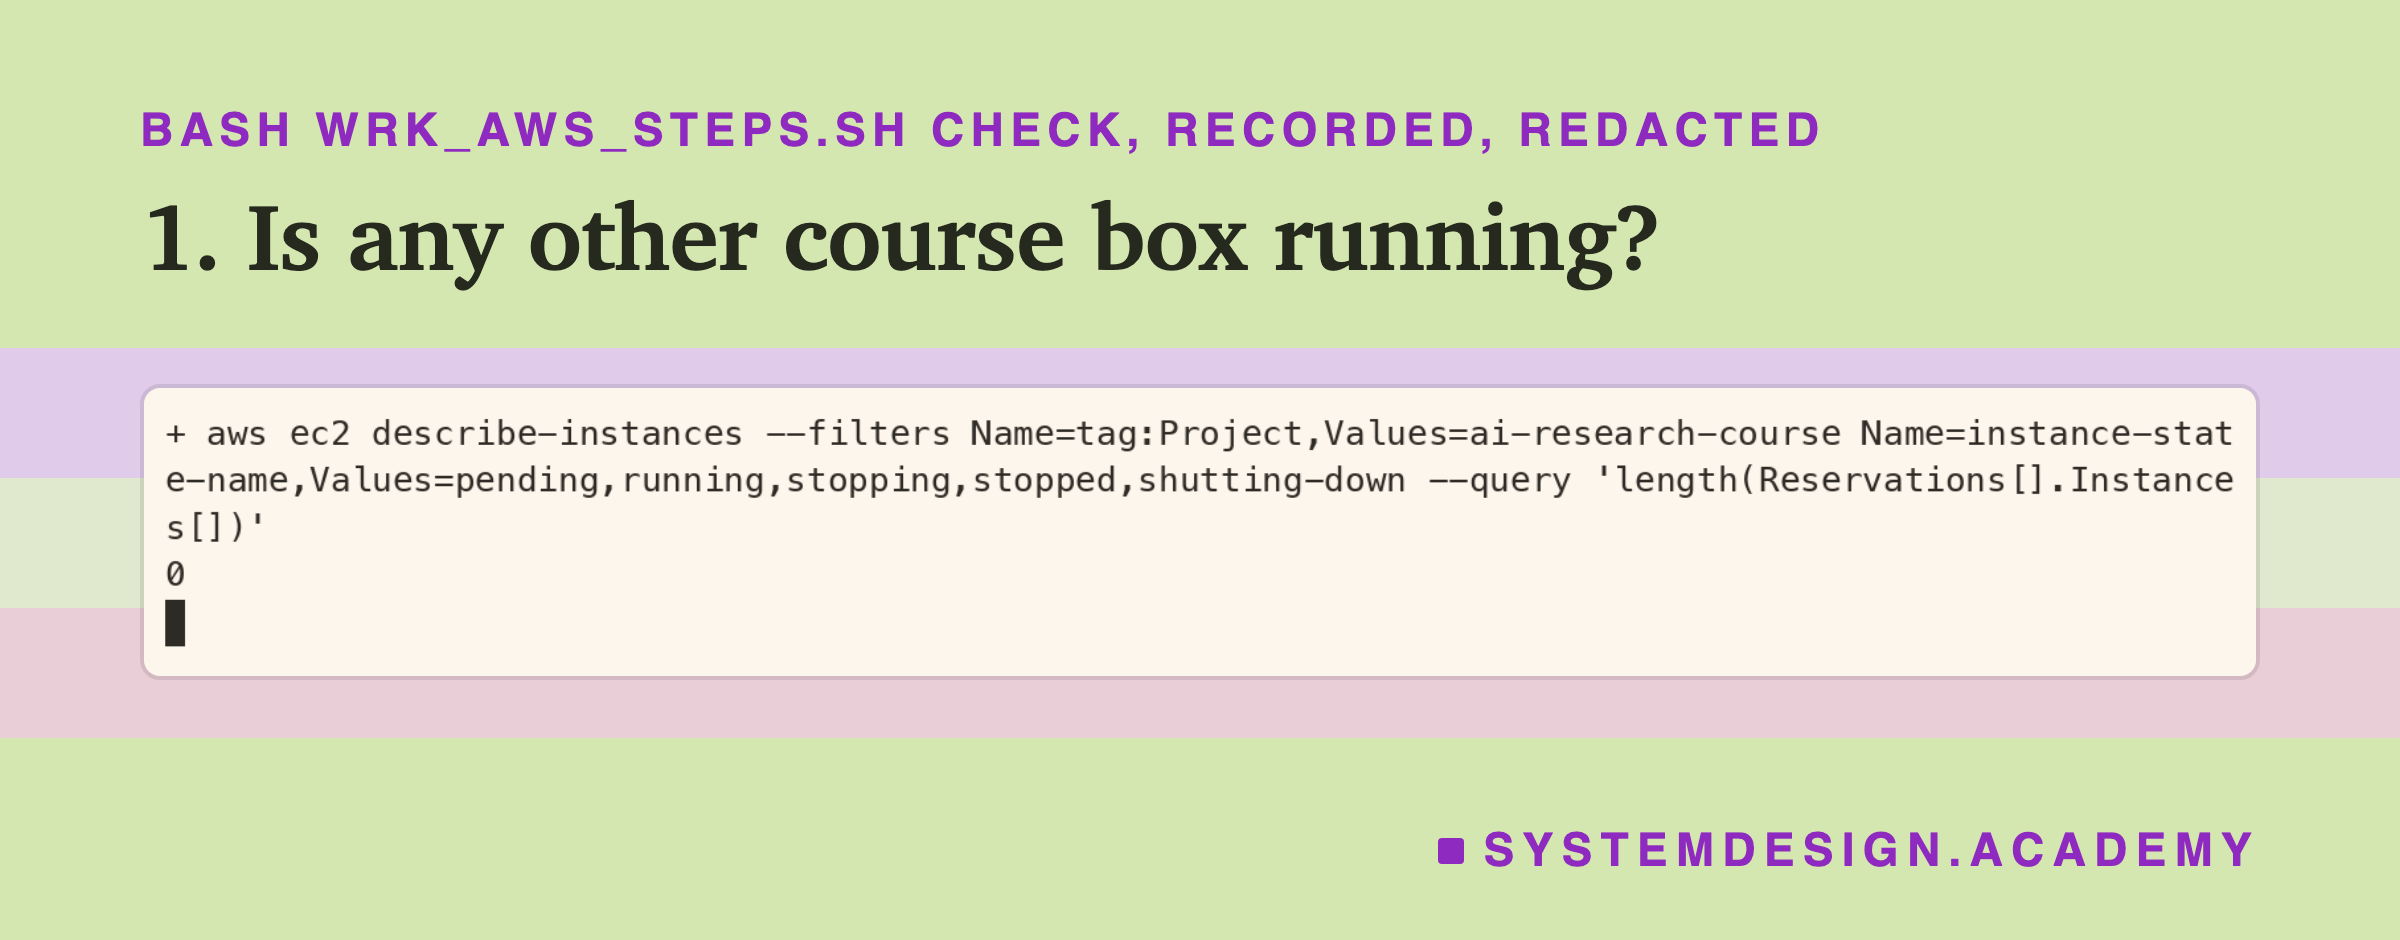
The recording shows the command and its answer, 0, so no other course box was alive. This is the command, copied from the step script:
  aws ec2 describe-instances --filters "Name=tag:Project,Values=ai-research-course" \
    "Name=instance-state-name,Values=pending,running,stopping,stopped,shutting-down" \
    --query "length(Reservations[].Instances[])"
Step 2: a key and a locked door. A key pair is how you prove to the box that you are allowed in. AWS keeps one half, and you keep the other half in a file that only you can read. A security group is a door rule for the box. Mine opens only port 22, the SSH port, and only to my own address. Both get tags, labels that say which project and lesson they belong to.
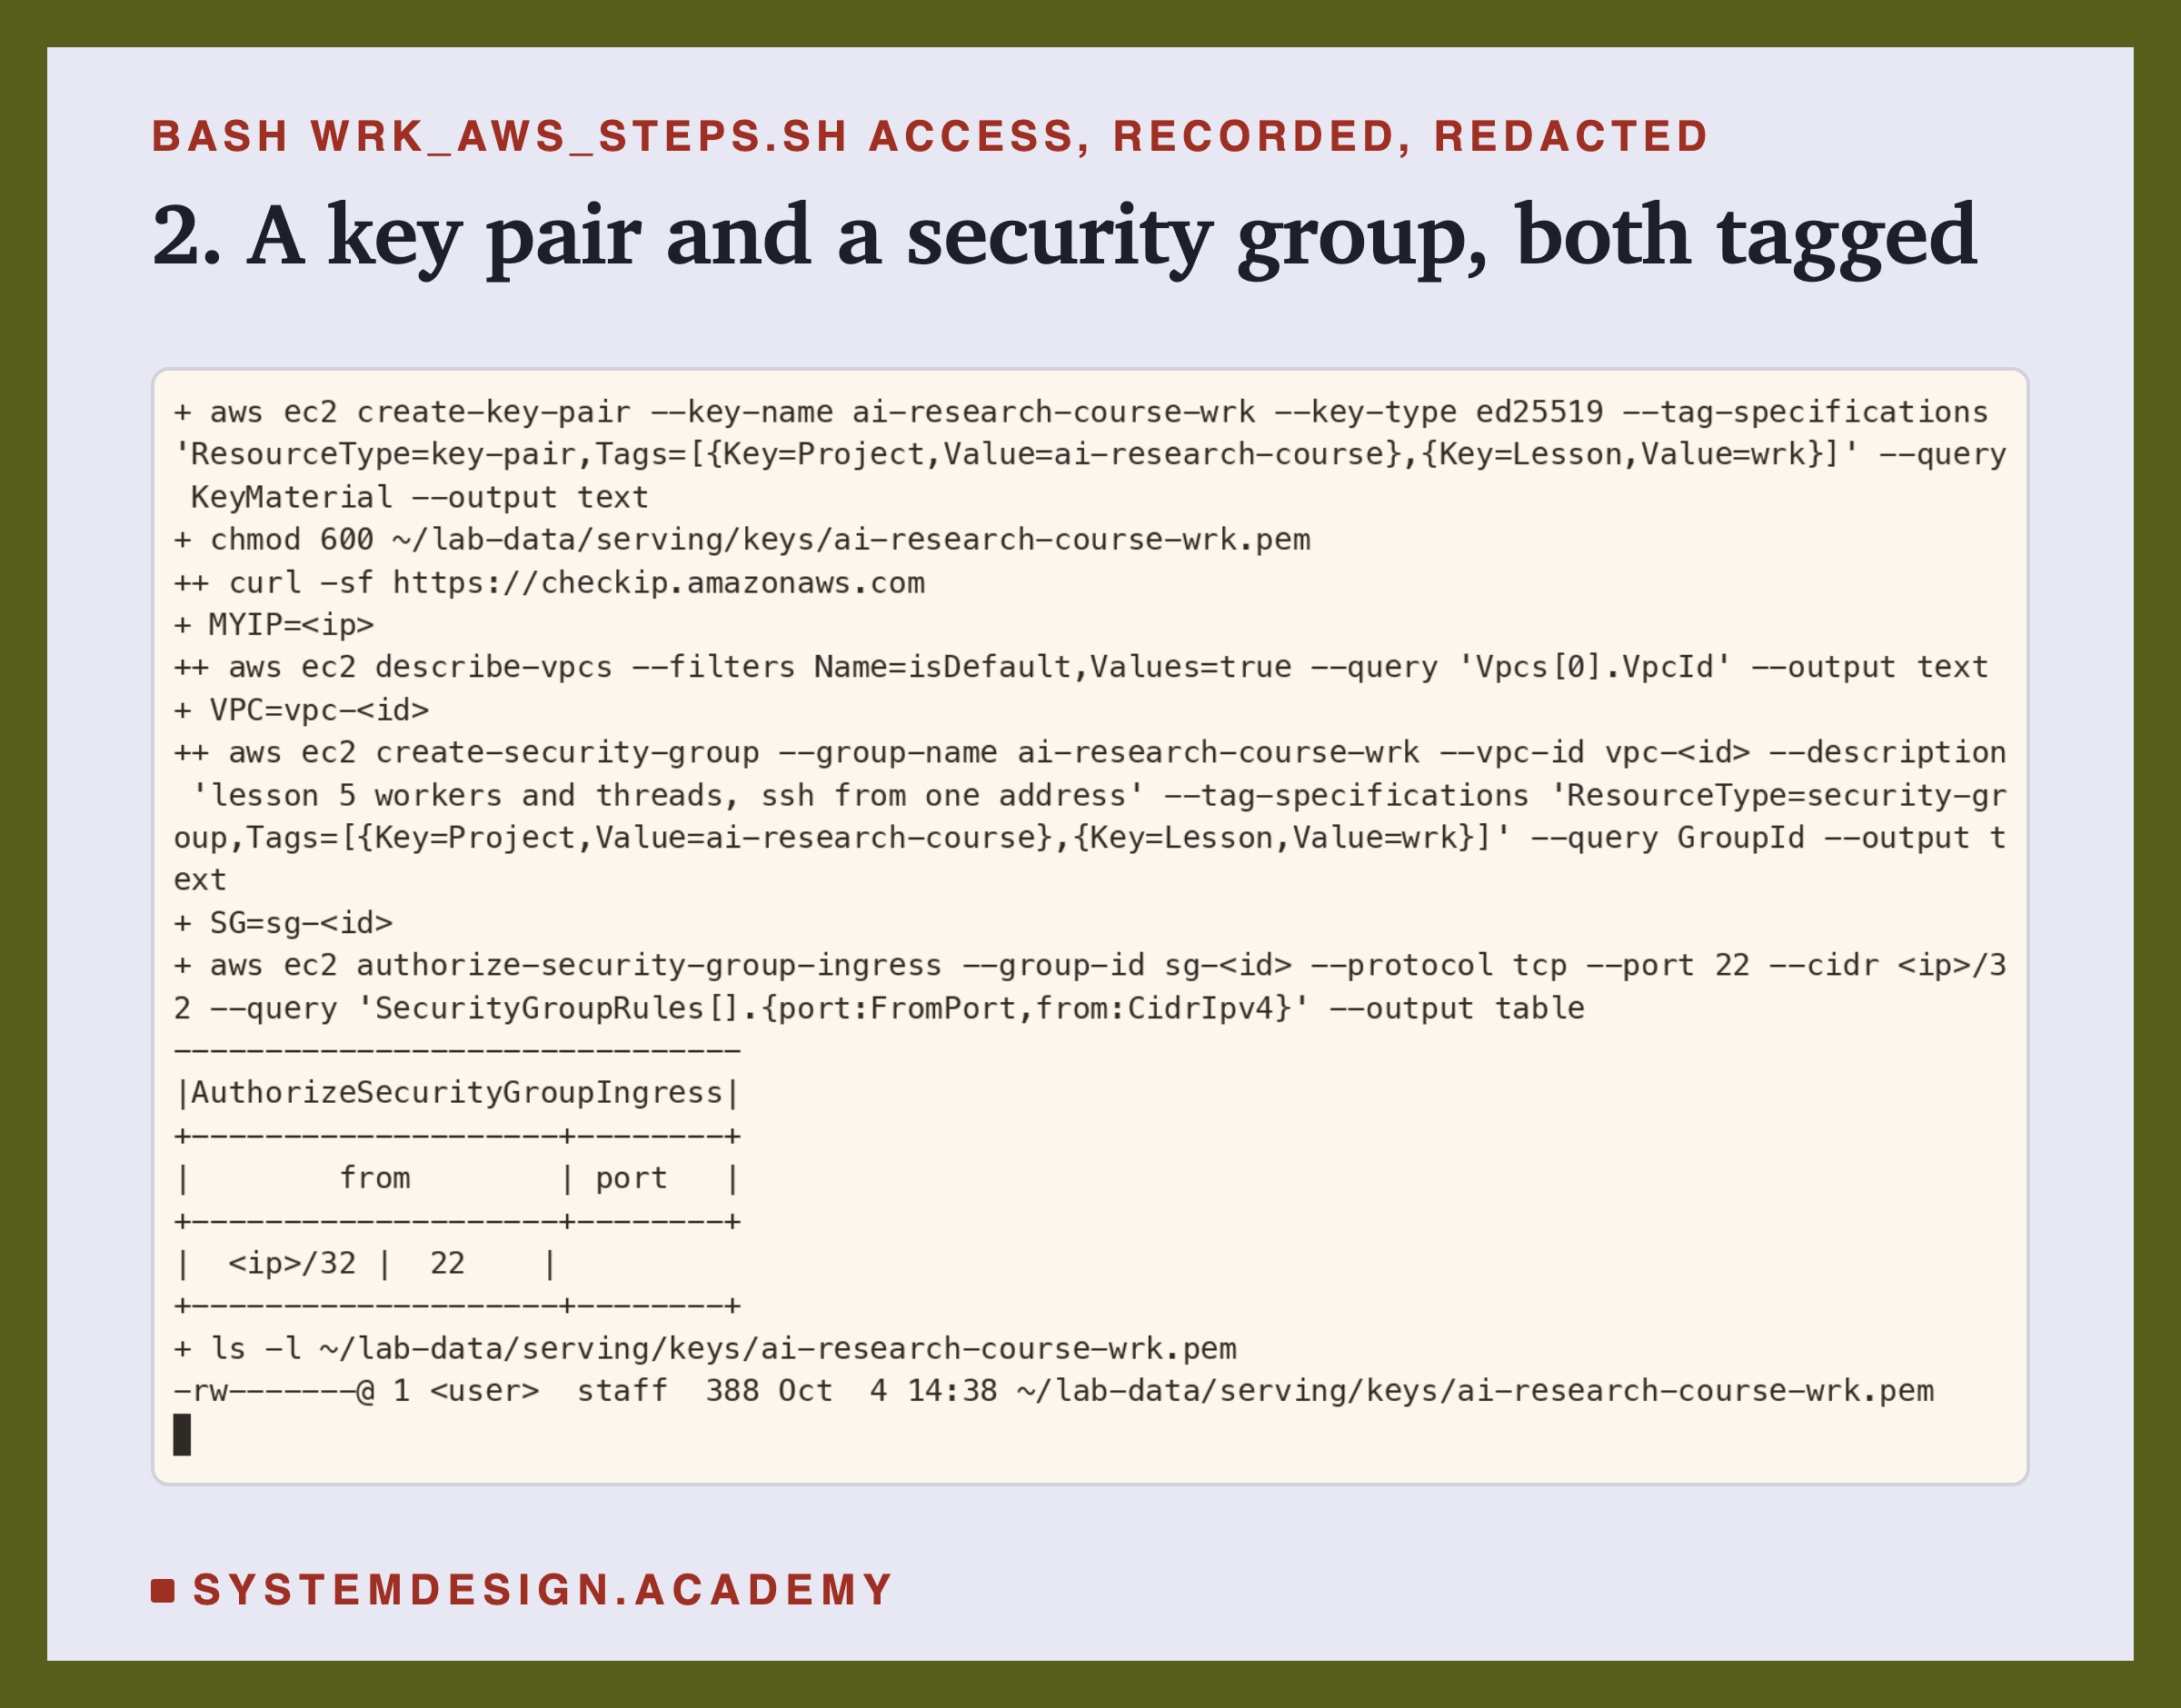
The key material went straight into the file and was never printed, and the door rule names only my own address. These are the commands:
  aws ec2 create-key-pair --key-name ai-research-course-wrk --key-type ed25519 \
    --tag-specifications "ResourceType=key-pair,Tags=[{Key=Project,Value=ai-research-course},{Key=Lesson,Value=wrk}]" \
    --query KeyMaterial --output text > ~/lab-data/serving/keys/ai-research-course-wrk.pem
  chmod 600 ~/lab-data/serving/keys/ai-research-course-wrk.pem
  MYIP=$(curl -sf https://checkip.amazonaws.com)
  VPC=$(aws ec2 describe-vpcs --filters Name=isDefault,Values=true --query "Vpcs[0].VpcId" --output text)
  SG=$(aws ec2 create-security-group --group-name ai-research-course-wrk --vpc-id "$VPC" \
    --description "lesson 5 workers and threads, ssh from one address" \
    --tag-specifications "ResourceType=security-group,Tags=[{Key=Project,Value=ai-research-course},{Key=Lesson,Value=wrk}]" \
    --query GroupId --output text)
  aws ec2 authorize-security-group-ingress --group-id "$SG" --protocol tcp --port 22 --cidr "$MYIP/32" \
    --query "SecurityGroupRules[].{port:FromPort,from:CidrIpv4}" --output table
Steps 4 to 7: Wait, Set Up, Look, Start
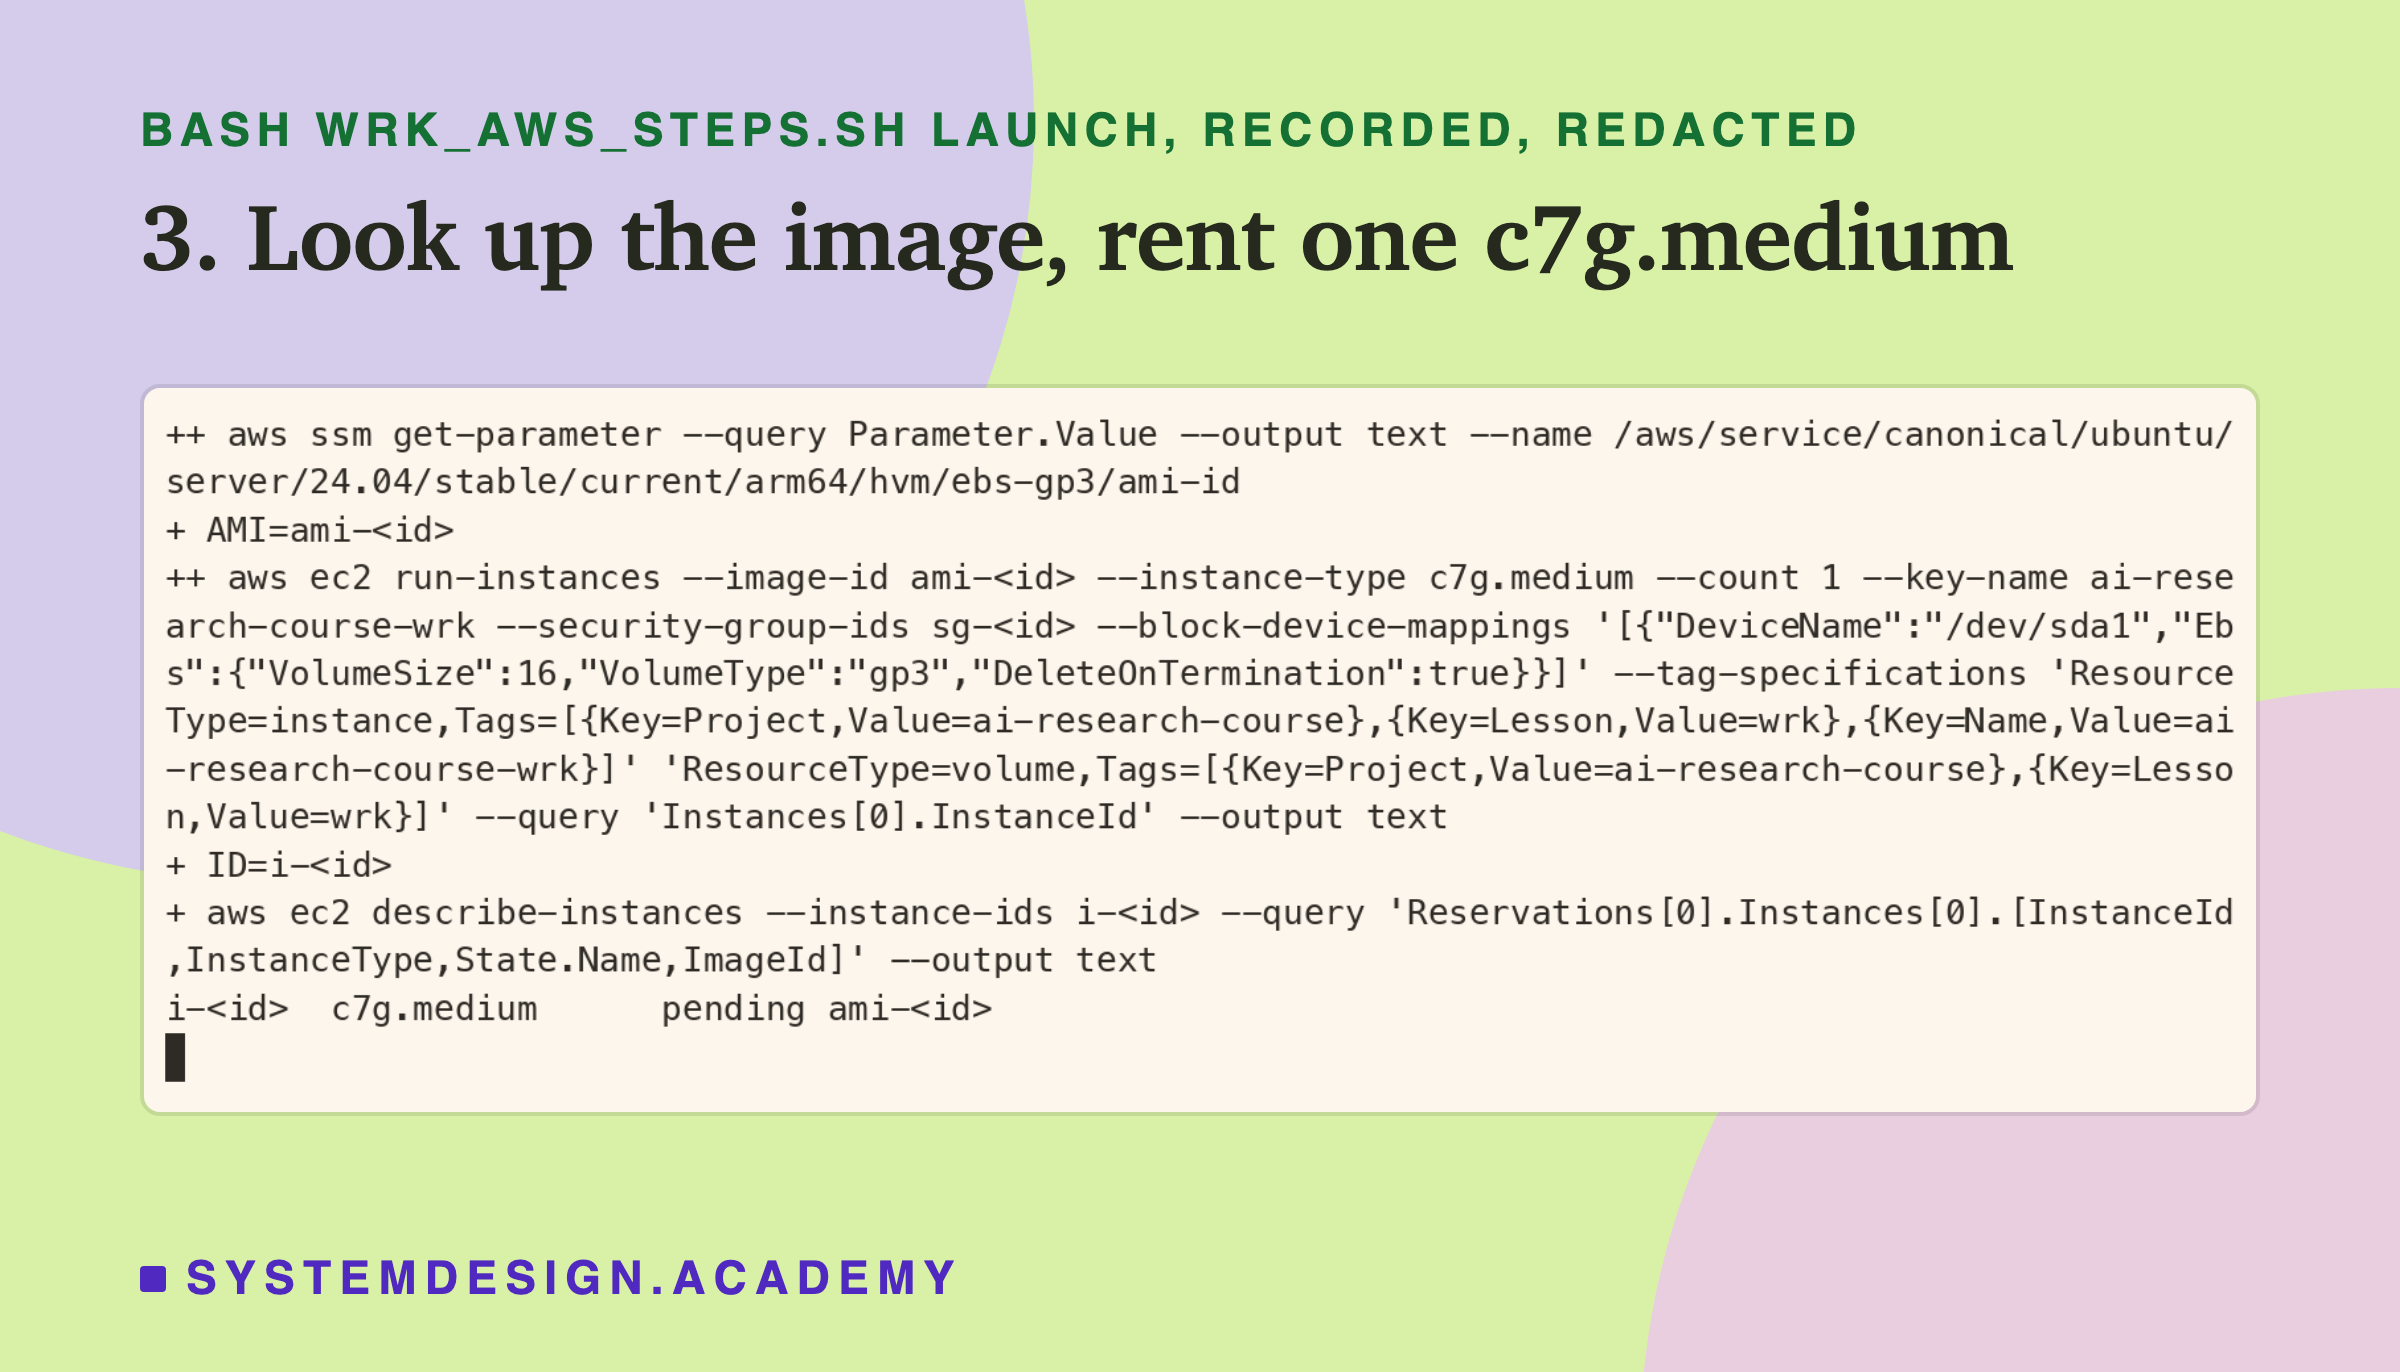
Step 4: wait until it runs. A new box takes a short while to start. The AWS tool can wait for you. Then the script reads the box's public address into the variable IP, and tries SSH every five seconds until the box answers.
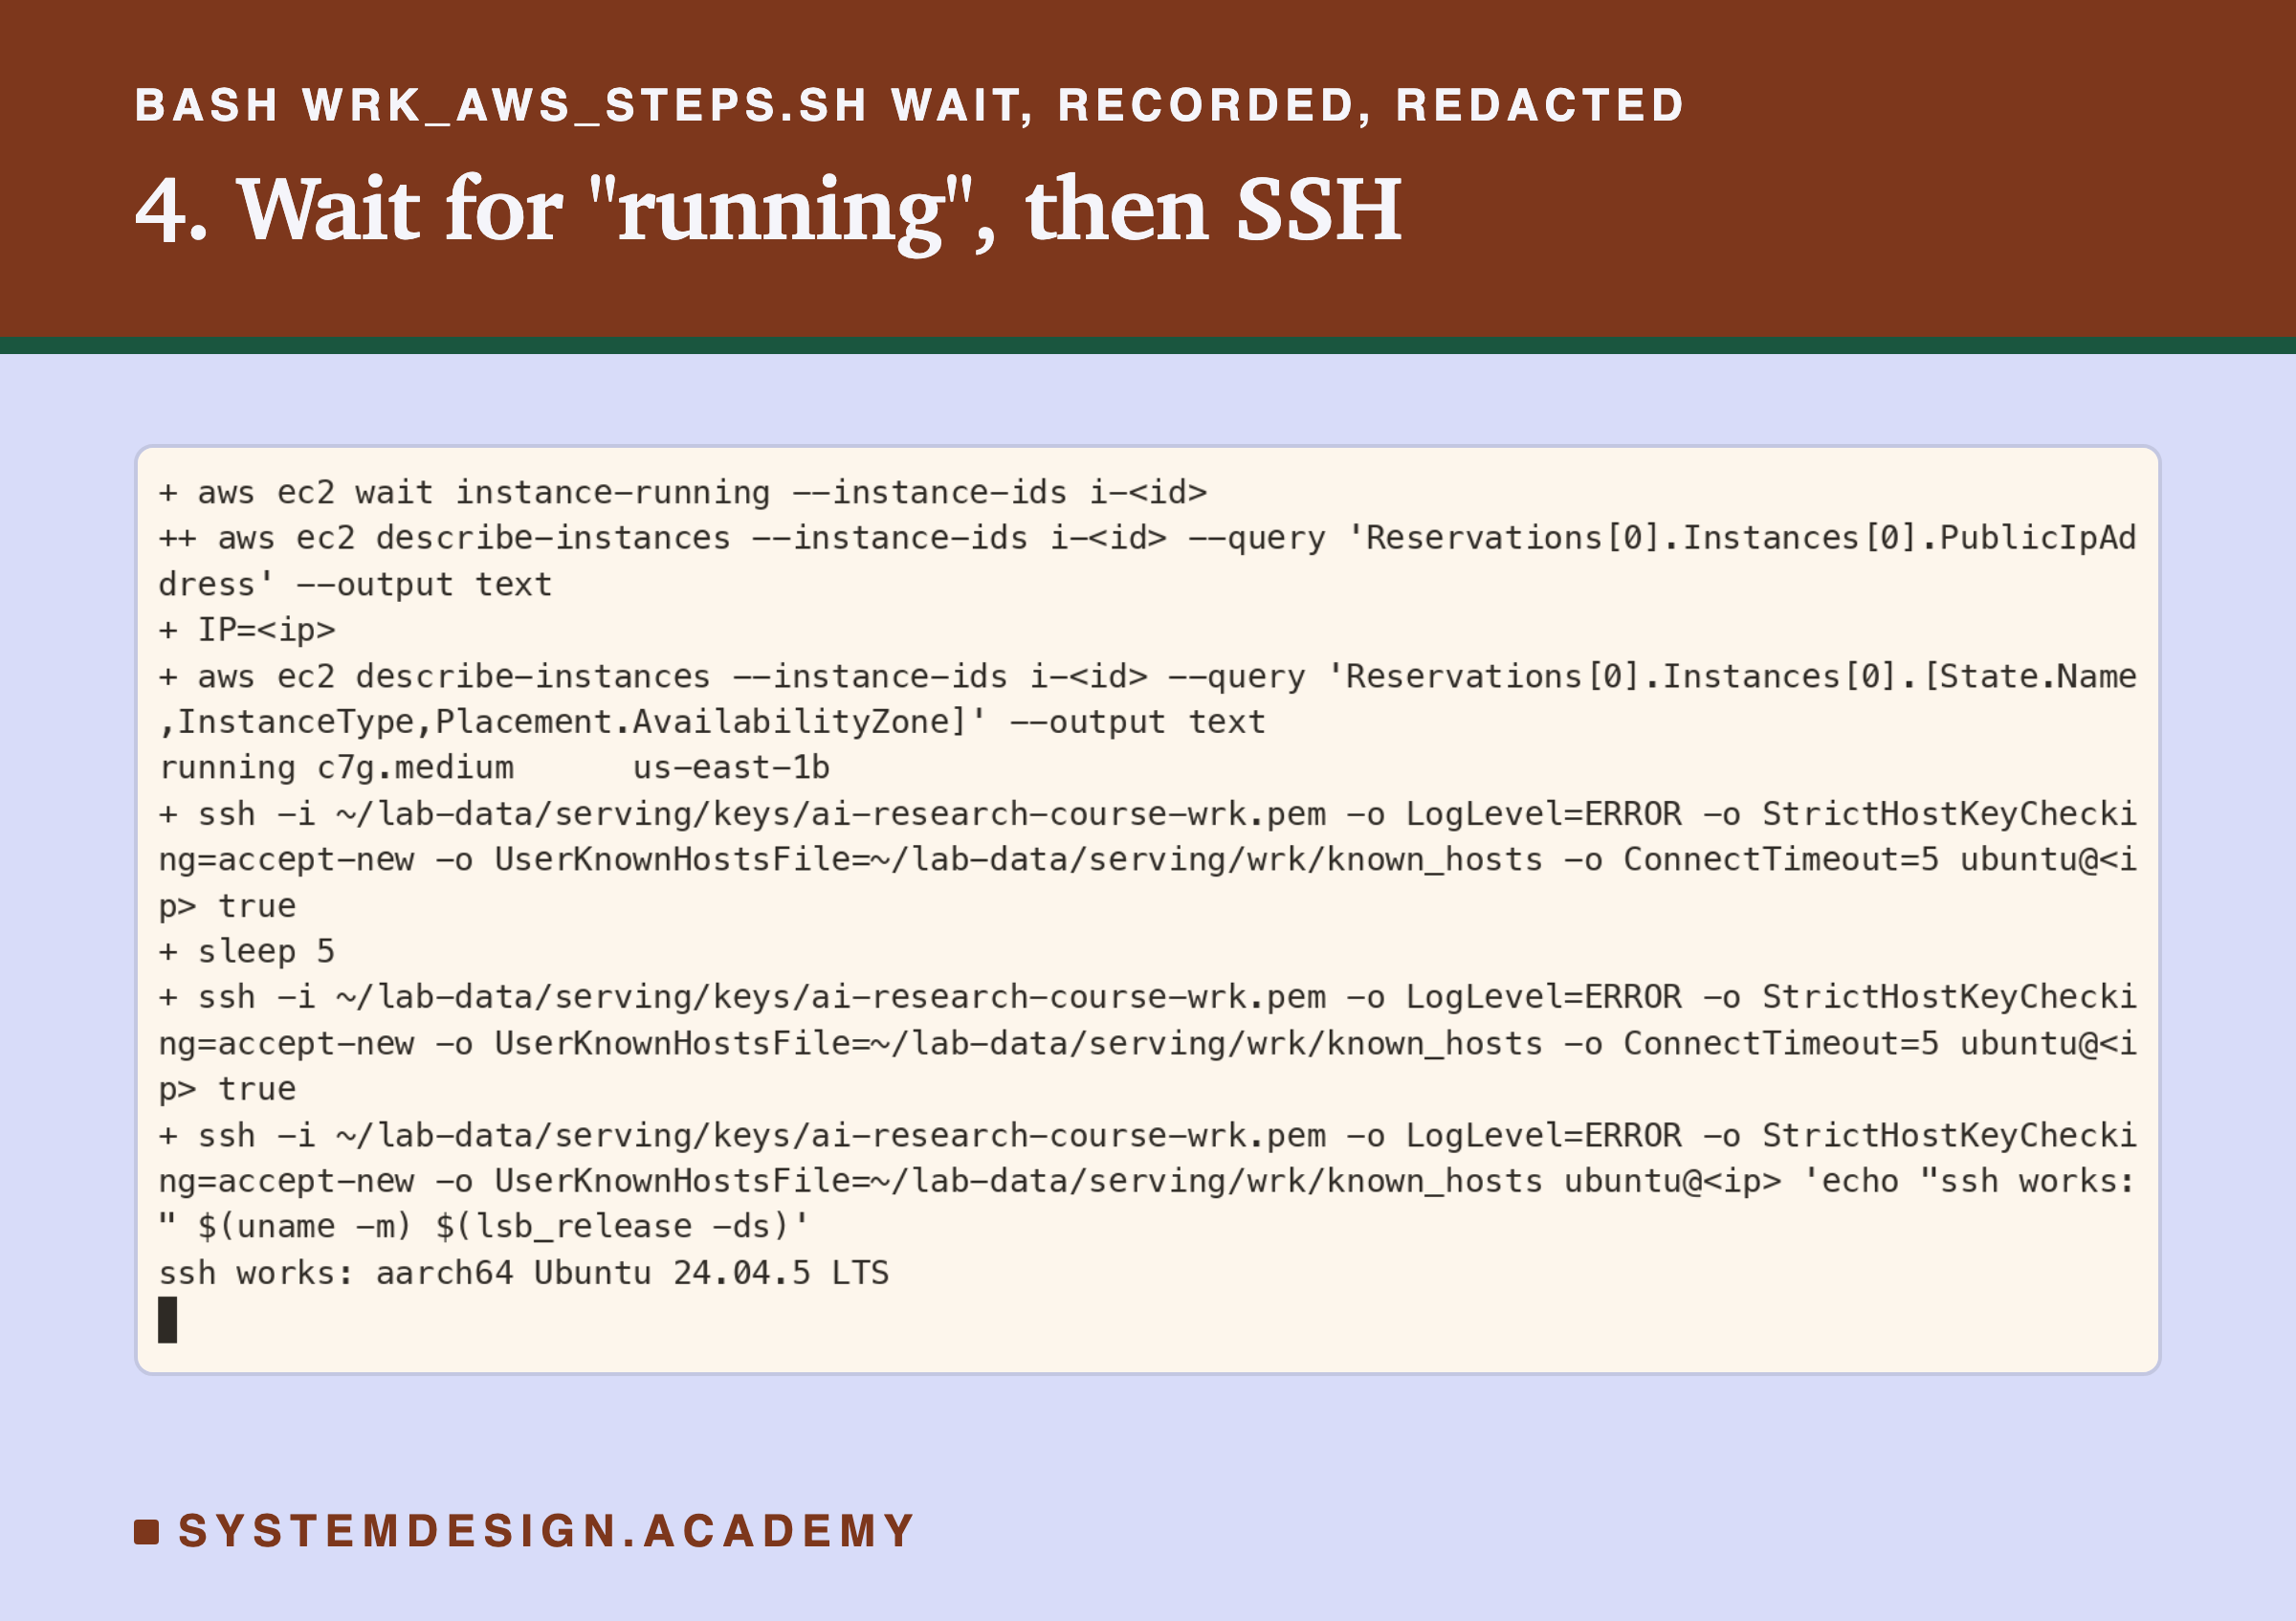
The first two SSH tries failed because the box was still starting, and the third one answered. These are the commands, with the retry loop:
  aws ec2 wait instance-running --instance-ids "$ID"
  IP=$(aws ec2 describe-instances --instance-ids "$ID" \
    --query "Reservations[0].Instances[0].PublicIpAddress" --output text)
  until ssh -i ~/lab-data/serving/keys/ai-research-course-wrk.pem "${SSHO[@]}" -o ConnectTimeout=5 \
    ubuntu@"$IP" true 2>/dev/null; do sleep 5; done
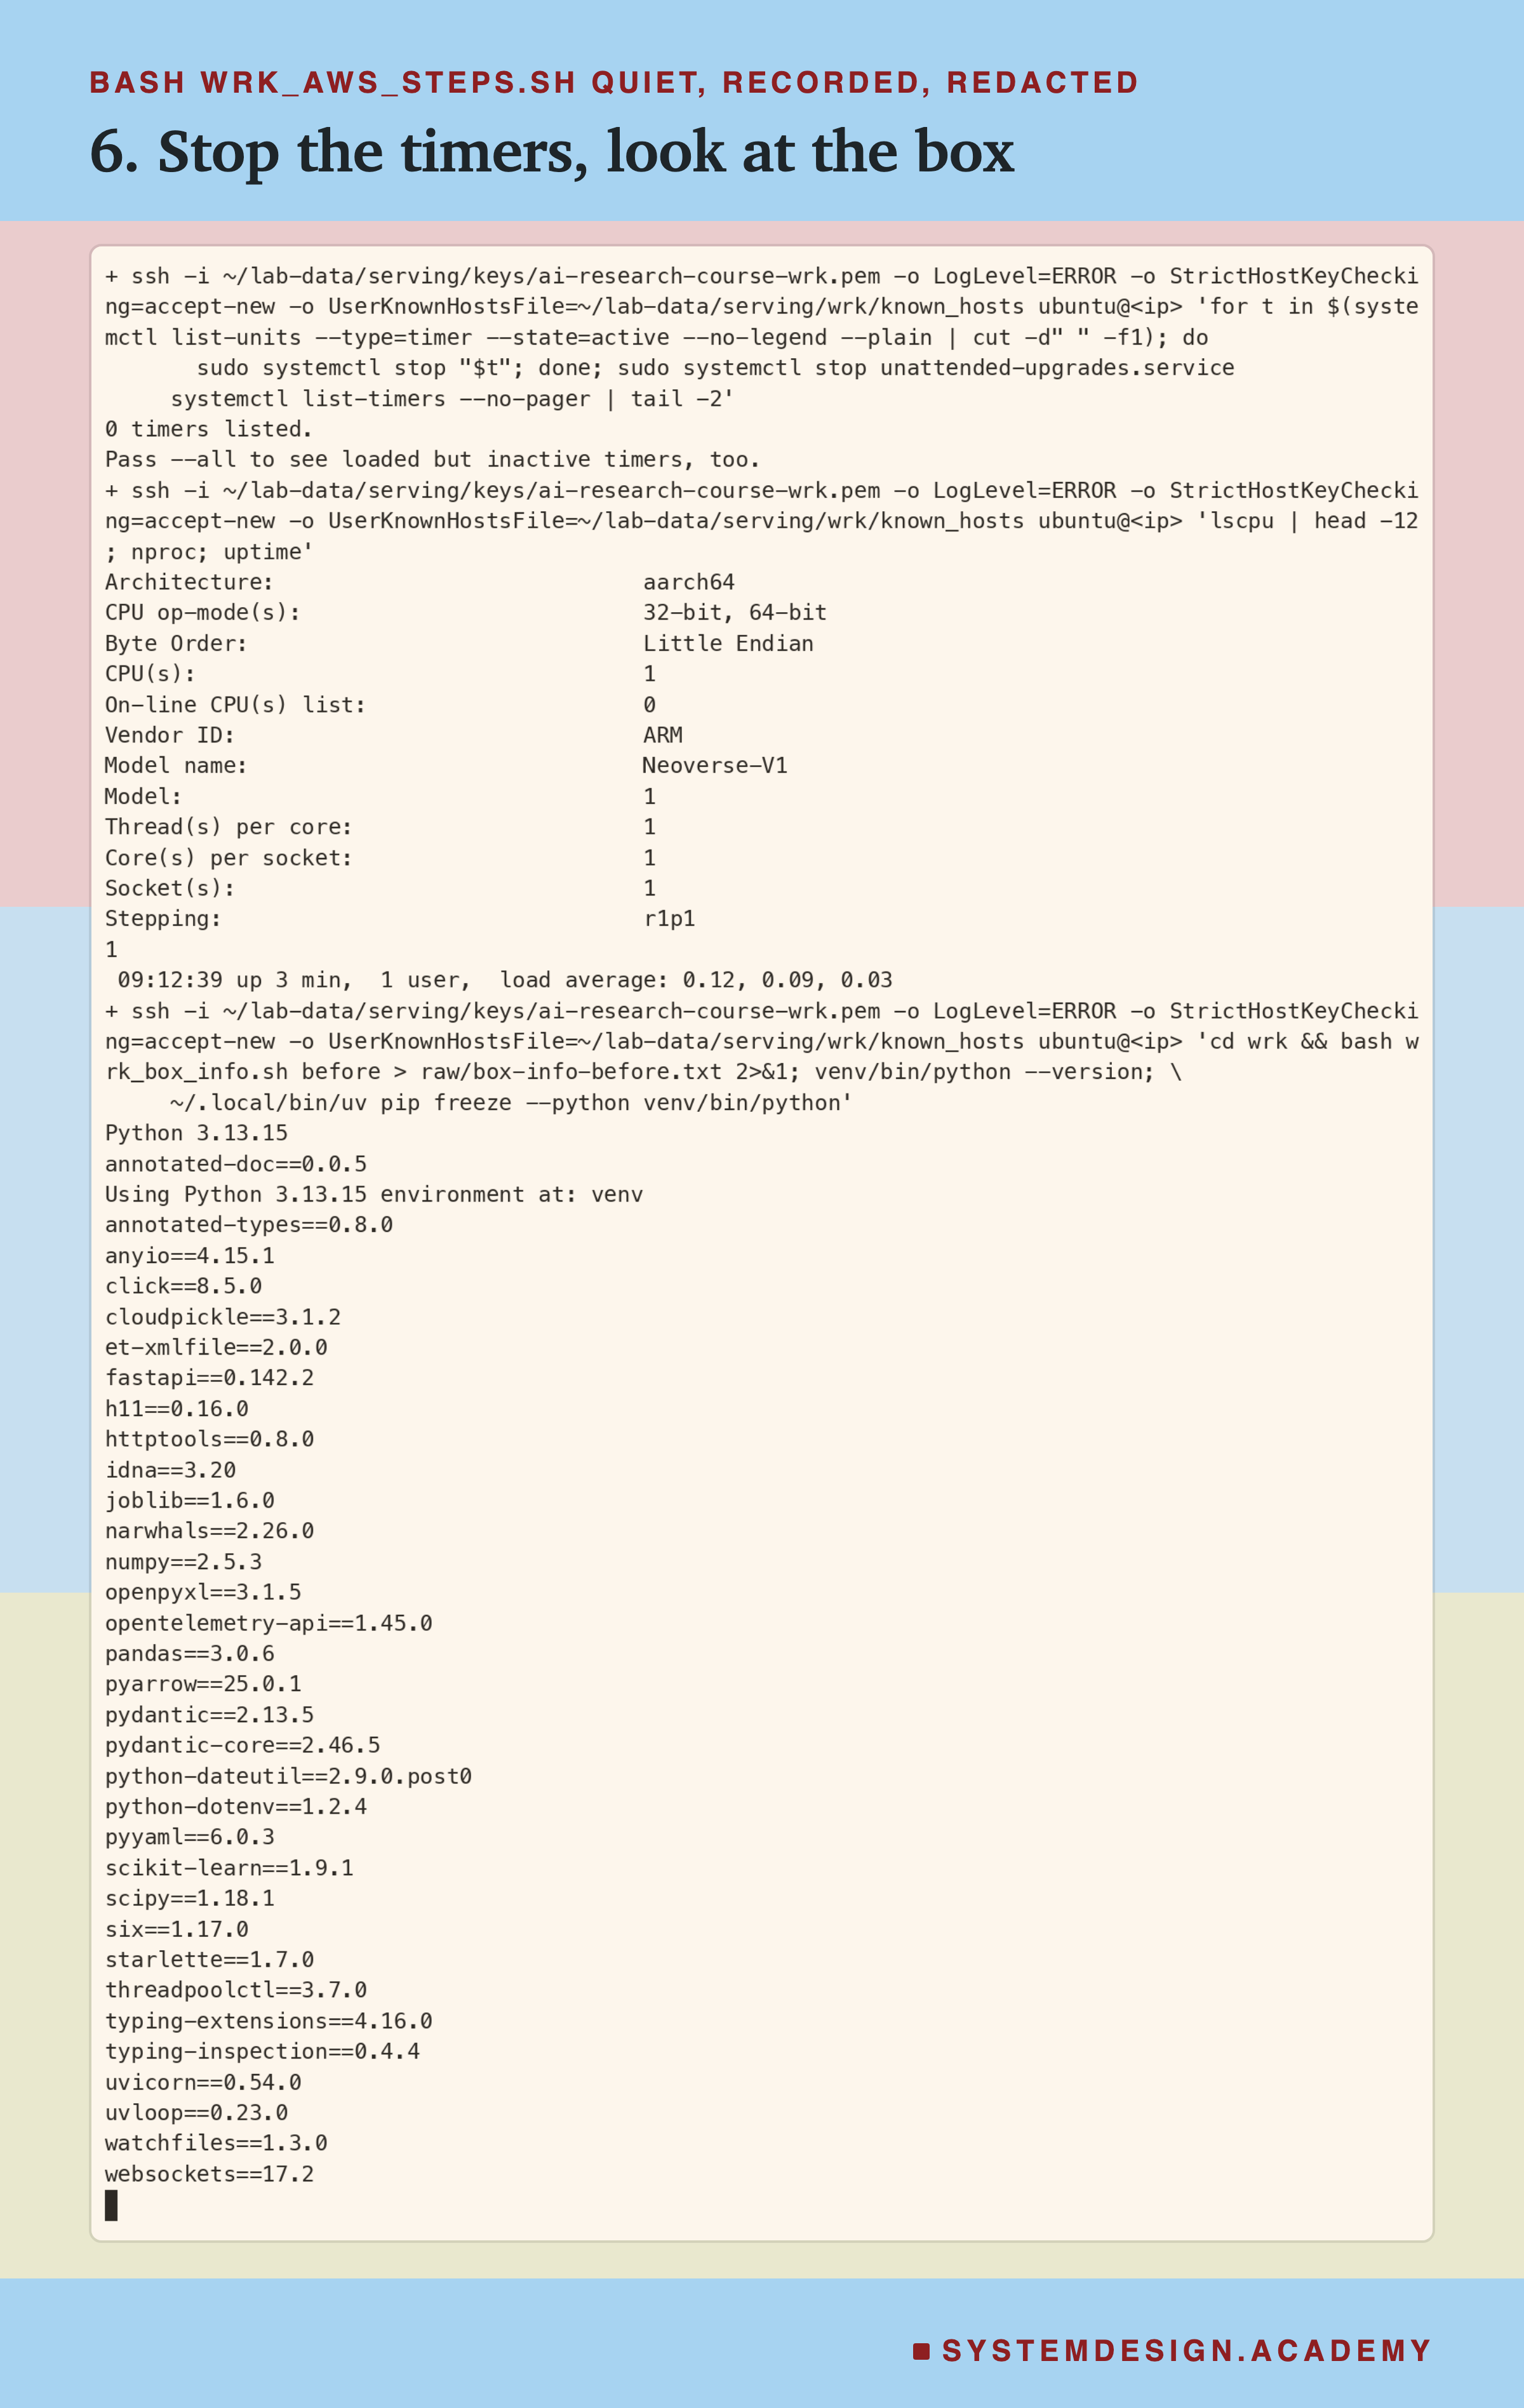
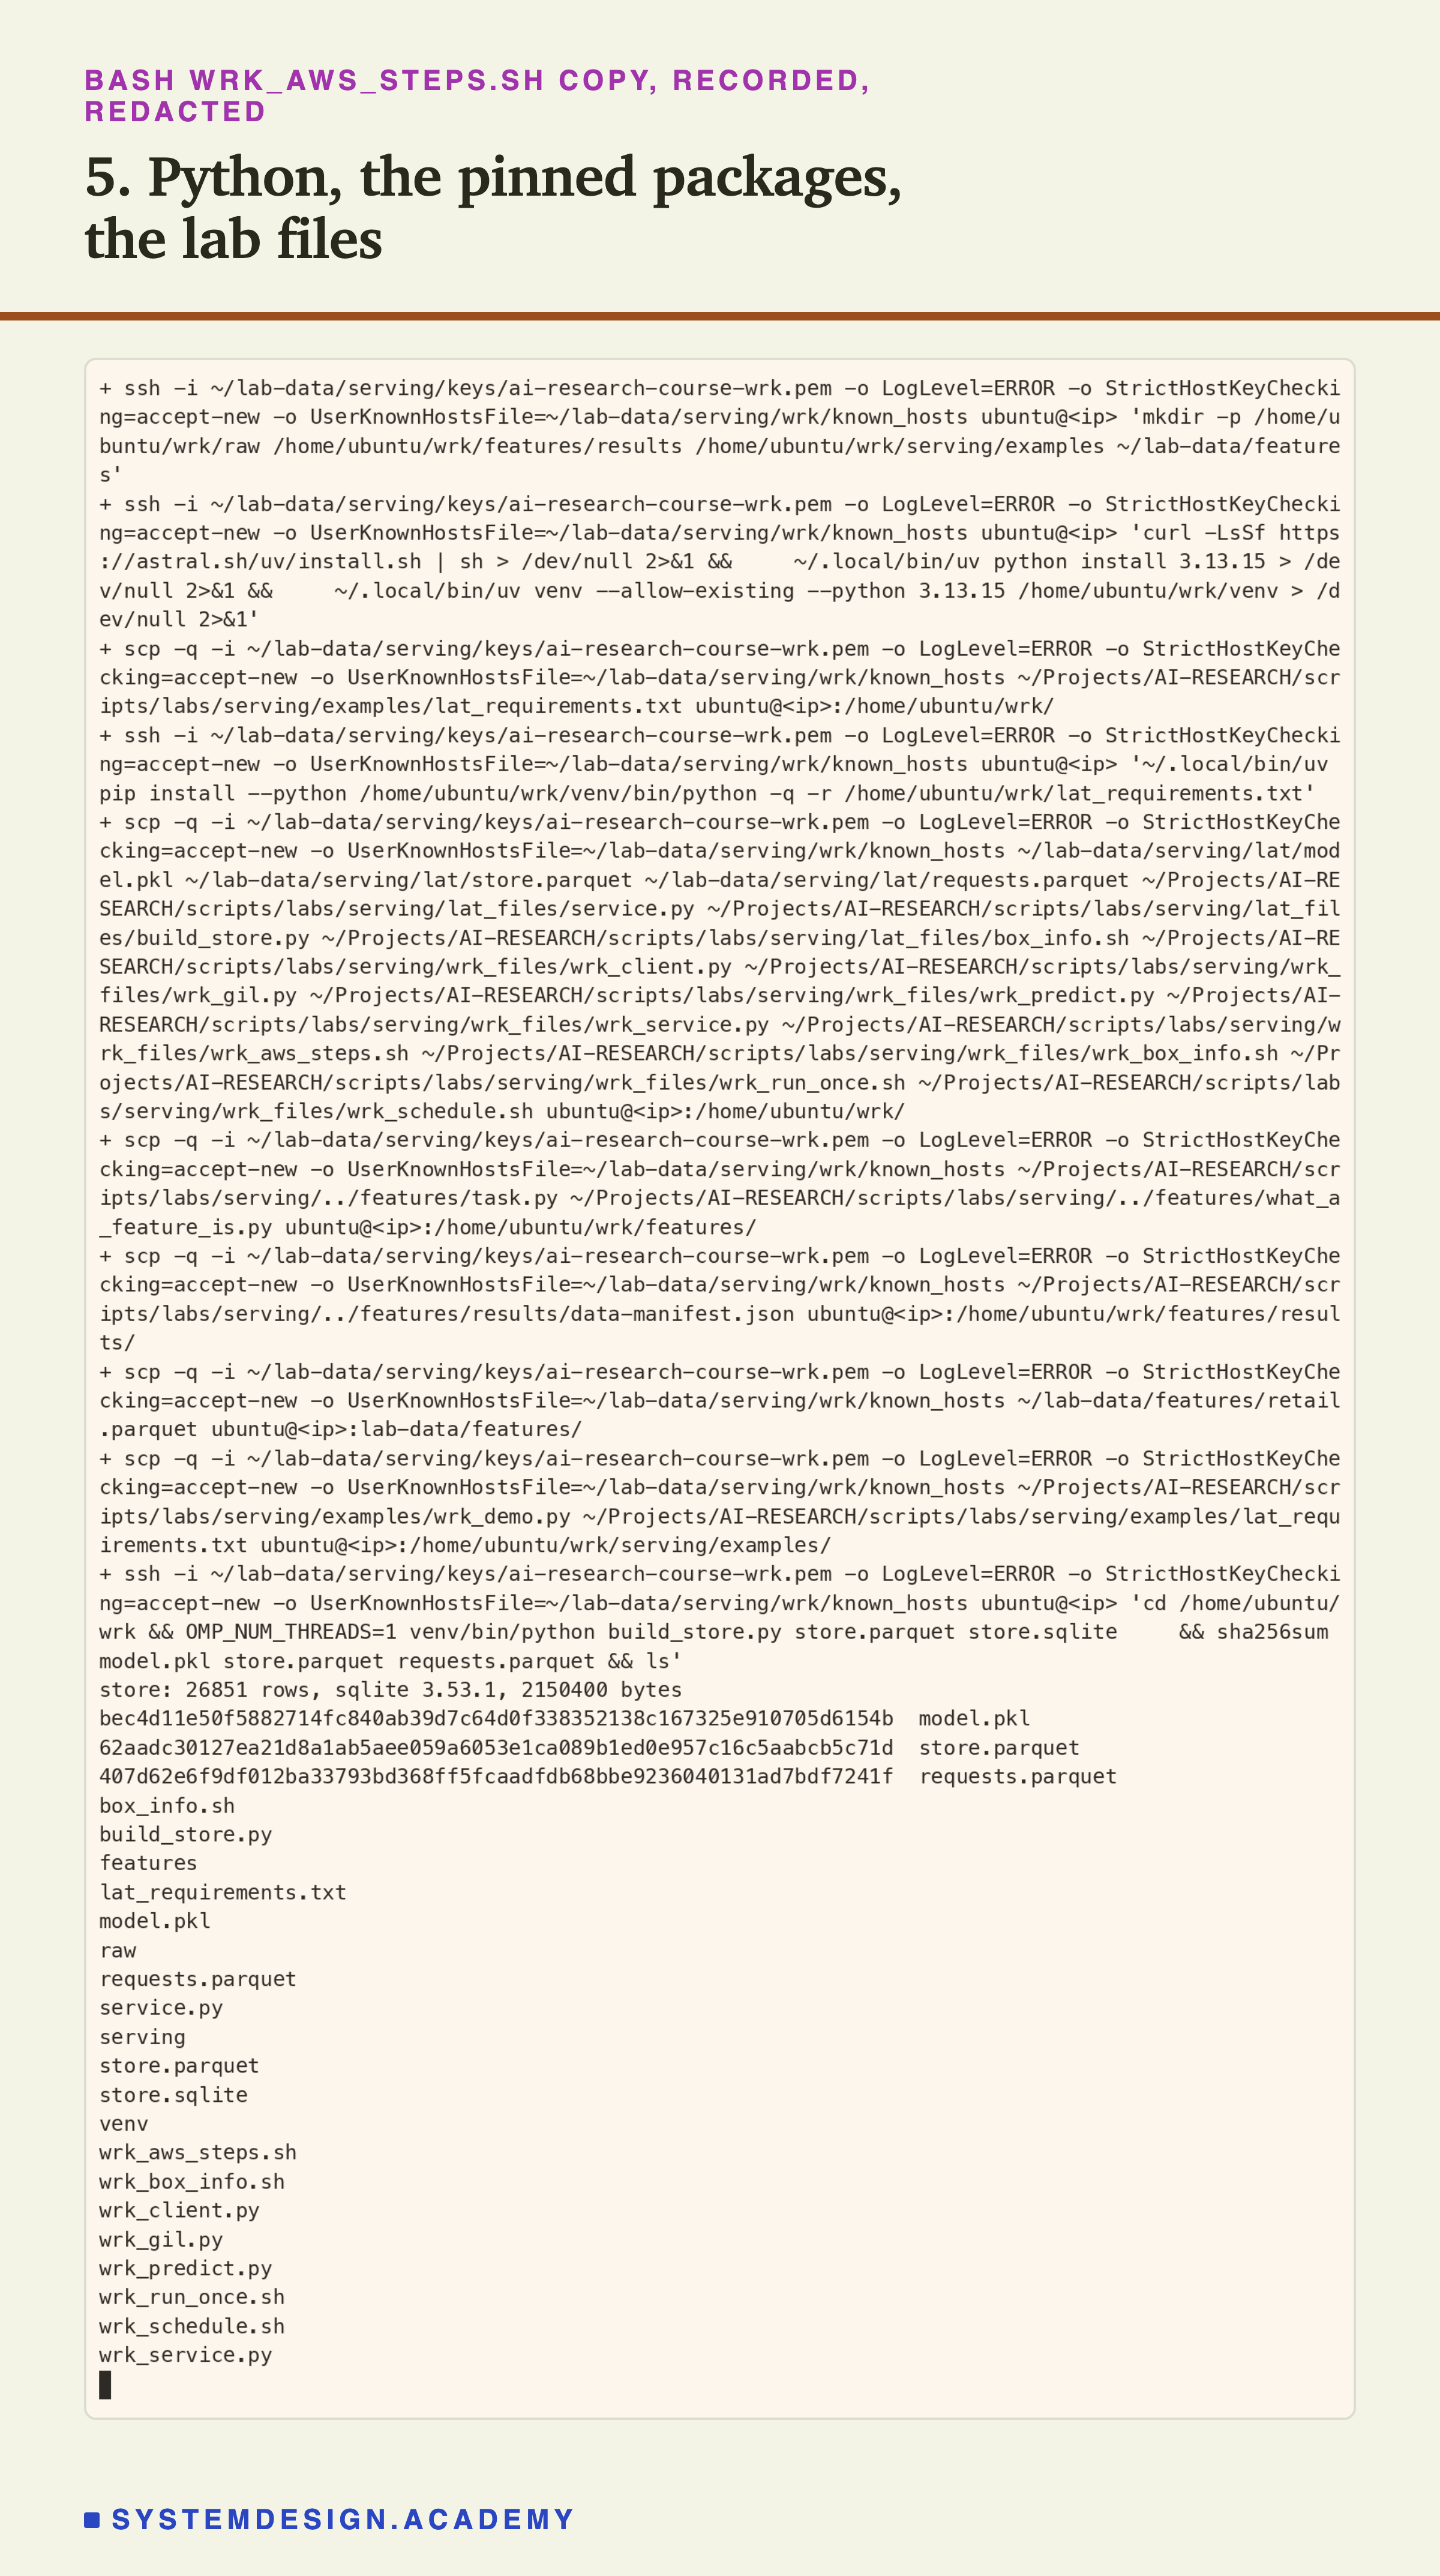
Step 5: Python and the lab files. The box gets the same Python, 3.13.15, and the same pinned library versions as lessons 2 to 4, through uv, a fast installer for Python. Then scp, a copy command that works through SSH, sends the files over. They are lesson 2's model file, feature table, request list and service, this lesson's files, and the files the demo needs. The last command builds the SQLite table on the box and prints the files' sha256 fingerprints, so you can check they match the ones on your computer.
Steps 8 and 11 to 13: Watch, Demo, Bring It Home, Delete
Step 8: watch without touching. While it runs, the schedule writes one progress line to the box's serial console after every run. The serial console is a log that AWS keeps for the box, and you can read it through AWS without logging in. So I could follow the runs and never disturb them.
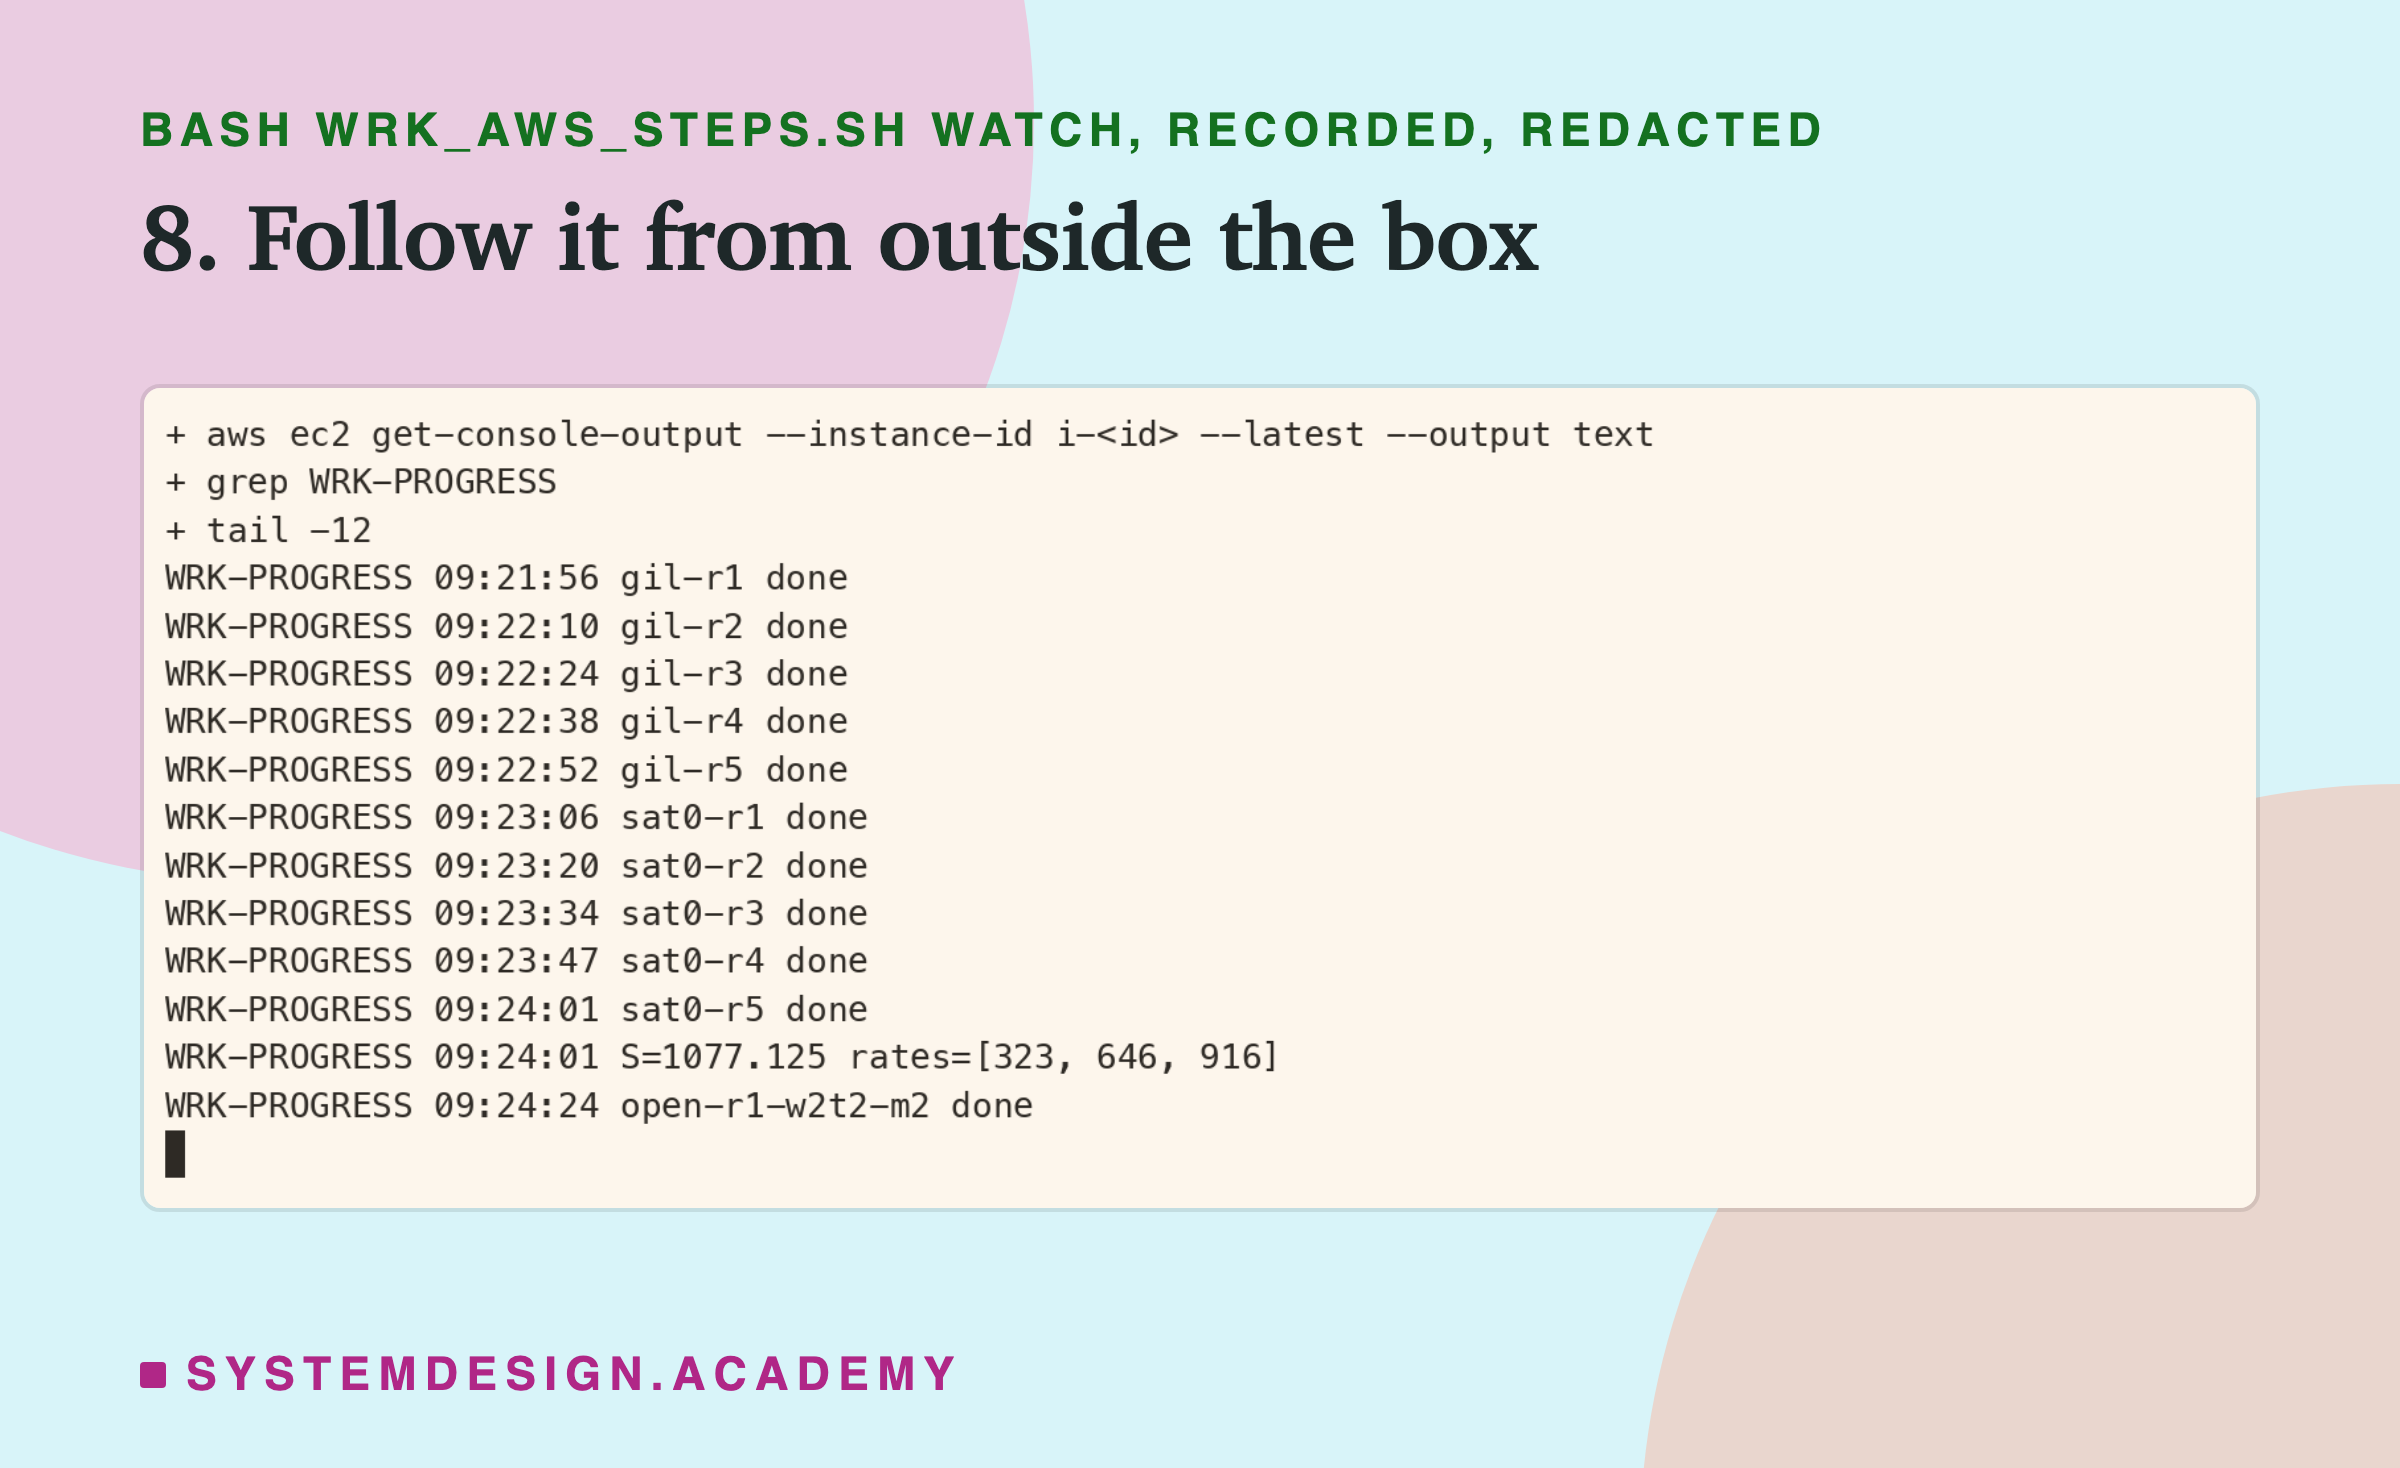
These lines came from AWS's copy of the console while the runs went on, so the box was never touched. This is the command to read them:
aws ec2 get-console-output --instance-id "$ID" --latest --output text | grep WRK-PROGRESS | tail -12
Step 11: the student demo, on the same box. After the schedule, I ran the demo you will meet later, so you can see what it prints on one core. Its output went into a file at the same moment it went to the screen.
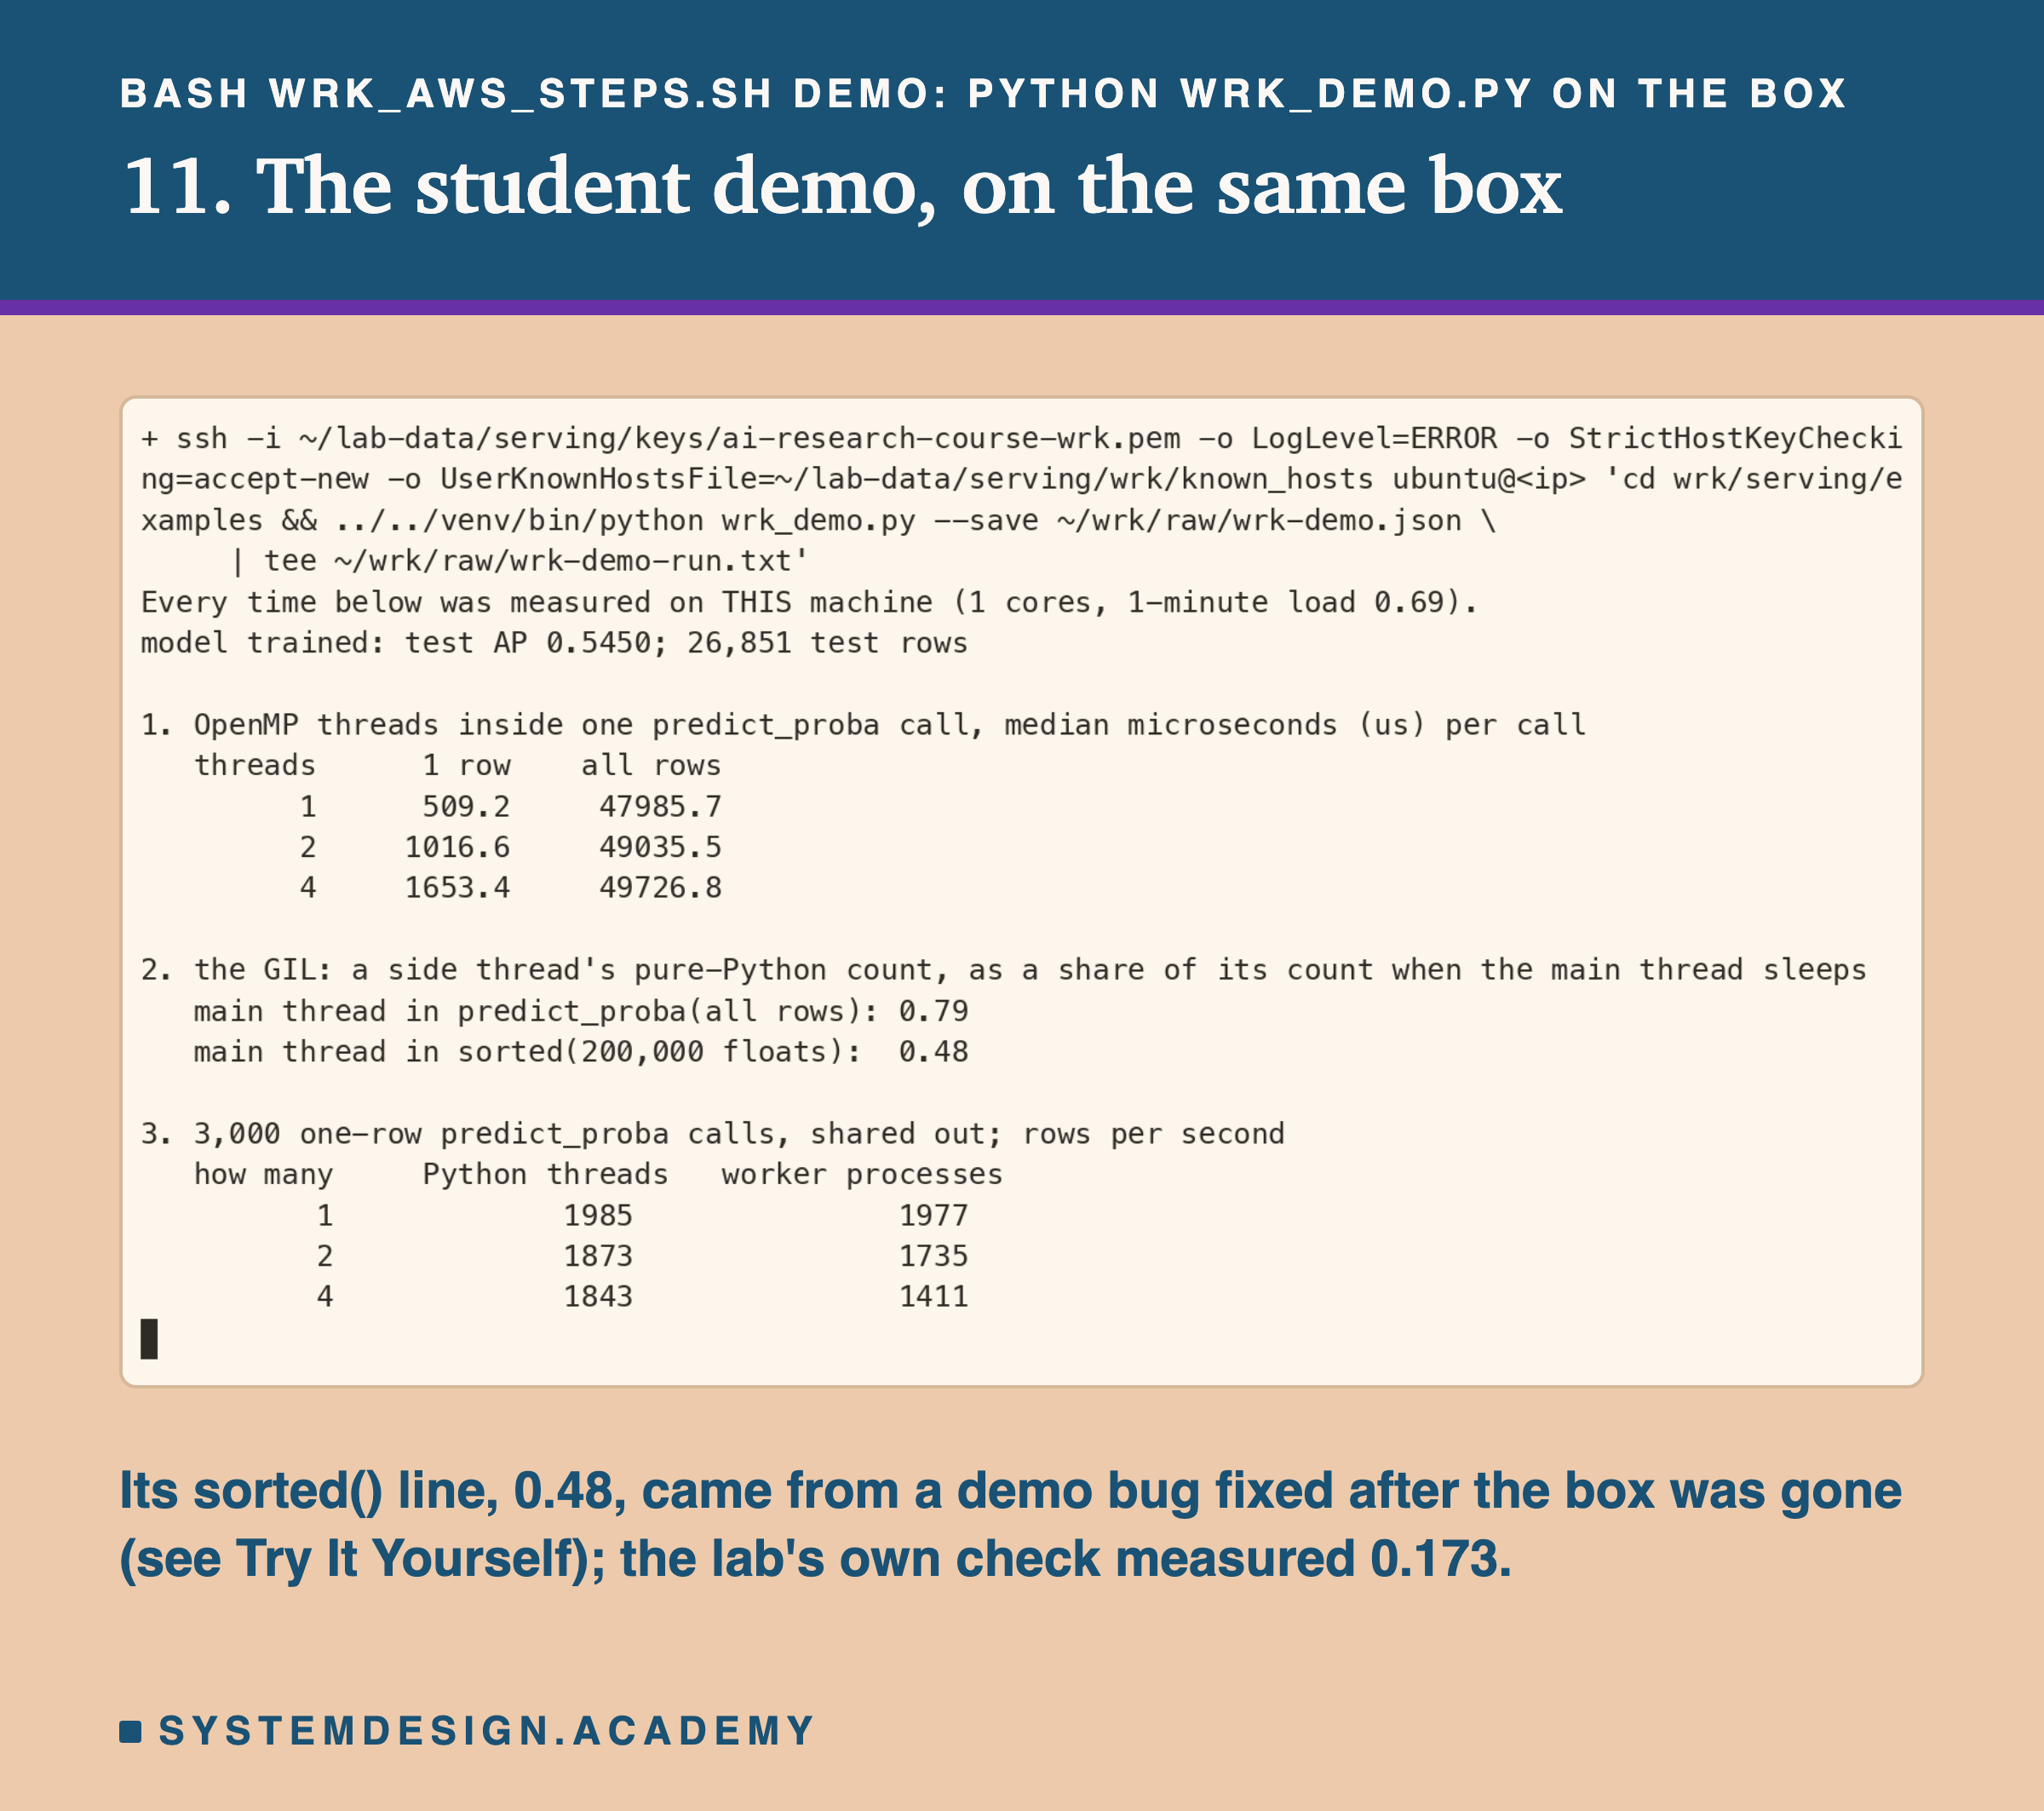
This run happened after the last timed run of the schedule had finished, so it could not disturb any timing. Its sorted() line, 0.48, came from a demo bug fixed after the box was gone (see Try It Yourself); the lab's own check measured 0.173. This is the command:
  ssh -i ~/lab-data/serving/keys/ai-research-course-wrk.pem "${SSHO[@]}" ubuntu@"$IP" \
    'cd wrk/serving/examples && ../../venv/bin/python wrk_demo.py --save ~/wrk/raw/wrk-demo.json \
     | tee ~/wrk/raw/wrk-demo-run.txt'
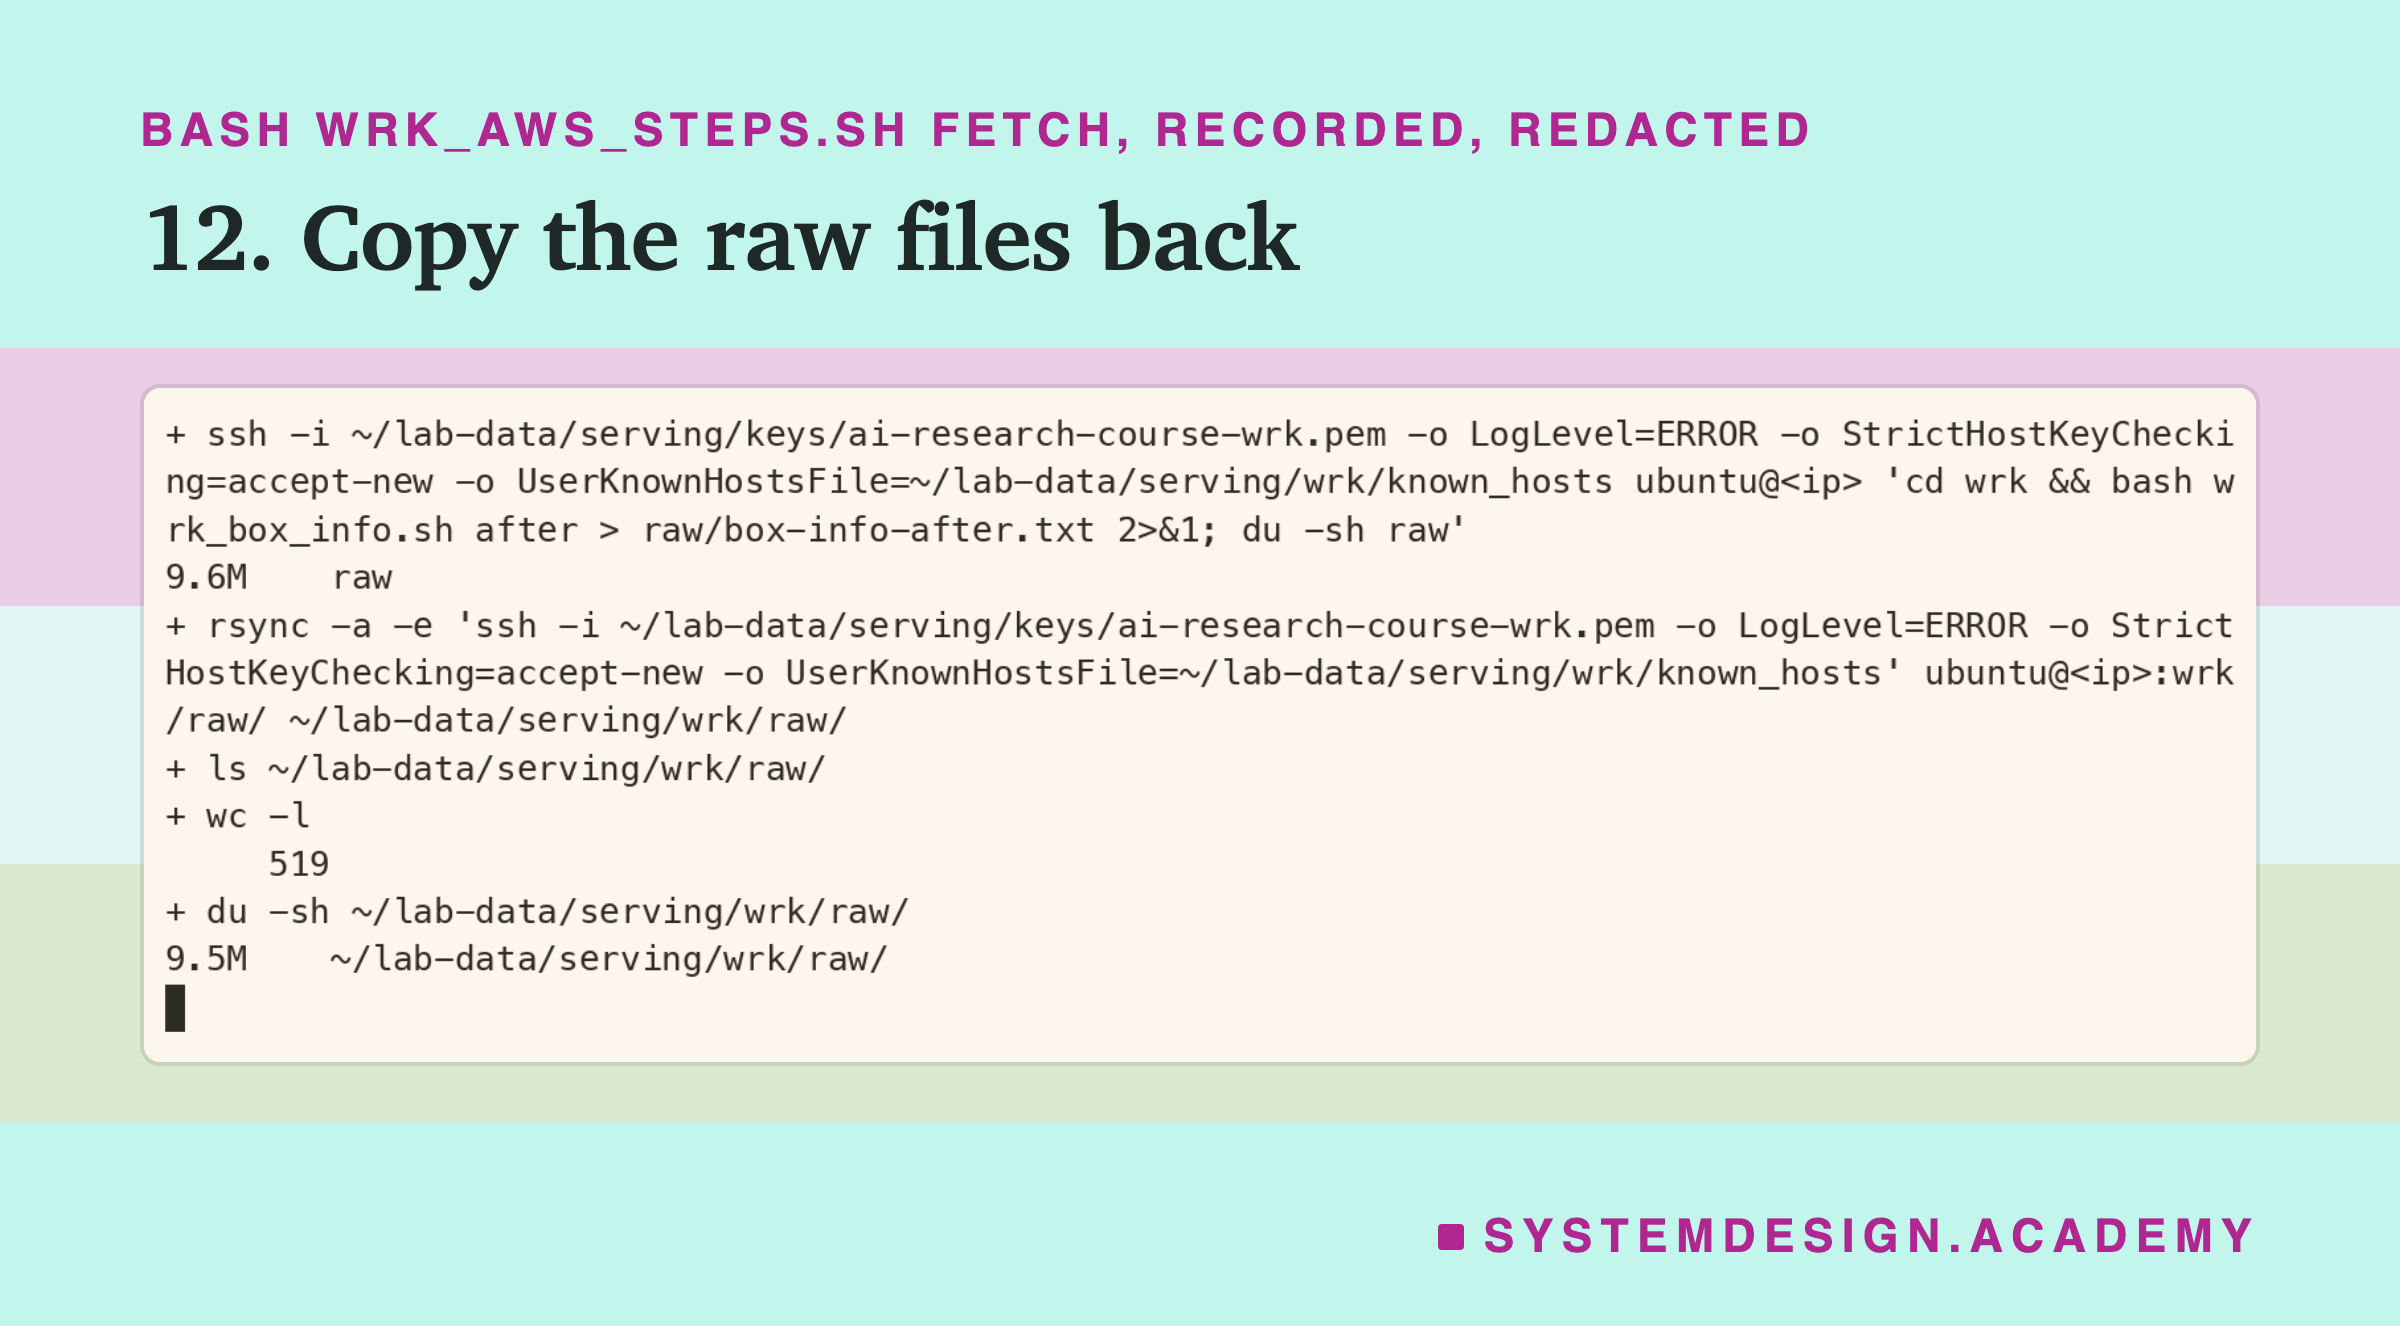
Step 12: bring the results home first. Lesson 3 lost a whole box of results because it was deleted before anyone copied them. So the rule is: the moment the runs finish, copy the raw files back, before anything else.
The Lab's Report, Running
This is a real recording of the report script, wrk_report.py. It ran on my laptop, but it times nothing. It reads the raw files the box measured and does all the arithmetic again with its own code.
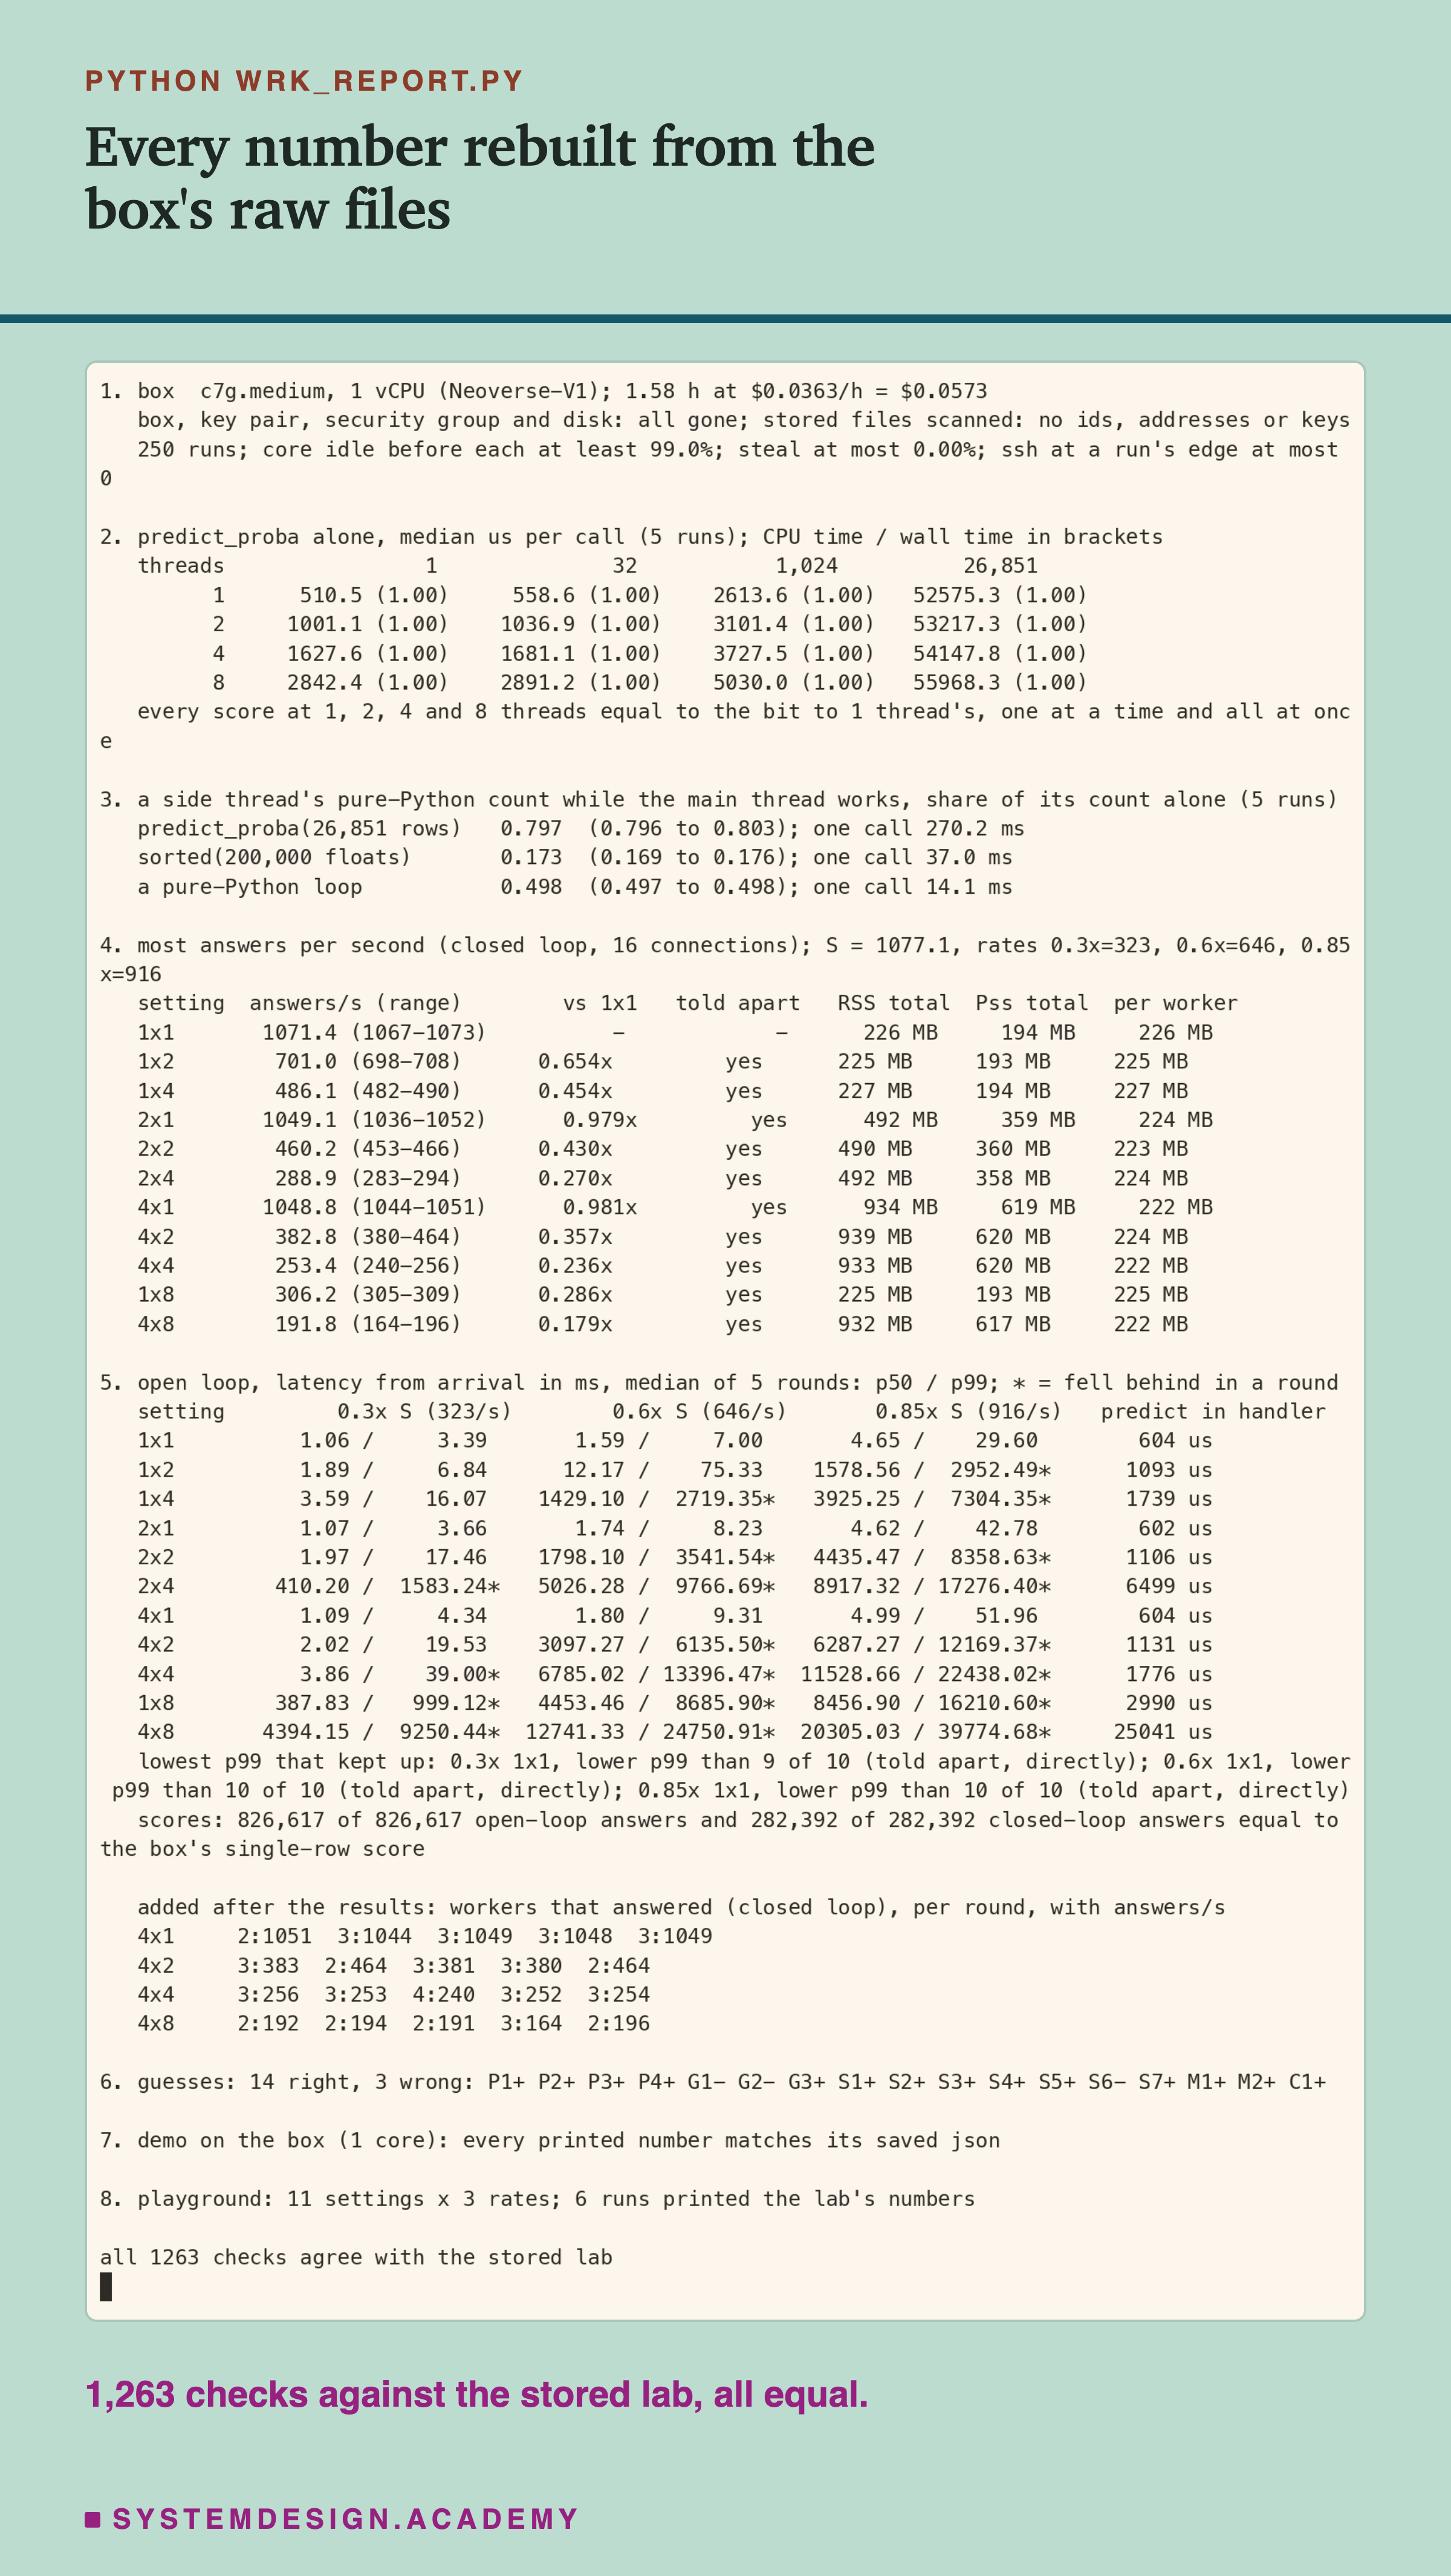
The report reads the small copy of the raw files kept in the repo. It computes its own percentiles, its own answers per second, its own paired differences and its own verdicts. Then it compares every one with the lab's results file. If any number disagreed, it would stop with an error. I checked that too: I changed one number in a copy of the results file, and the report printed "2 MISMATCHES" and stopped.
Section 1 is the quiet check. Before every one of the 250 runs, the core was at least 99.0% idle over two seconds. The machine under my box took no measurable time from it. No SSH session was open at the start or end of any run.
The system log had 80 lines during runs. 54 came from the AWS management agent failing to reach AWS, because my box had no permission to talk to it. 24 came from cron, which still ran because I stopped only the systemd timers. They were a statistics job (debian-sa1) and the hourly job, in 8 timed runs (open-r3-w4t8-m2, open-r4-w4t4-m1, open-r4-w4t8-m1, open-r5-w4t4-m1, open-r5-w4t8-m0, predict-r1-t4, sat-r1-w4t8 and sat-r3-w1t4). One line came from the kernel and one from systemd. No worker process died and restarted in any run.
Part P: More Threads Made a One-Row Call Slower
First, the model alone, with no web server. How long does one call to predict_proba take with 1, 2, 4 and 8 OpenMP threads, on one core?
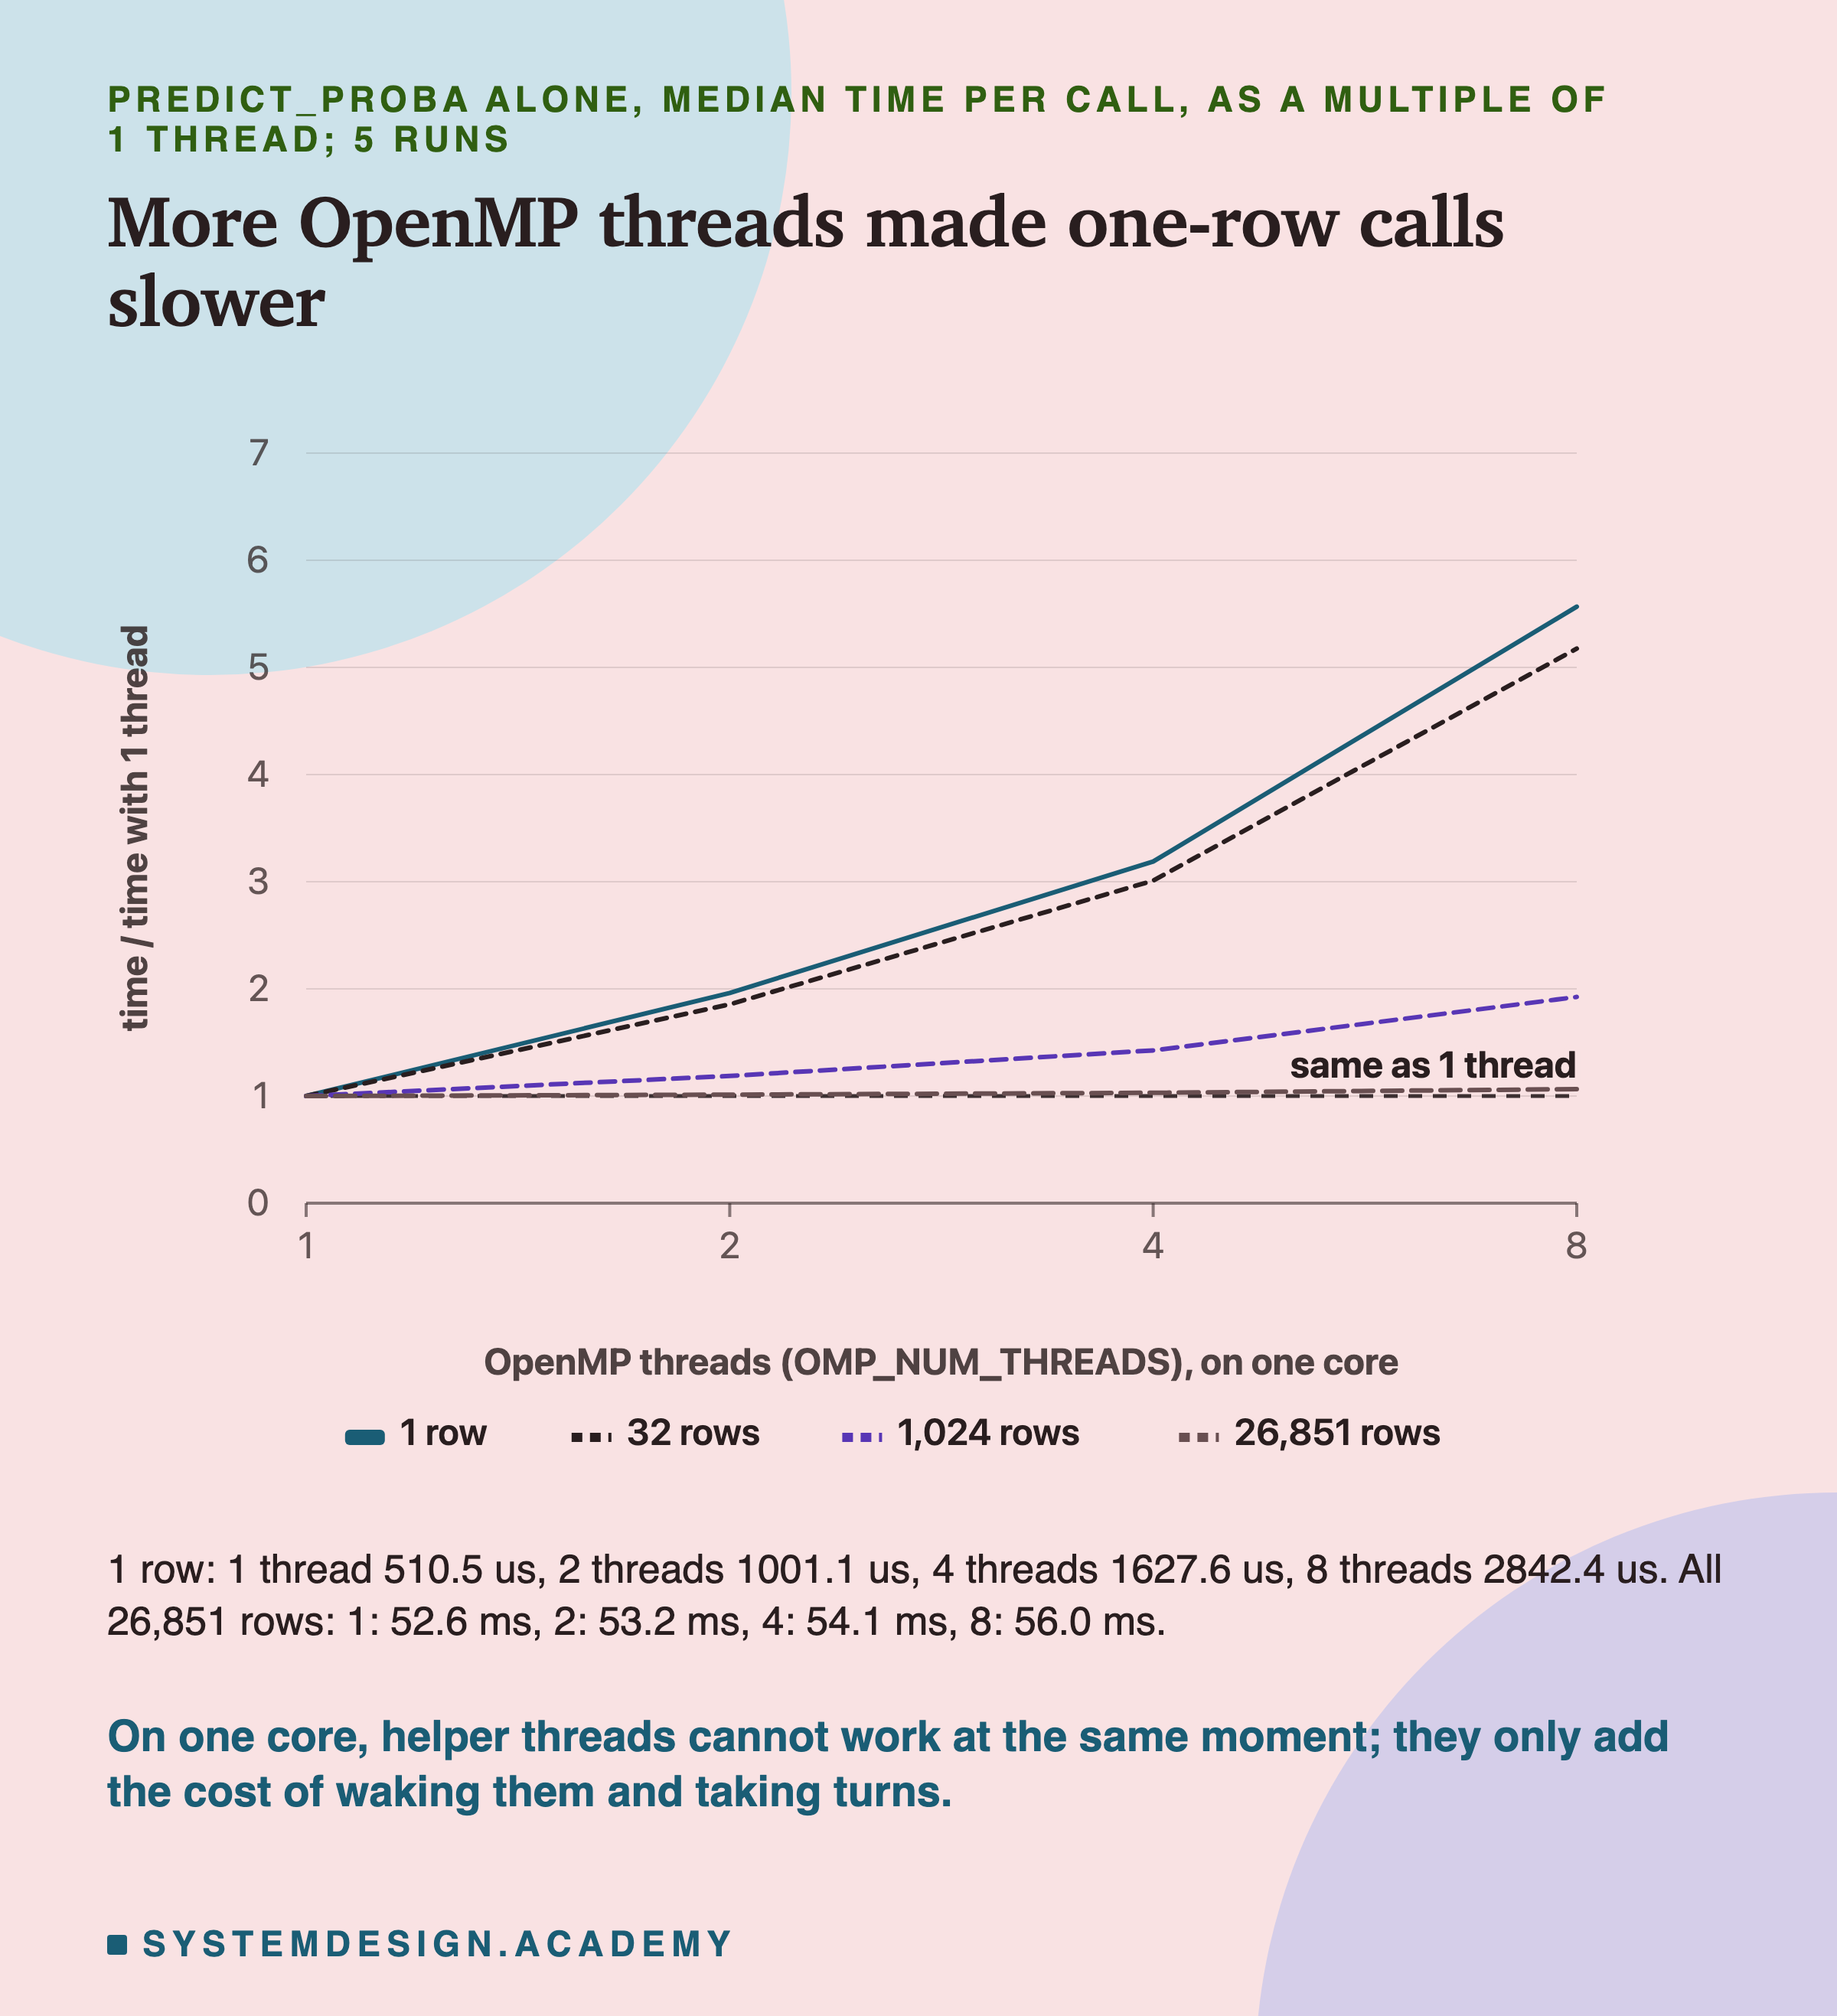
One row took 510.5 microseconds with 1 thread, 1,001.1 with 2, 1,627.6 with 4 and 2,842.4 with 8. So 4 threads made one row 3.19 times slower, and 8 threads 5.57 times slower.
All 26,851 rows took about the same with any thread count: 52.6 ms with 1 thread and 54.1 ms with 4, only 1.03 times as long.
Why does a thread count hurt so much for one row and so little for many? Think back to the office.
To type one short line together, someone has to call the helpers over, give each a share, and wait for the last one to finish. scikit-learn's tree code does the same: at each call it wakes its helper threads, gives each a share of the rows, and waits for all of them. With one row there is almost nothing to share, so the call is mostly the waking and waiting. On one core, the helpers cannot even work at the same moment. Each one has to wait for its turn on the core, so every helper adds a context switch.
With 26,851 rows the waking and waiting costs about the same as before, but now it is a tiny part of a 52-millisecond call. The rows still get scored one after another on the one core, so there is no speed-up either.
Part P also measured the process's CPU time against the wall time of each call. At every thread count and every batch size the ratio was 1.00. So the core was never idle during a call: all the extra time went to the process's own threads waking, waiting their turn and switching. One possible part of it, which I did not test, is spin-waiting. An OpenMP helper that has finished may keep the core busy checking for new work for a short while before it sleeps. I could not see from this how it split between the threads. The service runs below can.
Part G: predict_proba Lets Python's Lock Go, and Waits to Get It Back
Before the service, one more question. Python has the GIL: only one thread can run Python code at a time. Does predict_proba hold the GIL while it works, or let it go? And what happens to it when another thread is busy?
The Python documentation defines the GIL as "The mechanism used by the CPython interpreter to assure that only one thread executes Python bytecode at a time". It also says that "some extension modules, either standard or third-party, are designed so as to release the GIL when doing computationally intensive tasks". scikit-learn's tree code is written in Cython, a language close to C. In version 1.9.1 its loop over the rows of one tree reads prange(..., nogil=True, ...), which means "run without the GIL". The loop over the trees, though, is Python: the source reads for predictors_of_ith_iteration in self._predictors:, one call per tree.
To see what happens, I ran a side thread that counts in a Python loop. Then I measured how fast it counted while the main thread did three kinds of work. I report it as a share of how fast it counted while the main thread slept.
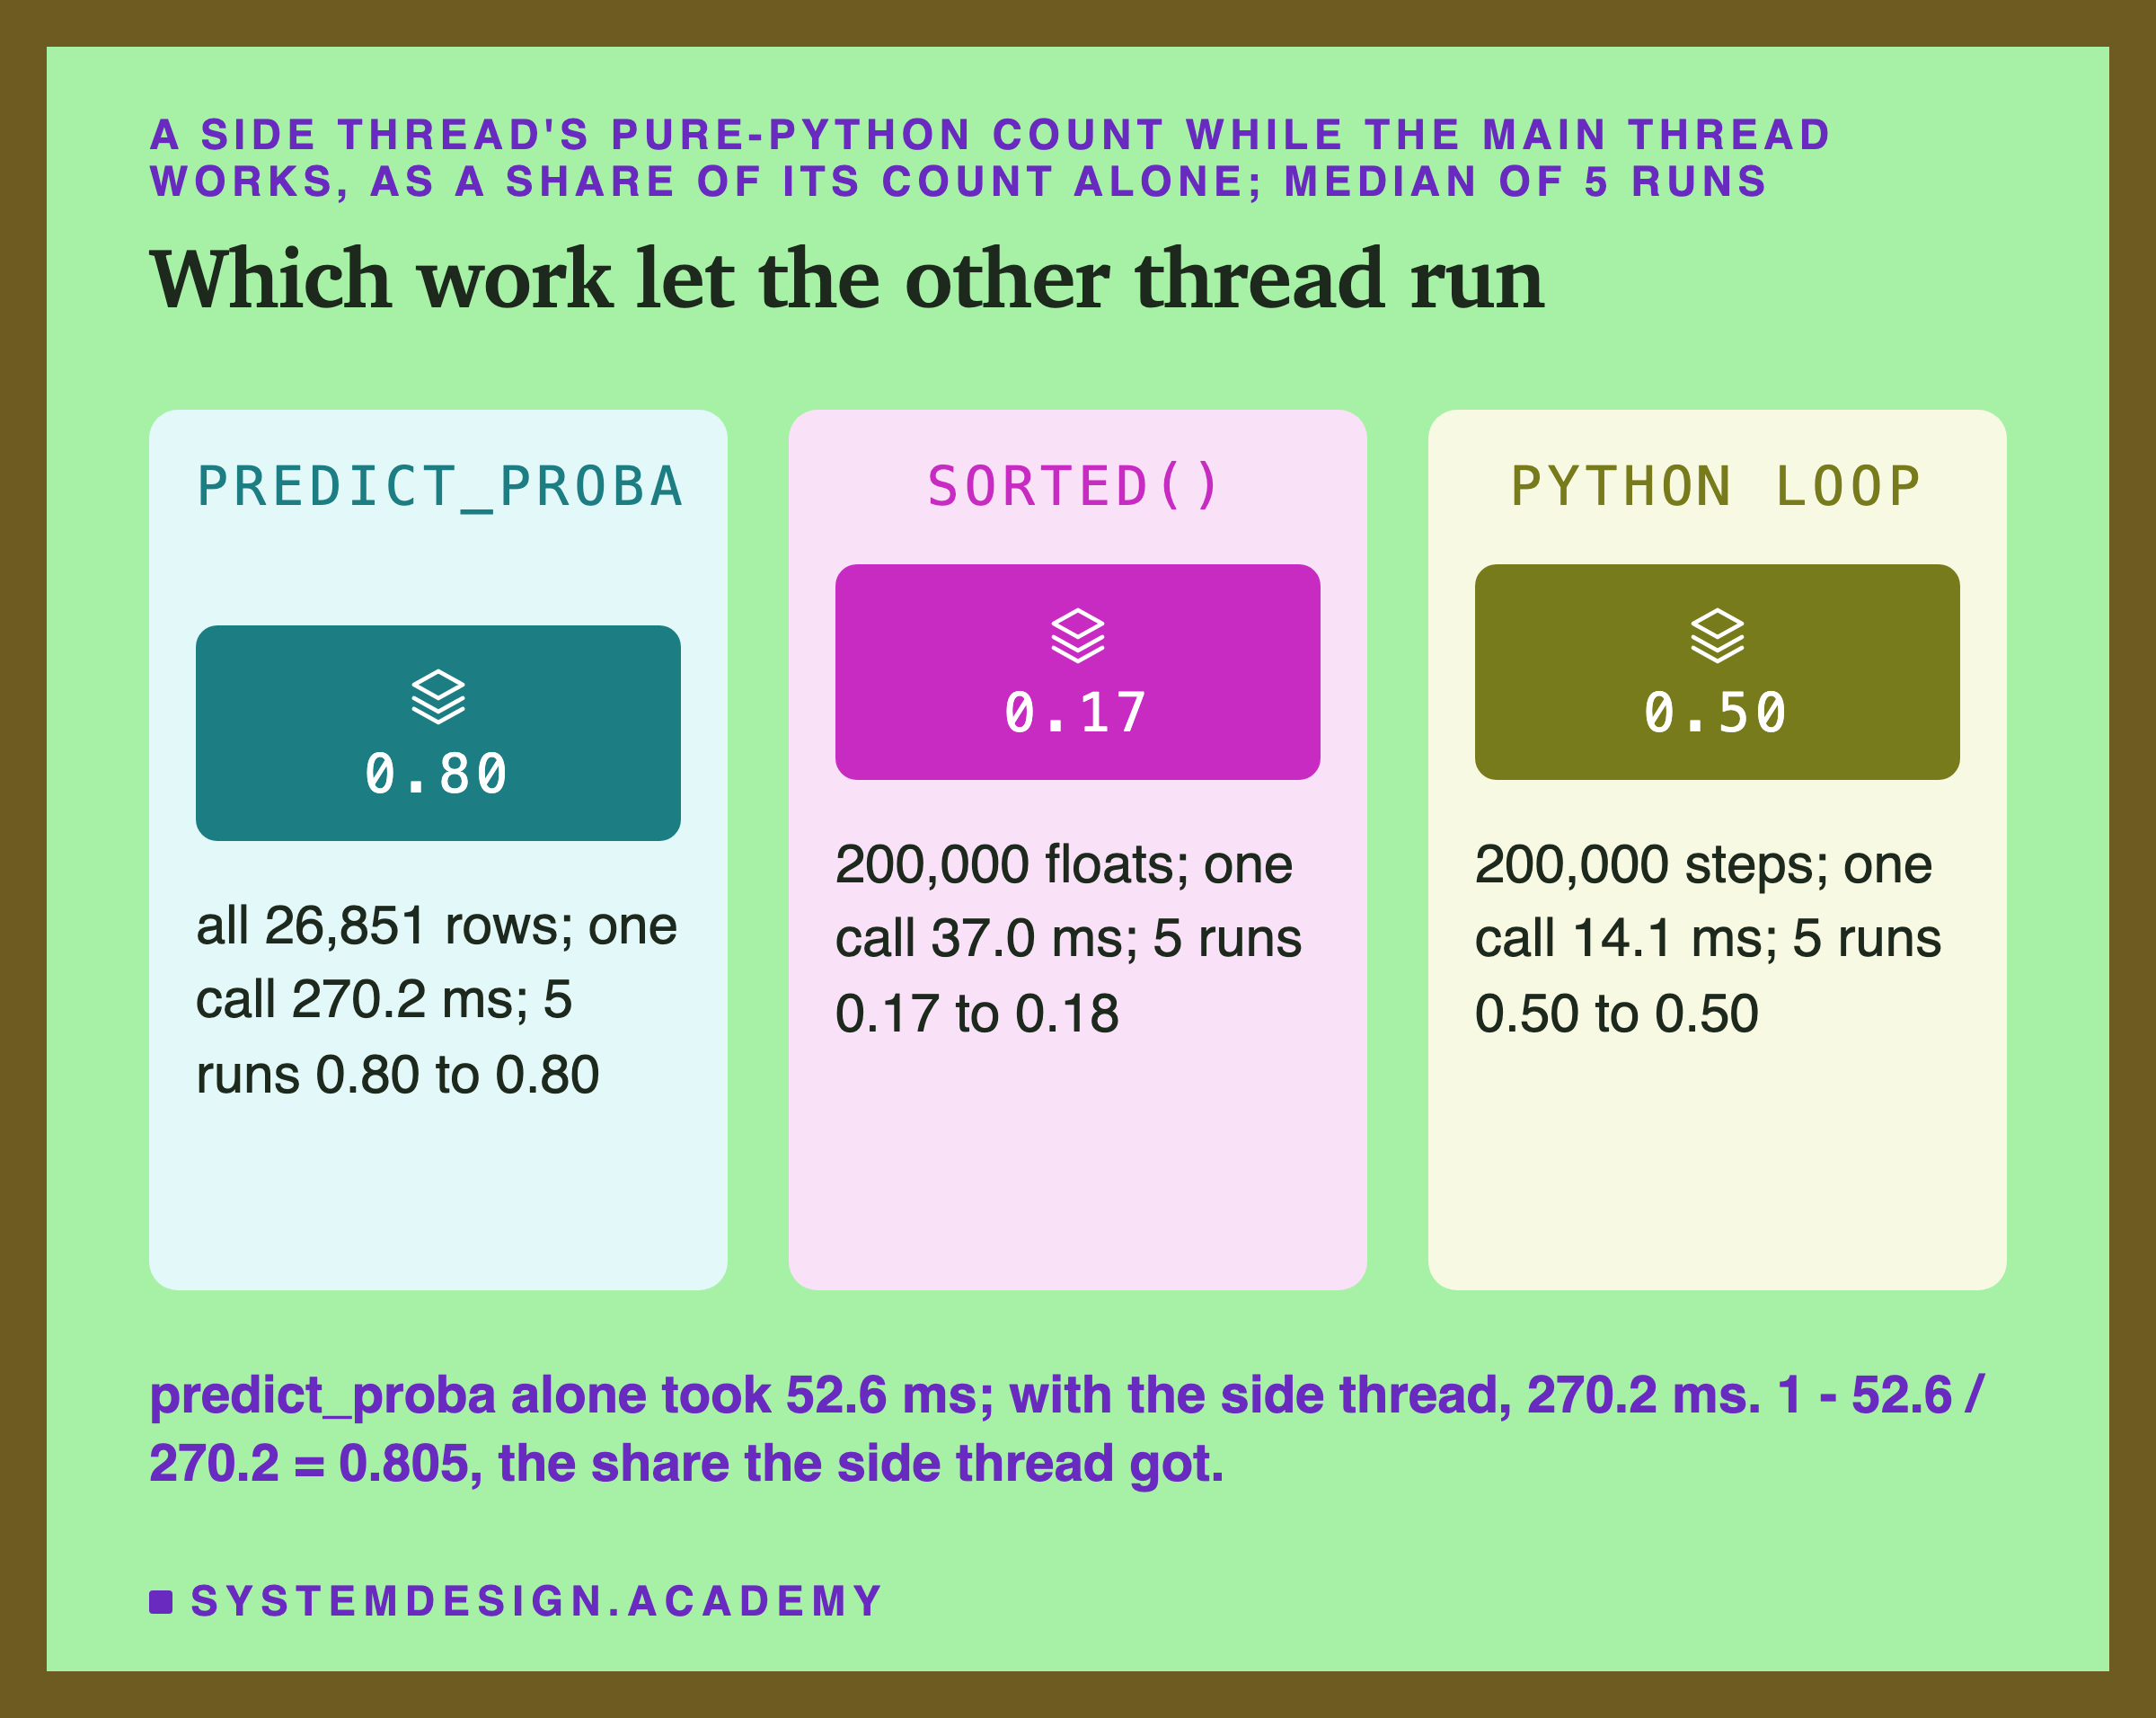
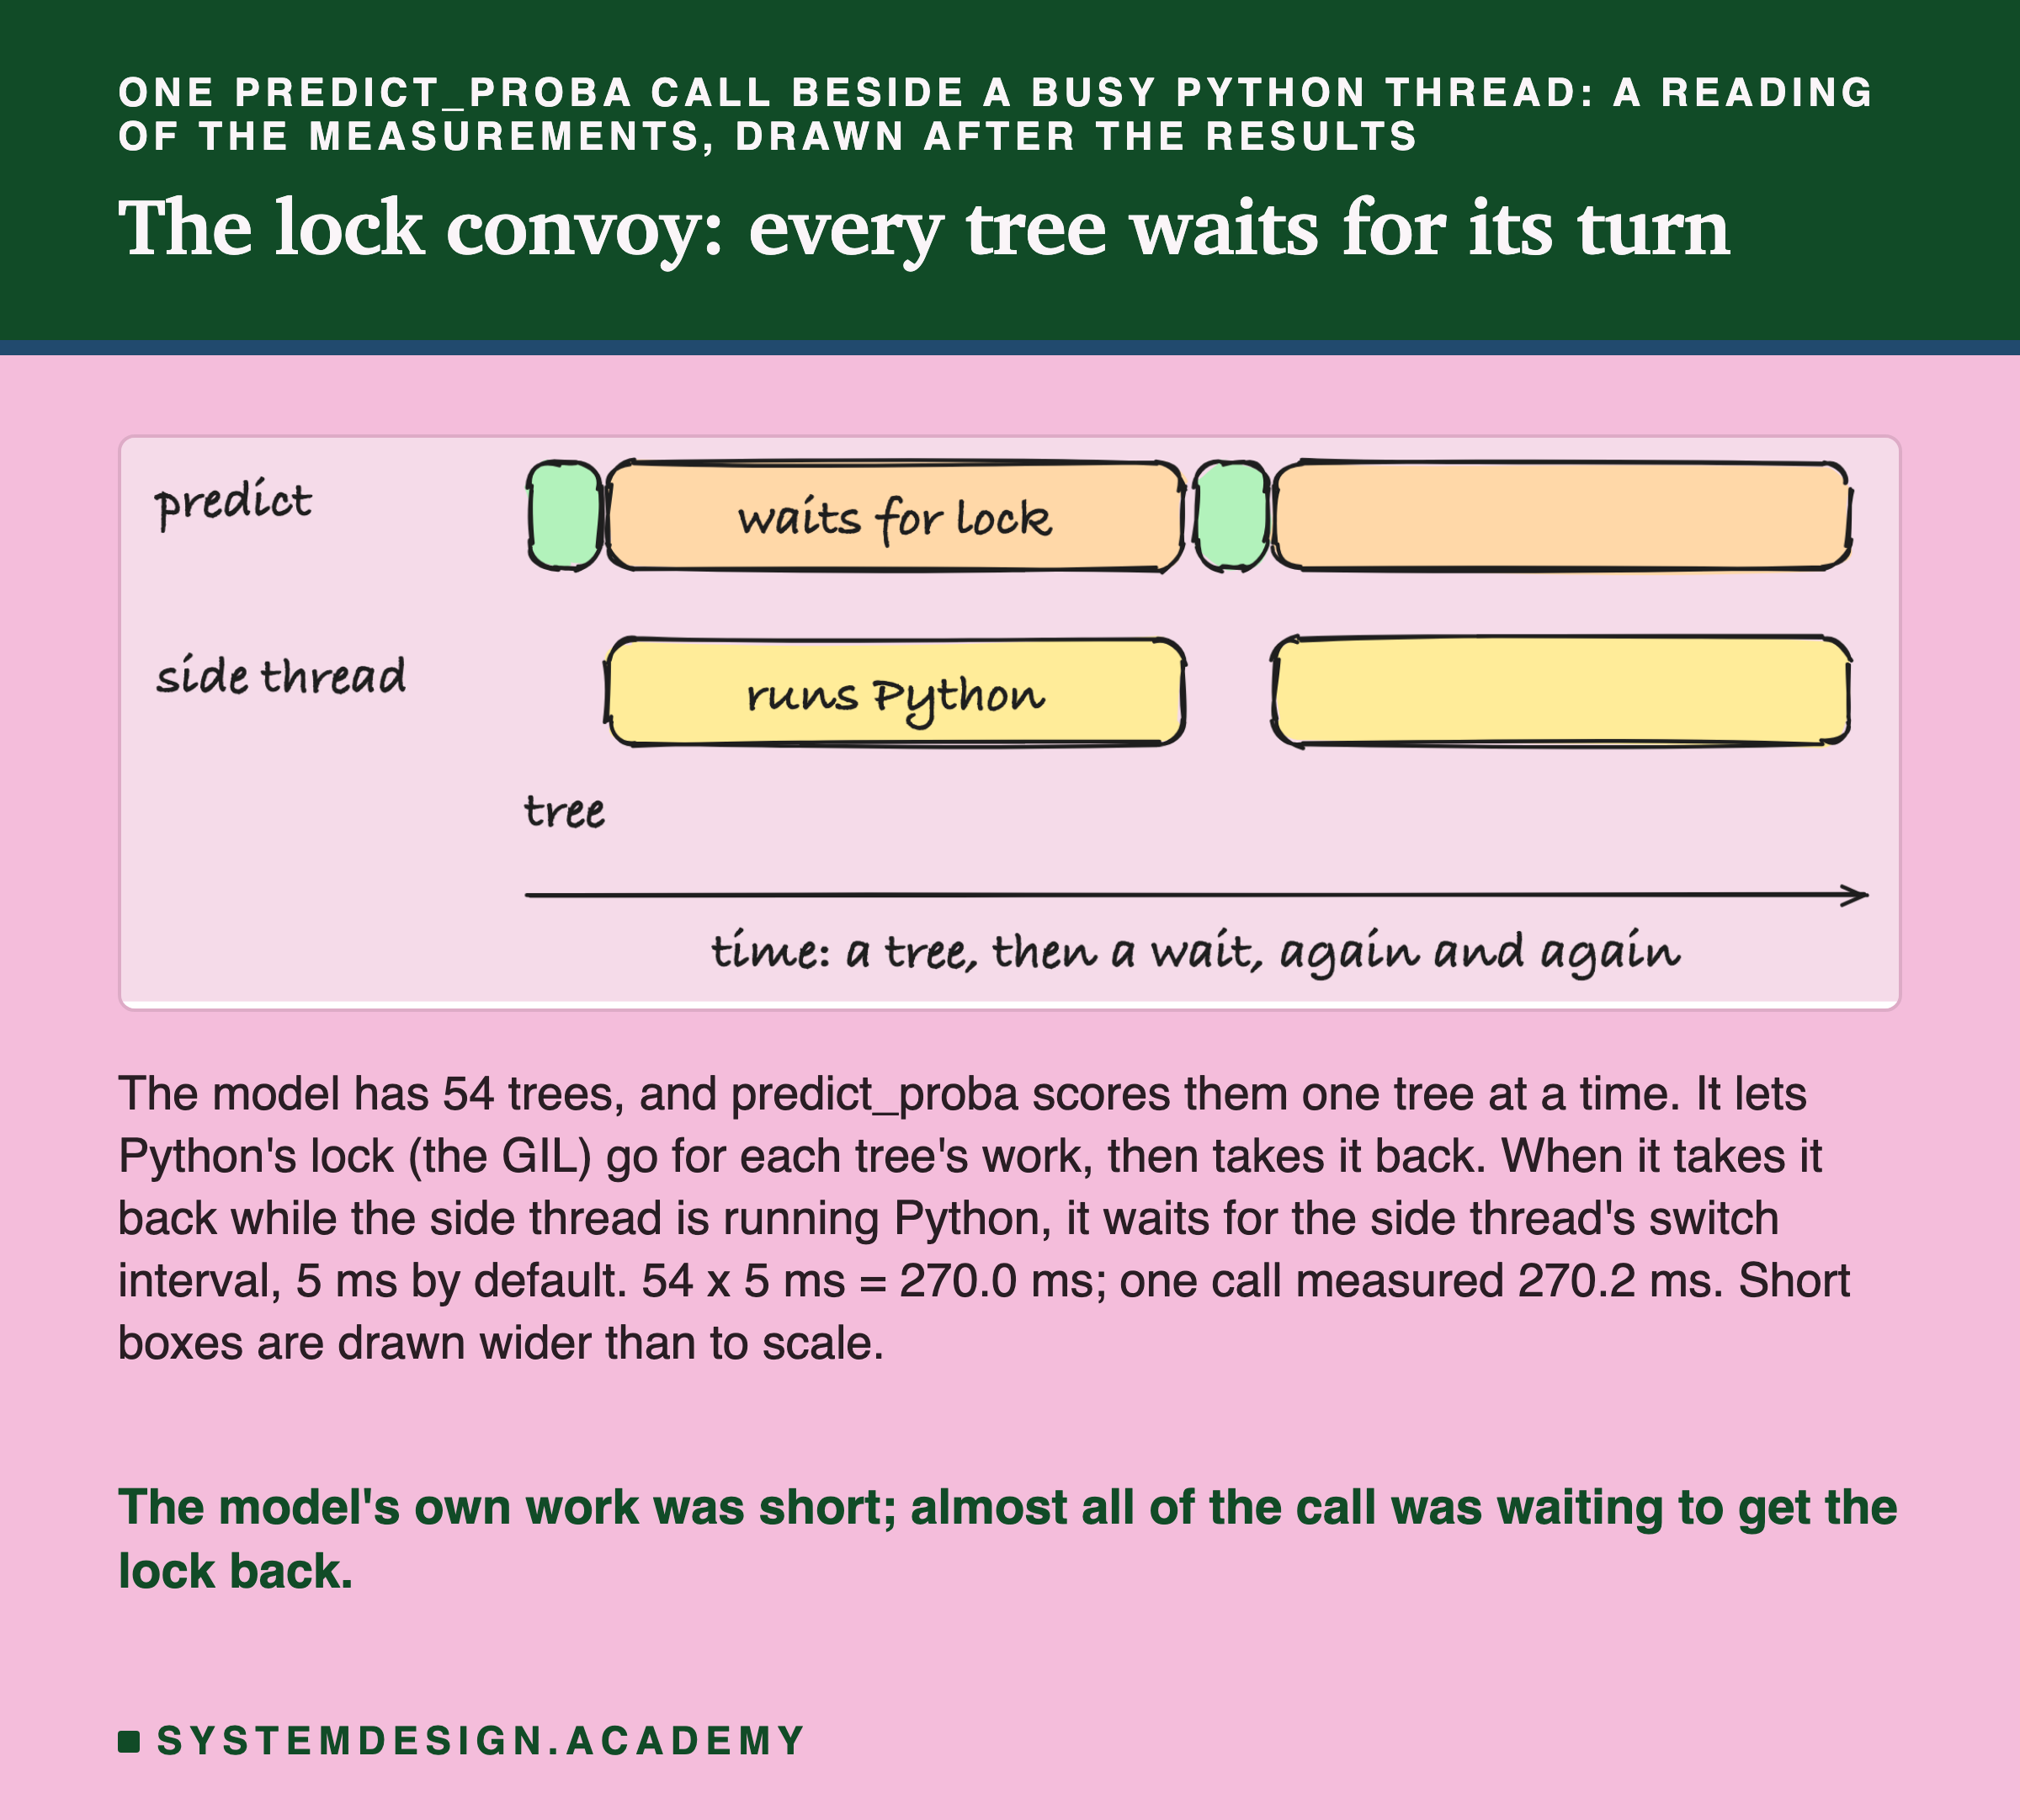
During predict_proba on all rows, the side thread kept 0.797 of its speed, and one call took 270.2 ms instead of 52.6 ms. So the model call did let the lock go: otherwise the side thread could not have run most of the time.
During sorted(), which holds the lock, it kept only 0.173. Sorting a list of Python numbers is C code that keeps the lock while it sorts, because it compares Python objects. The side thread got to run only between one sort and the next.
Both threads run Python code, and Python makes the running thread hand the lock over every , which is 0.005 seconds by default. So they shared the core about half and half.
Part B: The Most Each Setting Could Answer
Now the service. Before the settings, I measured S, the most answers per second of 1x1. Five closed-loop runs gave 1,072.1 to 1,078.3 a second, and their median, S, was 1,077.1. The open-loop rates were 0.3, 0.6 and 0.85 times S: 323, 646 and 916 requests a second.
Then every setting got one closed-loop run in each of the five rounds. Here they are on one grid.
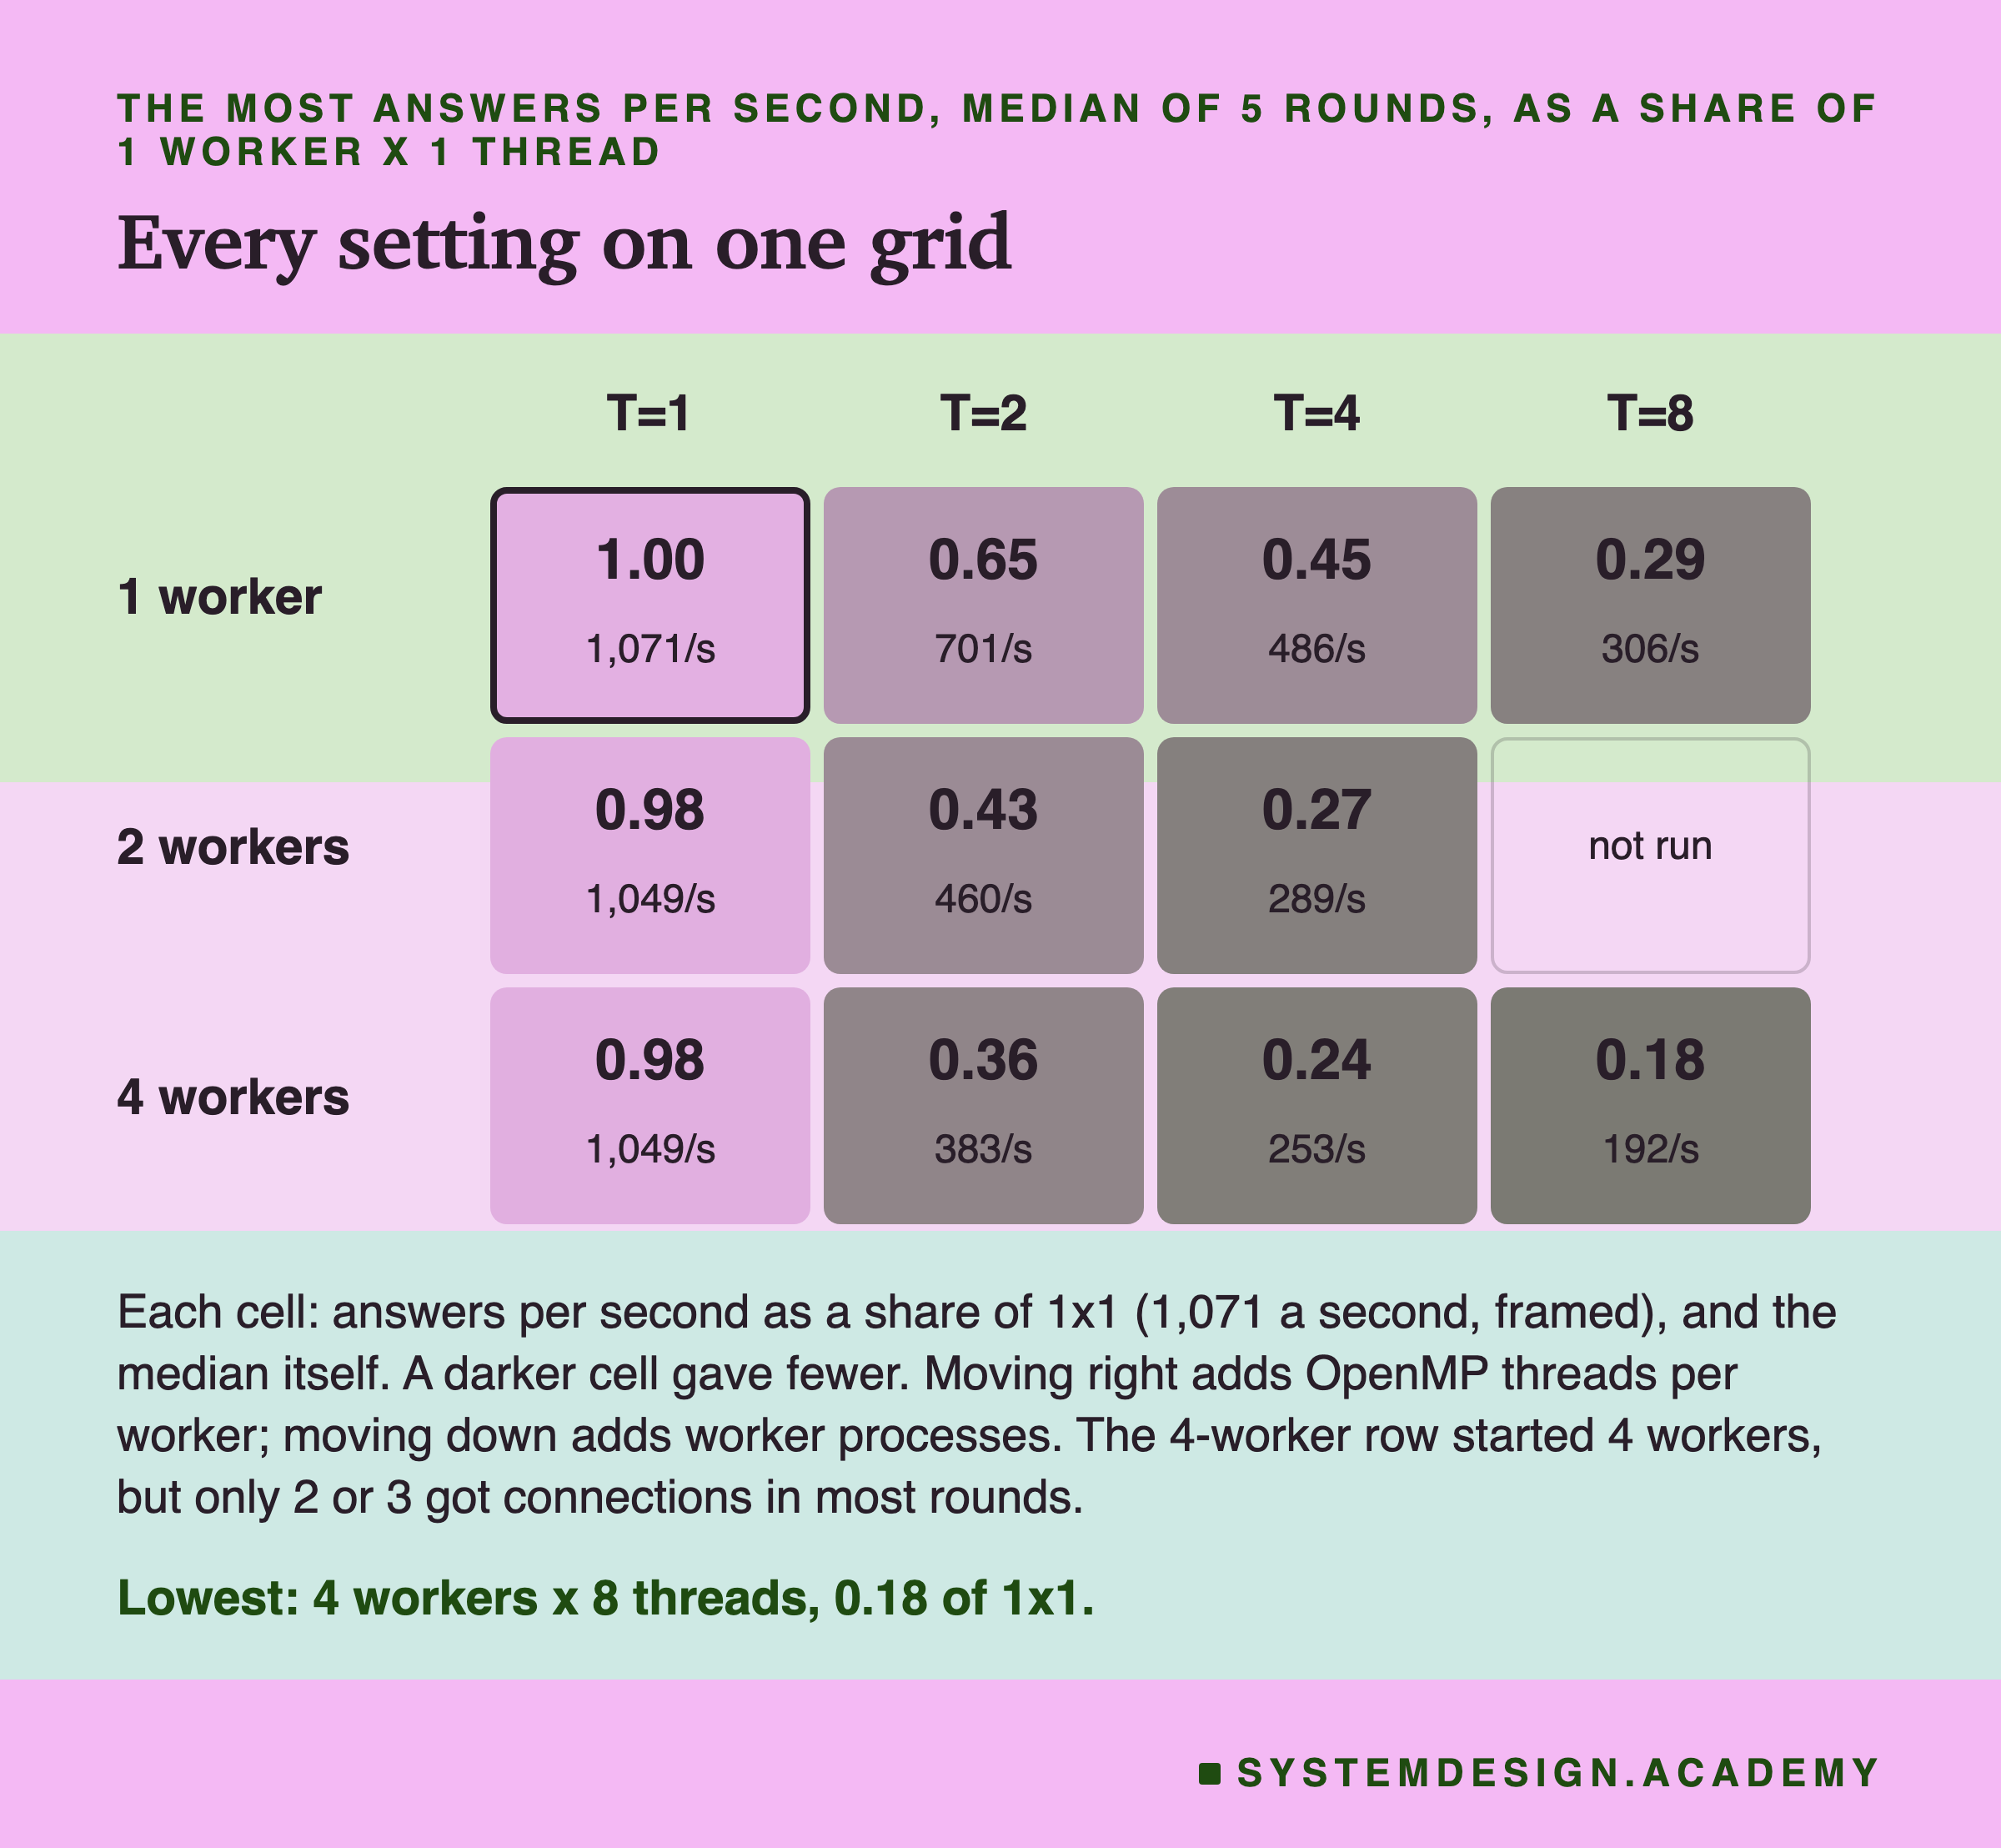
Moving down the first column, adding workers, cost about 2%. 2x1 gave 0.979 of 1x1 and 4x1 gave 0.981. In every round both were below 1x1, so the loss is told apart, but it is small. Each extra worker is one more process that the core switches to and from. Its own copy of the model and libraries also competes for the processor's small, fast memory caches. That is one possible reason; I did not measure the switches or the caches.
Moving right along any row, adding threads, cost a lot. One worker went from 1,071 to 701, 486 and 306 answers a second as T went from 1 to 8.
Both together were the worst. 2x2 gave 460, less than 1x2's 701, and 4x4 gave 253. 4x4 started four workers of four threads each, but in 4 of the 5 rounds only three got connections, so twelve threads were busy, not sixteen.
The other eight settings varied by at most 16.1 answers a second across the five rounds. Three did not. 4x2 gave 380 to 383 in three rounds and 464 in two: the two in which only two of its four workers got connections. 4x8 gave 191 to 196 in four rounds and 164 in the one where three workers got connections. 4x4 gave 252 to 256 with three workers, and 240 in the one round where all four did.
Where the One Core's Time Went
Why did threads hurt so much in the service? During every closed-loop run, the client read from /proc, Linux's view of every running thread, how much CPU time each of the service's threads used. I split it into the main threads, which read requests and run the model, and all the other threads, which here are OpenMP's helpers.
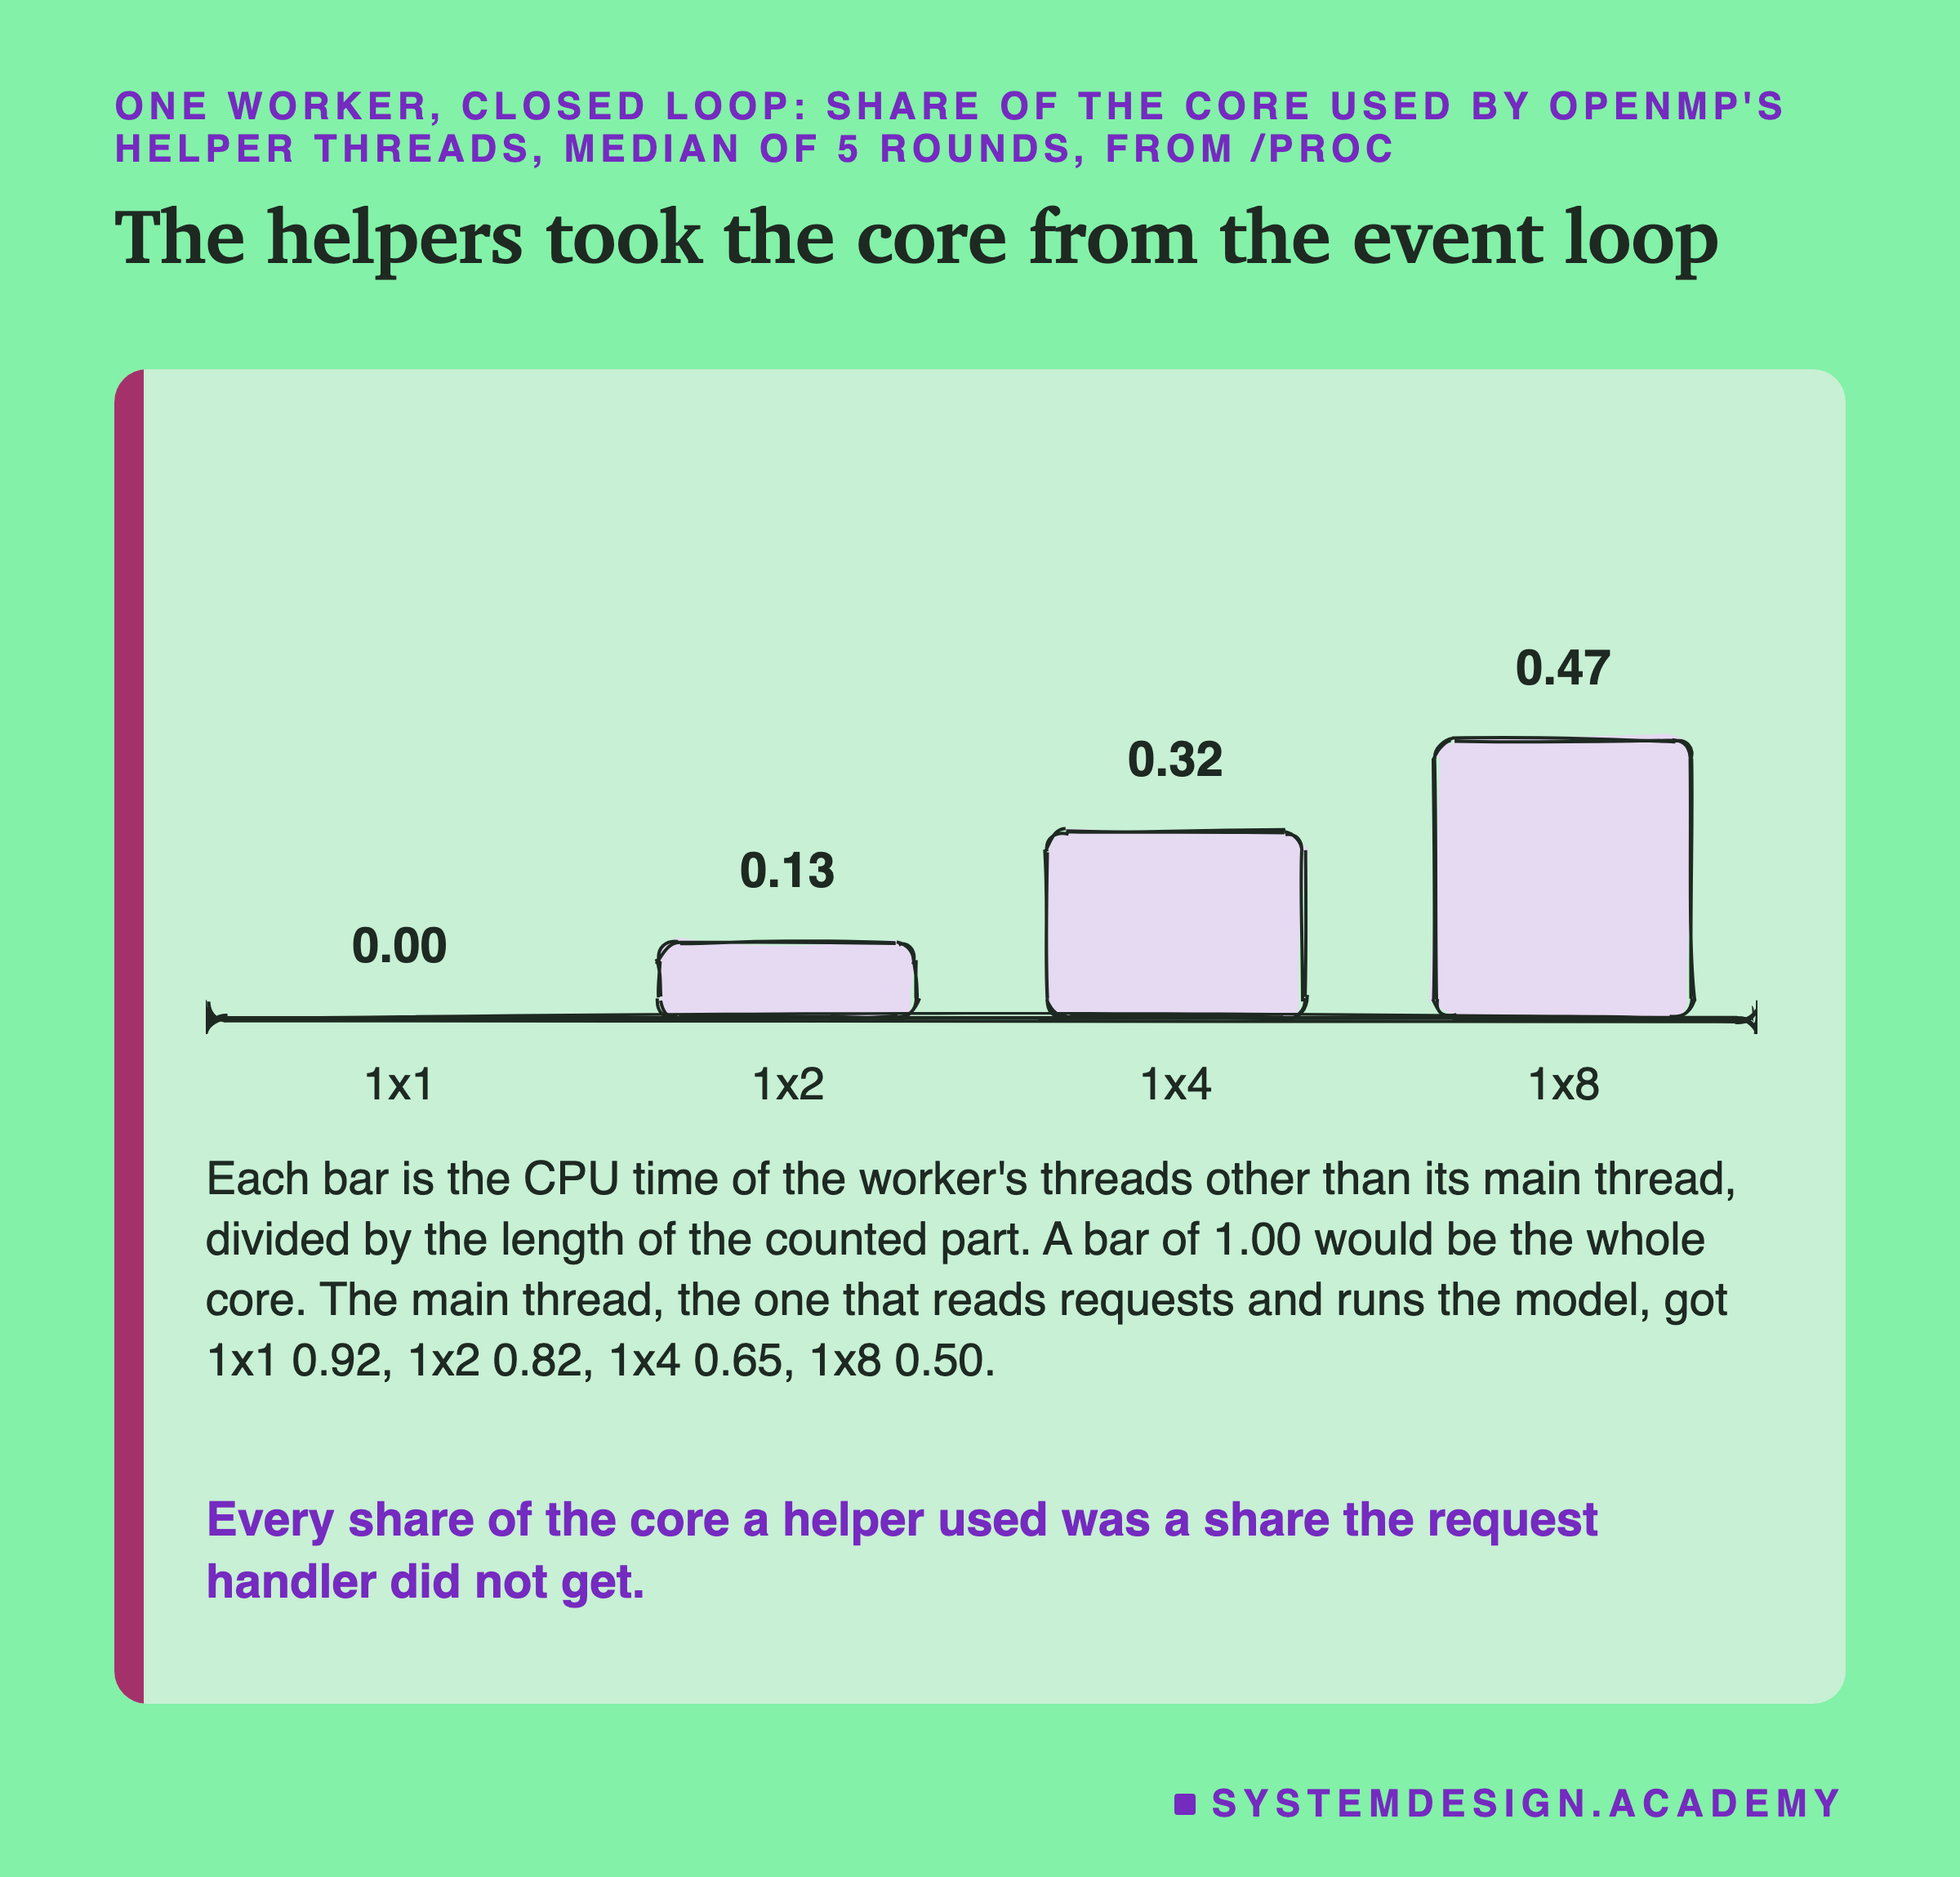
With 8 threads, the helpers used 0.47 of the core, and the main thread got only 0.50. With 1 thread, the main thread got 0.92 of the core and the client most of the rest.
The helpers were not doing useful work in parallel, because there was nothing in parallel to do. A request scores one row, and one row cannot be split usefully. So the helpers' time is the cost of the waking, waiting and switching from Part P, paid on every request. Spin-waiting, helpers busy-checking for work before they sleep, may be part of their CPU time; I did not test that.
scikit-learn's documentation on parallelism says it plainly: "It is generally recommended to avoid using significantly more processes or threads than the number of CPUs on a machine." And of too many threads, it "leads to oversubscription of threads for physical CPU resources and thus to scheduling overhead".
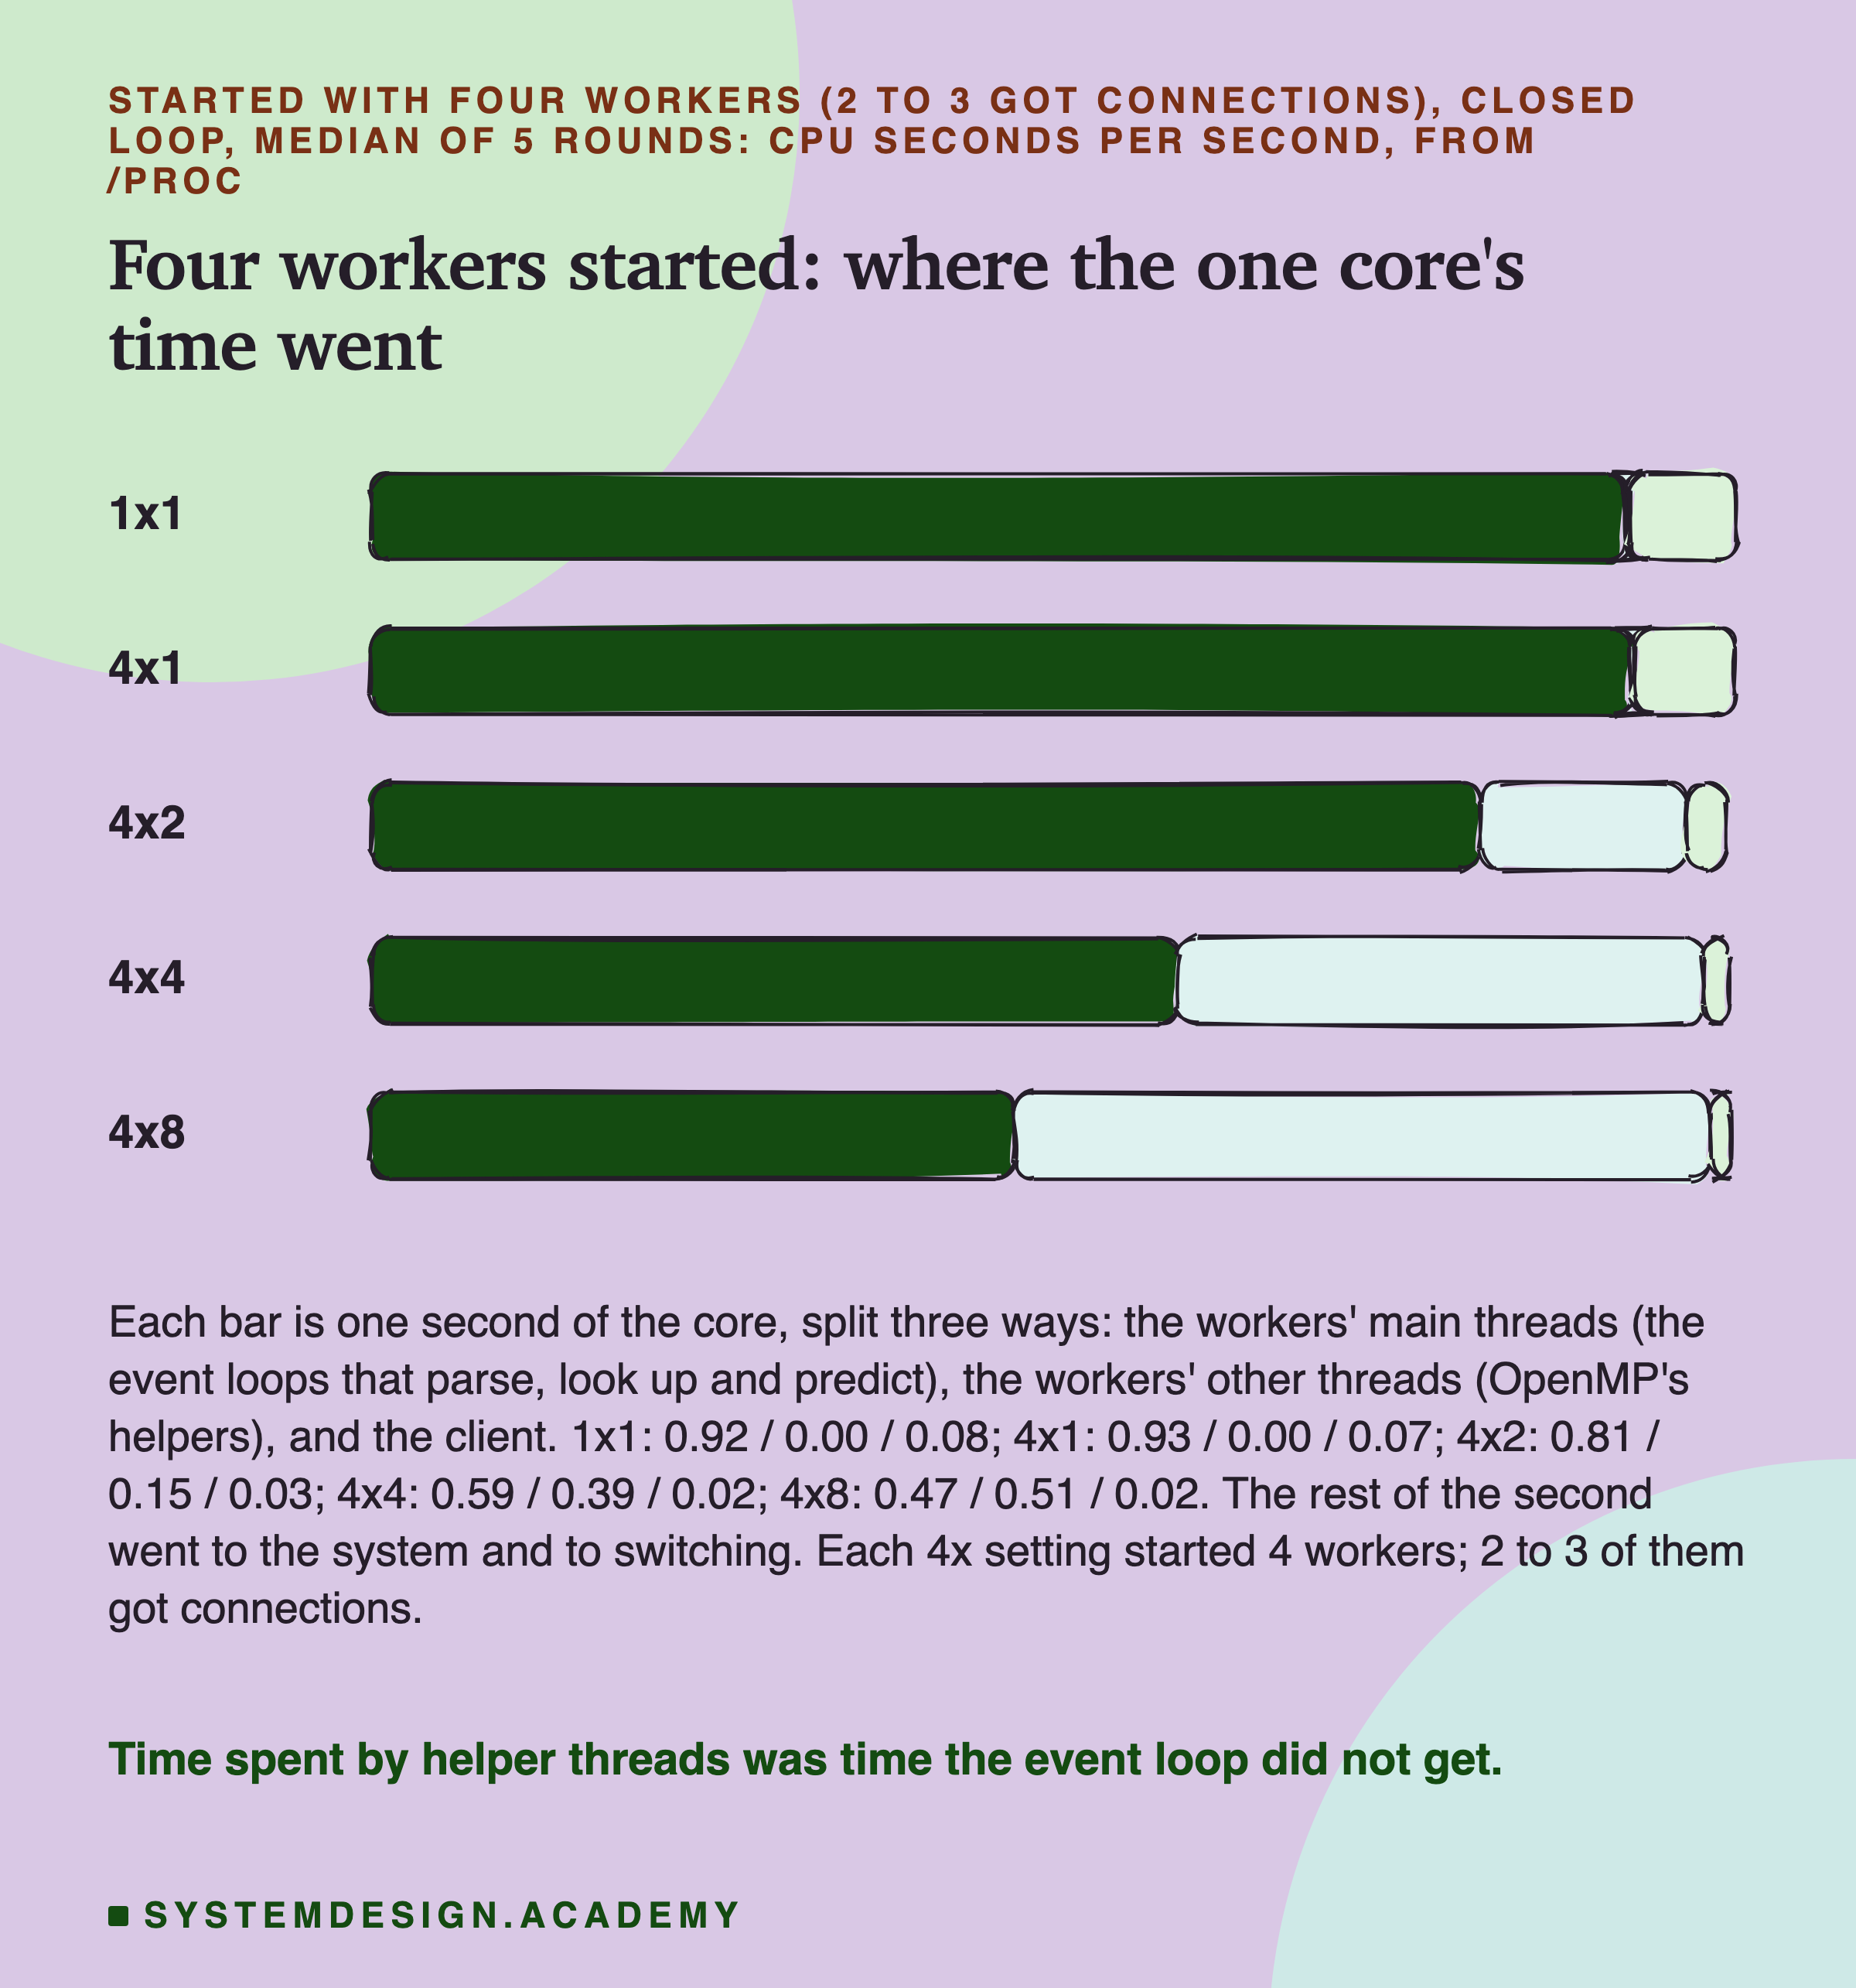
With four started workers, the story is the same. (In these runs 2 to 3 of the four got connections.) Four workers with one thread each kept 0.93 of the core in their main threads, as much as one worker. Four workers with 8 threads each gave 0.51 of the core to helpers.
Under Random Arrivals: Who Kept Up
The closed loop shows the most each setting could do. Real users arrive at random, so here are the open-loop runs.
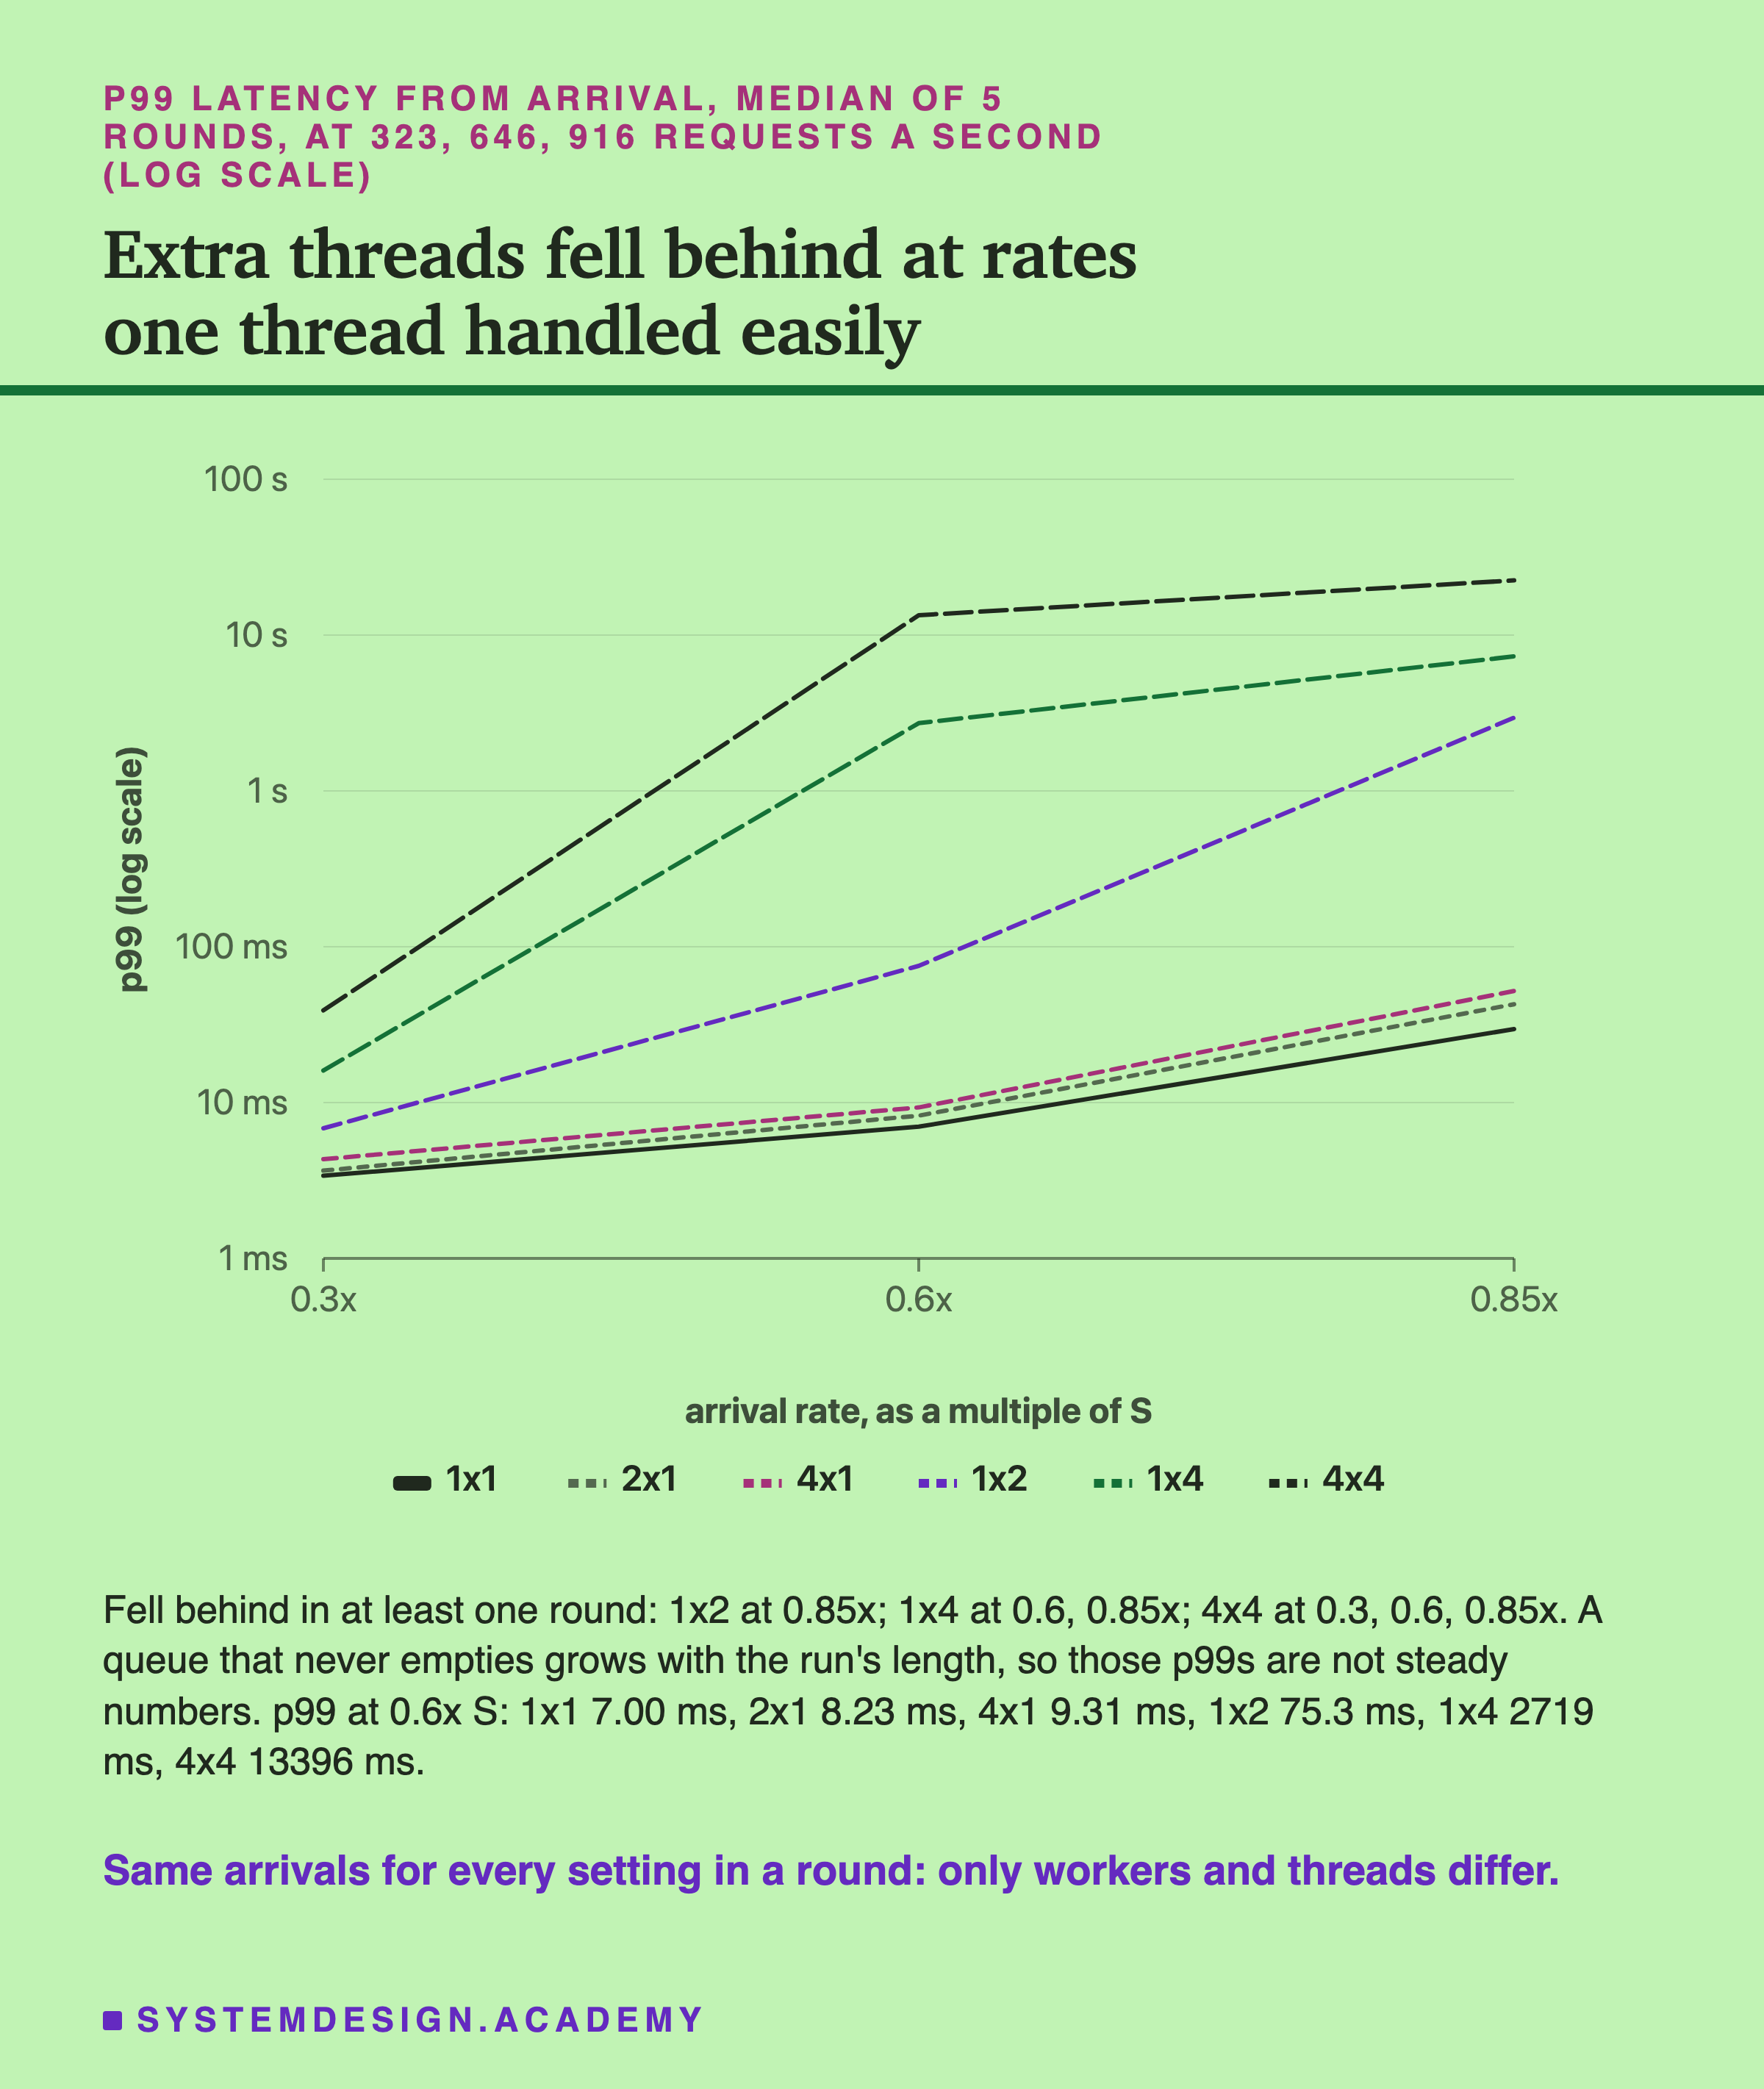
1x1 had the lowest p99 at every rate: 3.39 ms at 0.3 times S, 7.00 ms at 0.6 and 29.60 ms at 0.85. I compared it directly with each other setting, round by round. At 0.6 and 0.85 times S, its p99 was lower than all ten others, told apart. At 0.3 times S it was lower than nine; against 2x1 (3.66 ms) the difference cannot be told apart from noise.
More workers cost a little at the tail. At 0.85 times S, 2x1 had a p99 of 42.78 ms and 4x1 51.96 ms, against 29.60 ms for 1x1. Their medians were almost the same as 1x1's.
Extra threads made the service fall behind. 1x4's most was 486 answers a second, so at 646 arrivals a second its queue grew for the whole run, and its p99 reached 2.7 seconds. Every setting with 4 or 8 threads fell behind at 0.6 times S or earlier. Their p99s above that point only mean "the queue never emptied"; a longer run would have made them larger.
One of my guesses was wrong here. I expected every setting to keep up at 0.3 times S, 323 requests a second. Four did not in every round: 2x4, 4x4, 1x8 and 4x8. Their closed-loop most was already below 323, or close to it.
4x4 kept up in 3 of 5 rounds, and the rounds split by how many workers answered. It kept up in the three rounds where 3 workers answered, and fell behind in the two where all 4 did. More busy workers meant more helper threads wanting the core. Its closed-loop most, 253 a second, was measured with a different client and 16 connections, so the two numbers do not line up exactly.
Which Worker Answered
That last point needs a closer look. Each answer carried the id of the worker process that sent it, so I could count how the work was shared.
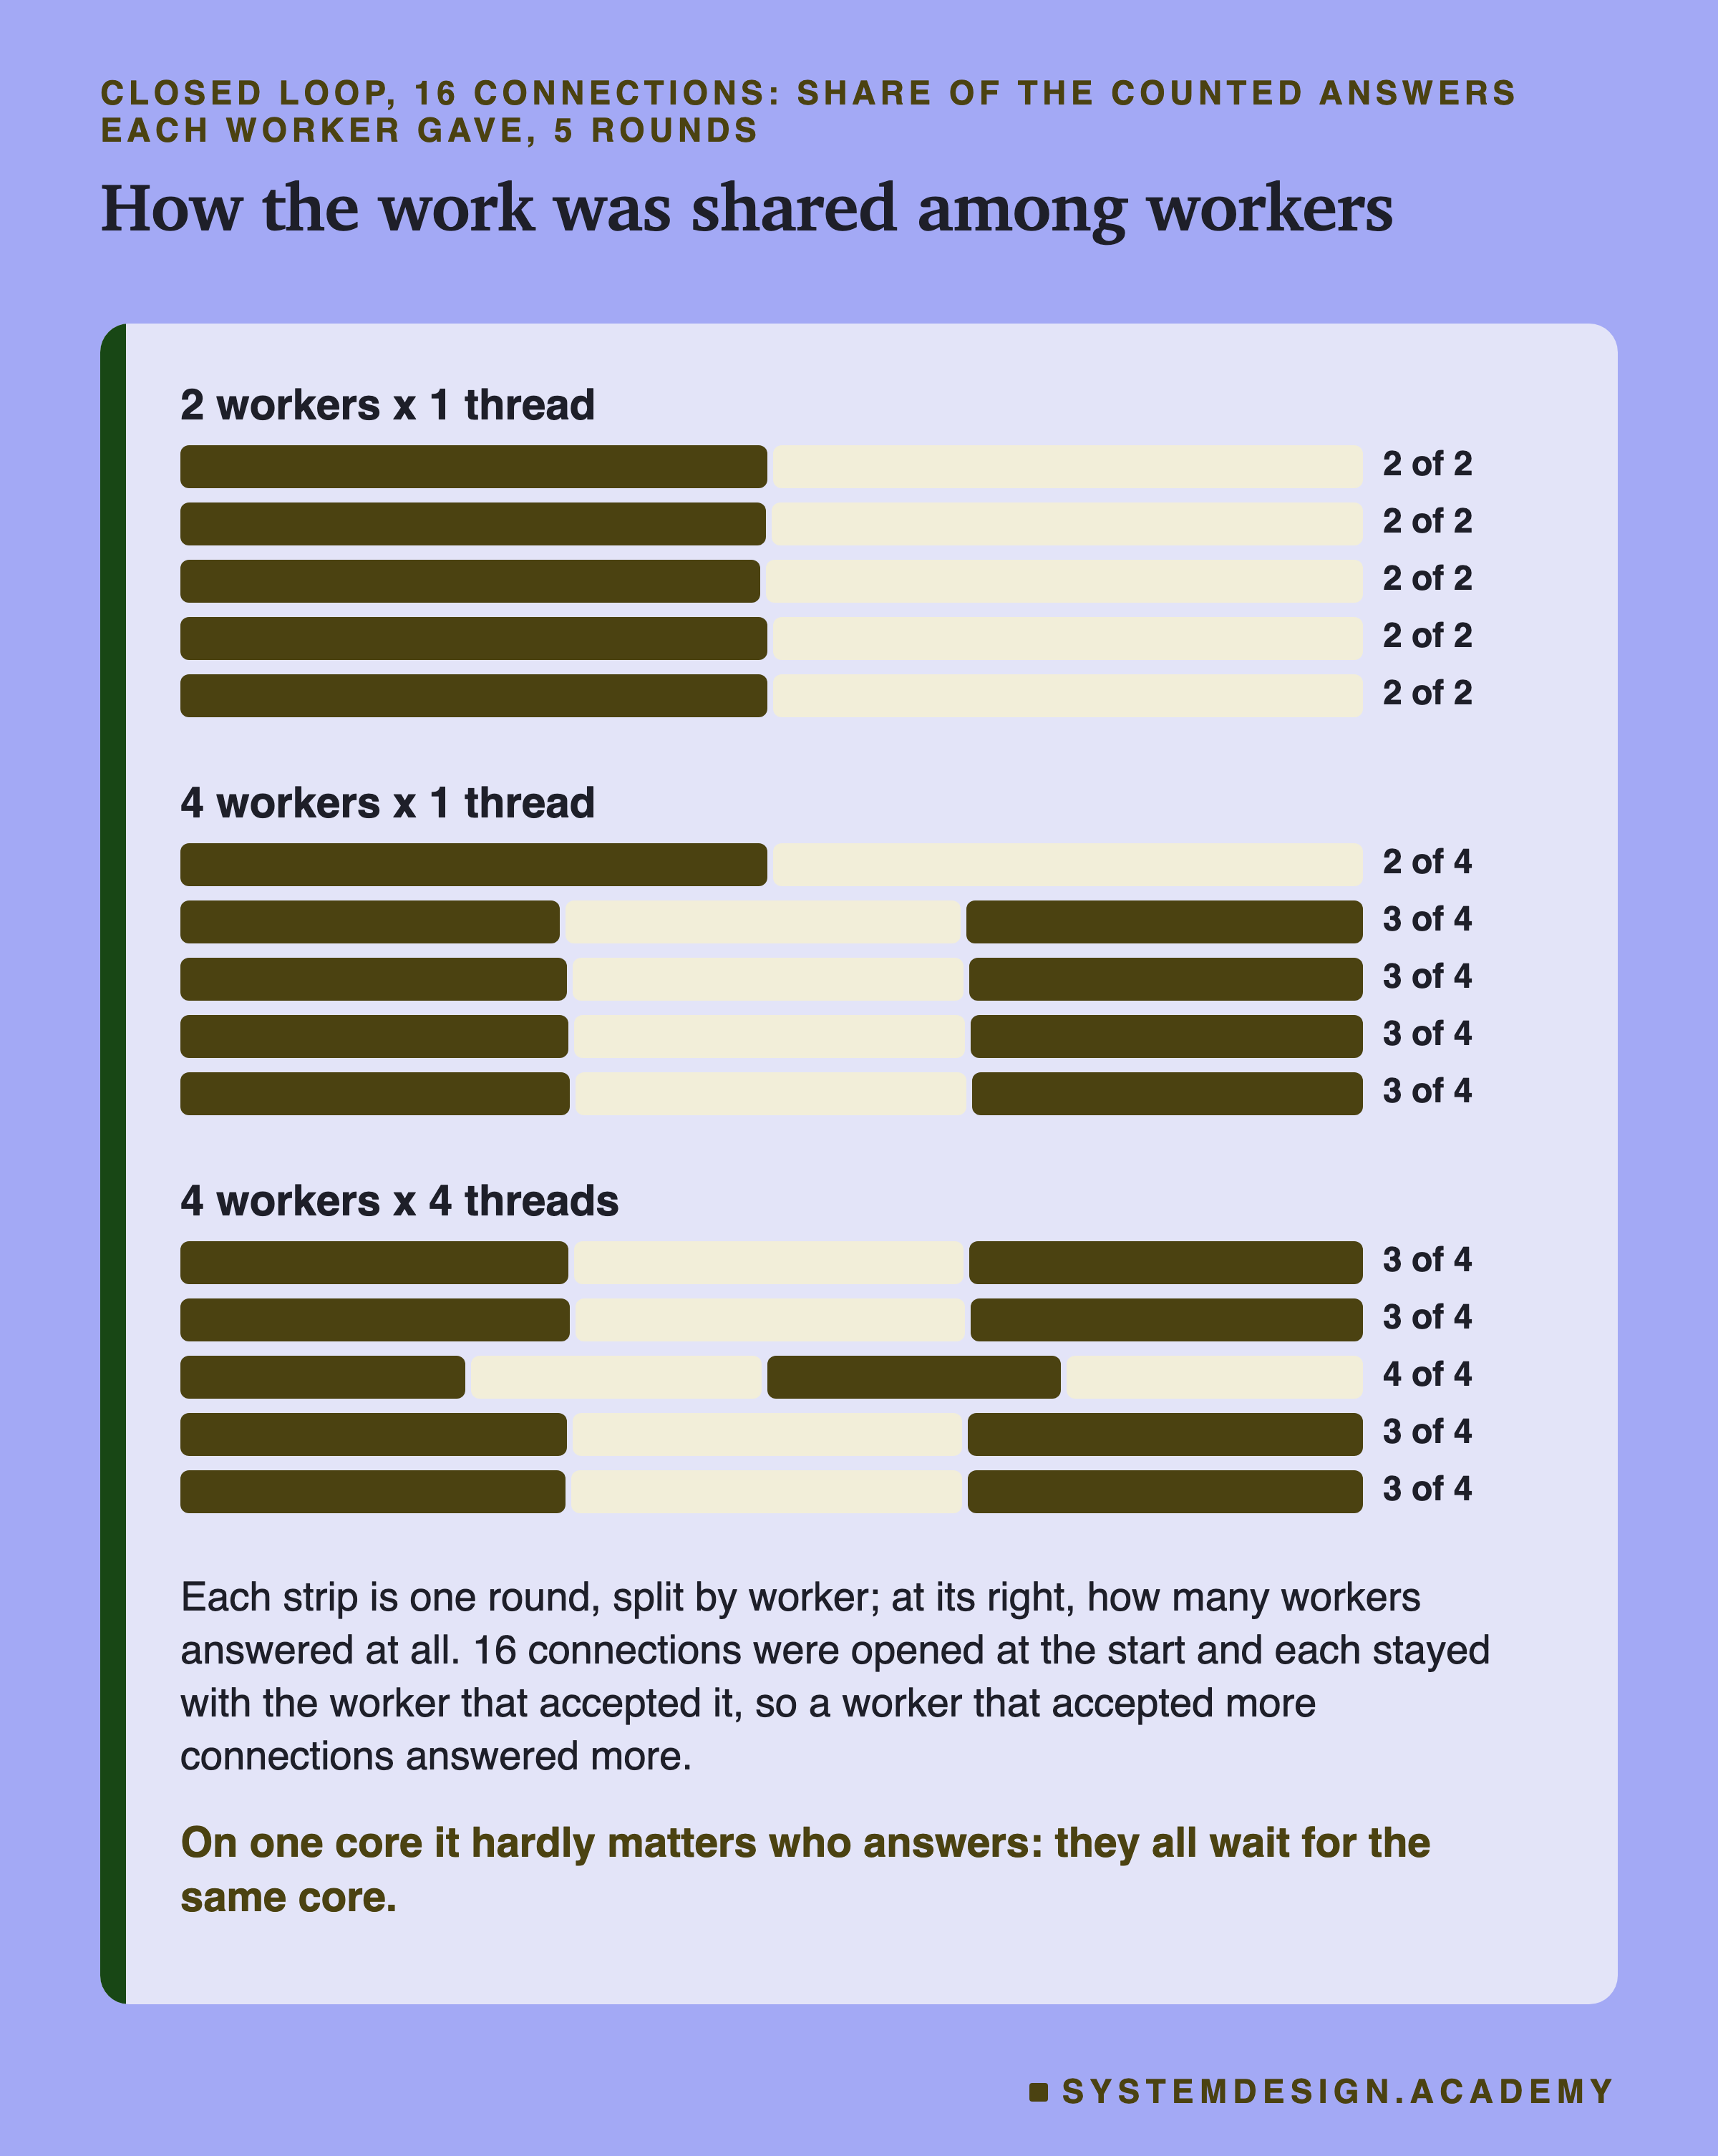
With four workers and 16 connections, one or two workers often answered nothing at all. uvicorn's workers share one listening socket. A connection goes to whichever worker accepts it first, and then it stays there for the whole run. For 4x1, the 16 connections opened at the start went to two or three of the four workers in every round.
In the open-loop runs, with 512 connections, 4x1 still had only two to four workers answering, depending on the run. So a setting called "4 workers" often served with three.
This table was added after the results, from the answers' process ids. It shows how many of the four started workers answered in each closed-loop round, and that round's answers per second.
| setting | round 1 | round 2 | round 3 | round 4 | round 5 |
|---|---|---|---|---|---|
| 4x1 | 2: 1,051 | 3: 1,044 | 3: 1,049 |
Memory: Each Worker Carries Its Own Copy
Workers are not free in memory. At the end of every closed-loop run, the client read each service process's RSS and Pss from /proc.
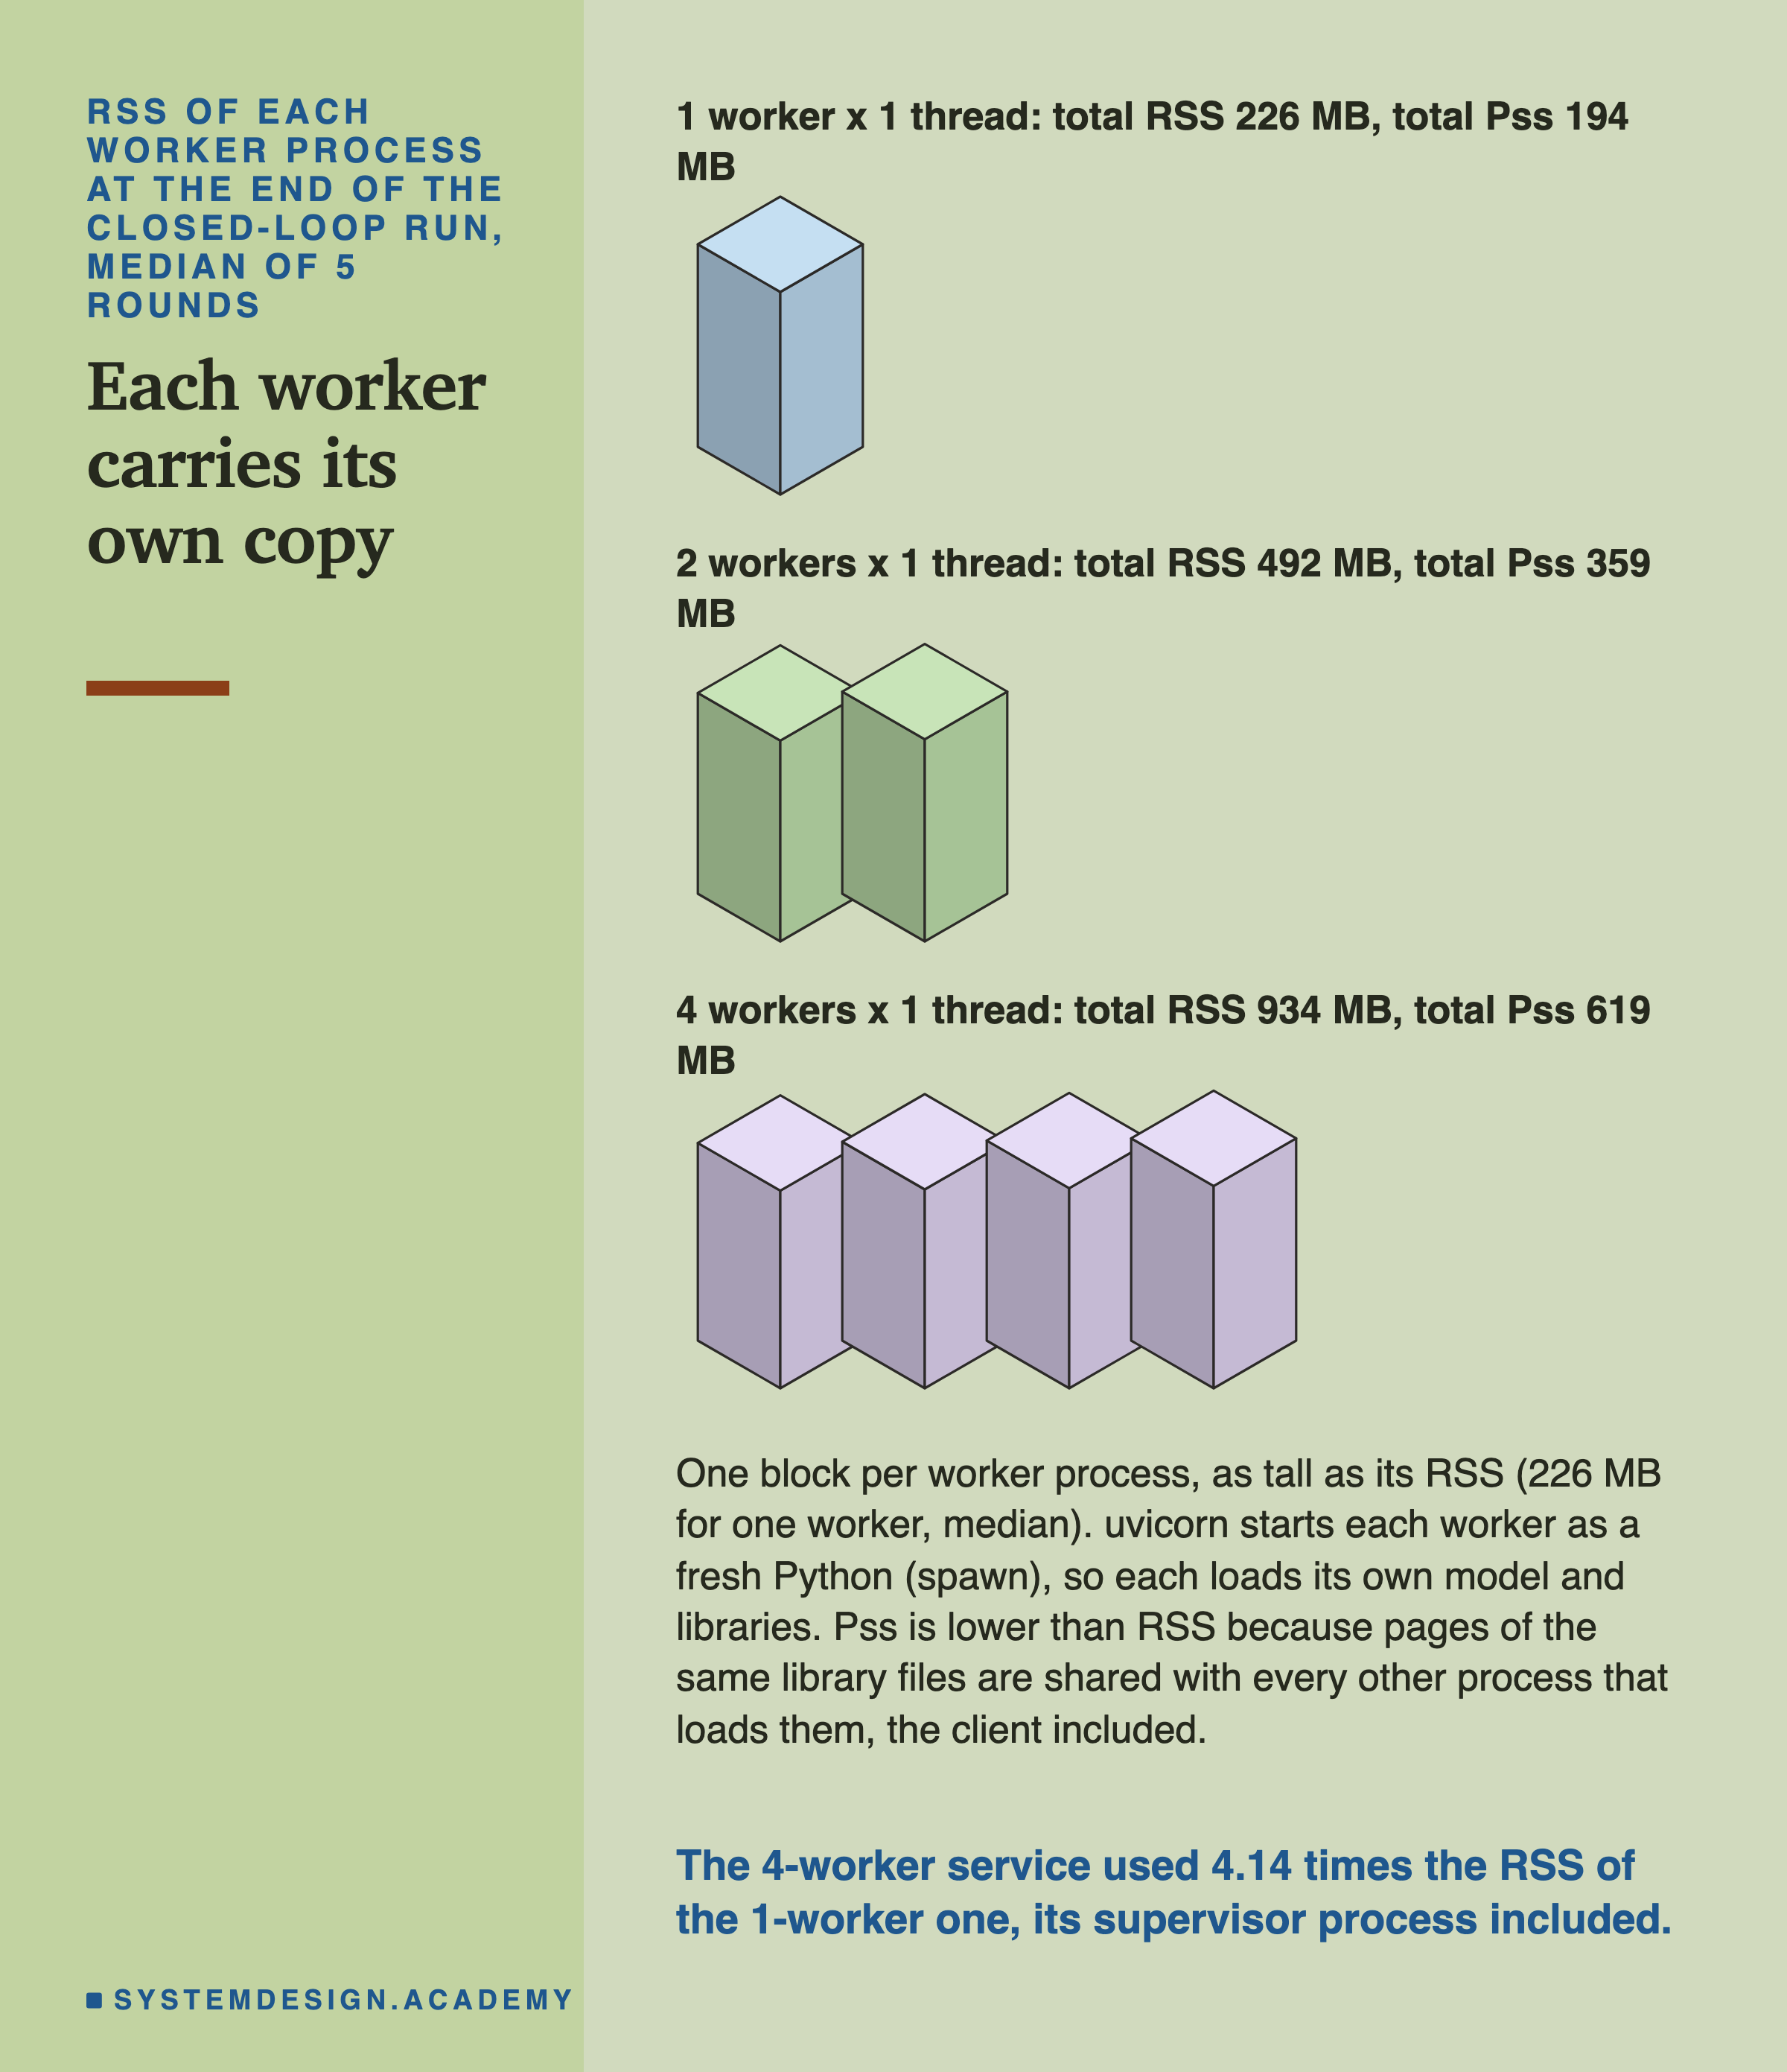
Each worker used 218 to 228 MB of RSS, whatever its thread count. One worker was 226 MB in all. Four workers were 934 MB, 4.14 times as much. That is more than four copies. With more than one worker, uvicorn also runs a supervisor process (about 27 MB), which starts the workers, checks they are alive and restarts any that die. Python adds a small helper process (about 17 MB).
Why does every worker hold a full copy? uvicorn's documentation says: "Uvicorn includes a --workers option that allows you to run multiple worker processes." And: "Unlike gunicorn, uvicorn does not use pre-fork, but uses" spawn. Spawn starts each worker as a brand-new Python, which imports numpy, scikit-learn and FastAPI and loads the model from the file, all over again. Pre-fork, which gunicorn uses, loads the model once and then copies the whole process with fork. The copies share the parent's memory pages until one of them writes to a page. This is called copy-on-write.
Pss shows what is really shared. Four workers' Pss was 619 MB, against 934 MB of RSS. The difference is pages of the same library files on disk, which the operating system loads once and lets every process map. Each worker's own model, arrays and Python objects are not shared. Lesson 10 of this chapter measures memory when many models live on one box.
What a Box With More Cores Would Change
Everything above is one small tree model on one core. I could not rent a box with more cores, so I give no numbers for one. But the measurements here show which parts of the answer depend on the core count, and why.
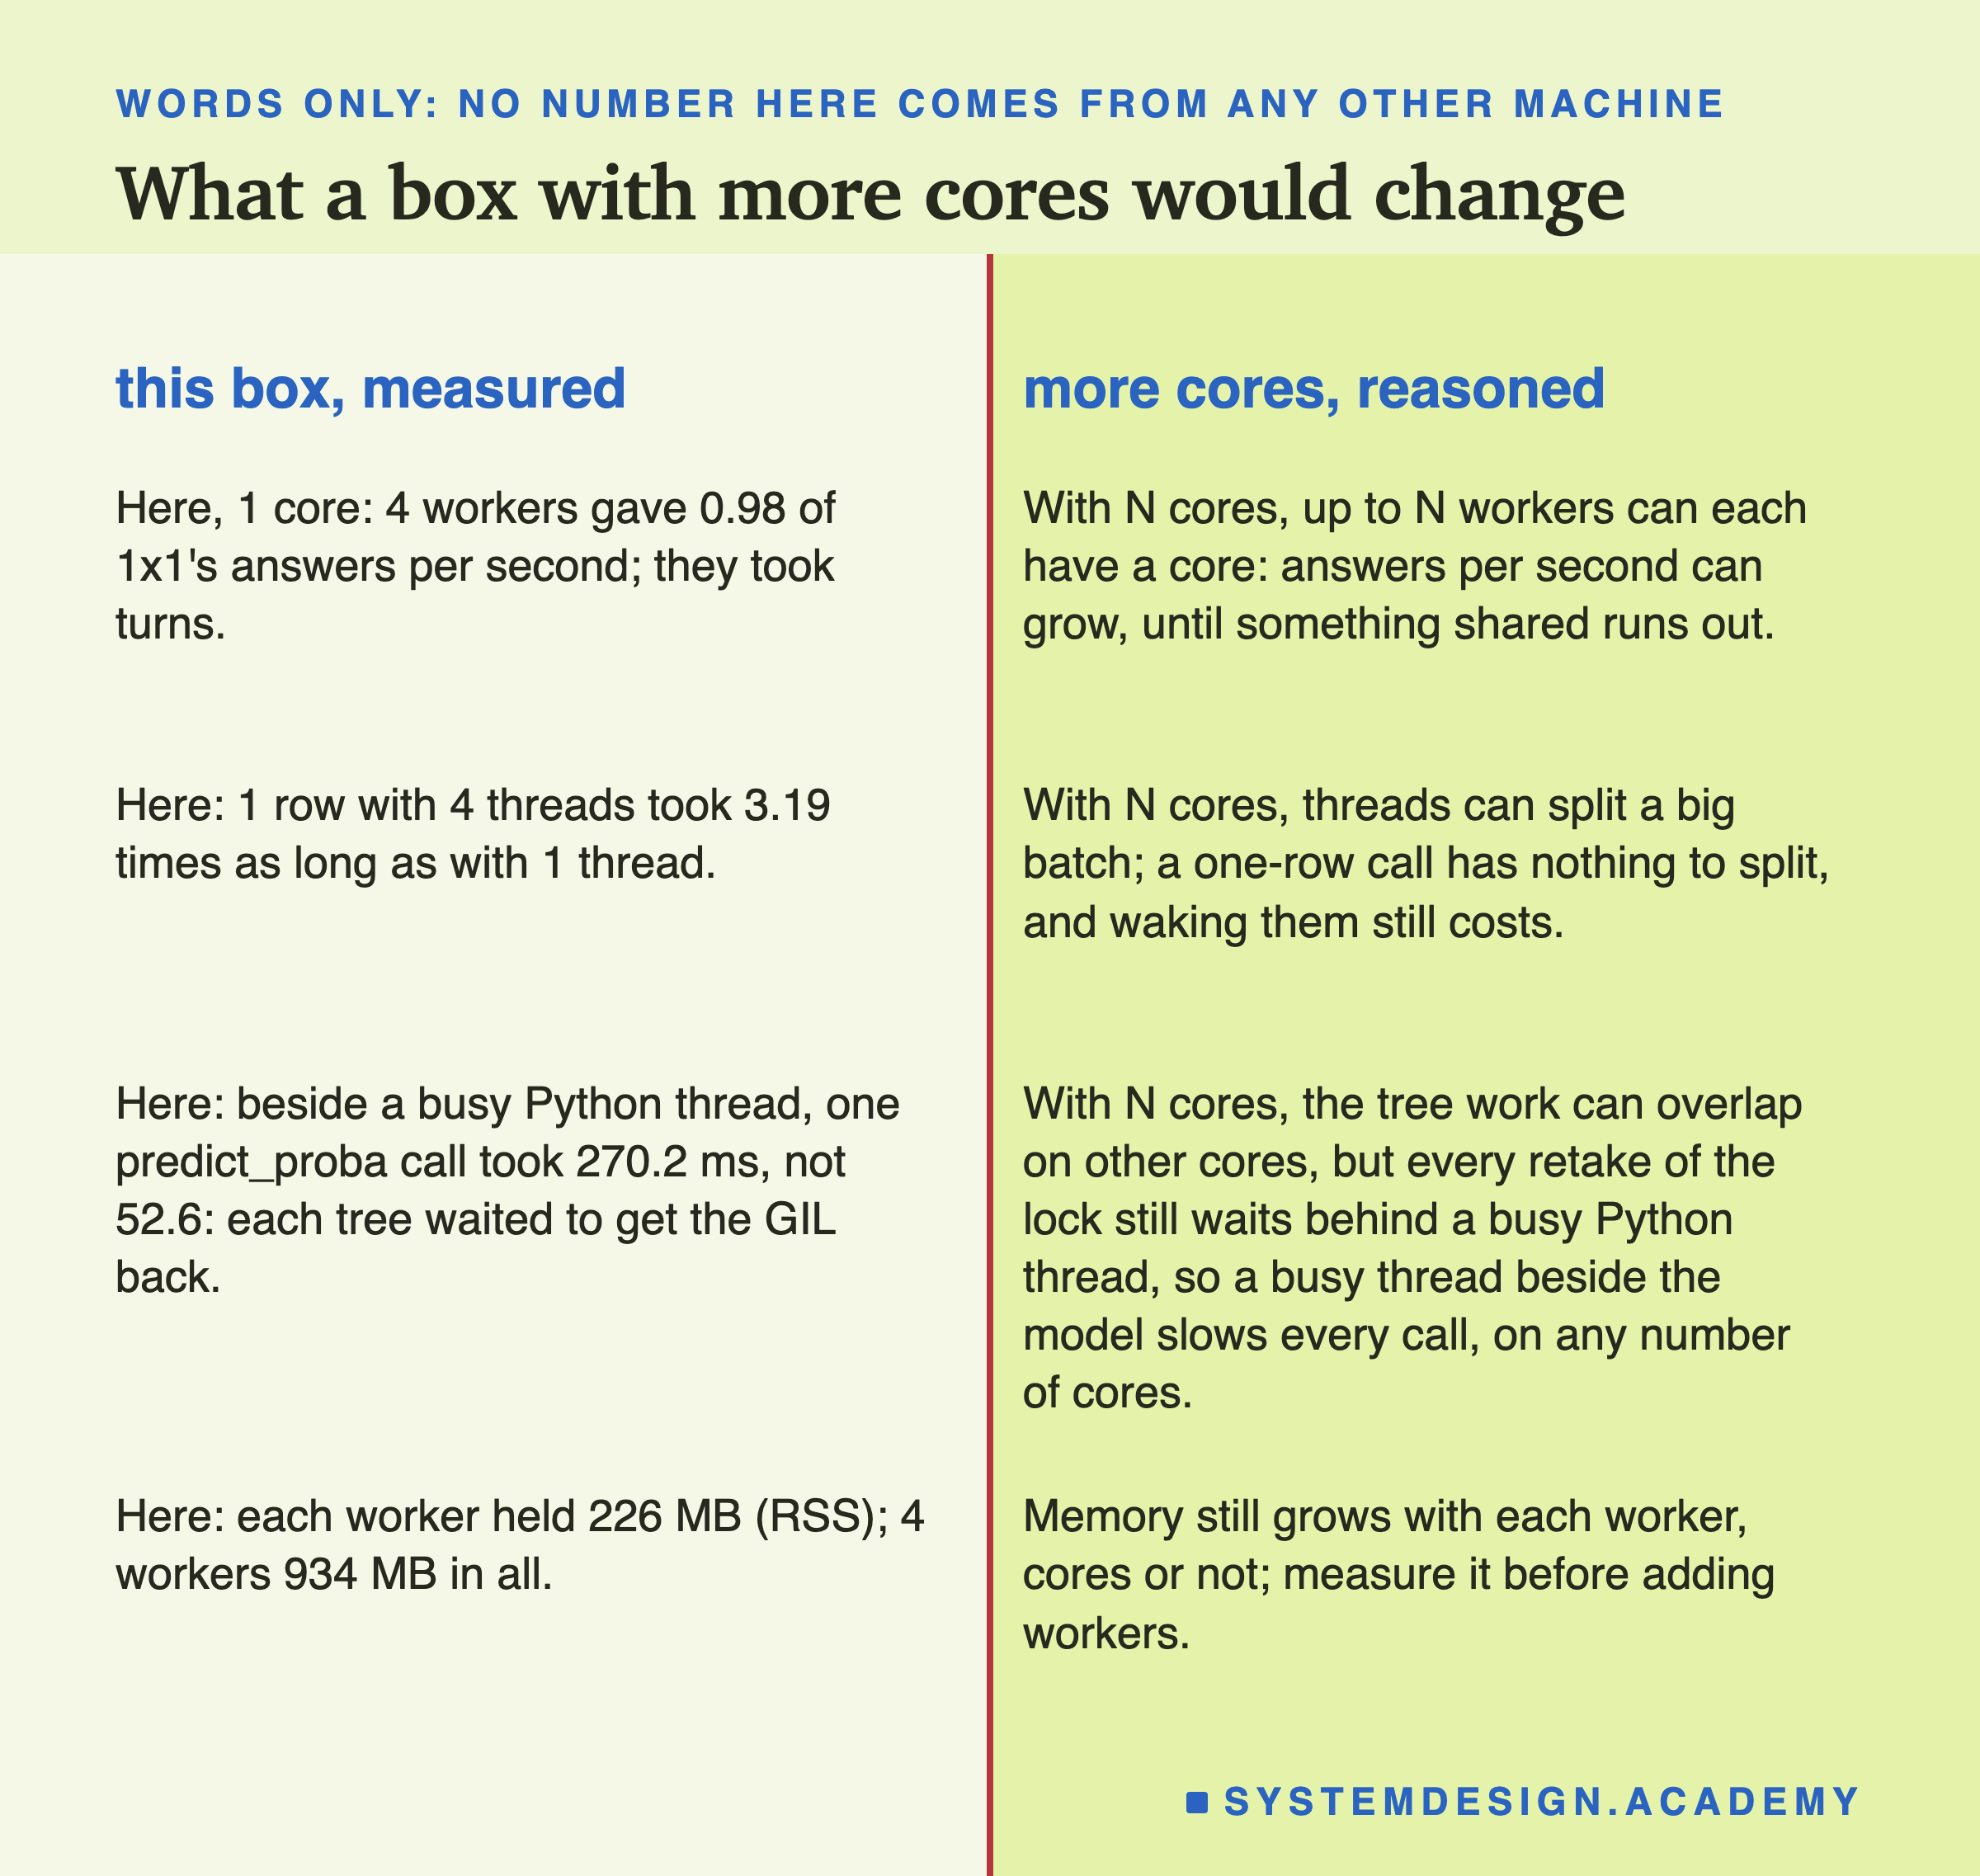
Workers are what more cores would change most. On one core, four workers took turns and gave 0.98 of one worker's answers. With four cores, each worker could have its own core. Much of each answer here is Python code: reading the request, checking it, and the Python part of the model call. Lesson 2 timed each step. Only one thread at a time can run Python code in a process. So more processes, not more threads, is the usual way to use more cores for a service like this one. How much it would gain, I cannot say without measuring.
One-row threads would still not help much. A one-row call has nothing to share between helpers. More cores remove the waiting for a turn, but not the waking and the gathering.
A busy Python thread beside the model still costs on any machine. With more cores, the tree work can overlap on other cores. But every retake of the lock still waits behind a busy Python thread, so a busy thread beside the model slows every call, on any number of cores. The box used the standard Python build. Python 3.13 also offers an optional free-threaded build without the GIL, which I did not measure. Its documentation says "Starting with the 3.13 release, CPython has experimental support for a build of Python called free threading where the global interpreter lock (GIL) is disabled."
The danger of multiplying is the same on any machine. scikit-learn uses as many threads as there are cores by default. Its own documentation gives the example of eight jobs each running a model with eight threads on eight cores, "a total of 8 * 8 = 64 threads". Four uvicorn workers on a four-core box, each with four OpenMP threads by default, is the same mistake: sixteen threads for four cores. That is exactly the 4x4 setting here, on a smaller scale.
My Seventeen Guesses Before the Run, Checked
I wrote seventeen guesses into the lab before it ran. Each is quoted here word for word from the docstring. Fourteen were right and three were wrong.
-
"P1. predict on 1 row at T = 1: median per call between 450 and 650 us (lesson 4: 501.7 us)." Right: 510.5 us.
-
"P2. predict on 1 row at T = 4: median at least 1.5 x T = 1's." Right: 3.19 times.
-
"P3. predict on all 26,851 rows at T = 4: median within 15% of T = 1's (one core: no speed-up, small loss)." Right: 1.030 times.
-
"P4. every score at every T equals T = 1's single-row score to the bit." Right.
-
"G1. side thread during predict_proba(26,851 rows): between 0.35 and 0.65 of its alone rate." Wrong: 0.797. I expected the two threads to share the core about half and half. Instead the model call spent most of its time waiting to take the lock back, one switch interval per tree, as the GIL slide explains. The side thread ran meanwhile.
-
"G2. side thread during sorted(): below 0.15 of its alone rate." Wrong, though close: 0.173. Each sort took only 37 ms, so the side thread's short turns between sorts added up to a bit more than I guessed.
-
"G3. side thread during a pure-Python loop: between 0.35 and 0.65 of its alone rate." Right: 0.498.
-
"S1. S (1x1, closed loop) between 1,000 and 1,200 answers per second." Right: 1,077.1.
-
"S2. 2x1 and 4x1 closed-loop answers per second below 1x1's, told apart, each by less than 15%." Right: 0.979 and 0.981.
Try It Yourself
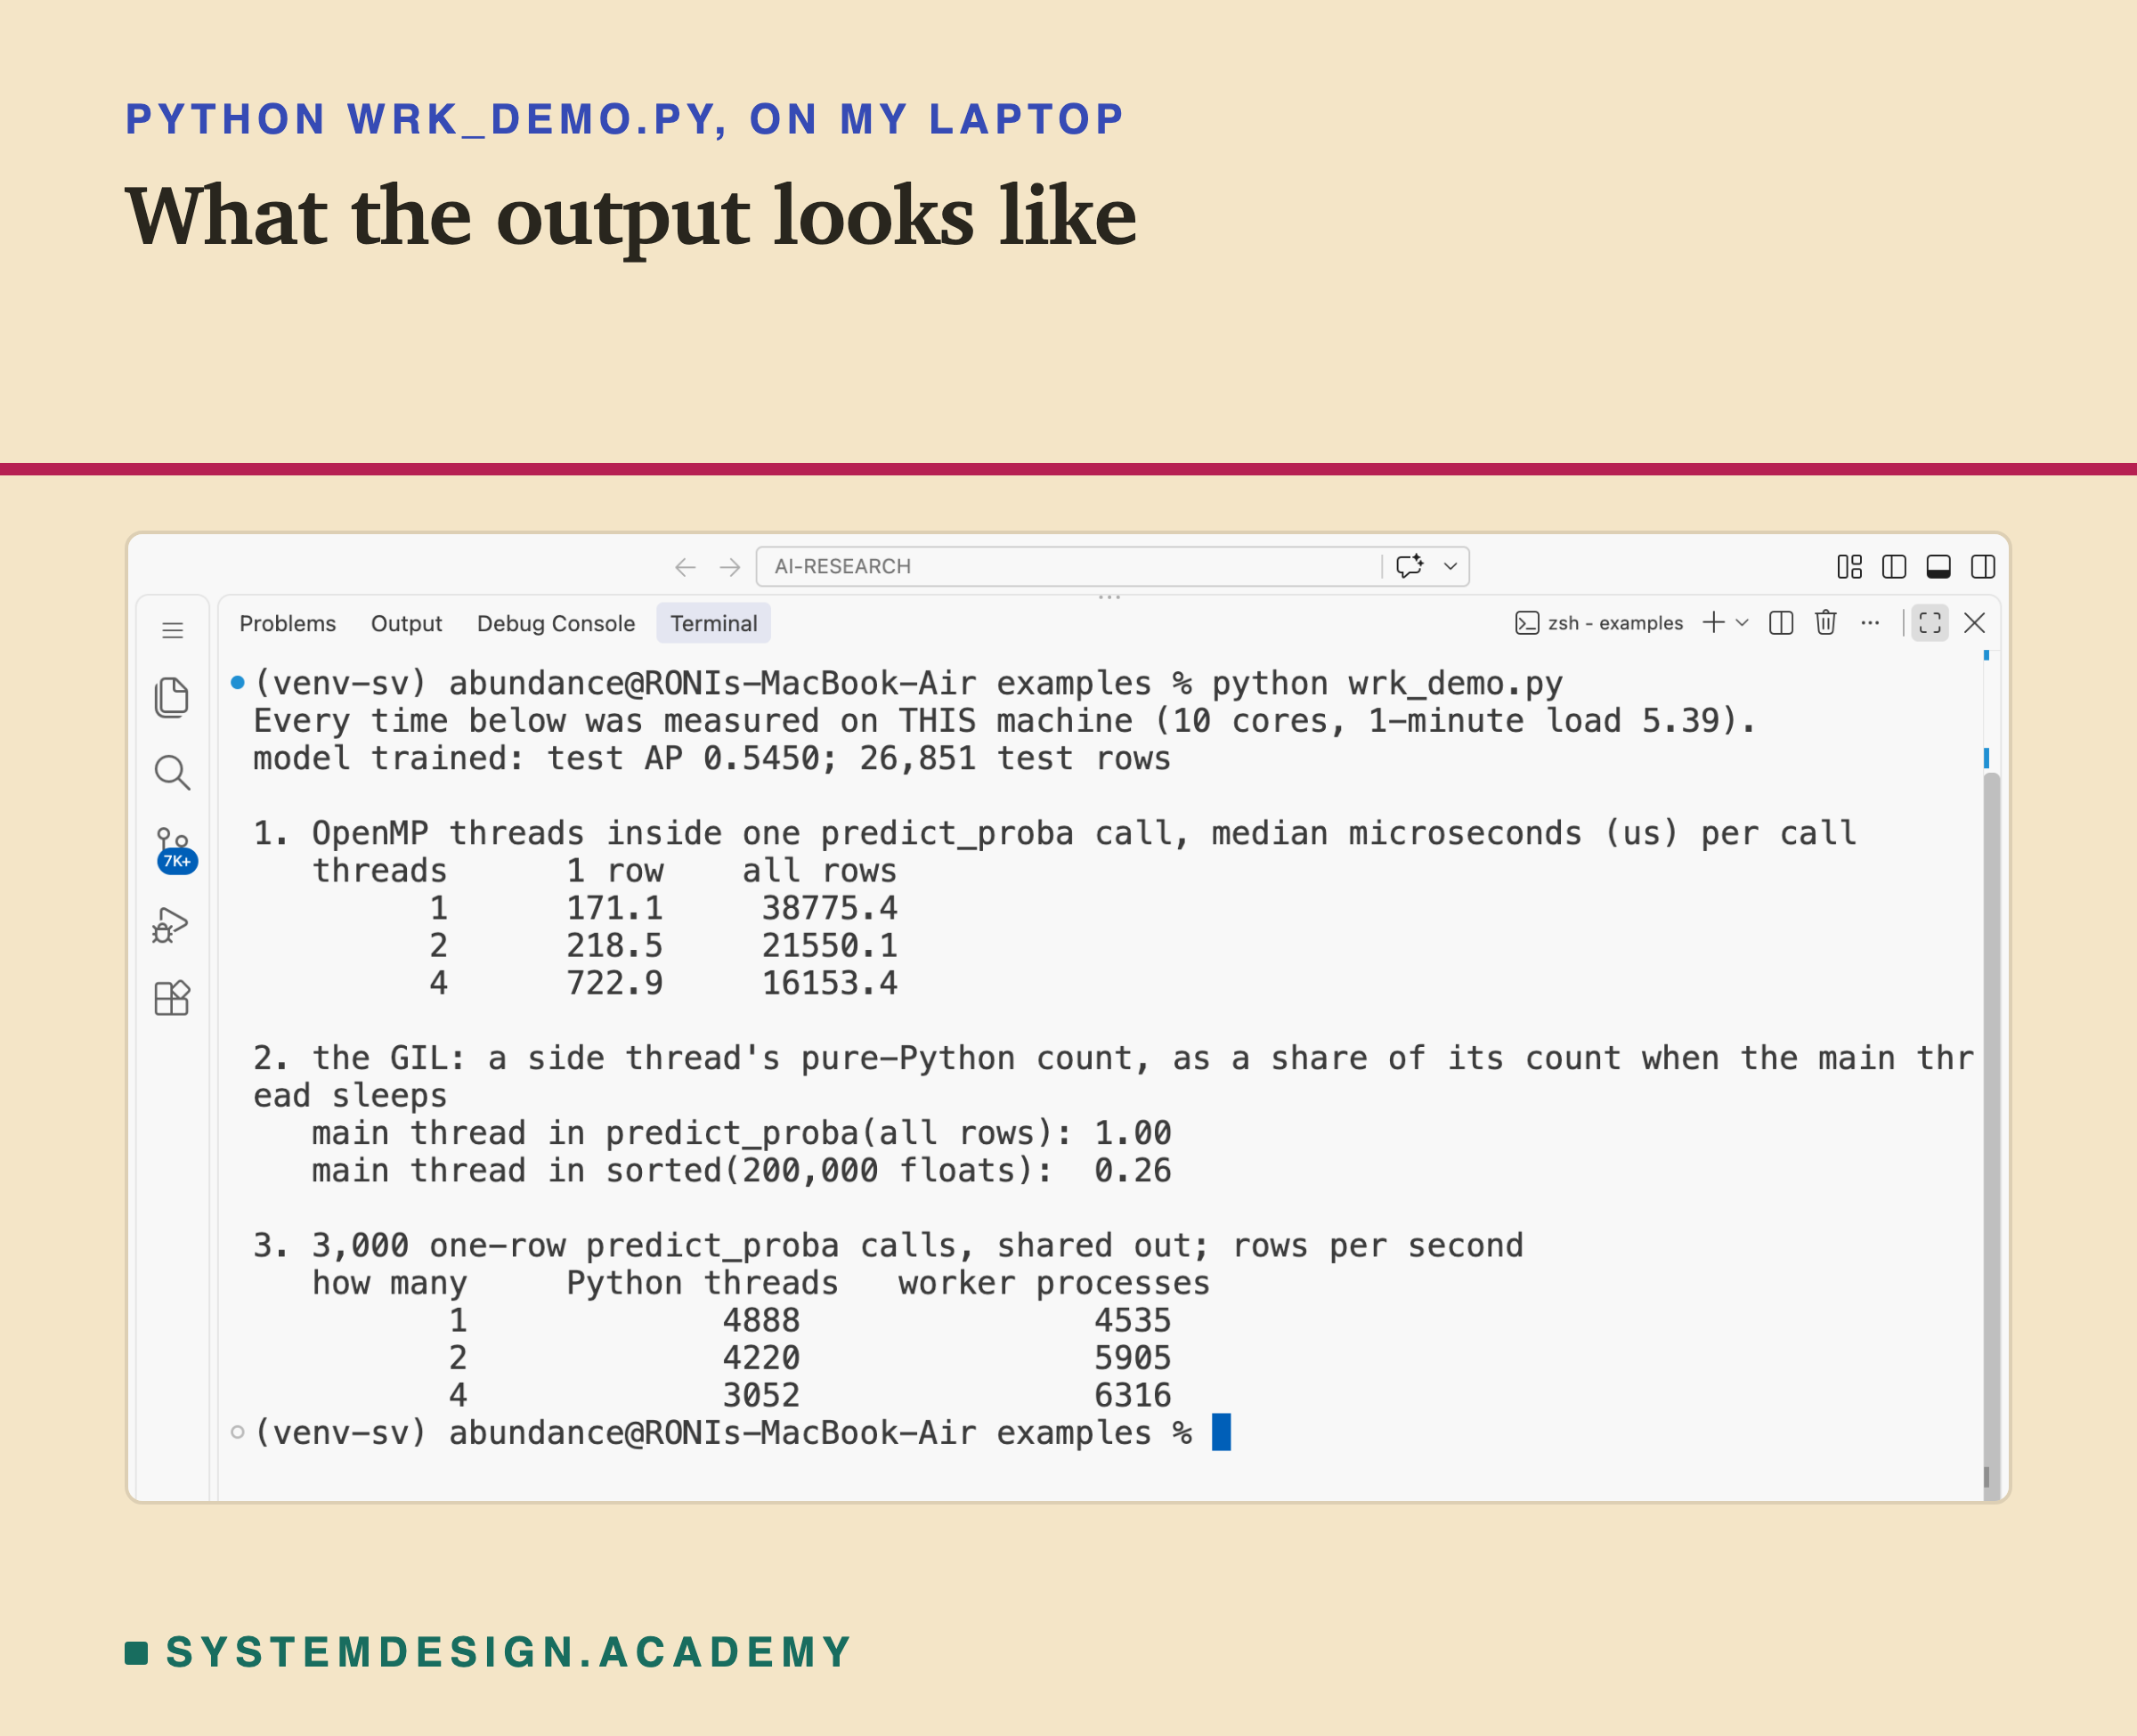
The full lab needs a rented box and about an hour and a half. The demo, wrk_demo.py, runs on your own computer. It times OpenMP threads, checks the GIL, and shares one-row calls between Python threads and between worker processes.
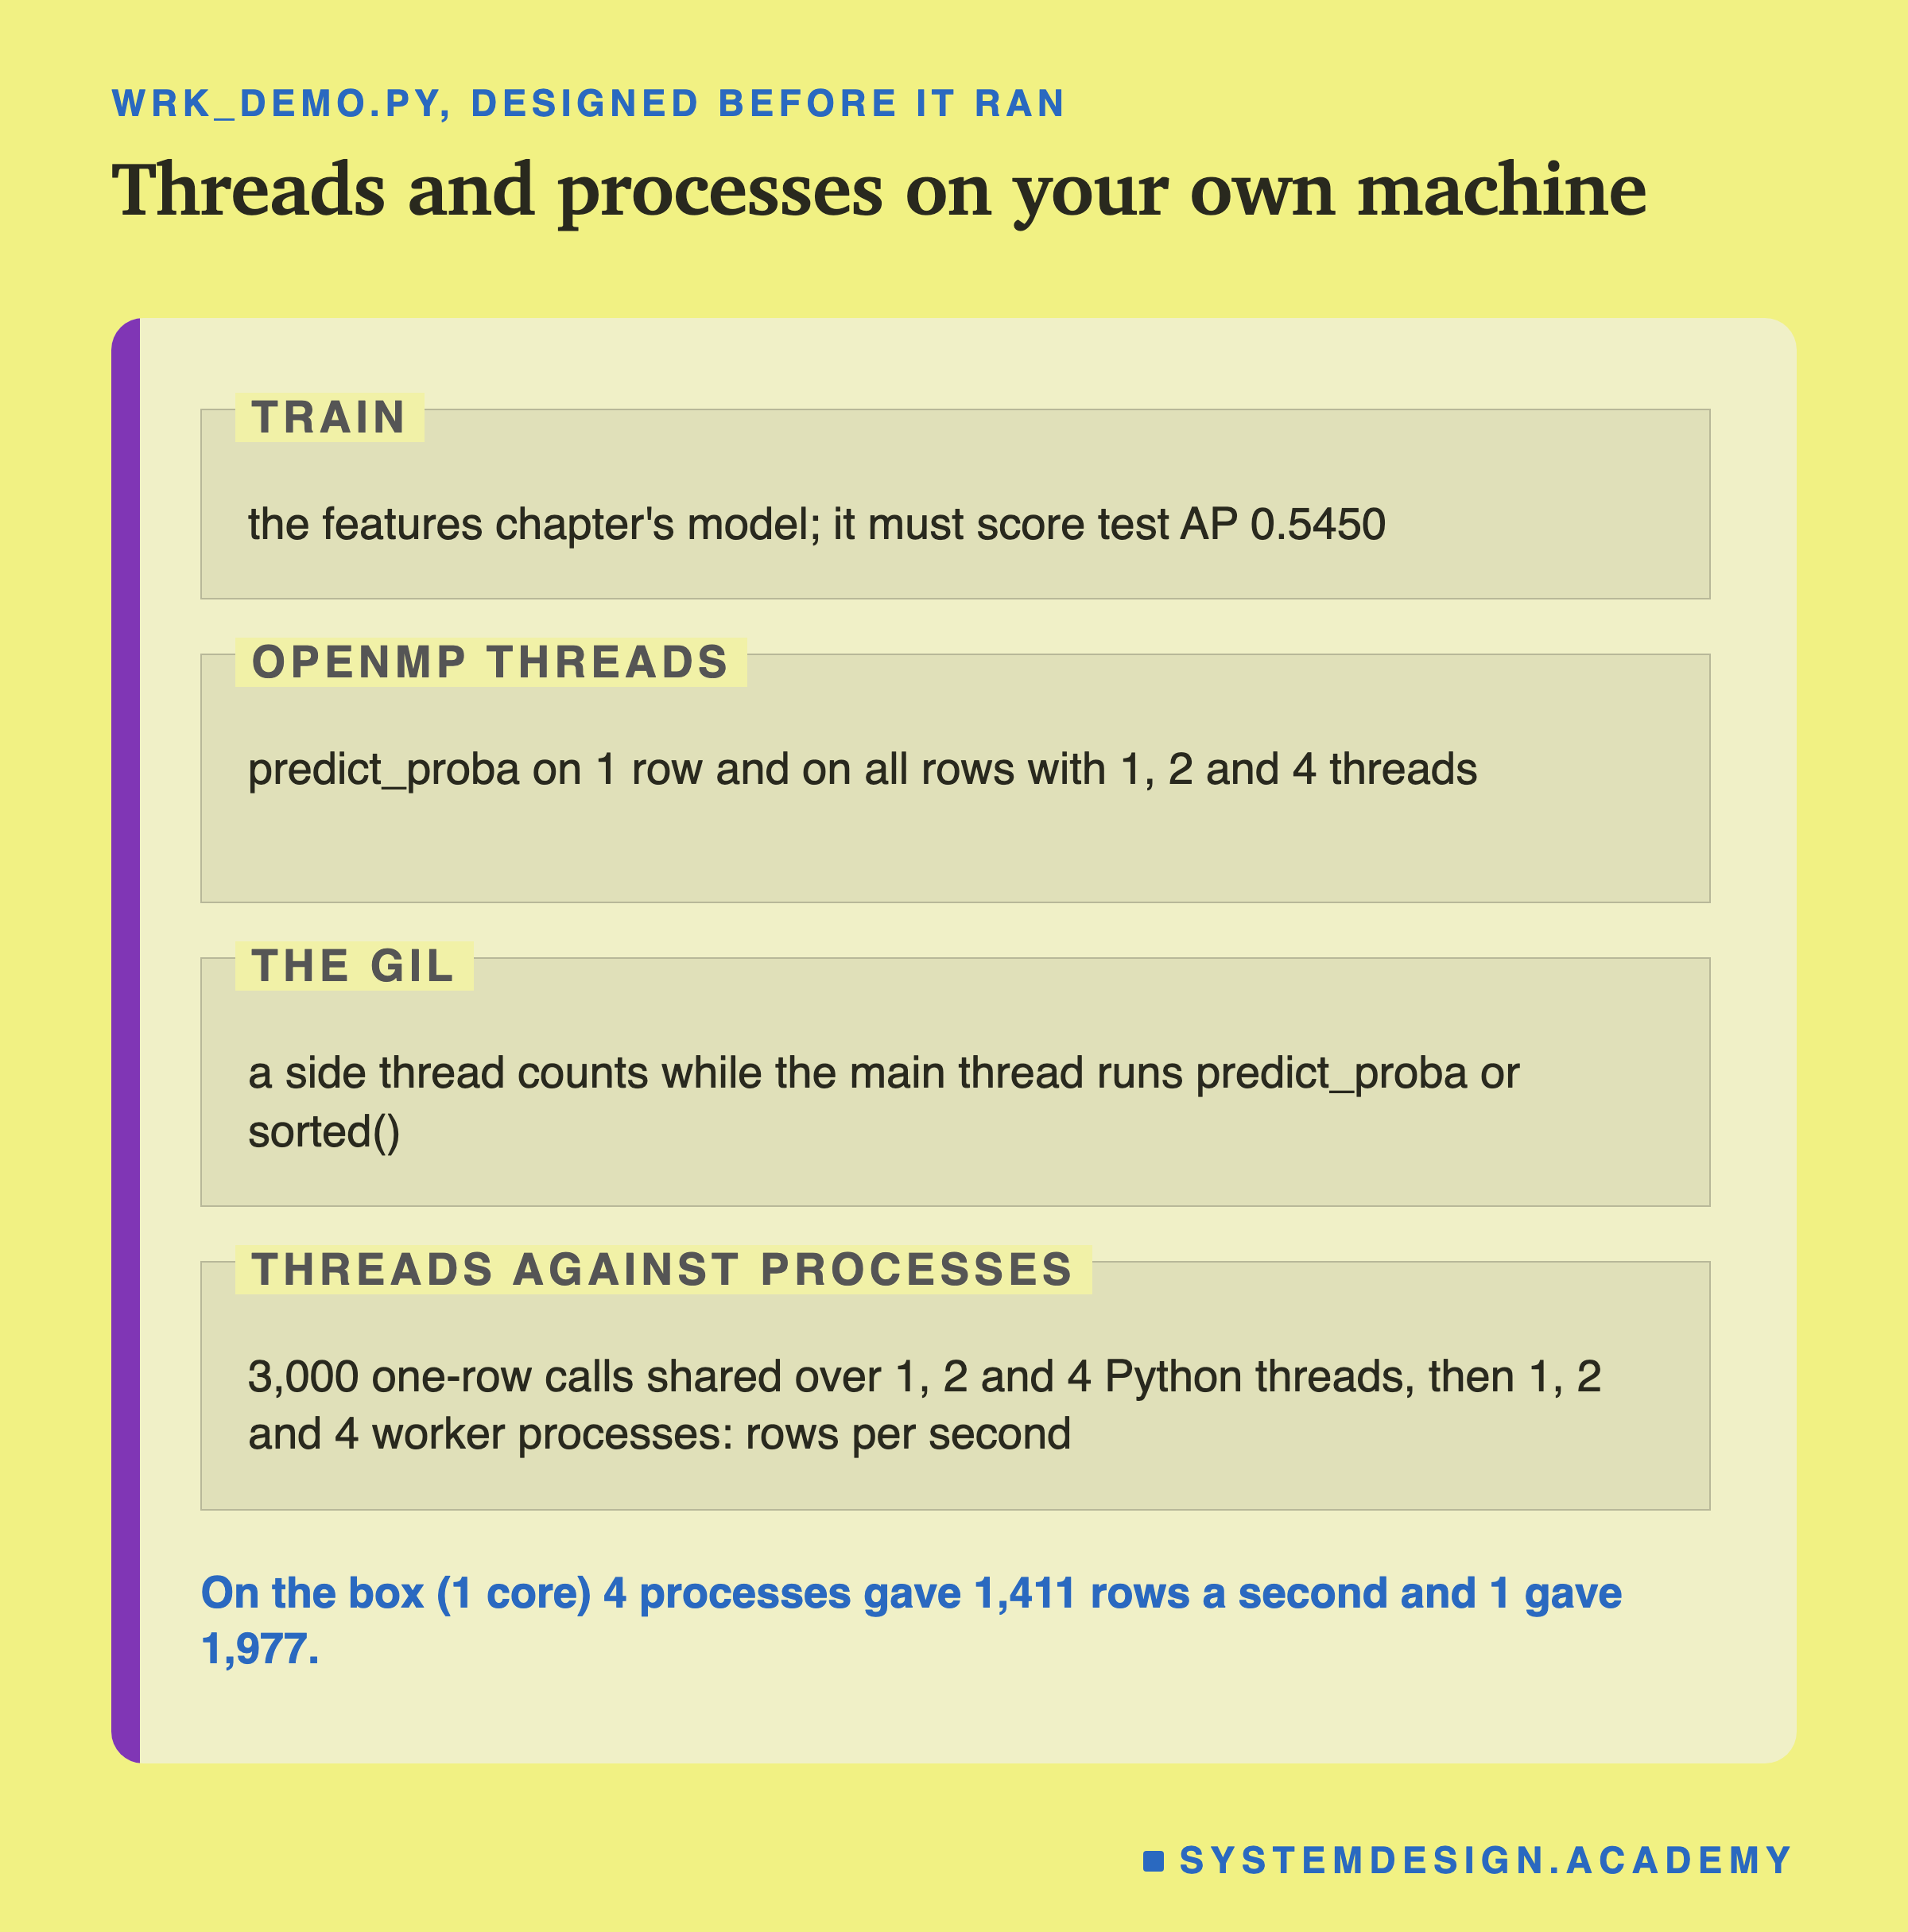
I wrote the demo's design into its docstring after the lab's design and before the demo first ran.
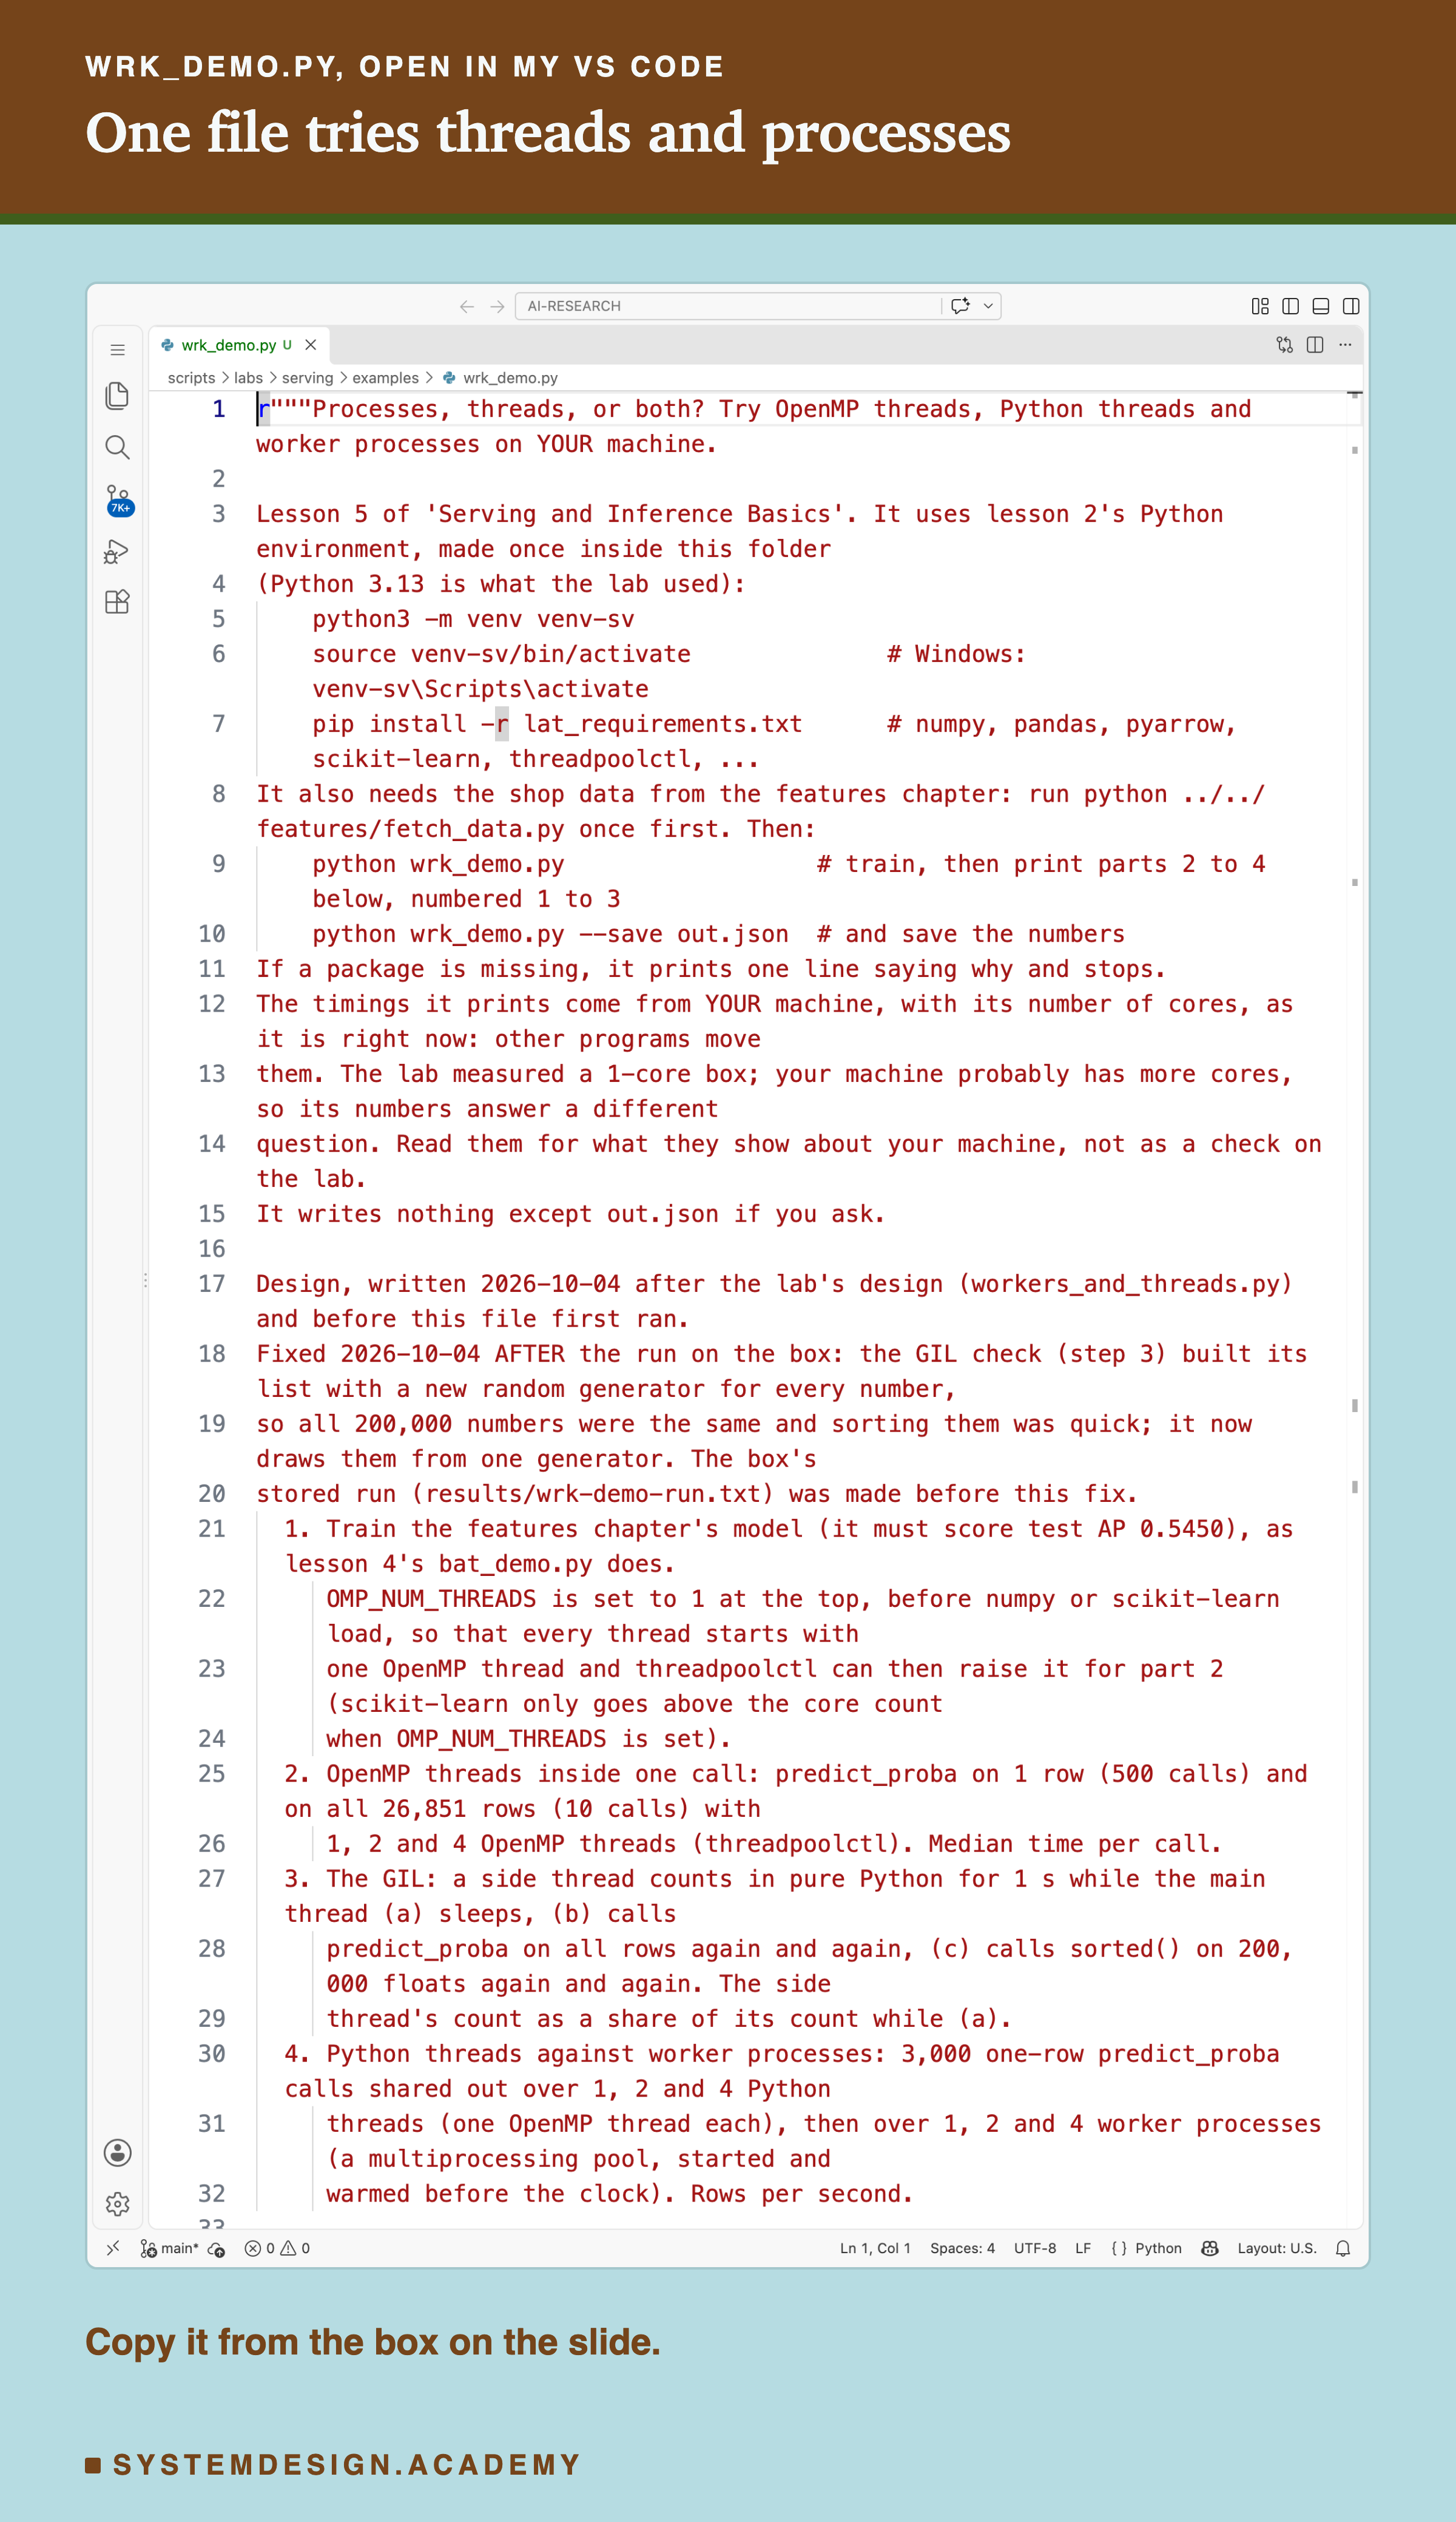
Before you run this lab. The demo uses lesson 2's Python environment, with the same library versions as the lab's box. If you made it for lessons 2 to 4, use it again. If not, make it once, inside the scripts/labs/serving/examples folder:
python3 -m venv venv-sv
source venv-sv/bin/activate        # on Windows: venv-sv\Scripts\activate
pip install -r lat_requirements.txt
I used Python 3.13. Then run python ../../features/fetch_data.py once, which downloads the shop data. Now run python wrk_demo.py. It needs no GPU, no web server and no cloud account. If a package is missing, it prints one line saying why and stops.
The first line it prints says the times come from your machine, with its number of cores and its load at that moment. Your machine probably has more cores than my box, so its numbers answer a different question: they are not a check on the lab. Do more threads slow down your one-row calls? Does the side thread keep going during ? Do more worker processes give more rows a second on your cores, and more Python threads not?
Pick Workers, Threads and a Rate
This box holds the real results from the lab. It needs nothing but Python, so it runs in your browser. It has no model and no clock: it only looks up what the box measured.
Press Run. Then try W = 1 with T = 4 at RATE = 0.6, where one worker fell behind. Try W = 4, T = 8. Every run shows 1 worker x 1 thread first, at the same rate, so you always compare with it.
The report script writes this box from the lab's raw files, runs it with six settings, and checks that each run prints the lab's numbers.
The Lab's Code, Piece by Piece
The lab has one file that runs on my laptop, a few small files that run on the box, and the step script you saw above.
workers_and_threads.py, on my laptop, holds the design in its docstring, written before any run. Its commands are check (lesson 2's files match by sha256), status (reads the box's serial console), collect, cost and factcheck. collect calls wrk_stats.py, which copies the box's small raw files into results/wrk-raw/, passes every log line through wrk_redact.py, and does all the arithmetic.
wrk_files/wrk_service.py is the service. It imports lesson 2's service file unchanged, so the model, the SQLite table and the request checks are lesson 2's, and the handler is lesson 2's too. It adds two fields to each answer: the process id, and the nanoseconds of its own predict_proba call. When a worker has loaded the model, it writes a small "ready" file, so a run starts only when every worker is ready.
wrk_files/wrk_client.py is lesson 4's client, copied with credit. It keeps the same closed loop, the same open loop with random arrivals and 512 kept-alive connections, and counted from each request's arrival. Changed for several workers: it warms every connection. Around the counted part, it reads for the CPU time of every service thread, and afterwards for each process's RSS and Pss. It also checks every score against the box's own single-row score.
How to Choose Workers and Threads
Here is the order I would follow, using only what this lab did.
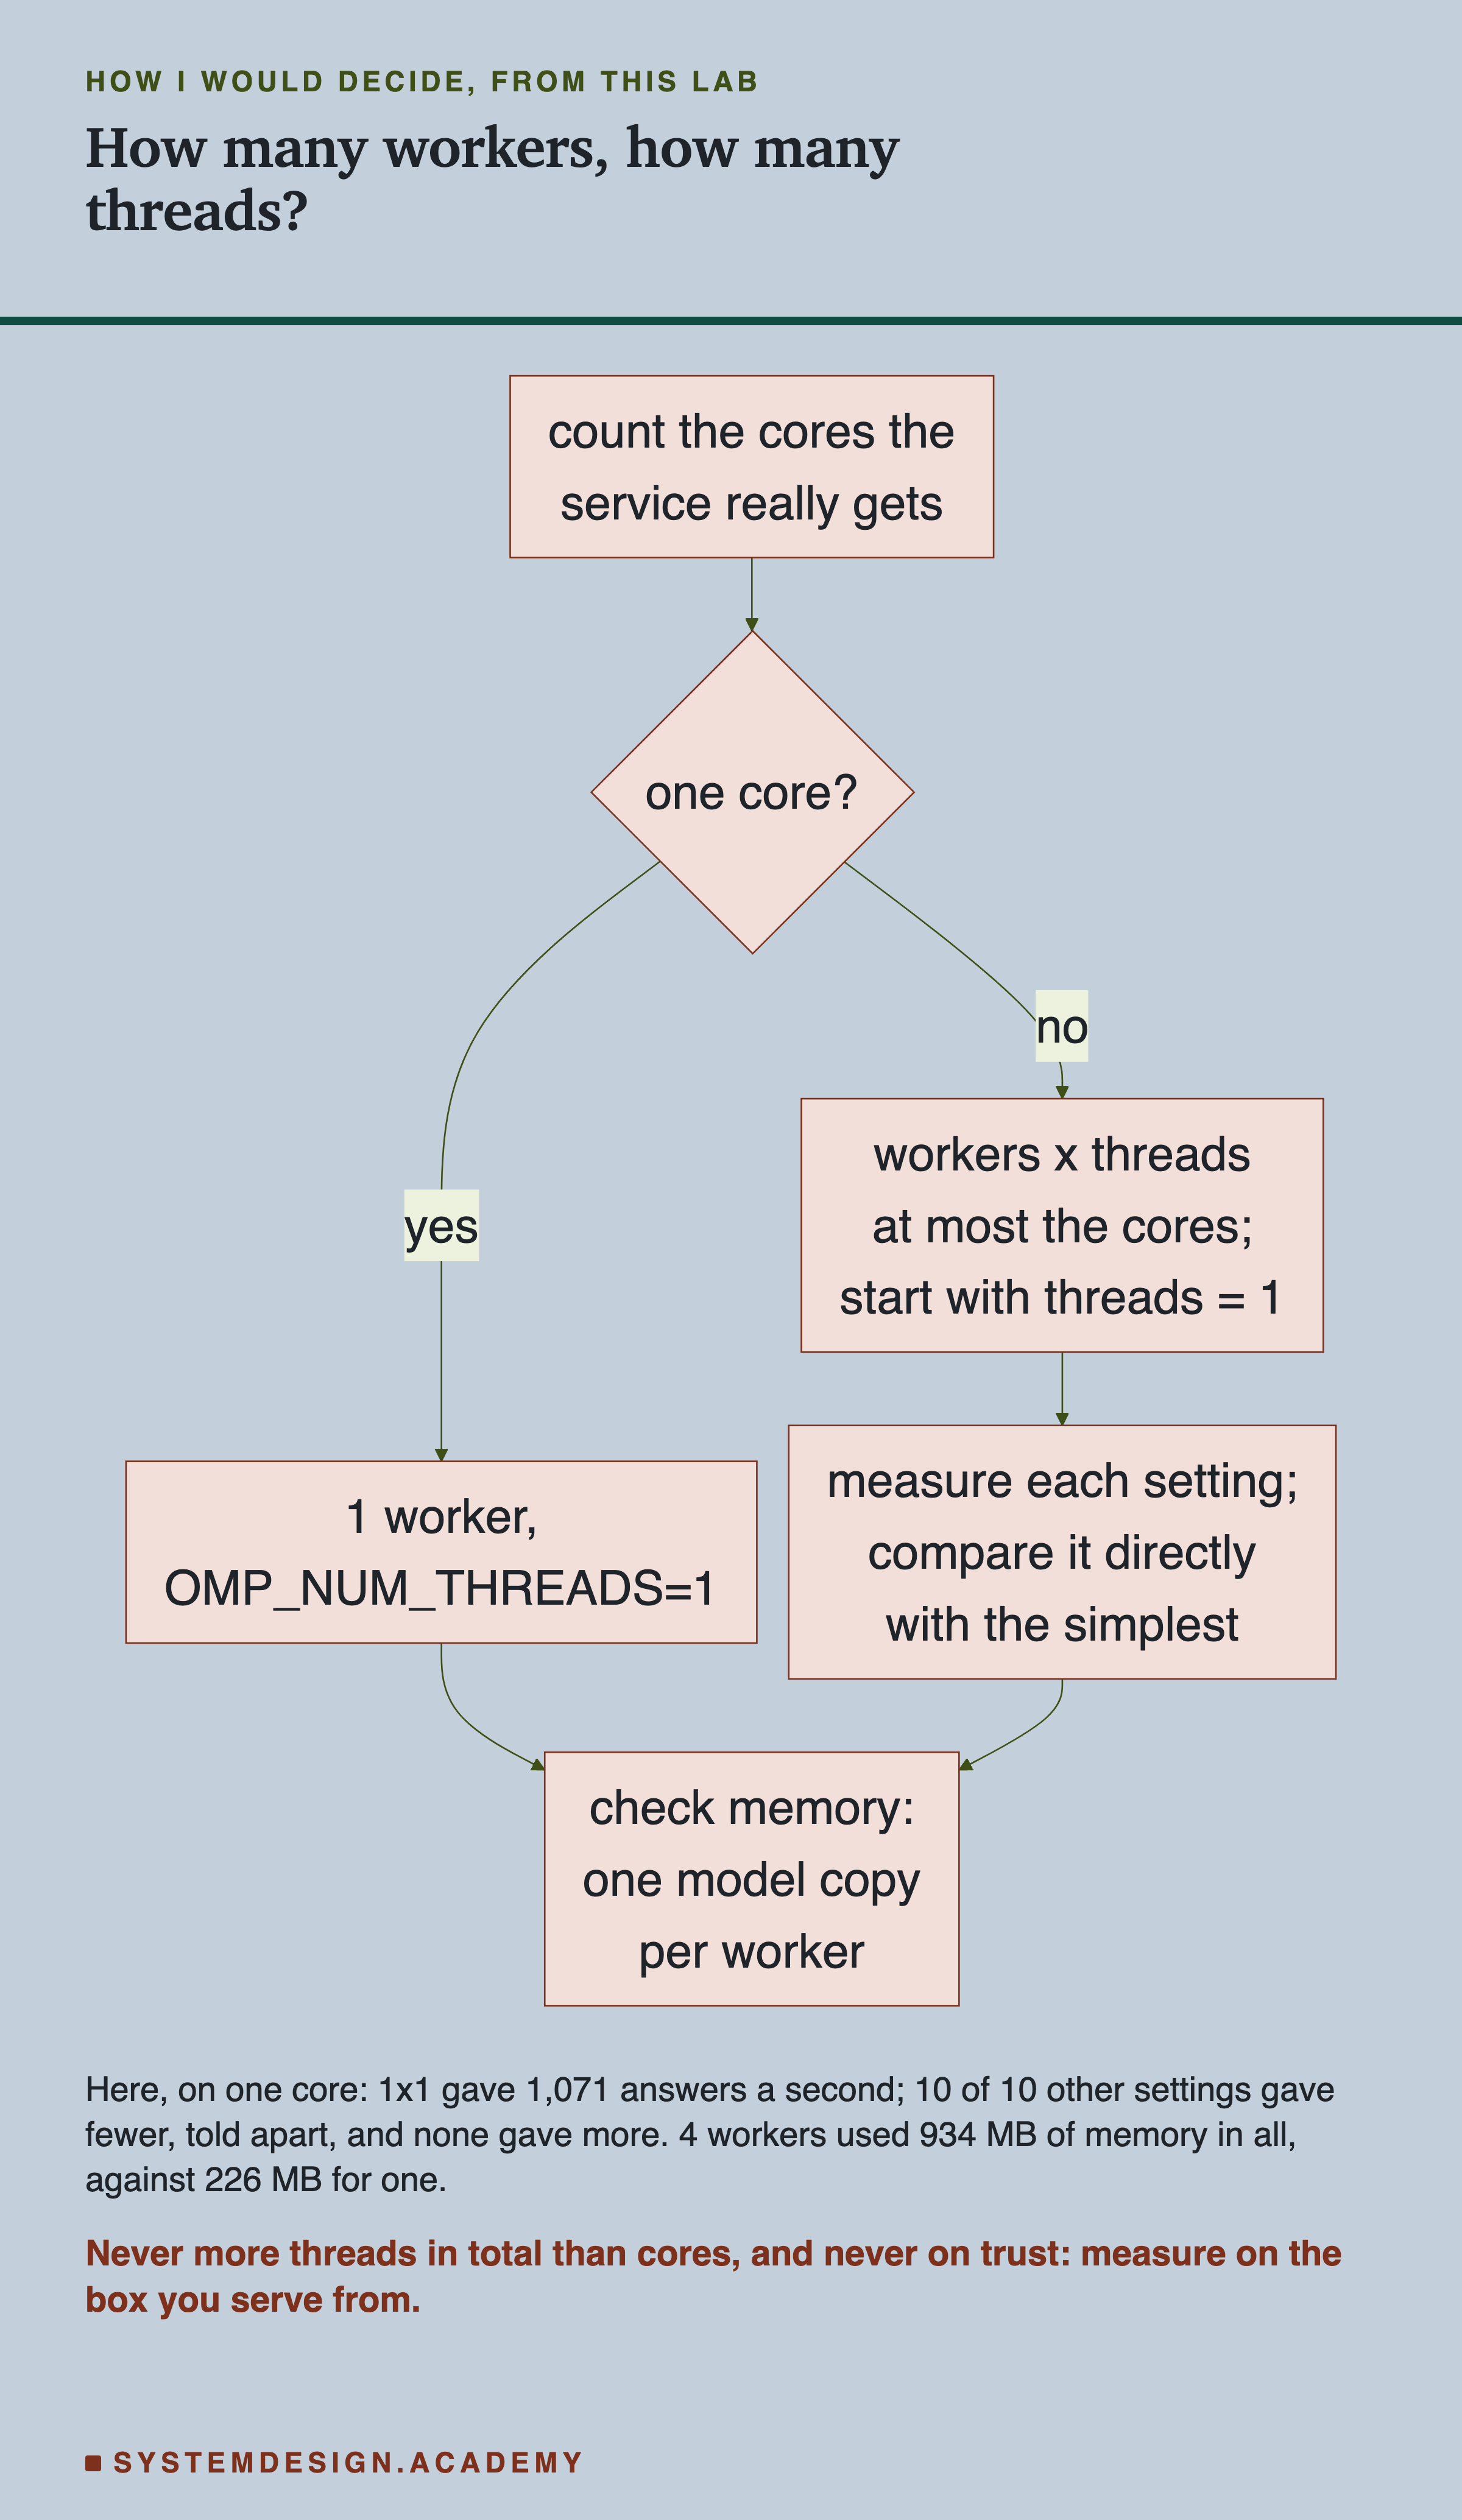
The chart starts with the one fact everything else depends on: how many cores the service really gets. Here are the same steps in words, each with the number from this lab behind it.
-
Count the real cores. Run
nprocon the machine, and check any CPU limit your container sets. My box printed 1. -
Set
OMP_NUM_THREADSon purpose. scikit-learn takes it as given, even above the core count. Left unset, it uses the number of cores, in every worker. Here, 4 threads made a one-row call 3.19 times slower. -
Keep workers times threads at most the cores. Here, every setting that broke this rule gave fewer answers than 1x1, and those with 4 or more threads fell behind at random arrivals that 1x1 handled easily.
-
Measure the most a setting can answer, and its under random arrivals, and compare directly. Here, 2x1 and 4x1 looked almost the same as 1x1 at a glance, but compared round by round they gave about 2% fewer answers.
-
Count the memory of every worker. Here each worker used about 220 MB, so four workers used 934 MB of a 2 GiB box.
When More Workers or Threads Help, and When They Do Not
More worker processes help when there are free cores for them. Each worker can run Python on its own core, and the GIL is per process, so it does not stop them. On one core they only took turns: 0.98 of one worker's answers.
More OpenMP threads help when one call has a lot of rows to share and there are free cores. A batch job that scores millions of rows on a big machine is the right place. A service that scores one row per request is the wrong place: here, more threads only slowed every call down.
Never let the two multiply past the cores. Workers times threads is the number of threads that want the core at once. On this box, the worst setting, four workers with eight threads, gave 0.18 of the answers of the simplest one.
Do not put a busy Python thread beside the model. predict_proba lets the GIL go for each tree's work. But beside a busy Python thread, each of its 54 trees waited about one switch interval to take it back. One call took 270.2 ms instead of 52.6. On more cores the tree work can overlap, but those waits for the lock remain.
Do not add workers without counting memory. Each one here was a full copy, about 220 MB.
Do not copy my handler as it is into a busy service. Like lessons 2 to 4, it is an async def that calls SQLite and predict_proba, which block the event loop while they run. With one thread per worker, that is what I measured on purpose.
What This Lab Cannot Tell You
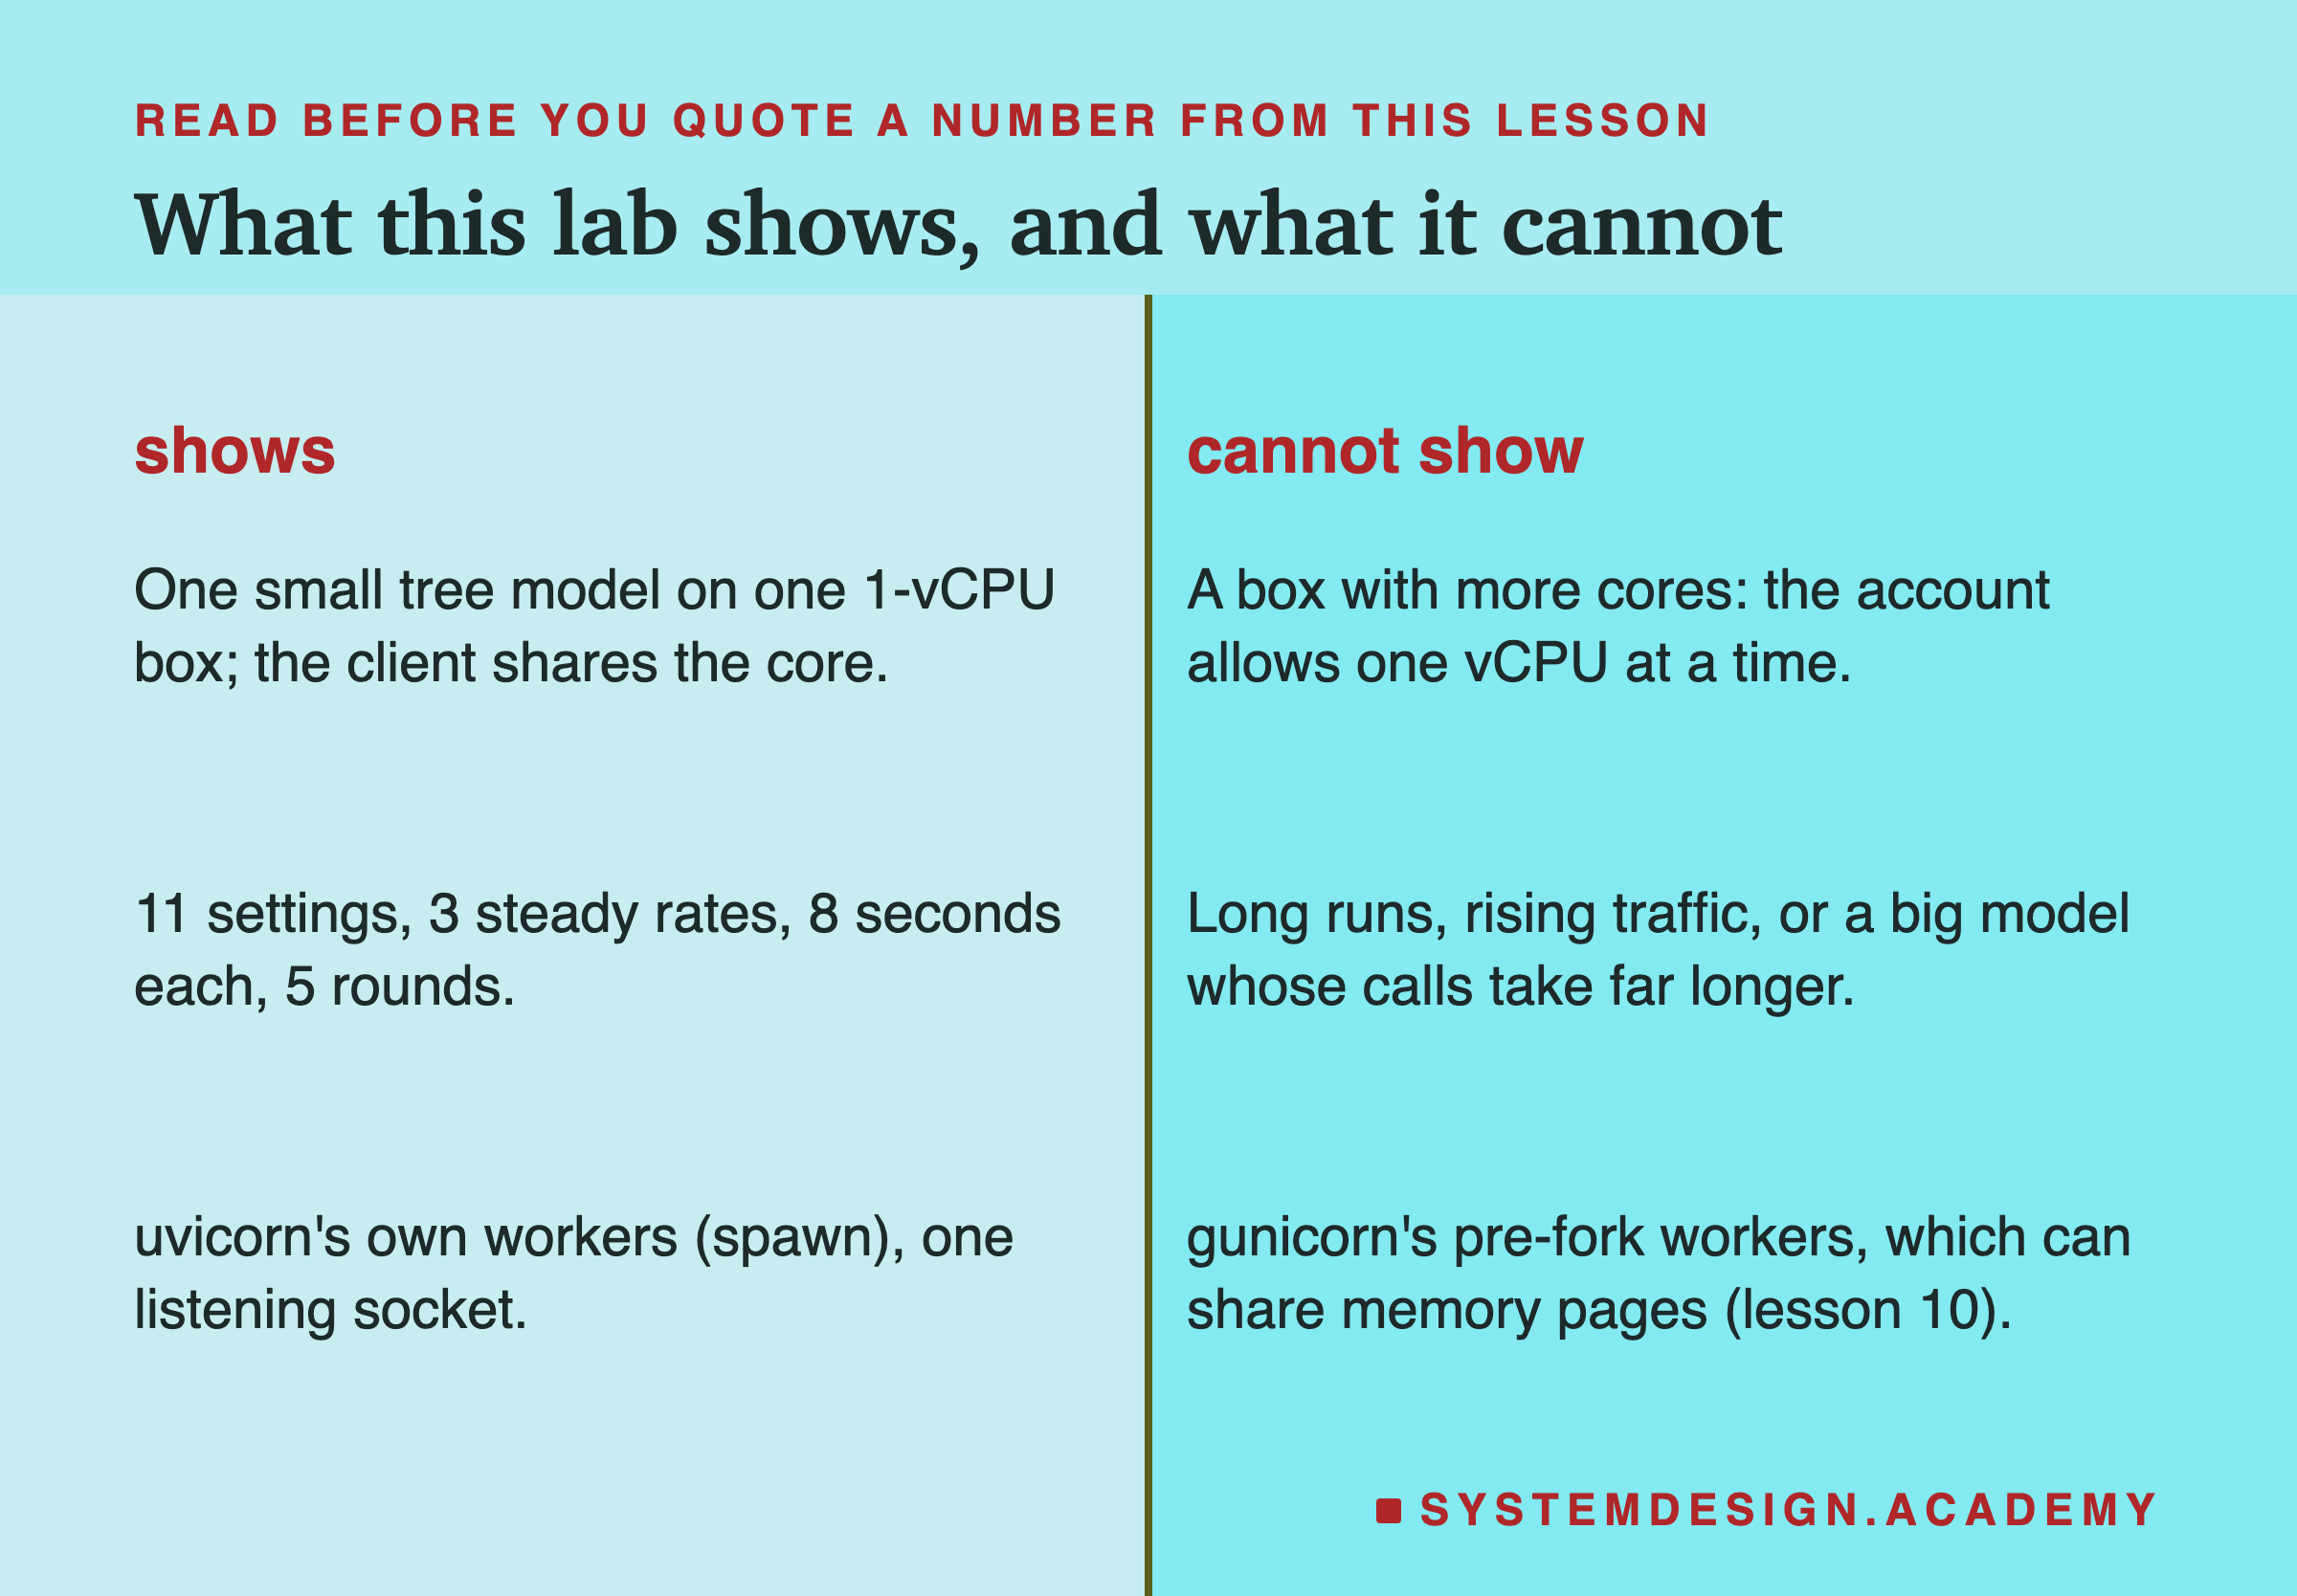
One core, and the client on it. The account's limit made this a one-core lesson. Every answer about more cores in this lesson is reasoning, not measurement. The client also used part of the core, about 0.08 of it in 1x1's closed-loop runs.
One small model. A one-row call here is about half a millisecond, most of it fixed cost. A model whose calls take far longer would change how much threads cost compared with the work.
Steady rates for 8 seconds. Real traffic rises and falls. Above a setting's limit, its latencies grow with the run's length, so they are not stable numbers.
Uneven workers. With four workers, some accepted no connections, so "4 workers" often served with three. I report it as measured; I did not try to balance them.
Labelled additions. Two figures use readings the design named, but I chose to draw them after seeing the results. They are where the core's time went per setting (CPU per thread), and the count of workers that answered (the answer's process id). The demo's sort list was fixed after the box run, as the demo slide says. The step 5 recording was the second run of that step on the same box.
What to Do on Monday
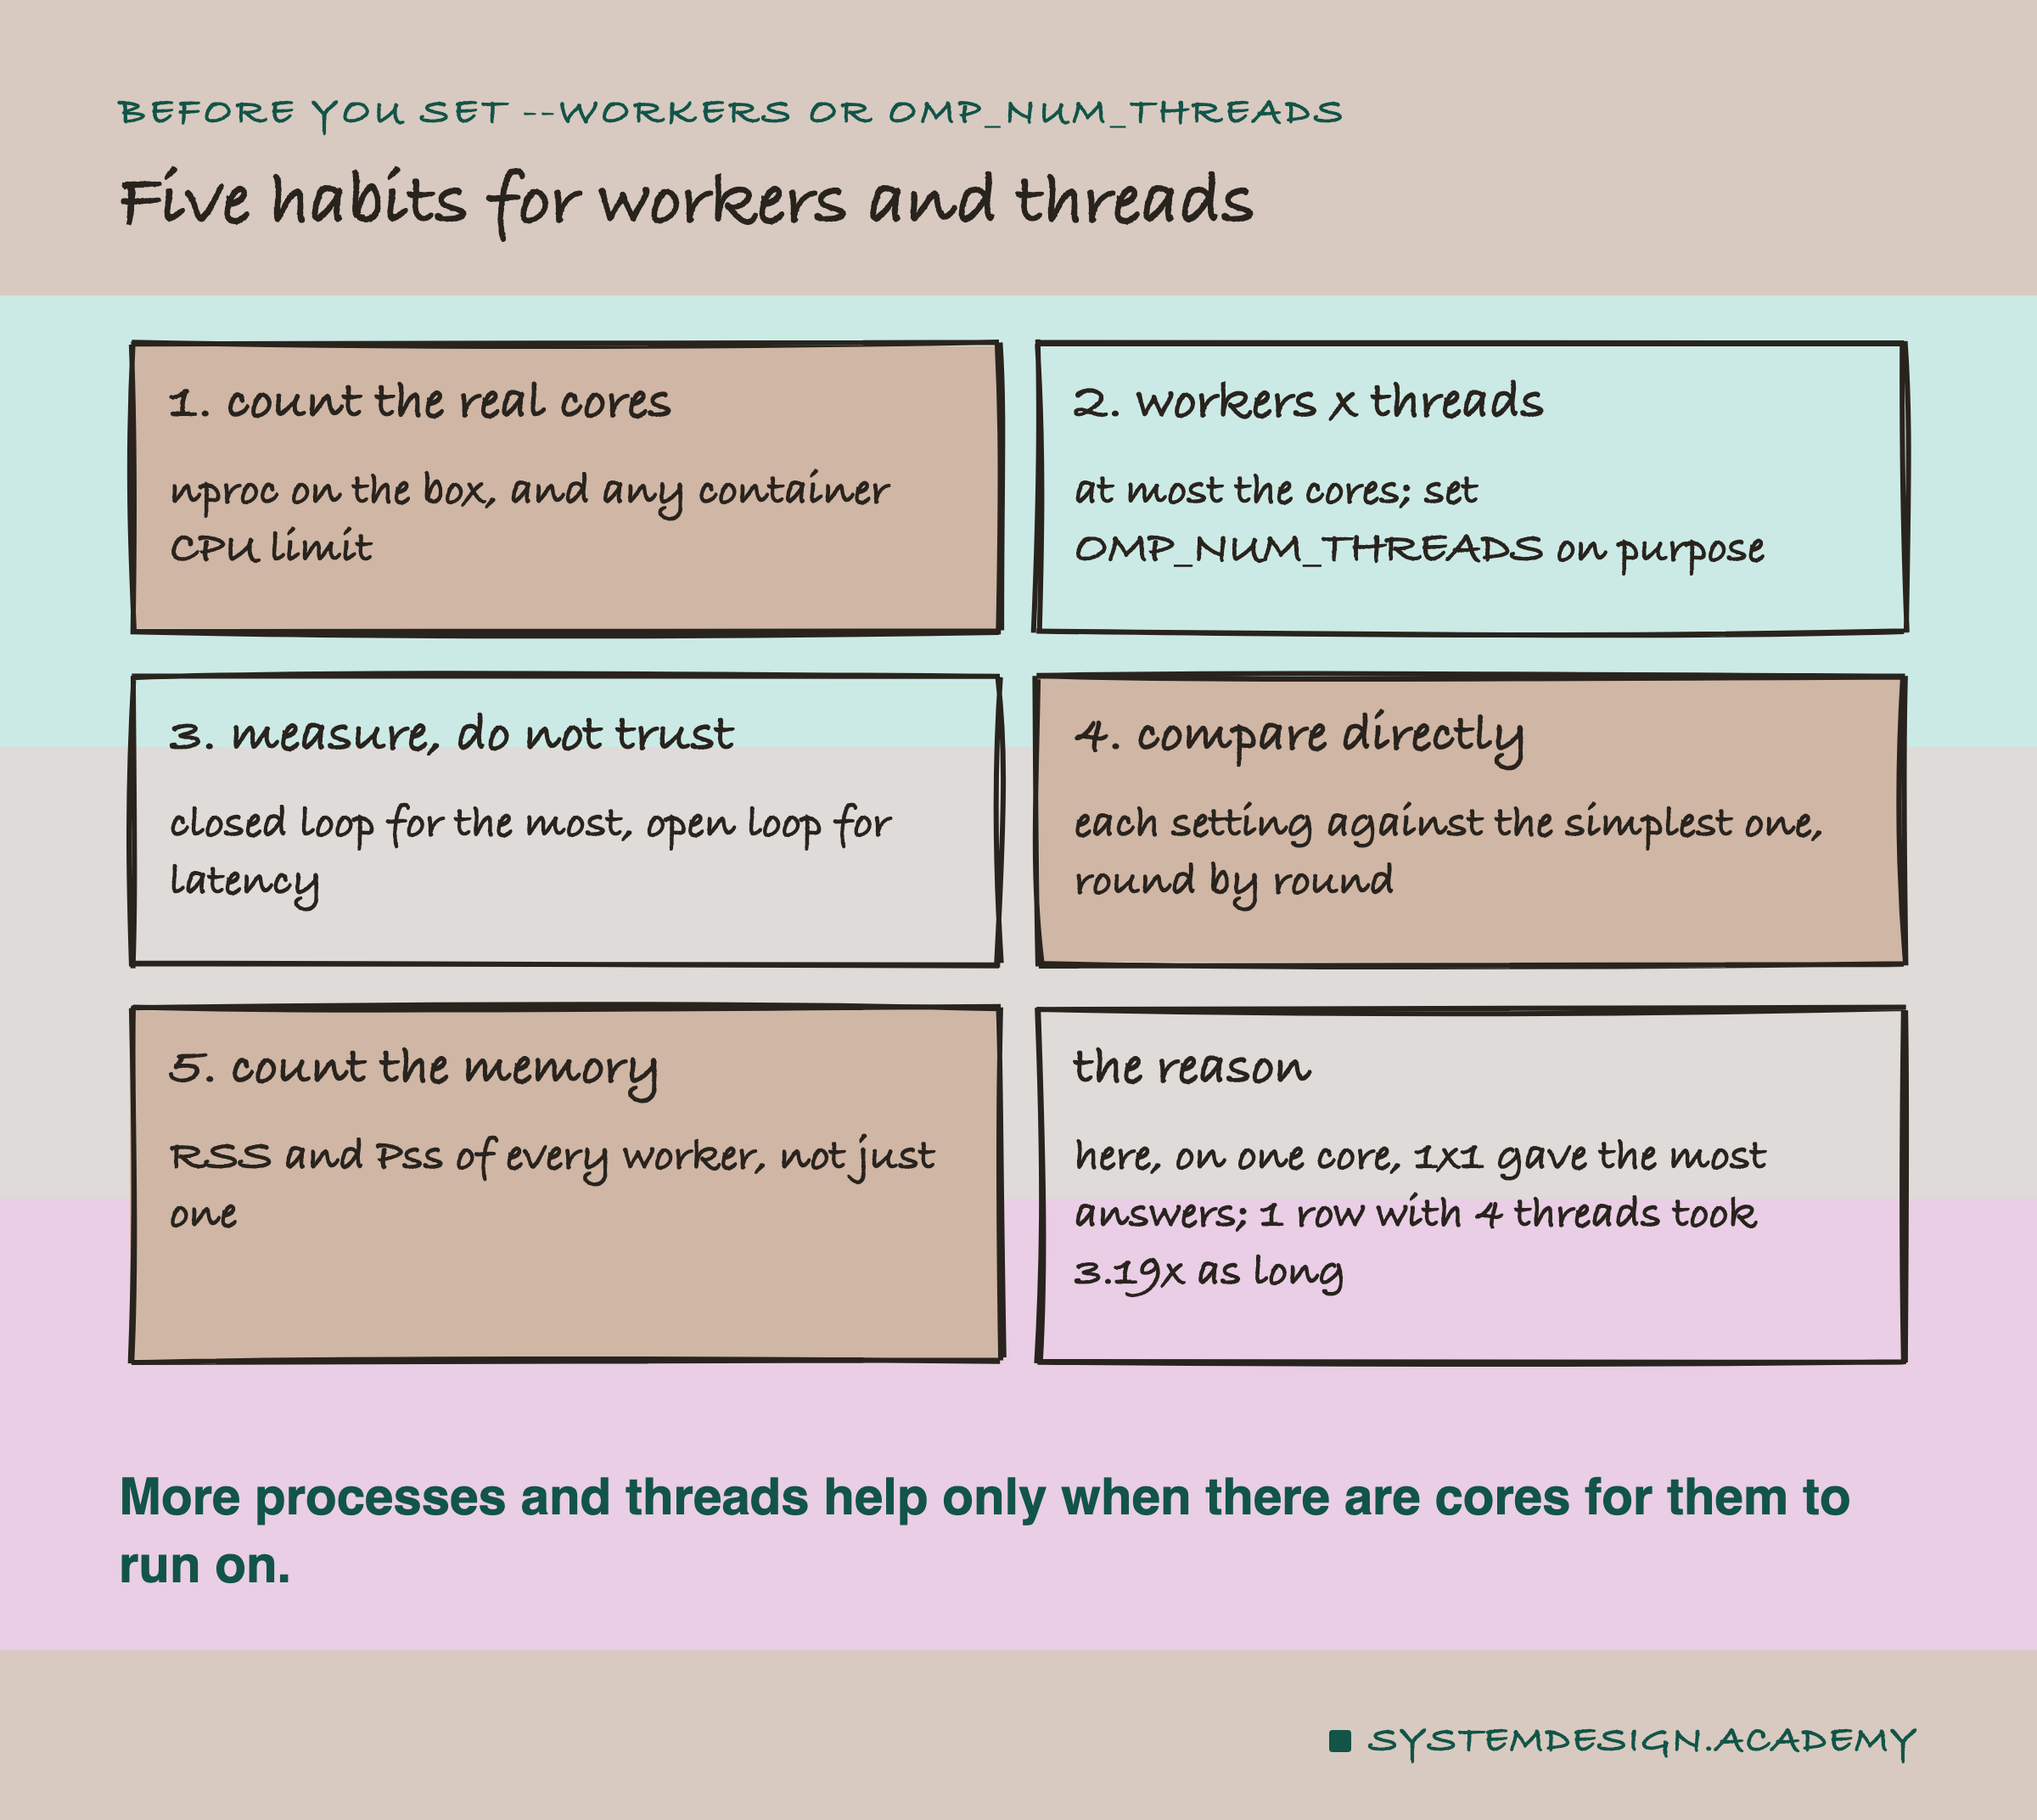
If you take one thing to work on Monday, look at how your model service is started. Find the number of workers, find OMP_NUM_THREADS, and run nproc where it runs. If workers times threads is more than the cores, you are paying for switching, not for work.
Then set OMP_NUM_THREADS=1 for a service that scores a few rows per request, and set the workers to at most the cores. Measure both the most it answers and its under random arrivals, against the setting you had before.
The one idea to keep: processes and threads are ways to use more cores. Where there are no more cores, they only take turns, and each turn has a price.
Knowledge Check
Knowledge Check
4 questions - Score 80% to pass
On the one-core box, how did four started workers with one thread each (2 or 3 got connections) compare with one worker and one thread?
Why did one-row predict_proba calls get slower with more OpenMP threads on one core?
What did the GIL check show about predict_proba on all 26,851 rows?
A service scores one row per request on a box with 4 cores. Which start-up follows this lesson's advice?