The First Customer of the Morning
Let me start at a desk in an office, early in the morning.
The desk opens at nine. The first person in the queue walks up at one minute past. The clerk has to switch on the lights and the computer, wait for it to start, open the right program and find the right drawer. Only then can she help. The second person waits only for the first one to finish.
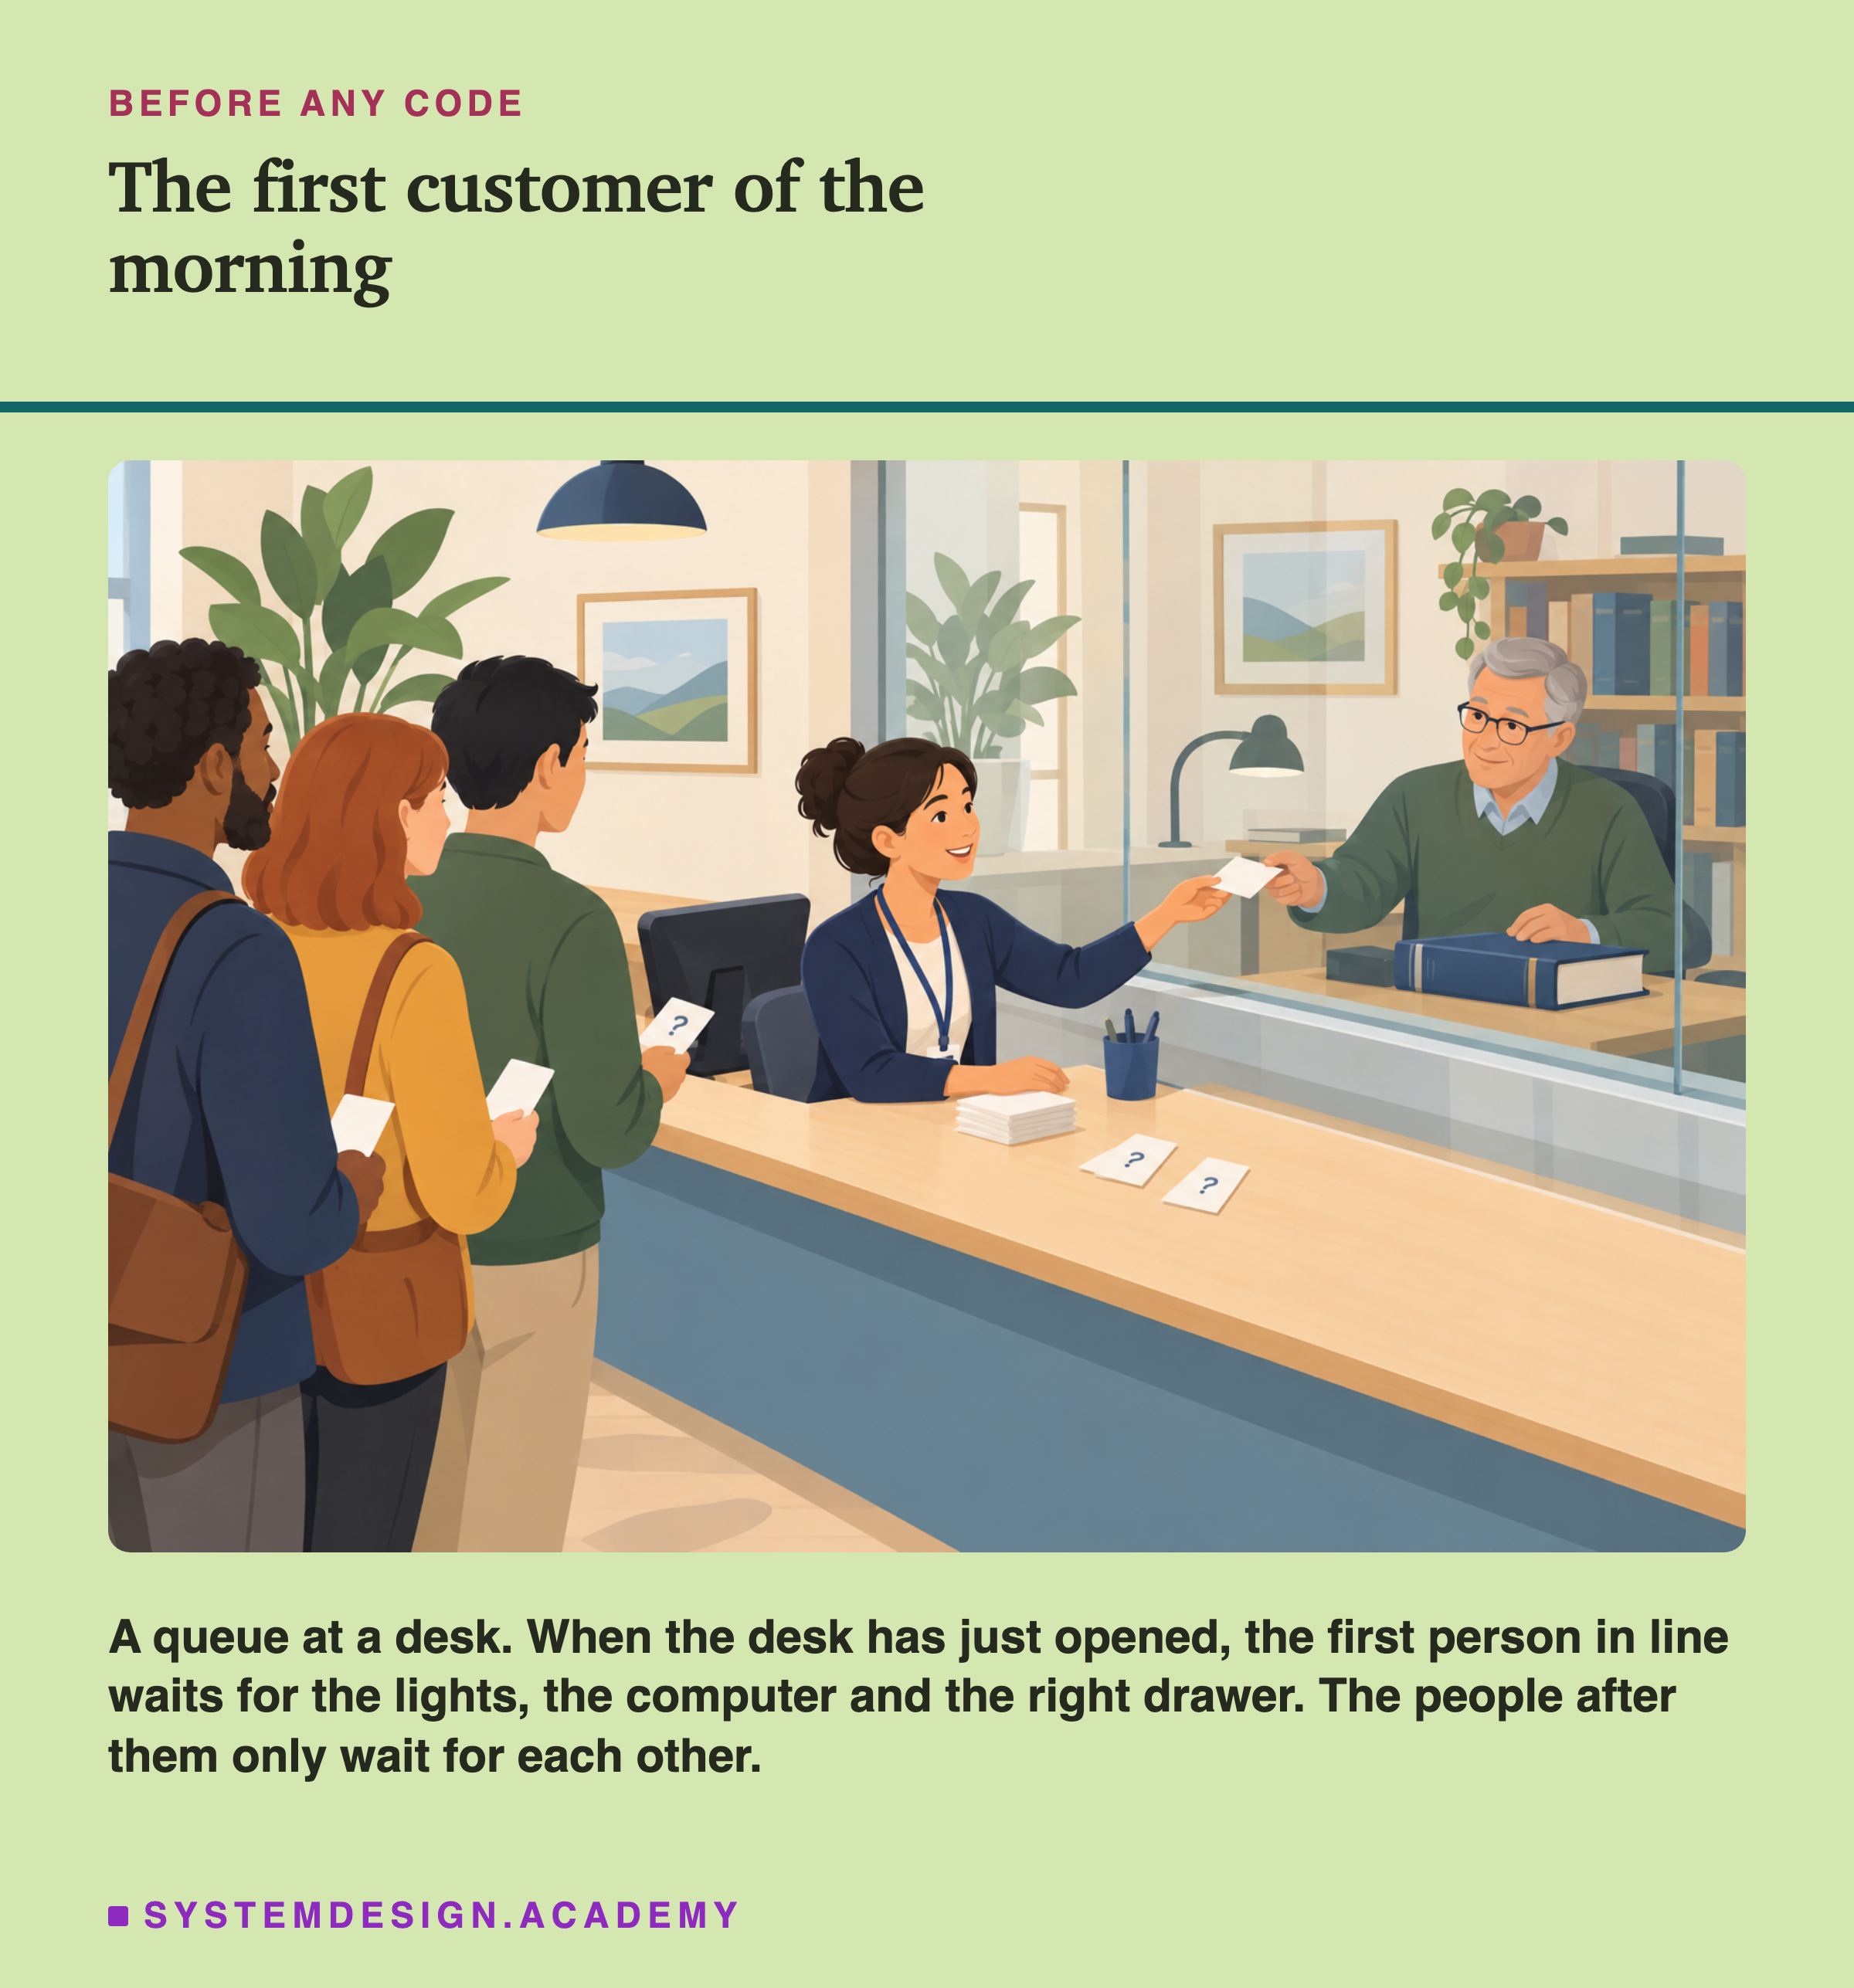
Nobody did anything wrong. The desk was simply not ready yet. A new copy of a prediction service has the same problem. Before it can answer anyone, it must start a program, load its tools, load the model and open its door. And the very first question it answers may still be slower than the ones after it.
In this lesson I measure that start, piece by piece, on a rented machine. I ask where the time goes, and which parts a real user would feel. Then I try four ways to hide those parts from users. I keep the files in memory, send a warm-up request, put a readiness check in front, and run the service in a container.
Where This Lesson Starts
This is lesson 6 of the chapter on serving a model. Lesson 2, latency anatomy, took one request apart. Lesson 3, tail latency, found that the slowest request of a run was always the first one, but it measured only after the service had started. Lesson 5, workers and threads, showed that one worker with one thread was the best choice on one core. So in this lesson the service always runs with one worker and one thread.
The model, the service code and the rented machine are the same as in lessons 2 to 5, so I do not explain them again. In short: the model is the features chapter's gradient boosted tree model, which scores one customer of a real online shop and reached a test AP of 0.5450. The service is a small FastAPI web service run by uvicorn. It reads the customer's six features from SQLite.
The container image follows packaging lesson 5, container images, which showed how to build a slim image and what was inside it. I do not repeat that here. This lesson asks a different question about the same kind of image: how long does it take to start?
The Words You Need First
Please read this slide slowly if any word is new. Every slide after it uses these words.
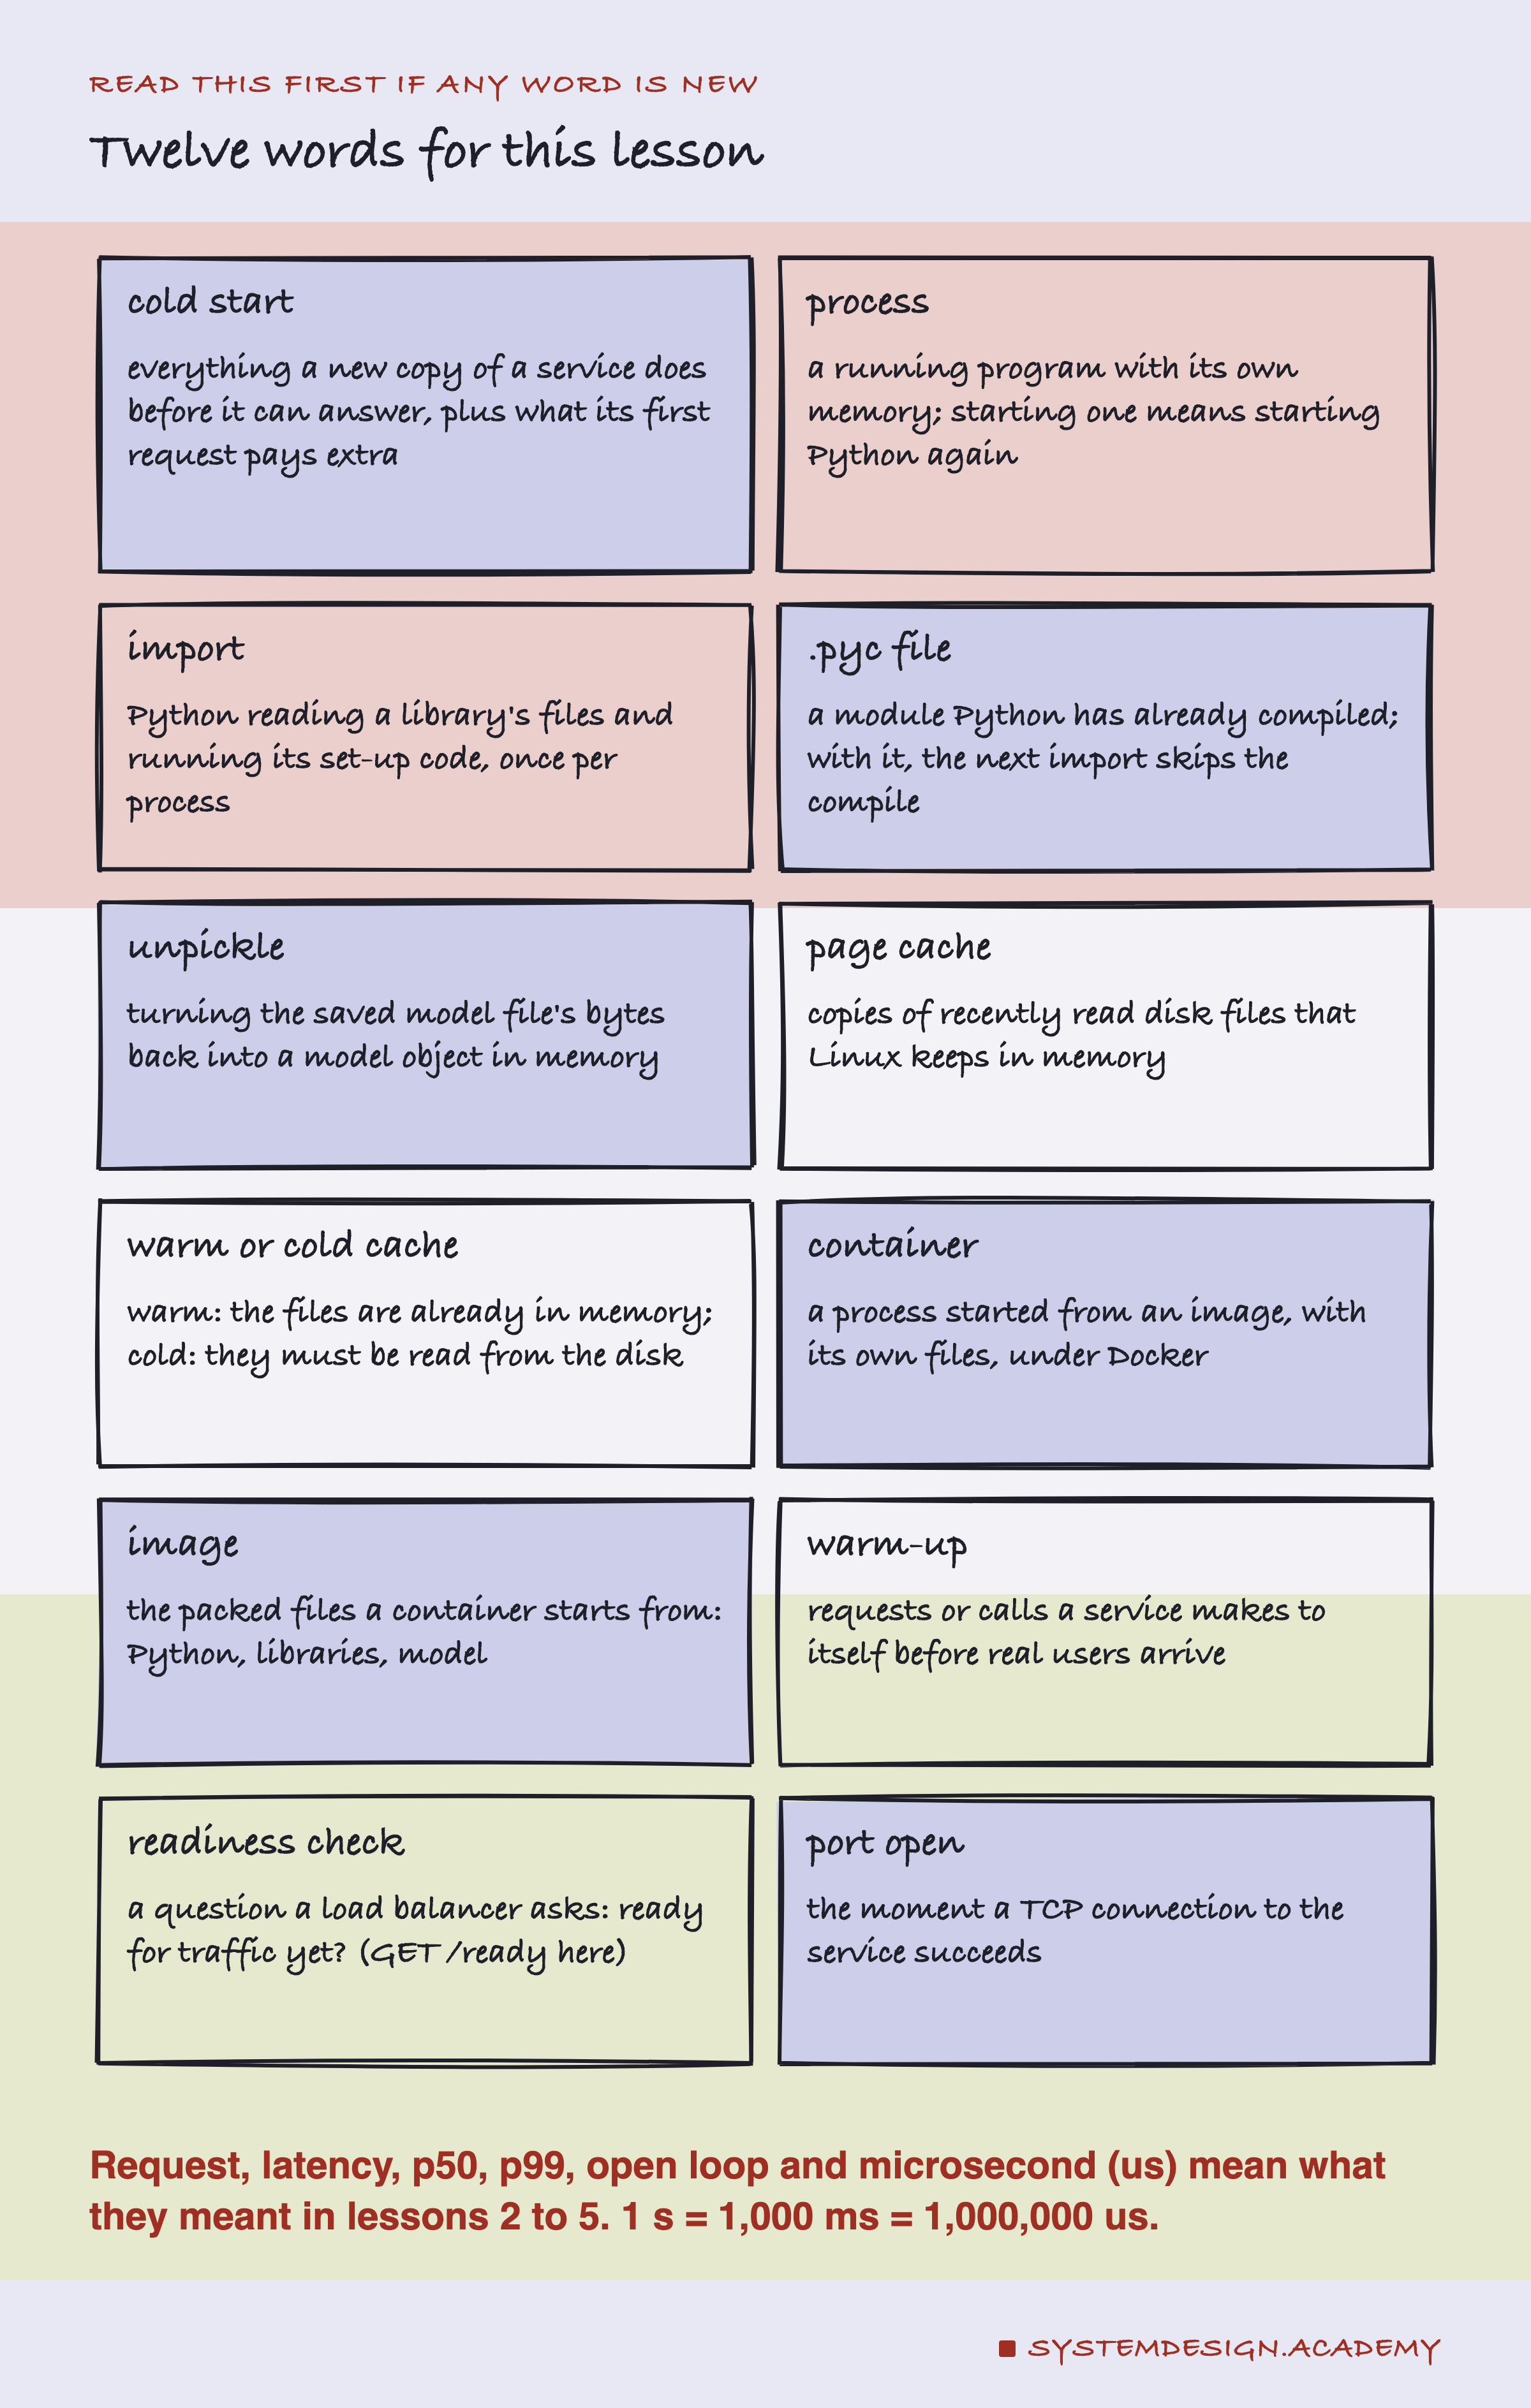
A cold start is everything a new copy of a service does before it can answer, plus anything extra its first request pays. A process is a running program with its own memory. Starting a new process here means starting Python again from nothing.
To import a library is to make Python read the library's files and run its set-up code. This happens once per process. A .pyc file is a module that Python has already turned into its own internal code, called bytecode. When the .pyc file exists and is up to date, the next import skips that step. To unpickle the model means to turn the bytes of the saved model file back into a model object in memory, as packaging lesson 1 showed.
The page cache is a part of memory where Linux keeps copies of files it has read recently. When a file is in it, reading the file is fast. I call that a warm cache. When it is not, Linux must read from the disk: a cold cache.
A container is a process started by from an image, which is the packed set of files it needs: Python, the libraries and the model. A warm-up is a request or a call that the service makes to itself before real users arrive. A readiness check is a question that a asks the service again and again: are you ready for traffic yet? Here it is a request to GET /ready. The port opening is the moment a network connection to the service first succeeds.
is the time from a request to its answer. The p99 is the 99th percentile: the time that 99 of every 100 requests stay under.
The Headline: Most of the Start Was Python Importing Libraries
Here is the main result first. Each lane is one way of starting the service, from the moment it was started to the moment the first answer came back. Each lane is the median of eight starts.
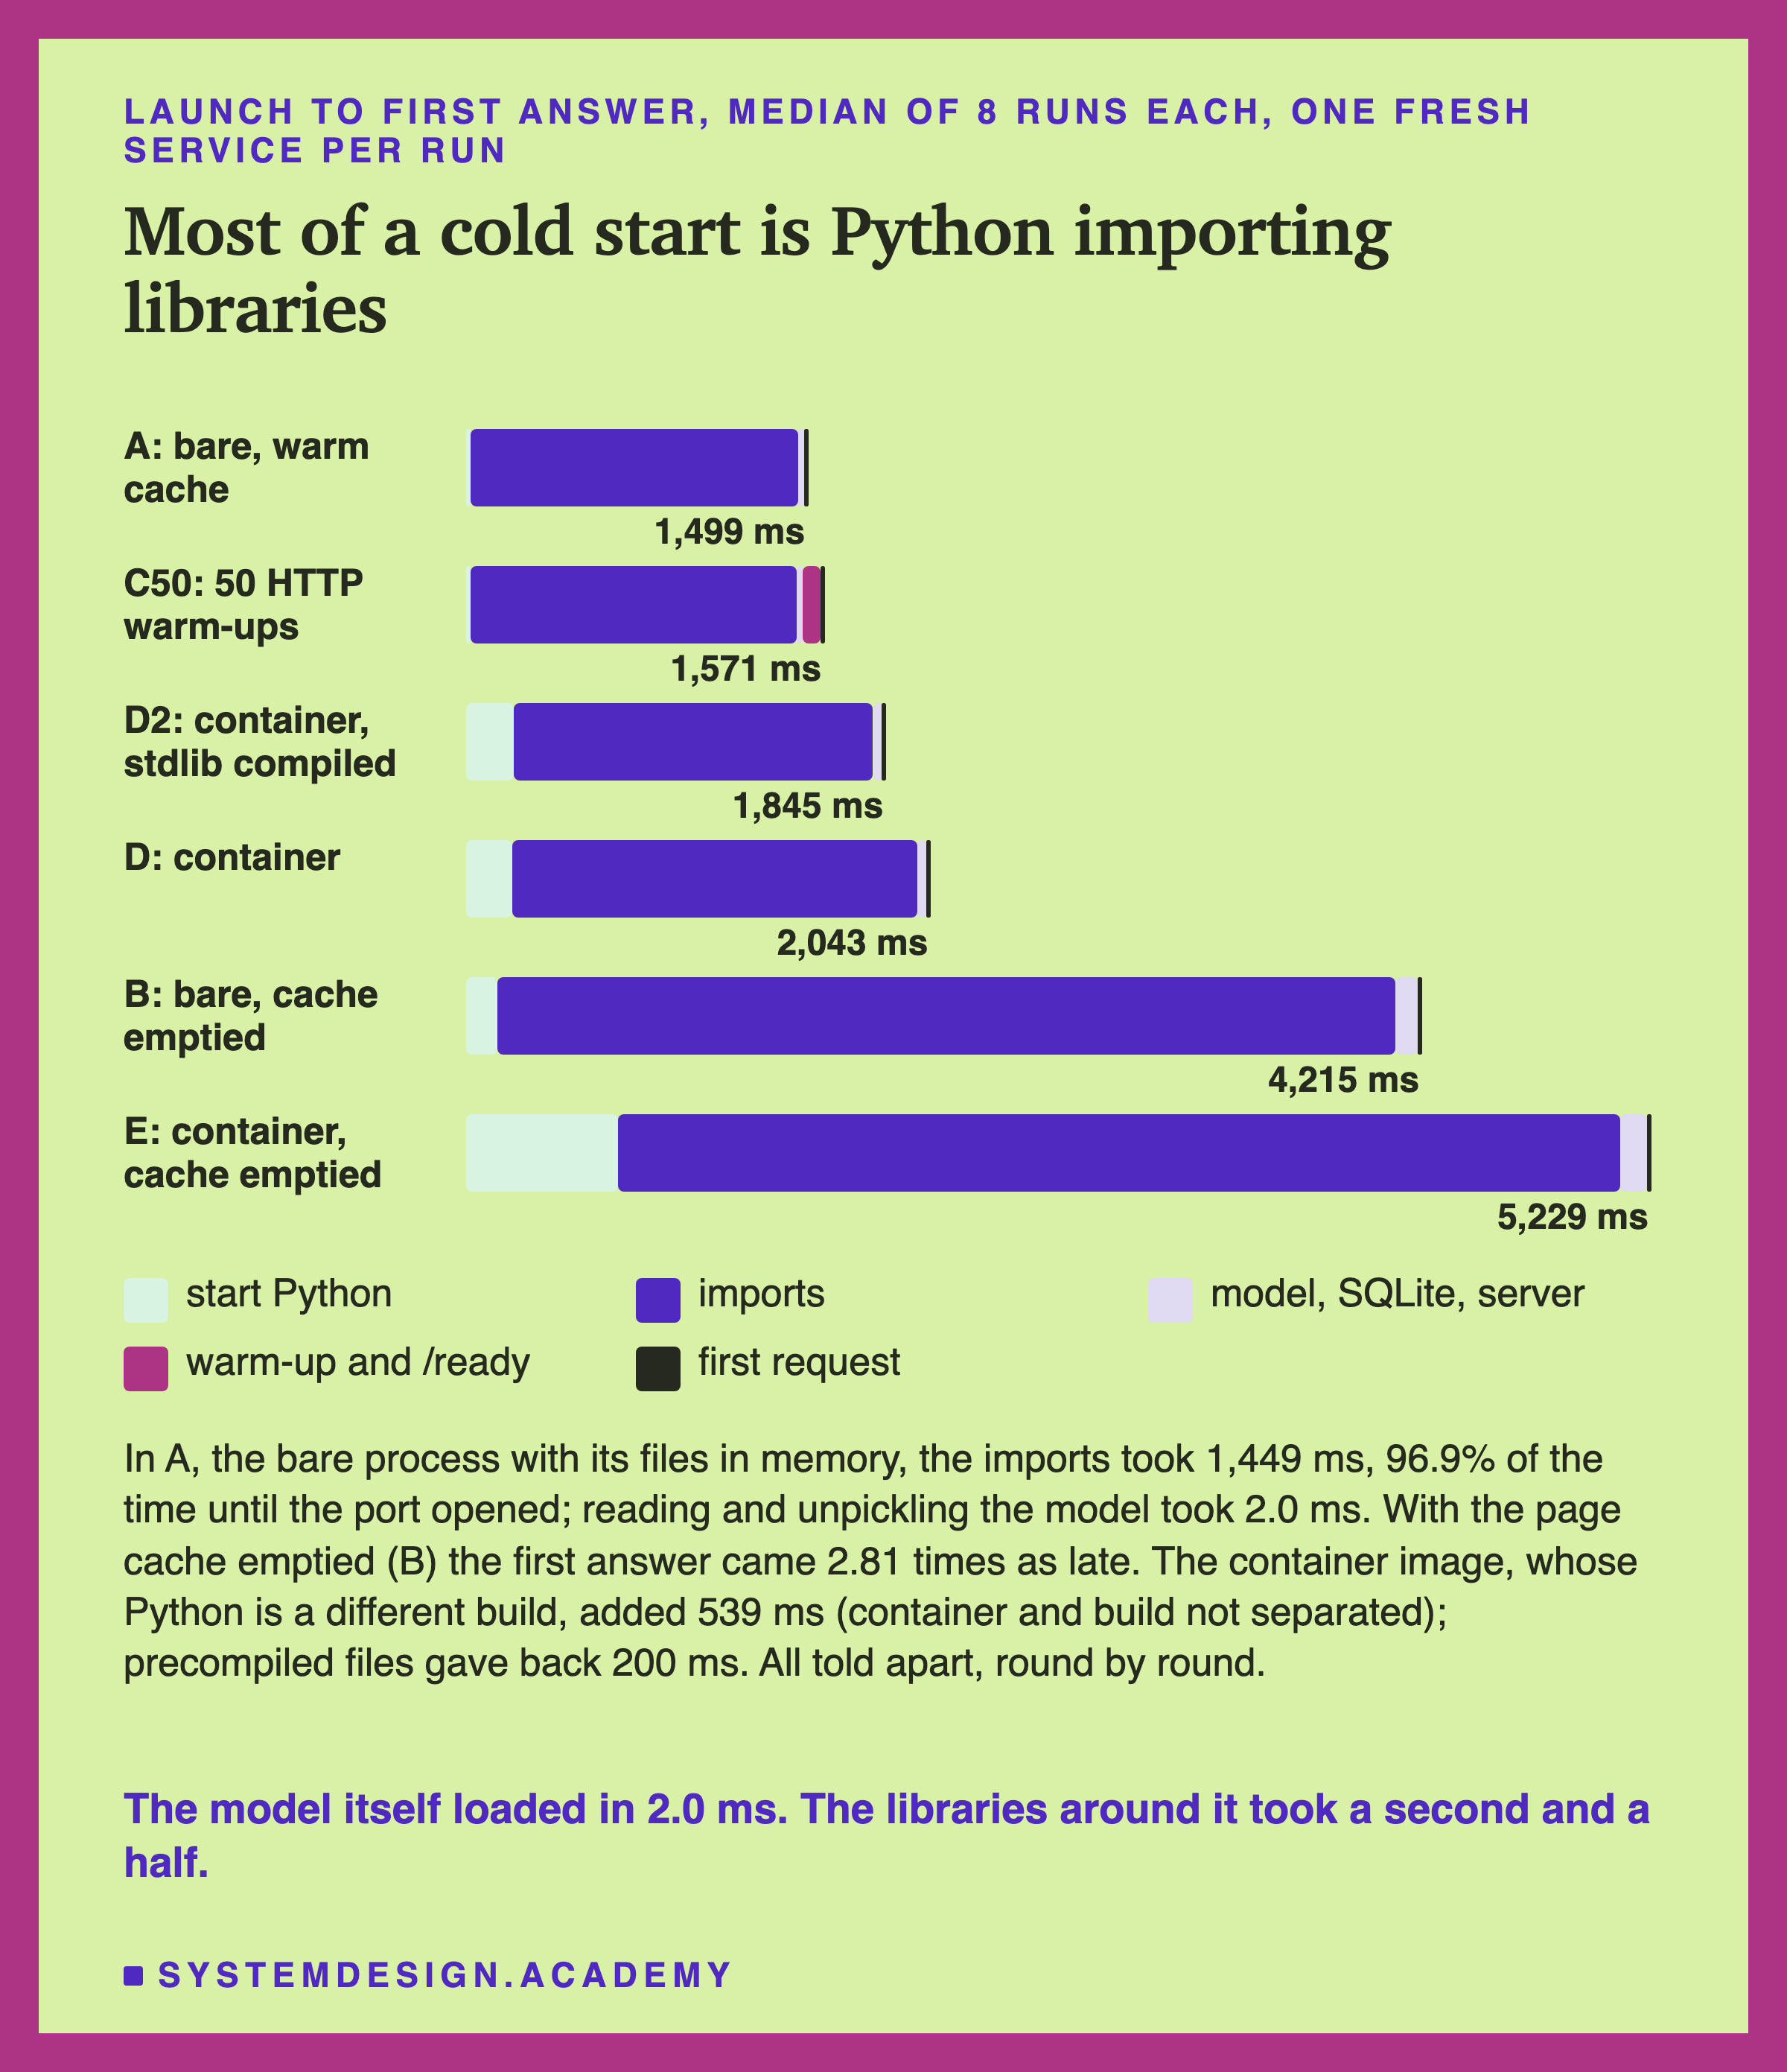
A fresh service answered for the first time after 1,499 milliseconds. That was a bare Python process on the box, with all its files already in memory.
Almost all of that was Python importing libraries. The imports took 1,449 ms, which is 96.9% of the time until the port opened. scikit-learn alone took 824 ms. Reading the model file and unpickling it took 2.0 ms.
Files that were not in memory made the start 2.81 times as long: 4,215 ms. The container image, whose Python is a different build, added 539 ms (container and build not separated). A container whose image held compiled copies of Python's standard library gave 200 ms of that back.
The first request itself was slower than the second: 4,680 microseconds against 1,849. One warm-up request, sent by the service to itself before it said "ready", brought the first real request down to 1,655 microseconds.
But under 539 random arrivals a second, I could not tell a warmed service from a cold one: the run-to-run spread was larger than any difference between them.
How the Lab Was Built
I wrote the lab's design into the docstring of scripts/labs/serving/cold_start.py on 2026-10-04, before any timed run. It names every way of starting, every comparison, the rule for "told apart from noise", and eighteen guesses.
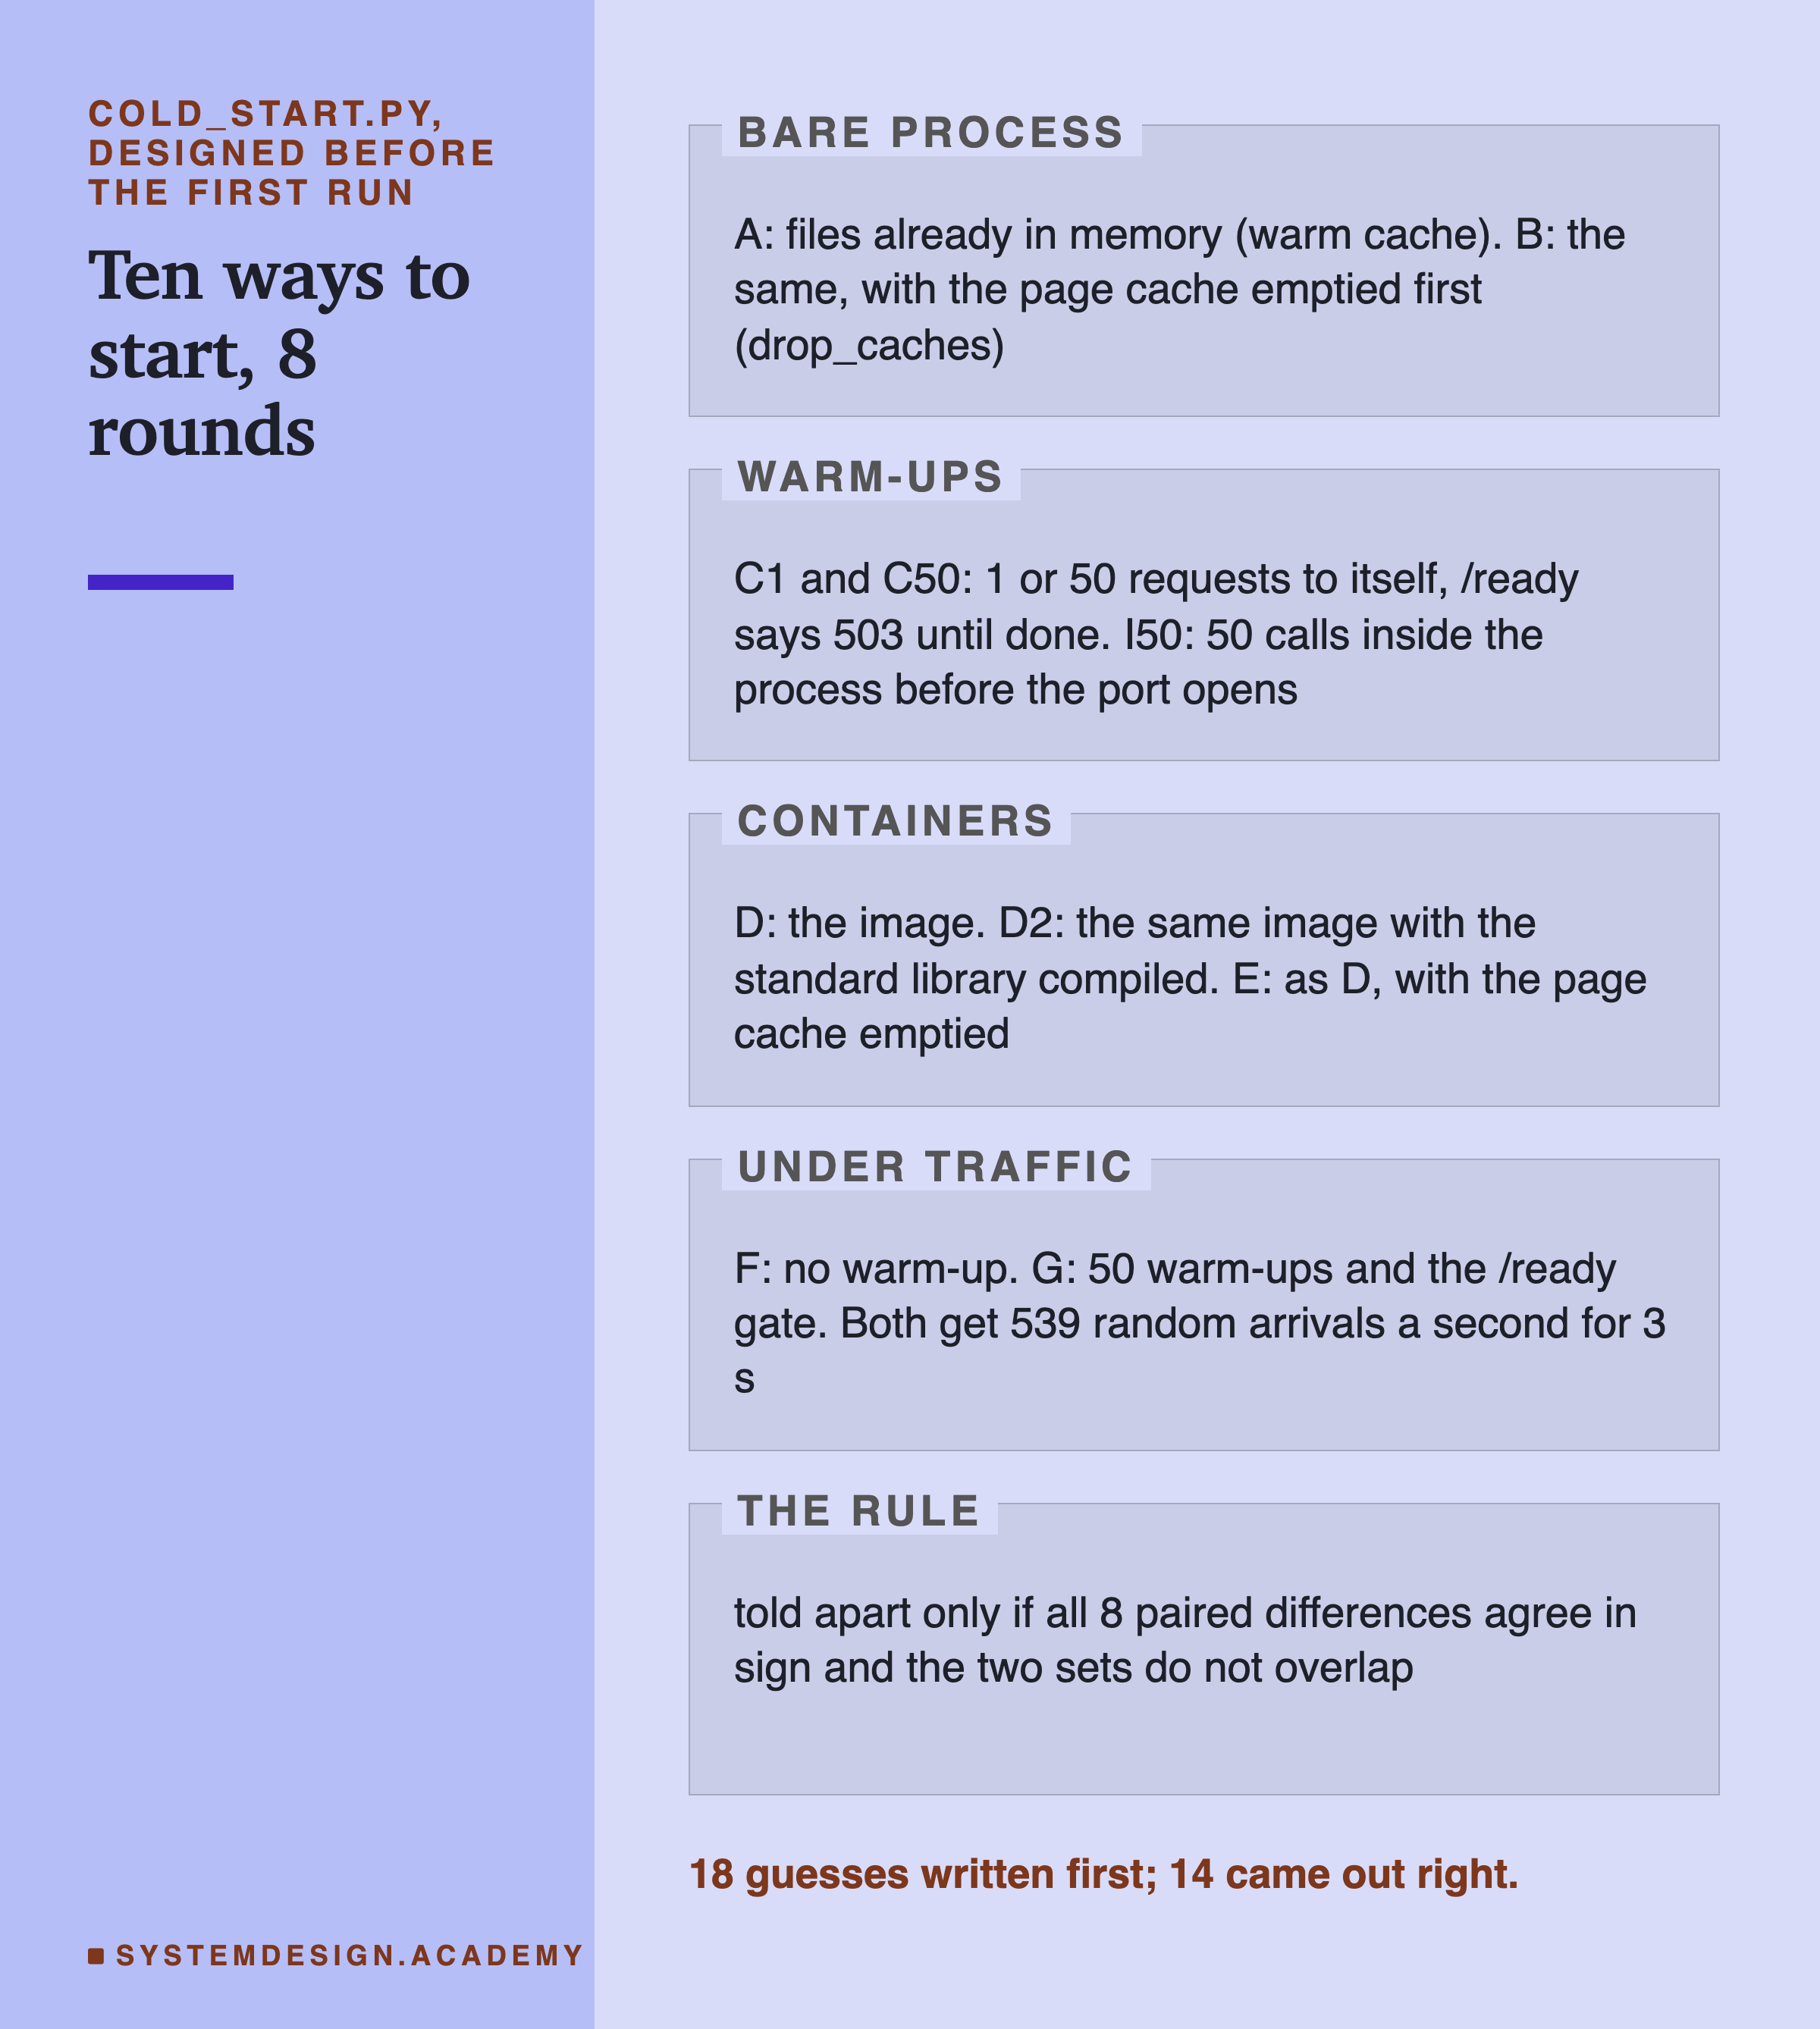
Every run starts a brand-new copy of the service. There are ten ways to start it, which I call arms. In each of eight rounds, every arm runs once, in a new random order.
A is the plain case: a bare Python process, with its files already in the page cache. B is the same, but I empty the page cache just before the start. C1 and C50 send 1 or 50 requests to themselves after the port opens, and answer /ready with "503, not yet" until the warm-up is done.
I50 makes 50 lookups and model calls inside the process before it opens the port, with no warm-up. D runs the service in a container. D2 uses an image with the standard library compiled. Its compileall over /usr/local/lib/python3.13 also compiled 84 site-packages files that had none. They are most likely pip's own, which the service does not import; I did not check which. E is D with the page cache emptied.
and test the start under traffic. F has no warm-up, and arrivals begin when the port opens. G has 50 warm-ups and waits for to say 200.
The Machine
Like lessons 2 to 5, every timing comes from a small machine I rented from Amazon Web Services. None comes from my laptop, which is always busy with other work.
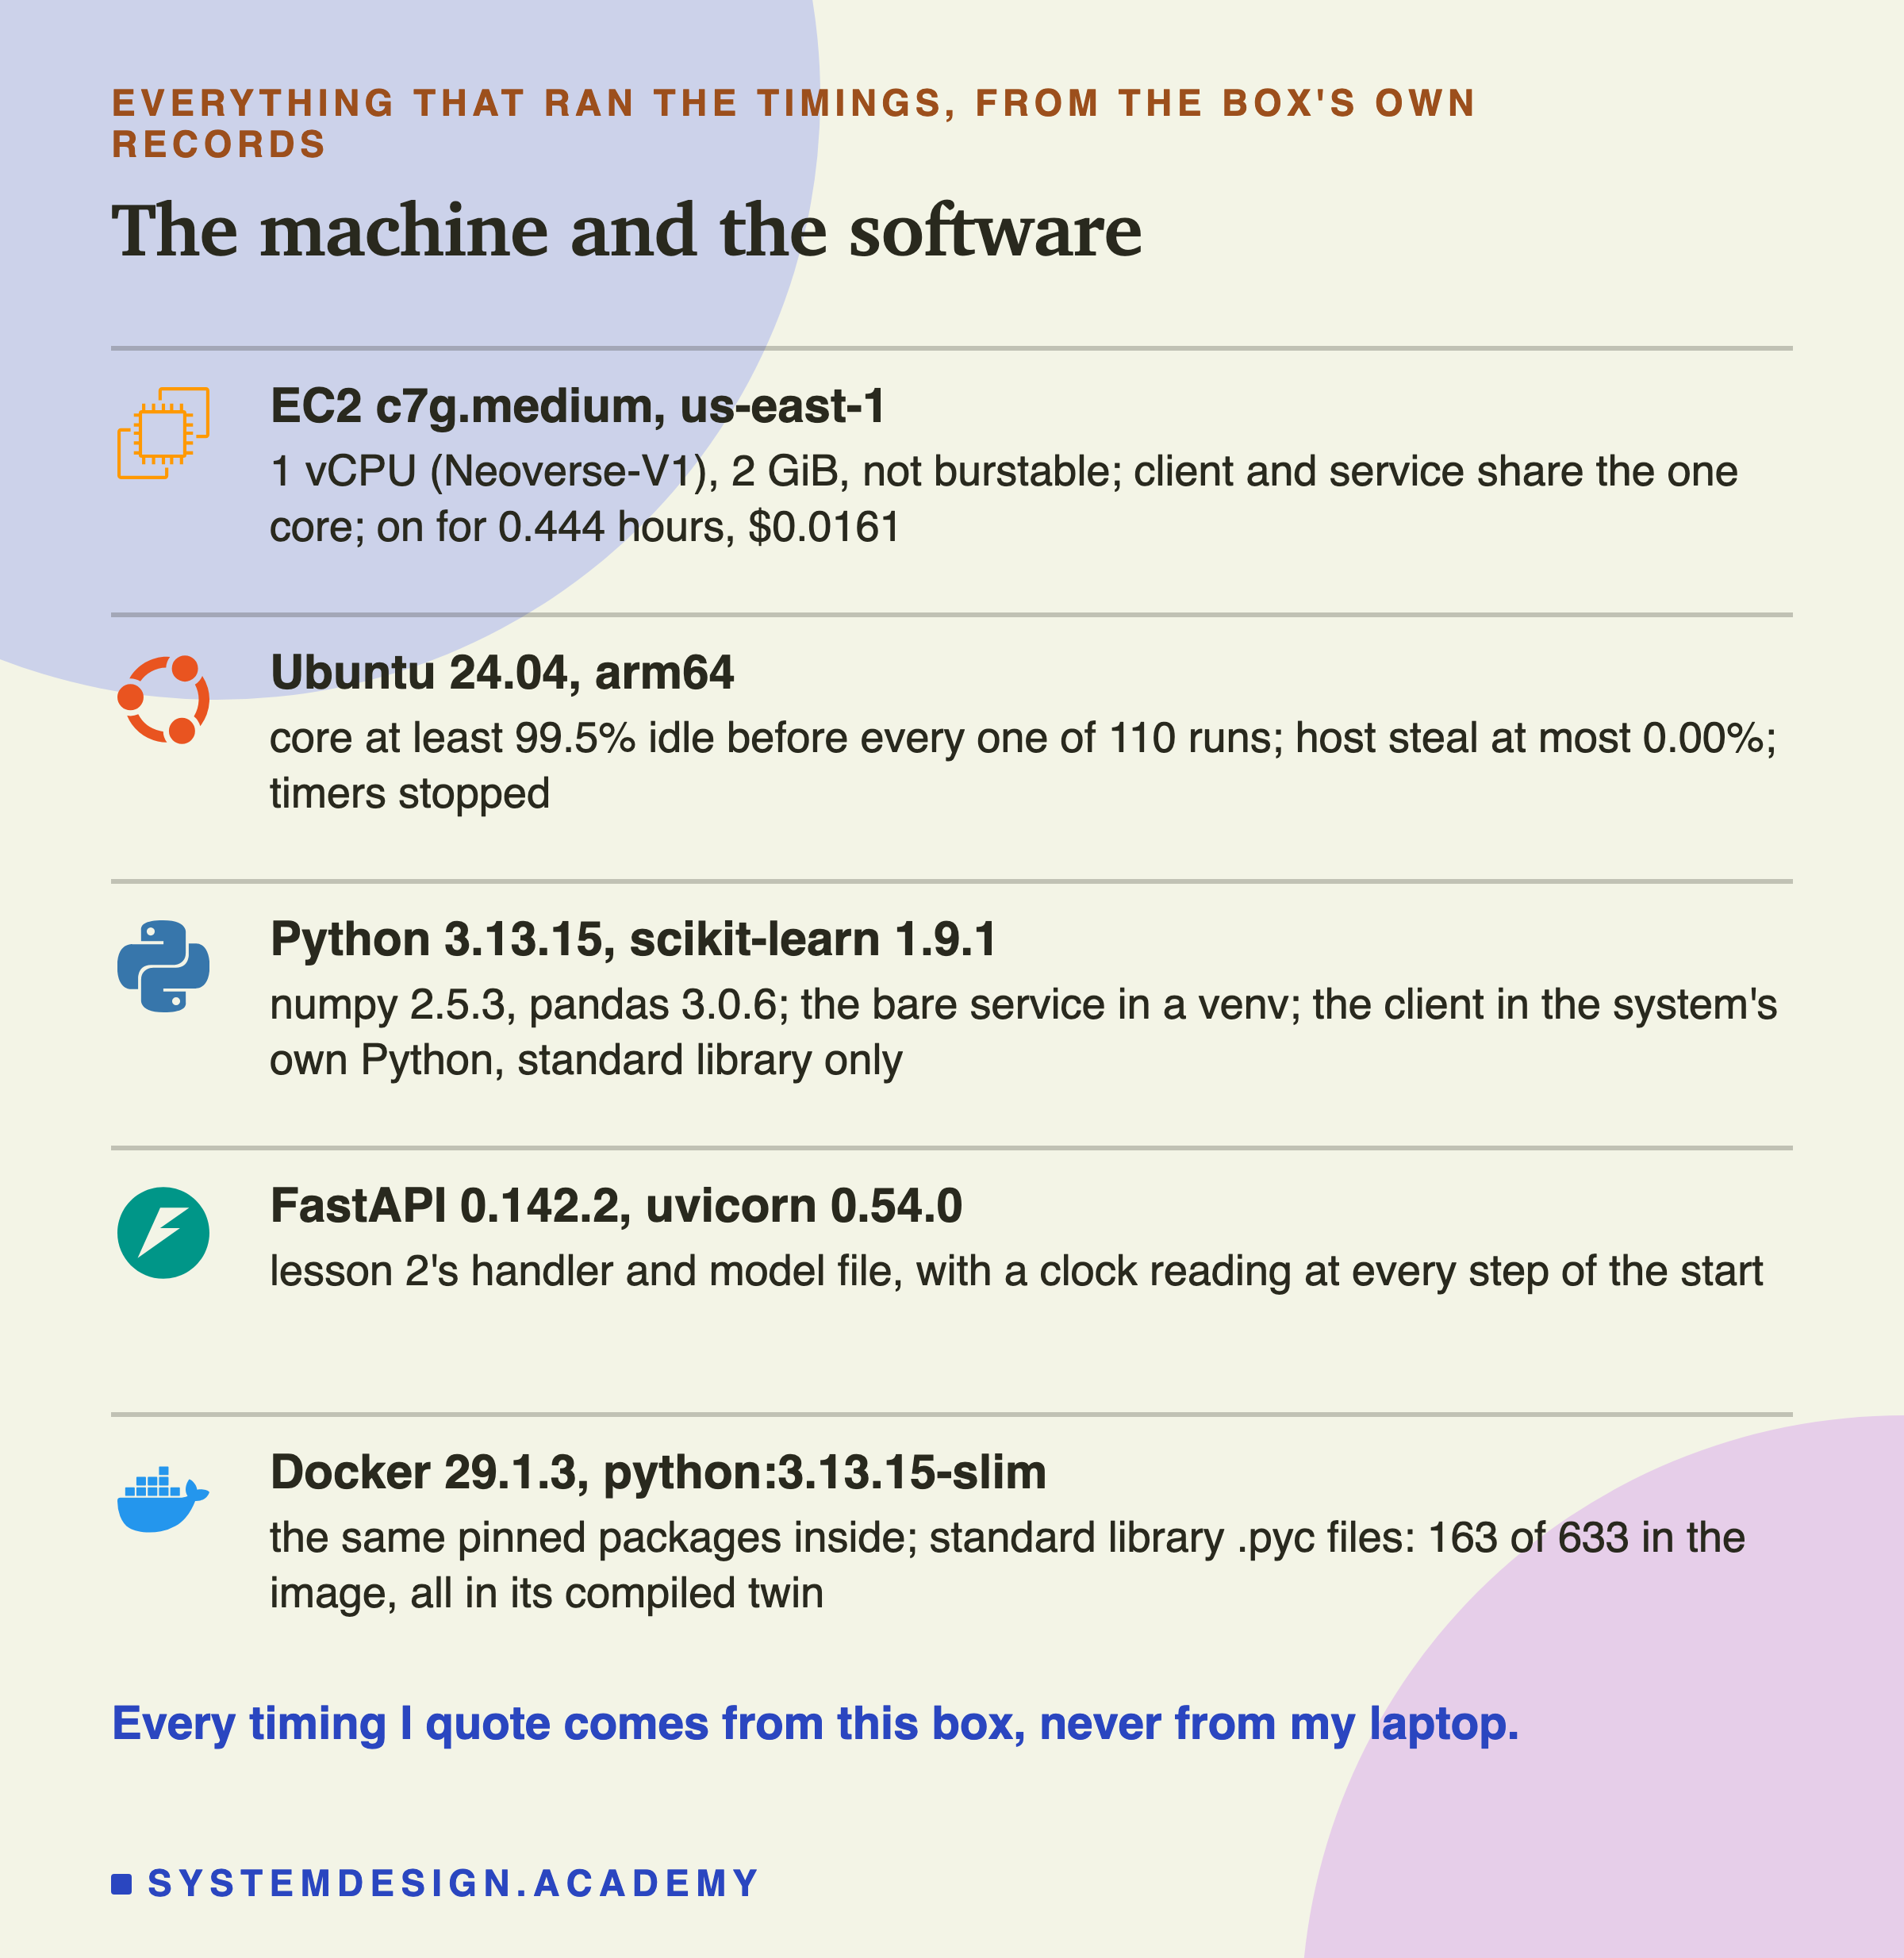
The box is an EC2 c7g.medium, with one virtual CPU and 2 GiB of memory. My AWS account allows only one virtual CPU at a time, as lesson 5 explained. So the client that starts the service and sends requests runs on the same core as the service.
The client runs in a different Python on purpose. In the cold-cache arms, I empty the page cache just before the start. If the client imported numpy, it would read the very files the service is about to read, and the service would start warm. So the client uses only Ubuntu's own Python and its standard library. It shares no files with the service's Python, except the basic C library.
Before every one of the 110 runs, the core was at least 99.5% idle. The machine under my box took no measurable time from it.
The Whole Lab in One Picture
Before the recordings, here is the whole lab as one numbered sequence. The numbers on the arrows match the numbers on the recordings that follow.
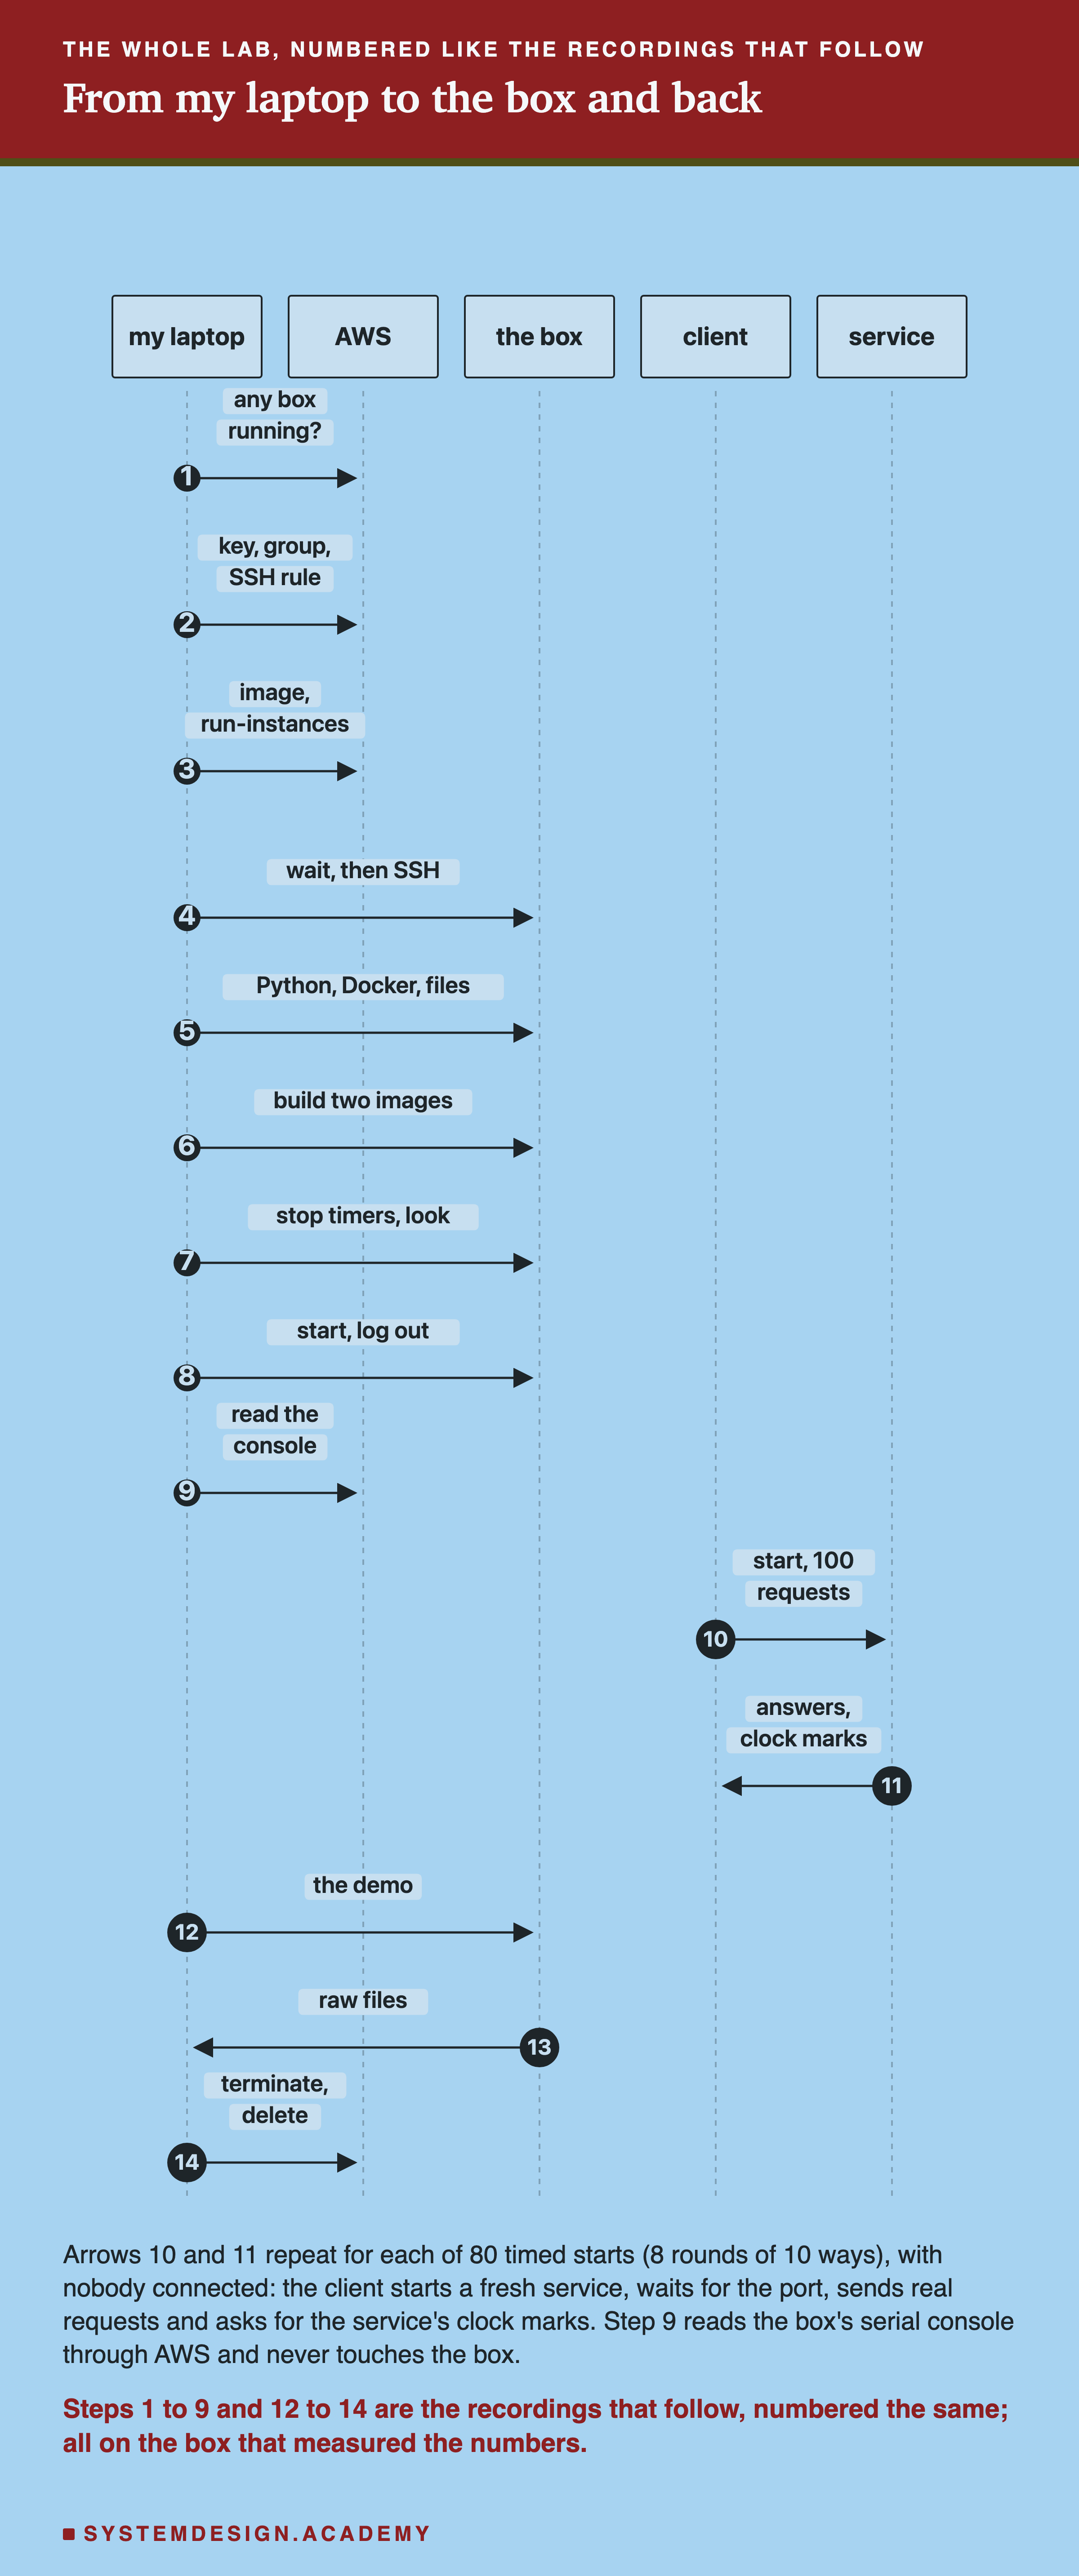
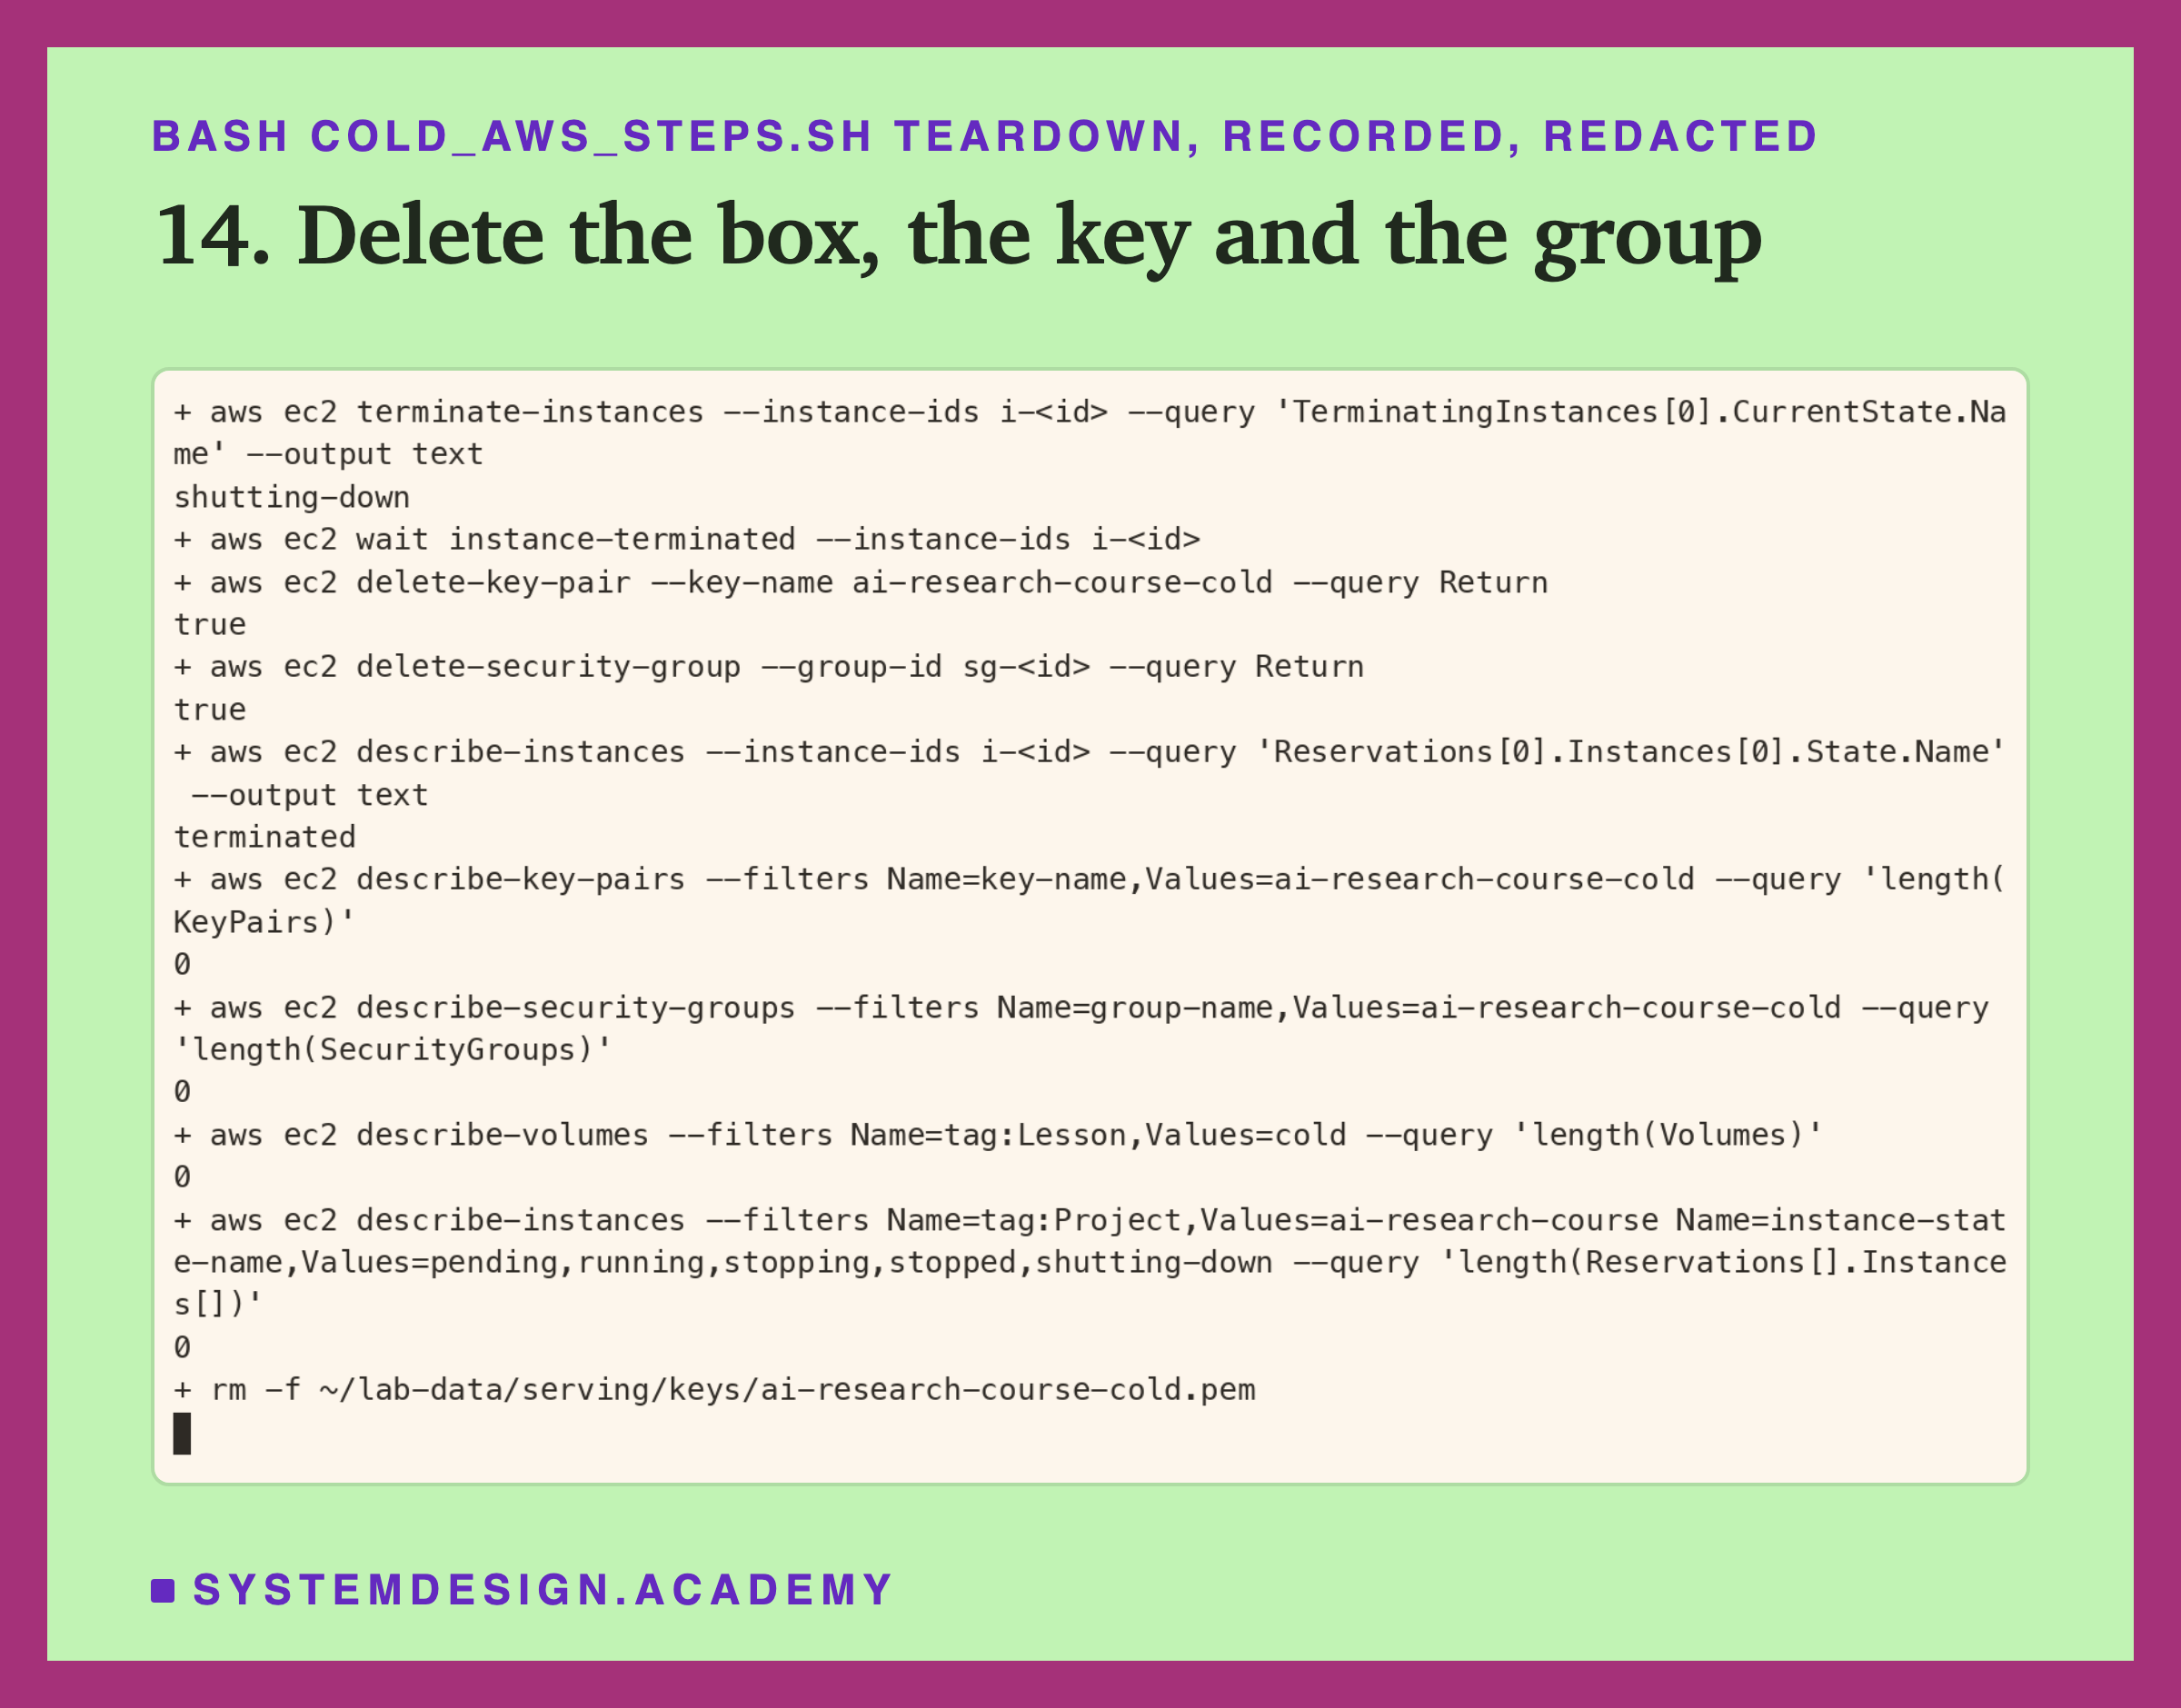
Steps 1 to 8 happen once: check, rent the box, set it up, build the images and start the schedule. Step 9 is how I watched the schedule without touching the box. Arrows 10 and 11 are the timed work, repeated for 80 starts with nobody logged in. Steps 12 to 14 come after the schedule: the student demo, the copy of the results back to my laptop, and the deletion of everything.
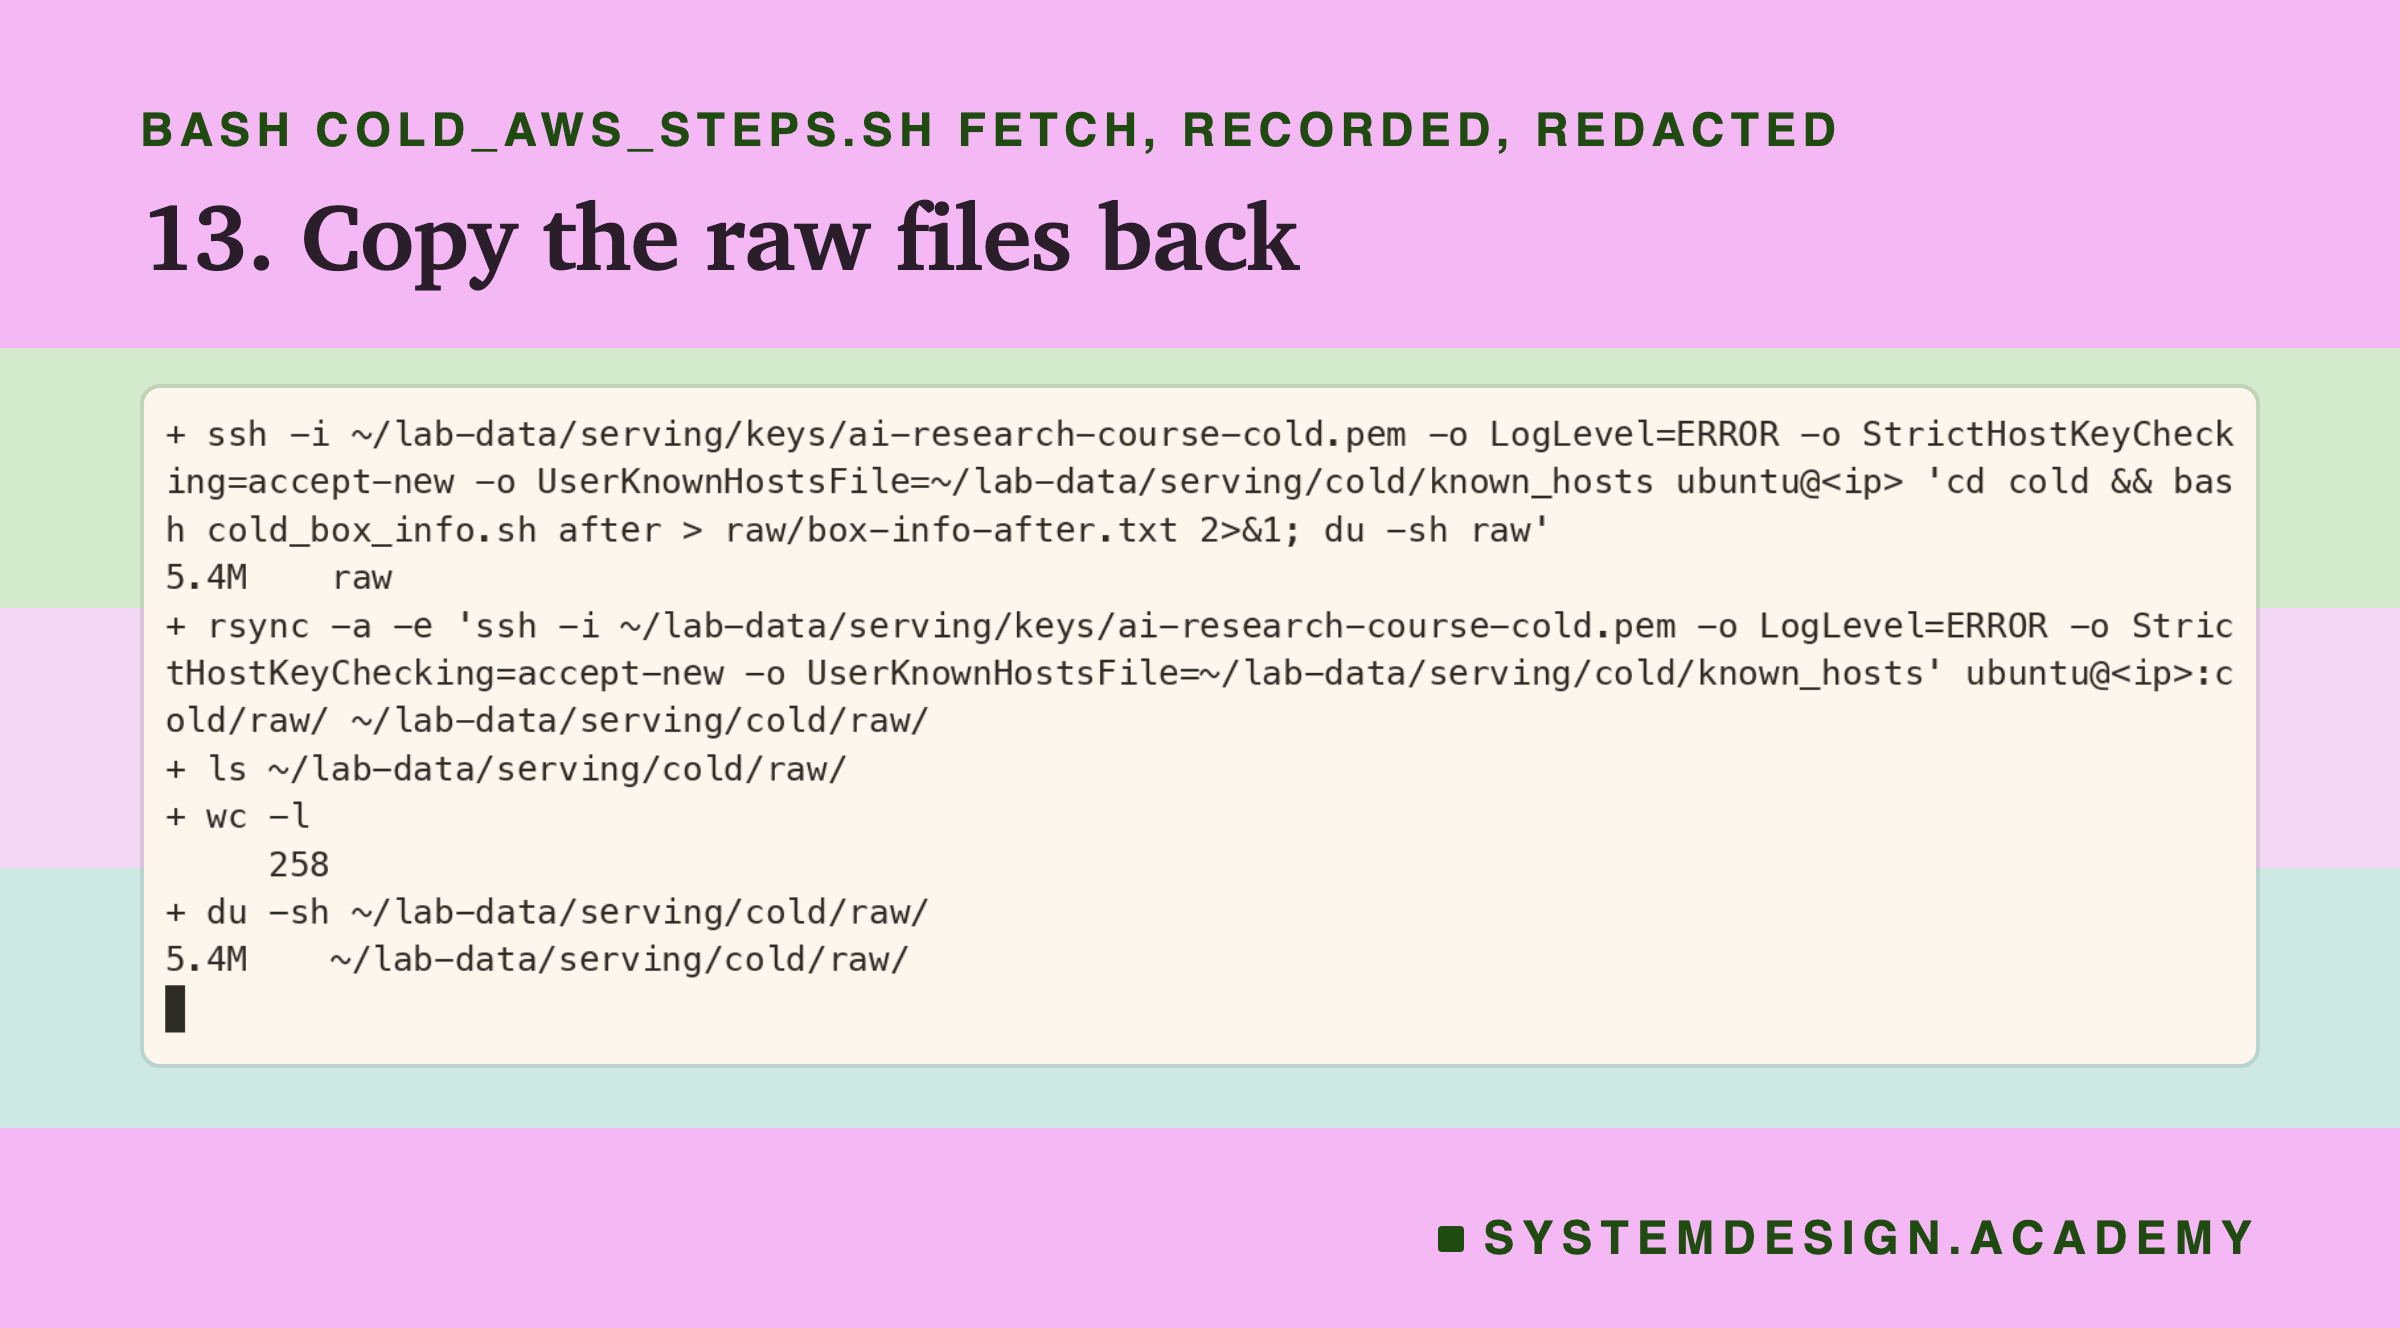
Three things are not in this picture, and I want to be open about them. Before the schedule, I ran one untimed start of each arm over SSH, only to check that every arm worked. That was the first real test of the Dockerfiles. After the demo, I copied one more script to the box with scp. Then I ran one more block of timings over SSH, without a recording, to repeat a measurement that had gone wrong. The slide about images explains it. And the fetch in step 13 ran twice: the first rsync, right after the demo, is not recorded either; the recording is the second one.
Build the Lab Box Yourself
The rented box is part of the lab, so I show every step of it. You can rent the same kind of box and run the same schedule.
Which box you see. Every recording comes from the box that measured this lesson's numbers. No recording happened during a timed run, and nobody logged in while the schedule ran.
What you need first. An AWS account, the AWS command line tool (aws) set up with your keys, and ssh, scp, rsync and curl. All the steps live in one file, scripts/labs/serving/cold_files/cold_aws_steps.sh. You run it from the scripts/labs/serving folder, one step at a time: bash cold_files/cold_aws_steps.sh check, then access, and so on. Every code block below is copied word for word from that file.
The blocks use a few names the file sets at its top. Run these lines first, from the scripts/labs/serving folder, if you paste the blocks by hand. All of them are copied from the file, except HERE=$PWD, the folder B and the two short names S and C. The file works out from its own location, which a pasted line cannot do. It sets , and inside its step. and use the box's address, , so run those two lines only after step 4 has set it.
Steps 1 to 3: Check, Lock the Door, Rent the Box
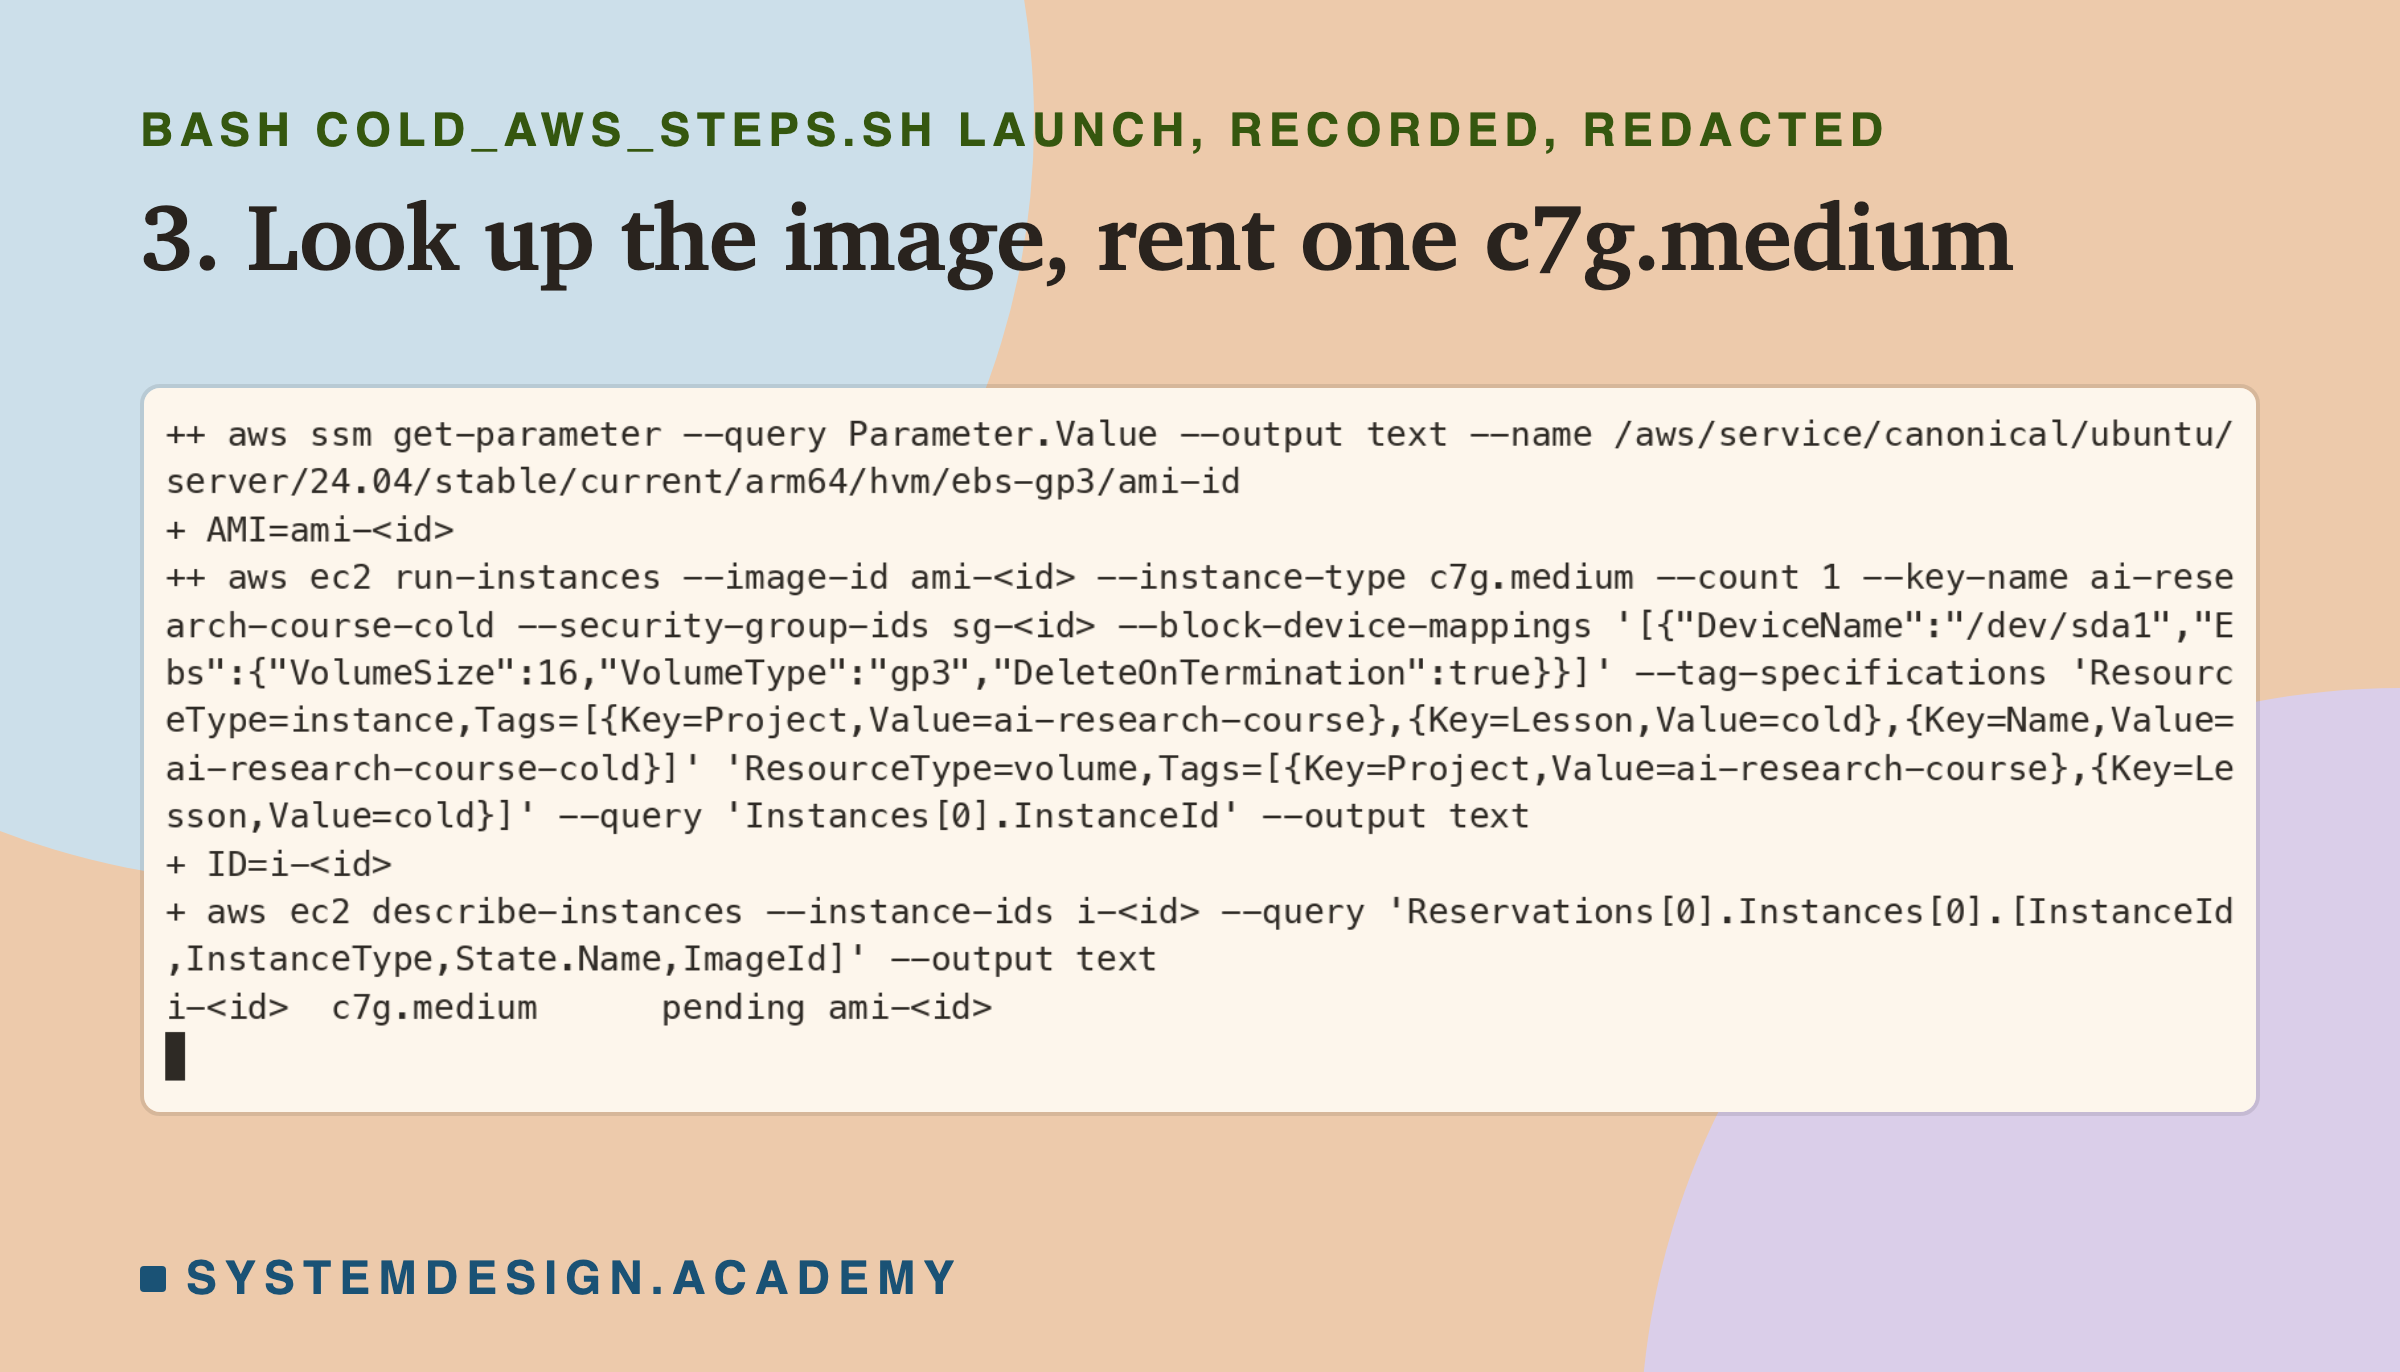
Step 1: is any other course box running? My account allows one box of this kind at a time, and another lesson may be using it. So the first command counts the course's boxes that are not yet deleted. It must print 0.
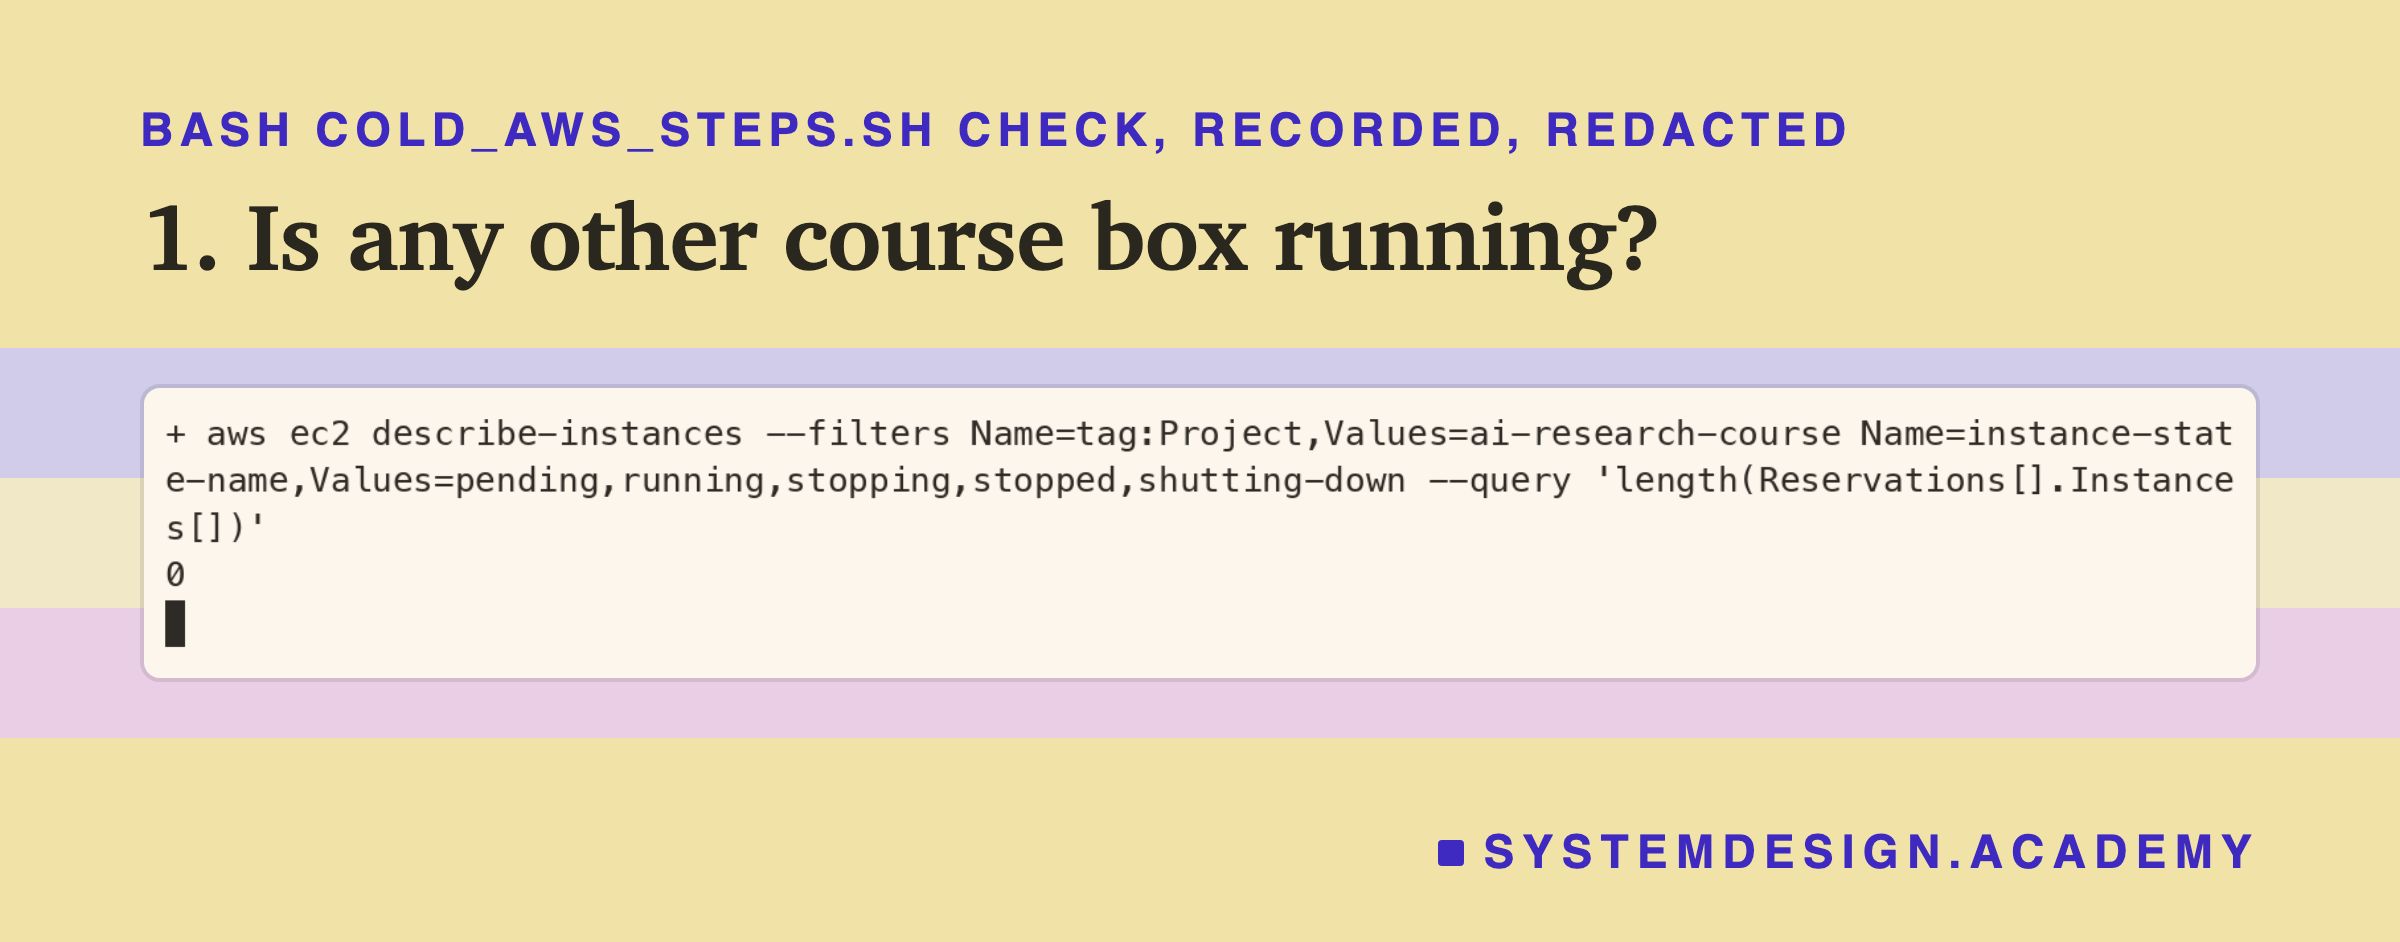
The recording shows the command and its answer, 0, so no other course box was alive. This is the command, copied from the step script:
  aws ec2 describe-instances --filters "Name=tag:Project,Values=ai-research-course" \
    "Name=instance-state-name,Values=pending,running,stopping,stopped,shutting-down" \
    --query "length(Reservations[].Instances[])"
Step 2: a key and a locked door. A key pair is how you prove to the box that you are allowed in. A security group is a door rule for the box. Mine opens only port 22, the SSH port, and only to my own address. In the rule, /32 after an address means that one address and no other. Both get tags, labels that say which project and lesson they belong to.
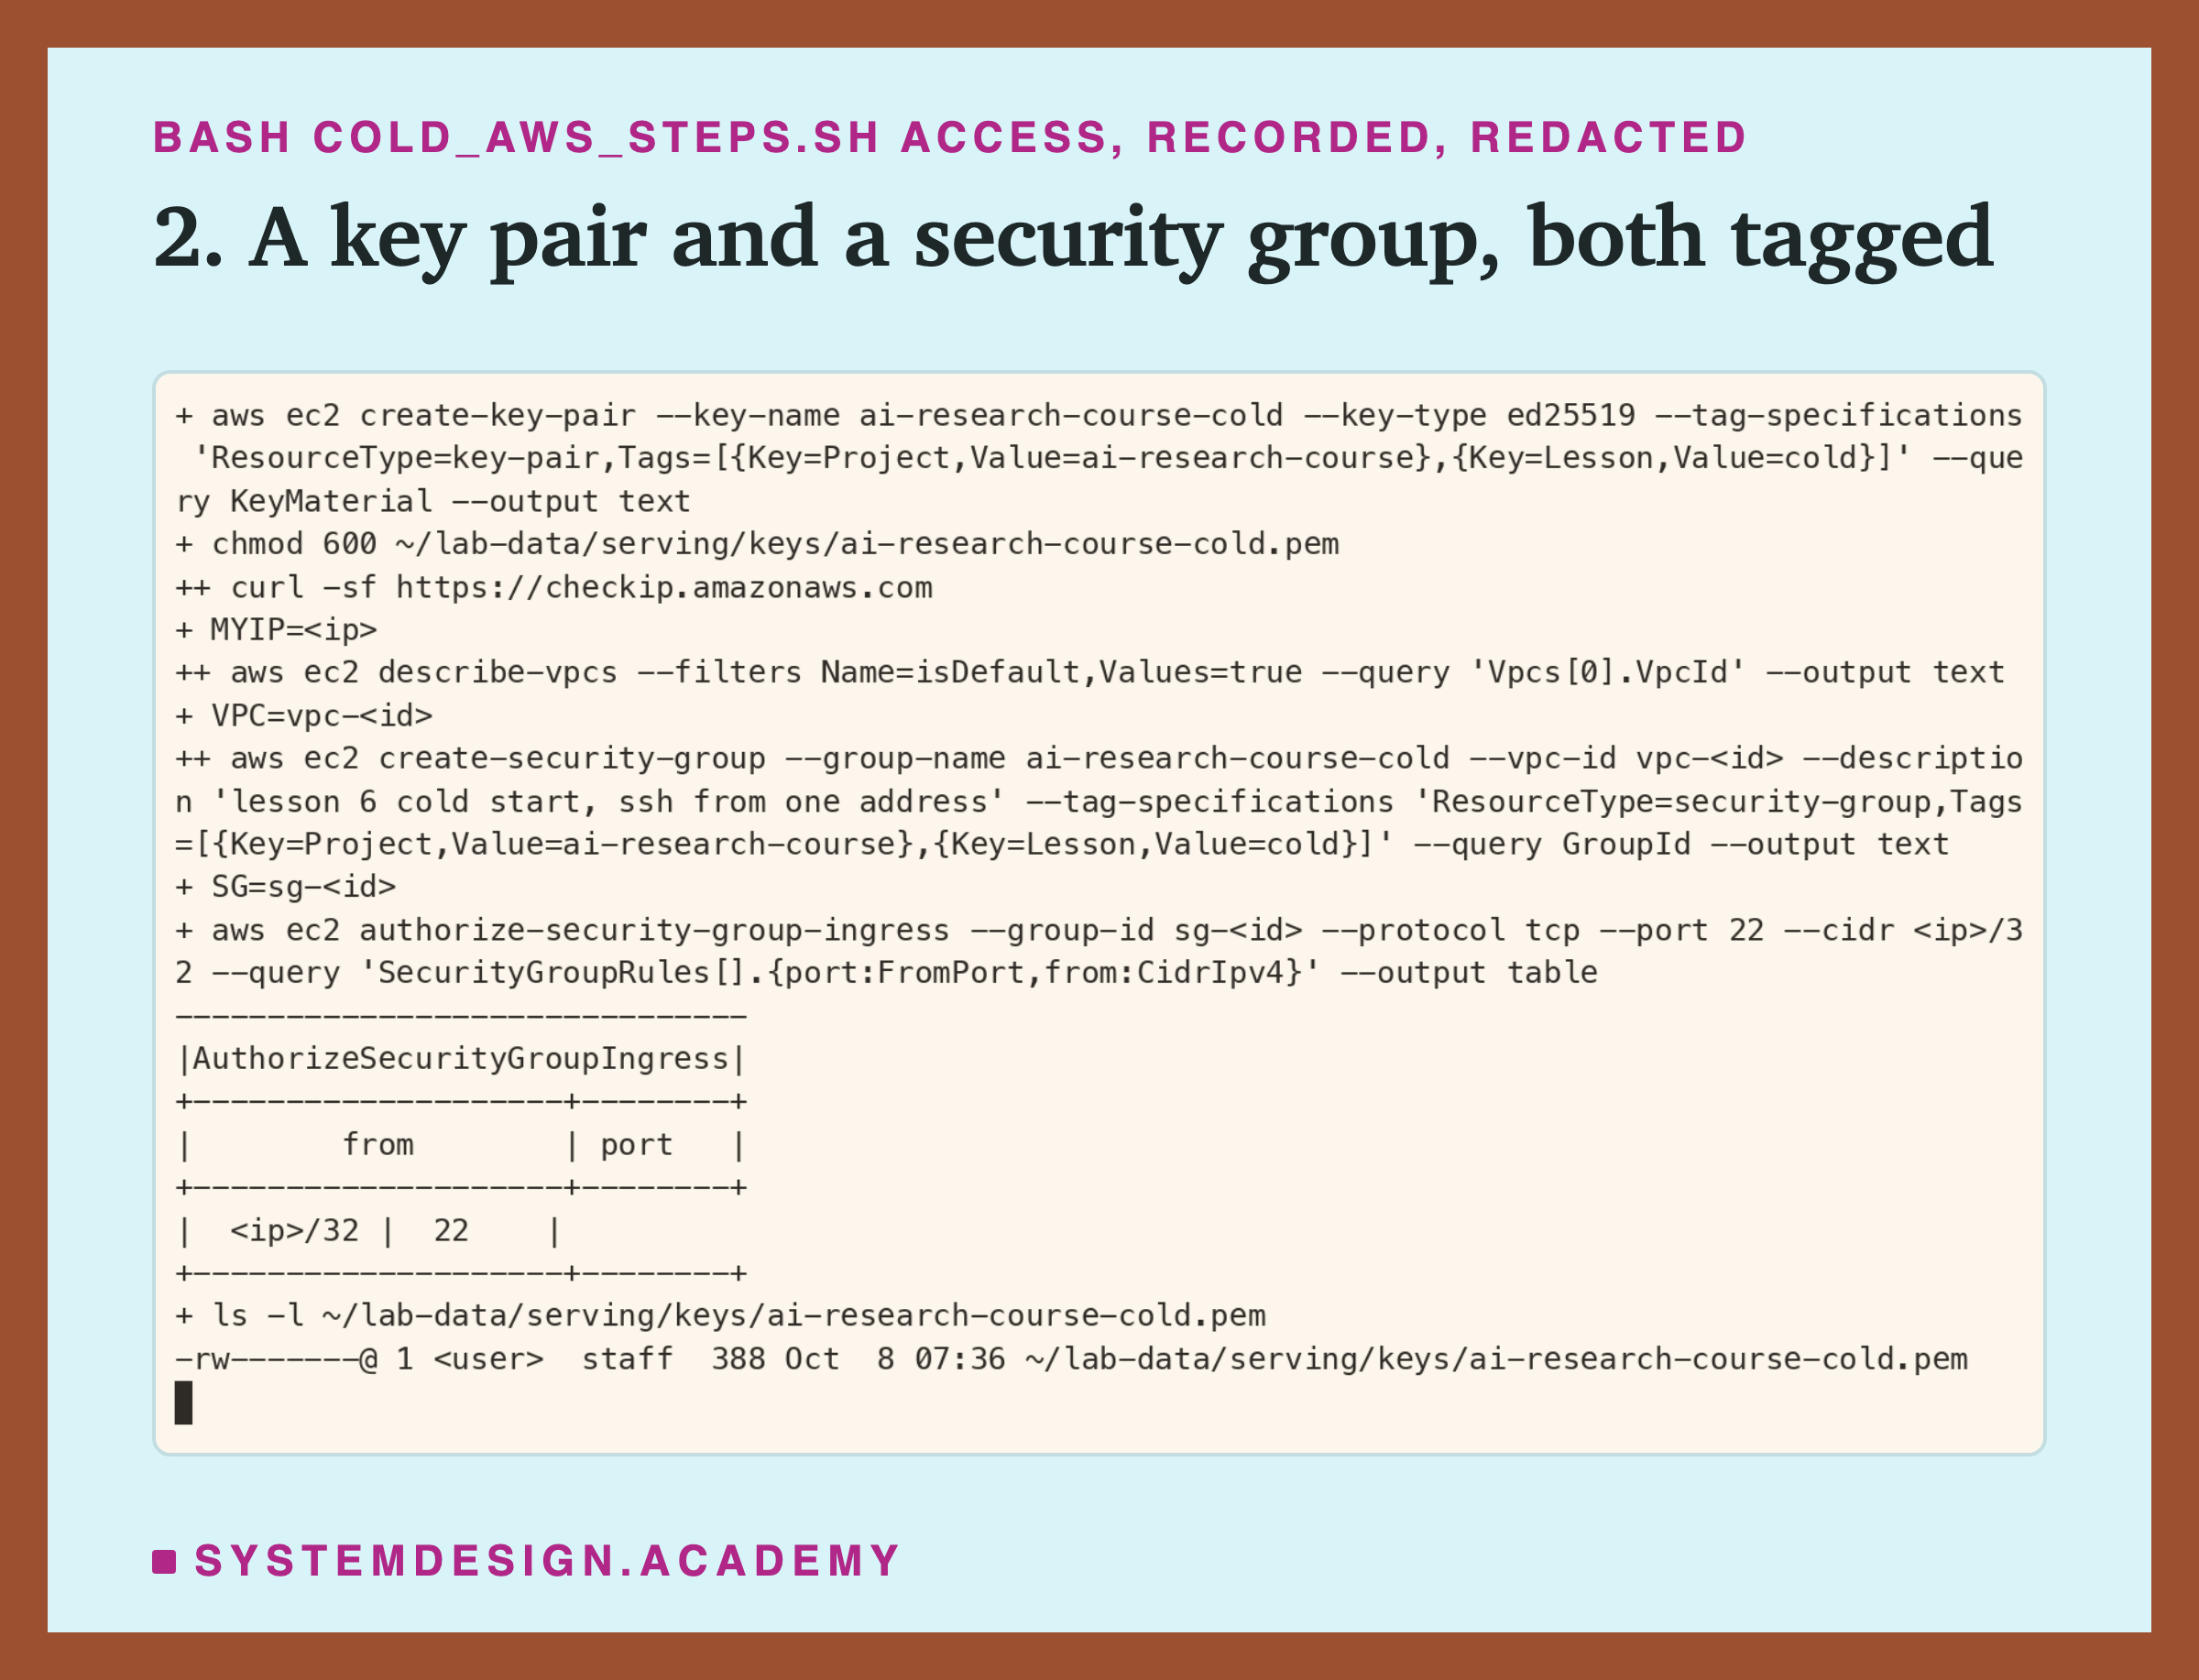
The key material went straight into the file and was never printed, and the door rule names only my own address. These are the commands:
  aws ec2 create-key-pair --key-name ai-research-course-cold --key-type ed25519 \
    --tag-specifications "ResourceType=key-pair,Tags=[{Key=Project,Value=ai-research-course},{Key=Lesson,Value=cold}]" \
    --query KeyMaterial --output text > ~/lab-data/serving/keys/ai-research-course-cold.pem
  chmod 600 ~/lab-data/serving/keys/ai-research-course-cold.pem
  MYIP=$(curl -sf https://checkip.amazonaws.com)
  VPC=$(aws ec2 describe-vpcs --filters Name=isDefault,Values=true --query "Vpcs[0].VpcId" --output text)
  SG=$(aws ec2 create-security-group --group-name ai-research-course-cold --vpc-id "$VPC" \
    --description "lesson 6 cold start, ssh from one address" \
    --tag-specifications "ResourceType=security-group,Tags=[{Key=Project,Value=ai-research-course},{Key=Lesson,Value=cold}]" \
    --query GroupId --output text)
  aws ec2 authorize-security-group-ingress --group-id "$SG" --protocol tcp --port 22 --cidr "$MYIP/32" \
    --query "SecurityGroupRules[].{port:FromPort,from:CidrIpv4}" --output table
Steps 4 to 8: Wait, Set Up, Build the Images, Start
Step 4: wait until it runs. A new box takes a short while to start. The AWS tool waits for you. Then the script reads the box's public address into IP, and tries SSH every five seconds until the box answers.
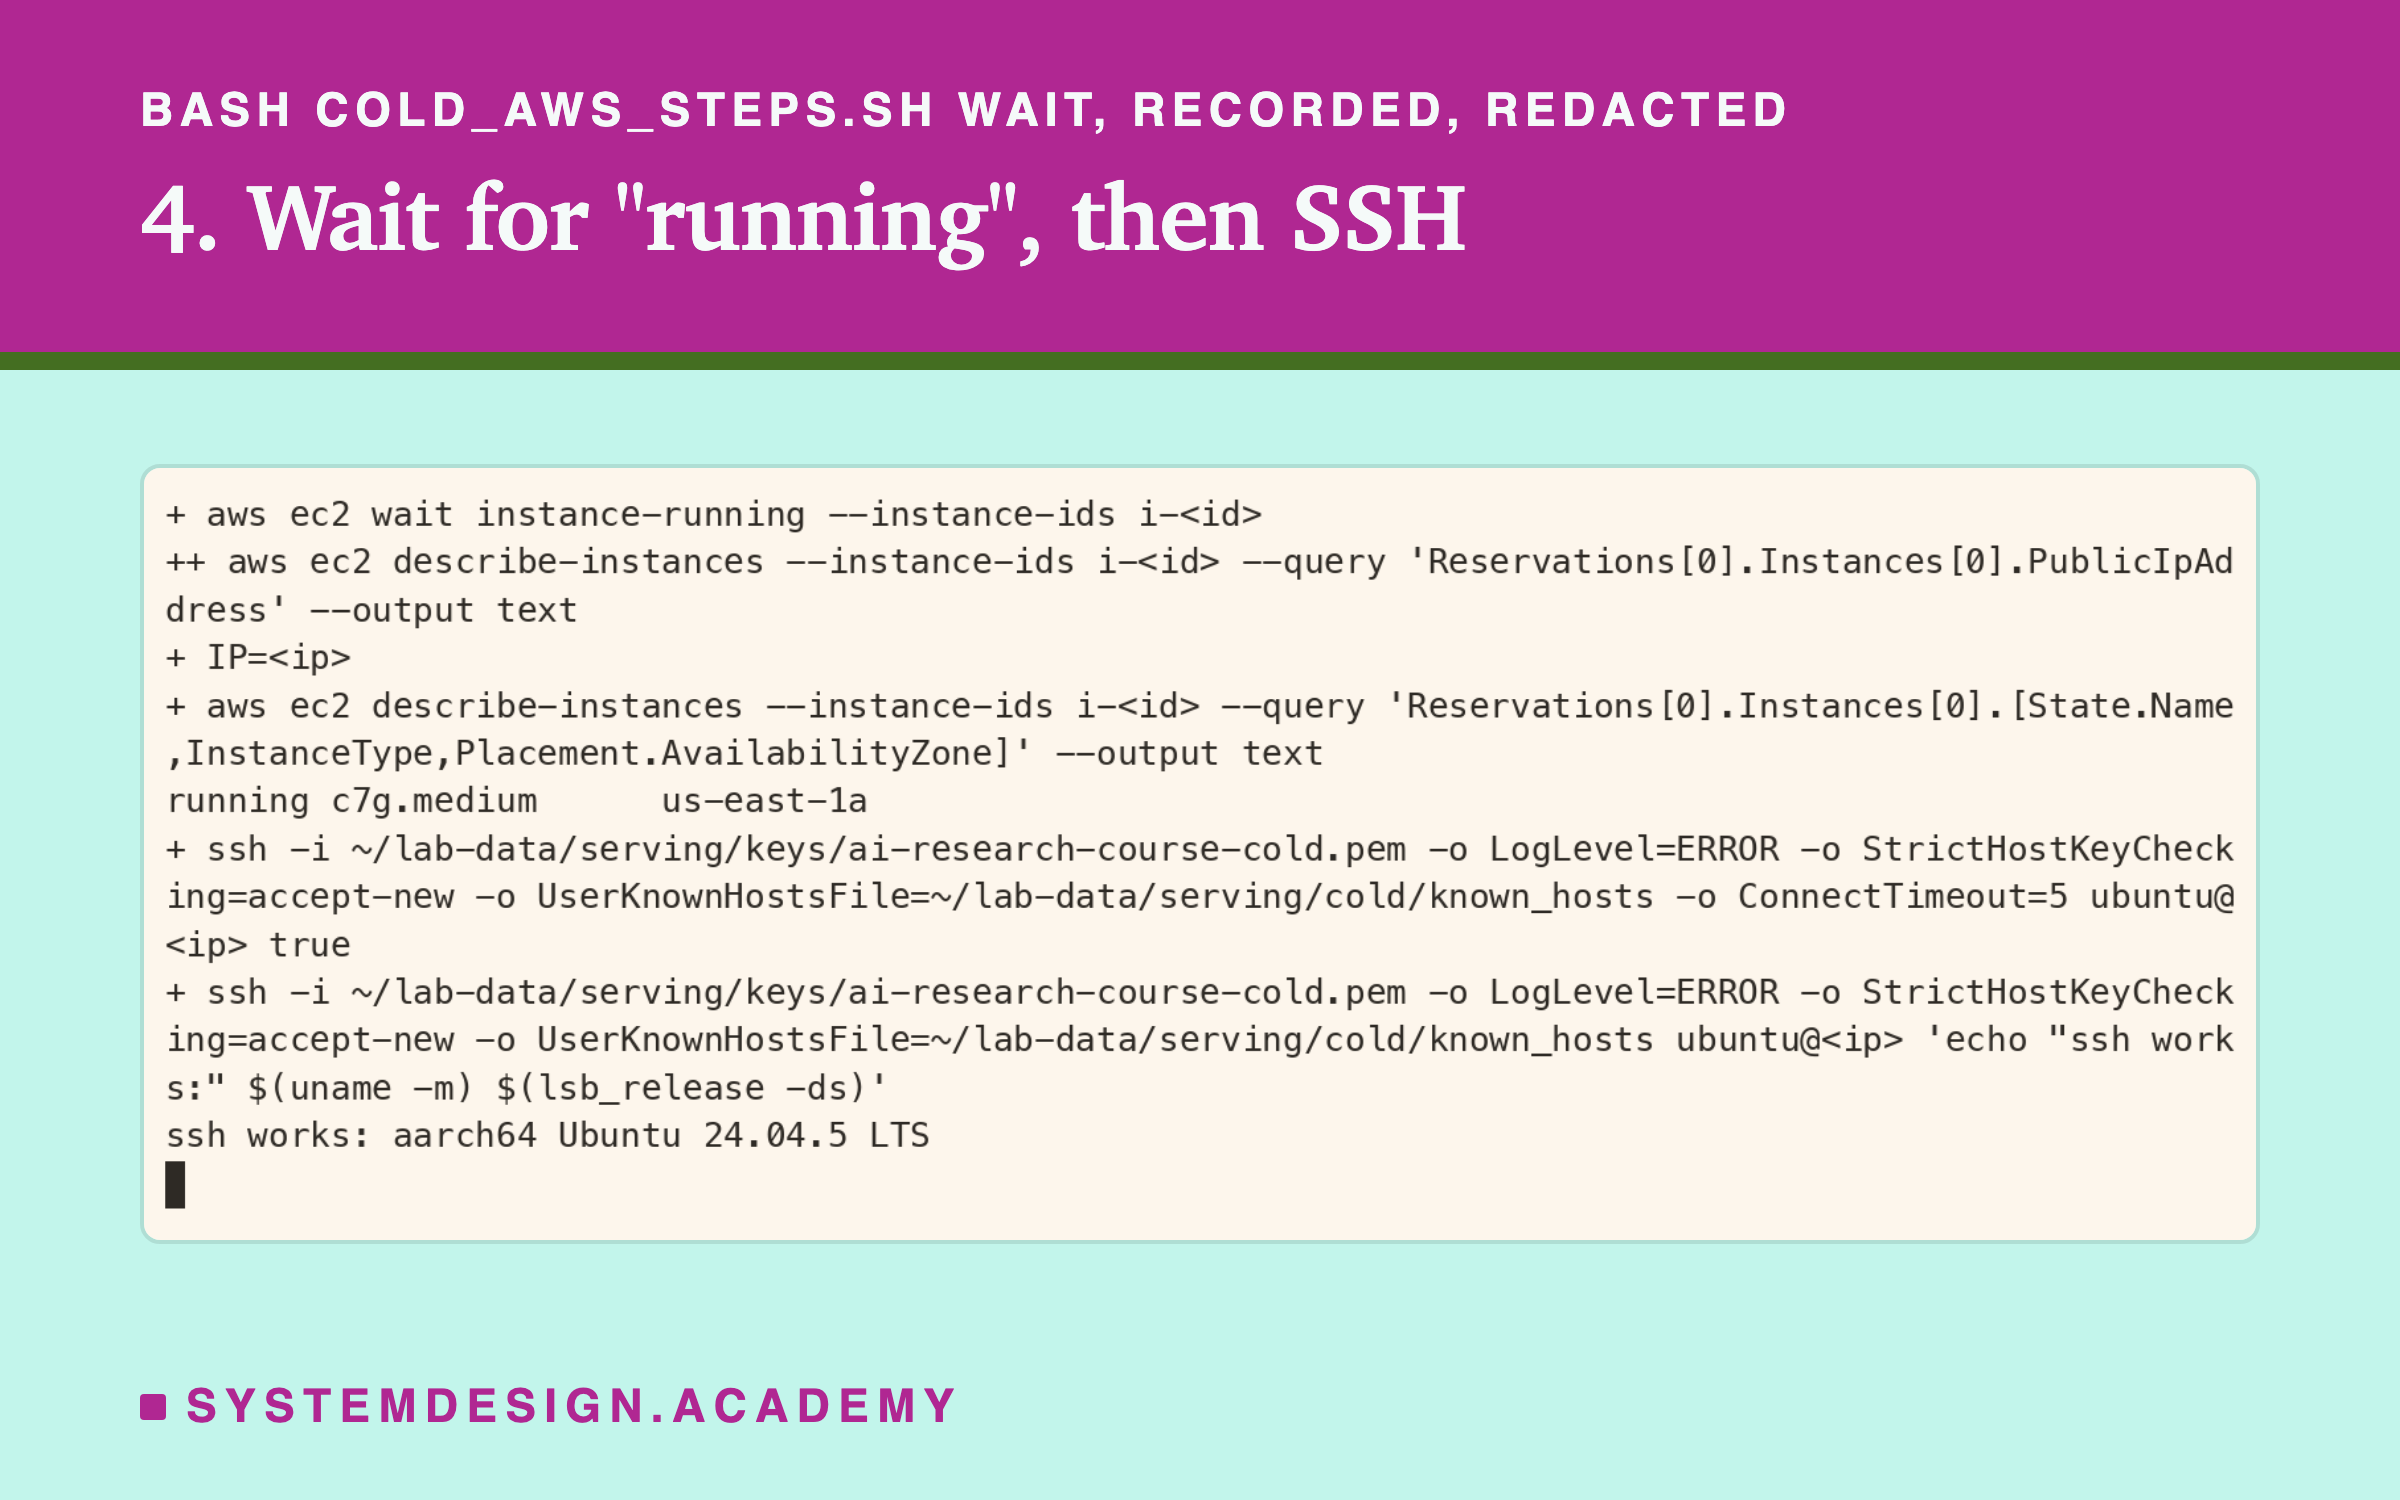
This time SSH answered on the first try. These are the commands, with the retry loop:
  aws ec2 wait instance-running --instance-ids "$ID"
  IP=$(aws ec2 describe-instances --instance-ids "$ID" \
    --query "Reservations[0].Instances[0].PublicIpAddress" --output text)
  until ssh -i ~/lab-data/serving/keys/ai-research-course-cold.pem "${SSHO[@]}" -o ConnectTimeout=5 \
    ubuntu@"$IP" true 2>/dev/null; do sleep 5; done
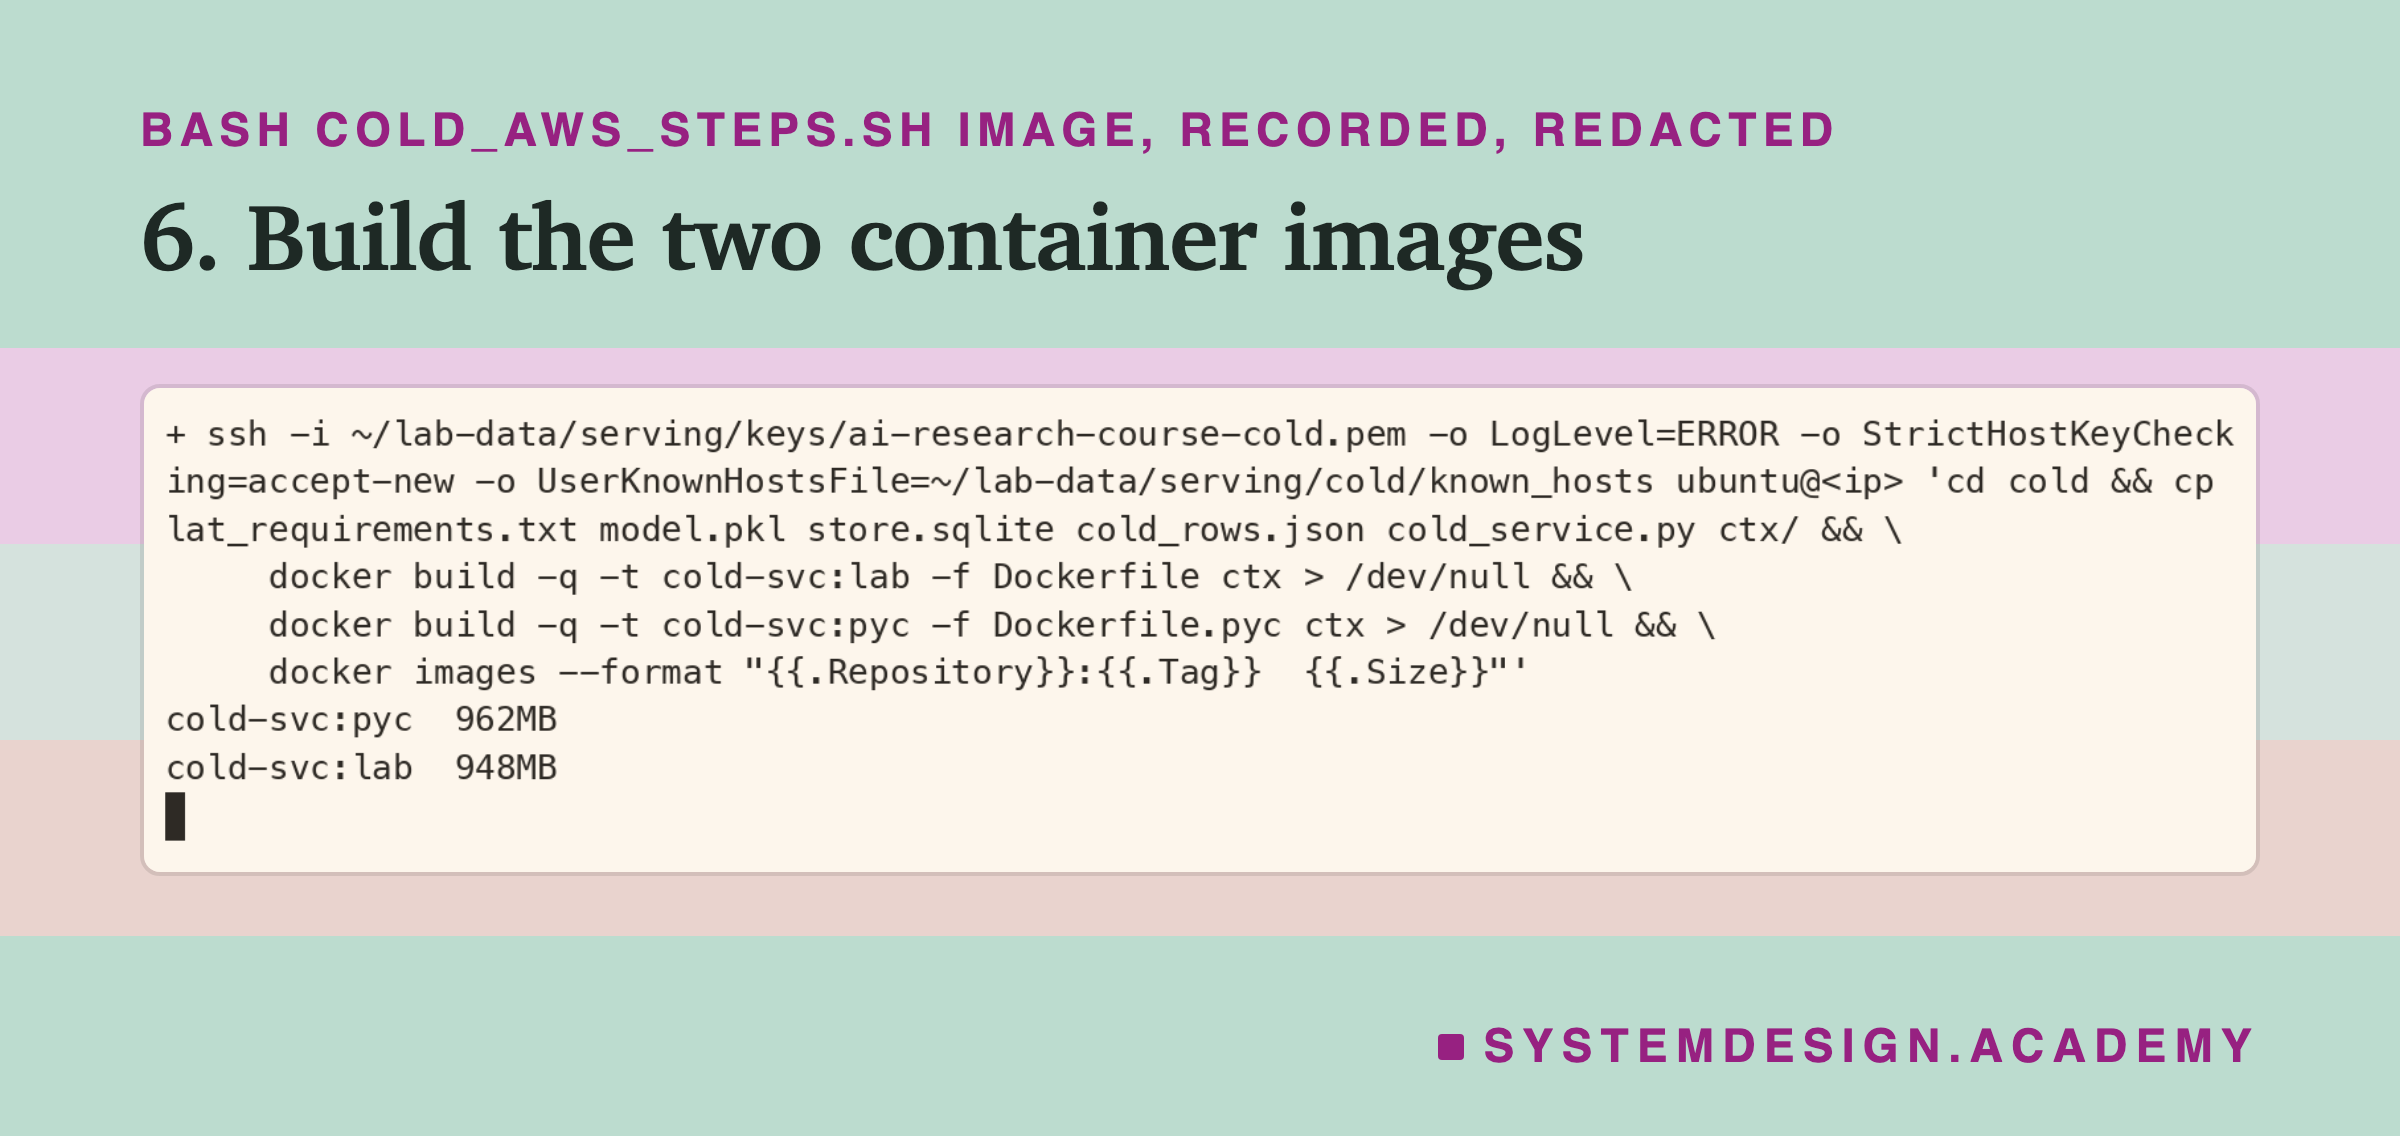
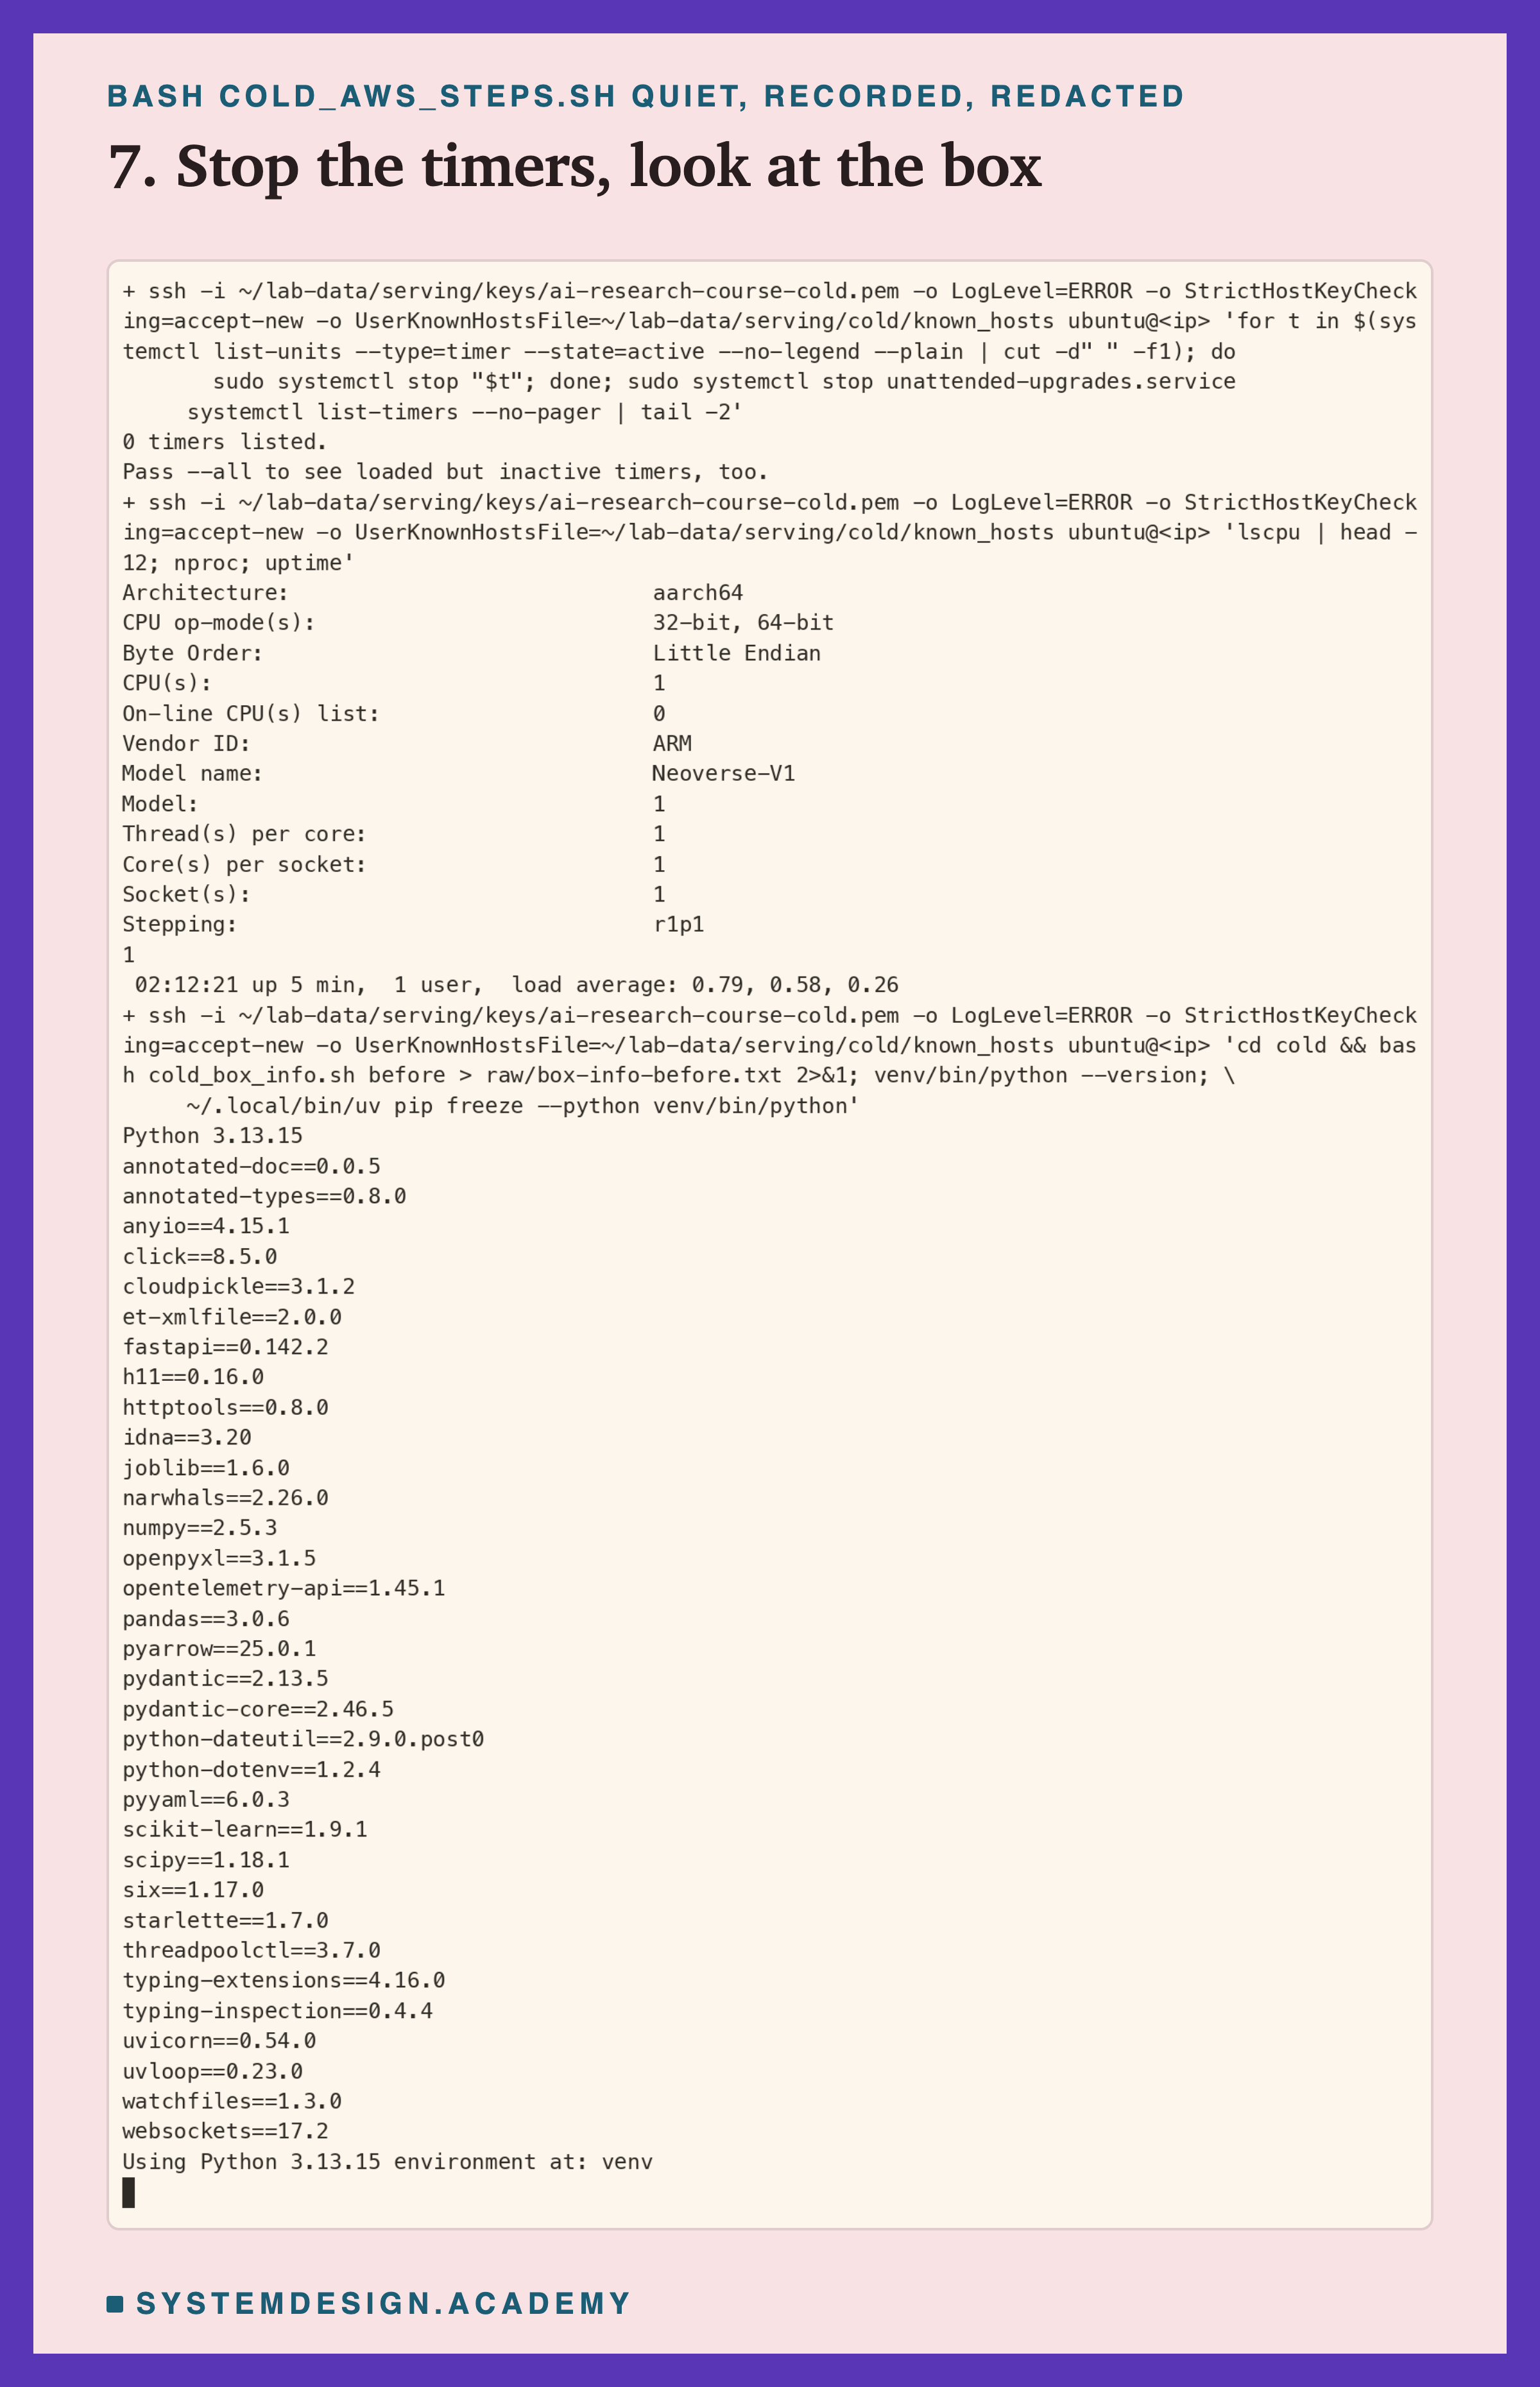
Step 5: Python, and the lab files. The box gets Python 3.13.15 and the same pinned library versions as lessons 2 to 5, through uv, a fast installer for Python. It also gets Docker from Ubuntu's own packages. Then scp sends lesson 2's model, feature table and request list, this lesson's files, and what the demo needs. The last command builds the SQLite table, computes a reference score for every request row, and prints the files' sha256 fingerprints.
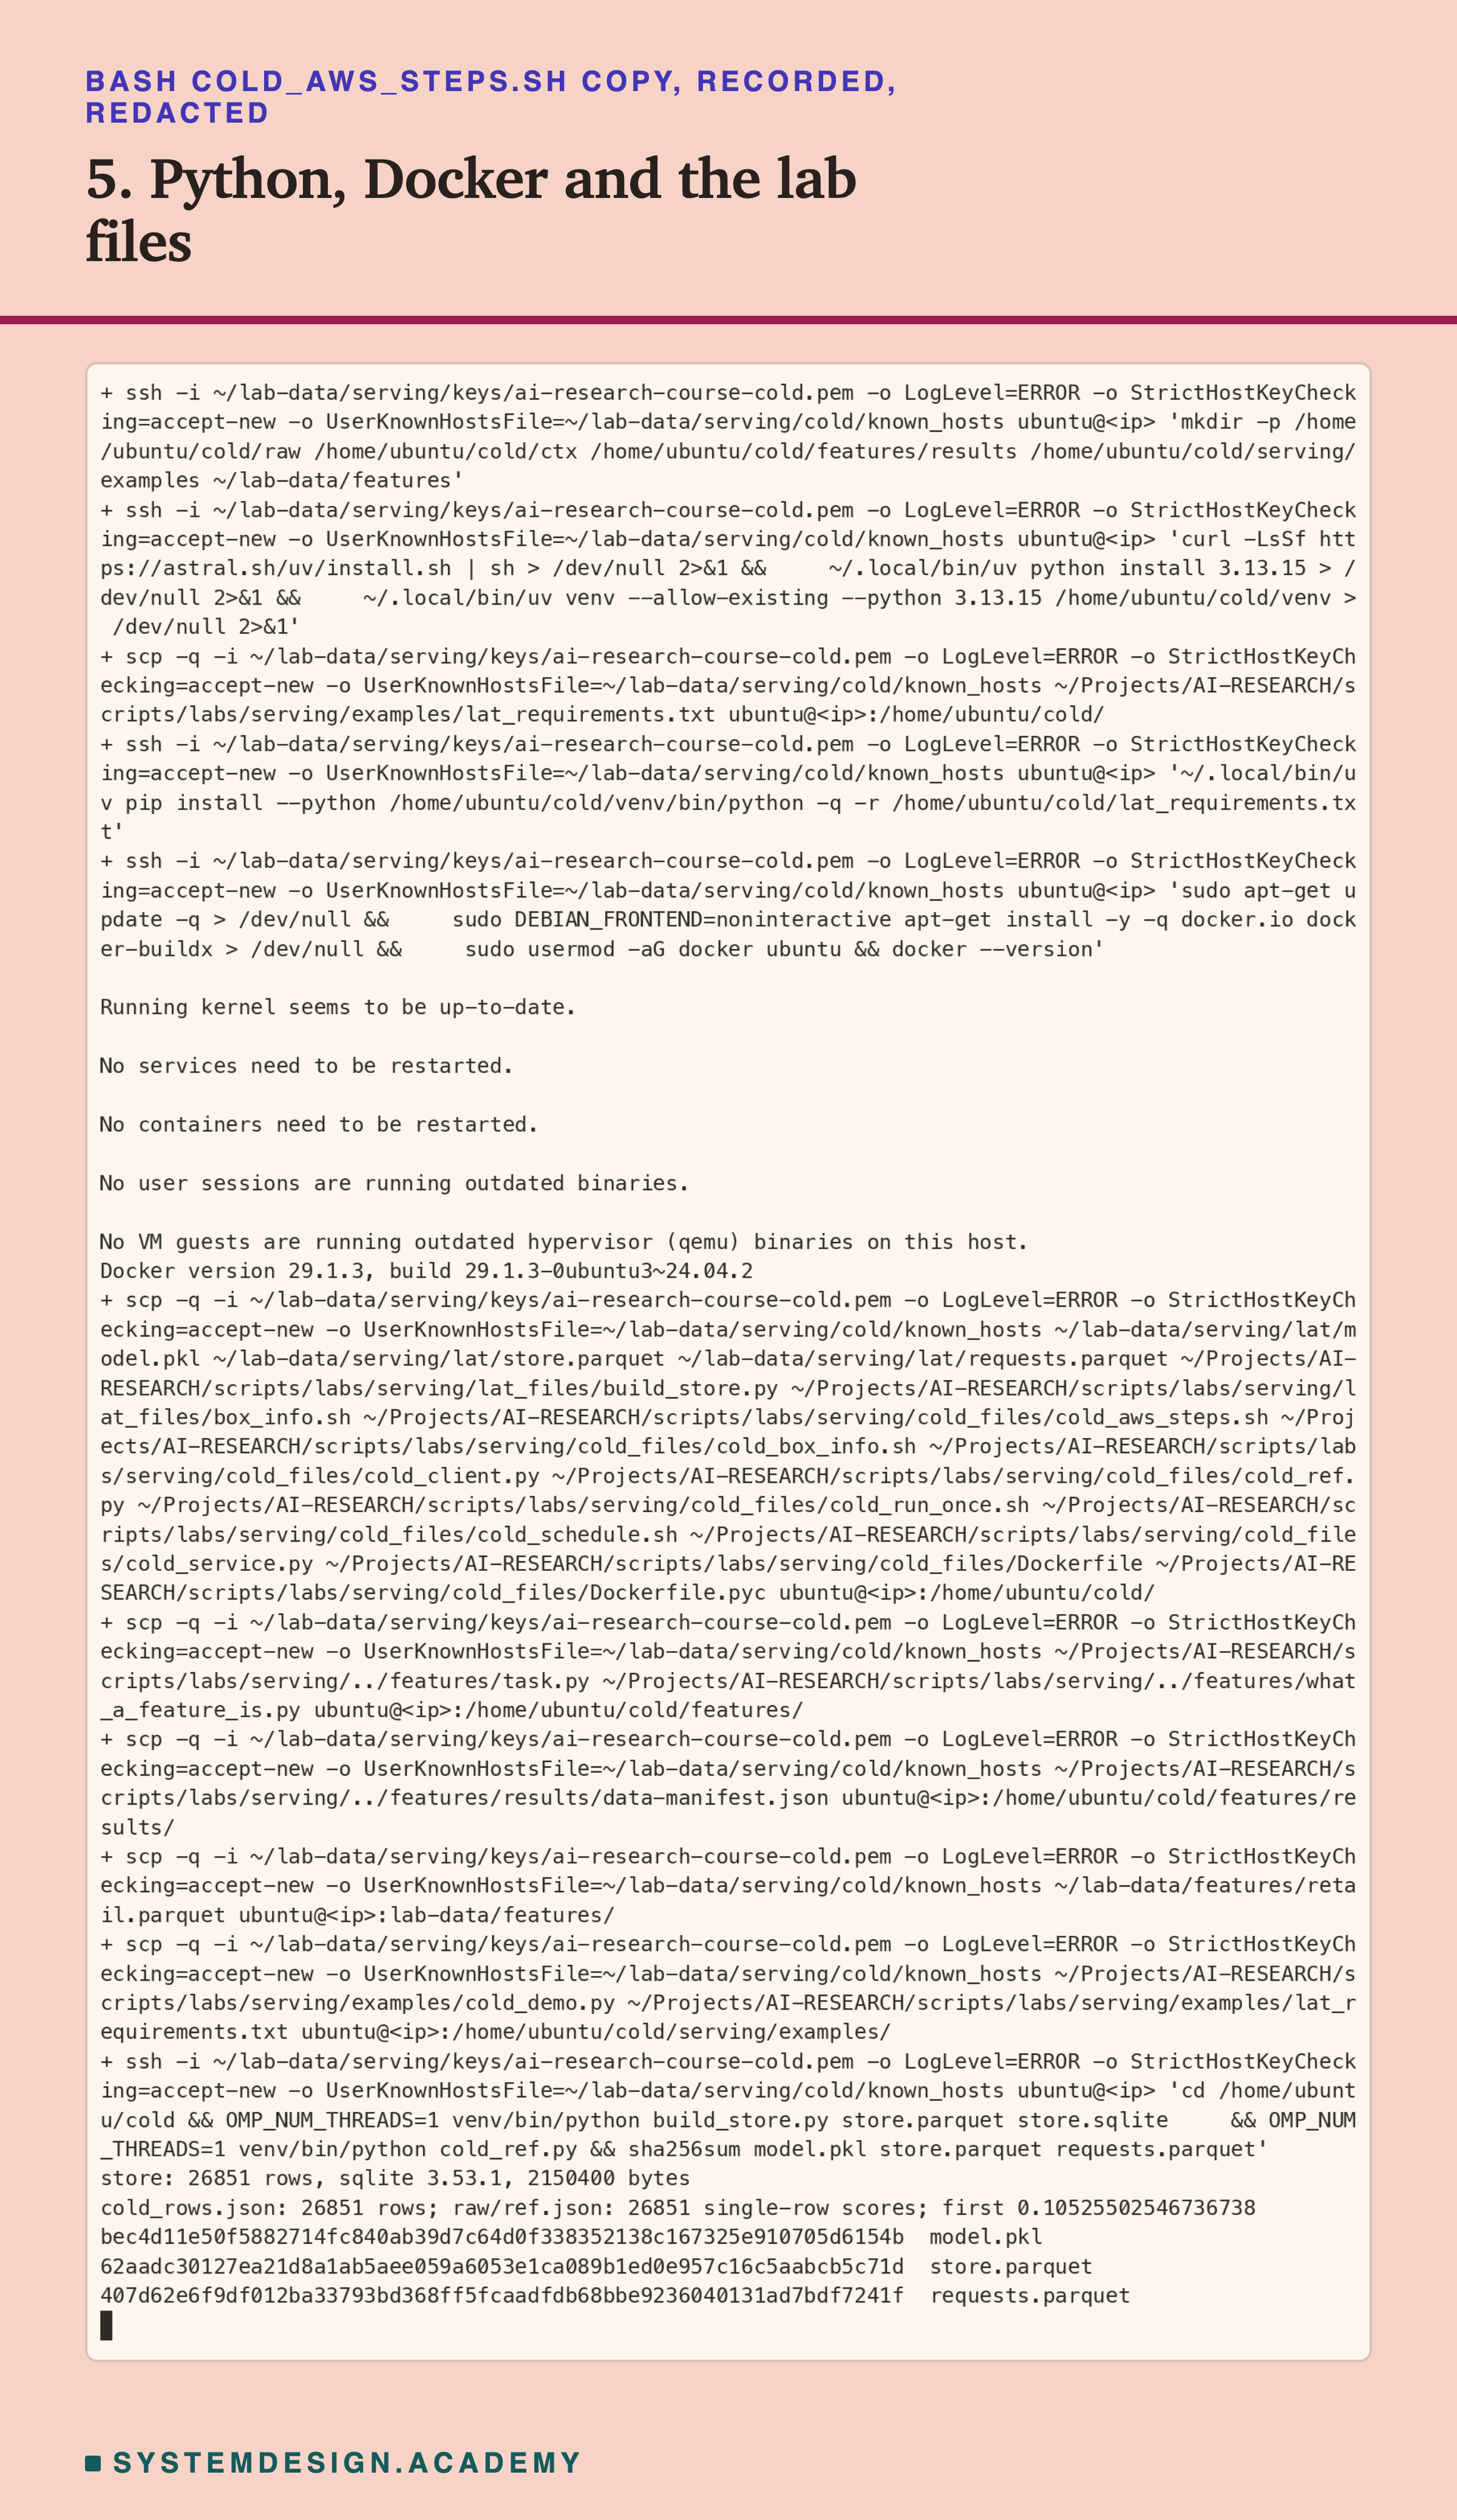
The three fingerprints match the ones lesson 2 recorded, so the box serves the same model. These are the commands that install Python, the packages and Docker:
Steps 9 and 12 to 14: Watch, Demo, Bring It Home, Delete
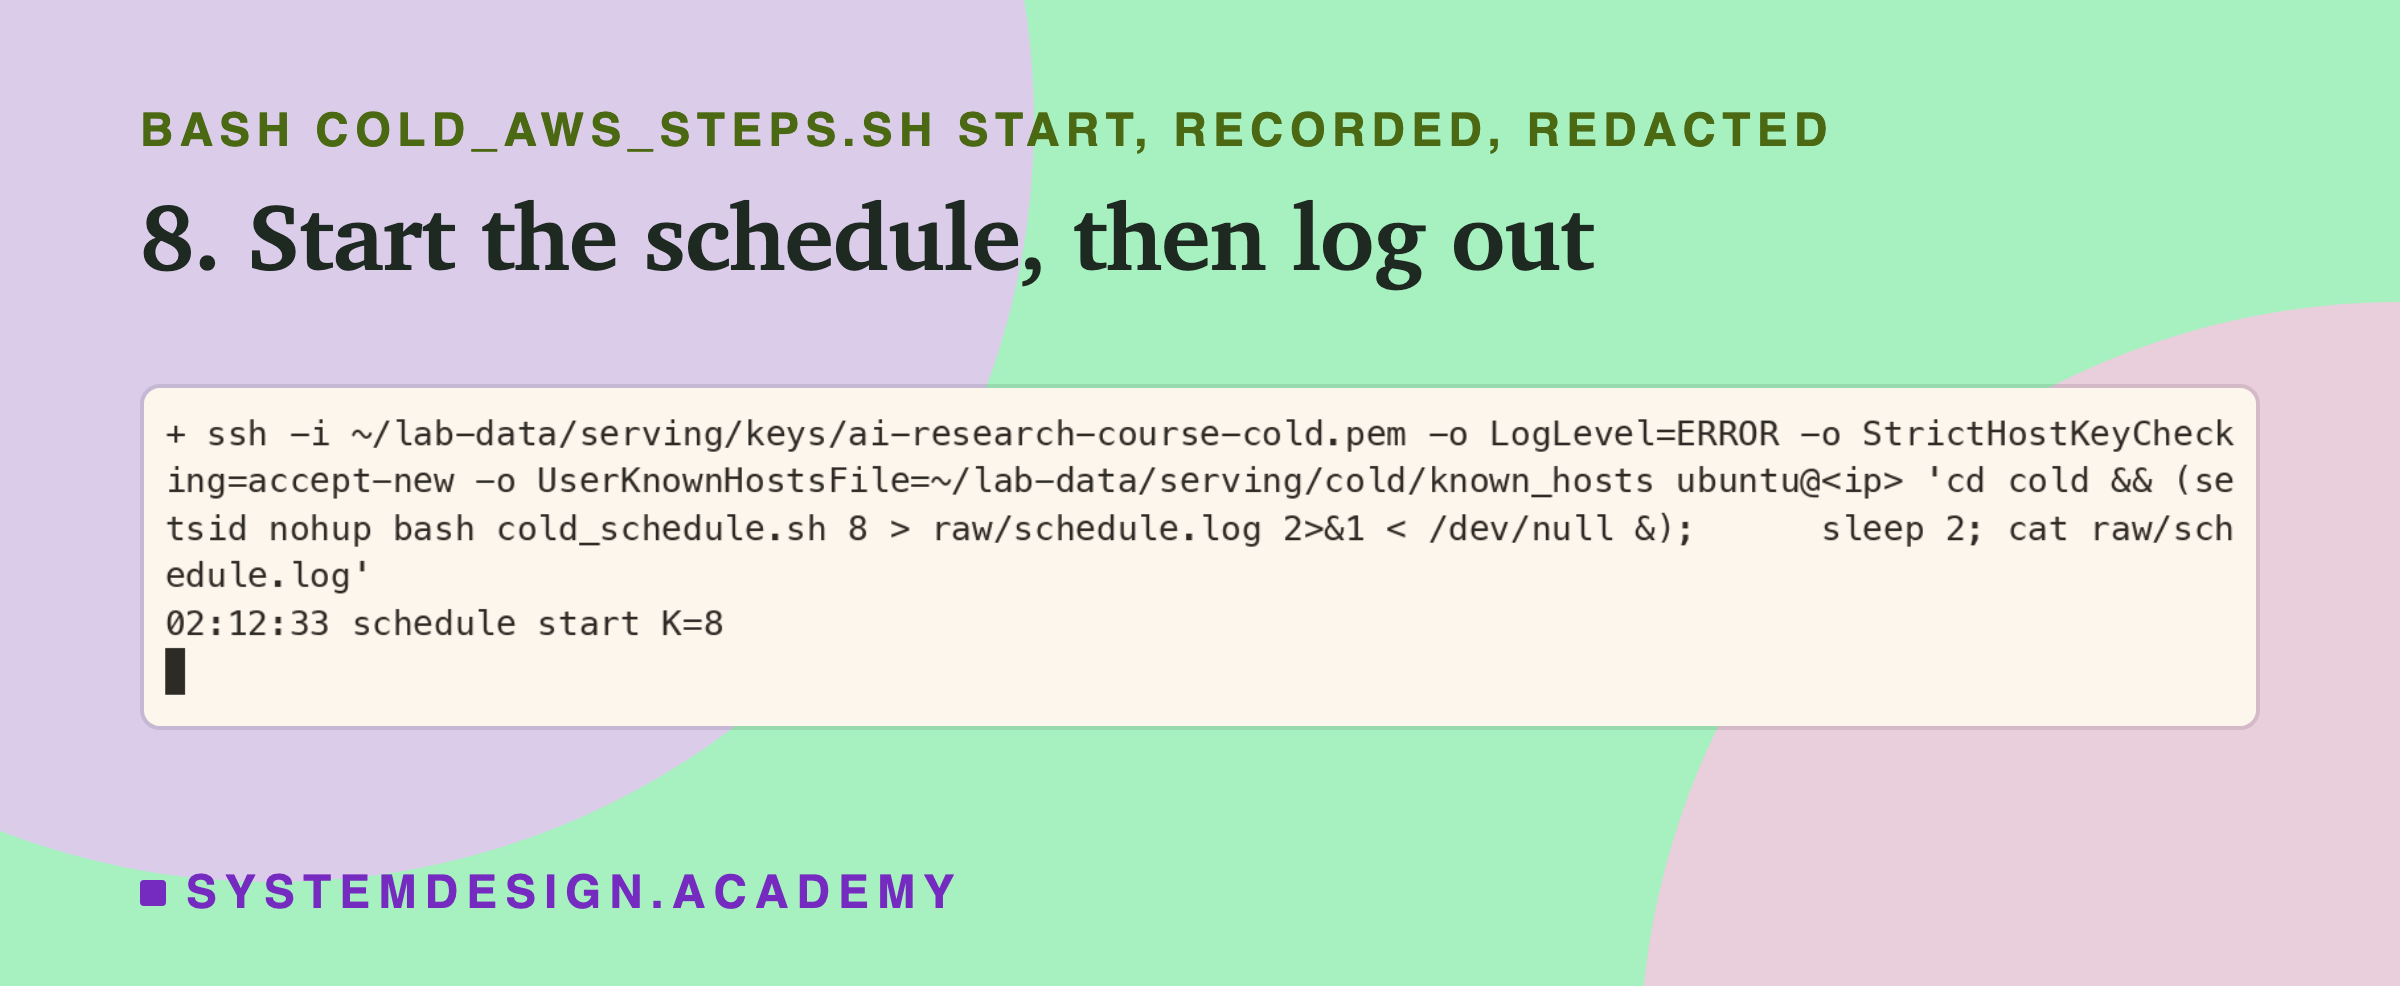
Step 9: watch without touching. The schedule writes one progress line to the box's serial console after every run. The serial console is a log that AWS keeps for the box, and you can read it through AWS without logging in.
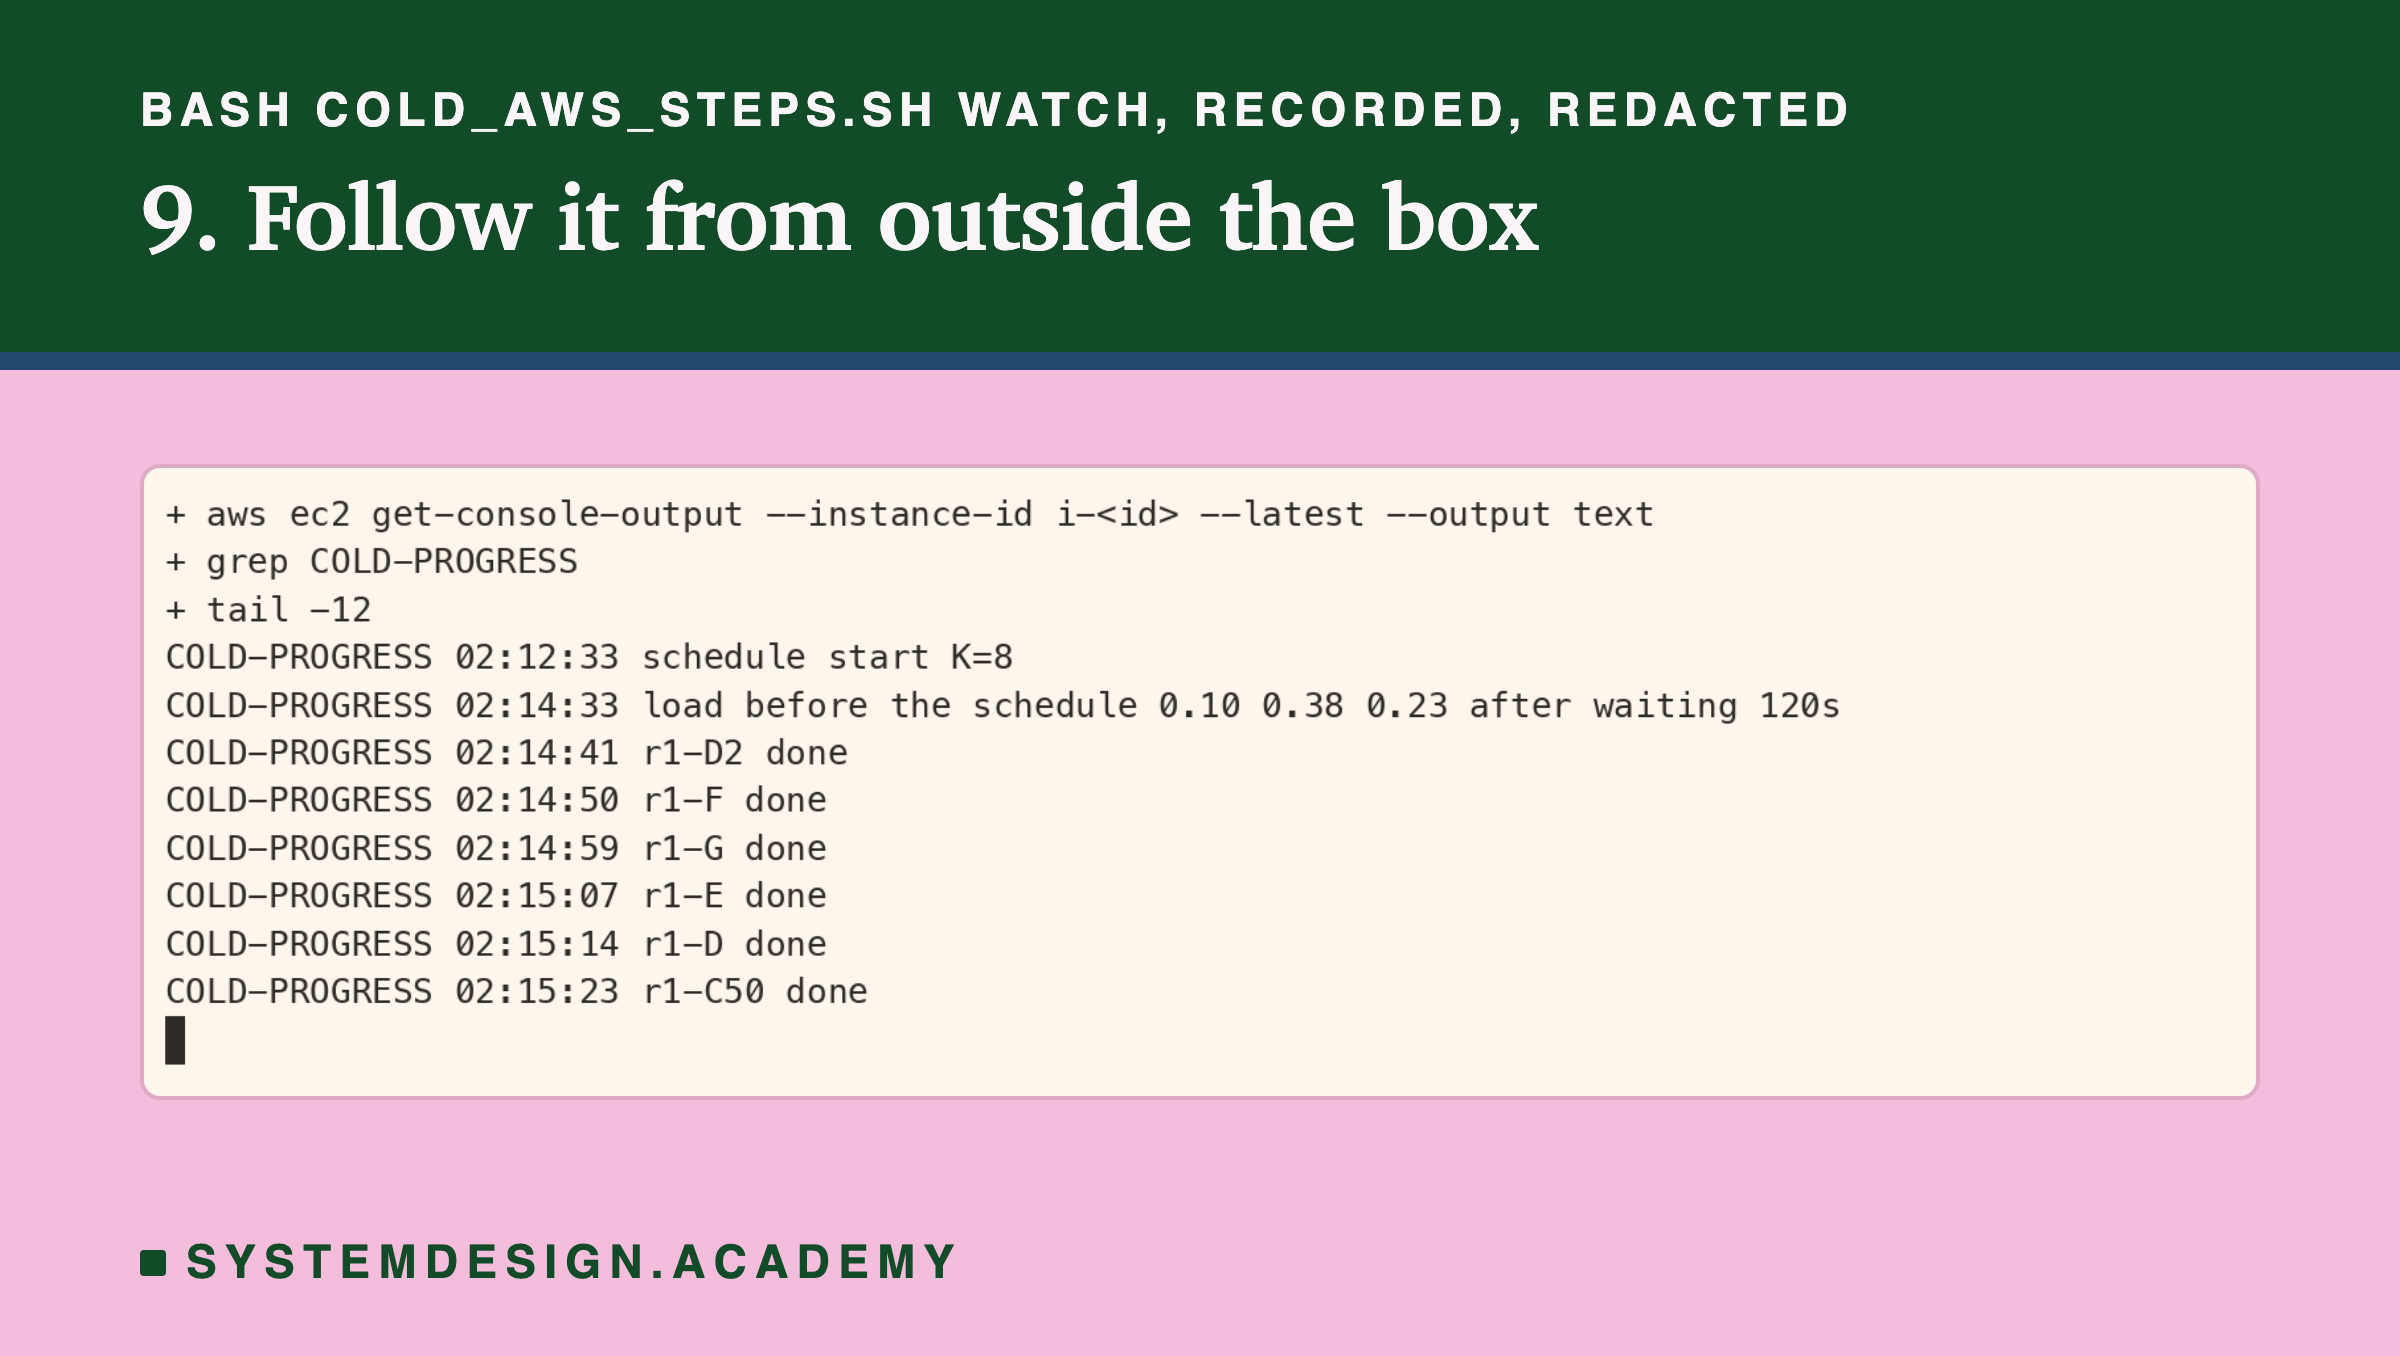
The schedule waited 120 seconds for the box to calm down, then started round 1. Each start took about eight seconds, warm-up start included. This is the command:
aws ec2 get-console-output --instance-id "$ID" --latest --output text | grep COLD-PROGRESS | tail -12
Step 12: the student demo, on the same box. After the schedule, I ran the demo you will meet later, so you can see what it prints on one core.
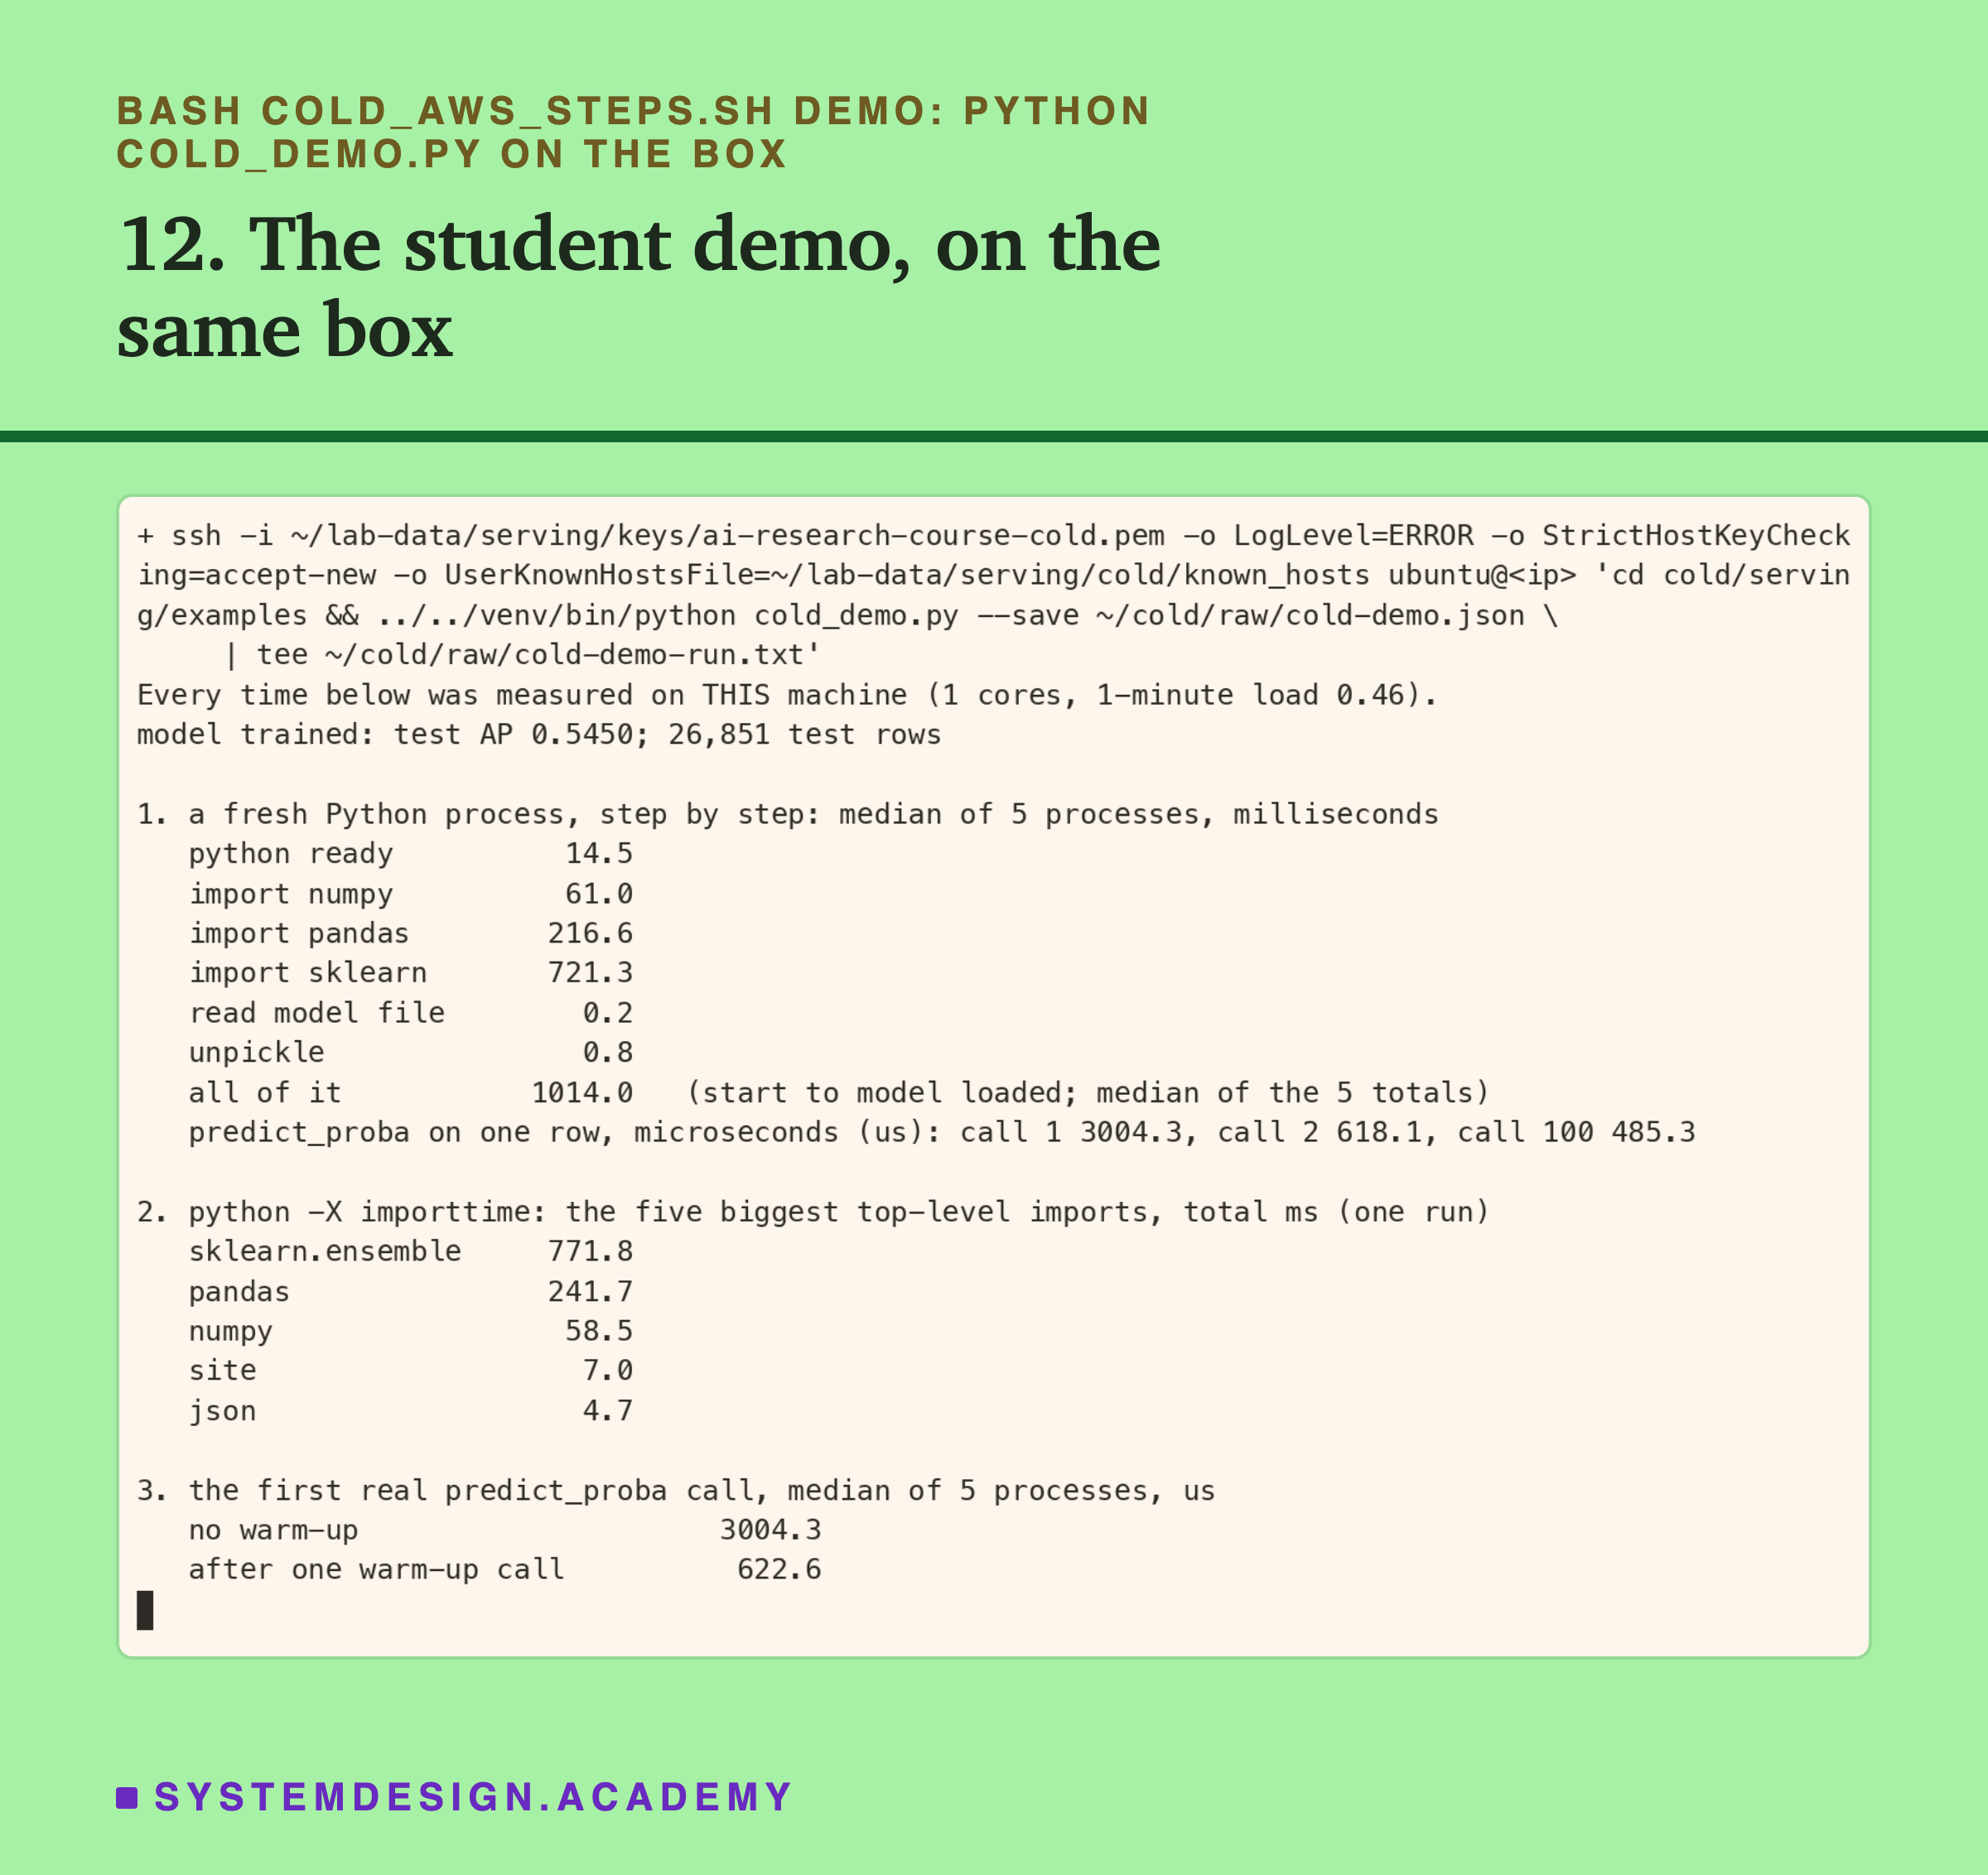
This run happened after the last timed run of the schedule, so it could not disturb any timing. The same output is stored in results/cold-demo-run.txt. This is the command:
  ssh -i ~/lab-data/serving/keys/ai-research-course-cold.pem "${SSHO[@]}" ubuntu@"$IP" \
    'cd cold/serving/examples && ../../venv/bin/python cold_demo.py --save ~/cold/raw/cold-demo.json \
     | tee ~/cold/raw/cold-demo-run.txt'
Step 13: bring the results home first. The rule from lesson 3 is: the moment the runs finish, copy the raw files back, before anything else.
The Lab's Report, Running
This is a real recording of the report script, cold_report.py. It ran on my laptop, but it times nothing. It reads the raw files the box measured and does all the arithmetic again with its own code.
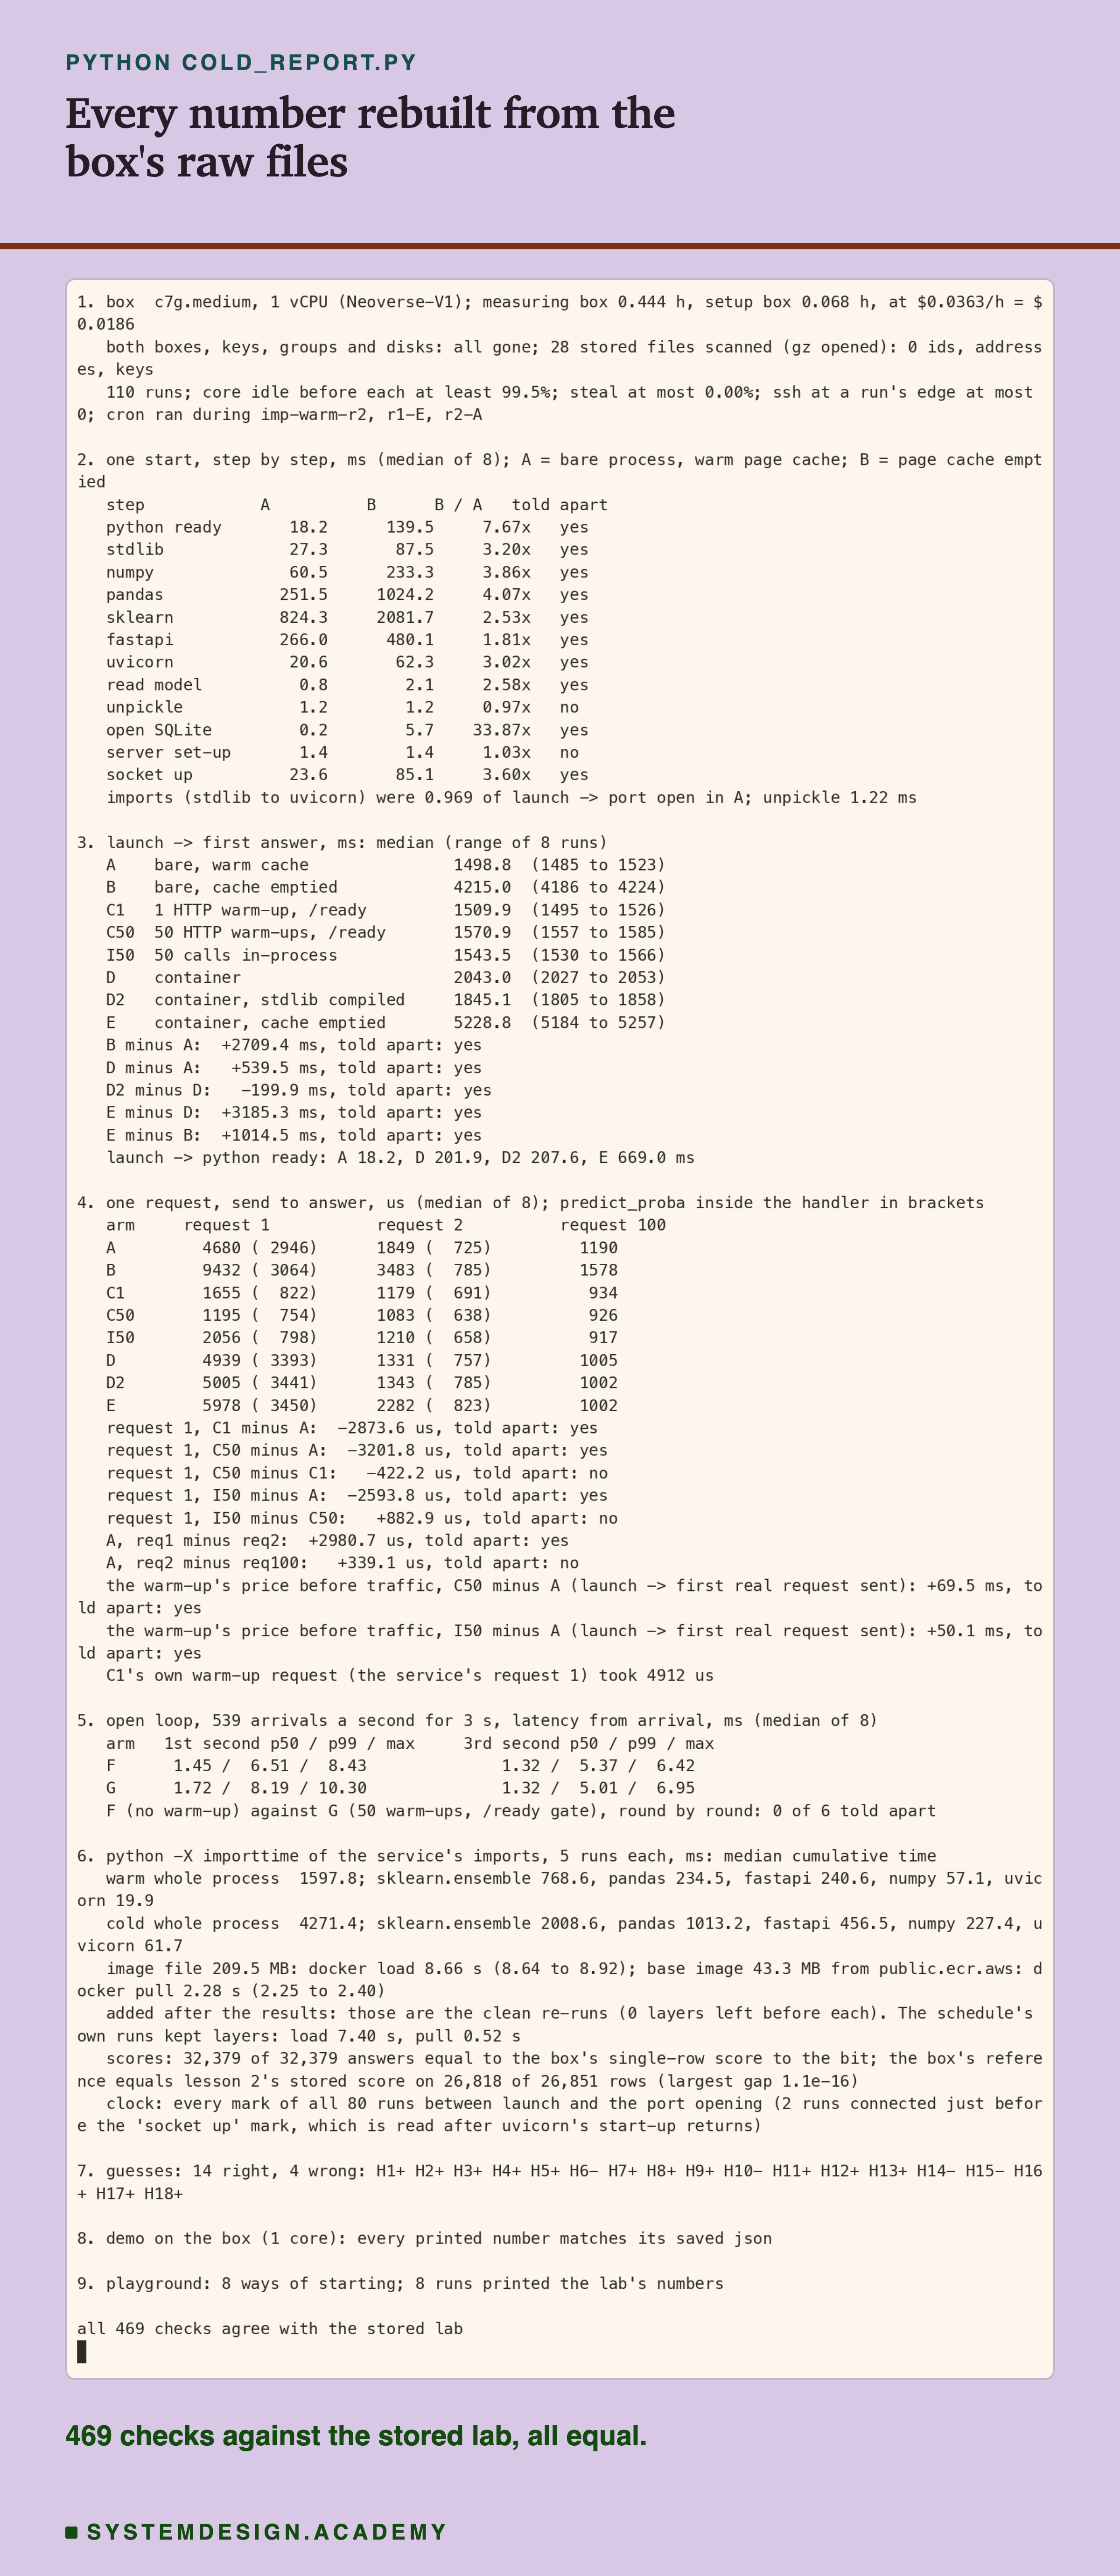
The report reads the small copy of the raw files kept in the repo, about 1.8 MB, gzipped. It computes its own steps, medians, percentiles, paired differences and verdicts, and compares every one with the lab's results file. If any number disagreed, it would stop with an error. I checked that too: I changed one number in a copy of the results file, and the report printed "2 MISMATCHES" and stopped.
The system log had 452 lines during the 110 runs. Most came from and its helper containerd starting and stopping containers, from sudo emptying the page cache, and from systemd. Nine came from cron, which still ran because I stopped only the systemd timers. They fell in three runs, and each landed inside its arm's range. r2-A answered first at 1,484.9 ms, and A's range was 1,484.9 to 1,523.2. r1-E answered at 5,236.8 ms, inside E's 5,184.4 to 5,257.0. imp-warm-r2 took 1,597.8 ms, inside the warm runs' 1,585.8 to 1,620.7.
One Clock for the Client and the Service
To split one start into steps, I need to subtract a time the client read from a time the service read. That only works if both read the same clock.
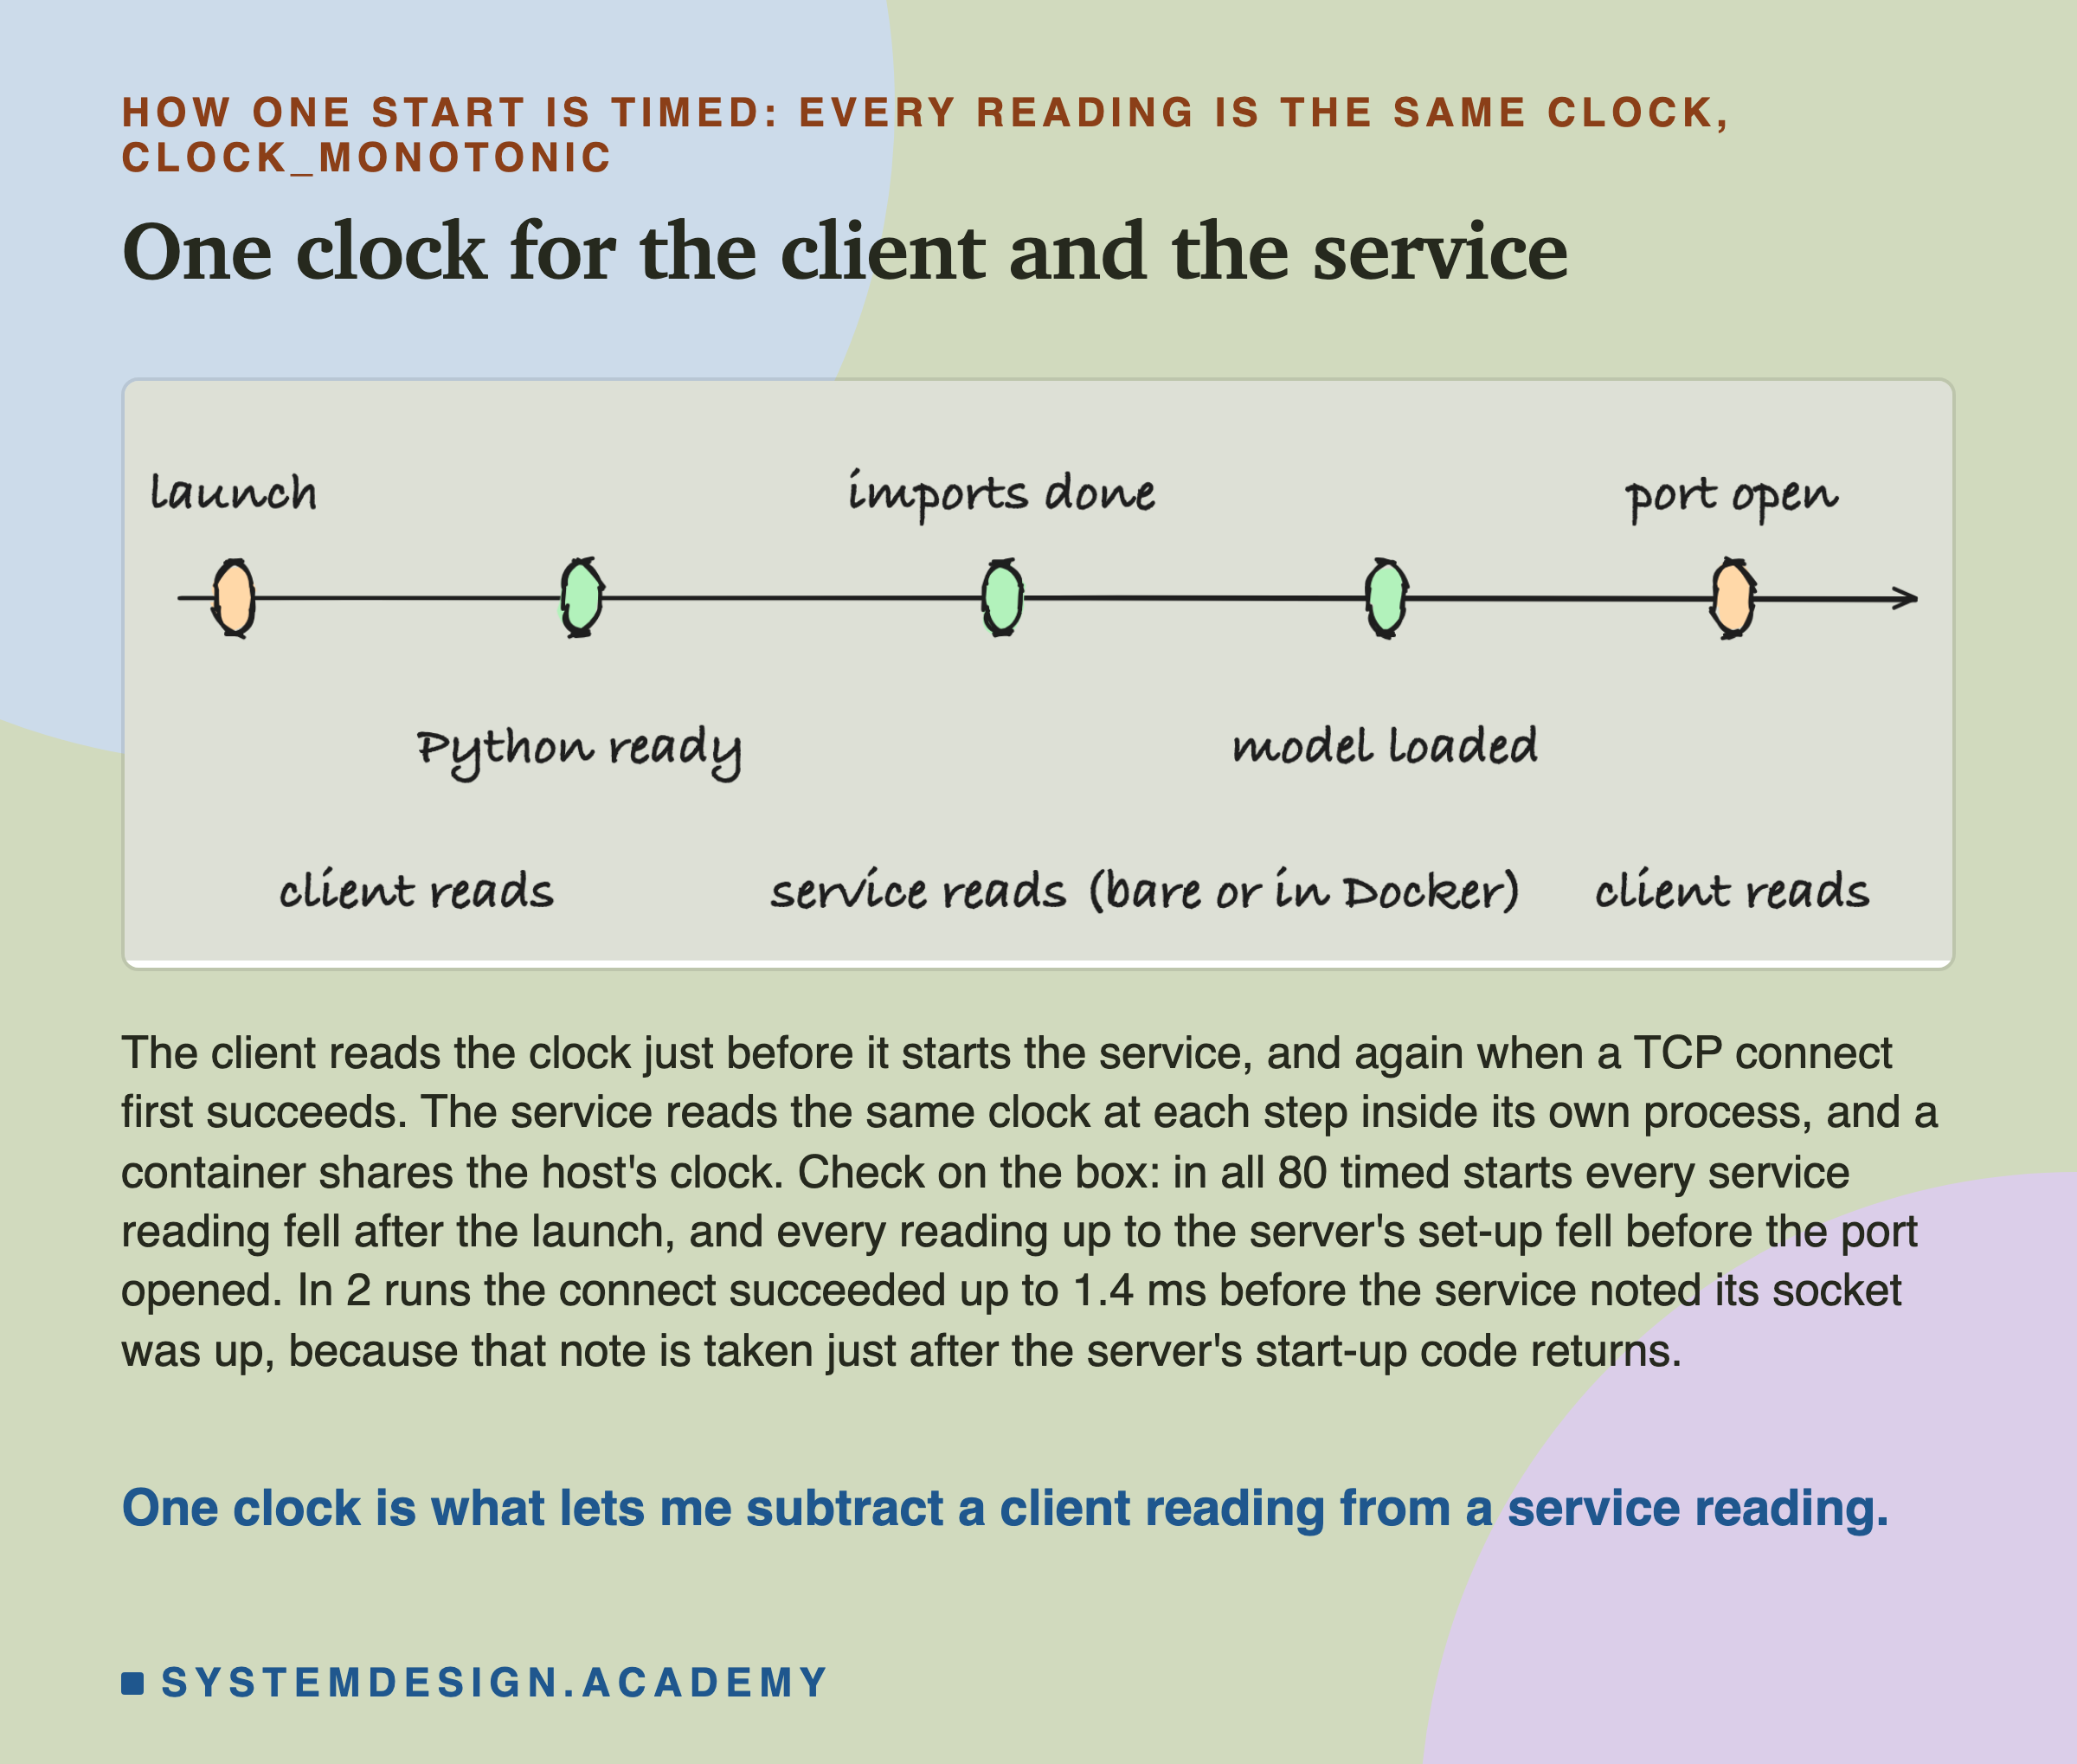
Every program here reads time.monotonic_ns(), a monotonic clock: one that only ever moves forward, so it is safe for measuring time between two readings. Python's documentation lists how it is built on each system, and on Linux it ends with "Otherwise, call clock_gettime(CLOCK_MONOTONIC)." That is one clock for the whole machine, and a container shares it unless you ask for a separate one.
I checked it on the box, not on trust. On my laptop, readings from two different Python versions did not agree, so the design asked for a check. In all 80 timed starts, every service reading came after the client's launch reading. Every reading up to the server's set-up came before the port opened.
One detail surprised me. My mark for "socket up" is read just after uvicorn's start-up code returns. The socket starts listening inside that code, so in 2 of 80 runs a connection succeeded slightly before my mark, by at most 1.4 ms. The clocks agreed; my mark was simply a little late. I changed the check to stop at the server's set-up, and I say so in the lab's notes.
Where One Start's 1.5 Seconds Went
Now arm A, the plain case, step by step. Each block is one step of the start. Its height is the median time over eight runs.
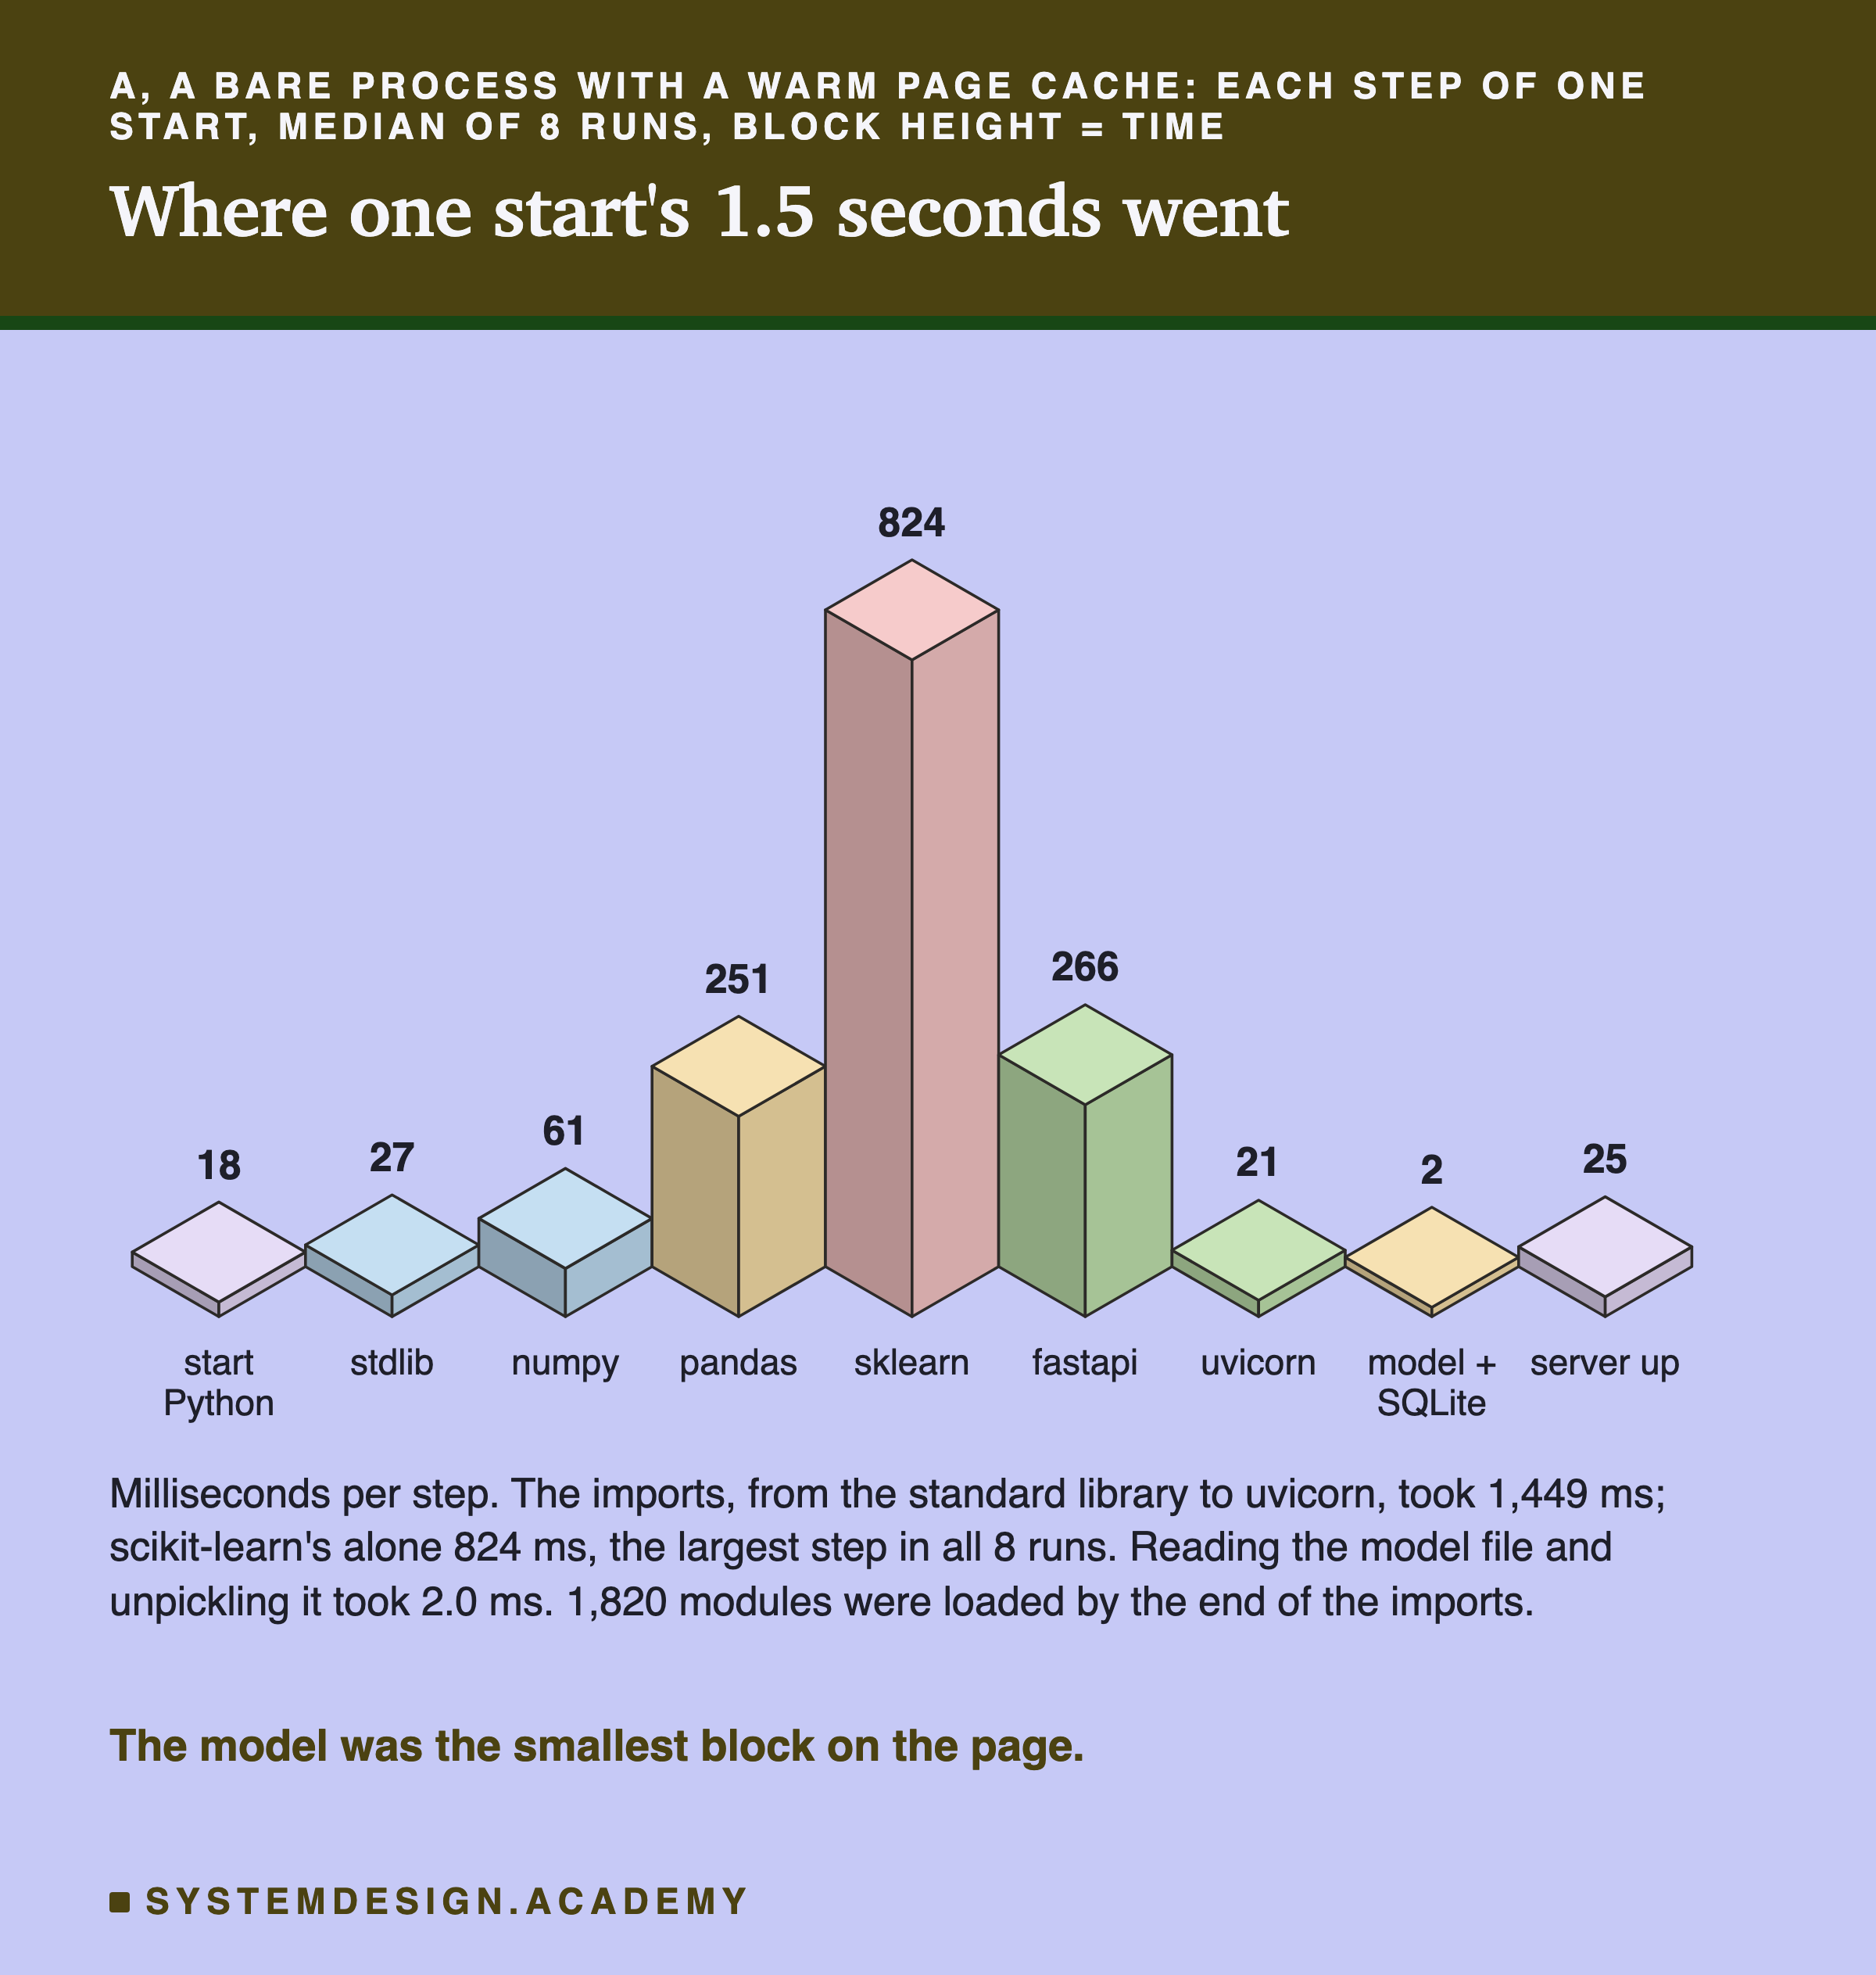
Starting Python took 18 ms. That is from the client's launch to the first line of my service file.
Then came the imports, 1,449 ms in all. numpy took 61 ms, pandas 251, scikit-learn's ensemble module 824, FastAPI and pydantic 266, and uvicorn 21. By the end, 1,820 Python modules were loaded. I import pandas on its own line before scikit-learn only to show its time separately; scikit-learn would import it anyway.
Loading the model took 2.0 ms: 0.8 ms to read the file's bytes and 1.2 ms to unpickle them. The model is small, about 200 KB, and its class was already imported. Opening SQLite took 0.2 ms, and starting the server and its socket, the network end point that clients connect to, took about 25 ms.
So the model is not the slow part of starting this service. The libraries around it are. A bigger model would change the picture, and I come back to that in the limits.
Which Library Cost What
To check the import times another way, I asked Python itself. Python's -X importtime option prints the time of every import, with "cumulative time (including nested imports) and self time (excluding nested imports)".
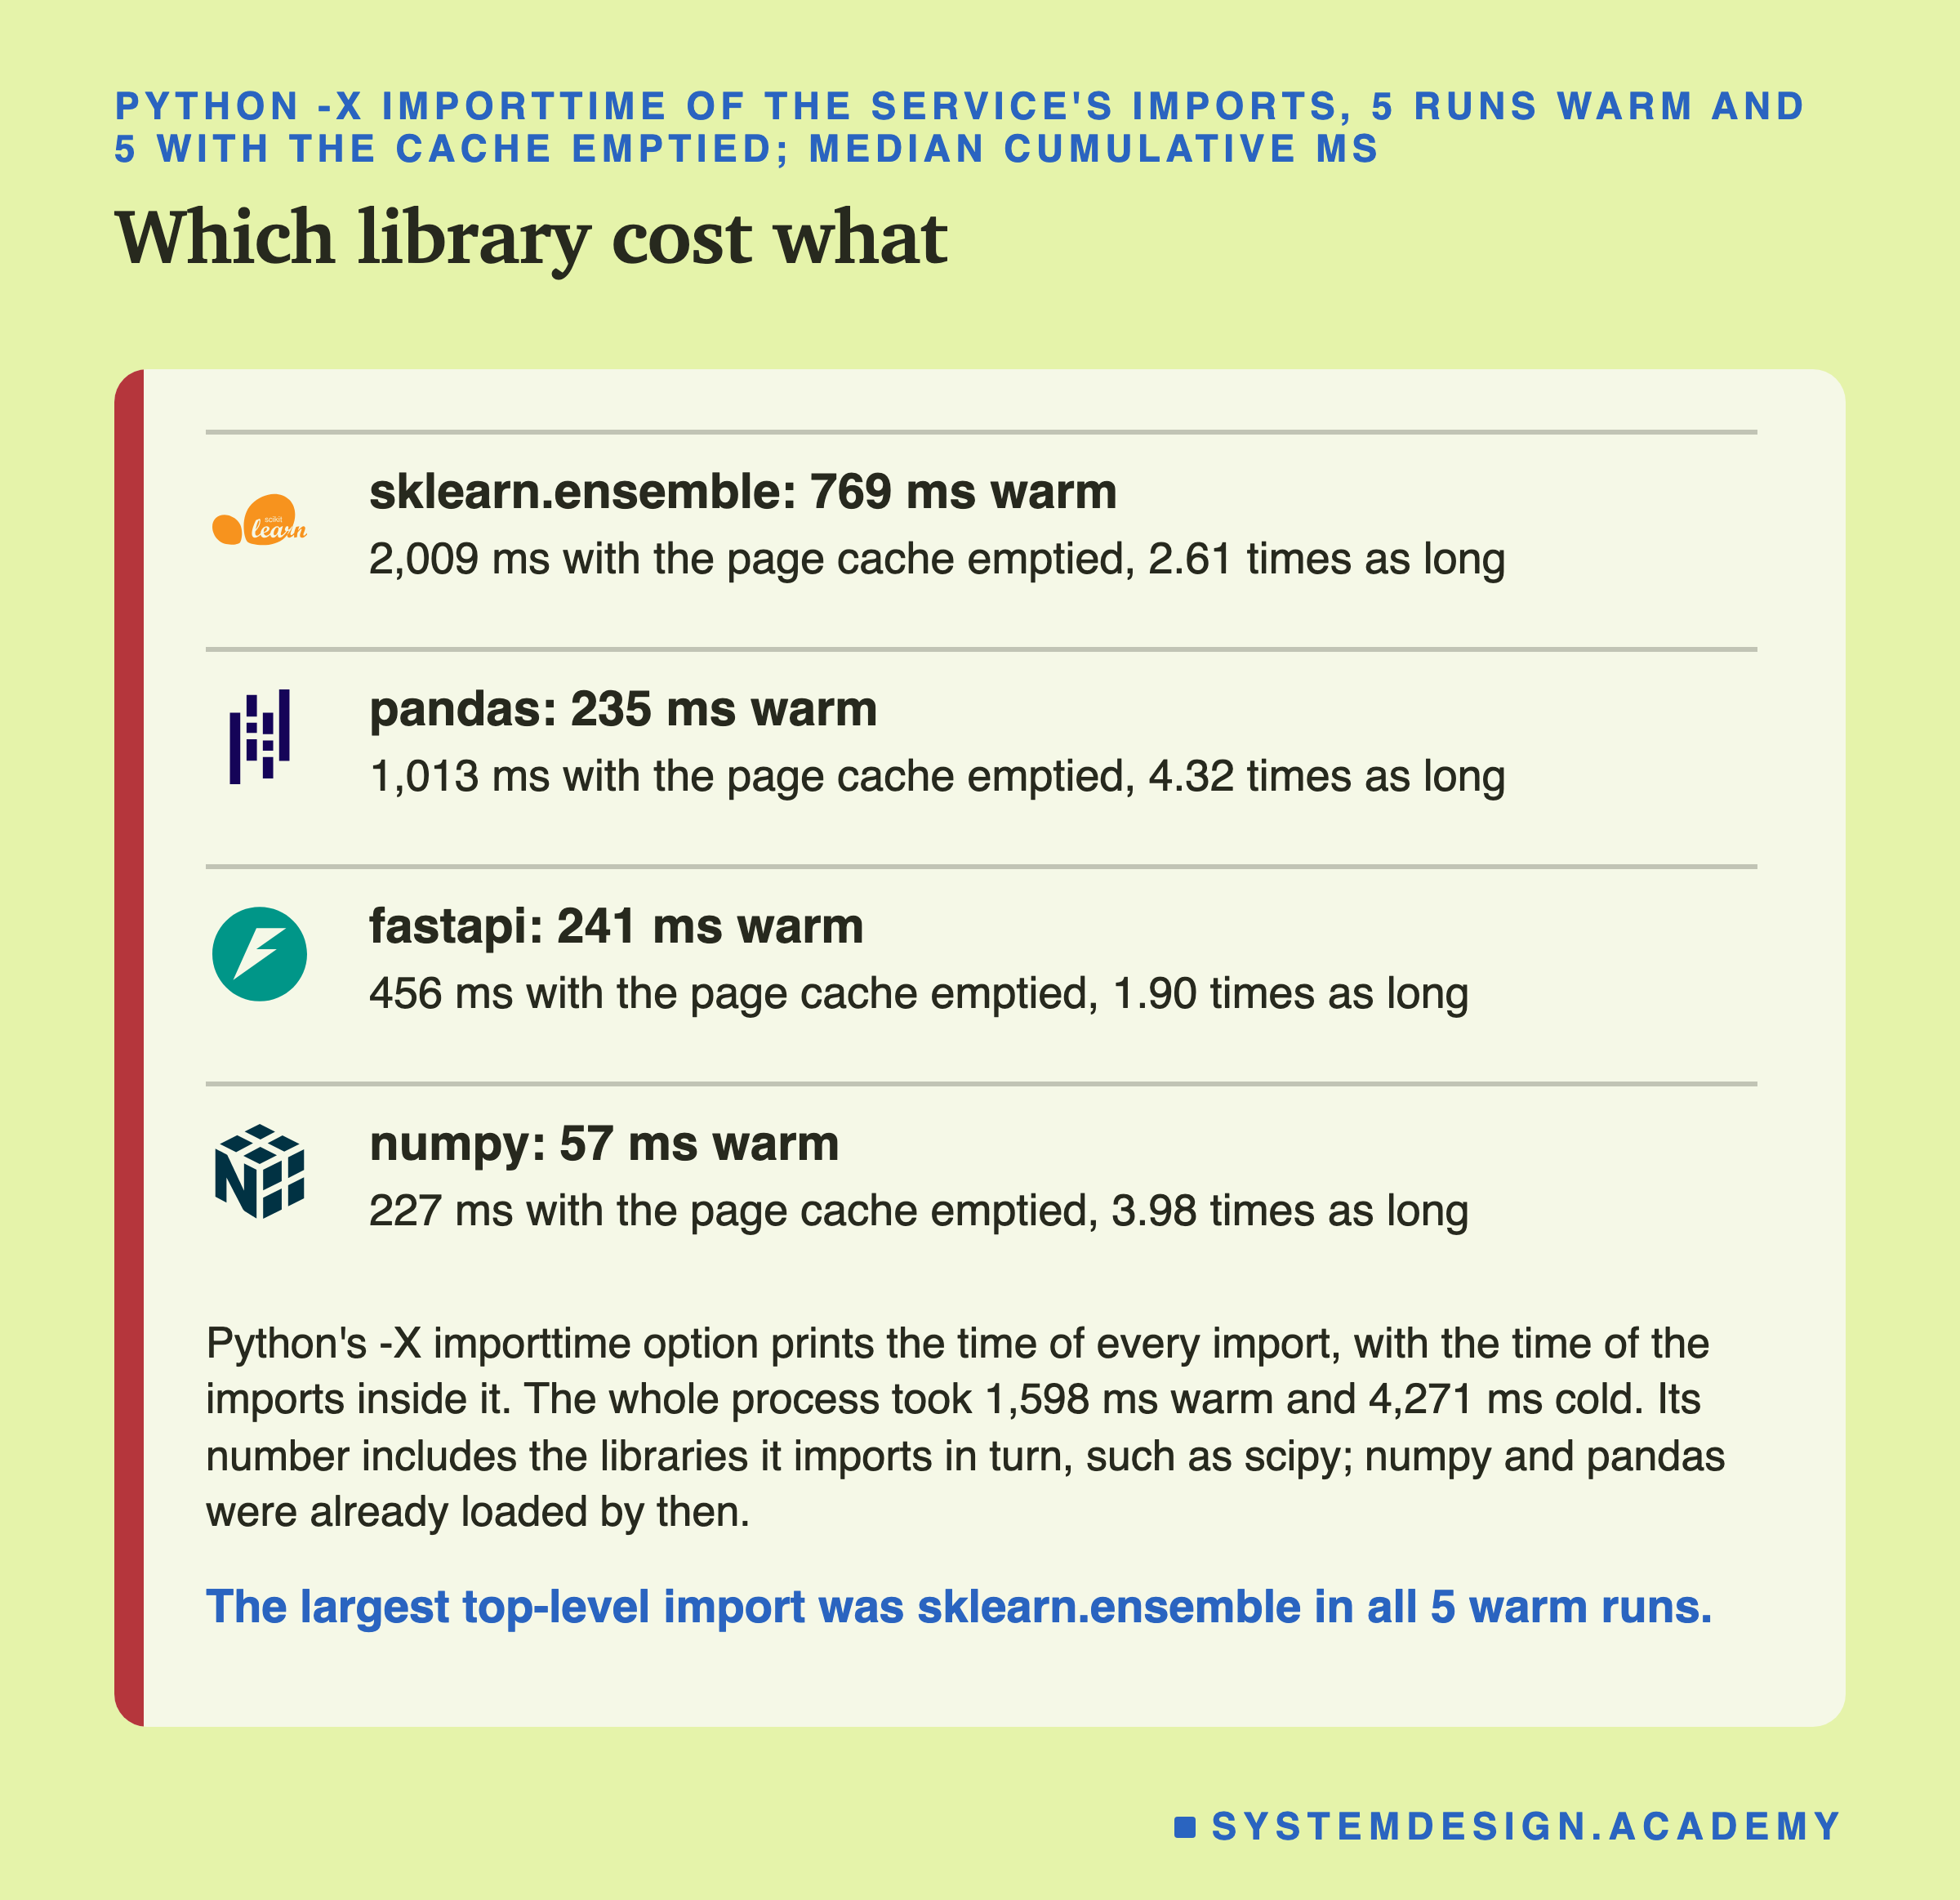
I ran it ten times: five with the files in memory and five with the page cache emptied, in a shuffled order. The order of imports matched the service: numpy, then pandas, then scikit-learn, then FastAPI and uvicorn.
scikit-learn's ensemble module was the largest in every run: 769 ms warm. It imports scipy and many of its own parts inside it, which all count in its number. pandas took 235 ms and FastAPI 241. These agree with my own clock marks to within about ten percent, so the two ways of measuring tell the same story.
With the page cache emptied, every library took longer, from 1.90 times for FastAPI to 4.32 times for pandas. The whole process took 4,271 ms instead of 1,598.
An Empty Page Cache Made Almost Every Step Slower
Arm B starts the same bare service, but just before the start I empty the page cache: sync; echo 3 > /proc/sys/vm/drop_caches. The kernel's documentation says writing to this file "will cause the kernel to drop clean caches". Its advice is to run sync first, so that more pages are clean and can be dropped.
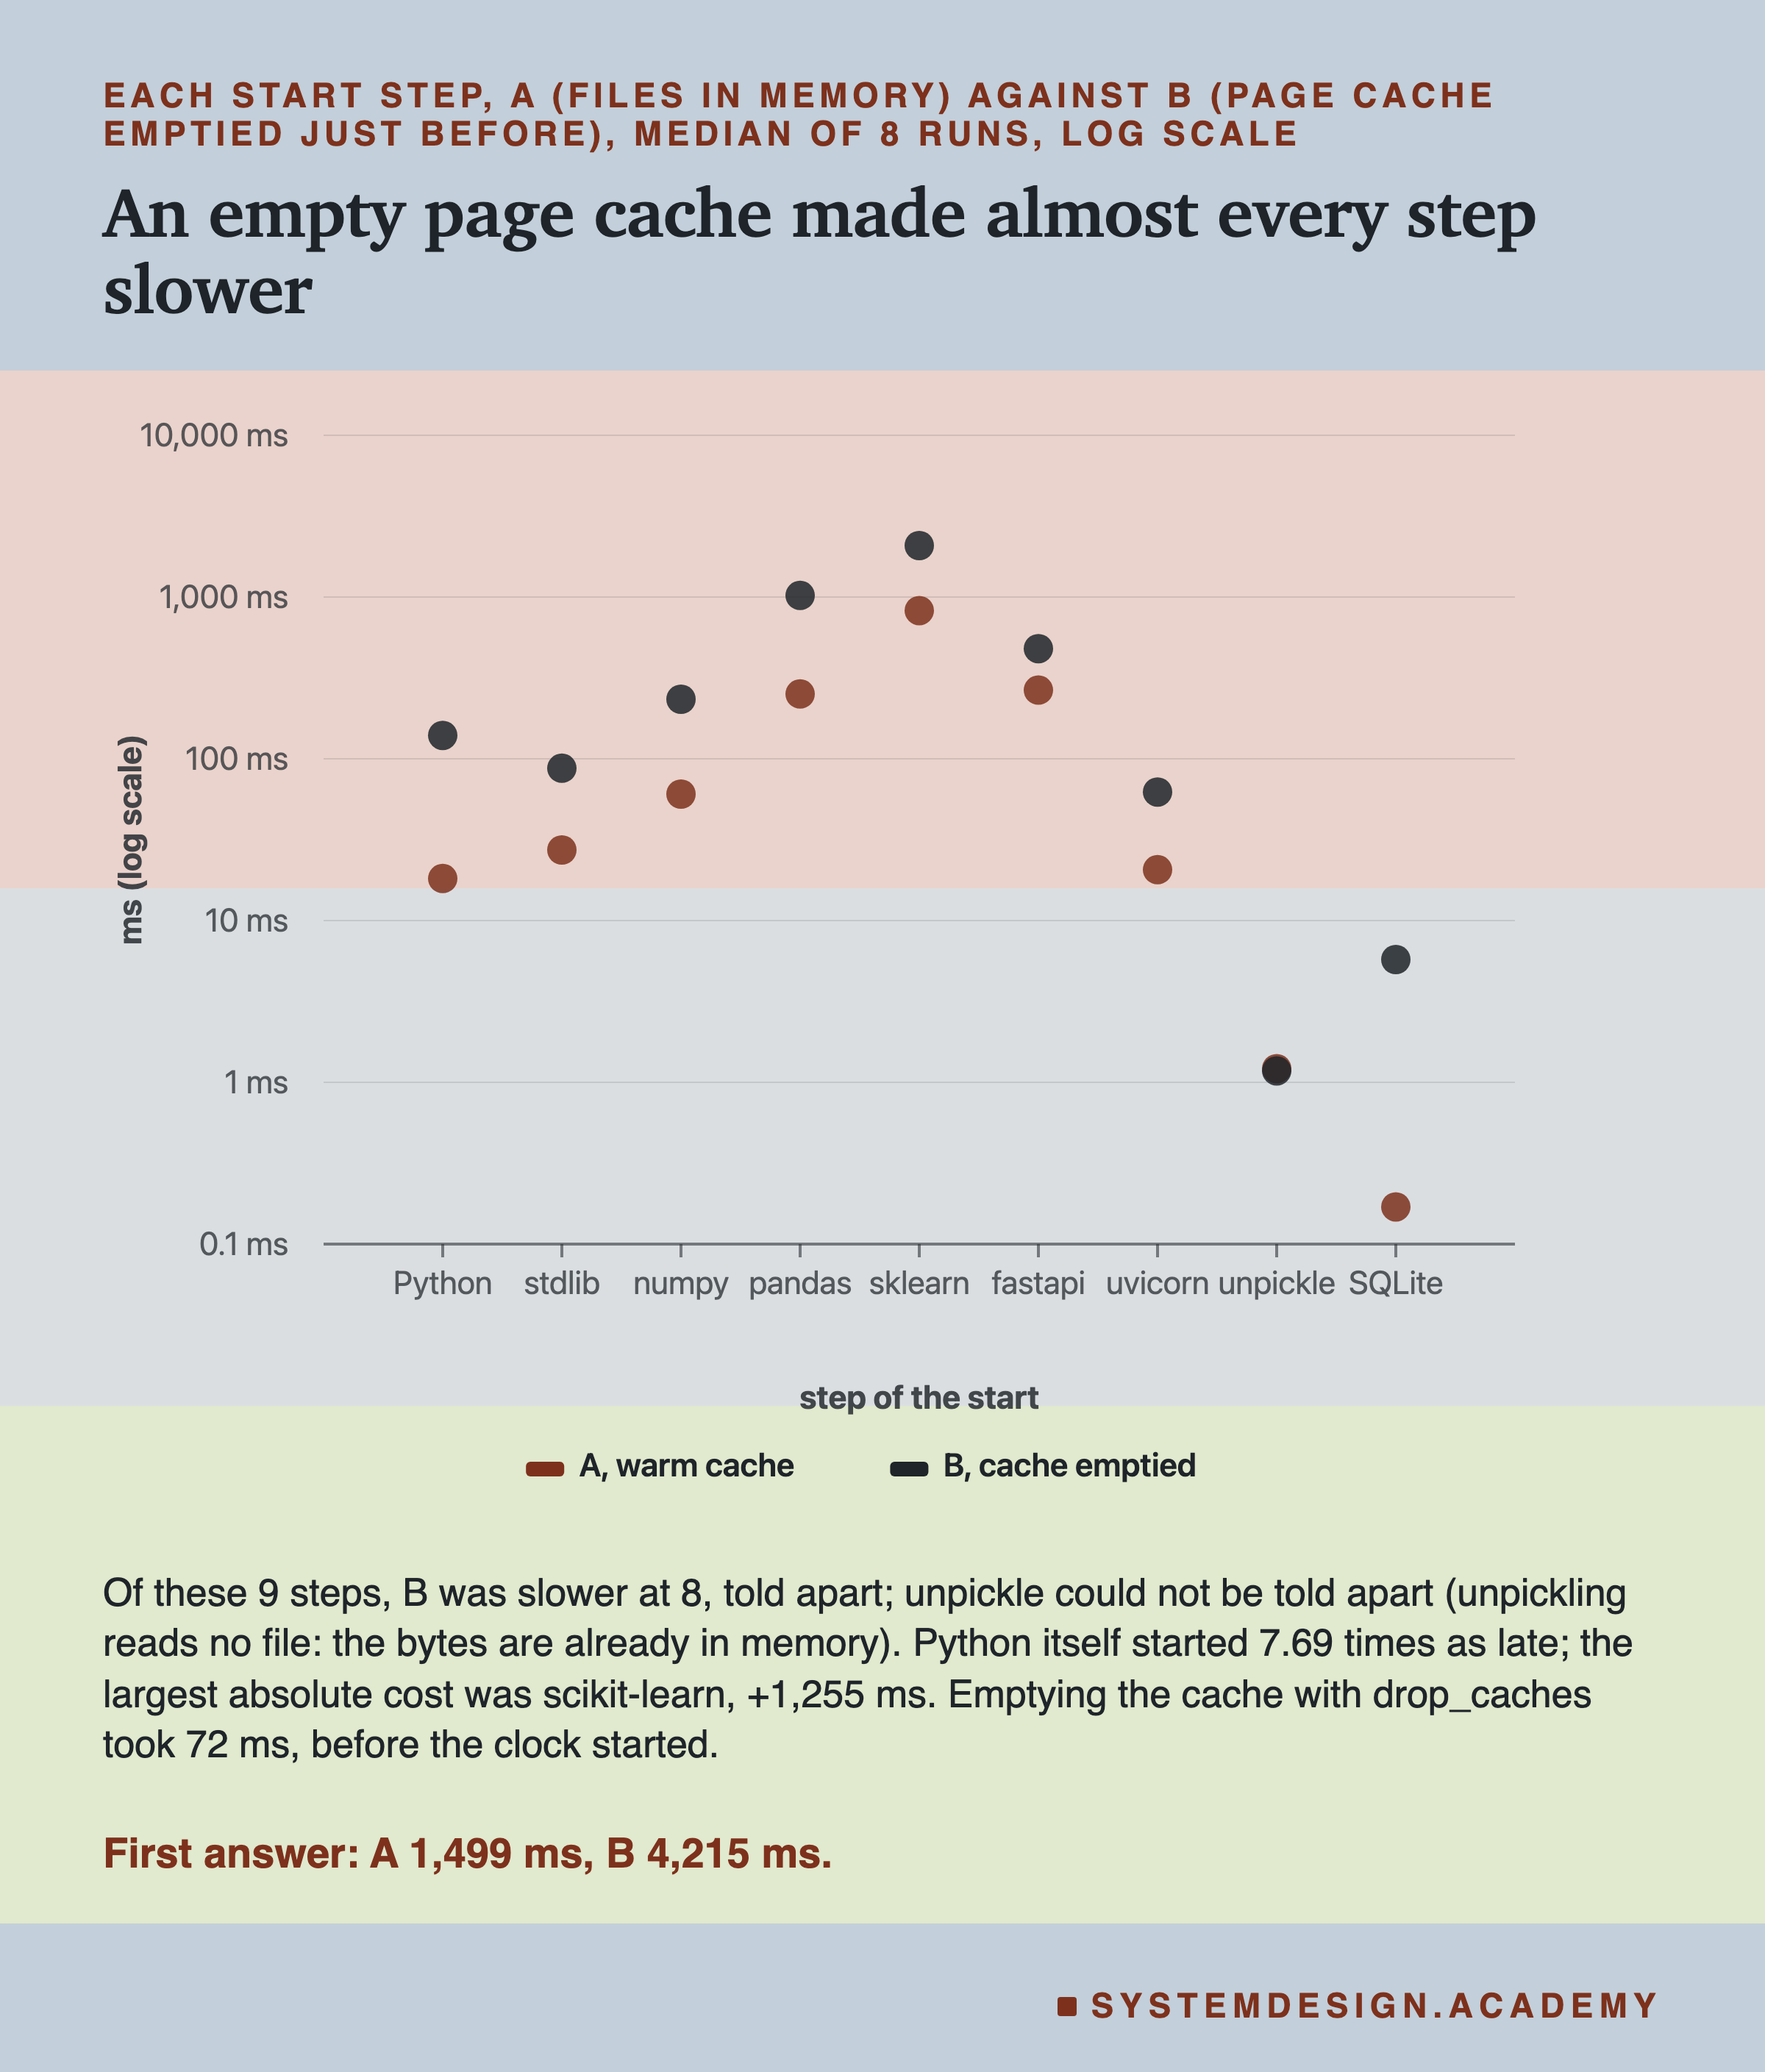
The whole start took 4,215 ms instead of 1,499: 2.81 times as long, told apart. Every step that reads files from disk got slower. Python itself took 140 ms to start instead of 18, because its own program and standard library had to come from the disk. scikit-learn's import cost the most extra time: 1,255 ms more.
Unpickling did not change: 1.2 ms in both. It reads no file. The bytes were already read in the step before, which did get slower, from 0.8 ms to 2.1.
What does a cold cache mean in real life? It is a machine whose memory does not hold these files: just after a reboot, or after other work has pushed them out. It is not a brand-new disk made from a snapshot. AWS fetches such a disk's blocks from storage on first read, which can be much slower. I did not measure that case.
The first request was slower in B too: 9,432 us against 4,680 (not a declared comparison; B's lowest, 9,115 us, was above A's highest, 5,770). Its own request path had files left to read.
What the Container Added
Now arms D and D2. The service, the model and the packages are the same, but the service runs in a container: docker run -d --rm --network host. The option --network host lets the container use the box's own network, so the client connects the same way.
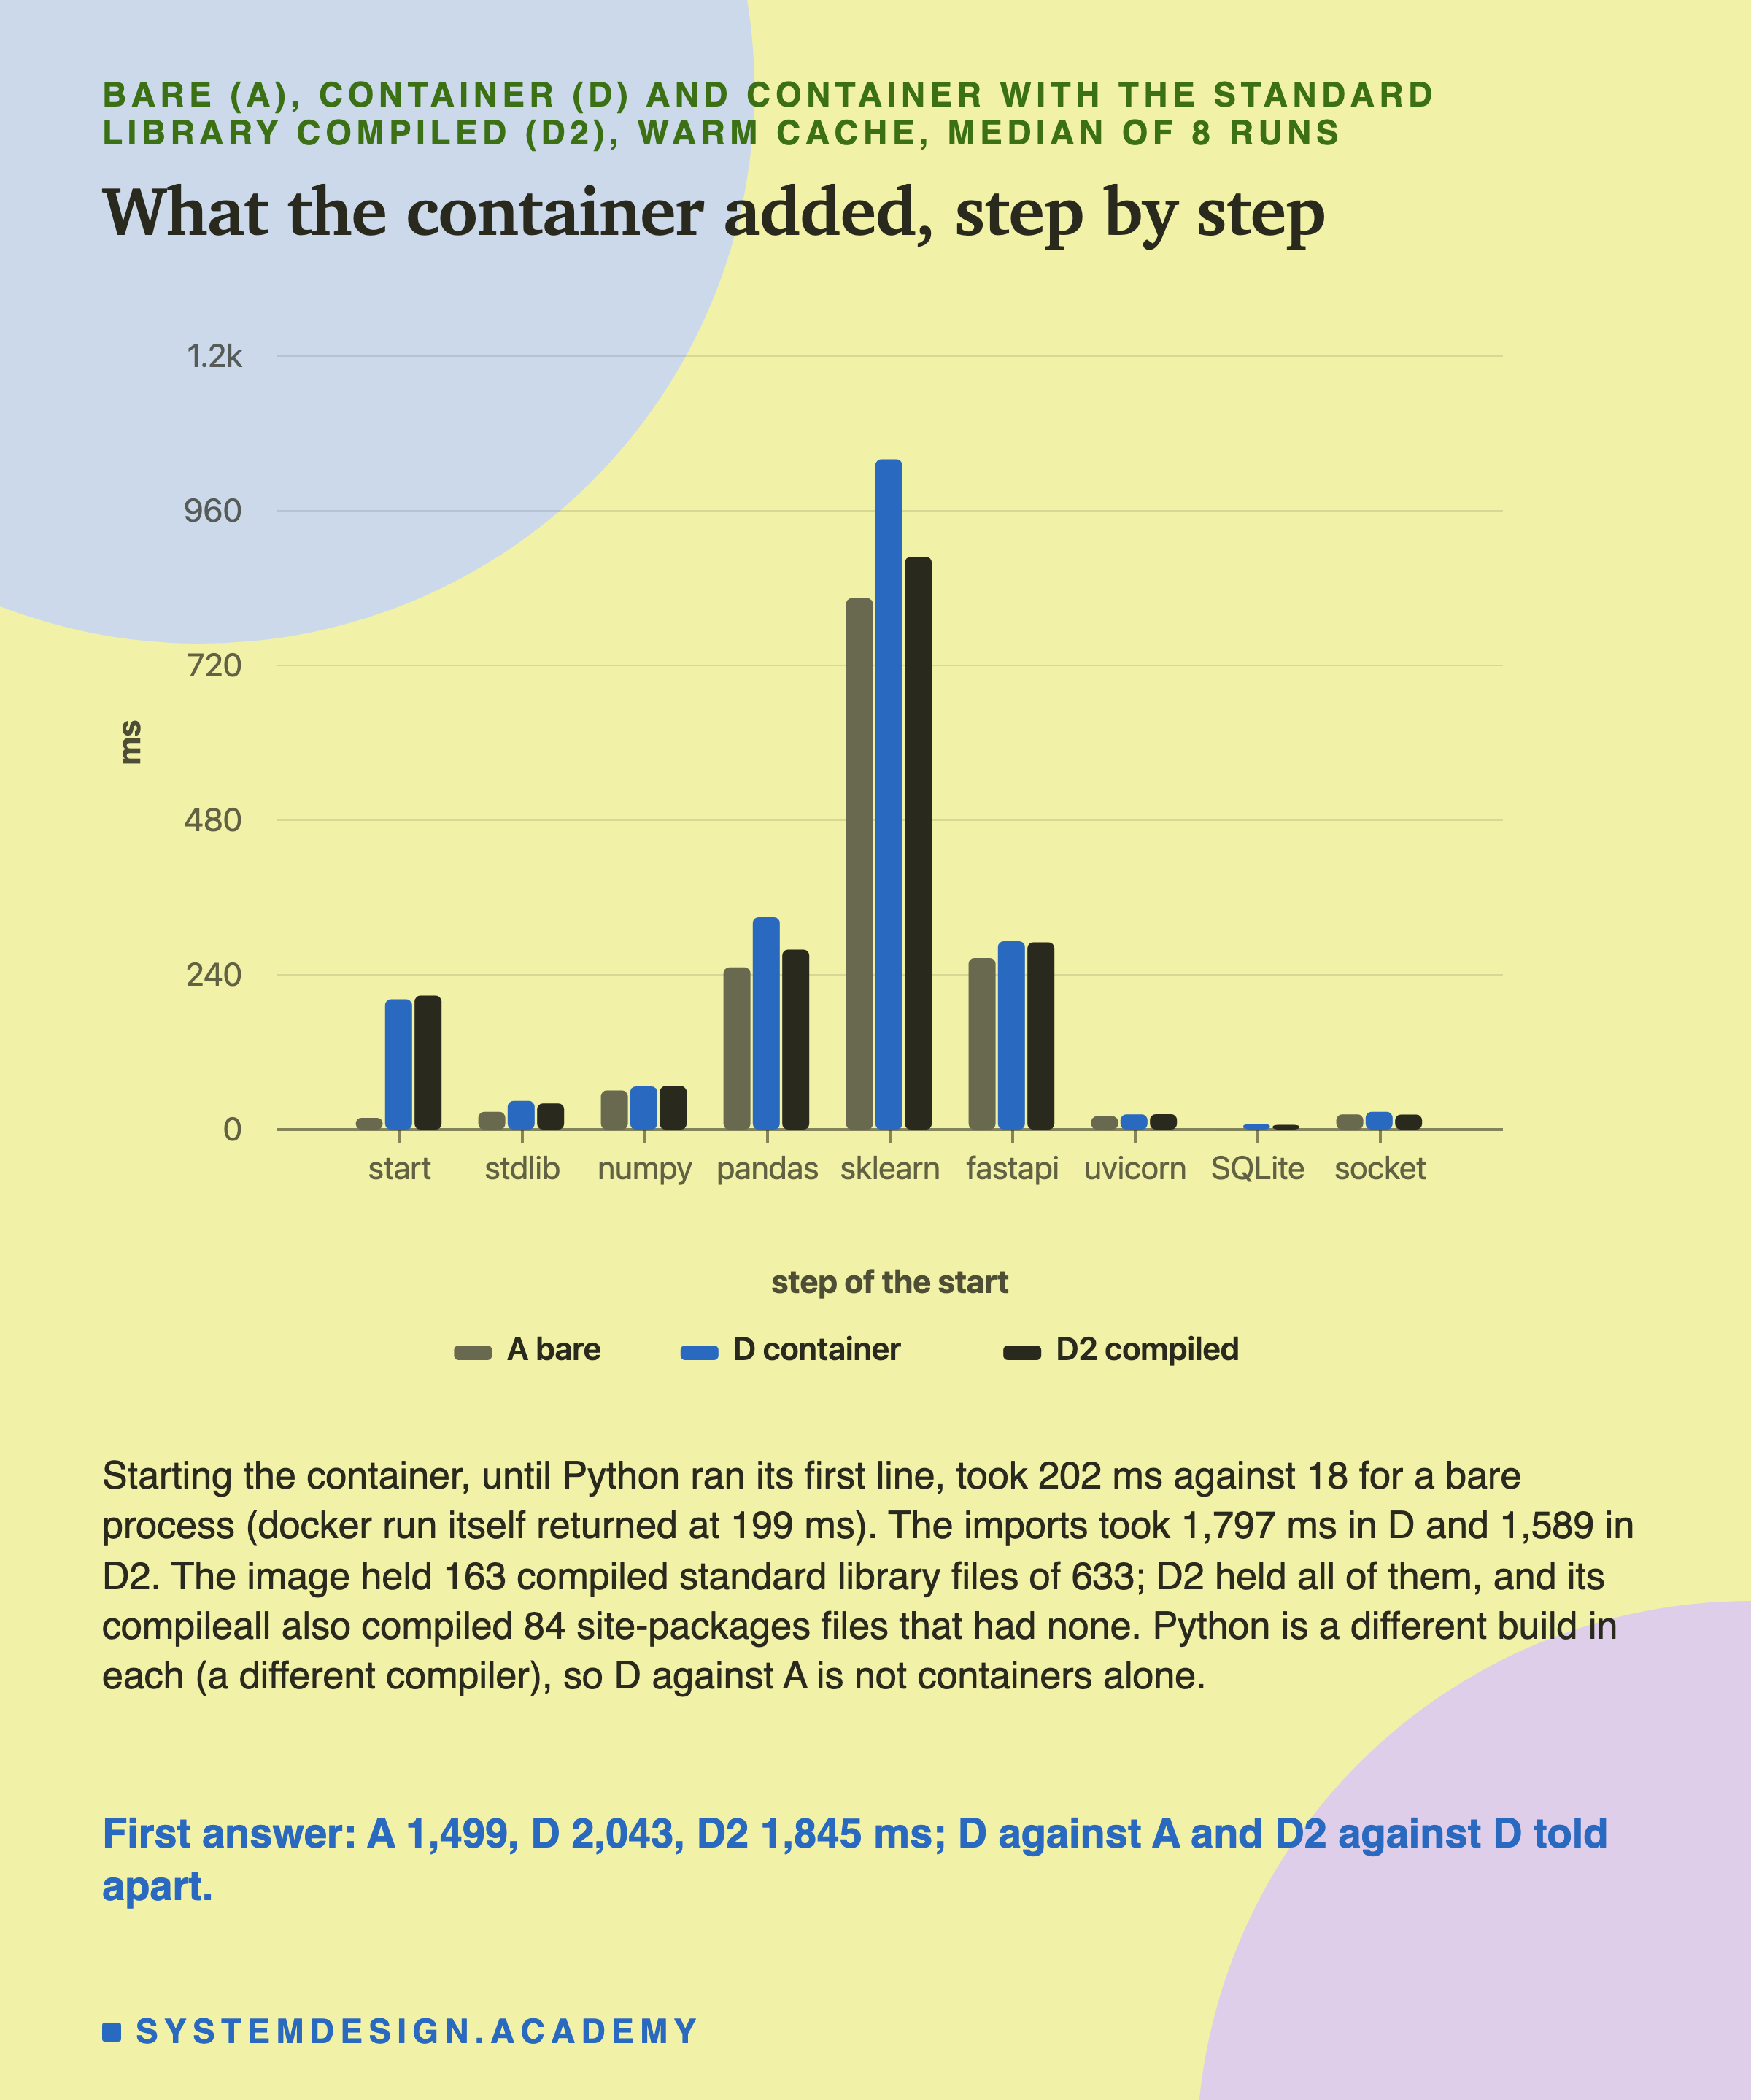
The container's first answer came 539 ms later than the bare process's, told apart. The container image's Python is a different build, so this is the container and the build together, not separated. Two parts make up most of it.
First, starting the container took 202 ms before Python ran a line, against 18 ms for a bare process. has to set up the container's files, its limits and its process. The docker run command itself returned at 199 ms.
Second, the imports took 348 ms longer: 1,797 ms against 1,449. Here a detail of the image matters. A container started with --rm gets a fresh, thin writable layer every time, and the layer is thrown away when it stops. Docker's documentation says: "When you create a new container, you add a new writable layer on top of the underlying layers." So a .pyc file that Python writes during one start is gone at the next.
Most of the standard library had no .pyc files in the image. The box counted 163 compiled files out of 633 standard library modules. The official slim image ships none; pip compiled the ones it used itself during the build.
Getting the Image onto the Machine
A container cannot start until its image is on the machine. When a new machine joins, it must first get the image, from a file or from a registry, which is a server that stores images.
The schedule measured both: docker load of my image from a file, and docker pull of the base image from AWS's public copy of 's official images. Each one started from a machine with no images, and an emptied page cache.
The first try was not what the design asked for, and I found it only by looking at the numbers. Each pull took about 0.5 seconds.
That made me check, and containerd's store still held the base image's layers. containerd is the program under Docker that keeps images and runs containers; Docker 29's release notes say "containerd image store is now the default for fresh installs". The build in step 6 had left the base image's layers in that store. Docker's build cache, which keeps pieces of earlier builds to make later builds faster, was holding them. Removing the images removed their names, not their layers, which were still on disk. So "pull" found everything locally, and "load" found most of it too.
So I repeated both, on the same box, after the demo. This block was added after the results, and it is not in the recordings: I started it over SSH. Its script, cold_files/cold_image_again.sh, also empties the build cache. Blobs are the stored files that layers and image descriptions are kept in. Before each timed run the script checks that containerd's store holds 0 blobs, and all ten runs started from 0.
Loading my 209.5 MB image file took 8.66 seconds (8.64 to 8.92 over five runs). Pulling the base image, 43.3 MB as Docker reports it, took 2.28 seconds (2.25 to 2.40). The first, unclean try gave 7.40 and 0.52 seconds; I keep those numbers in the results, labelled, and I do not use them.
So on a new machine, getting the image can cost several times the start itself. A full pull of my own image from a registry far away would cost more. I did not measure that, because I have no registry for my image, and making one would be a new resource.
The First Request Paid About Three Milliseconds More
Back to the service once it has started. In arm A, the client sends 100 real requests, one at a time, as soon as the port opens. How does the first compare with the rest?
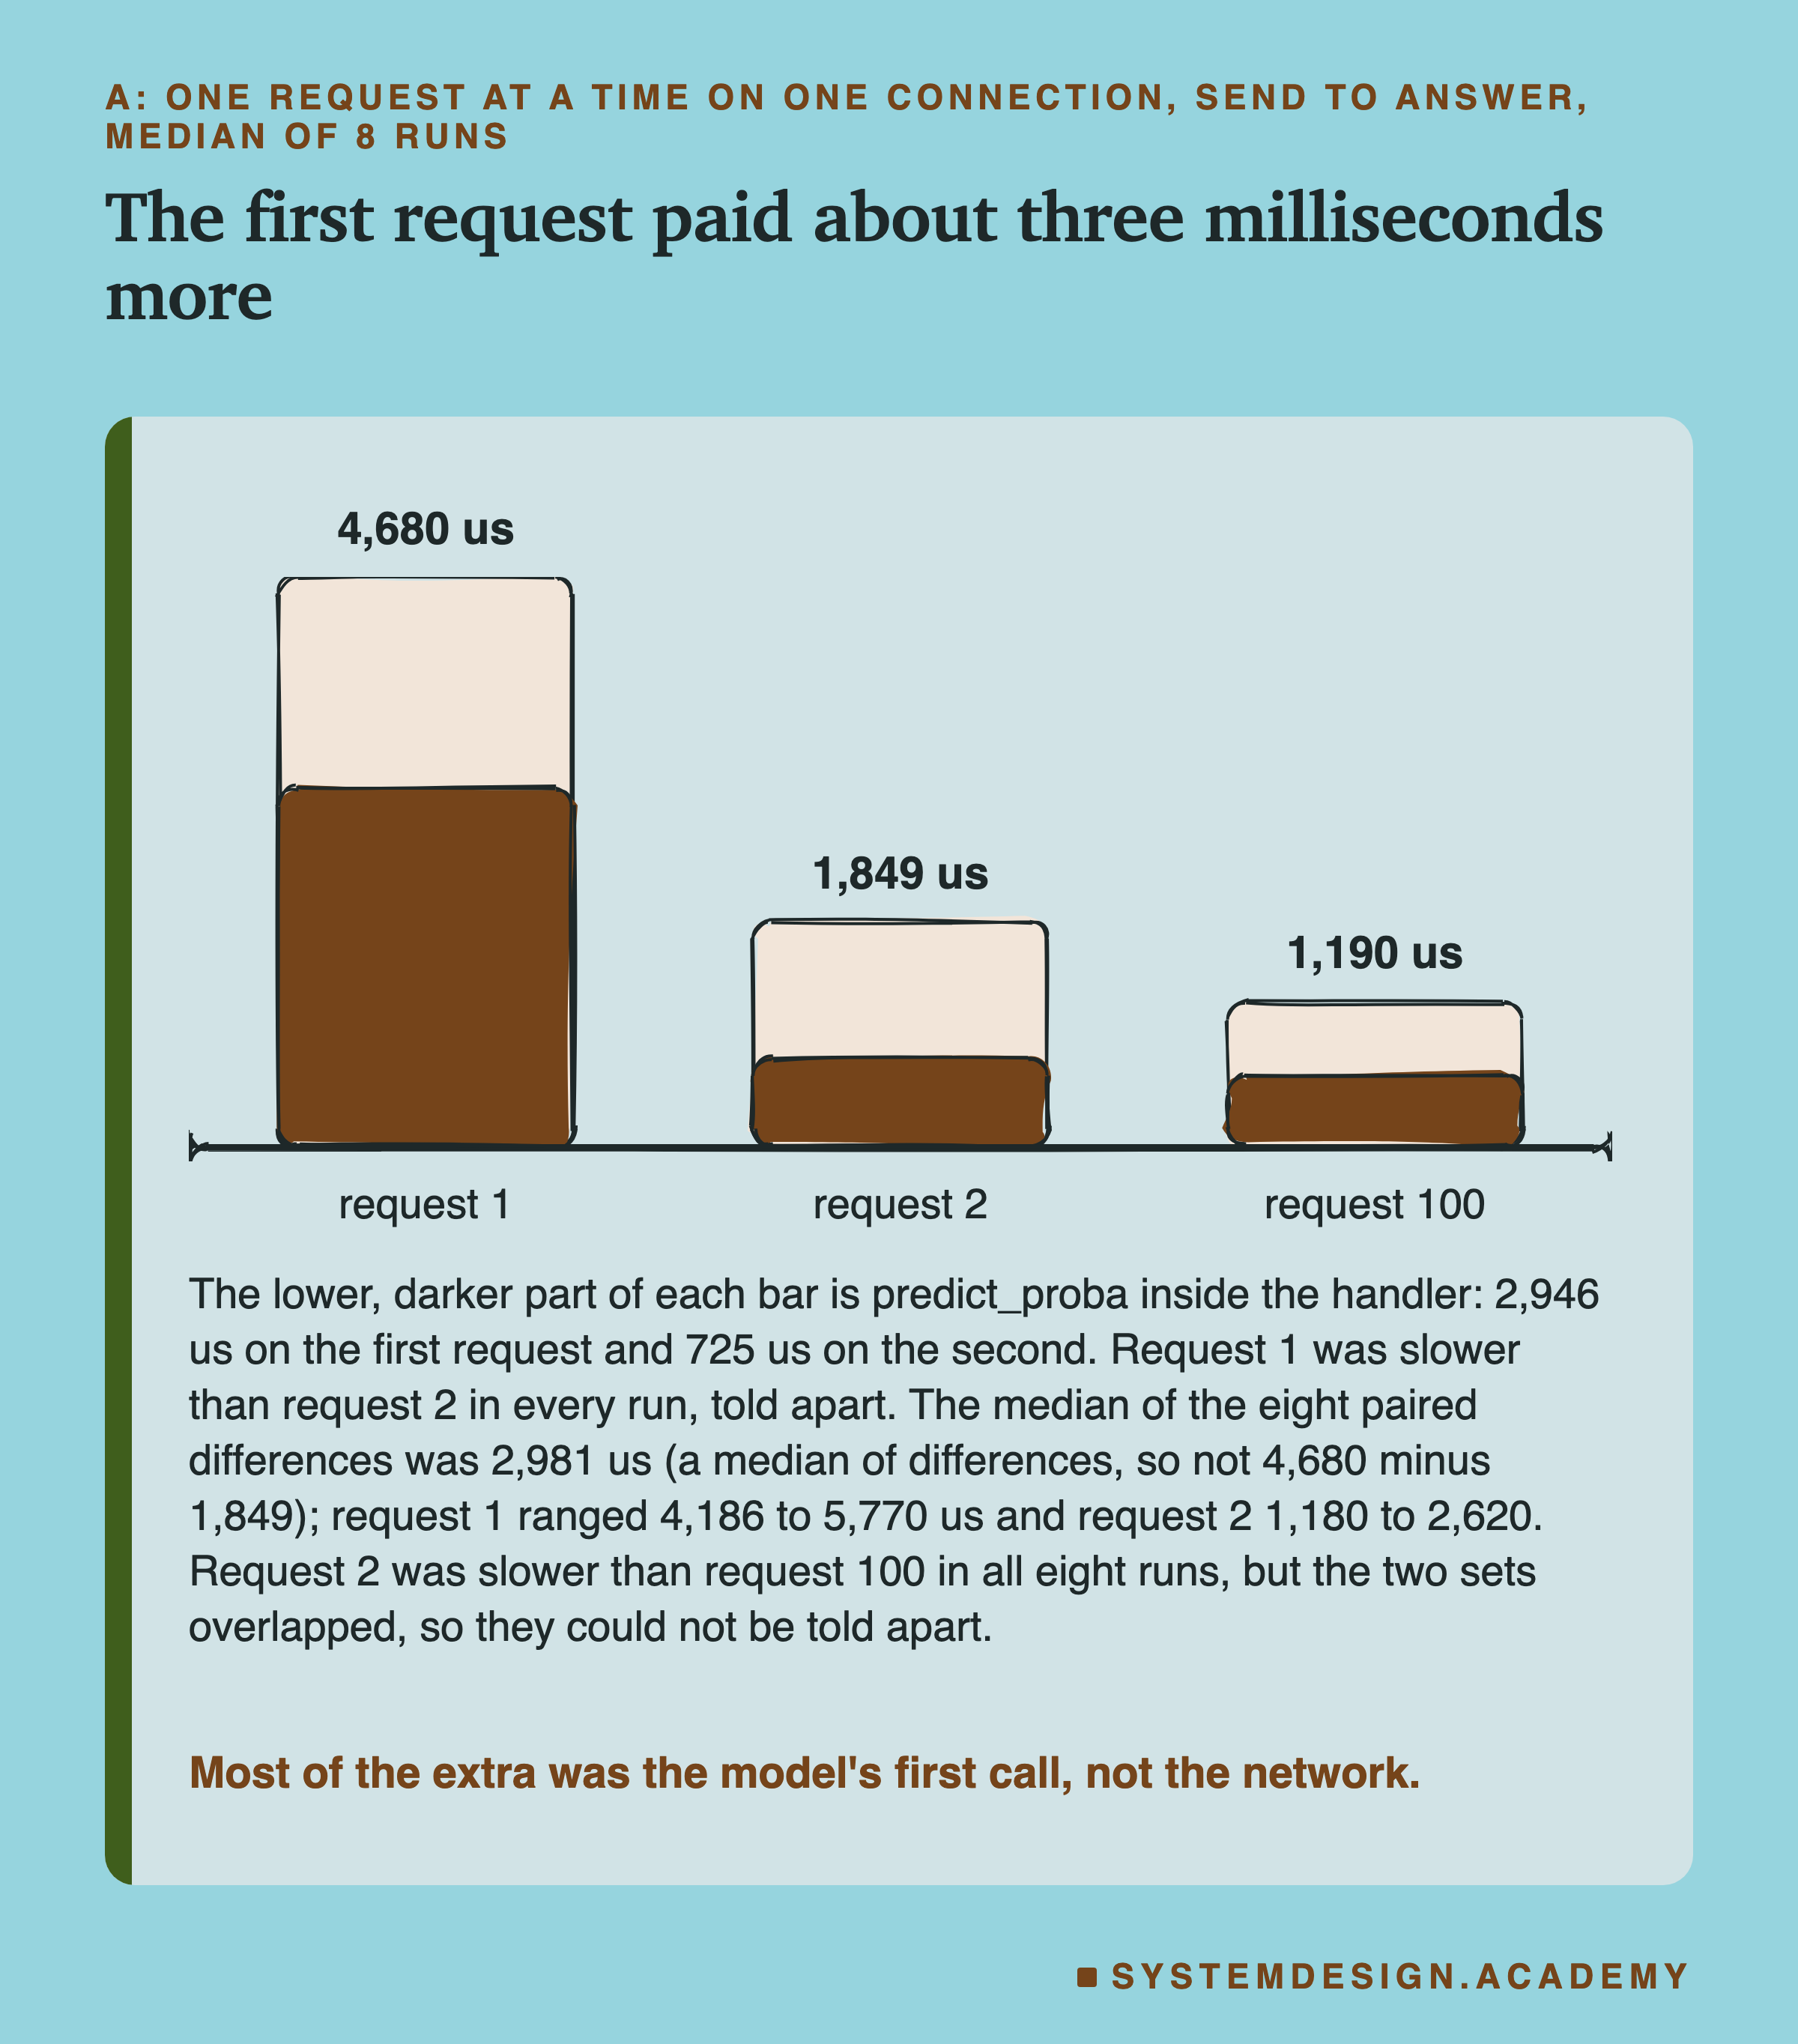
The first request took 4,680 microseconds, and the second 1,849 (medians of eight runs). Request 1 was slower in all eight runs. The median of the eight paired differences was 2,981 us (a median of differences, so not 4,680 minus 1,849). Request 1 ranged 4,186 to 5,770 us and request 2 ranged 1,180 to 2,620. The median of the eight per-run ratios was 2.84. Inside the handler, the model's own call took 2,946 us the first time and 725 us the second. So most of the extra was the model's first predict_proba call. The rest was the first trip through the web framework's code.
Why is the model's first call slow? I did not measure inside it. One possible reason is that the first call prepares things the later calls reuse. Examples are code that the processor reads for the first time, and helper objects that scikit-learn builds once. Lesson 3 saw the same first-call effect in its maximum .
Request 2 was slower than request 100 in all eight runs, 1,849 against 1,190 us. But the two sets of eight overlapped, so by the rule they could not be told apart. My guess had been that the first request would cost at least three times the second. It cost 2.84 times, so that guess was wrong, though close.
One Warm-Up Removed Most of the First Request's Extra
If the first call costs extra, let someone else make it. A warm-up sends the service a request, or a model call, before real users arrive.
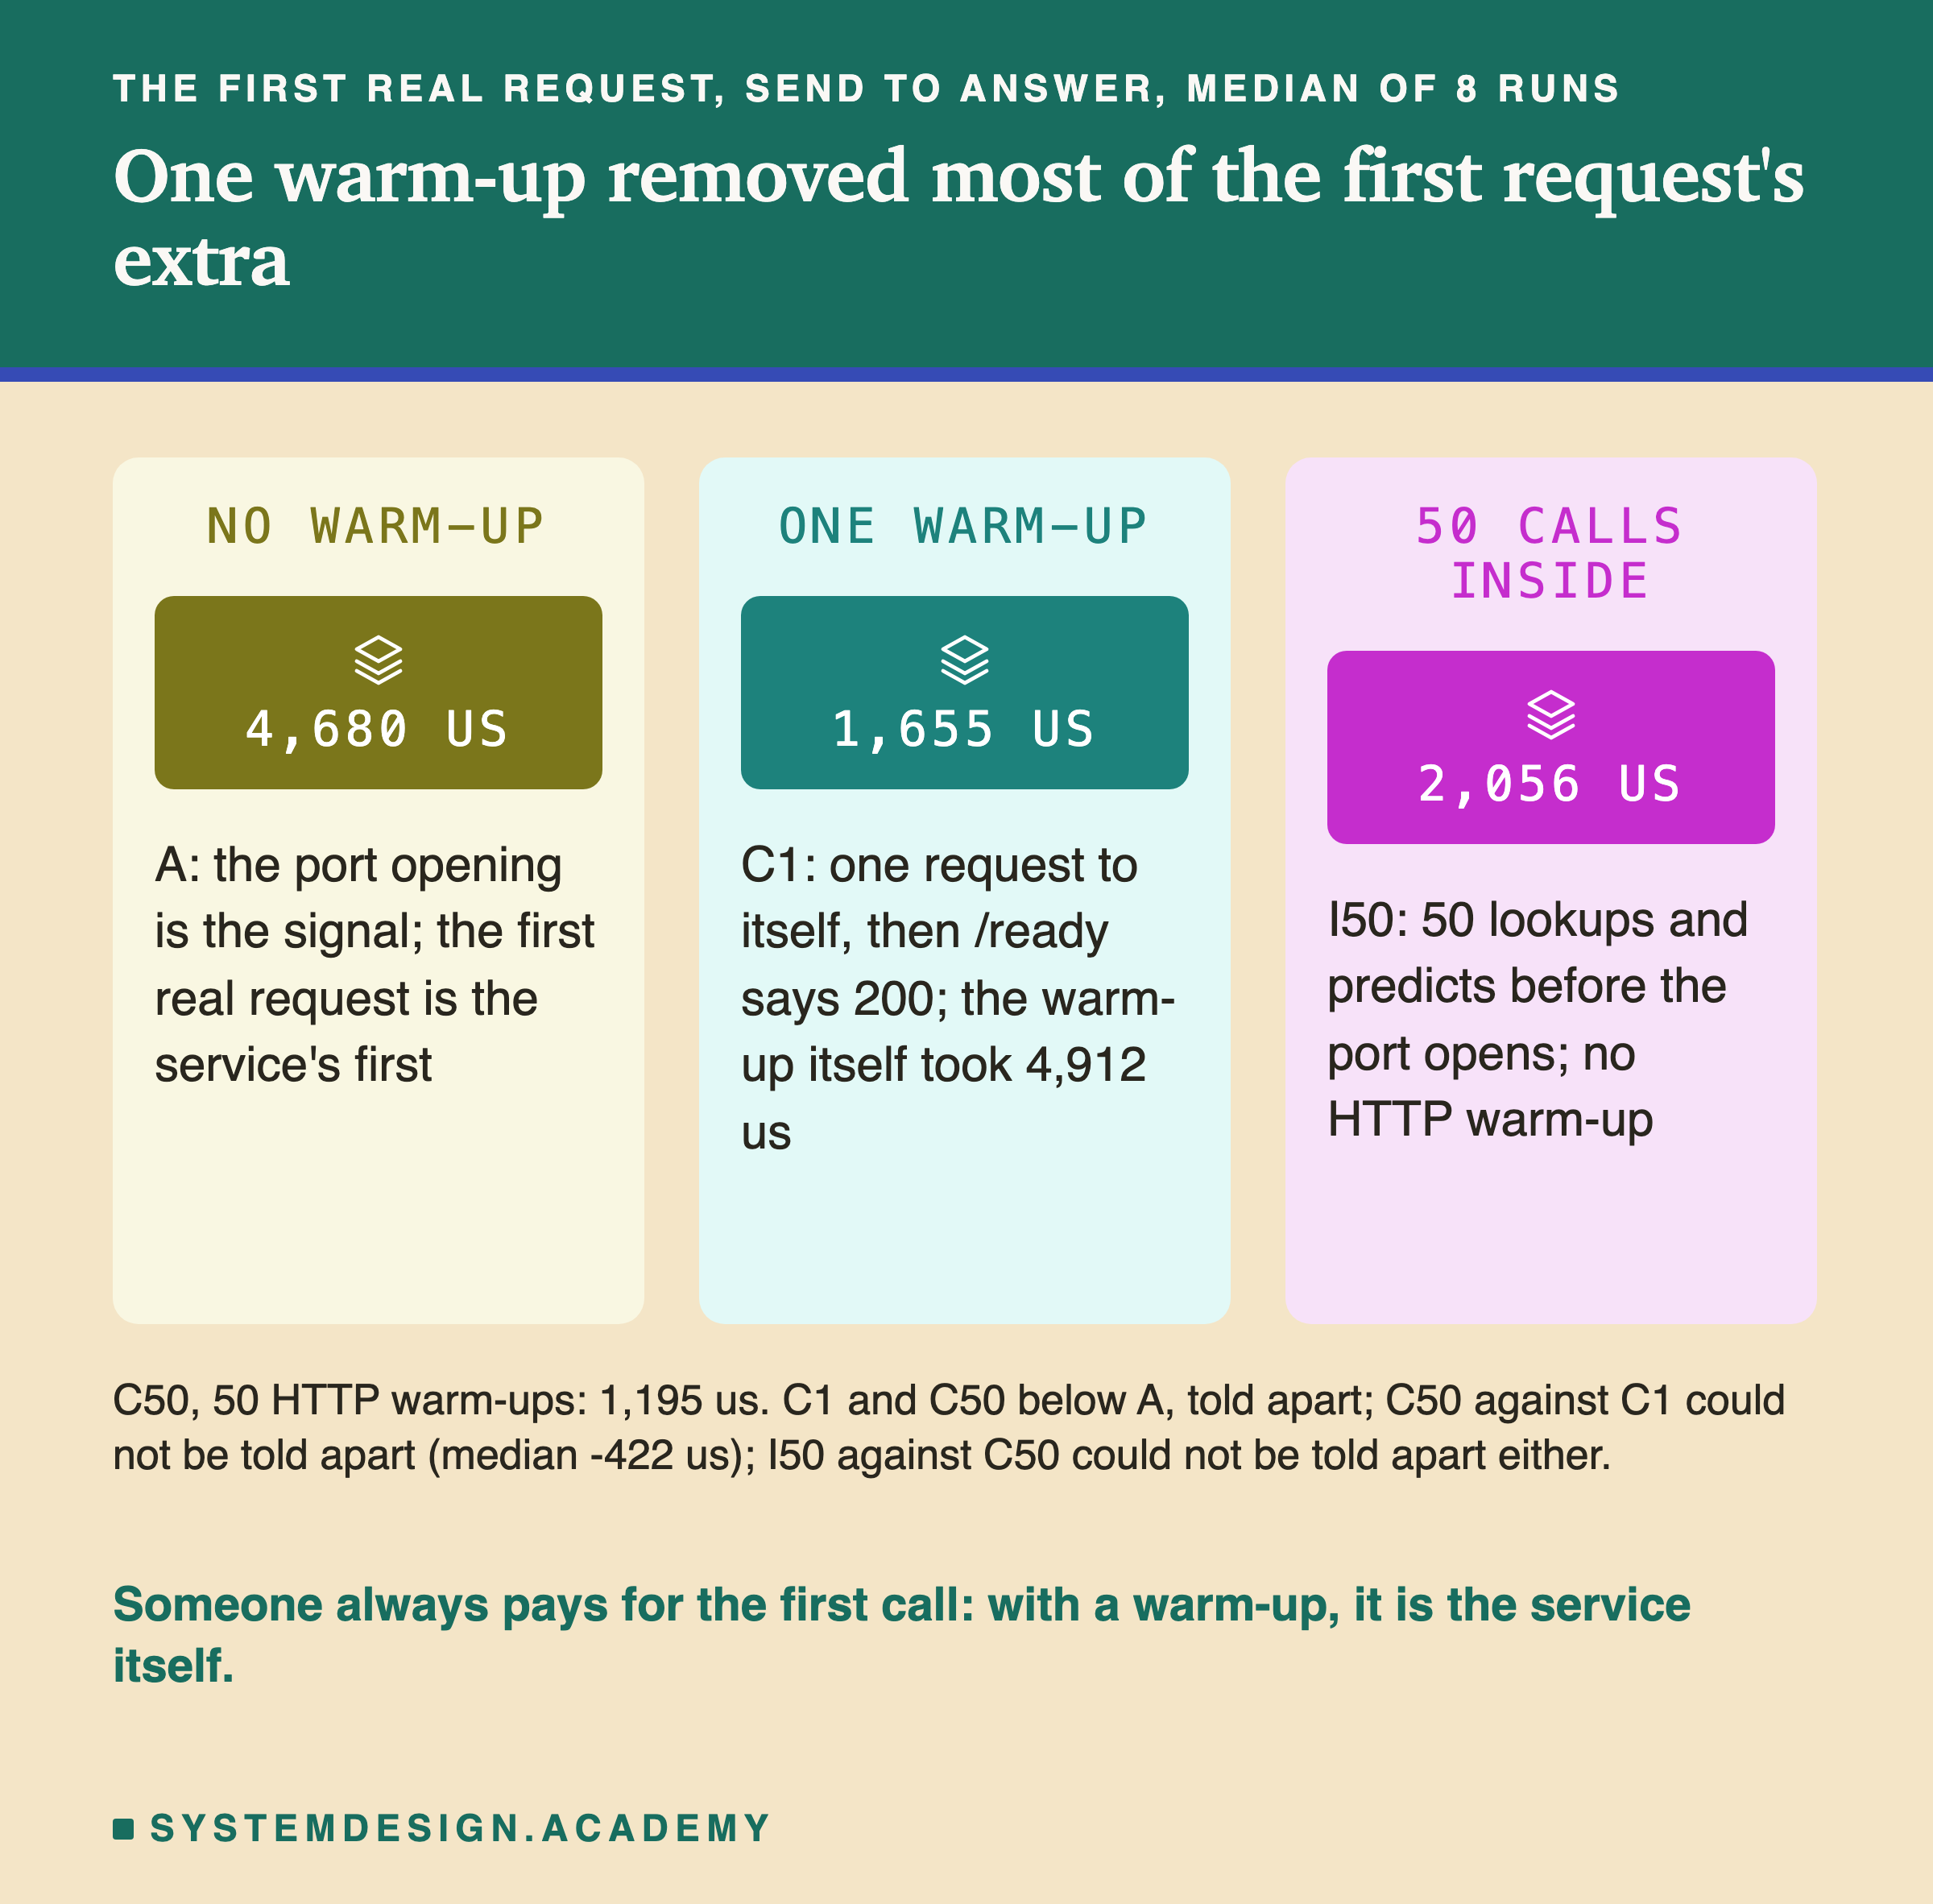
With one warm-up request (C1), the first real request took 1,655 us instead of 4,680, told apart. The warm-up request itself took 4,912 us, about what the first request took in A. So the extra cost did not disappear. The service paid it, before any user was let in.
Fifty warm-up requests (C50) gave 1,195 us. Against one warm-up, the difference could not be told apart. So one request did most of the work here.
Fifty calls inside the process (I50) gave 2,056 us. These warmed the model and SQLite, but not the web framework's own path. My guess was that I50 would land between A and C50, told apart from both. It was below A, told apart, but against C50 it could not be told apart. So that guess was wrong. The path's own first-time cost was too small to show against the noise here.
The Readiness Gate
A warm-up only helps if no user arrives before it ends. Something must hold traffic back. That is the readiness check.
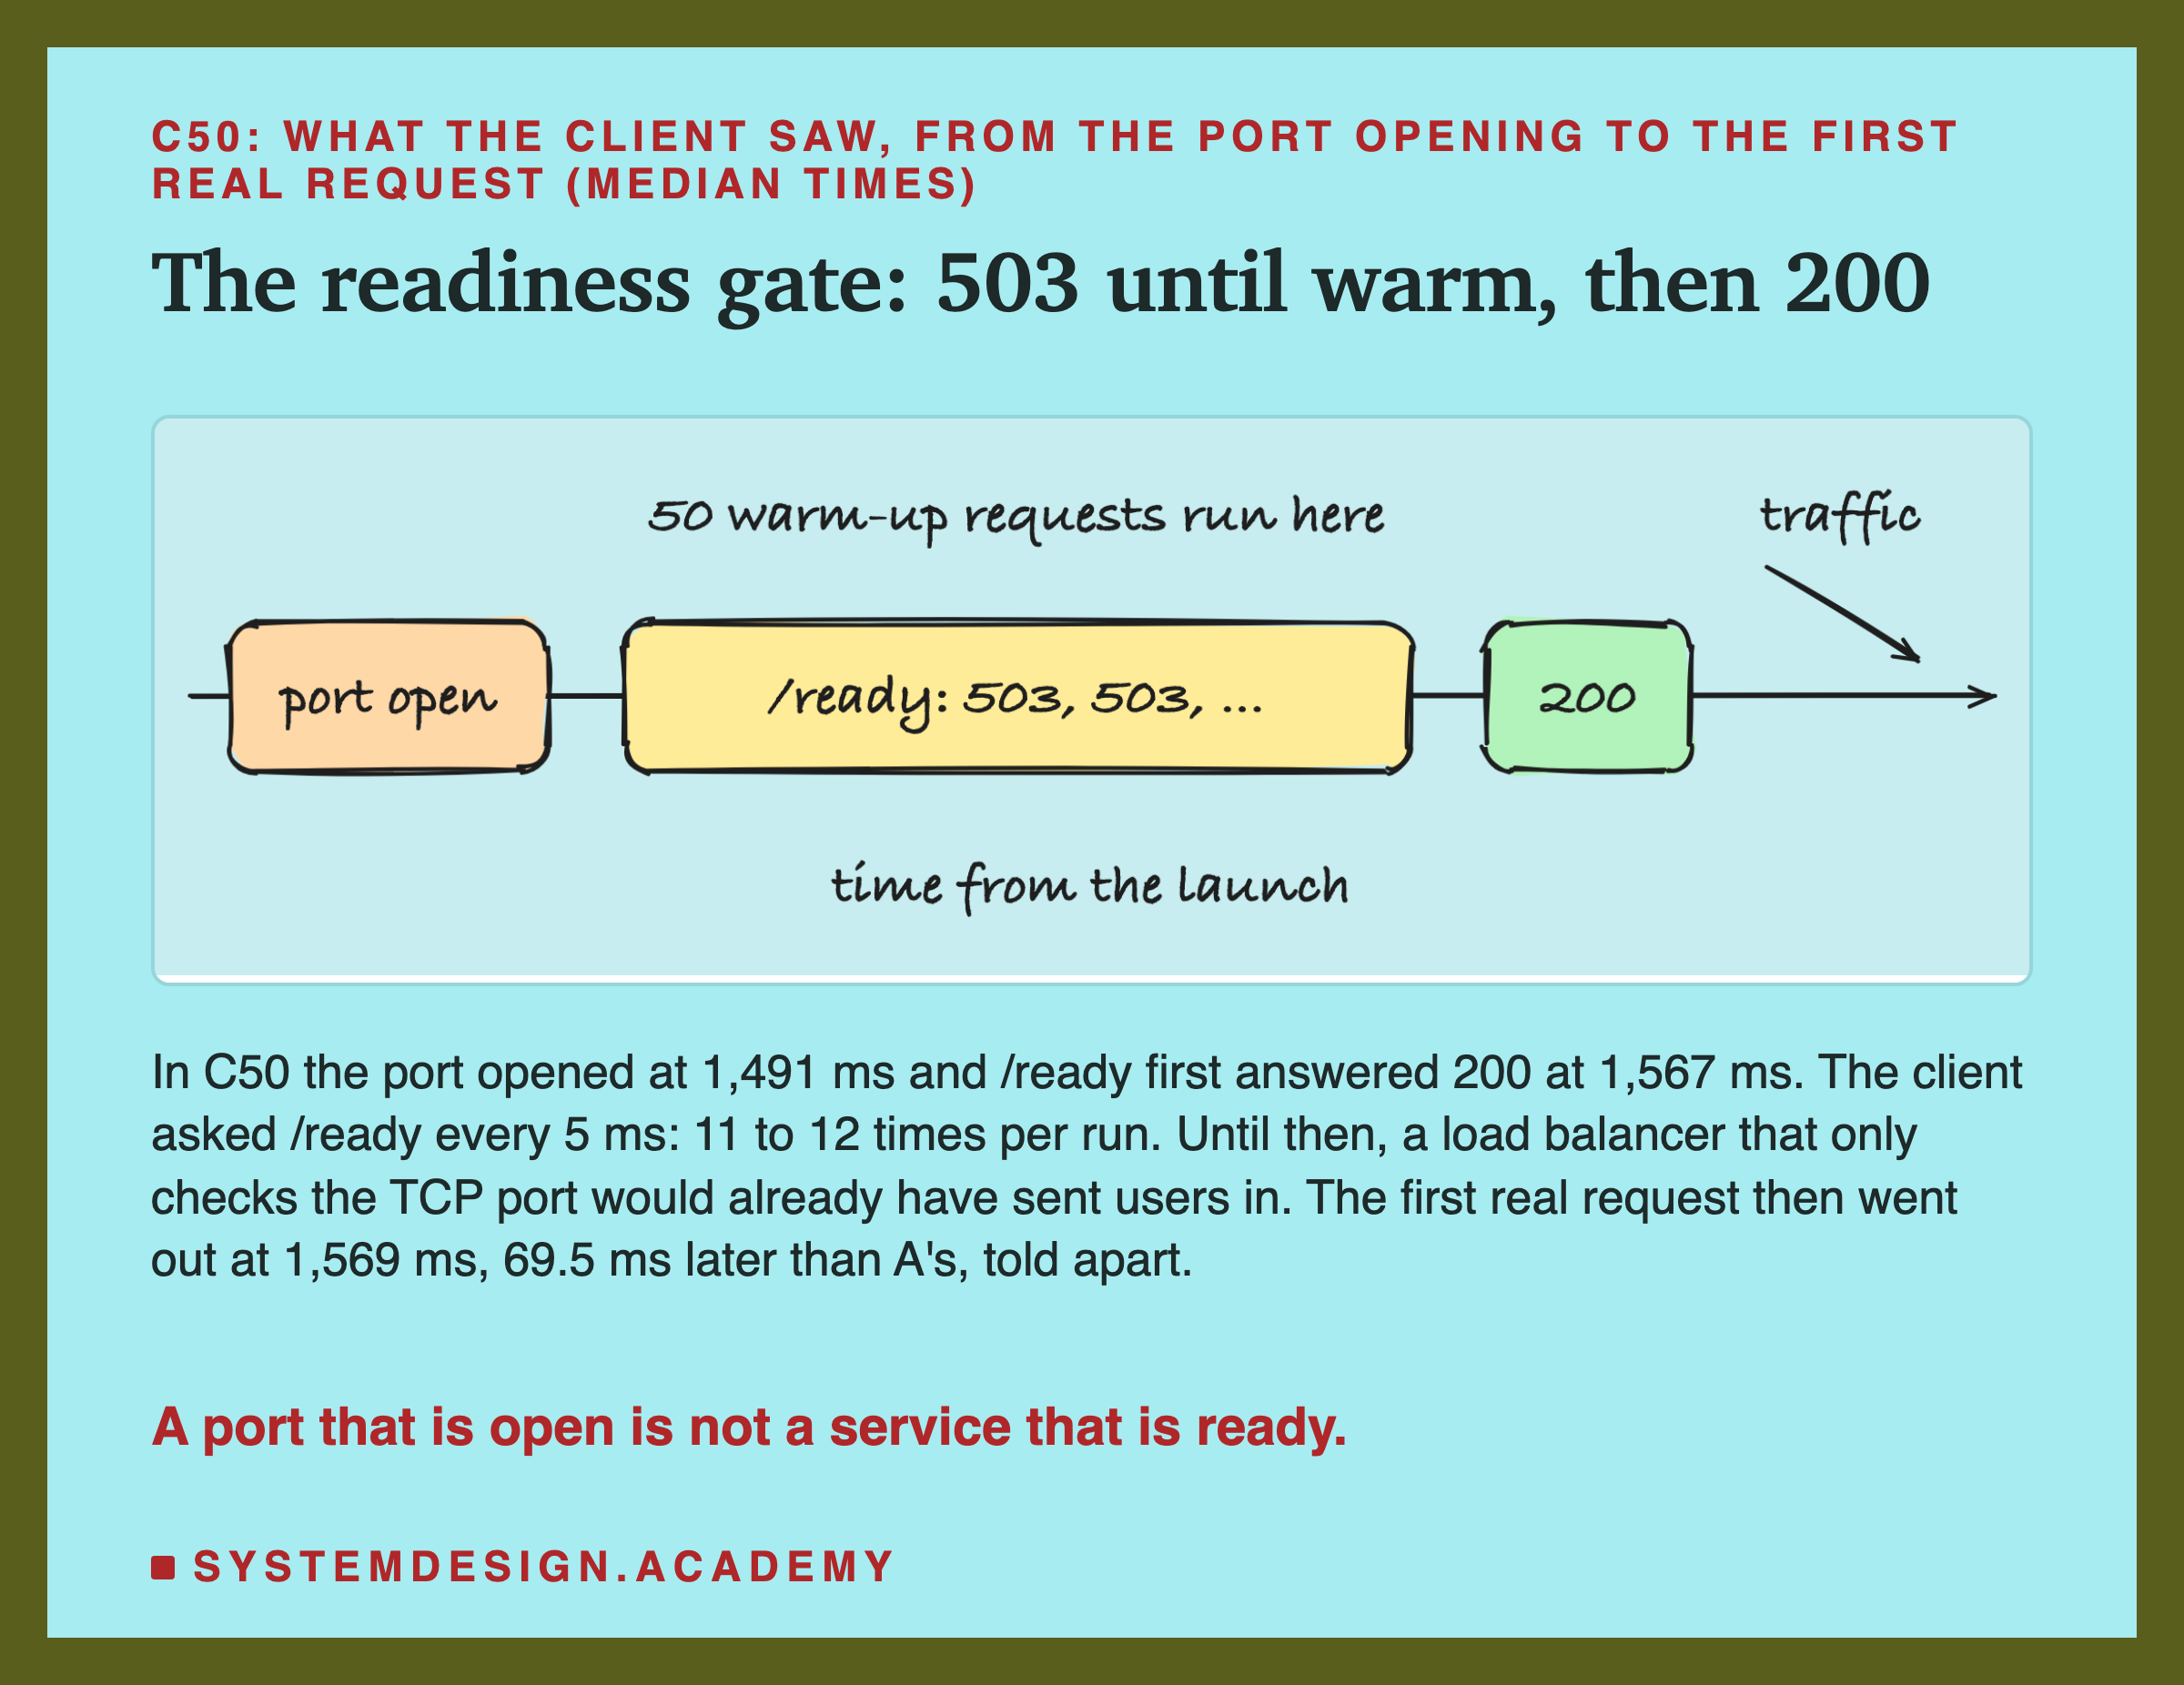
In arms C1 and C50, my service answers GET /ready with status 503, "not available", until its warm-up is done, and with 200 after. The client plays the : it asks every 5 ms and sends real requests only after a 200.
, a common system for running containers, describes the same idea. Its documentation says: "Readiness probes determine when a container is ready to accept traffic." It also says this is useful when an application must do "time-consuming initial tasks, such as establishing network connections, loading files, and warming caches."
The important part is what the check asks. Some load balancers check only that a connection succeeds; for AWS's Network Load Balancer, its documentation says "The default is the TCP protocol." In C50 the port opened 76 ms before the service was warm. With one warm-up (C1) the gap was about 16 ms (ready 1,506.3 minus port 1,490.5, a difference of medians). A check that only opens a connection would have sent users in during those milliseconds, straight into the slow first call.
What the Warm-Up Cost
A warm-up is not free. It makes the start a little longer, and it puts the cost of the first call on the service instead of on a user.
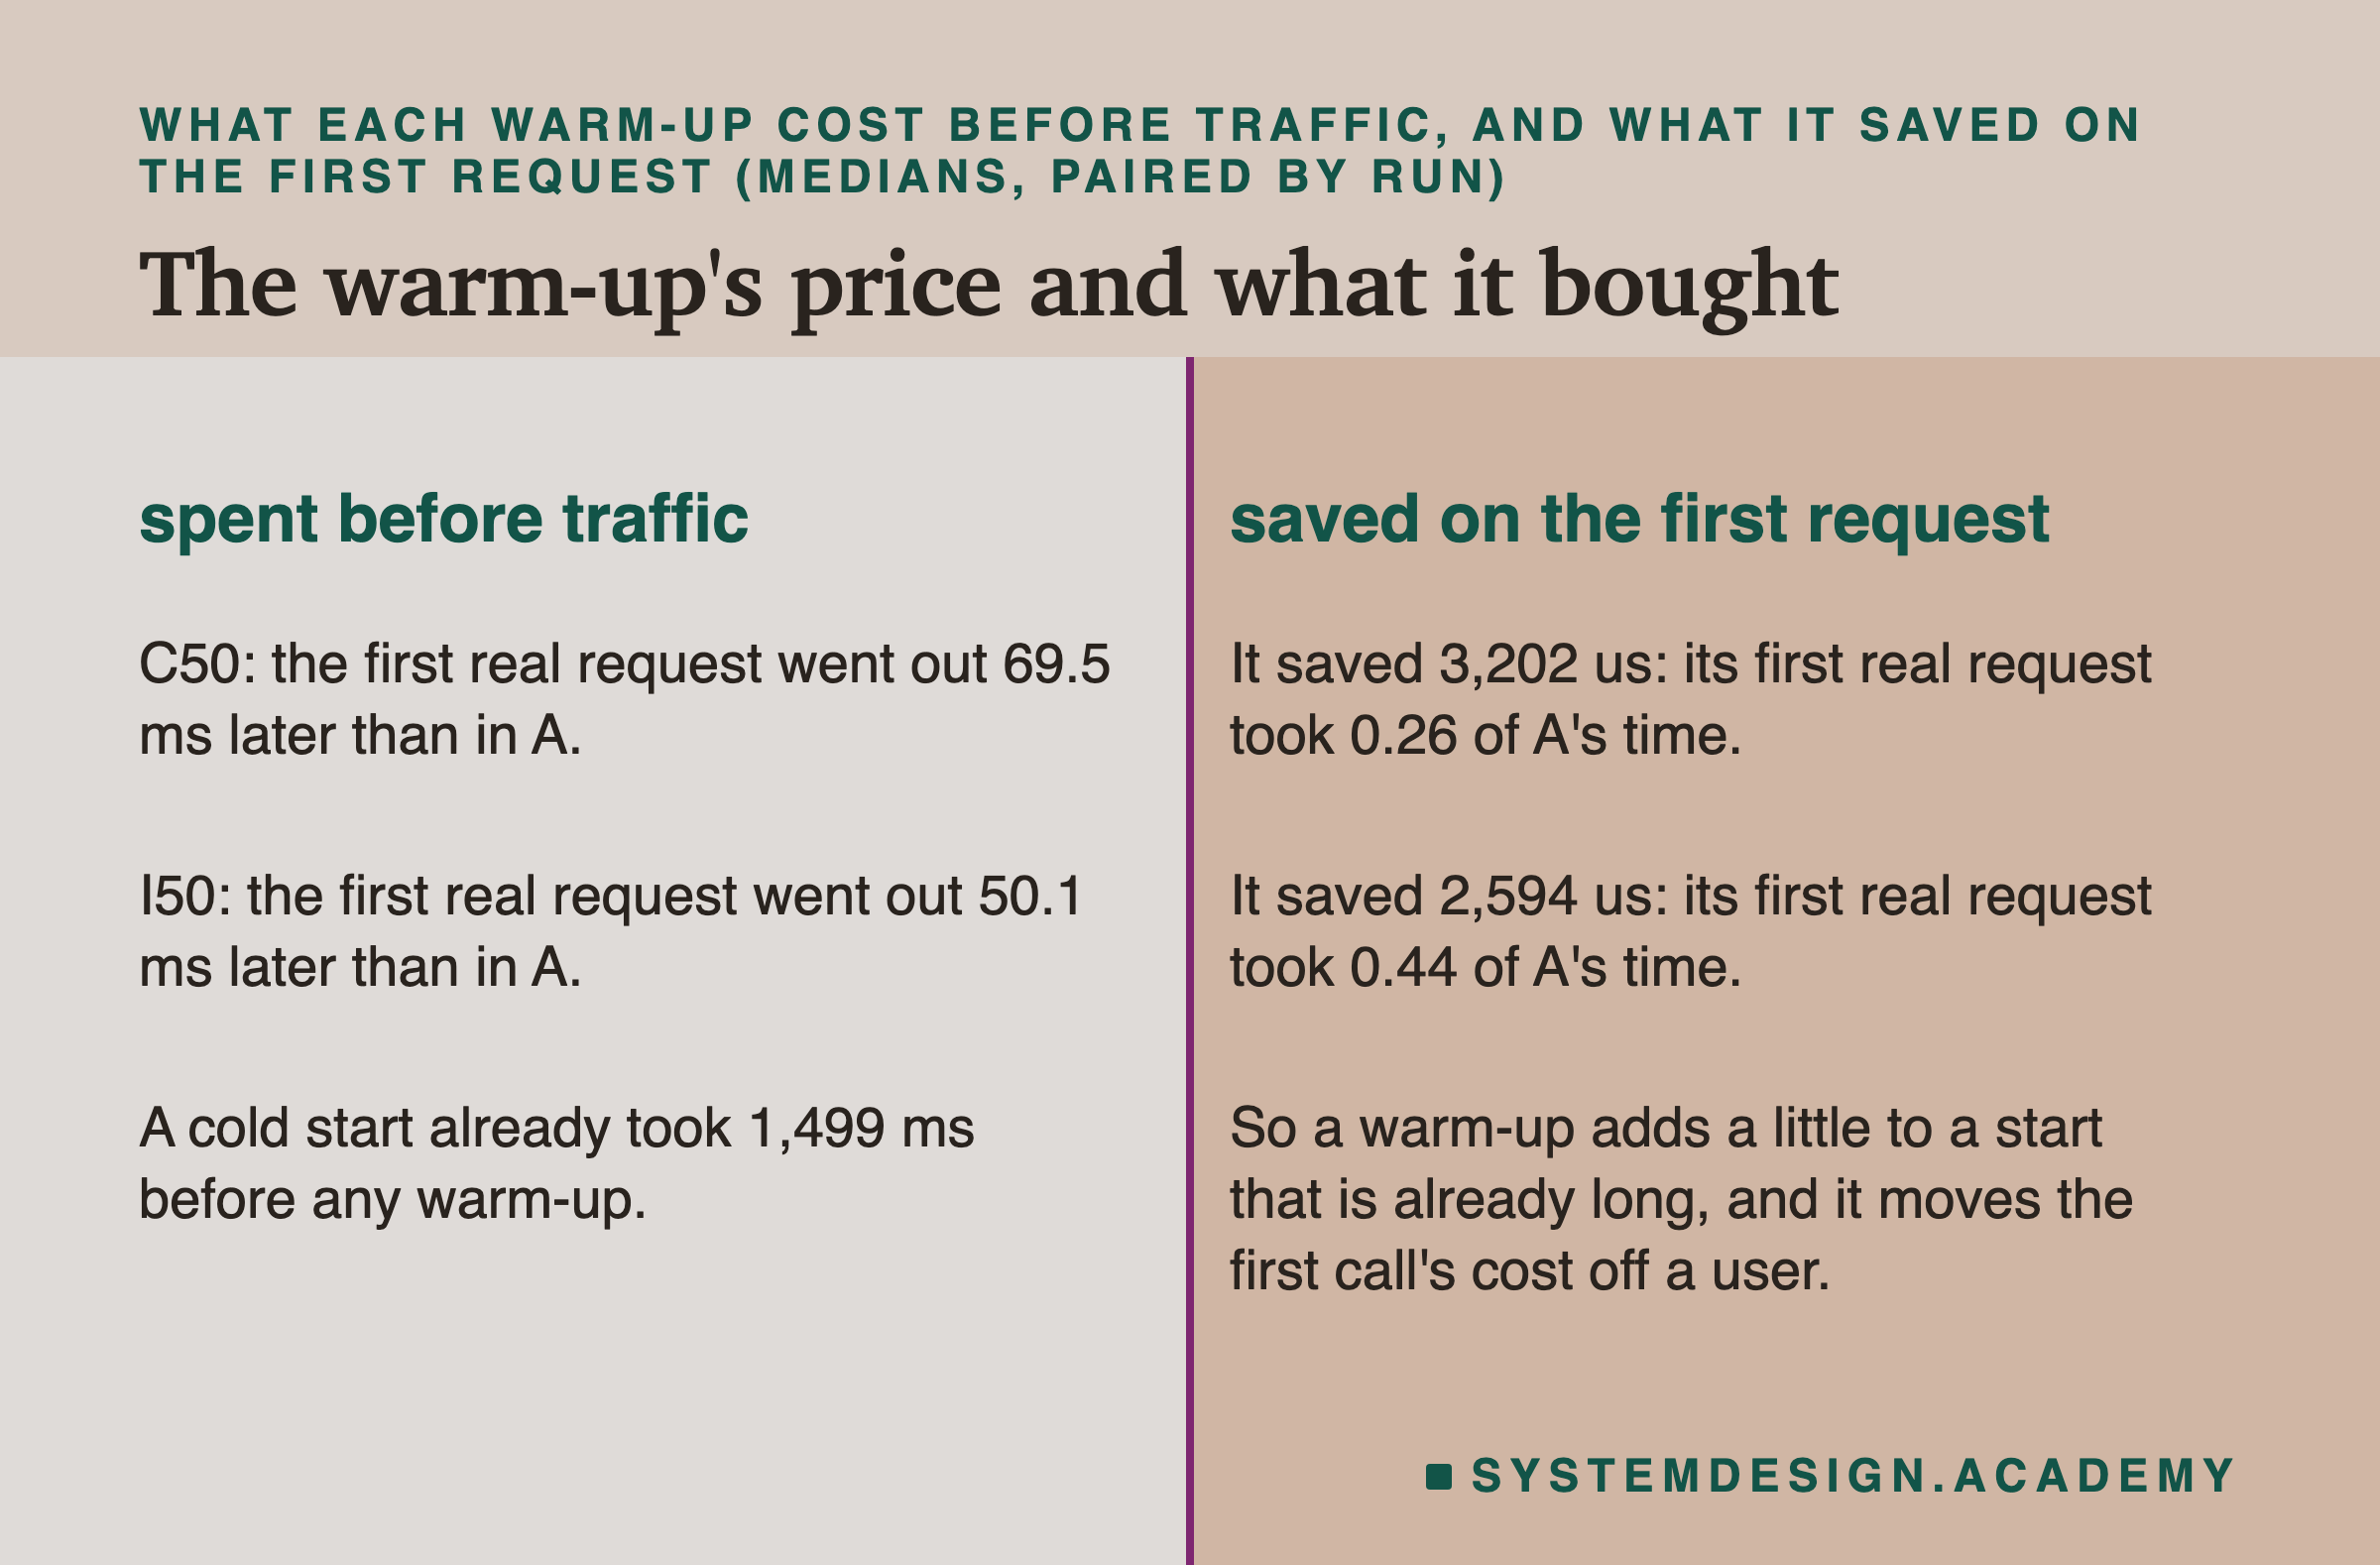
Fifty warm-ups delayed the first real request by 69.5 ms, compared with A, told apart. Fifty in-process calls delayed it by 50.1 ms, also told apart. Against a start of 1,499 ms, both are small.
What did they buy? About 3 milliseconds on one request. That sounds like very little, and on its own it is. But it is the request that a user waits for after a deploy, a restart or a scale-up. And if a service starts many times a day, for example when it scales up and down with traffic, every start has a first user.
I would still use one warm-up request behind a readiness check. It is cheap, it covers the whole request path, and here it removed most of the extra.
Under Steady Traffic, the Warm-Up Could Not Be Told Apart
So far one request came at a time. Real users arrive at random, many at once. Arms F and G start the service and then send open-loop traffic: 539 random arrivals a second for 3 seconds. That is half of lesson 5's measured capacity S, 1,077.1 a second. counts from the moment each request was meant to arrive.
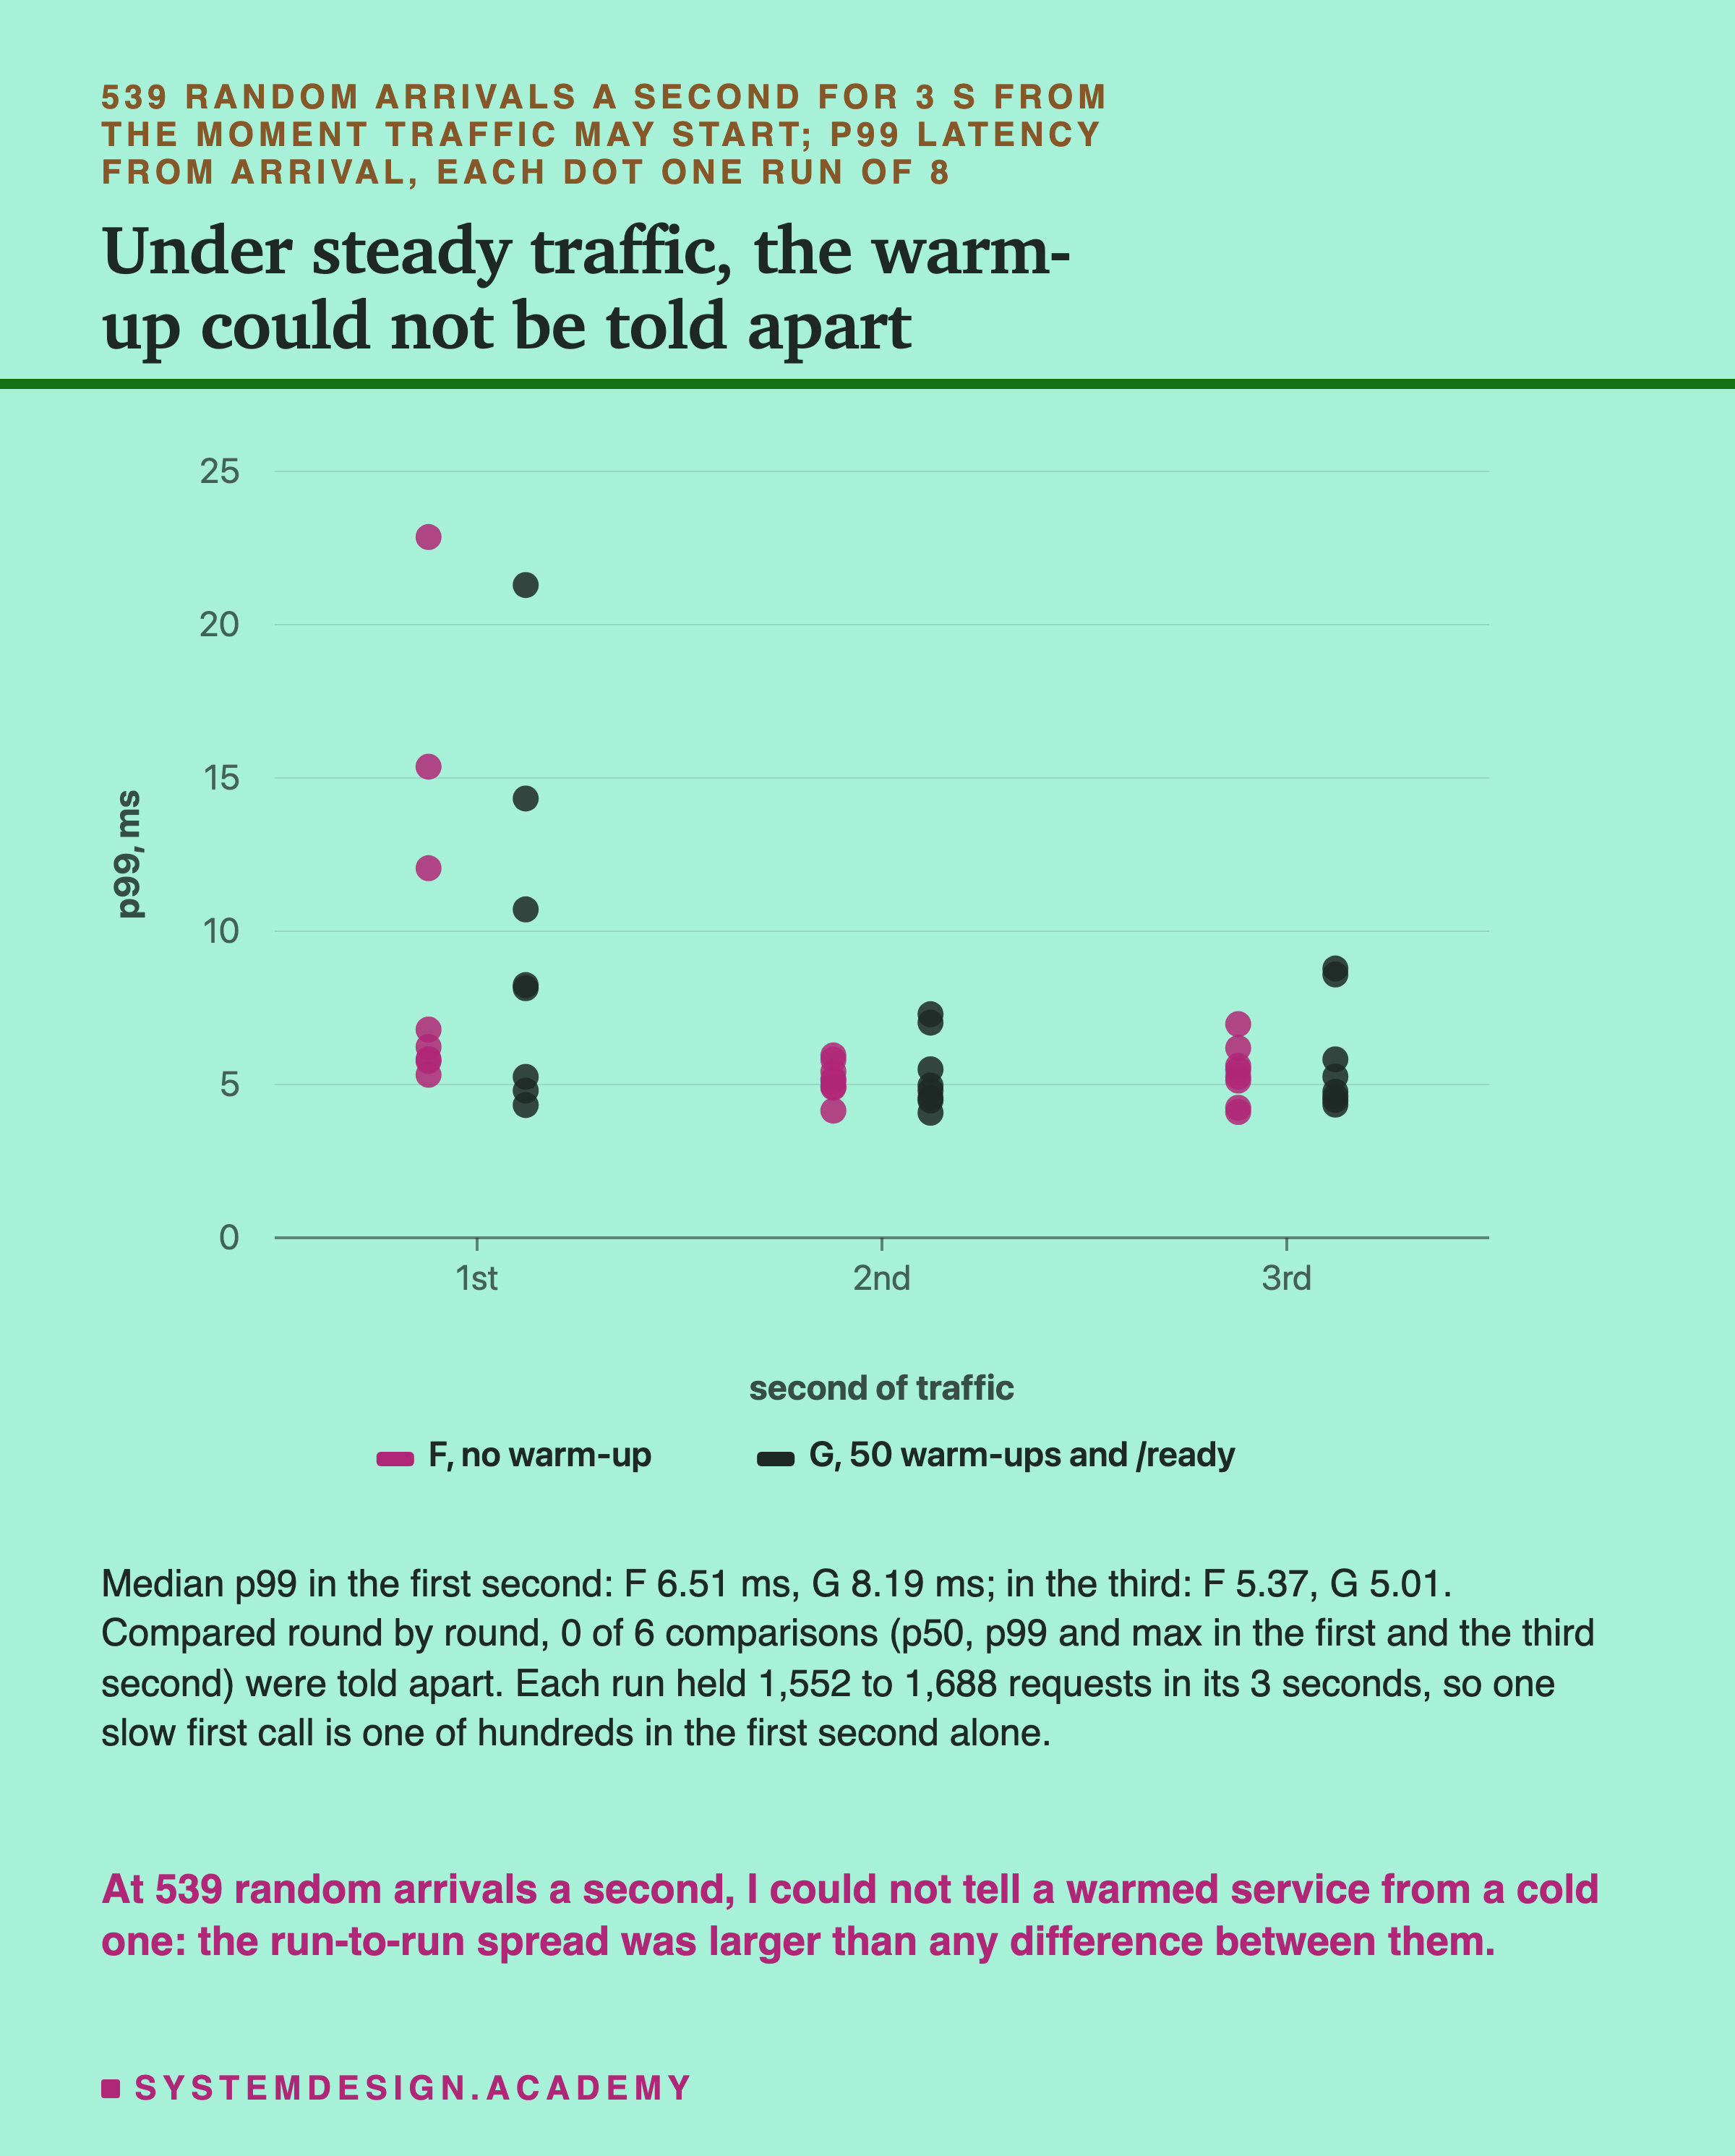
None of the six comparisons was told apart. In the first second, F's median p99 was 6.51 ms and G's 8.19 ms. In the third second they were 5.37 and 5.01. One run in each arm reached 21 to 23 ms; the next highest were 15.4 (F) and 14.3 (G).
I had guessed that G's first-second maximum would be lower than F's, and that F's first second would be at least three times worse than its third. Both guesses were wrong. F's first-second p99 was only 1.40 times its third.
Why? One possible reason is size. At 539 arrivals a second, about 540 requests land in the first second. The first call's extra 3 ms touches only the few requests queued behind it. The random bunching of arrivals, which made the queue grow and shrink, moved the p99 by more than that. This does not mean warm-ups never matter under traffic. A bigger model, a slower first call or more traffic at the start could change it. Here, at this rate, I could not see it.
My Eighteen Guesses Before the Run, Checked
I wrote eighteen guesses into the lab before it ran. Each is quoted here word for word from the docstring. Fourteen were right and four were wrong.
-
"H1 A: launch -> python_ready between 15 and 80 ms." Right: 18.2 ms.
-
"H2 A: the sklearn import step (after numpy and pandas) is the largest single step of the start." Right, in all 8 runs.
-
"H3 A: the import steps (stdlib to uvicorn) are at least 70% of launch -> port open." Right: 96.9%.
-
"H4 A: unpickle under 20 ms." Right: 1.22 ms.
-
"H5 A: launch -> first answer between 1.0 and 4.0 s." Right: 1.499 s.
-
"H6 A: request 1 at least 3 x request 2 (median of the runs), and request 100 within 1.2 x request 2." Wrong: request 1 was 2.84 times request 2. Request 100 was 0.73 times request 2.
-
"H7 B: launch -> first answer at least 2 x A's, told apart." Right: 2.81 times.
-
"H8 C1: the first real request within 1.5 x A's request 2 (one warm-up removes most of the first-request cost)." Right: 1.04 times.
-
"H9 C50 vs C1: the first real request cannot be told apart." Right.
-
"H10 I50: the first real request below A's, told apart, and above C50's, told apart (the path is still cold)." Wrong: below A's, told apart, but against C50's it could not be told apart.
Try It Yourself
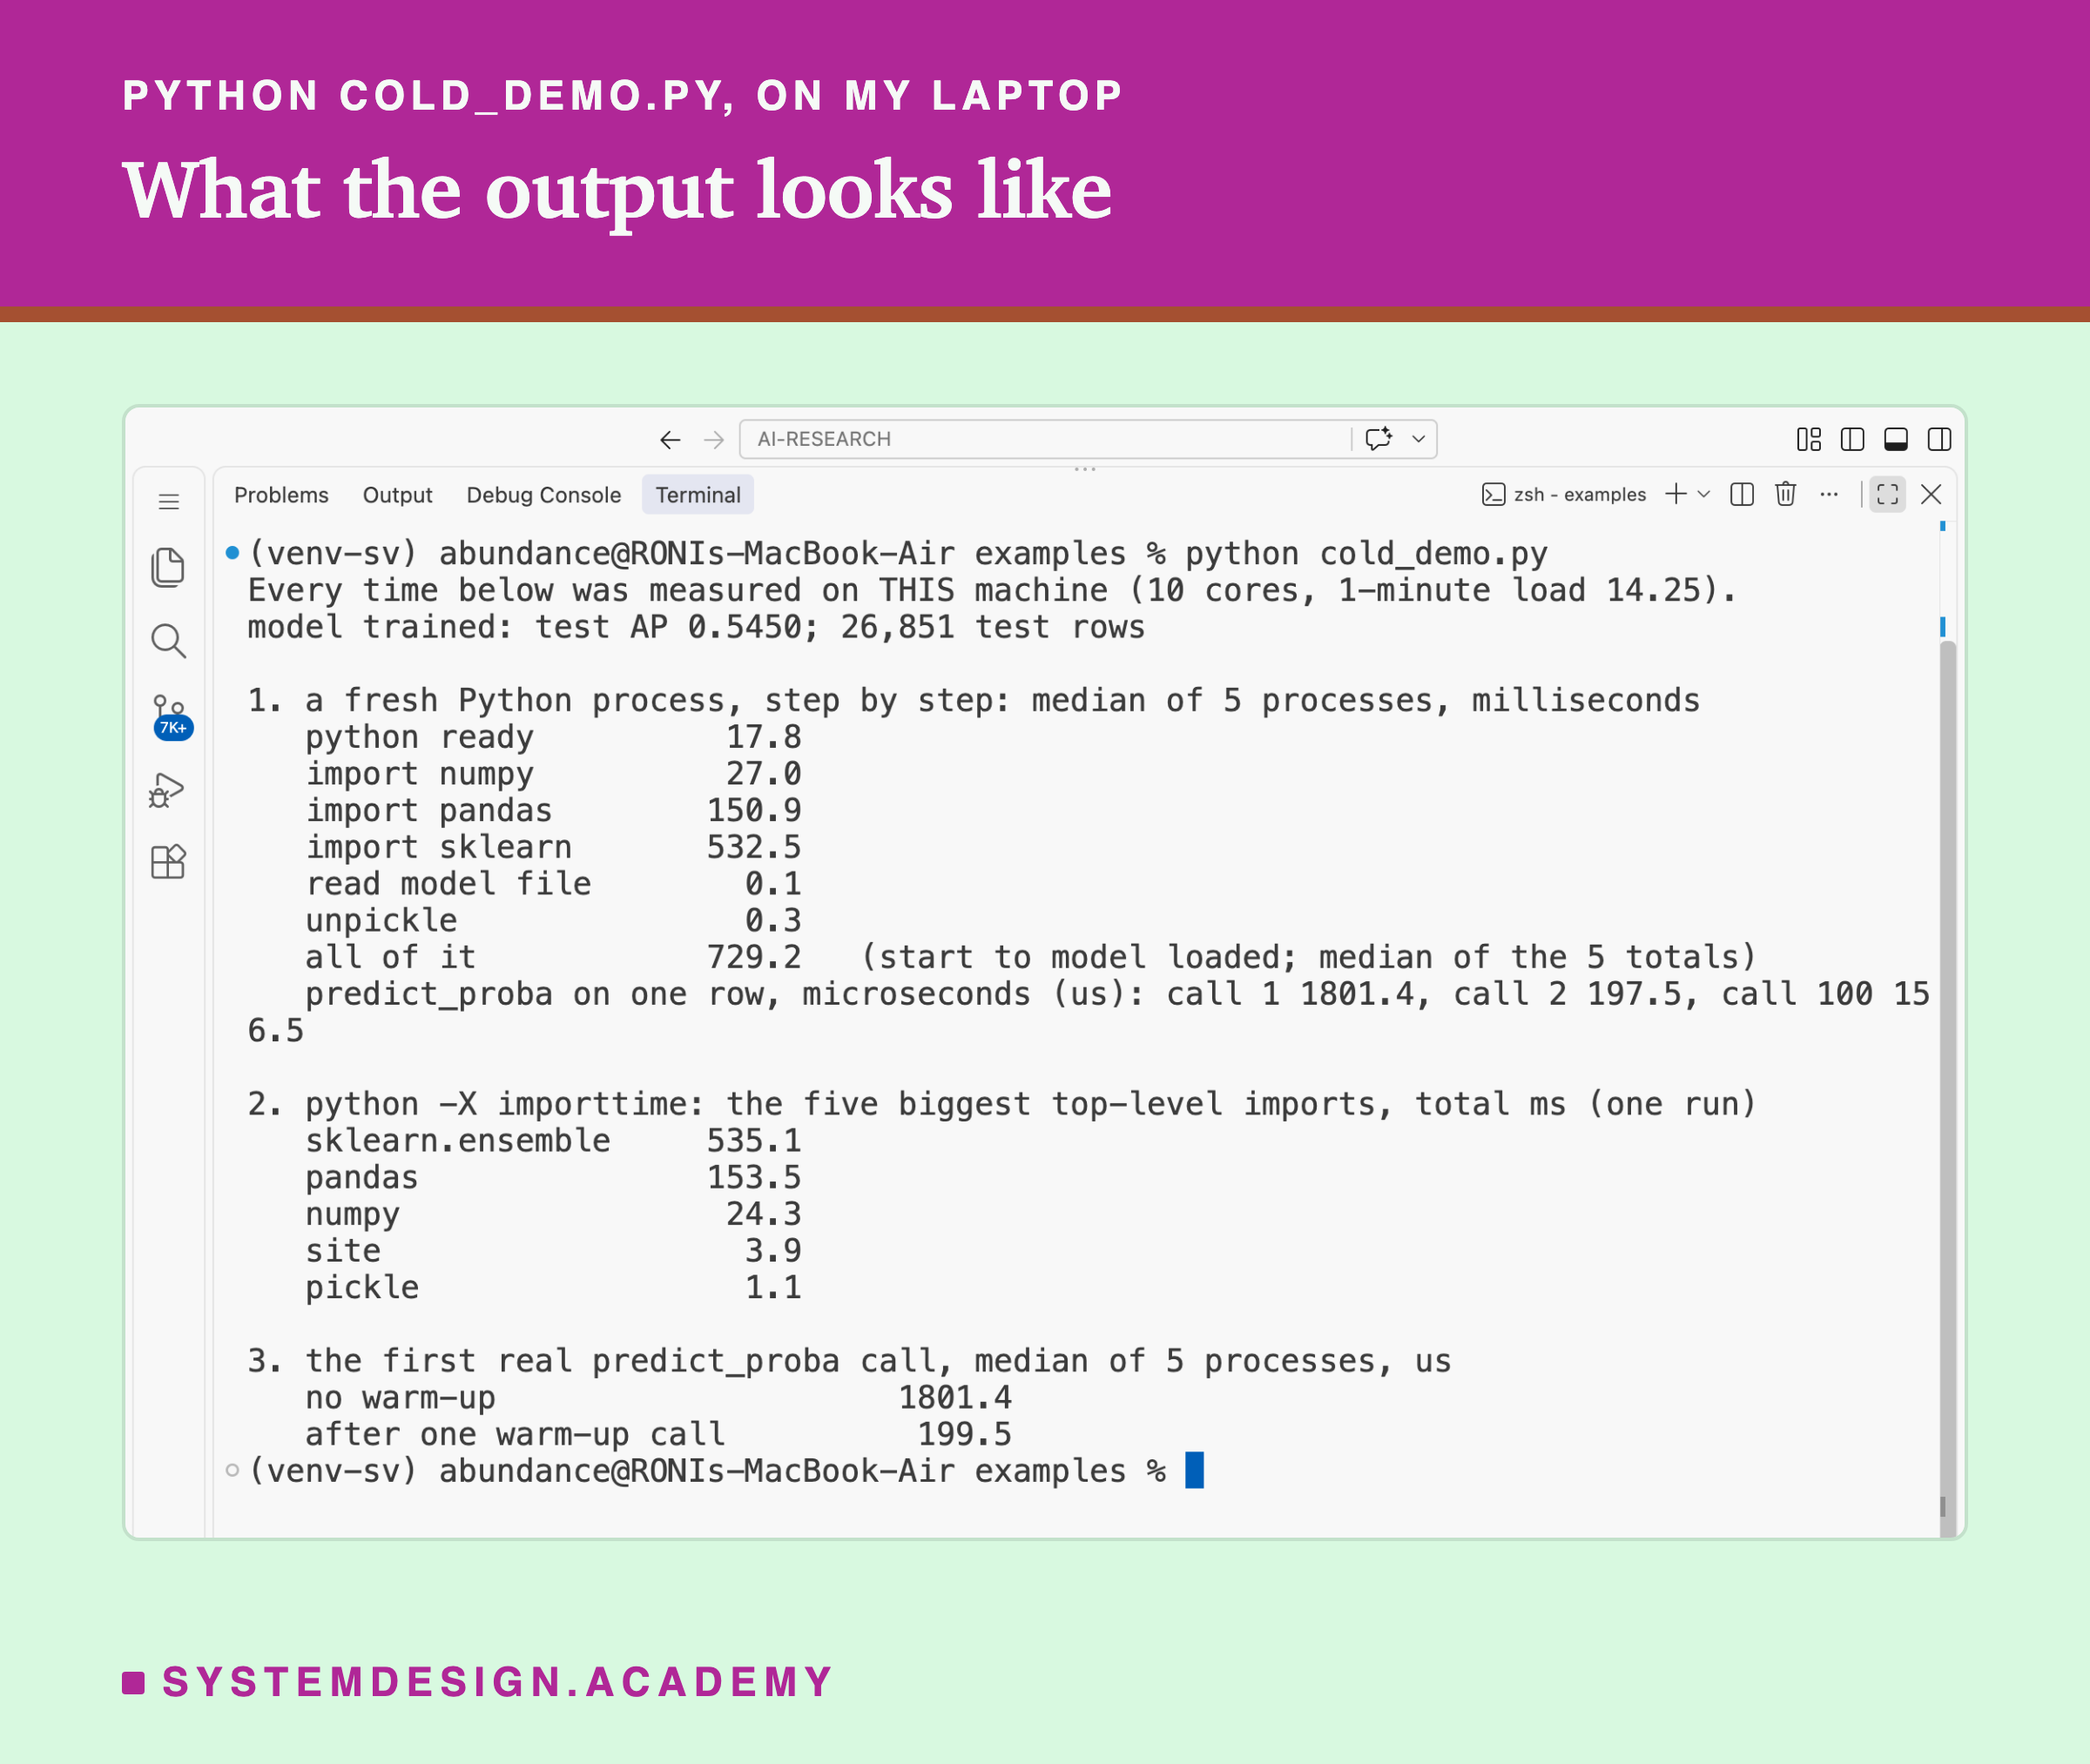
The full lab needs a rented box and . The demo, cold_demo.py, runs on your own computer and needs neither. It times a fresh Python process, step by step, the same way the lab does.
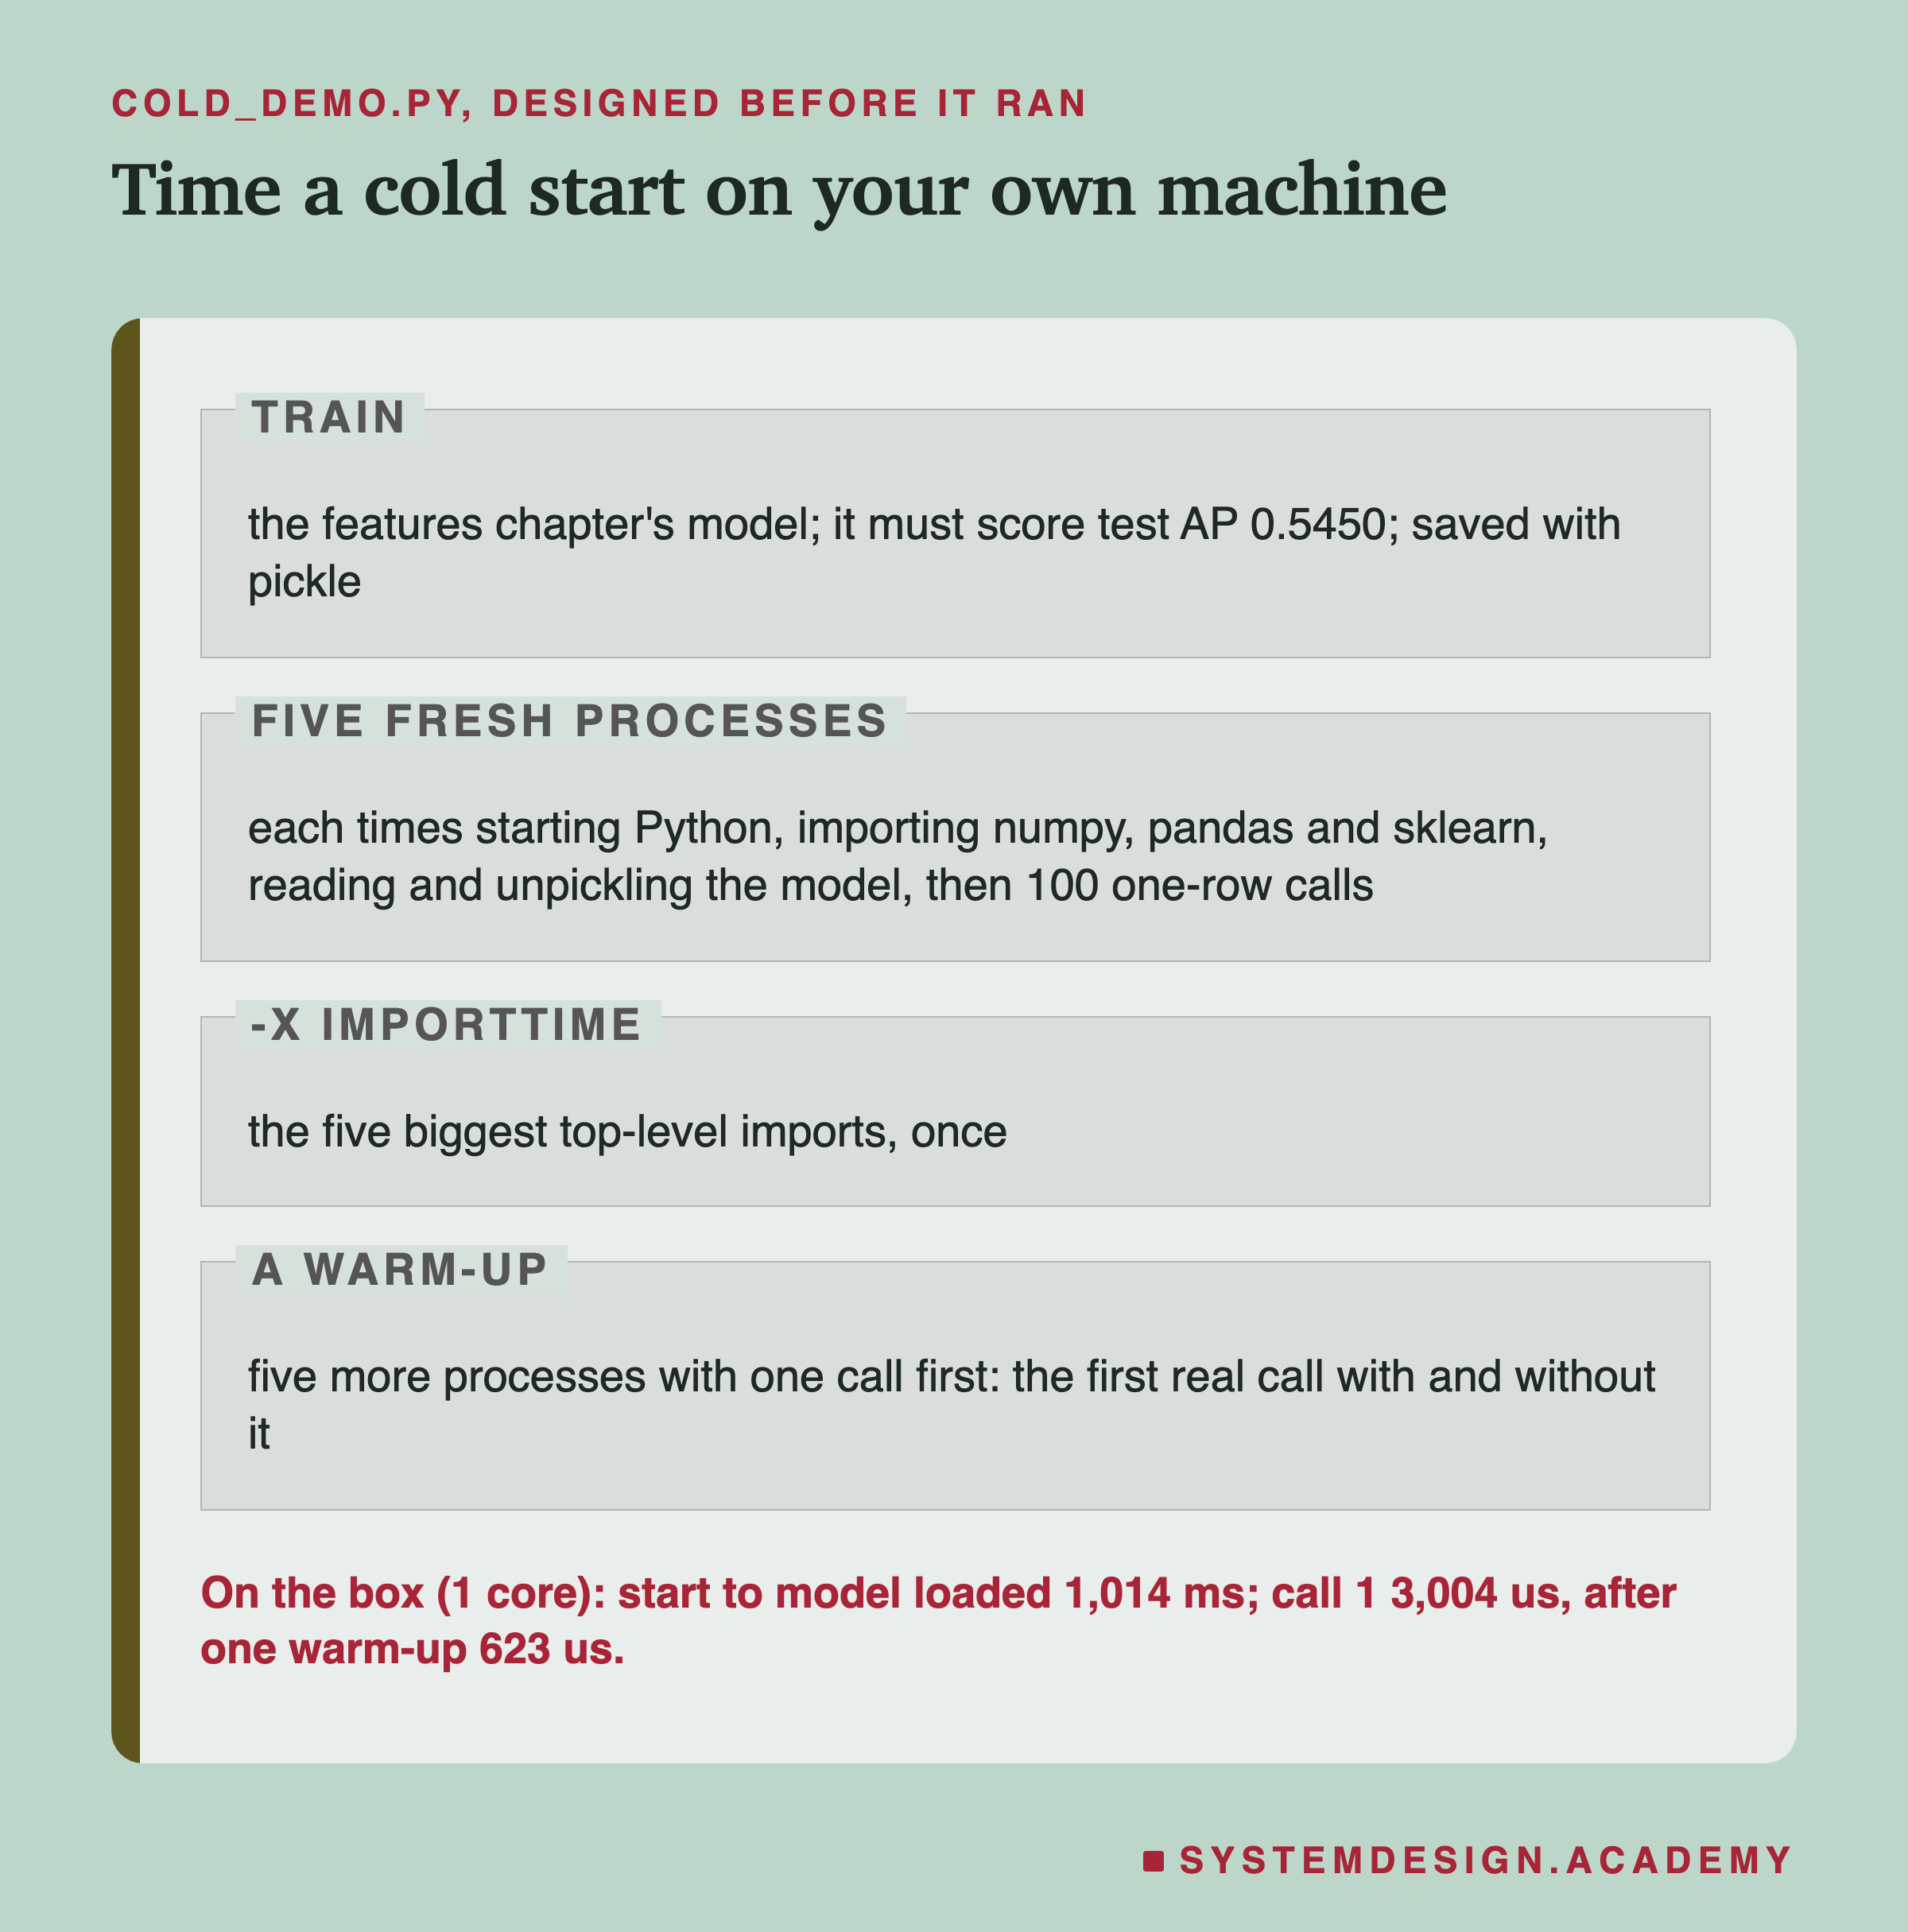
I wrote the demo's design into its docstring after the lab's design and before the demo first ran.
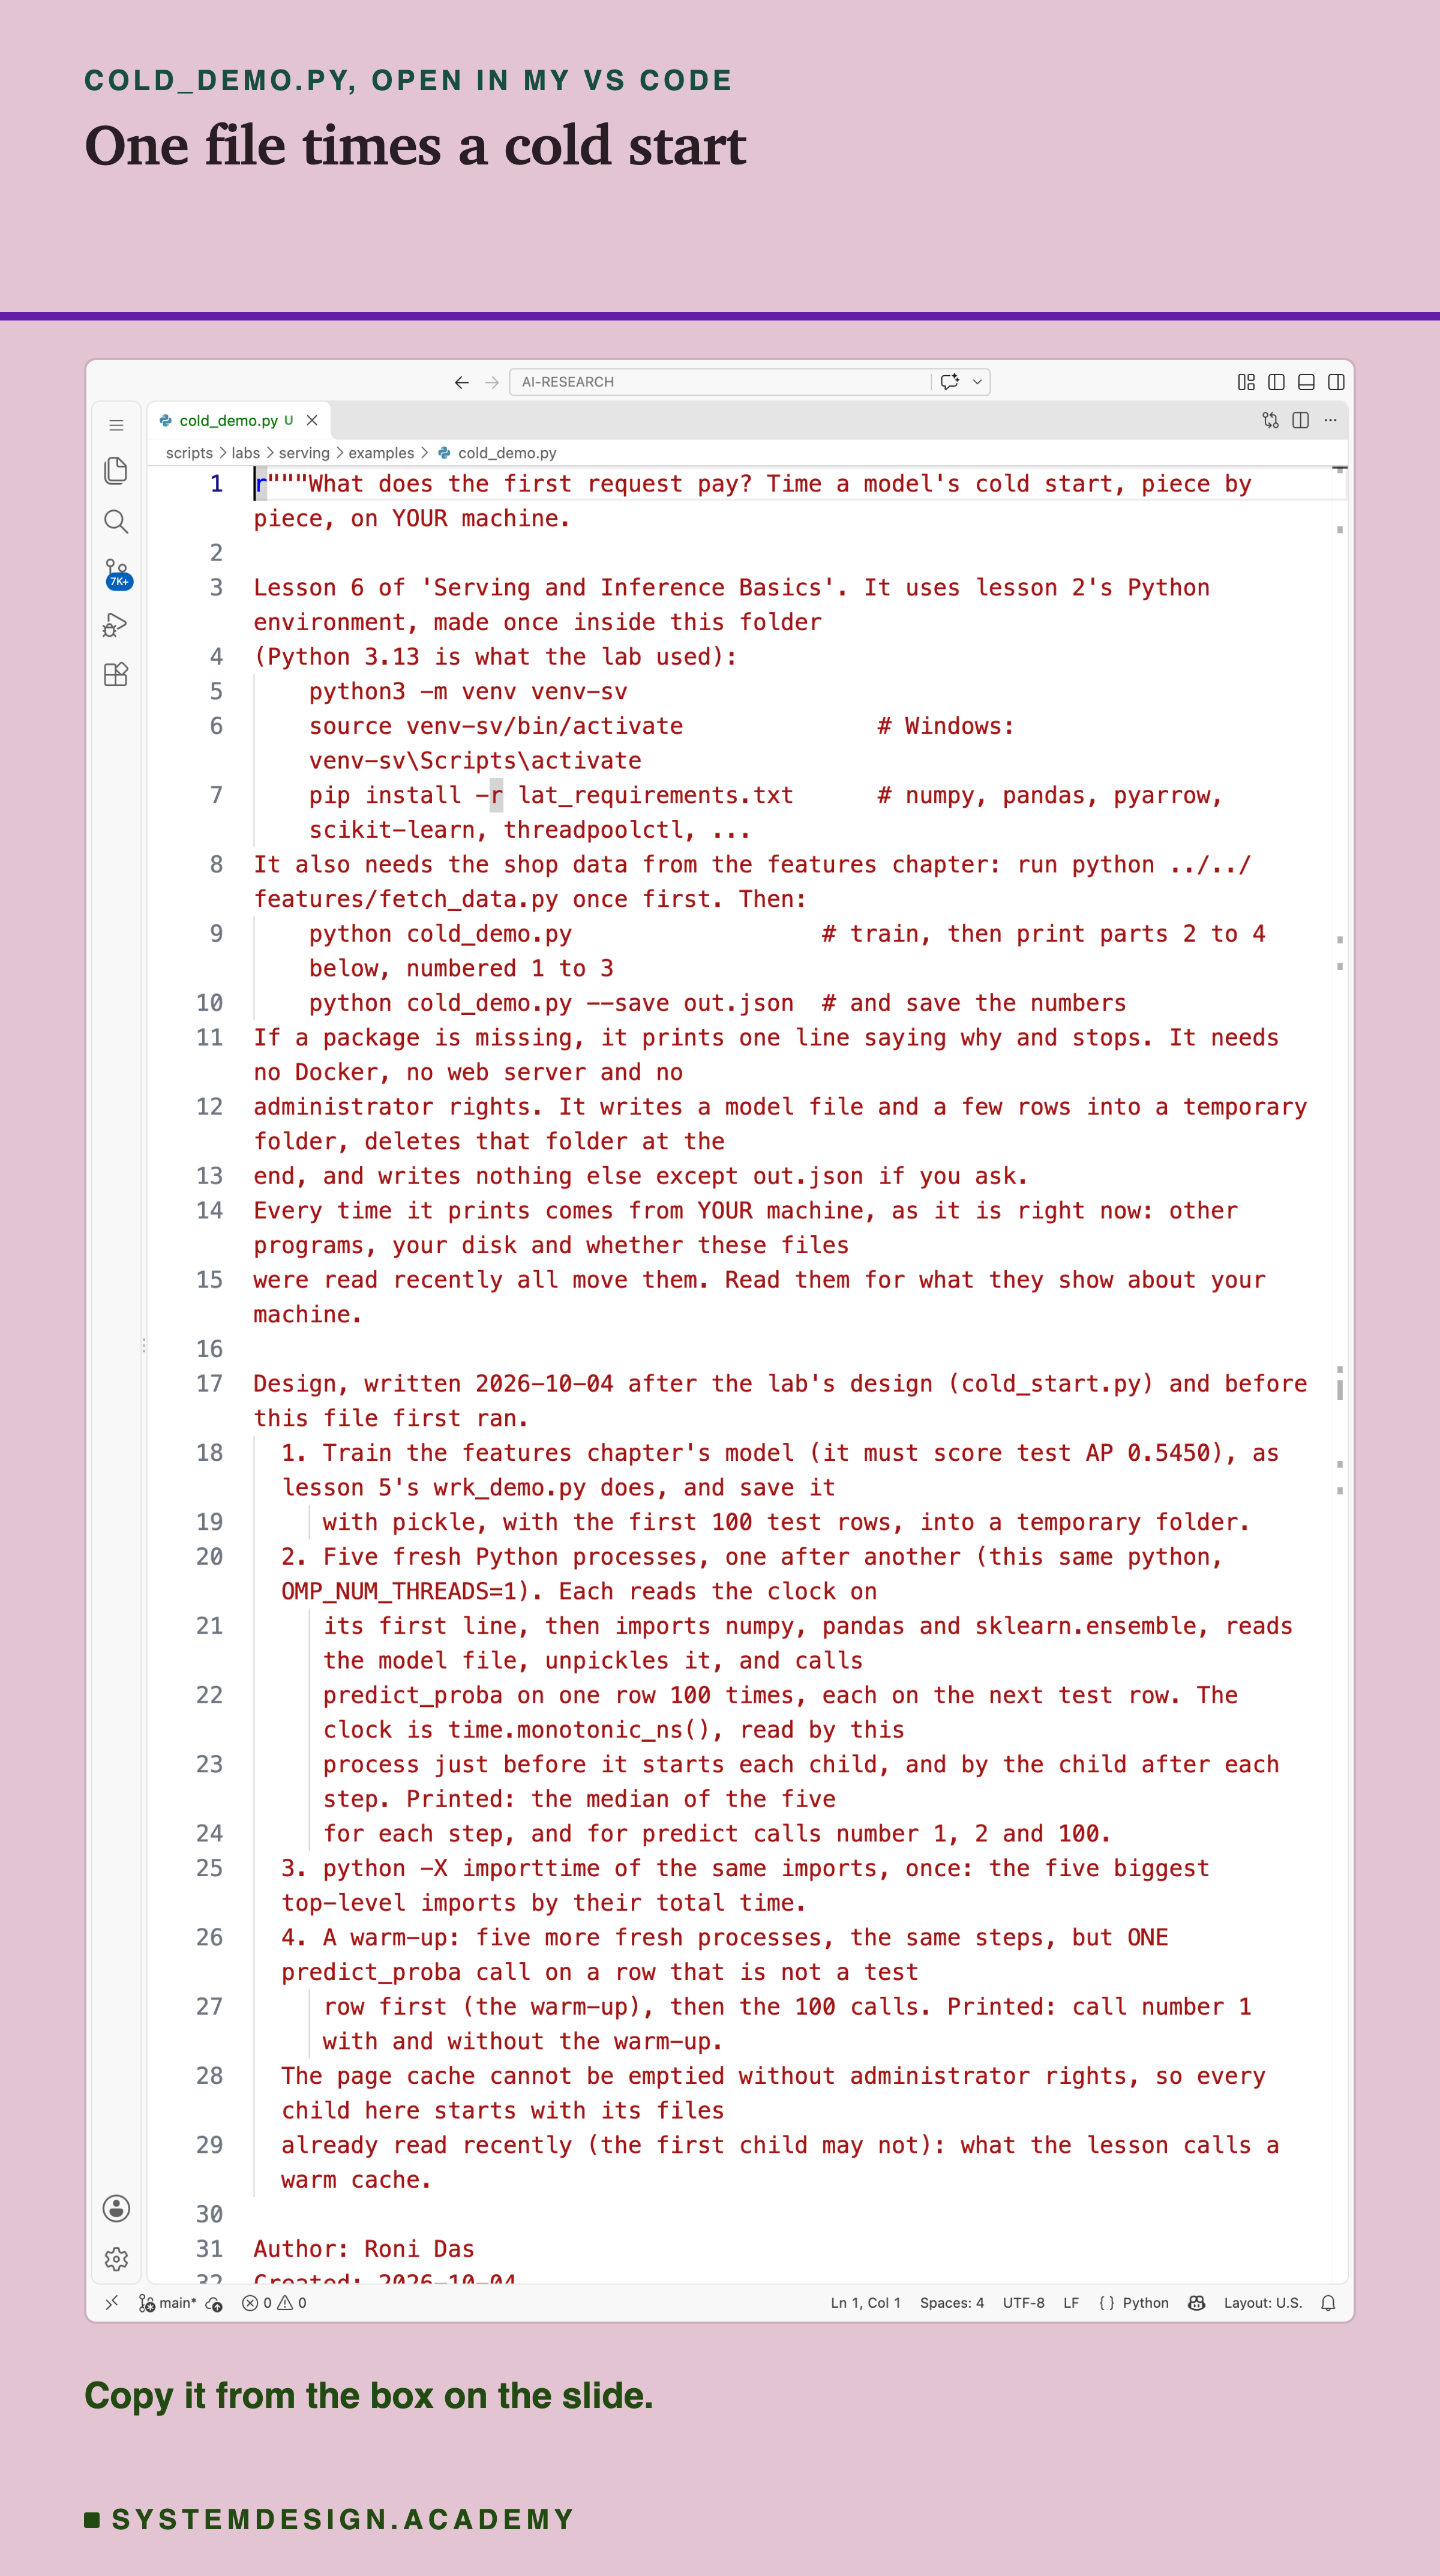
Before you run this lab. The demo uses lesson 2's Python environment, with the same library versions as the lab's box. If you made it for lessons 2 to 5, use it again. If not, make it once, inside the scripts/labs/serving/examples folder:
python3 -m venv venv-sv
source venv-sv/bin/activate        # on Windows: venv-sv\Scripts\activate
pip install -r lat_requirements.txt
I used Python 3.13. Then run python ../../features/fetch_data.py once, which downloads the shop data. Now run python cold_demo.py. It needs no Docker, no web server and no cloud account. It writes a model file into a temporary folder and deletes the folder at the end.
The first line it prints says the times come from your machine. Your disk, your processor and whatever else is running all move them. The demo cannot empty your page cache without administrator rights, so every process after the first starts with its files already in memory.
Pick a Way to Start
This box holds the real results from the lab. It needs nothing but Python, so it runs in your browser. It has no model and no clock: it only looks up what the box measured.
Press Run. It shows arm A, the plain case, and then the arm you pick, so you can always compare. Try START = "B" for an emptied page cache, "D2" for the compiled container, or "C1" for one warm-up. The differences it prints are one median minus another, so they can differ a little from the paired medians on the slides.
The report script writes this box from the lab's raw files, runs it for all eight ways, and checks that each run prints the lab's numbers.
The Lab's Code, Piece by Piece
The lab has one file that runs on my laptop, a few small files that run on the box, and the step script you saw above.
cold_start.py, on my laptop, holds the design in its docstring, written before any run, with dated notes added after. Its commands are check (lesson 2's files match by sha256), status (reads the box's serial console), collect, cost and factcheck. collect calls cold_stats.py, which gzips the box's raw files into results/cold-raw/, passes every log line through cold_redact.py, and does all the arithmetic.
cold_files/cold_service.py is lesson 2's service, rewritten so that every step of starting it reads the clock. It adds GET /ready, which says 503 until a warm-up is done, and GET /startup, which hands the clock readings to the client after the run.
cold_files/cold_client.py starts the service, waits for the port or for , sends the requests and stops the service. It uses only the standard library, for the reason on the machine slide. Its open-loop mode is lesson 4's design, rewritten without numpy.
How to Make a Cold Start Hurt Less
Here is the order I would follow, using only what this lab did.
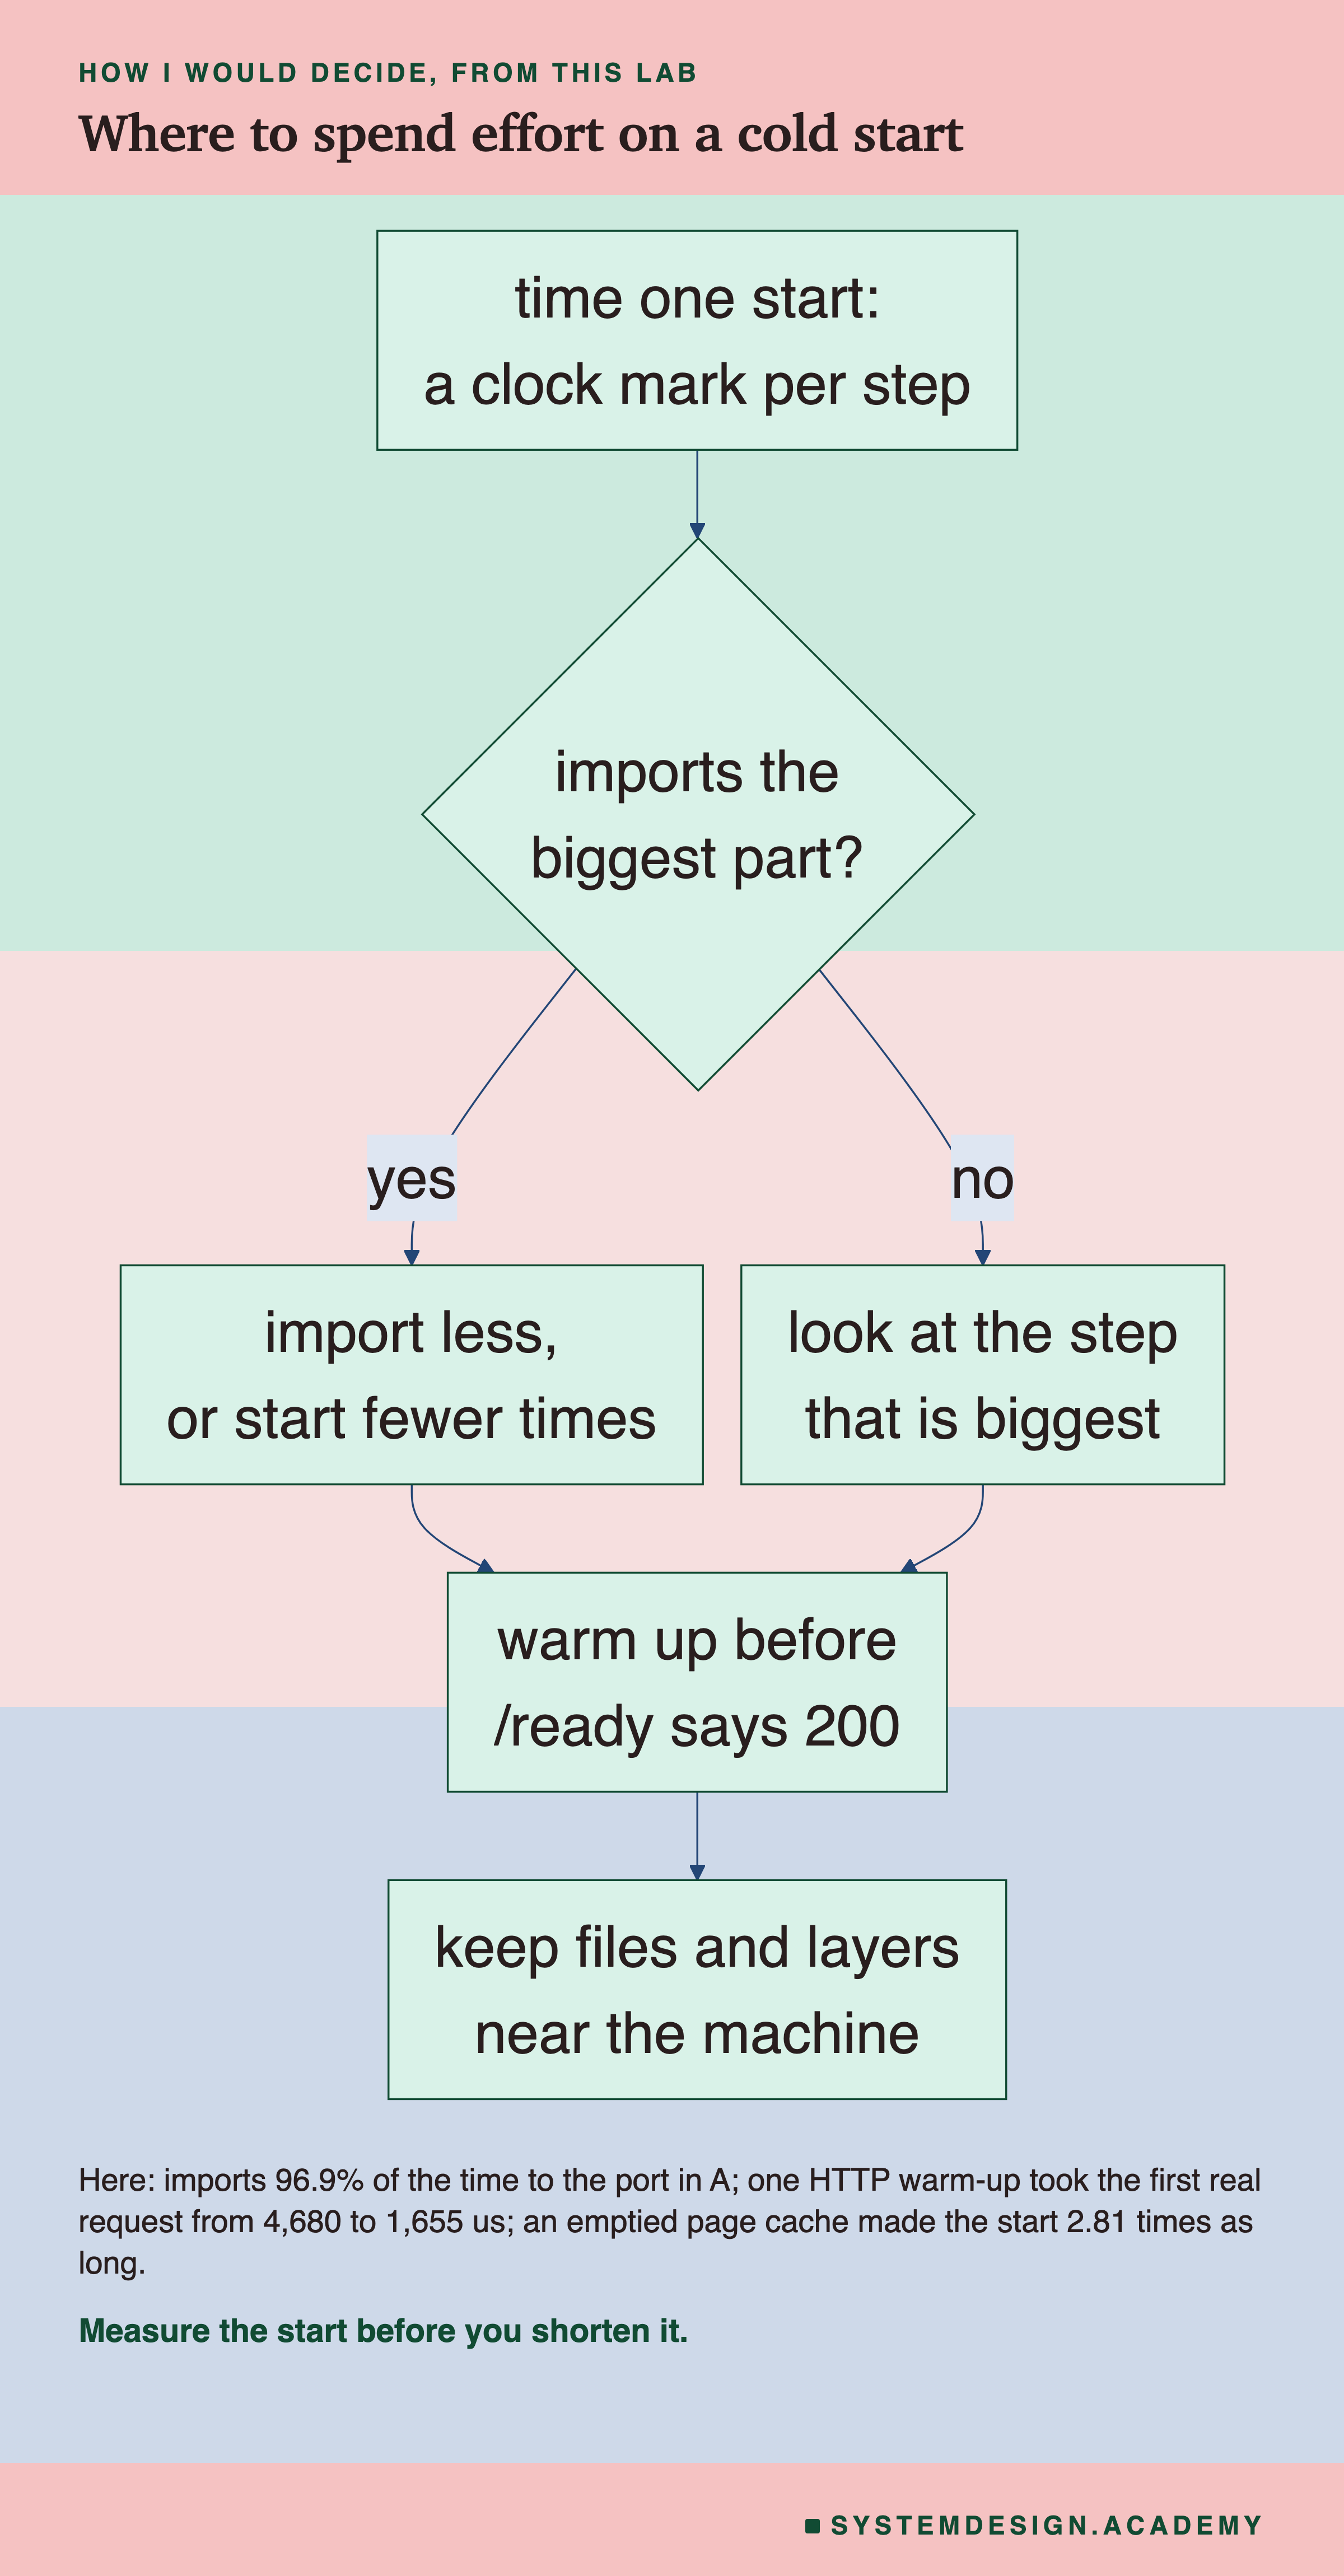
The chart starts by measuring, because the right fix depends on which step is biggest. Here are the same steps in words.
-
Time one start, step by step. Read one clock at each step, as
cold_service.pydoes, or runpython -X importtime. Here the imports were 96.9% of the time until the port opened. -
If imports are the biggest part, import less, or start less often. Import only what the service uses. Start the service once and keep it running, rather than once per request or per job. Here, one start cost 1.5 seconds, and one request about 1 millisecond.
-
Put compiled files in the image. Run
python -m compileallon the standard library when you build it. Here that saved 200 ms on every container start. -
Warm up, then say ready. Send one real request through the whole path, and answer the readiness check with 200 only after it. Here it took the first real request from 4,680 to 1,655 us.
-
Make the ask the right question. A check that a port is open is not enough. Here the port opened 76 ms before the service was warm with 50 warm-ups (C50), and about 16 ms before with one (C1).
When Cold Starts Matter, and When They Do Not
Cold starts matter when a service starts often. If it scales up and down with traffic, or runs as a short job for each batch, every start pays the import time again. Here that was 1.5 seconds on a warm machine and 4.2 seconds on a cold one.
They matter for the first users after a deploy. Every new copy has a first request. Here it cost about 3 ms more than the next, unless a warm-up paid it first.
They matter most on a new machine. Then the files are not in memory, and the image may not be there at all. Here an emptied page cache made the start 2.81 times as long, and loading the image took 8.66 seconds before the start could even begin.
They matter less for a service that starts once and runs for weeks. One slow start a week is not worth much effort. Under steady traffic here, I could not even tell a warmed start from a cold one.
Do not judge the model file first. It is easy to blame the model for a slow start. Here the model took 2.0 ms of a 1,499 ms start. Measure before you shrink the model.
What This Lab Cannot Tell You
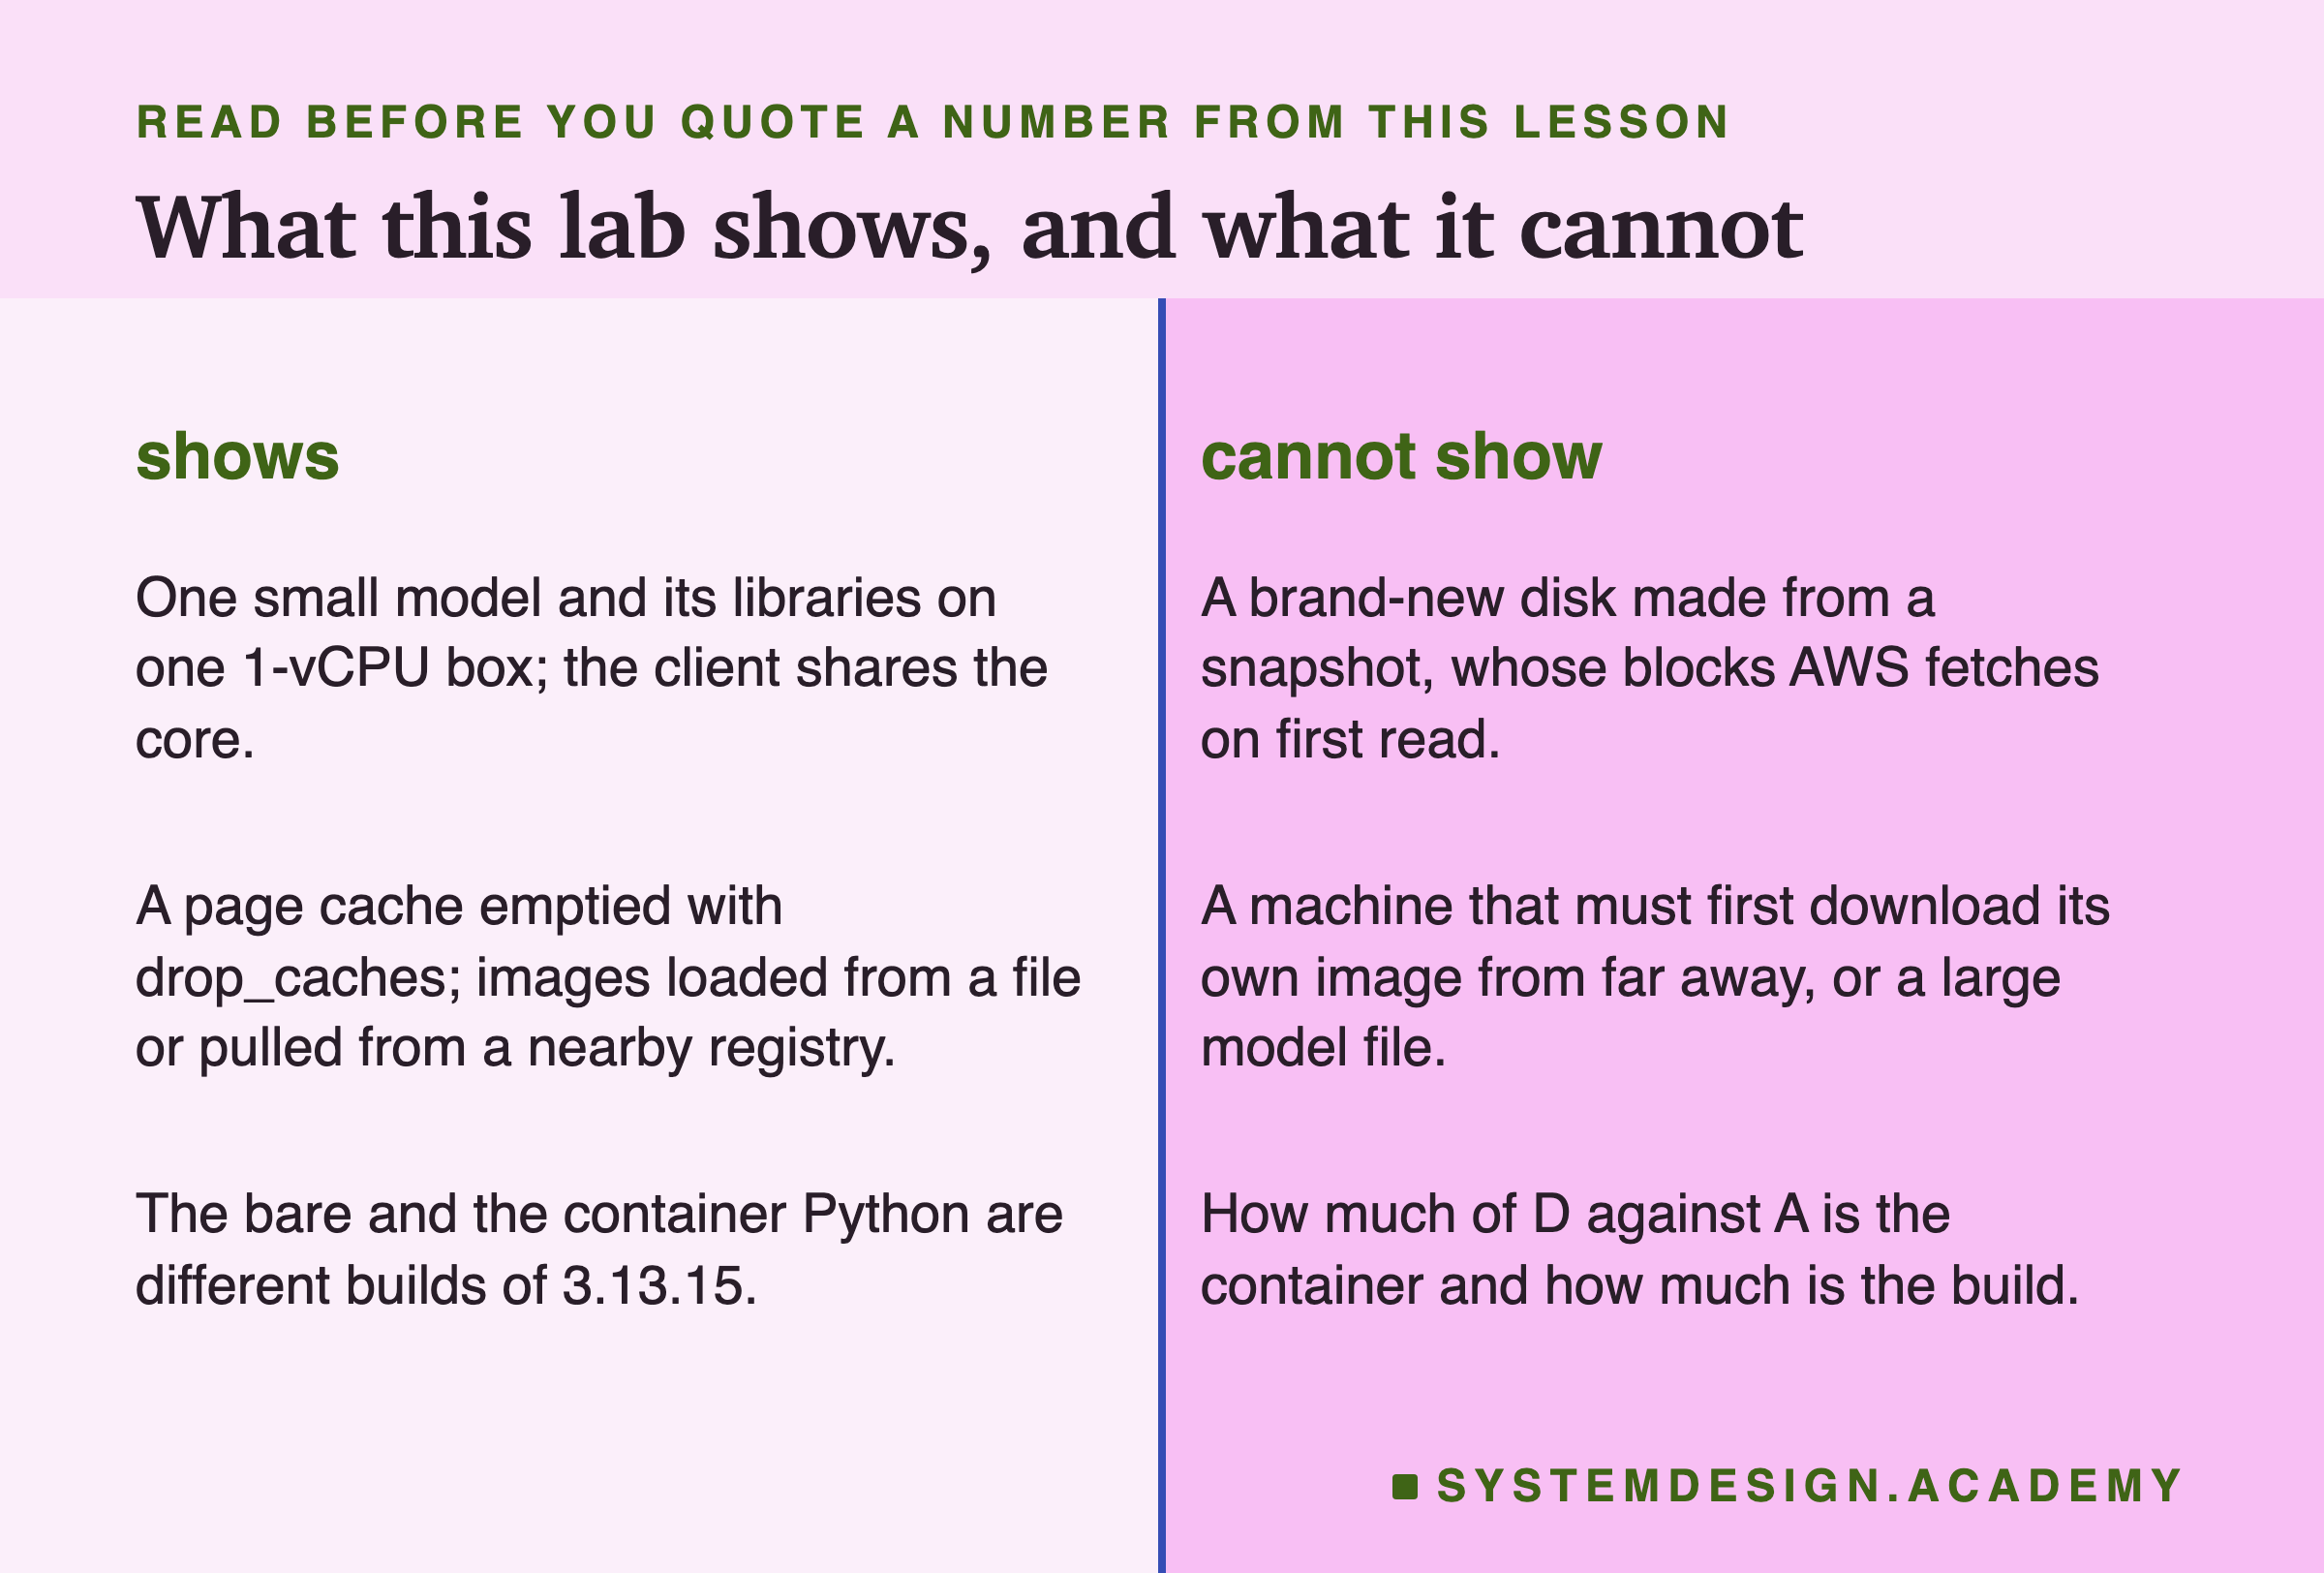
One small model. This model loads in 2 ms. A model of several gigabytes would make loading the model the biggest step, and the answer would change. I did not measure one.
One core, and the client on it. Starting a service is mostly one thread of work, so I expect the shape to hold on bigger machines. But I measured only this one.
A cold cache, not a cold disk. Emptying the page cache simulates a machine that has not read these files recently. A new disk made from a snapshot can be much slower on first read. Pulling a large image from far away can take much longer too.
Two builds of Python. The bare and container Pythons differ (Clang against GCC), so D against A mixes the container and the build. D2 against D does not. But D2's layer also compiled 84 site-packages files that had none (most likely pip's own, which the service does not import; I did not check which).
An emptied page cache is not a reboot. drop_caches keeps pages that running programs have mapped. About 154 MB stayed cached after each drop, including the programs dockerd and containerd. So arm E was cold for the image's files, but itself was warm, unlike just after a reboot.
Labelled additions and repeats. The clock check was changed after the results, as the clock slide explains. The image timings were repeated after the results with a cleaner start, as the image slide explains. Both changes are in the lab's notes, and the first numbers are kept.
What to Do on Monday
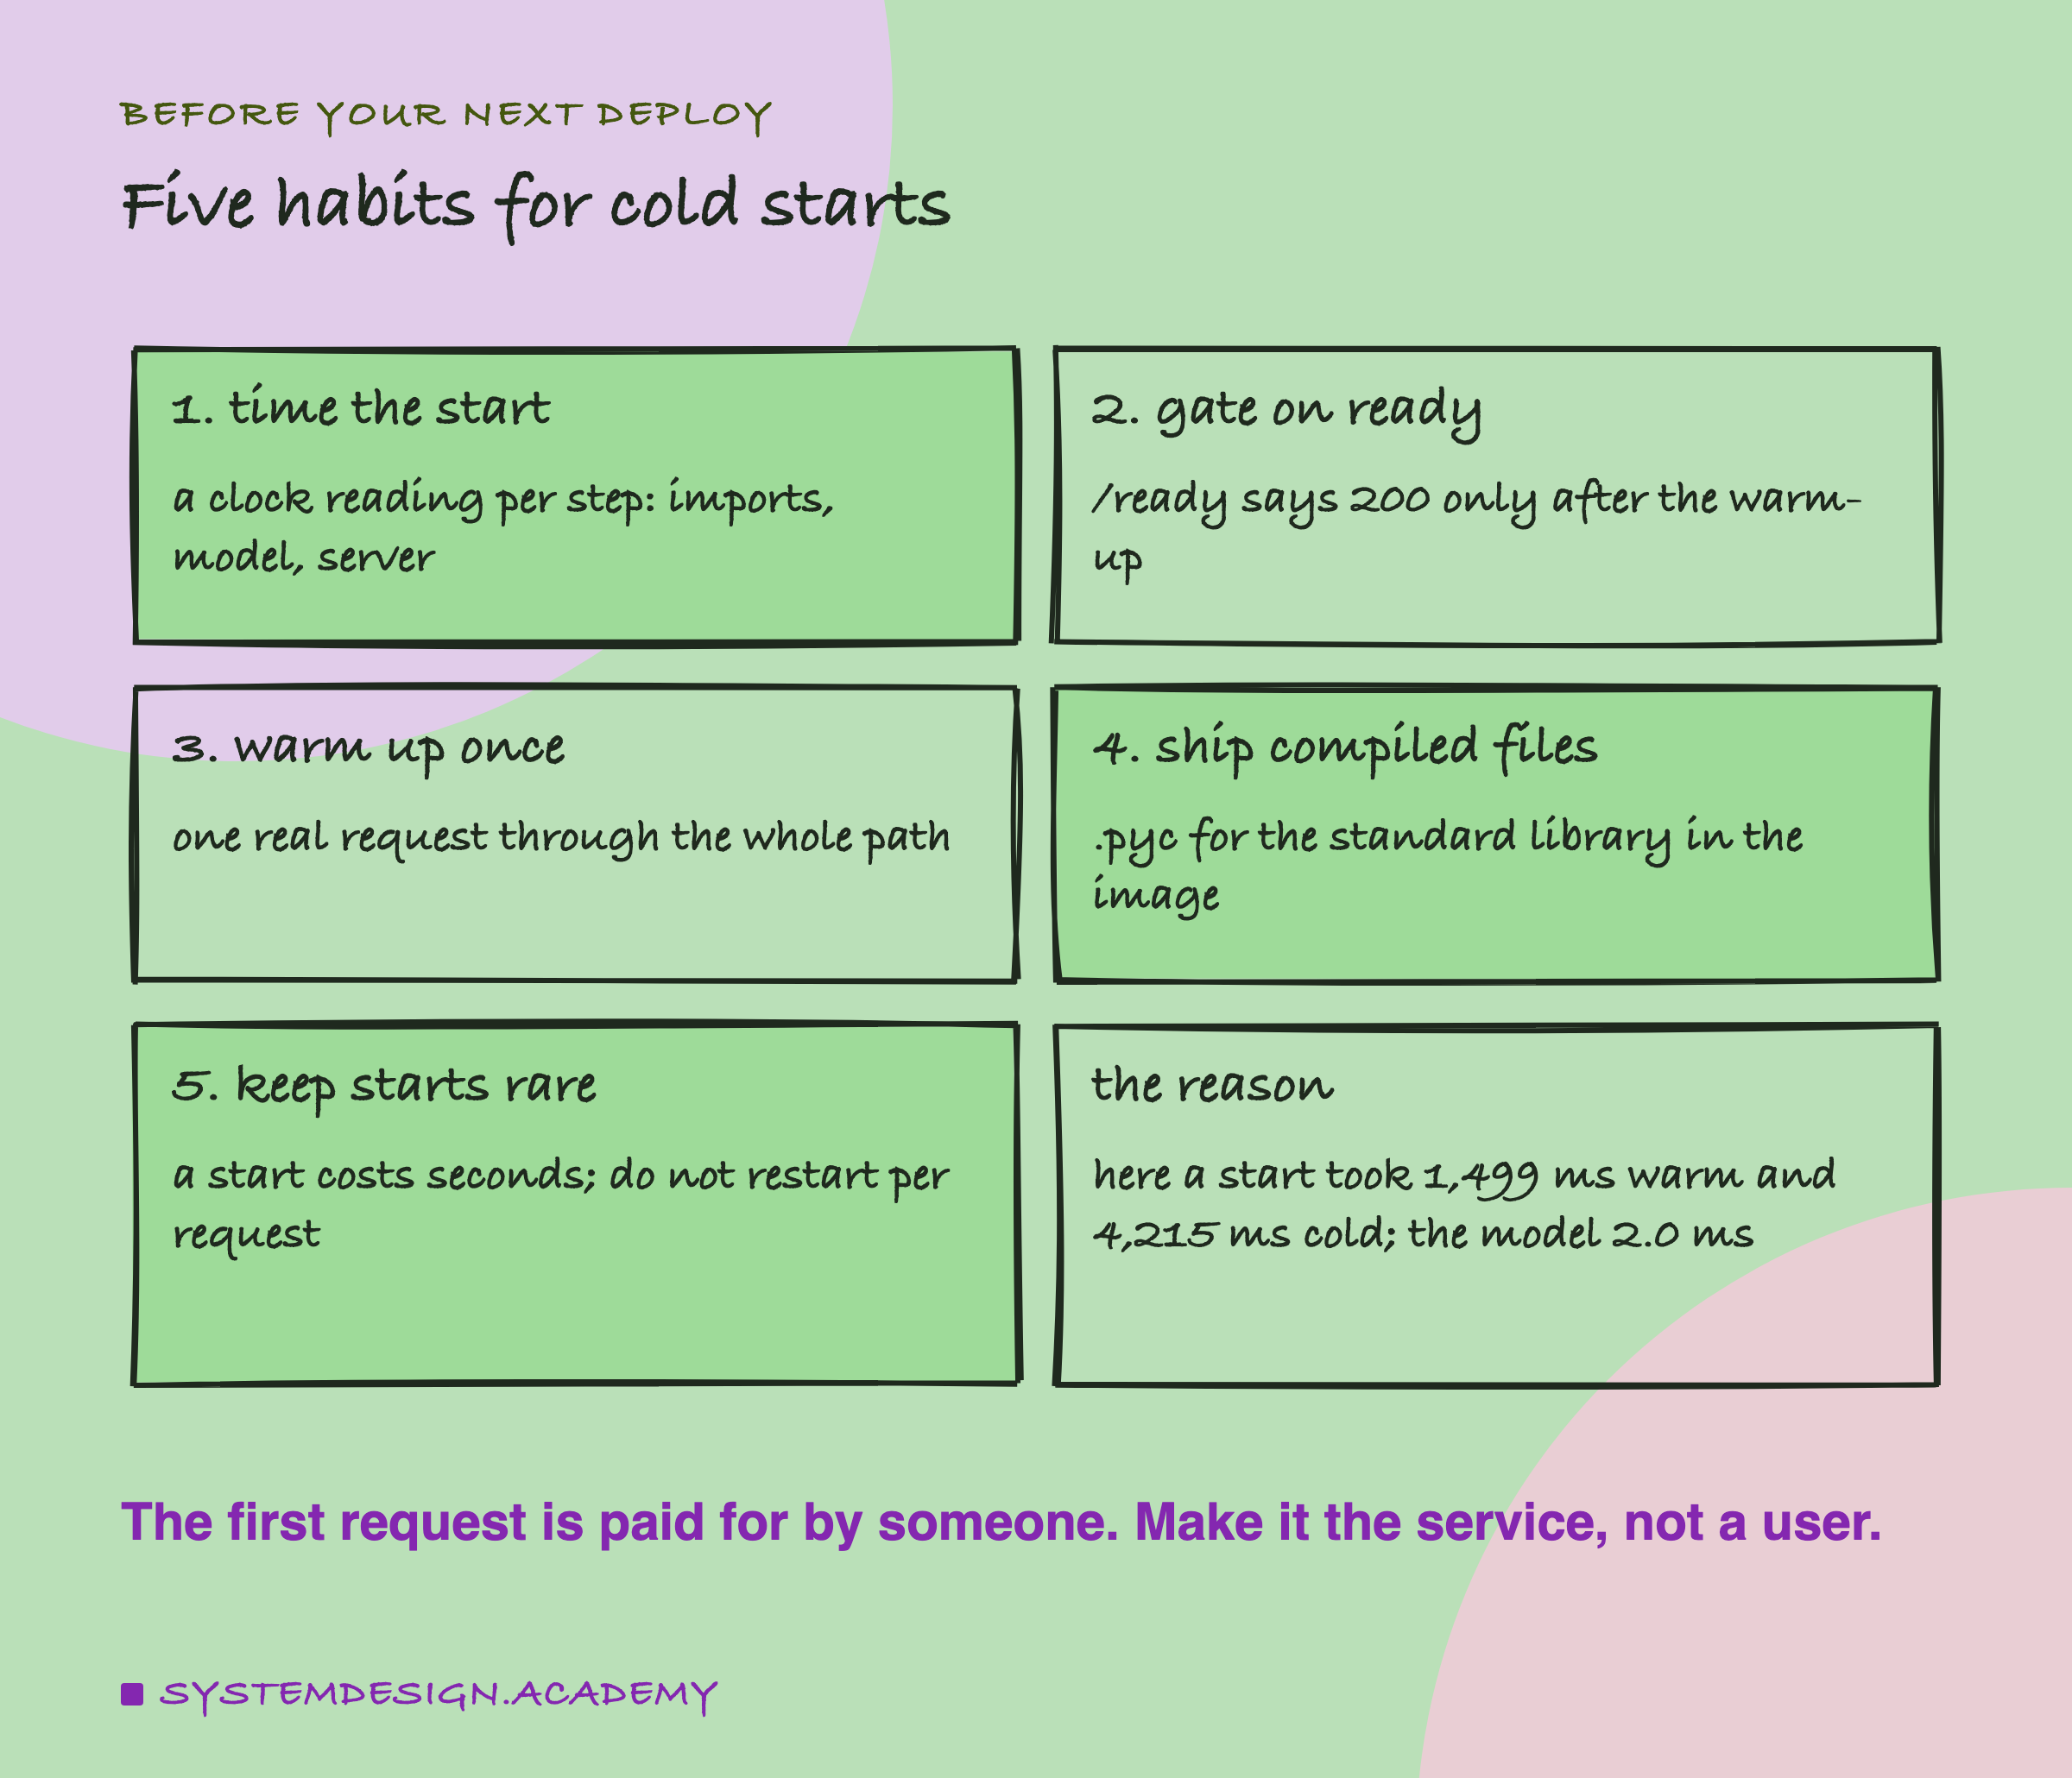
If you take one thing to work on Monday, time one start of your model service. Run python -X importtime -c "import your_service" and sort by the cumulative column. You will probably find, as I did, that the libraries cost far more than the model.
Then look at how your service says it is ready. If the only checks that a port is open, add a /ready route that answers 200 only after one real warm-up request has gone through.
The one idea to keep: a service is not ready when its port opens. It is ready when someone has already paid for the first request, and that someone should be the service.
Knowledge Check
Knowledge Check
4 questions - Score 80% to pass
In arm A, a bare process with its files in memory, which part took most of the time before the port opened?
Why did the image with a compiled standard library (D2) start faster than the plain image (D)?
What did one warm-up request behind a /ready check (C1) do to the first real request?
Under 539 random arrivals a second, what did the lab find for F (no warm-up) against G (50 warm-ups and /ready)?