System design interview guide
Design a Top-K System (Heavy Hitters): Count-Min Sketch, Heaps and Windows
Two courses by the author of this page:
770 lessons · 18 free to read
₹499 in India · $49 elsewhere, once
Get System DesignYou own this course
204 lessons · 10 free to read
₹999 in India · $49 elsewhere, once
Get AI EngineeringYou own this course
Suppose a video site records 10 billion views a day and wants a list of the 10 most-viewed videos in the last hour, the last day and all time. That is about 116,000 views every second on average, and close to 350,000 at the busiest time of day. Most videos get a handful of views. A few get millions. You cannot sort every video every second, and keeping an exact count for every video in every window costs a lot of memory. This page shows how to find the few big ones cheaply, and how to be honest about the error.
A top-k system finds the k items that occur most often in a stream of events, such as the 10 most-viewed videos in the last hour. The items that occur most often are called heavy hitters. The usual design has two paths. The fast path reads view events from a log such as Kafka, sends each video to one counting worker by hashing its id, and counts views per time window. To save memory, each worker counts with a count-min sketch: a small table of counters, d rows by w columns, where each row hashes the video to one counter. To add a view, add 1 to one counter in every row. To read a count, take the smallest of those d counters. The answer is never too low. With width w = e/ε and depth d = ln(1/δ), it is too high by more than ε times the total number of views only with probability δ. A sketch cannot list its videos, so each worker also keeps a min-heap of size k: a small list that always knows its smallest member, so a new video replaces that member when its estimate is larger. The workers send their lists to one merger, which builds the global top k. The slow path stores every view and recounts them exactly every hour, then replaces the estimates. The traps are merging lists from partitions that split a video's views (the true winner can vanish), sliding windows, and one viral video overloading one worker.

Where it shows up
This is a standard question in system design interview preparation. Hello Interview, for example, teaches it as 'Top K YouTube videos' over the last hour, day, month and all time. It also hides inside other questions: trending hashtags, the most-searched queries for autocomplete, the busiest IP addresses for attack detection, and the top ads in an ad click aggregator. Interviewers like it because it tests counting at scale, stream windows and approximate data structures in one problem.
Spec sheeta Top-K System
- 01View events per second
- about 116,000 average, 350,000 peak
- 02Raw event log
- about 1 TB a day
- 03Exact counts for one day
- about 32 GB
- 04Count-min sketch for one day
- about 152 MB
worked through below, with the maths
Why this question is asked
The problem looks easy: count views and sort. The interviewer wants to see where that breaks and what you do next. First, can you estimate the load and the memory before you pick a tool? Second, do you know when exact counting is enough, and when an approximate structure such as a count-min sketch is worth its error? Third, can you state that error exactly, and explain why a sketch alone does not give you the top k? Fourth, do you understand time windows, and why a sliding window costs more than a tumbling one? Fifth, can you spot the trap in merging partial top-k lists from many machines, and fix it? Strong candidates also raise hot keys (one item that gets far more traffic than the rest) without being asked, and they offer a slow exact path next to the fast approximate one.
This page is the free part.
The course goes deeper on the Top-K System design
₹499 in India$49 everywhere elseonce, for the whole course
The System Design course covers the Top-K System design across a run of lessons, not one page. These 4 alone are about 99 minutes of step-by-step reading, every one with a quiz.
- Stream Processing
Process data as it arrives, real-time analytics, fraud detection, and event-driven architectures.
- Tumbling Windows
Fixed-size, non-overlapping time windows, count events per minute, average per hour.
- Hopping Windows
Fixed-size windows that overlap, sliding averages with configurable hop interval.
- Sliding Windows
Windows that slide with every event, continuous recalculation over the most recent N events or T time.
all part of
System Design Masterclass
770 lessons · about 283 hours · 18 free to read
₹499in India, by UPI
$49everywhere else, by PayPal
The concepts were explained in a clear and structured way, with practical examples that made even complex system design topics easier to understand. I especially liked the focus on real-world architecture, scalability, trade-offs. The content was well designed, engaging, and highly useful for anyone looking to strengthen their system design skills. Highly recommended for software engineers preparing for system design interviews or wanting to build a stronger foundation in designing scalable systems.
You own this course
Continue with Stream Processingpay once,
yours for life
Live from the course bench
Before you design Top-K System (Heavy Hitters), try the questions it rests on.
Real interview questions, live diagrams and measured lab results, pulled at random from the lessons. A new set every time you come back.

Requirements
Always clarify these in the first 5 minutes of the interview. Do not start drawing boxes until both lists are agreed.
Functional requirements
- Record a view event for any video: the video id, the time of the view and the viewer's region
- Return the top k most-viewed videos for the last 1 hour, the last 24 hours and all time, with k up to 1,000
- Return a view count next to each video in the list, marked as an estimate or as exact
- Show new trends quickly: a video that suddenly gets many views appears in the hourly list within about a minute
- Replace estimates with exact counts once each hour has been fully recounted
Non-functional requirements
- Take in about 350,000 view events per second at peak without losing any
- Answer a top-k request in tens of milliseconds, because the list is computed ahead of time
- Keep counting memory small and bounded, even when hundreds of millions of different videos are watched in a day
- State the error: every estimate is never below the true count, and is too high by at most a known amount with a known probability
- Survive the loss of a counting machine without losing counts, by replaying the log from a saved position
- Stay balanced when one video takes a large share of all views
Back-of-envelope scale estimates
Show your math. Pulling numbers from thin air signals you have not thought about the load.
View events per second
about 116,000 average, 350,000 peak
Assume 10 billion views a day. These are assumptions for the interview; say them out loud before you use them. 10,000,000,000 / 86,400 seconds = 115,741 views per second on average. Assume the busiest hour runs 3 times the average: 3 x 115,741 = 347,222, about 350,000 per second.
Raw event log
about 1 TB a day
Assume each view event is about 100 bytes (video id, time, region, a few ids). 10,000,000,000 x 100 bytes = 1,000,000,000,000 bytes = 1 TB a day. The slow exact path keeps this in cheap object storage.
Exact counts for one day
about 32 GB
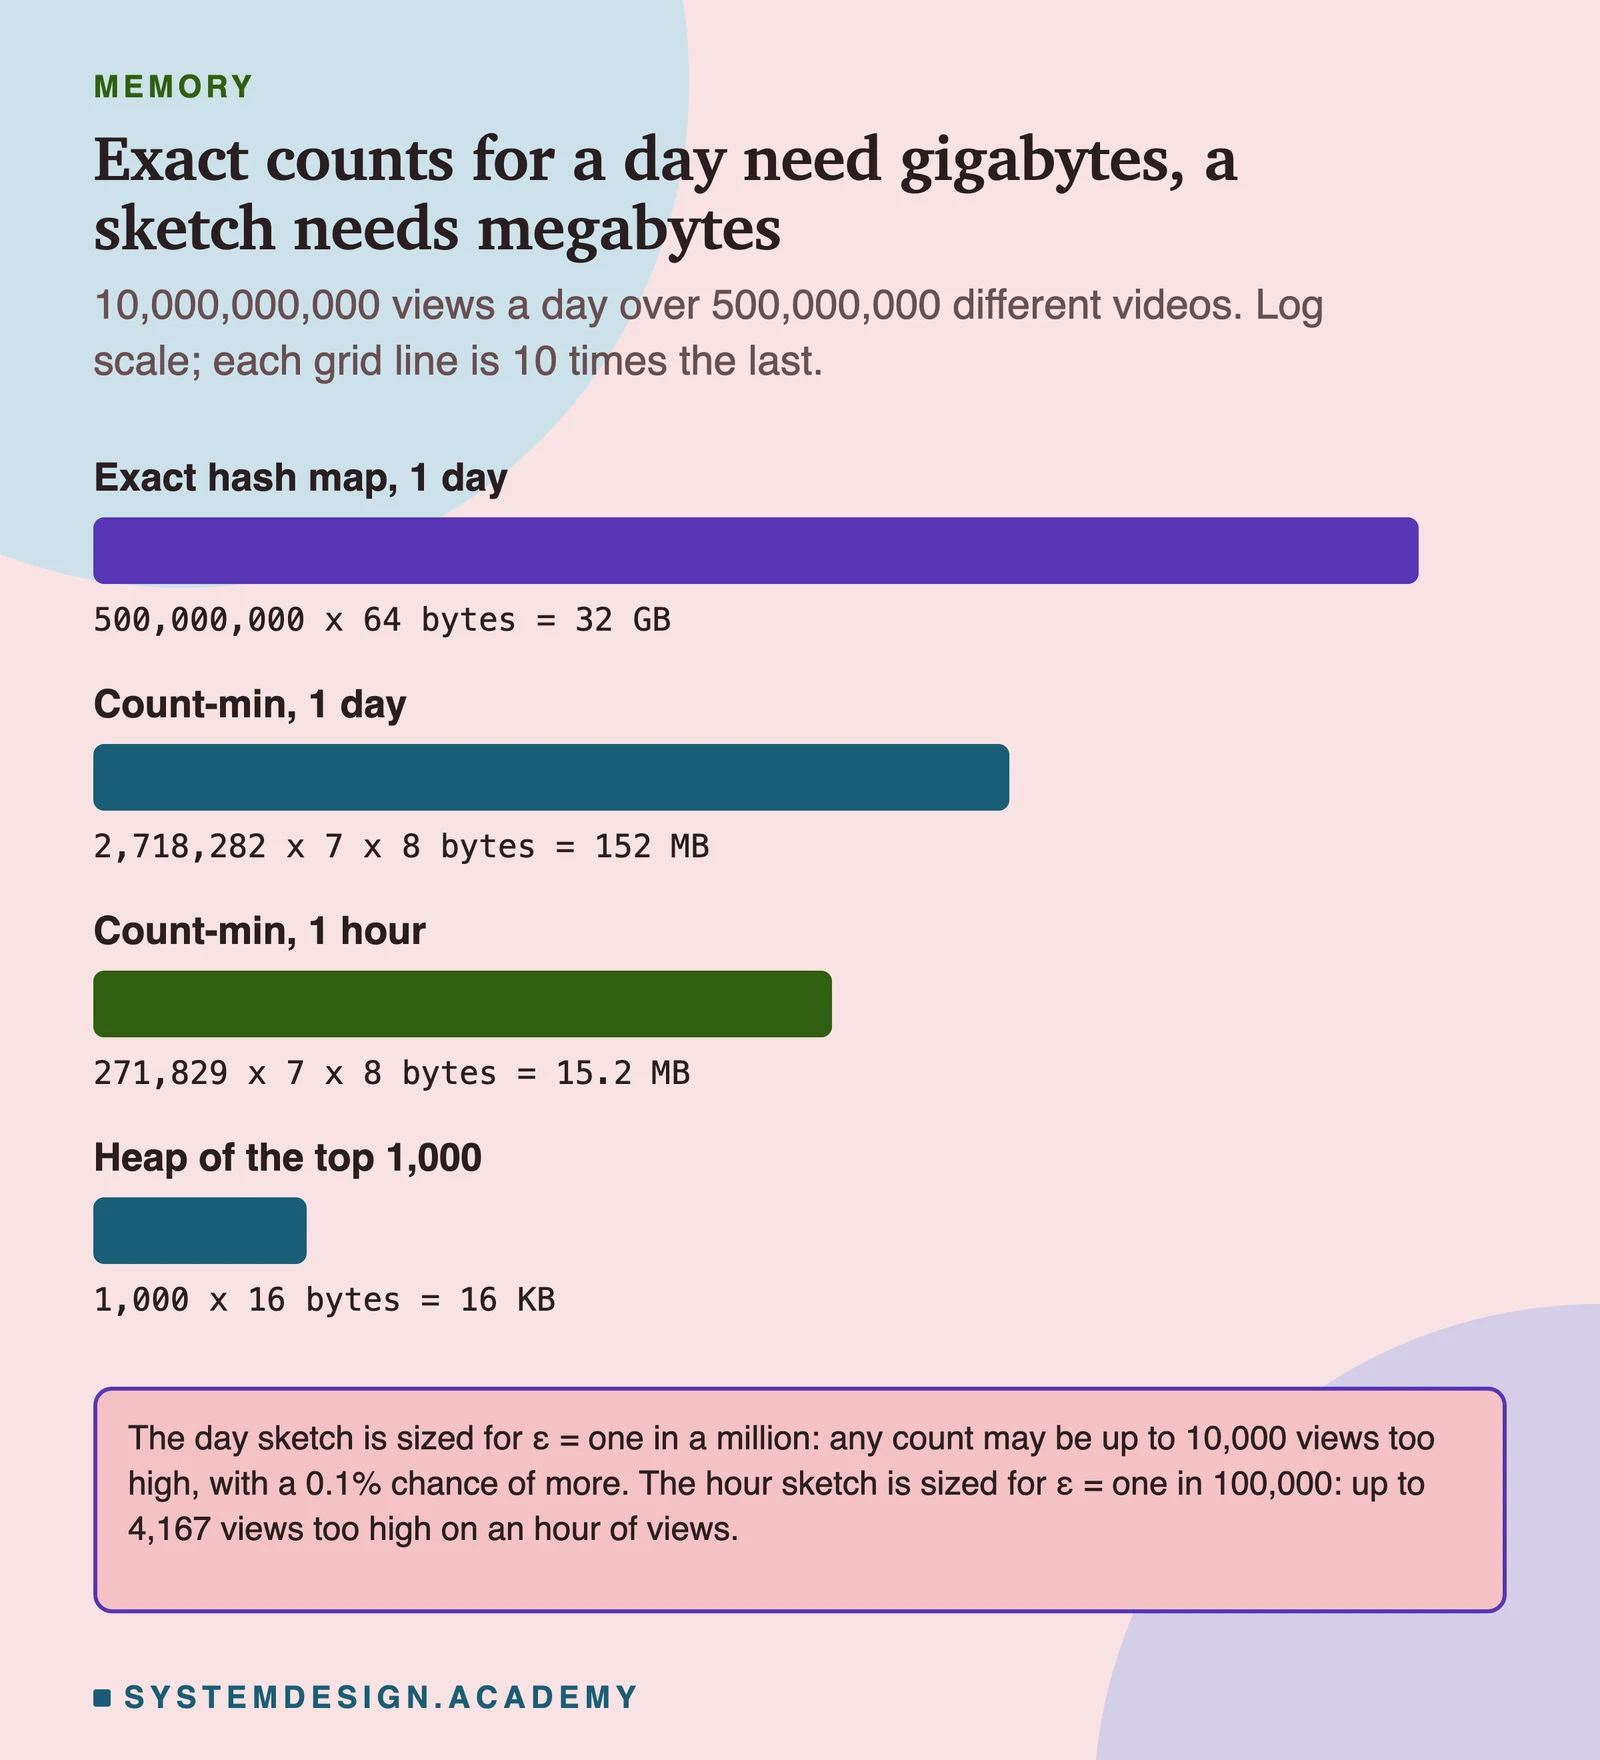
Assume 500 million different videos get at least one view in a day. An exact hash map (a table from video id to count) needs about 64 bytes per entry once you include the id, the count and the table's own overhead. 500,000,000 x 64 bytes = 32 GB. Spread over 14 machines that is about 2.3 GB each, which is possible. It grows with every extra window and every extra breakdown, such as one count per country.
Count-min sketch for one day
about 152 MB
Pick ε = 0.000001 (one in a million) and δ = 0.001. Width w = e / ε = 2,718,282 rounded up. Depth d = ln(1 / 0.001) = 6.9, rounded up to 7. 2,718,282 x 7 = 19,027,974 counters. At 8 bytes each (a day's total of 10 billion does not fit in 4 bytes): 152 MB. Error: at most ε x 10,000,000,000 = 10,000 views too high, with probability at least 0.999.
Sliding last hour, from 5-minute slices
about 183 MB
One hour is 10,000,000,000 / 24 = 416.7 million views. With ε = 0.00001 the error is at most 4,167 views. Width 271,829, depth 7, 8 bytes: 15.2 MB per sketch. A sliding hour kept as 12 five-minute sketches of that size: 12 x 15.2 = 183 MB. The top-1,000 heap itself is tiny: 1,000 x 16 bytes = 16 KB.
Counting workers
about 7 at peak, run 14
Assume one worker can count 50,000 events per second. Measure this on your own machines. 347,222 / 50,000 = 6.9, so 7 at peak. Run about twice that, 14, so a lost machine or a viral video does not push the others past their limit.
High-level architecture
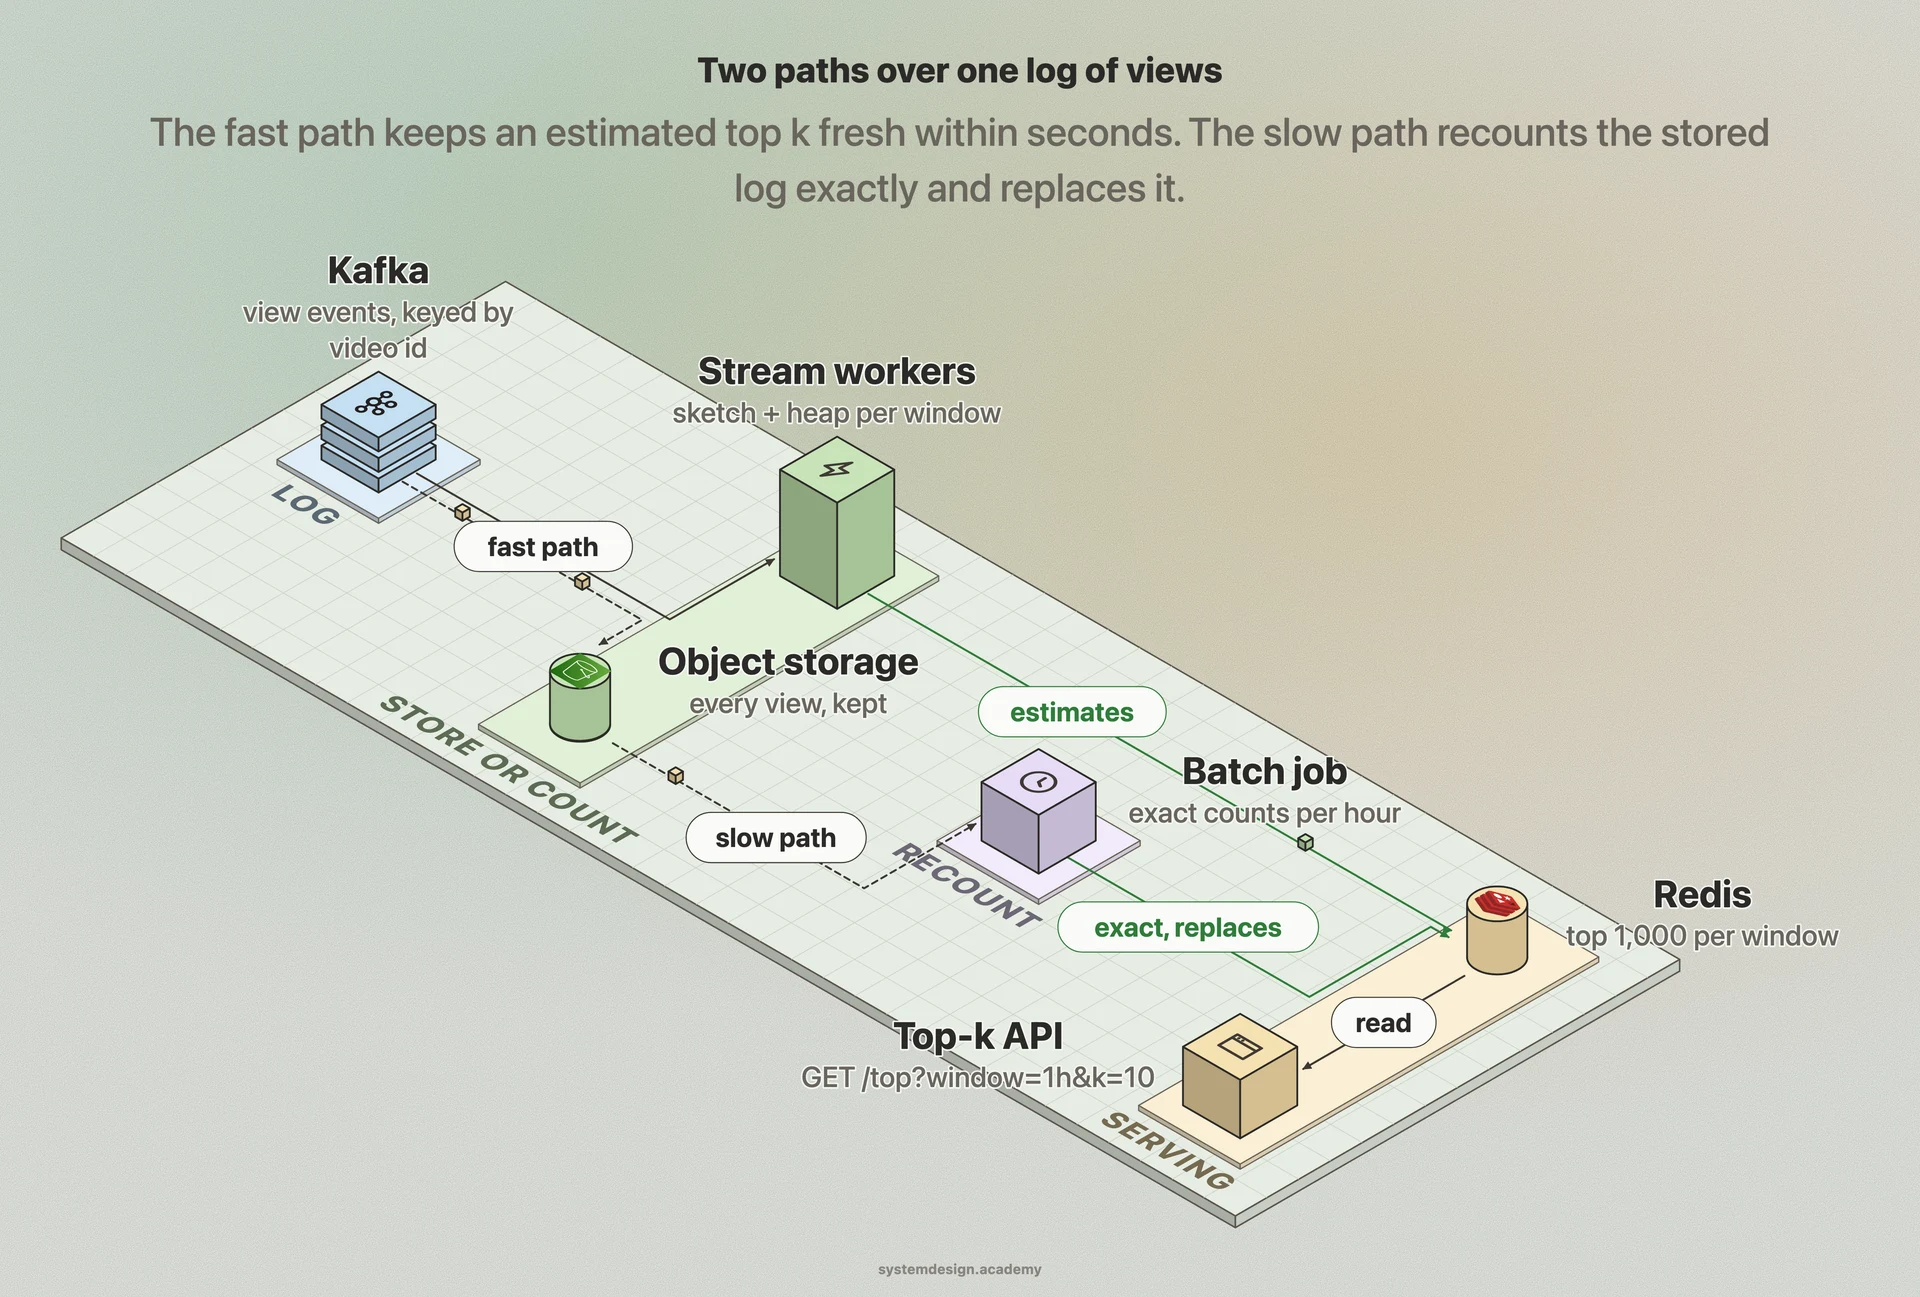
Draw two paths that start from one log. The log is Kafka, a service that stores events in the order they arrive and lets many readers read them at their own pace. A topic (one named stream) is split into partitions, and all events that share a key go to one partition. This works because a hash function turns the key into a partition number, and a given key always produces one fixed number. Video players send one view event per view, and the key is the video id. The fast path is a set of stream workers, for example Apache Flink jobs. A stream worker is a program that reads events one by one, as they arrive, and keeps running state in memory. Each worker reads some of the partitions, so it owns every view of its own videos. For each window (last hour, last day), it keeps a count-min sketch to count views and a min-heap that holds its top 1,000 videos by estimated count. Every few seconds each worker sends its list to a small merge step, which builds the global top 1,000 and writes it to Redis, an in-memory data store that answers simple reads very fast. The top-k API only reads Redis, so a request never touches the counting. The slow path copies every event into object storage, cheap storage for large files, such as Amazon S3. Once an hour has passed, plus some time for late events, a batch job (a program that processes a large stored set of data in one run) counts that hour exactly: group by video id, count, keep the top 1,000. The exact list replaces the estimate in Redis. The all-time list is the stored all-time count of each video plus the exact hours that are done. This pairing, a fast layer for the newest data and a batch layer that later corrects it, is what Nathan Marz called the lambda architecture.
In a real interview, sketch this on the whiteboard before diving into any single box.
One view, from a click to the top-10 list
Follow a single view of video v42 through both paths. This is a good order to explain it in.
- 1
Recorded
The player sends a view event: video v42, time 10:07:31, region eu. The ingest service writes it to the Kafka topic views, with the key v42.
- 2
Routed
Kafka hashes the key, and the hash picks one partition. Every view of v42 lands in that partition and is read by one worker.
- 3
Counted
The worker adds 1 to one counter in each row of the sketch for the current 5-minute slice, then reads the hour's estimate for v42: its estimate in each of the last 12 slice sketches, added together.
- 4
Ranked
If v42 is already in the worker's heap, its count is updated. If not, and its estimate beats the smallest count in the heap, v42 replaces that video.
- 5
Merged
Every few seconds, each worker sends its top 1,000 with counts. The merge step keeps the largest 1,000 overall. This is exact for the estimates, because no video's views are split across workers.
- 6
Served
The merged list goes into Redis under a key such as top:1h. GET /top?window=1h&k=10 reads the first 10 entries.
- 7
Archived
This event is also written to object storage, in a folder for its hour.
- 8
Recounted
After the hour closes and late events have had time to arrive, a batch job counts every view of that hour exactly and writes the exact top 1,000.
- 9
Corrected
The exact hourly counts replace the estimates. Daily and all-time totals are built by adding exact hourly counts per video, never by adding hourly top-k lists.
Core components
Walk through each service. The interviewer wants to hear what each one owns, not just the names.
Ingest service and Kafka topic
The ingest service accepts view events from players and writes them to a Kafka topic keyed by video id. Kafka can keep the events for days (how long is a setting), so any worker that crashes can start reading again from the last position it saved. Keying by video id puts all views of one video in one partition.
Stream counting workers (fast path)
Each worker reads its partitions and keeps, per window, a count-min sketch and a min-heap of its top 1,000 videos. It saves its state and its read position in the log together, regularly, so after a crash it reloads the state and replays only the events after that position. Saving both together is what stops a replay from losing views or counting them twice.
Count-min sketch
A fixed-size table of counters, d rows by w columns, with one hash function per row. It answers 'about how many views did this video get?' in fixed memory, however many different videos there are. The answer can be too high, never too low.
Min-heap of size k
A small structure that holds k videos and can always tell you the smallest of them in one step. A new video gets in only if its count beats that smallest one, which is then removed. It holds the video ids, which the sketch cannot list.
Merge step
Collects each worker's top list every few seconds and keeps the largest k' overall (k' is a longer list than the k anyone asks for, here 1,000). Because each video lives on one worker, this merge is exact for the estimates. It is one small process per window, with a standby copy.
Serving store (Redis) and top-k API
Redis holds the latest top 1,000 for each window as a ranked list. The merge step writes each new list under a new key and then switches the window's name to point at that key in one step, so a reader never sees half a list. The API reads the first k entries and marks each count as an estimate or exact. A list that changes every few seconds is also easy to cache in front of the API.
Object storage and batch recount (slow path)
Every event is stored in hourly folders. A batch job counts each closed hour exactly and writes exact hourly counts per video, which replace the estimates and feed the daily and all-time totals. If the fast path had a bug, the slow path fixes the numbers.
Data model
Pick the right store per table. Justify each choice with the access pattern, not by reflex.
views (Kafka topic)key: video_idevent_timeregionviewer_id (for removing duplicates and fraud checks)The log of every view. The key decides the partition, so all views of one video are read by one worker. Events are kept for several days so workers can replay them.
window state (in each worker's memory, saved regularly)window (1h, 24h)slice_start (every 5 minutes)sketch counters (d x w)heap (video_id, estimate) x 1,000One sketch per 5-minute slice, and the heap of the current leaders. The window's count for a video is the sum of its estimates over the slices in the window.
topk (Redis, one key per window)key: top:1h, top:24h, top:allmember: video_idscore: view countflag: estimate or exactRewritten by the merge step every few seconds and by the batch job once an hour. Reads take the first k members by score.
hourly_counts (batch output)hourvideo_idviews (exact)Exact counts for every video in every closed hour. Daily and all-time numbers are sums of these rows per video. Keep all the rows here, not only each hour's top list, because adding top lists loses videos (see the merging section).
all_time_countsvideo_idviews (exact, up to the last closed hour)A running total per video, increased once per closed hour from hourly_counts. The all-time top k is this table's top k plus the current hour's estimates.
Deep dives
These are the conversations the interviewer is steering you toward. Practice each one until you can talk through it without notes.
The two paths: fast estimates and a slow exact recount
Two needs pull against each other. Viewers want the trending list to move within a minute. The business wants the numbers to be right, because people may be paid by views or rank. So build two paths. The fast path counts in memory as events arrive and accepts a small, stated error. The slow path stores every event and later counts each closed hour exactly, then overwrites the estimate. This is the lambda architecture. Nathan Marz, who named it, put it this way: the realtime layer only covers the last few hours of data, and everything it computes is later replaced by the batch layer. A bug in the fast path therefore fixes itself within the hour. The cost is two code paths that must agree on what counts as a view. If that worries the interviewer, mention the kappa architecture: one stream path, and to recount you replay the stored log through a fixed version of the stream code. For a top-k system the lambda shape is common because the fast path is approximate on purpose and the slow path is exact on purpose. Late events need a rule on both paths. A view that arrives 3 minutes late must count toward the hour in which it happened. The batch job waits a short grace period before it closes an hour. Watermarks, which tell a stream job how far event time has progressed, are covered in depth in the ad click aggregator walkthrough on this site.
Exact counting first, and where it gets expensive
Always start with the simple answer, then show where it hurts. The simple answer is a hash map from video id to count, plus a sort. Sorting every video on every request is too slow, so keep a min-heap of the top k next to the map instead. With the views partitioned by video id across 14 workers, the exact map for one day is about 32 GB in total, roughly 2.3 GB per worker. That is fine for one day. The trouble comes from multiplication. Each window needs its own counts: last hour, last day, all time. A sliding hour needs one set of counts per slice. A breakdown such as 'top videos per country' multiplies by the number of countries. And most of the memory goes to the long tail: hundreds of millions of videos with a few views each, which will never be in any top list. A count-min sketch fixes exactly this. Its memory is fixed by the error you choose, not by the number of different videos. Say it plainly in the interview: if one exact map per window fits, use it, because exact is simpler to explain to users. Reach for the sketch when windows, slices and breakdowns multiply the memory.
The count-min sketch and its error bound
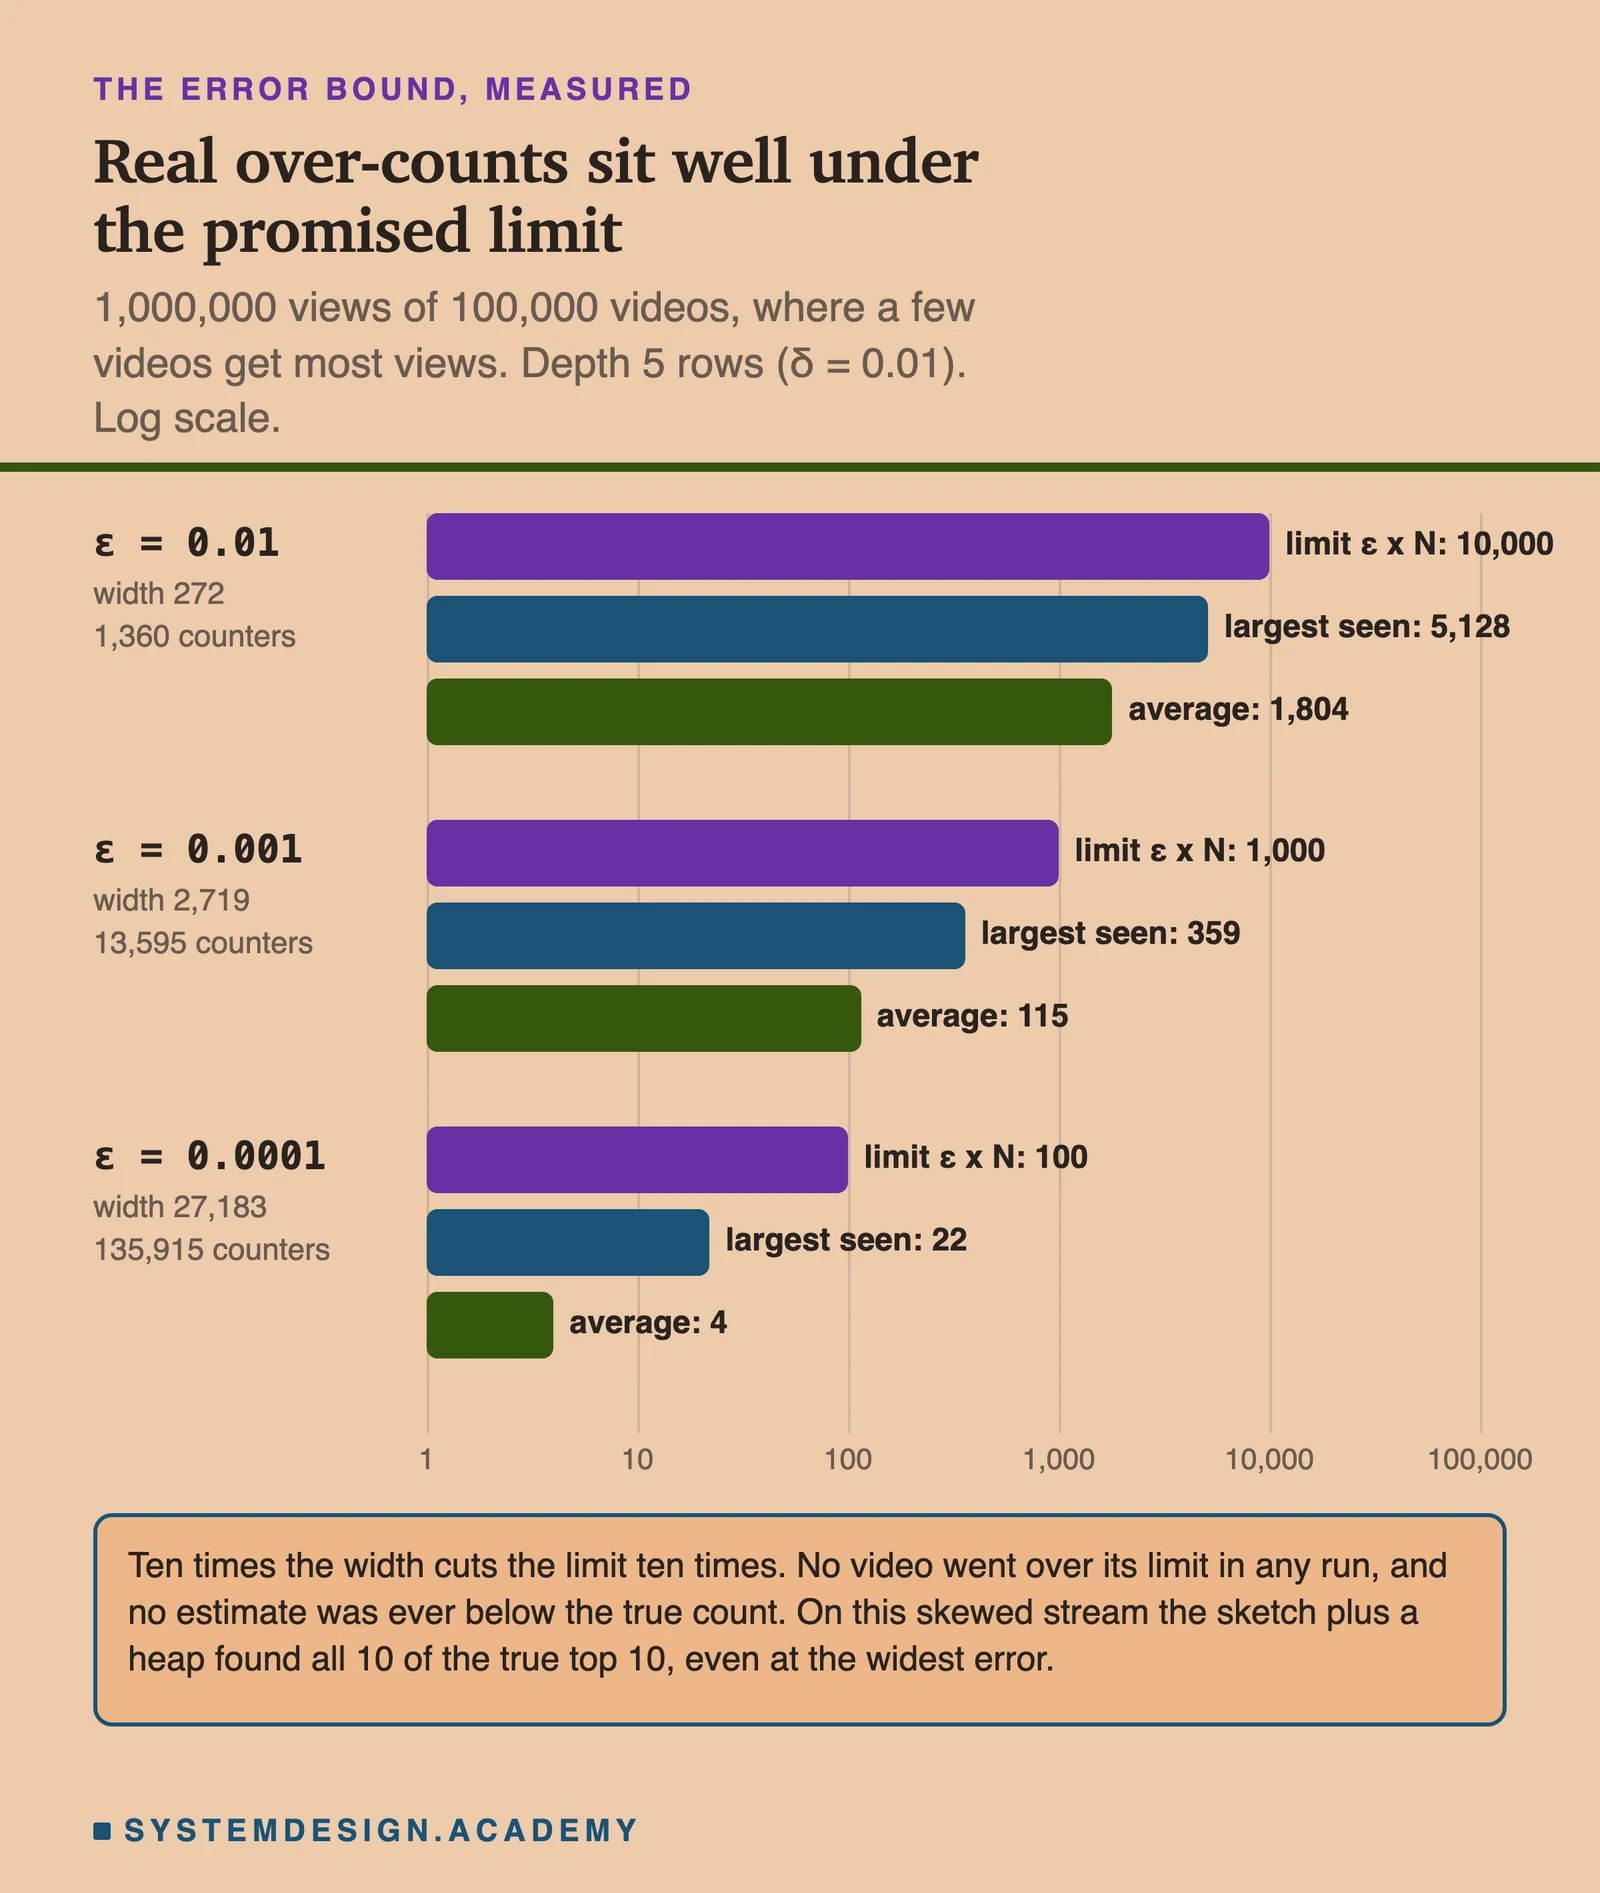
The count-min sketch comes from a 2005 paper by Graham Cormode and S. Muthukrishnan. It is a table of counters with d rows and w columns, all starting at zero. Each row has its own hash function, which turns a video id into a column number. To add a view of video i, go to each row, find the column that row's hash gives for i, and add 1 there. To read the count of video i, look at those d counters and take the smallest. Other videos can land in that counter too (a collision), and their views only ever add to it, so every counter is at least the true count. The smallest one is the best guess, and it is never too low. You choose two numbers. ε (epsilon) is how large an error you accept, as a fraction of all views. δ (delta) is the chance you accept of going over that error. The paper sets the width w = e / ε, rounded up, where e is about 2.718, and the depth d = ln(1 / δ), rounded up, where ln is the natural logarithm. Its Theorem 1 then says: the estimate is at least the true count, and with probability at least 1 - δ it is at most the true count plus ε times the total number of views. Two cautions. First, the error is relative to the total of all views, not to the video's own count. With ε = 0.001 on a million views, any video may be up to 1,000 too high. That is nothing for a video with 80,000 views and everything for one with 50. So a sketch is good at the top of the list and useless for the tail. A top-k system only needs the top. Redis's own documentation says the same: results under error times total count should be treated as noise. Second, libraries size the table with their own constants. In Redis, CMS.INITBYPROB with error 0.001 and probability 0.002 creates a sketch 2,000 wide and 9 deep, while the paper's formulas would give 2,719 and 7. Read the library's sizing before you quote a bound for it. Two sketches of equal size that use identical hash functions can be added cell by cell, and the result is the sketch of both streams together (Redis offers this as CMS.MERGE). That is what makes slices and partial counts cheap to combine. The full Python is short:
import math, random
P = 2_147_483_647  # a prime larger than any item id

class CountMin:
    def __init__(self, eps, delta, seed=1):
        self.w = math.ceil(math.e / eps)          # width  = e / epsilon
        self.d = math.ceil(math.log(1 / delta))   # depth  = ln(1 / delta)
        r = random.Random(seed)
        self.ab = [(r.randrange(1, P), r.randrange(P)) for _ in range(self.d)]
        self.rows = [[0] * self.w for _ in range(self.d)]

    def _col(self, j, x):
        a, b = self.ab[j]
        return ((a * x + b) % P) % self.w

    def add(self, x, c=1):                        # one counter per row goes up
        for j in range(self.d):
            self.rows[j][self._col(j, x)] += c

    def query(self, x):                           # smallest of the d counters
        return min(self.rows[j][self._col(j, x)] for j in range(self.d))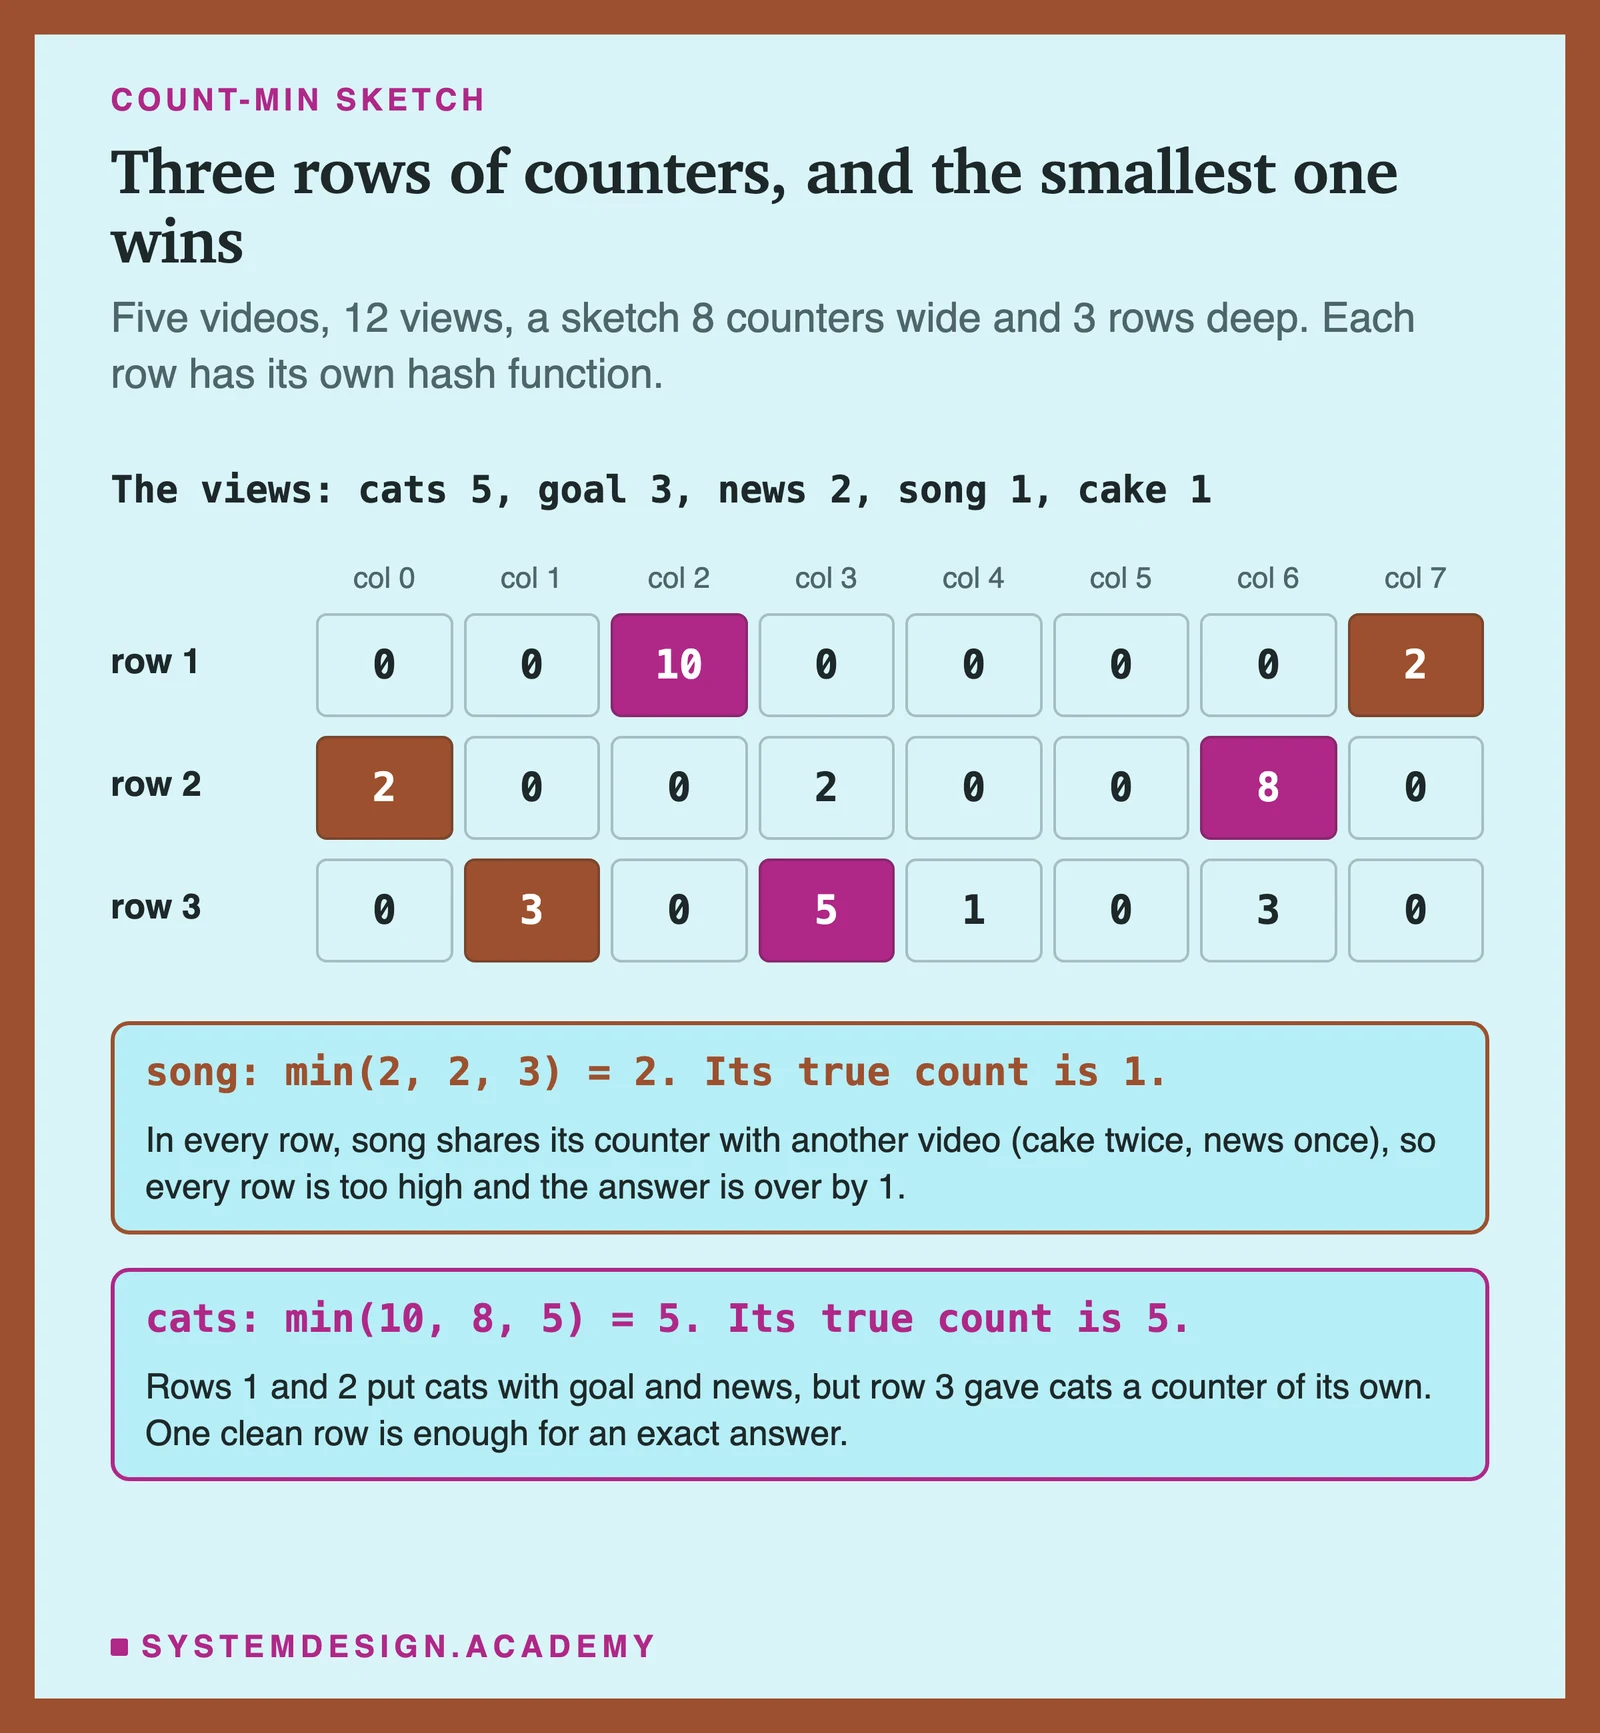
Why a sketch alone cannot give you the top k
A count-min sketch answers one kind of question: about how many times did this video appear? It cannot answer the question you actually have: which videos appeared most? It stores counters, not video ids, so there is nothing to list. The paper itself solves this with a heap. As each view arrives, add it to the sketch and read back that video's estimate. Then offer the video to a min-heap that holds at most k videos. A min-heap is a small tree-shaped structure that always keeps its smallest item at the top, so checking the smallest costs one step and replacing it costs about log k steps. If the video is already in the heap, update its count. If the heap has room, add it. Otherwise, if the new estimate is larger than the smallest count in the heap, the new video replaces it. With k = 1,000 the heap is about 16 KB. One subtle point: the heap only ever sees videos at the moment they get a view. A video's true count only changes when one of its own views arrives, and that is exactly when it is offered to the heap again, so a growing video is always checked at the moment it grows. The paper proves the matching result for frequent items: every item above a threshold φ (phi, a fraction you choose) times the total is reported, and with probability 1 - δ no item below (φ - ε) times the total is. Redis ships this pairing as one command family. Its Top-K structure uses the HeavyKeeper algorithm, with a table of decaying counters plus a min-heap of the k leaders, and TOPK.ADD tells you which item was pushed out of the list.
import heapq

def offer(heap, k, video, est):
    """heap is a min-heap of (estimate, video) with at most k entries."""
    for i, (_, v) in enumerate(heap):
        if v == video:                  # already in the top k: update its count
            heap[i] = (est, video)
            heapq.heapify(heap)
            return
    if len(heap) < k:
        heapq.heappush(heap, (est, video))
    elif est > heap[0][0]:              # beats the smallest of the k
        heapq.heapreplace(heap, (est, video))

def top_k(events, k, sketch):
    heap = []
    for v in events:
        sketch.add(v)
        offer(heap, k, v, sketch.query(v))
    return sorted(heap, reverse=True)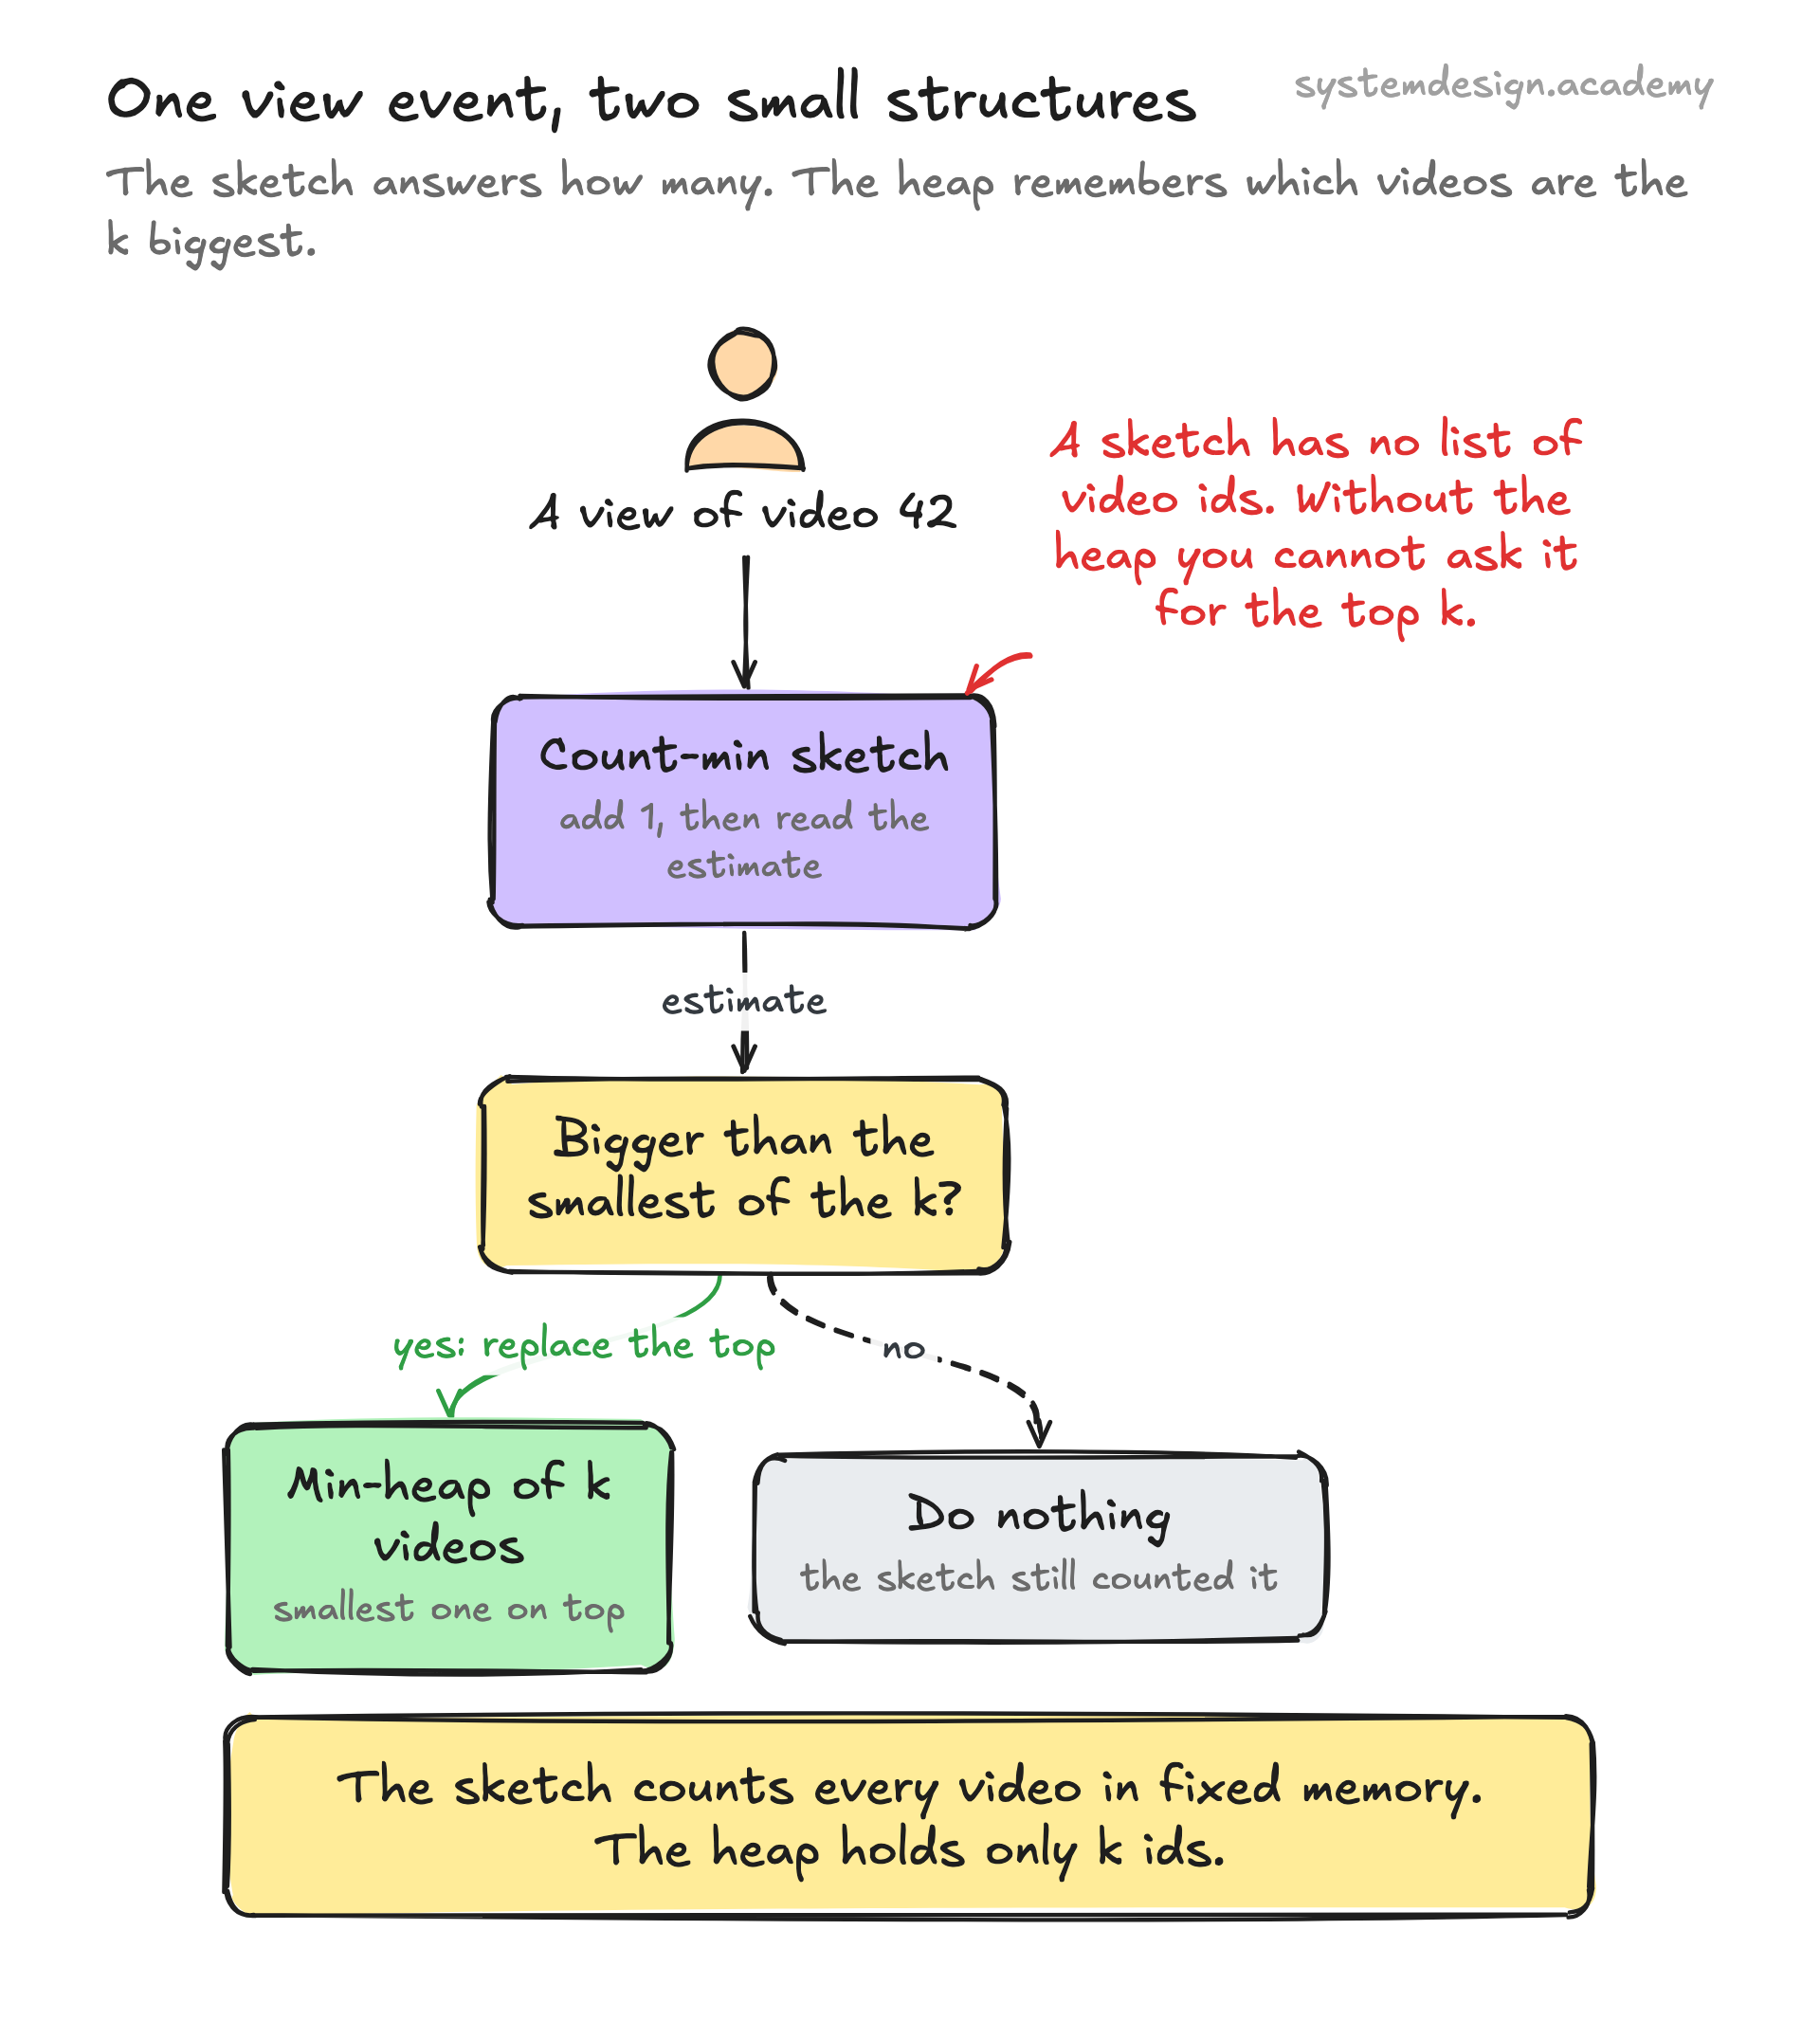
Windows: tumbling, sliding, and 5-minute slices
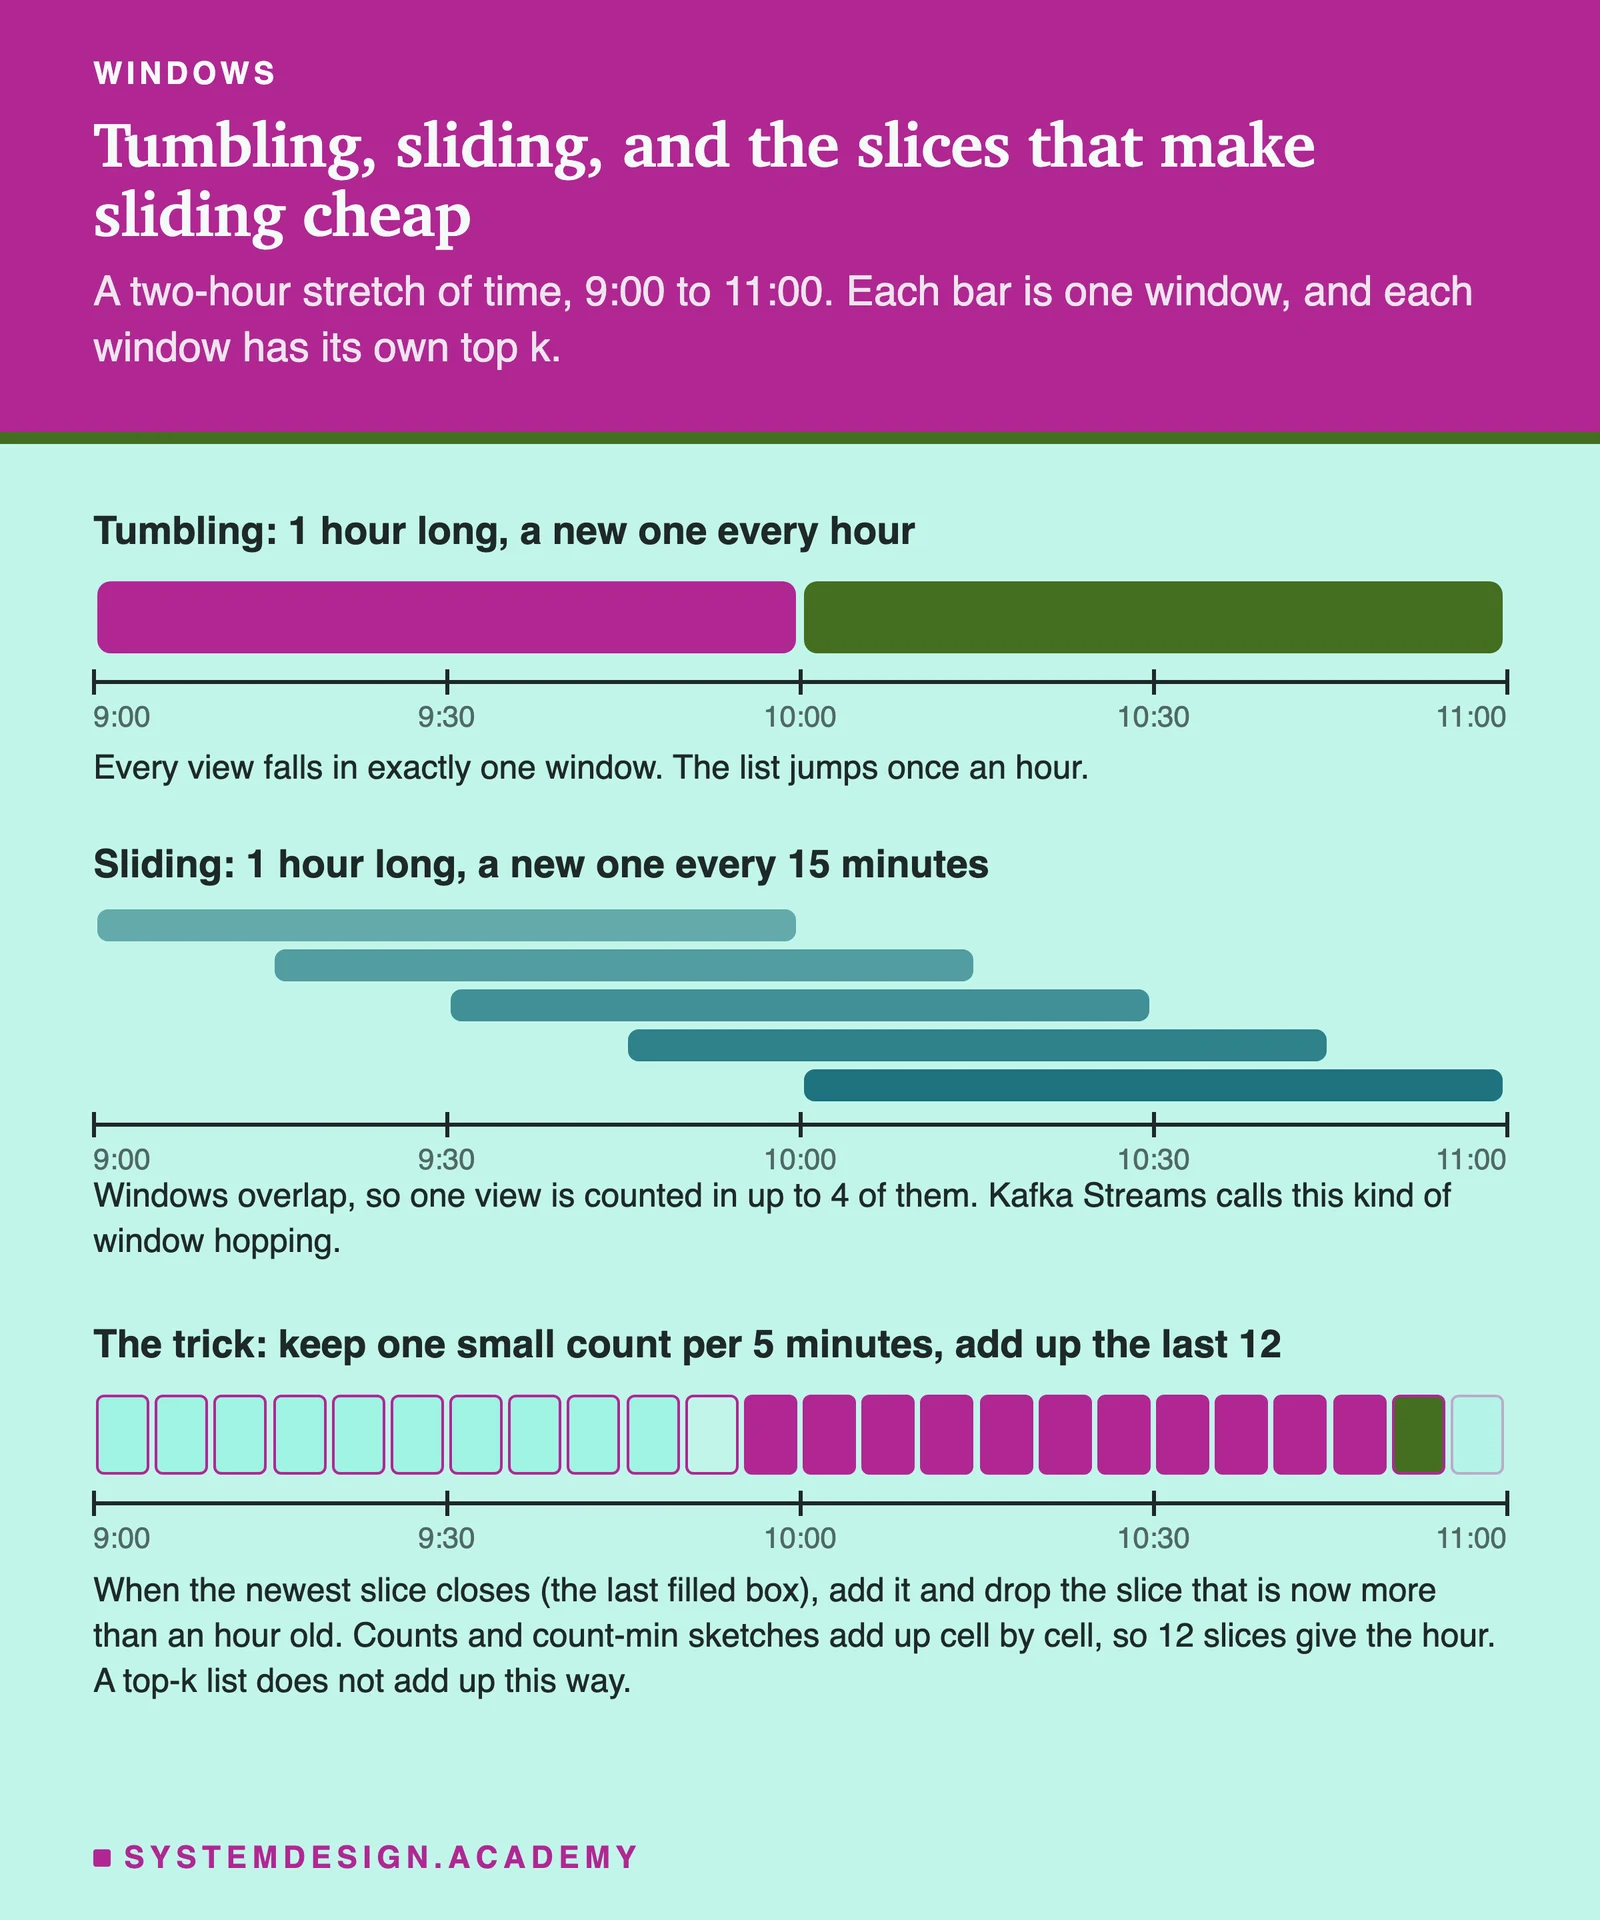
A window is the stretch of time a count covers. The two kinds you must know have different costs. A tumbling window has a fixed size and never overlaps the next one: 9:00 to 10:00, then 10:00 to 11:00. Apache Flink's documentation defines it that way, and each event belongs to exactly one window. It is cheap, but the 'last hour' list jumps once an hour and is out of date near the end. A sliding window also has a fixed size but starts a new window every slide interval, for example one hour long every 15 minutes, so the windows overlap and one view belongs to several of them. Kafka Streams calls this kind a hopping window and keeps the name sliding for windows defined by the time difference between two records. Name both so the interviewer knows you know. The cost is real. Flink's documentation warns that a window of one day that slides every second is not a good idea, because each event is copied into every overlapping window. The fix is slices. Count each 5-minute slice once, in its own small sketch. The last hour is then the sum of the latest 12 slice sketches, which works because sketches add cell by cell. Every 5 minutes, add the newest slice and drop the oldest. The heap needs care here: when a slice is dropped, counts go down, and a heap that only ever saw increases is now out of date. So at every slide, rebuild the hour's top list from candidates: every video named in any slice's top 1,000, plus the current leaders, each scored with the summed sketch. That candidate set can miss a video that was never in any slice's list, which is the merging problem in the next section, and its check applies here too. In Flink, prefer an incremental aggregate, which keeps one running value per window, over a function that buffers every event of the window: the documentation says the buffering kind must keep all elements.
Merging partial top-k lists across partitions
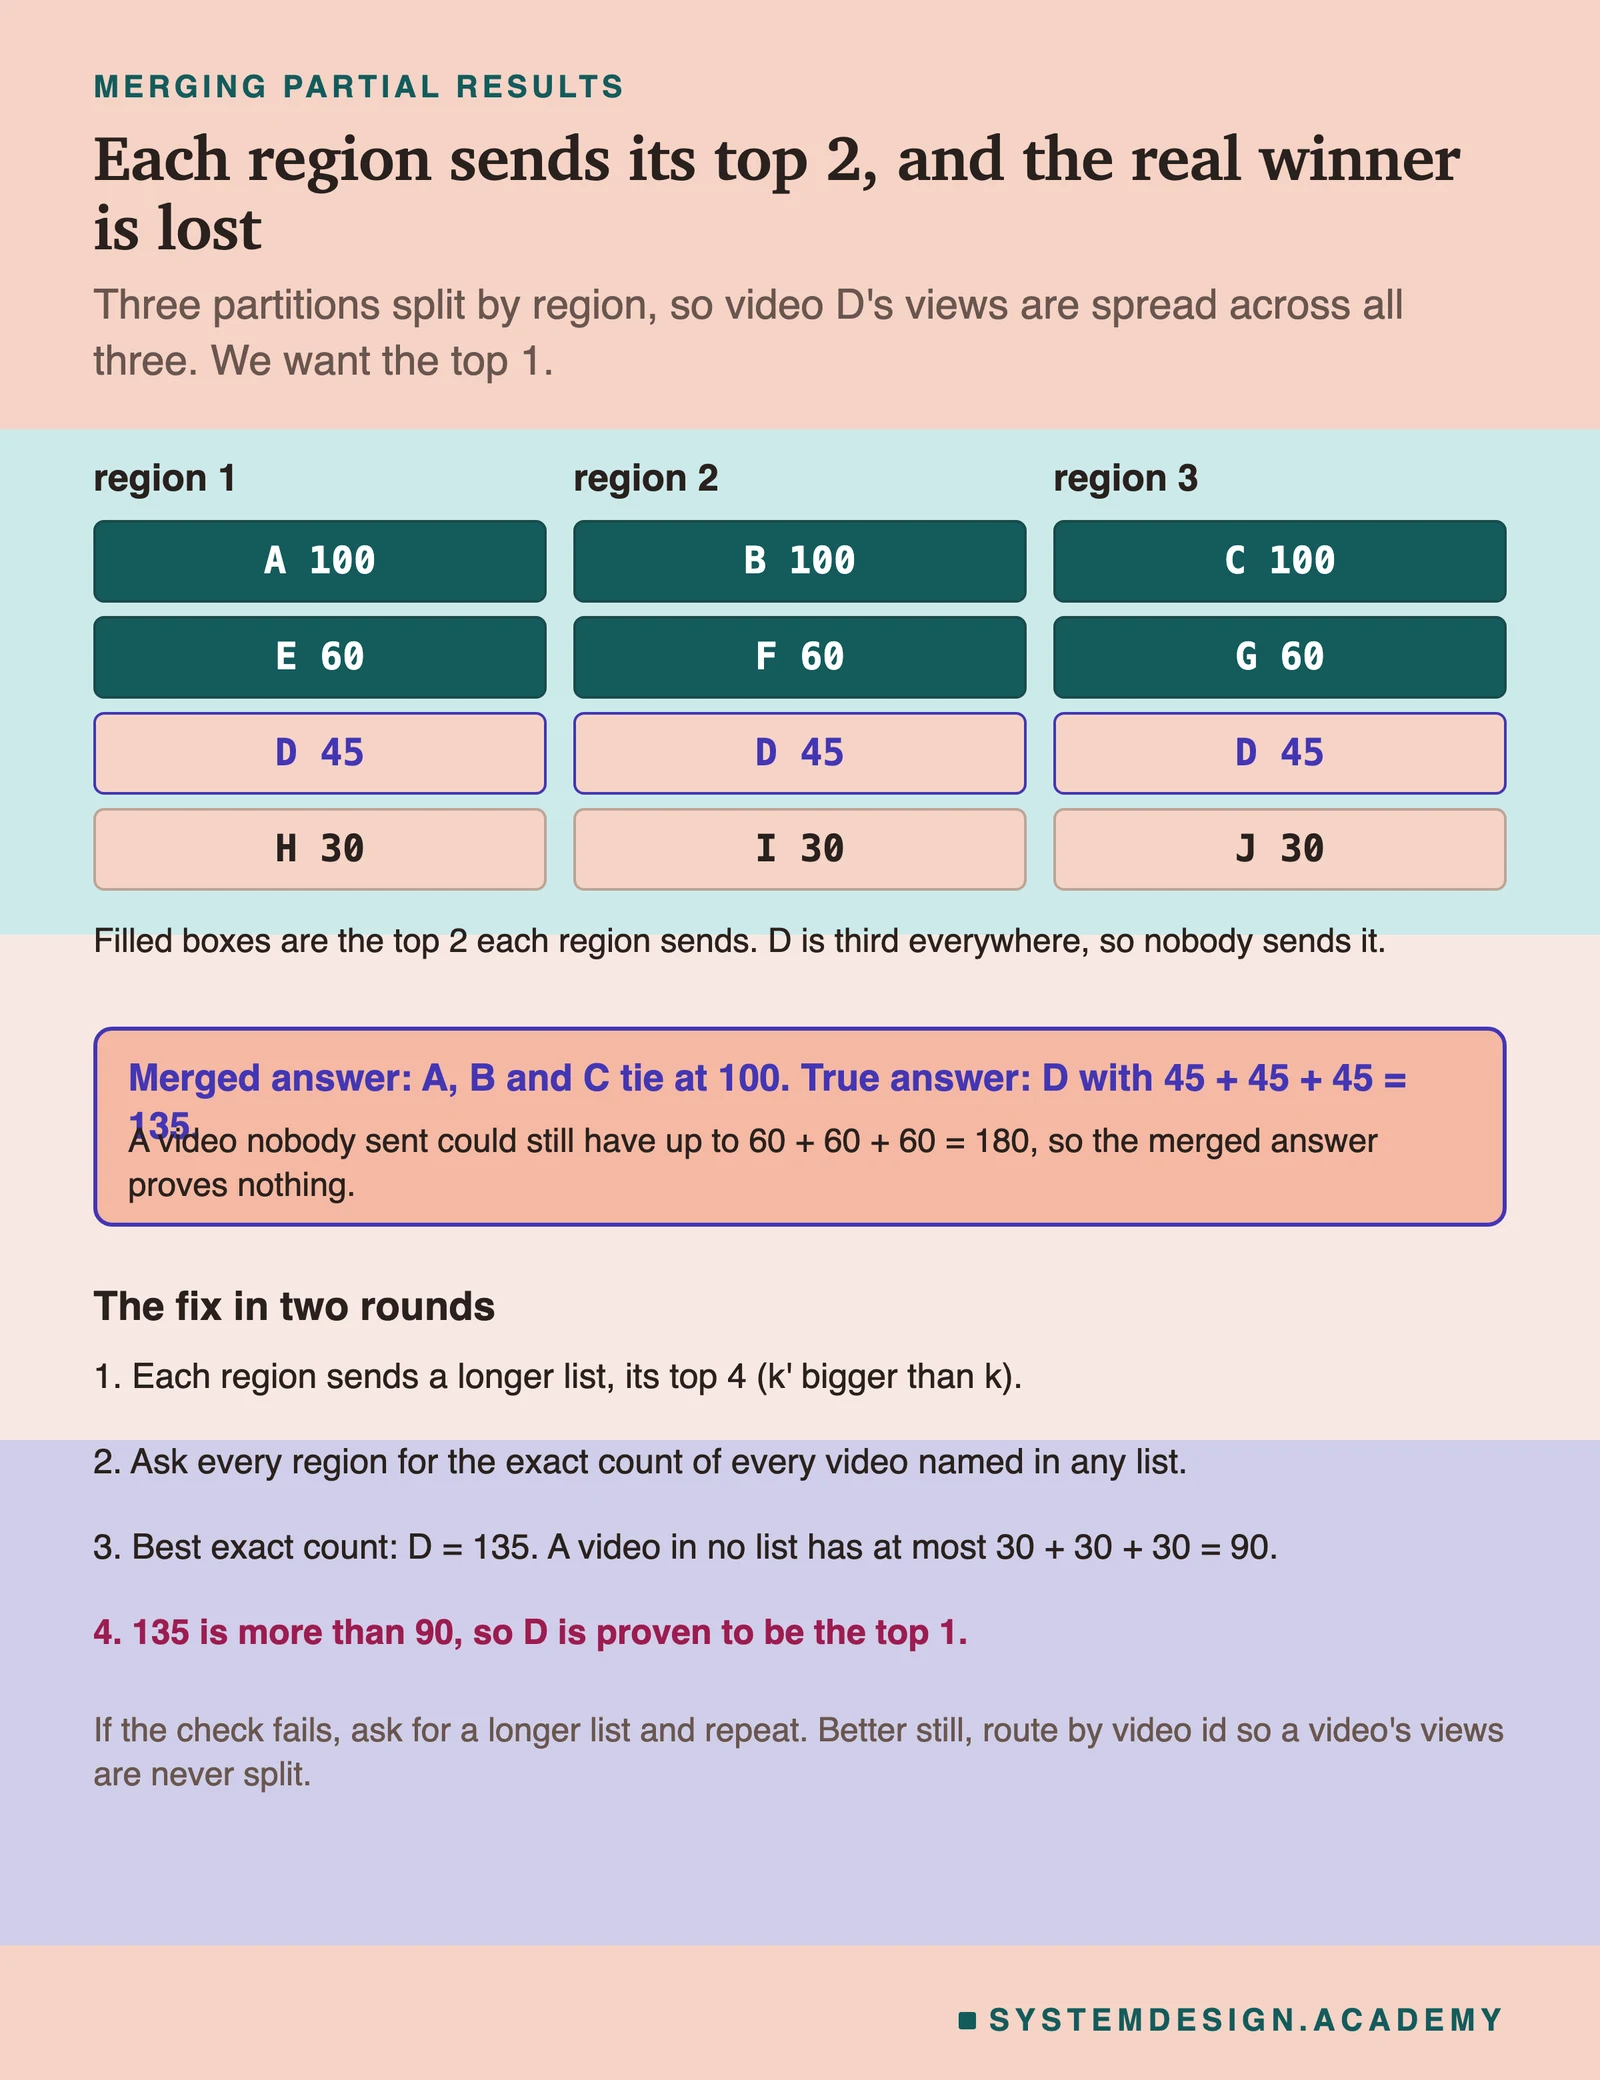
This is the trap most candidates walk into. There are two cases, and they behave differently. Case one: the views are partitioned by video id, so each video's views all land on one worker. Then every video in the global top k is also in its own worker's local top-k list, and merging those lists is exact, as far as the estimates are exact. That is why the design keys Kafka by video id. Case two: a video's views are split across the lists you merge. This happens when partitions are by region or by server, when a hot video is salted across workers (next section), and, most often, when you build a day out of 24 hourly top lists. Now merging lists can lose the true winner. The figure shows it with real numbers: three regions each send their top 2, and video D, third in every region with 45 views, never appears, yet its total of 135 beats everything that was sent. A video that is 11th every hour can be first for the day and appear in no hourly top 10. There are three fixes. The best is to merge counts, not lists: add exact hourly counts per video, or add sketches cell by cell, and only then pick the top k. If you must merge lists, ask for longer lists (k' larger than k, here 1,000 for a top 10), then do a second round: ask every partition for the exact count of every video named in any list. Finally check the bound. A video missing from a partition's list has, in that partition, at most the smallest count on that list. Add those smallest counts across partitions; that sum is the most any unlisted video could have. If your k-th answer beats it, the answer is proven. If not, ask for longer lists and repeat. One practical note for Flink: a non-keyed window runs as a single task, so do the per-video counting in keyed windows across many tasks and keep only the small final merge of 1,000-entry lists in the single task.
Hot partitions: one video, a fifth of all views
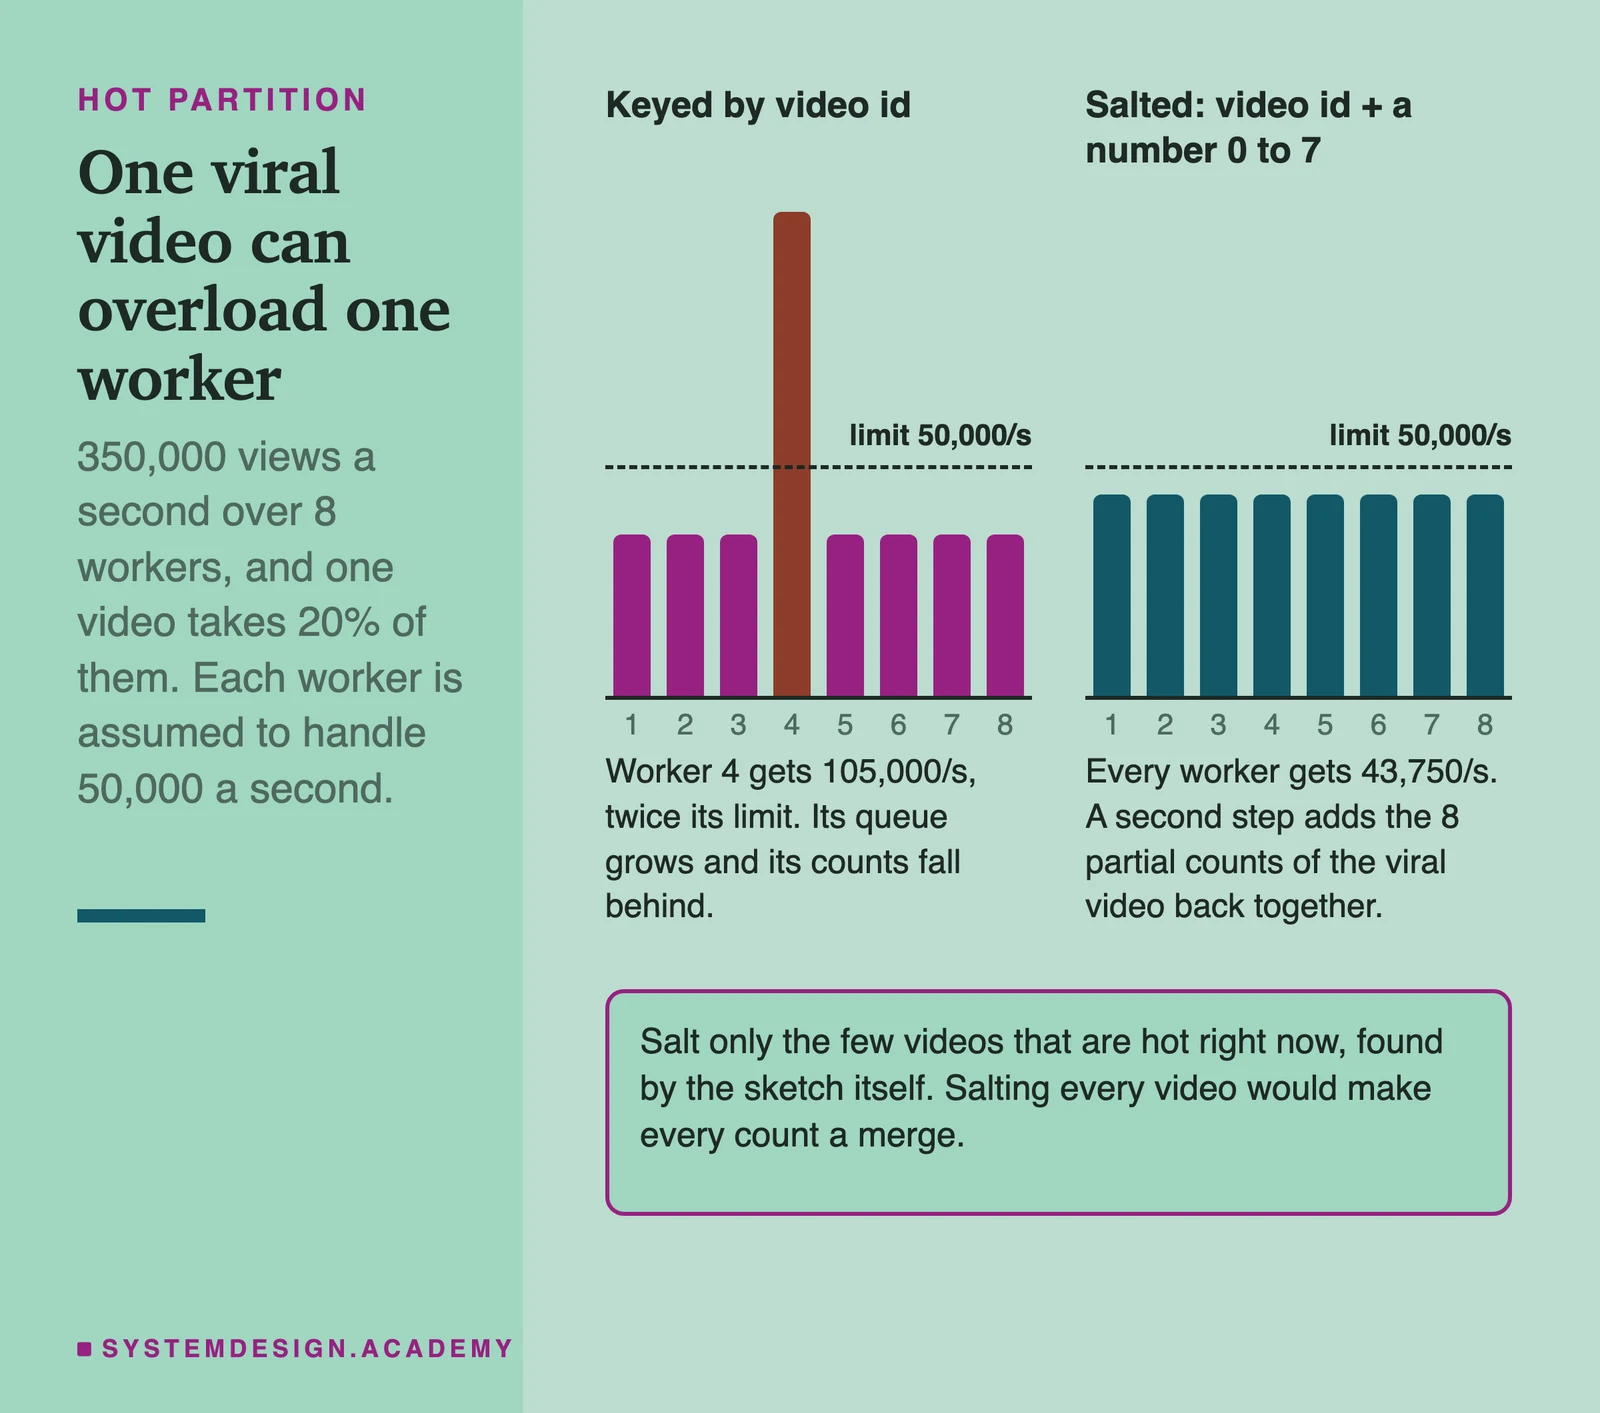
Keying by video id spreads load well when no single video is huge. A viral video breaks that. Suppose one video takes 20% of 350,000 views per second, which is 70,000 per second, on top of the roughly 35,000 that each of 8 workers already handles. The worker that owns it gets 105,000 per second against a limit of 50,000. Its queue of unread events grows, its counts fall behind, and its part of the top list goes stale exactly when people care most. Adding workers does not help, because one key always hashes to one place. Two fixes, best used together. First, pre-aggregate before the network: the ingest service counts views per video for one second and sends (video, count) pairs. A video with 70,000 views per second then costs one message per ingest machine per second. Second, salt the hot keys: add a random number from 0 to 7 to the key of a video that is hot right now, so its events spread over 8 partitions. Each partial count is then one piece of that video's total, and a second small step adds the pieces back together before ranking. That is case two from the merging section, so the merge must add counts, not lists. Only salt the few videos that need it. You can find them cheaply with the sketch itself: any video whose estimated rate crosses a threshold gets salted for the next few minutes.
Other heavy-hitter algorithms: Misra-Gries and Space-Saving
The count-min sketch plus a heap is not the only answer, and naming the others shows depth. Misra-Gries (1982) keeps k - 1 counters. A tracked item gets its counter raised. A new item takes a free counter if one exists. If none is free, every counter goes down by 1 and counters that reach zero are freed. Every item that appears more than n/k times in a stream of n items is guaranteed to still hold a counter at the end. Space-Saving, by Metwally, Agrawal and El Abbadi (2005), changes one step: when the counters are full, the new item takes over the counter with the smallest count and adds 1 to it, remembering the old value as its possible over-count. With m counters, the smallest counter is at most n/m, so no count is too high by more than n/m, and any item that appears more than that smallest count is guaranteed to be tracked. Both keep the item ids themselves, so they give the top list directly with no separate heap. Both can also be merged: Apache DataSketches ships a Frequent Items sketch based on Misra-Gries that merges across machines. Its documentation states the gap between the upper and lower bound as at most the total count times 3.5 / M, where M is the map size. In its own test, 10 million items with M = 2,048 gave a worst case of 17,090 and an actual largest error of about 3,000. In an interview, a fair summary is: count-min plus heap if you also need a count for any video on request, Space-Saving if you only need the top list.
Trade-offs to discuss
Every senior interviewer expects you to surface at least 3 of these. Pick the decisions, state the alternatives, and justify your choice.
Exact counts vs a count-min sketch
Exact counts are simplest to explain and have no error, and with partitioning they fit for one or two windows. A sketch keeps memory fixed however many videos there are, at a stated error relative to the total. Use exact counts where the memory fits; use a sketch when windows, slices and breakdowns multiply the memory.
Count-min plus heap vs Space-Saving
Count-min plus heap can also answer 'how many views did this one video get?' for any video. Space-Saving keeps only the leaders, with their ids and an error bound, in a single structure. Pick count-min if other features need the count of any single video; pick Space-Saving for a pure top list.
Tumbling vs sliding windows
Tumbling windows count each event once and are cheap, but the list jumps once per window. Sliding windows give a smooth 'last hour', at the cost of slices, rebuilding the top list at every slide, and more memory. Many products show sliding for the trending list and tumbling for daily reports.
Partition by video id vs by region or server
By video id, merging local top-k lists is exact and simple. By region or server, the load is naturally even but one video's views are split, so you must merge counts or run the two-round check. Key by video id, and salt only the hot videos.
Fast estimates only vs adding a slow exact path
A single stream path is less code. Adding a batch recount doubles the logic but makes every closed hour exact and repairs any fast-path bug. If the counts drive money or rankings people dispute, keep the slow path.
Small k vs a longer k' behind the scenes
Users ask for 10, but keeping 1,000 per worker and per window costs only kilobytes. The longer list makes merges and slice rebuilds safe, and lets the API serve any k up to 1,000 without recomputing.
Free PDF · 18 pages
Get the free System Design Interview Cheat Sheet
The interview in seven stages, the numbers worth knowing by heart, and twelve classic systems on one page each, every line linked to the lesson it comes from.
Follow-up questions to expect
After the main design, the interviewer usually picks one part and asks more. Here is what to say.
Why is the count-min estimate never too low?
Every counter for a video holds that video's views plus the views of any other video that hashed to that counter. Counts only go up, so every counter is at least the true count, and so is the smallest one.
How do you get the daily top 10 from the hourly results?
Add the exact hourly counts per video, or add the 24 hourly sketches cell by cell, and then pick the top 10. Never add the 24 hourly top-10 lists: a video that is 11th every hour can be first for the day and appear in none of them.
A worker crashes. What happens to its counts?
The worker saves its state and its read position in the Kafka log regularly. A replacement loads the last saved state and replays the events after that position, so no view is lost. Its part of the list may be a few seconds out of date while it catches up.
How would you add 'top 10 per country'?
Make the country part of the key you count, for example (country, video). Exact maps multiply by the number of countries, so this is where the sketch earns its place. Each country also gets its own heap, which is small.
Bots inflate views. Where do you filter them?
Before counting, in the ingest service or a filter stage, using viewer id and rate rules. The slow path can apply heavier checks and its exact counts replace the estimates, so a filter that improves later still fixes past hours.
Why not just keep a Redis sorted set of every video and increment it?
It is exact and very simple, and for a modest number of videos it is a good answer. At 350,000 increments per second over hundreds of millions of members it needs a lot of memory and many machines, and each window needs its own set. Counting in stream workers and storing only the top 1,000 in Redis is cheaper.
How a Top-K System actually does it
Every method on this page is published and in use. The count-min sketch is defined in Cormode and Muthukrishnan's paper (Journal of Algorithms, 2005): width e/ε, depth ln(1/δ), and an estimate that is never below the truth and, with probability at least 1 - δ, at most ε times the total too high. That paper also finds heavy hitters by pairing the sketch with a heap. Redis offers both pieces. Its count-min sketch commands size a table from an error and a probability; with 0.001 and 0.002 it builds a table 2,000 wide and 9 deep. Its Top-K structure is based on the HeavyKeeper algorithm (USENIX ATC 2018), which decays the counters of small items, and it keeps the leaders in a min-heap. Misra and Gries published their counter-based method in 1982, and Metwally, Agrawal and El Abbadi published Space-Saving in 2005, where no count is more than n/m too high with m counters. Apache DataSketches ships a mergeable Frequent Items sketch built on Misra-Gries, with a documented bound of 3.5/M times the total count. For windows, Apache Flink defines tumbling and sliding windows, runs non-keyed windows on a single task, drops late events by default, and warns against tiny slides on long windows. Kafka Streams calls overlapping fixed windows hopping windows. The fast-plus-batch layout is Nathan Marz's lambda architecture (2011), in which the batch layer later replaces whatever the realtime layer computed. Across all of them, one lesson repeats: approximate counting is safe at the top of a list where a few items get most of the events and unreliable in the tail, so build the system so that the error lands where nobody looks.
Sources
- Cormode and Muthukrishnan: An Improved Data Stream Summary: The Count-Min Sketch and its Applications
- Metwally, Agrawal and El Abbadi: Efficient Computation of Frequent and Top-k Elements in Data Streams (Space-Saving)
- Misra-Gries summary (algorithm, guarantee and mergeability)
- Apache DataSketches: Frequent Items sketch overview
- Redis documentation: Top-K
- Redis documentation: Count-min sketch
- HeavyKeeper: An Accurate Algorithm for Finding Top-k Elephant Flows (USENIX ATC 2018)
- Apache Flink documentation: Windows
- Apache Kafka Streams documentation: DSL windowing (tumbling, hopping, sliding)
- Nathan Marz: How to beat the CAP theorem (the lambda architecture)
- Hello Interview: Top K YouTube videos problem breakdown
Lessons to study before this interview
If any of these topics are fuzzy, the interviewer will catch it. Each lesson is 15 to 60 minutes with diagrams, code, and a quiz.
Stream Processing
advanced / stream batch processing
Tumbling Windows
advanced / stream batch processing
Hopping Windows
advanced / stream batch processing
Sliding Windows
advanced / stream batch processing
Stateful Stream Processing
advanced / stream batch processing
Watermarking
advanced / stream batch processing
Lambda Architecture
advanced / stream batch processing
Kappa Architecture
advanced / stream batch processing
Bloom Filters
intermediate / database types storage
Hash Partitioning
foundation / database fundamentals
Consistent Hashing
intermediate / data replication distribution
Redis Cache
foundation / caching strategies
Design a Real-Time Analytics Dashboard
capstone / capstone
Design YouTube/Netflix
capstone / capstone
Frequently asked questions
Practice with 770 system design lessons
Lifetime access for ₹499 in India or $49 elsewhere. Interactive diagrams, quizzes, and 20 capstone projects to practise on.