The Inspector Who Stands in the Line
Let me start at a post office.
The manager wants to know how long customers wait at the one counter. She sends an inspector with a stopwatch. The inspector has a simple plan. He joins the line, waits, gets served, writes down his wait, and joins the line again. He does this all day.
At eleven o'clock the clerk goes to the back room for five minutes. The inspector is at the counter at that moment, so he waits five minutes and writes it down. That is one long wait in his notebook. But in those five minutes, thirty other people came in and stood in the line behind him. Each of them waited too, some for almost five minutes. None of them is in the notebook, because the inspector was busy waiting himself. At the end of the day his notebook says: almost every wait was short, and one was long.
A second inspector sits by the door instead. She writes down when each person walks in and when each person is served. Her notebook holds all thirty long waits.
A load tester for a web service can work like either inspector. In this lesson I test one small service both ways, and with a real tool, and I make the service stop on purpose, like the clerk. Then I check how far each report is from the truth.
Where This Lesson Starts
This is lesson 7 of the chapter on serving a model. It uses the same model and the same service as the lessons before it, so I do not explain them again. The model is the features chapter's gradient boosted tree model. It scores one customer of a real online shop, with a test AP of 0.5450. The service is the small FastAPI web service from lesson 2, latency anatomy. It runs with one worker process and one thread. Lesson 5, workers and threads found that to be the best setting on one core.
Every earlier lesson needed a load test. Lesson 4, batching requests, built the open-loop client I use again here, and lesson 3, tail latency, explained percentiles. Lesson 6, cold start, measured what the first request pays. This lesson turns round and tests the testers.
A percentile says what share of requests were faster than a given time. The median, also called the p50, is the time that half of the requests beat, and the p99 is the time that 99 of every 100 beat.
The machine has one core. My AWS account may run only one virtual CPU at a time, so I rent the same one-core box as before. There is no second box for the tester. The tester and the service share the core, and that is one of the things I measure.
The question: when a load tester gives you a p99, how close is it to what users would really see?
The Words You Need First
Please read this slide slowly if any word is new. Every slide after it uses these words.
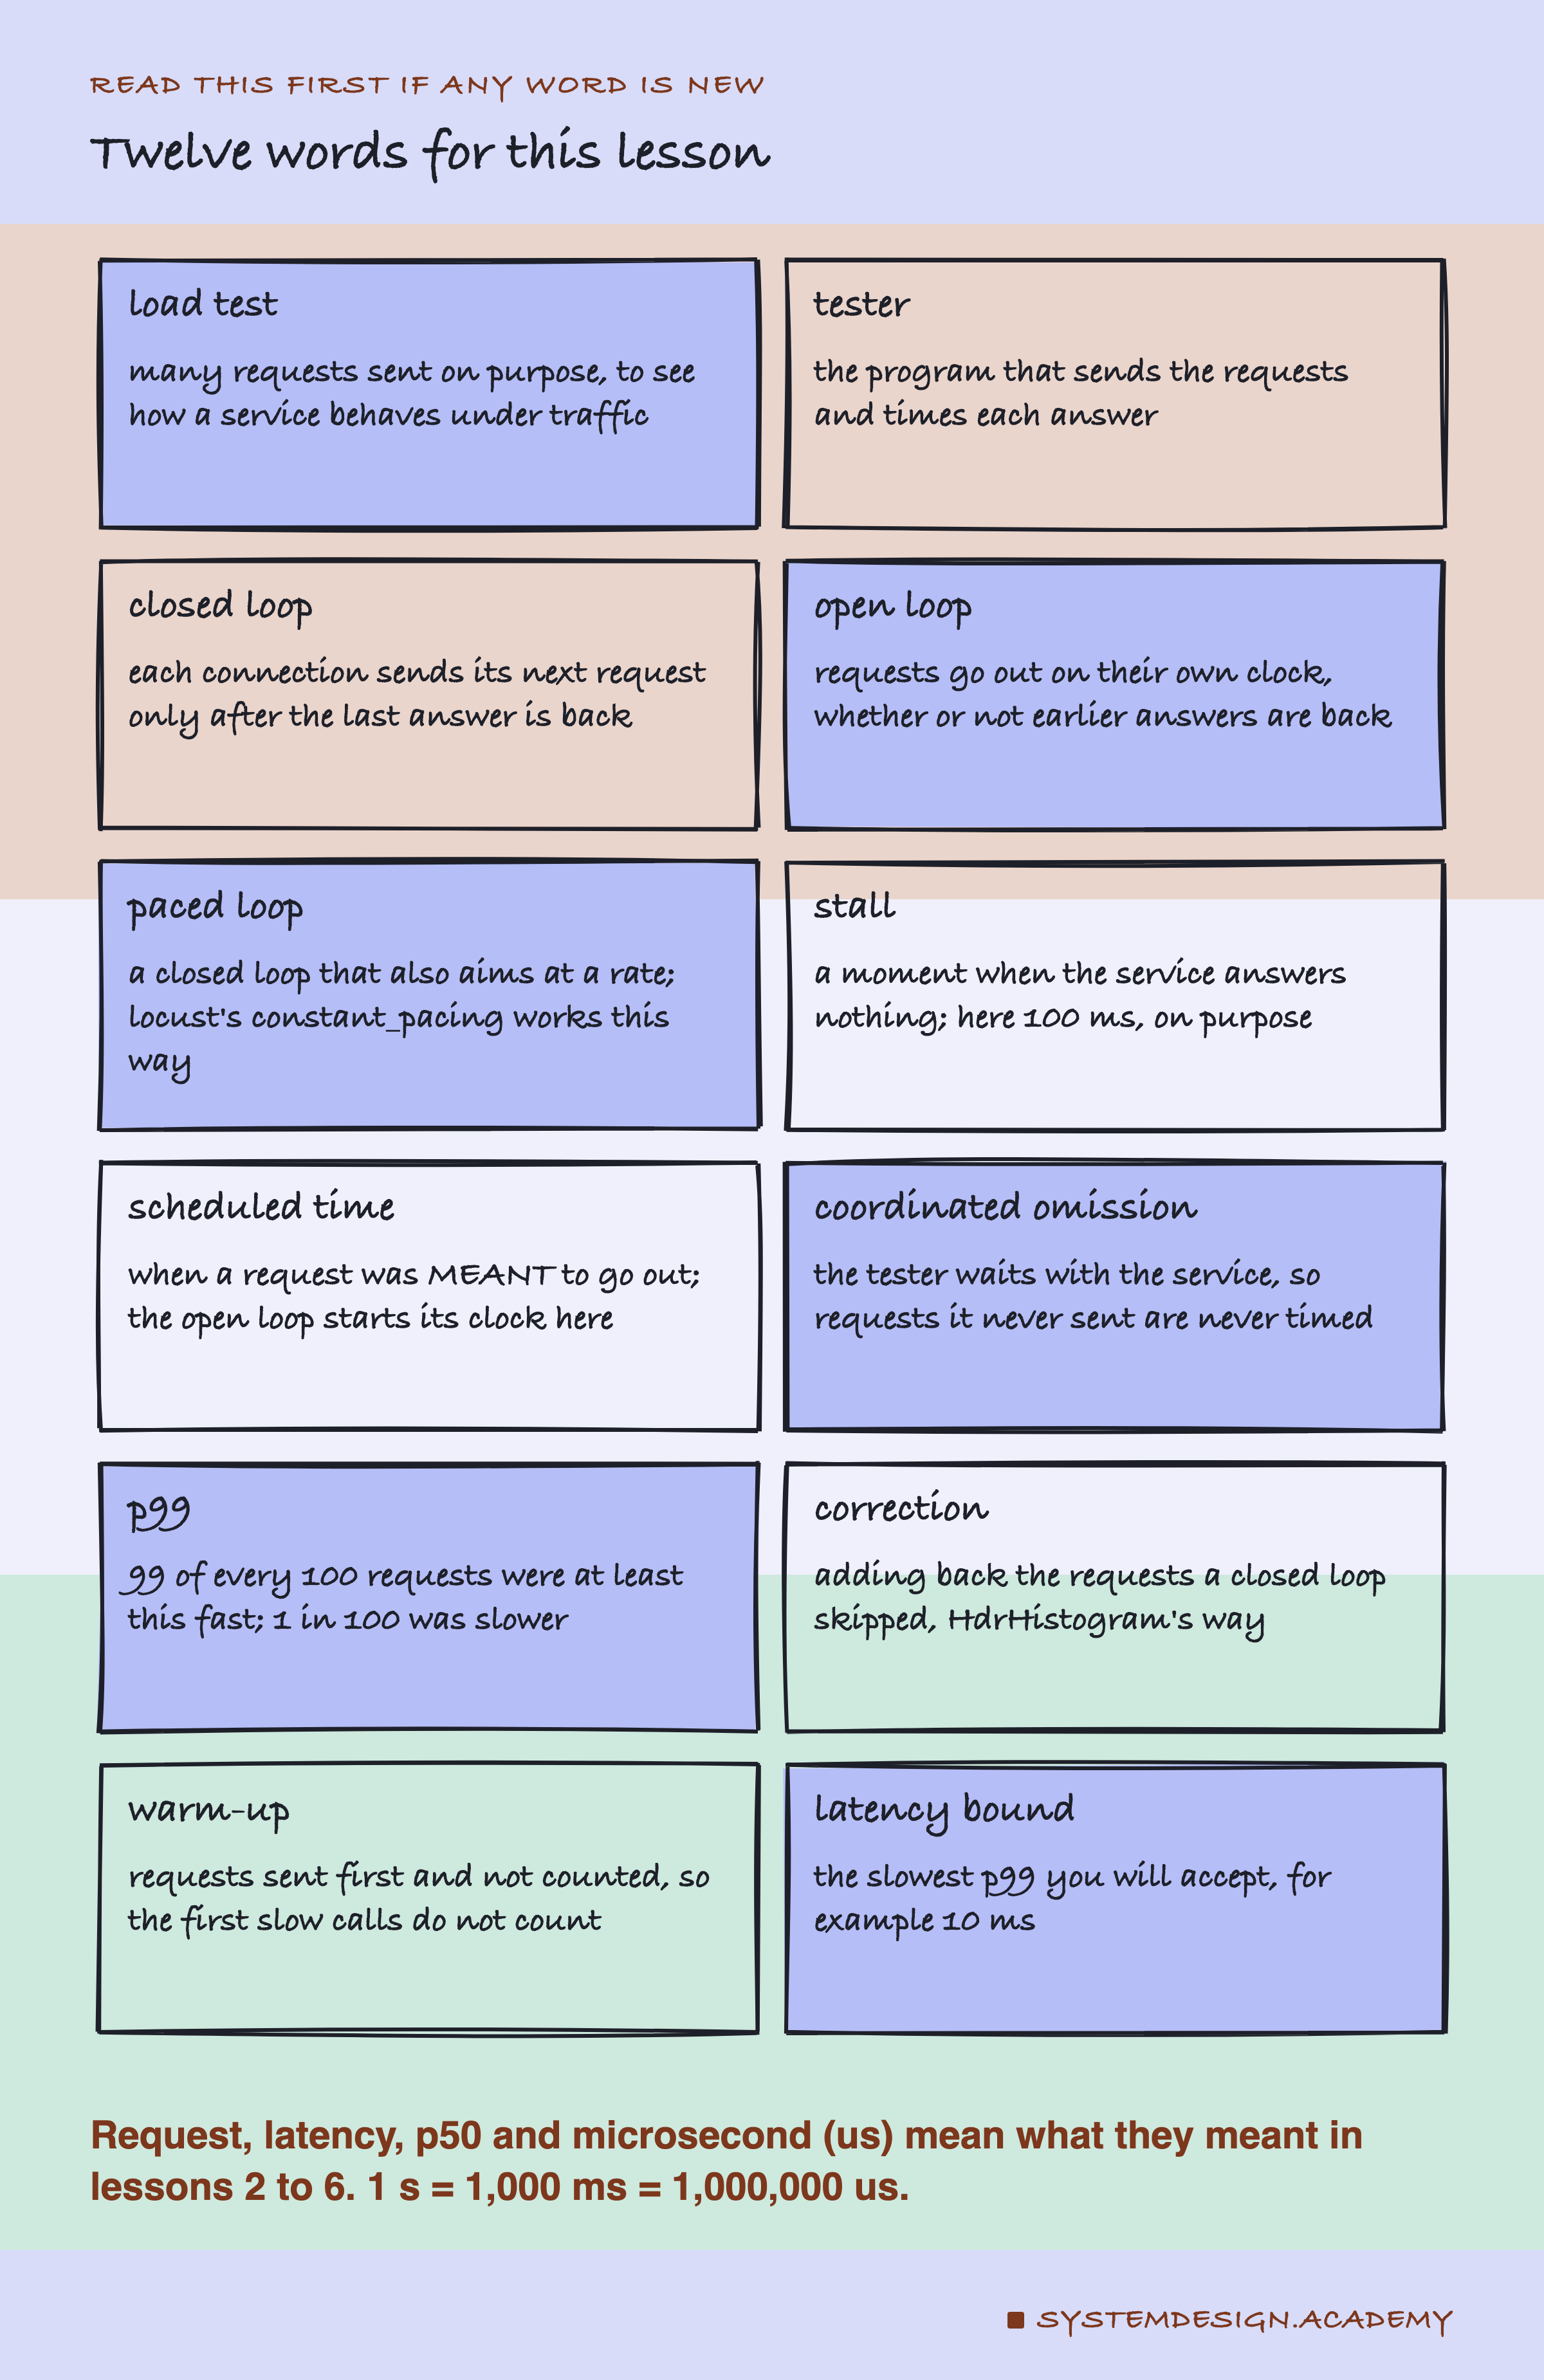
A load test sends many requests to a service on purpose, to see how it behaves under traffic. The program that sends them and times each answer is the tester. A connection is one open line between the tester and the service, and in this lab each connection carries one request at a time.
A closed loop tester is the first inspector. Each connection sends its next request only after the last answer has come back.
An open loop tester is the second inspector. It decides in advance when each request should go out, as if users arrived on their own.
My open loop draws its arrival times as Poisson arrivals: random arrivals with no pattern, like people walking into a shop, at a steady average rate. Then it sends each one at that time, whether or not earlier answers are back. The moment a request was meant to go out is its scheduled time, and an open loop times each request from there. A paced loop is a closed loop that also aims at a rate. Each connection tries to send one request every so many milliseconds, but it still waits for its answer first.
A stall is a moment when the service answers nothing. Real services stall during a long garbage collection pause (the language tidying up memory nobody uses any more) or while they wait for a lock. Here I make the service stall on purpose, for 100 ms at a time.
Coordinated omission is the name Gil Tene gave to the inspector's mistake: the tester waits together with the service, so the requests it never sent are never timed. p99 is the time that 99 of every 100 requests beat. A correction tries to add back the requests a closed loop skipped. A warm-up is requests sent first and not counted. A is the slowest p99 you will accept.
The Headline: The Same Service, Very Different p99s
Here is the main result first. Each row is one kind of tester, and each dot is one of five rounds. All of them measured the same service, which stalled for 100 ms at the same random moments in every run of a round.
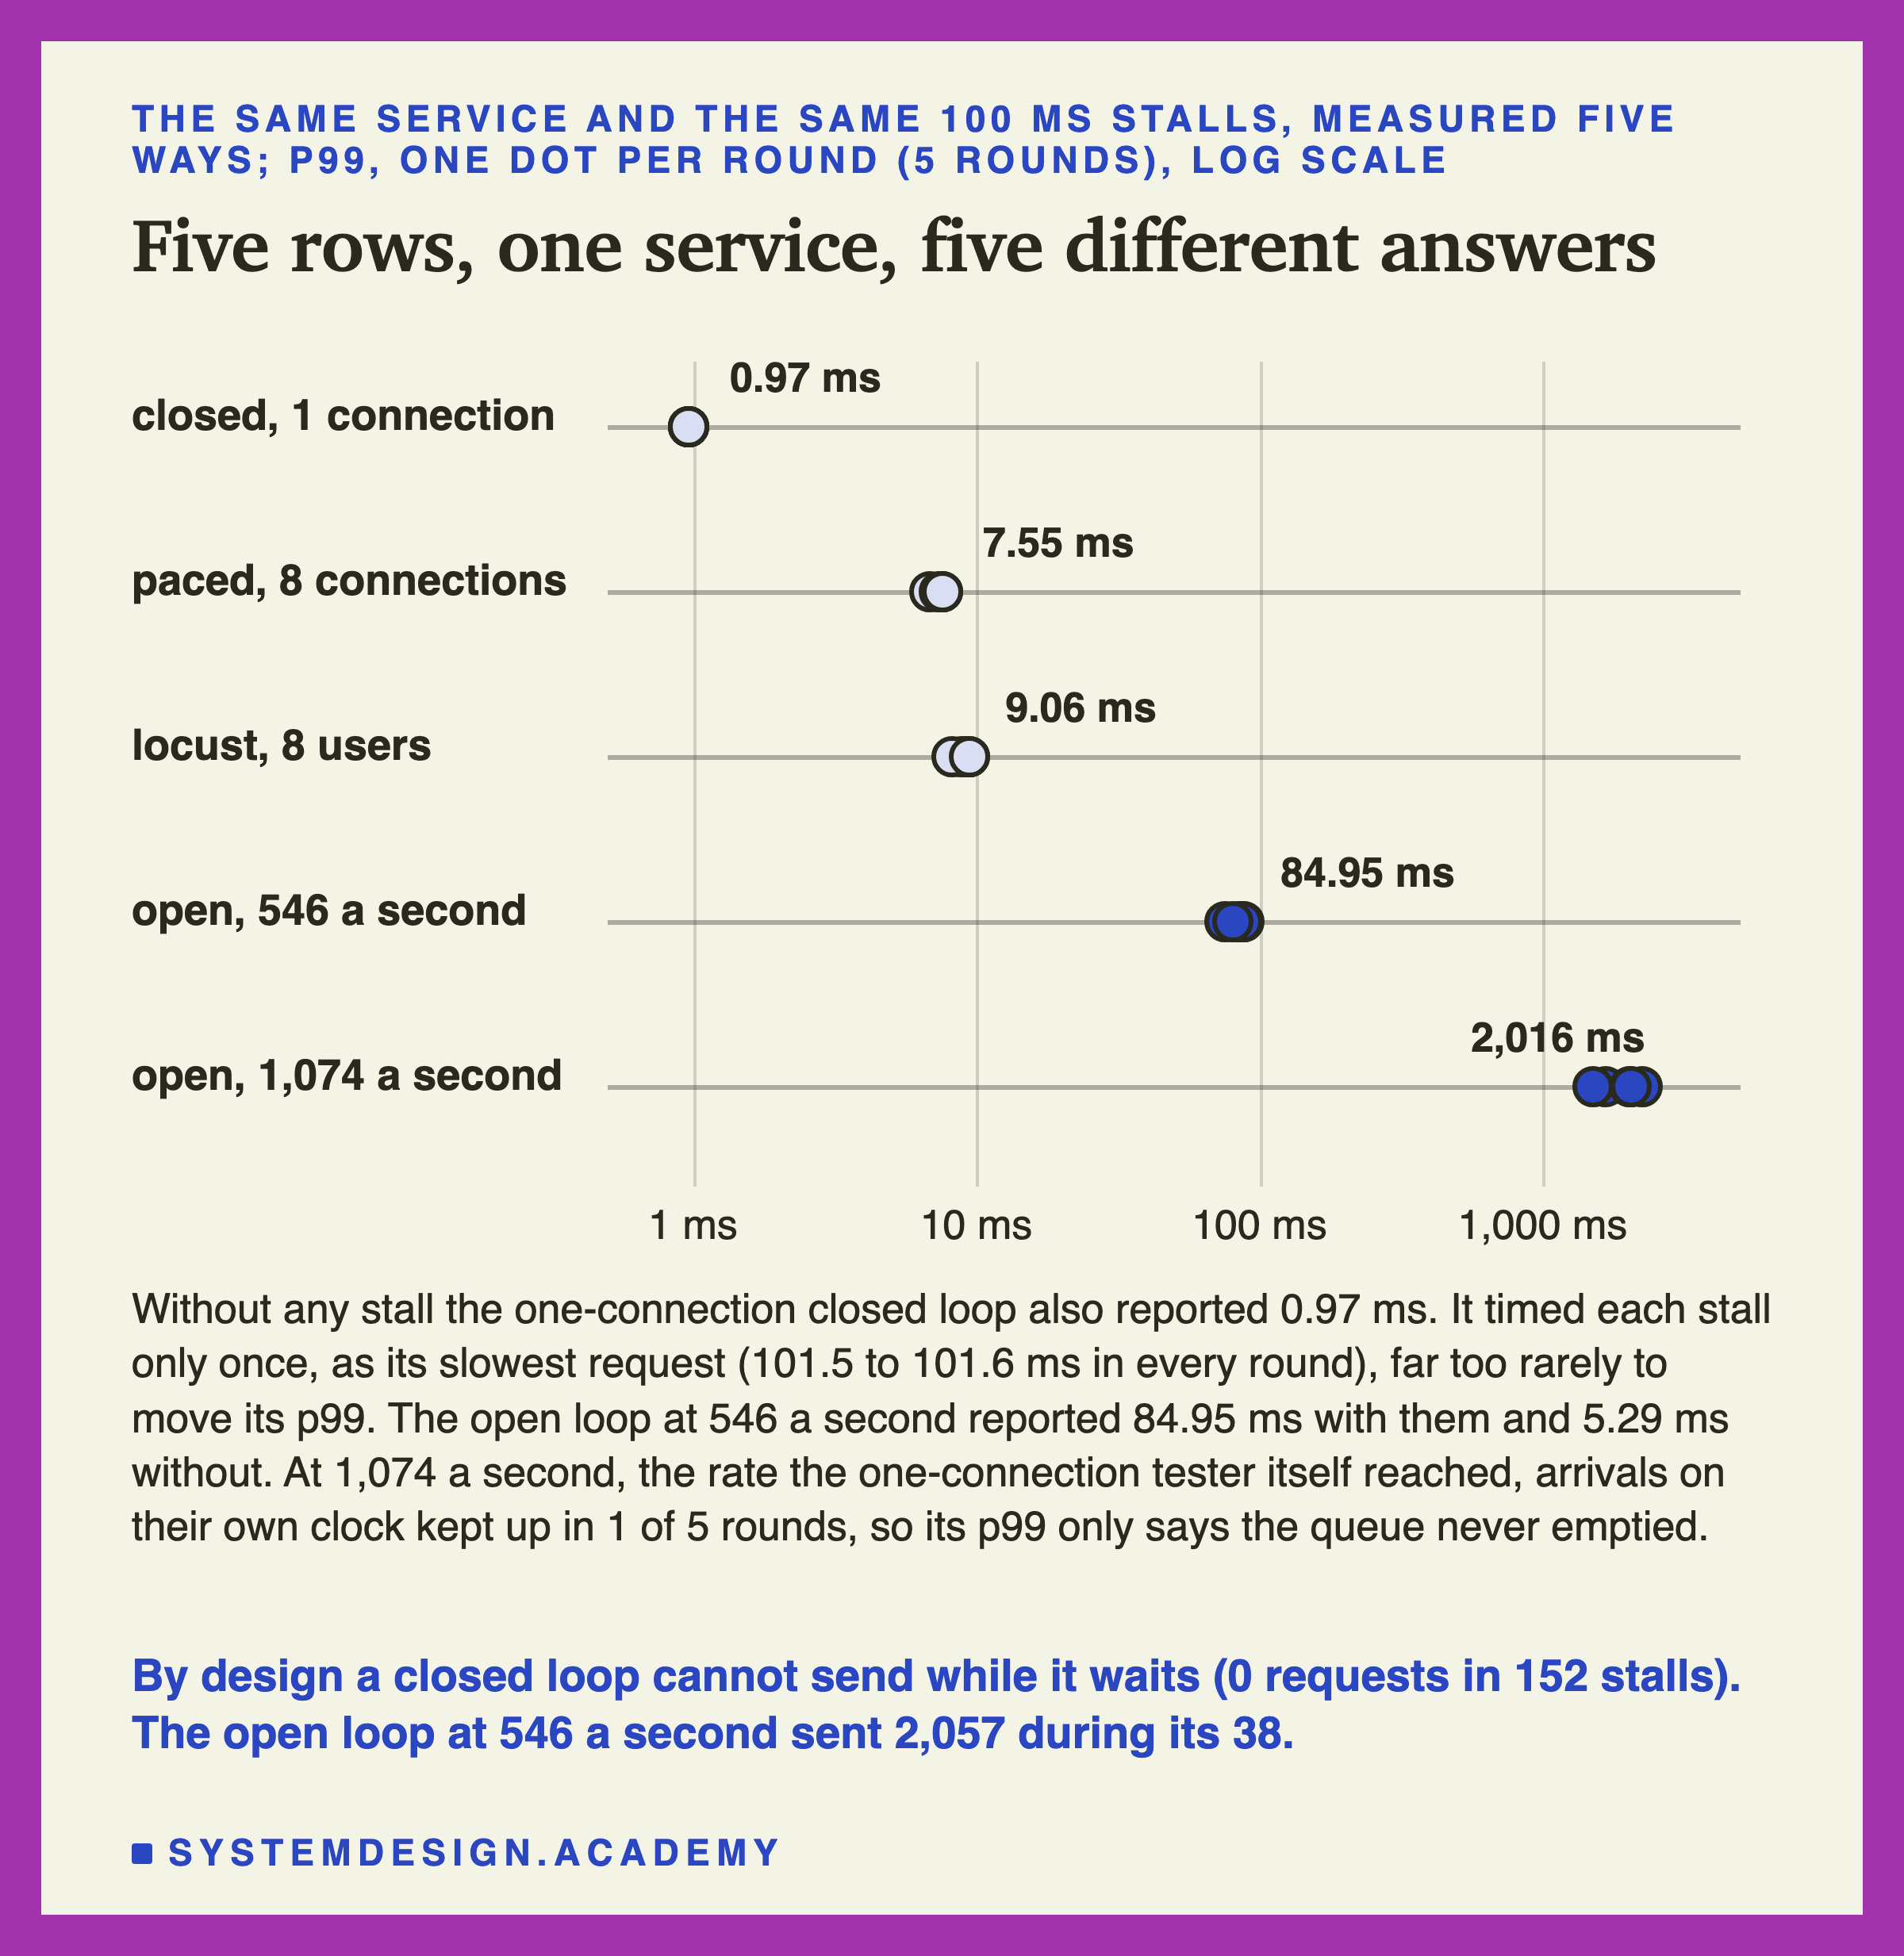
The closed loop with one connection reported a p99 of 0.97 ms. With no stall at all, the same tester also reported 0.97 ms. Compared round by round, the two cannot be told apart. The stalls were there, 100 ms each, and this tester's p99 could not show them.
An open loop at 546 requests a second reported 84.95 ms. Without the stalls, at the same arrival times, it reported 5.29 ms. So the open loop's p99 showed the stalls very clearly.
Two paced testers aiming at 546 a second (they reached 514 and 525) reported 7.55 ms (mine) and 9.06 ms (locust). Both were far below the open loop's 84.95 ms, told apart in every round.
Why, in one count. By design, a closed loop cannot send while its requests wait. So the four closed loops sent 0 requests during the 152 stalls they met; that is a check, not a finding. The finding is what this does to the p99. Each stall reached the closed loop's record once (its slowest request, 101.5 ms, in every round), far too rarely to move its p99. The open loop at 546 a second sent 2,057 requests during its 38 stalls.
How the Lab Was Built
I wrote the lab's design into the docstring of scripts/labs/serving/load_testing.py on 2026-10-08, before any run on the box. It names every tester, every rate, the rule for "told apart from noise", what counts as the truth, and eighteen guesses.
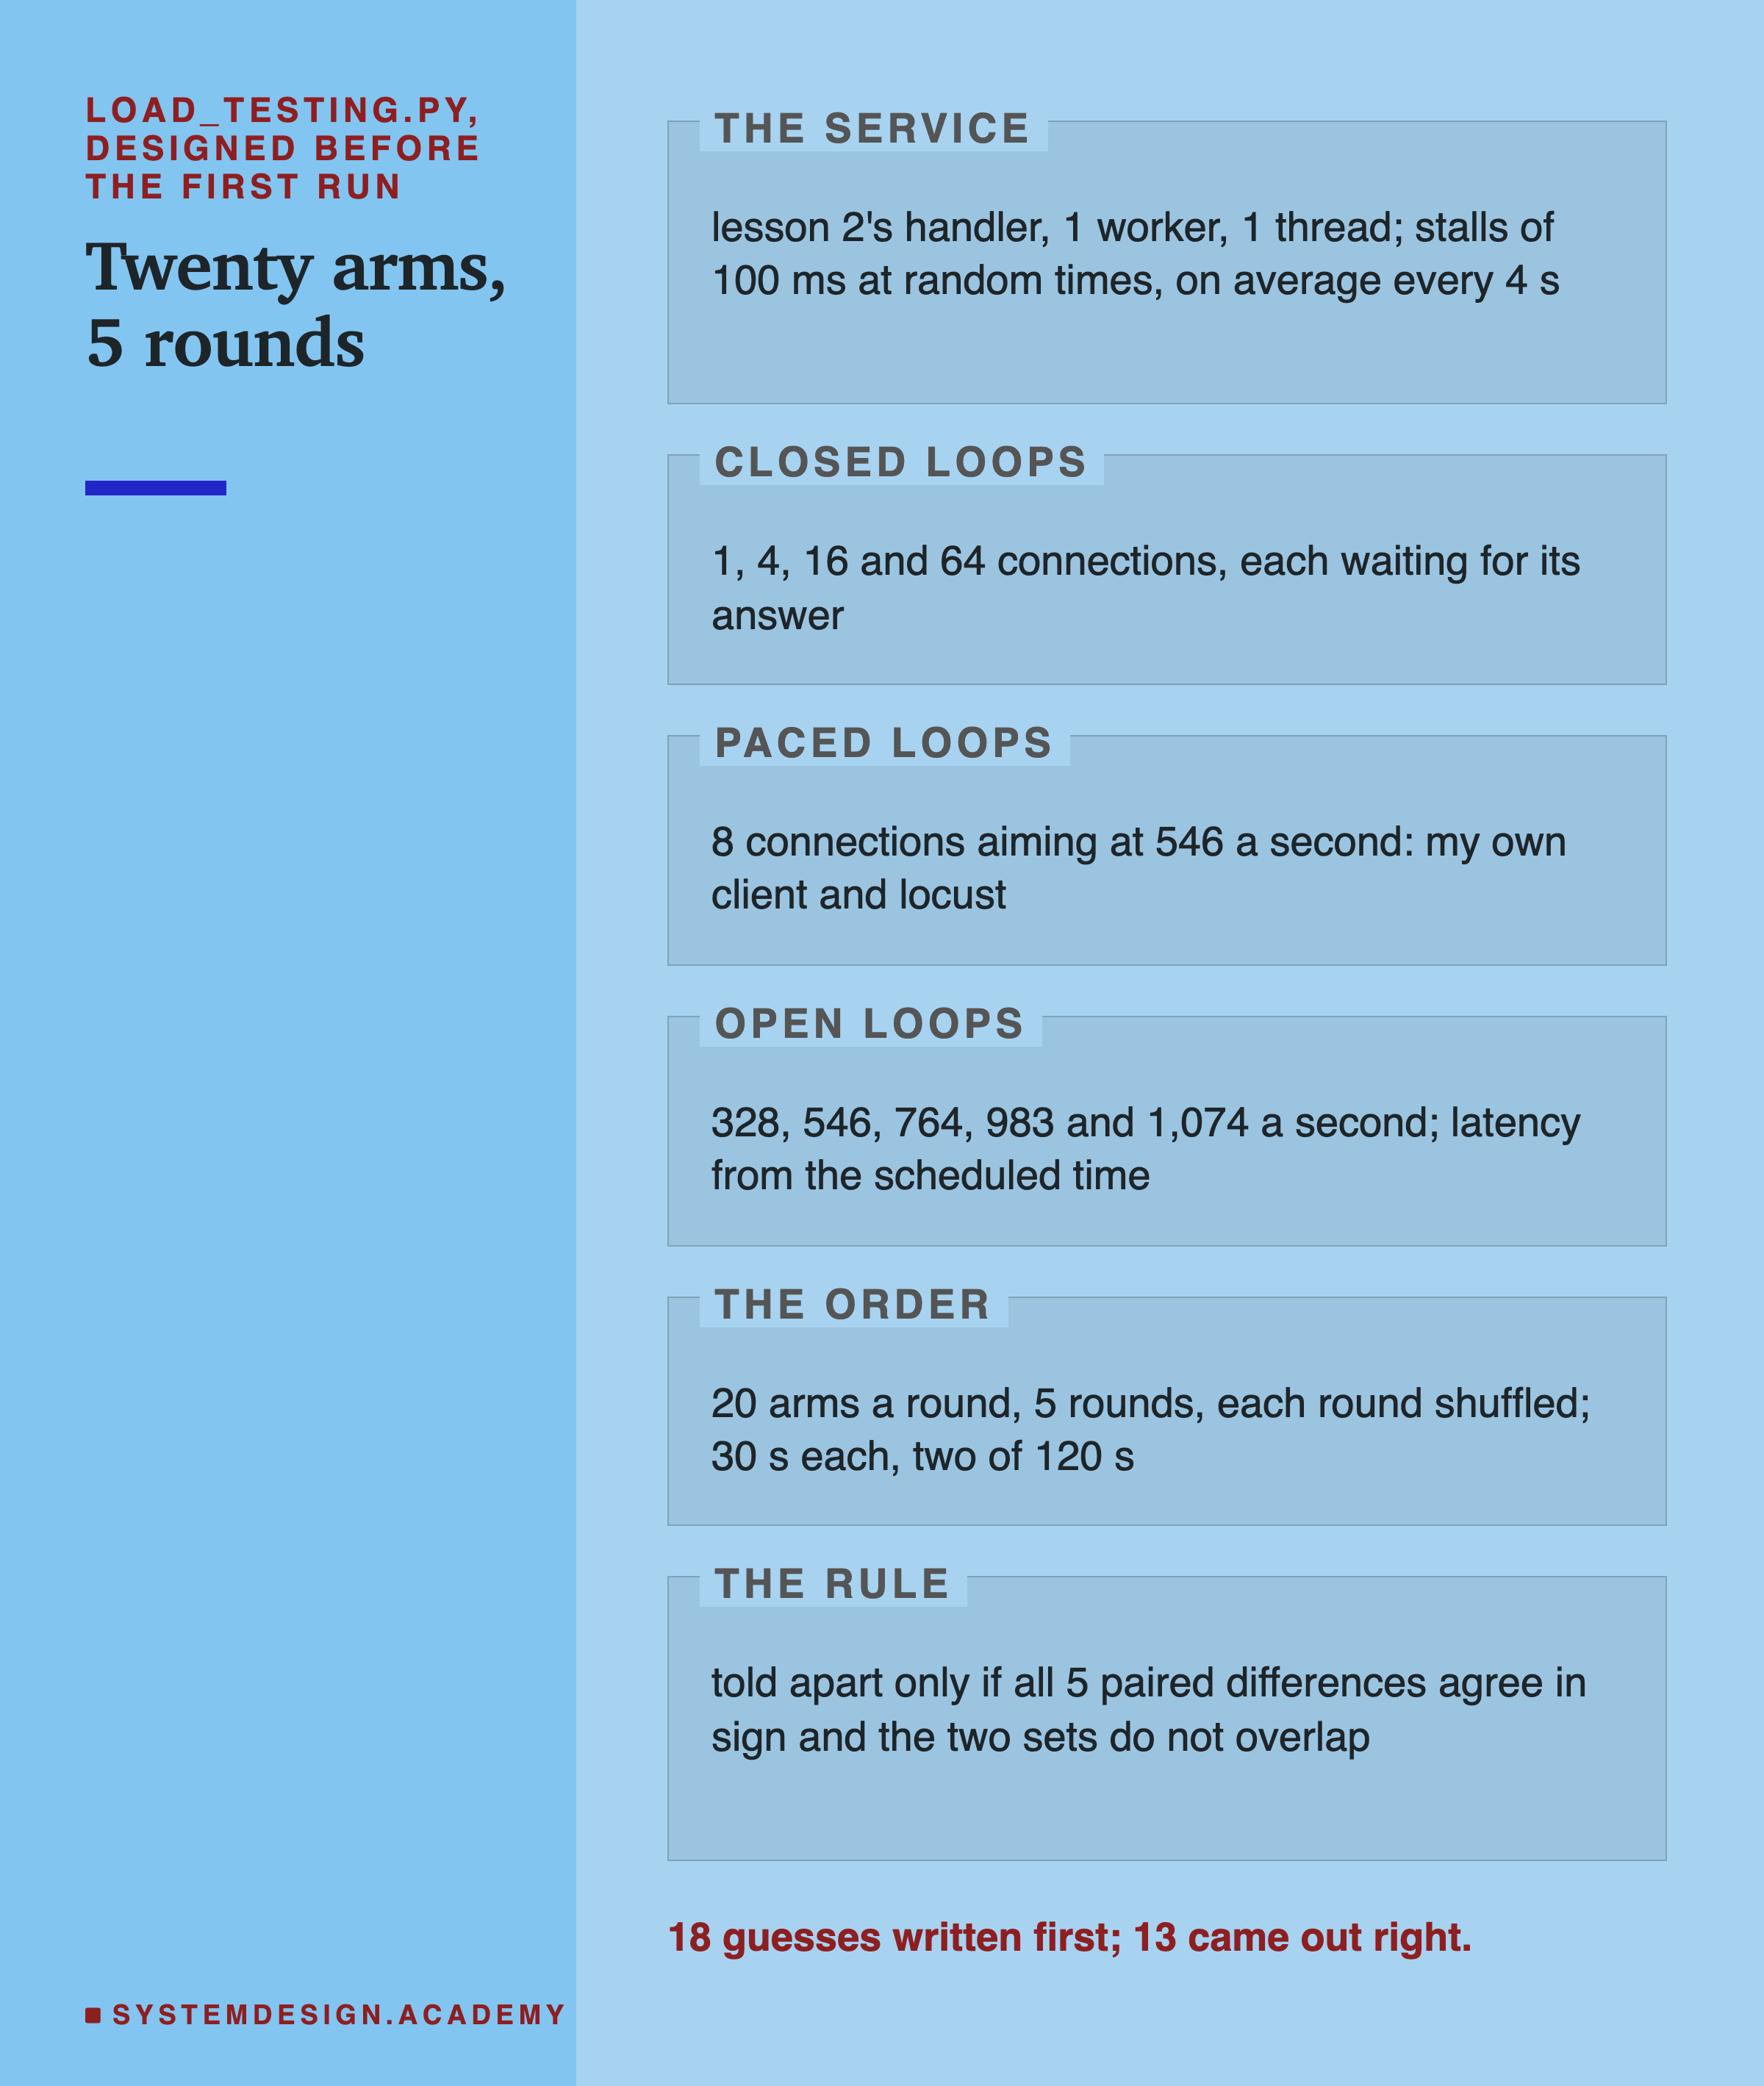
The stall. The tester sends a small "arm" request to the service at the start of each counted run. The service then draws stall times from a seed, a number that fixes a random draw so it can be repeated exactly. The stalls come on average every 4 seconds, never two within half a second. At each one, the service's event loop, the one thread that reads and answers every request in turn, runs time.sleep(0.1). For 100 ms nothing is read or answered. Sleep gives the core away, so the tester on the same core keeps its own clock during a stall.
One seed per round. Every run of a round with the stall on used the same seed, so every tester met the stalls at the same moments after its own start. And the open runs at one rate used the same arrival times with the stall on and off. So I could compare two testers, or stall on and off, on matched runs.
What counts as the truth. For a given rate, I take the open loop's p99 at that rate, in the same round, with the same stalls. That is what users arriving on their own clock at that rate saw.
The rule. A paired difference is the difference between two arms within the same round. A difference is "told apart from run-to-run noise" only if all five paired differences have the same sign, AND the two sets of five values do not overlap. When I say one tester reported more than another, I compared those two directly.
The Machine, and the Tester That Shares It
Like lessons 2 to 6, every timing behind a finding comes from a small machine I rented from Amazon Web Services. The one run on my laptop, the demo near the end, is labelled as such.
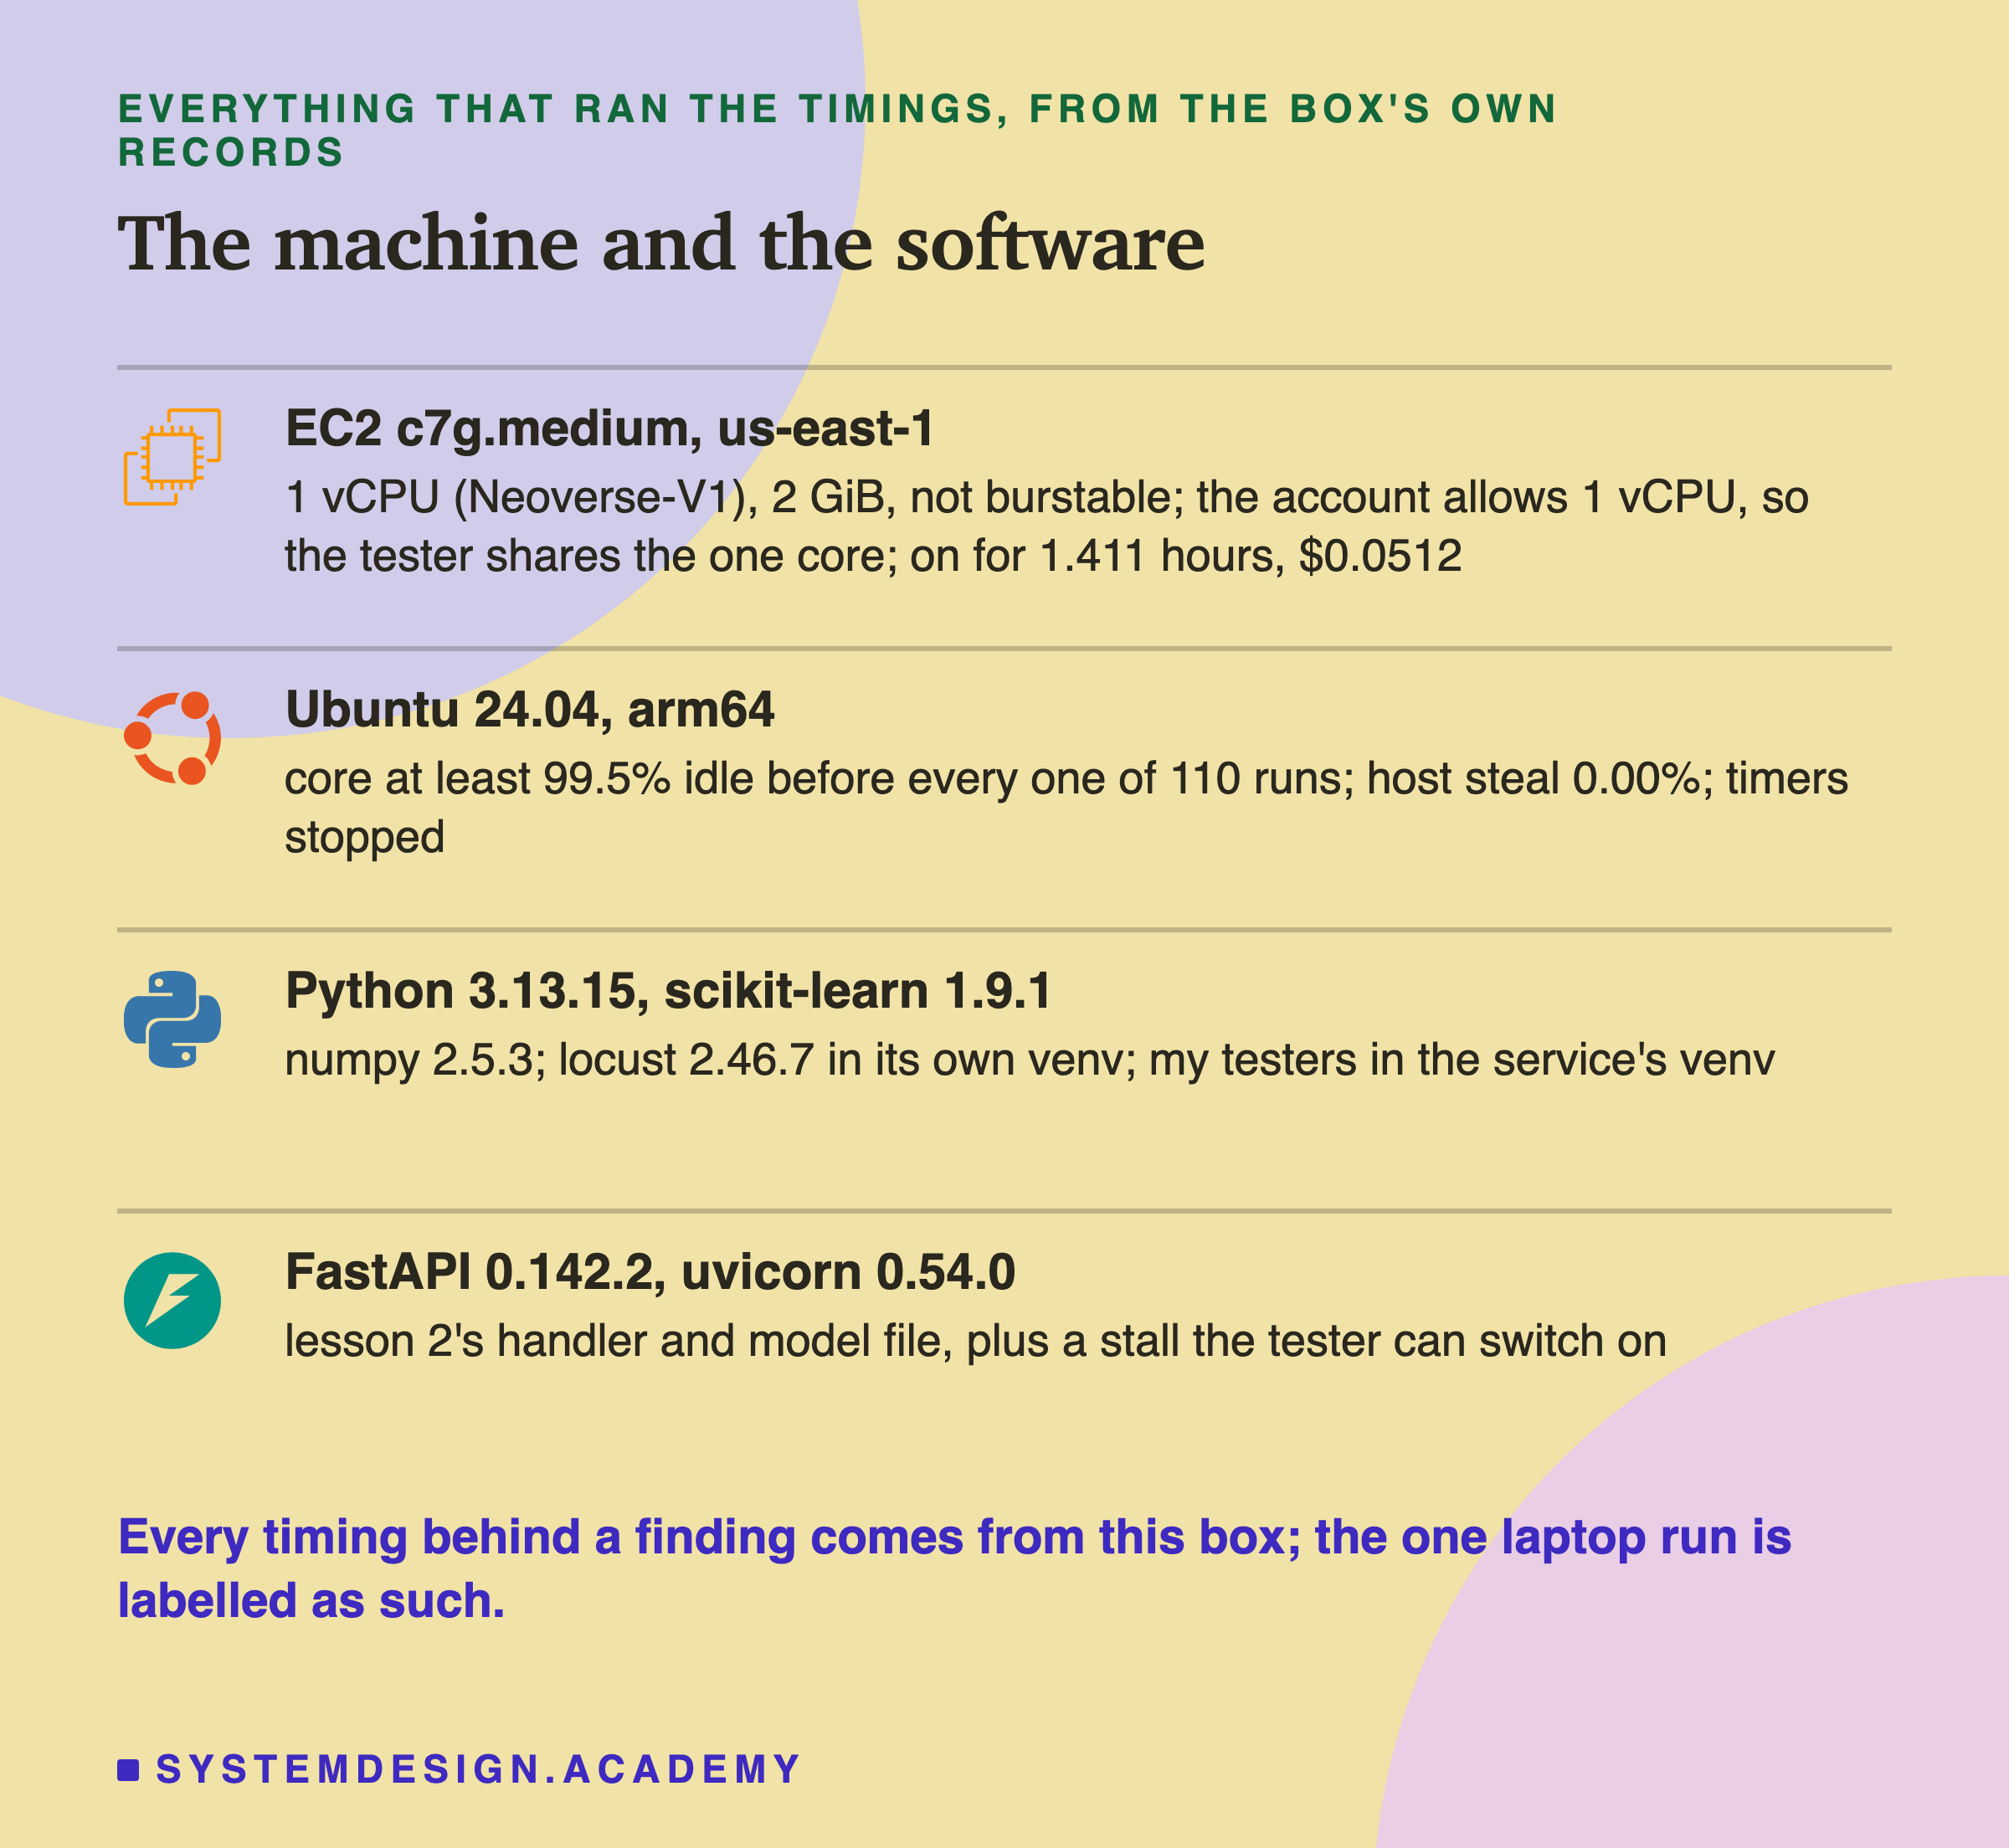
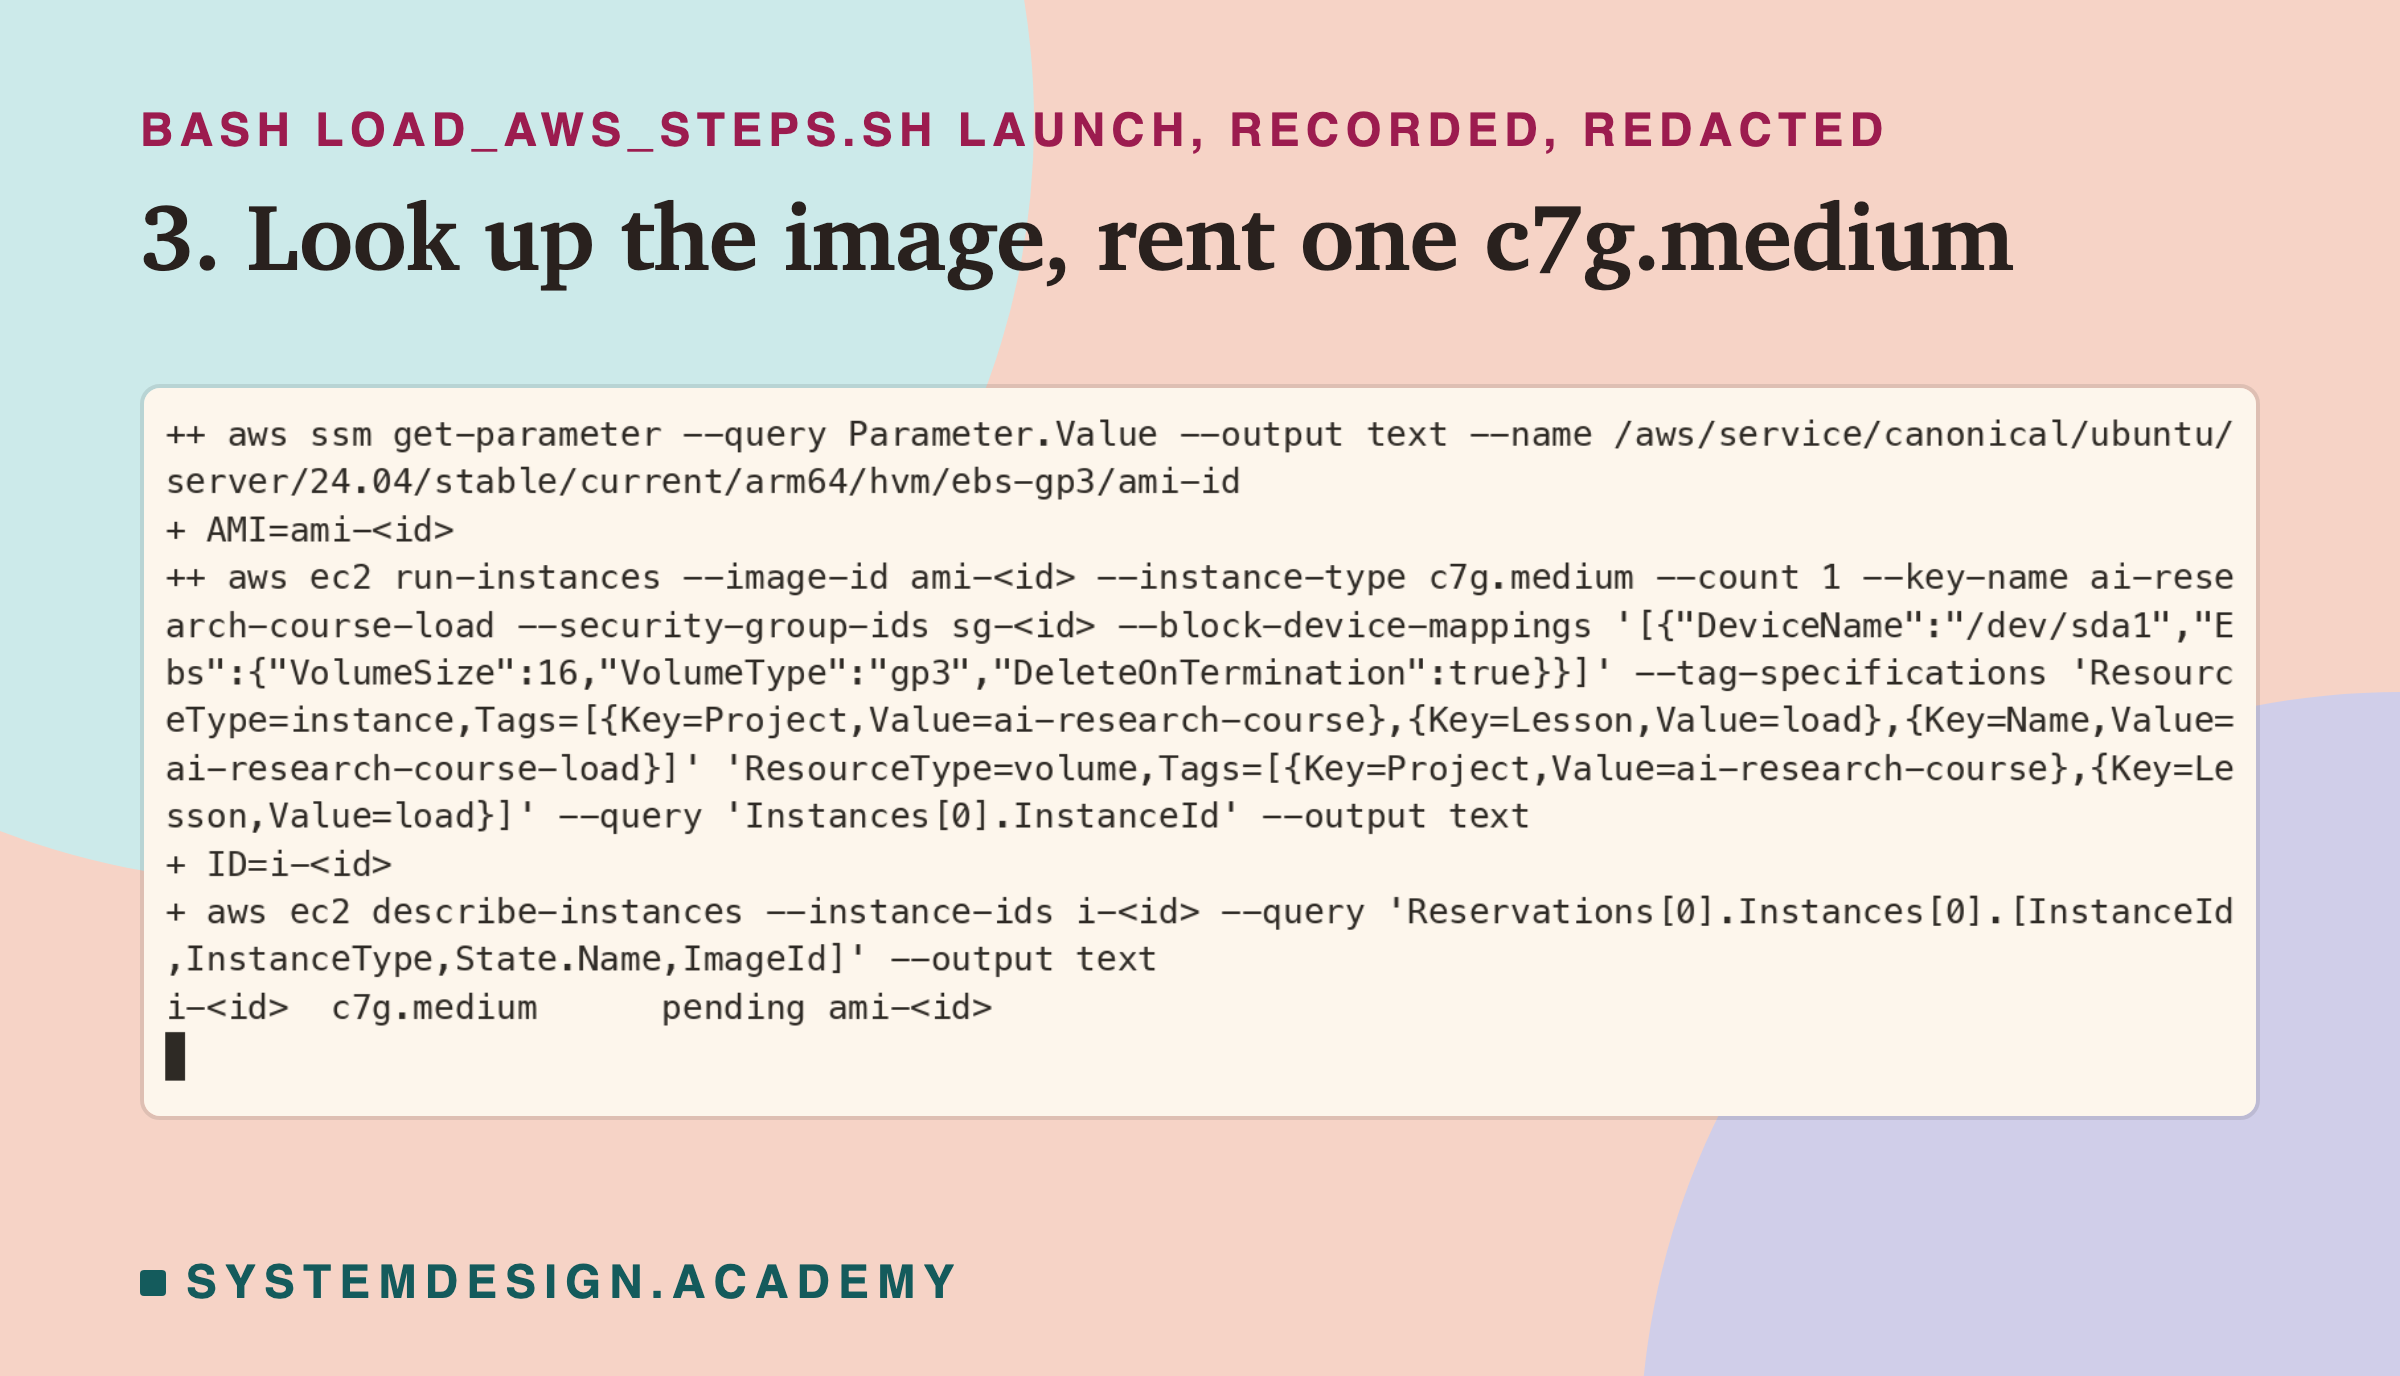
The box is an EC2 c7g.medium. AWS's own API lists it with 1 virtual CPU, 1 core and 2,048 MiB of memory, and not burstable. I checked the account's limit with the AWS service-quotas tool on the day: 1 vCPU for standard machines. So the tester could not run on a second box.
Before every run, a fresh service was started. Then the core had to be at least 95% idle over two seconds before the tester began. In all 110 runs it was at least 99.5% idle. Steal, time the machine under my box gives to other customers' boxes, was 0.00%. No SSH session was open at the start or end of any run.
The system log had 64 lines during runs, in 11 of the 110 runs. Some came from a statistics job that cron starts on a schedule. Some came from the AWS management agent failing to reach AWS, because my box had no permission to talk to it. One came from systemd skipping a cache clean-up, and one from the kernel.
The Whole Lab in One Picture
Before the recordings, here is the whole lab as one numbered sequence. The numbers on the arrows match the numbers on the recordings that follow.
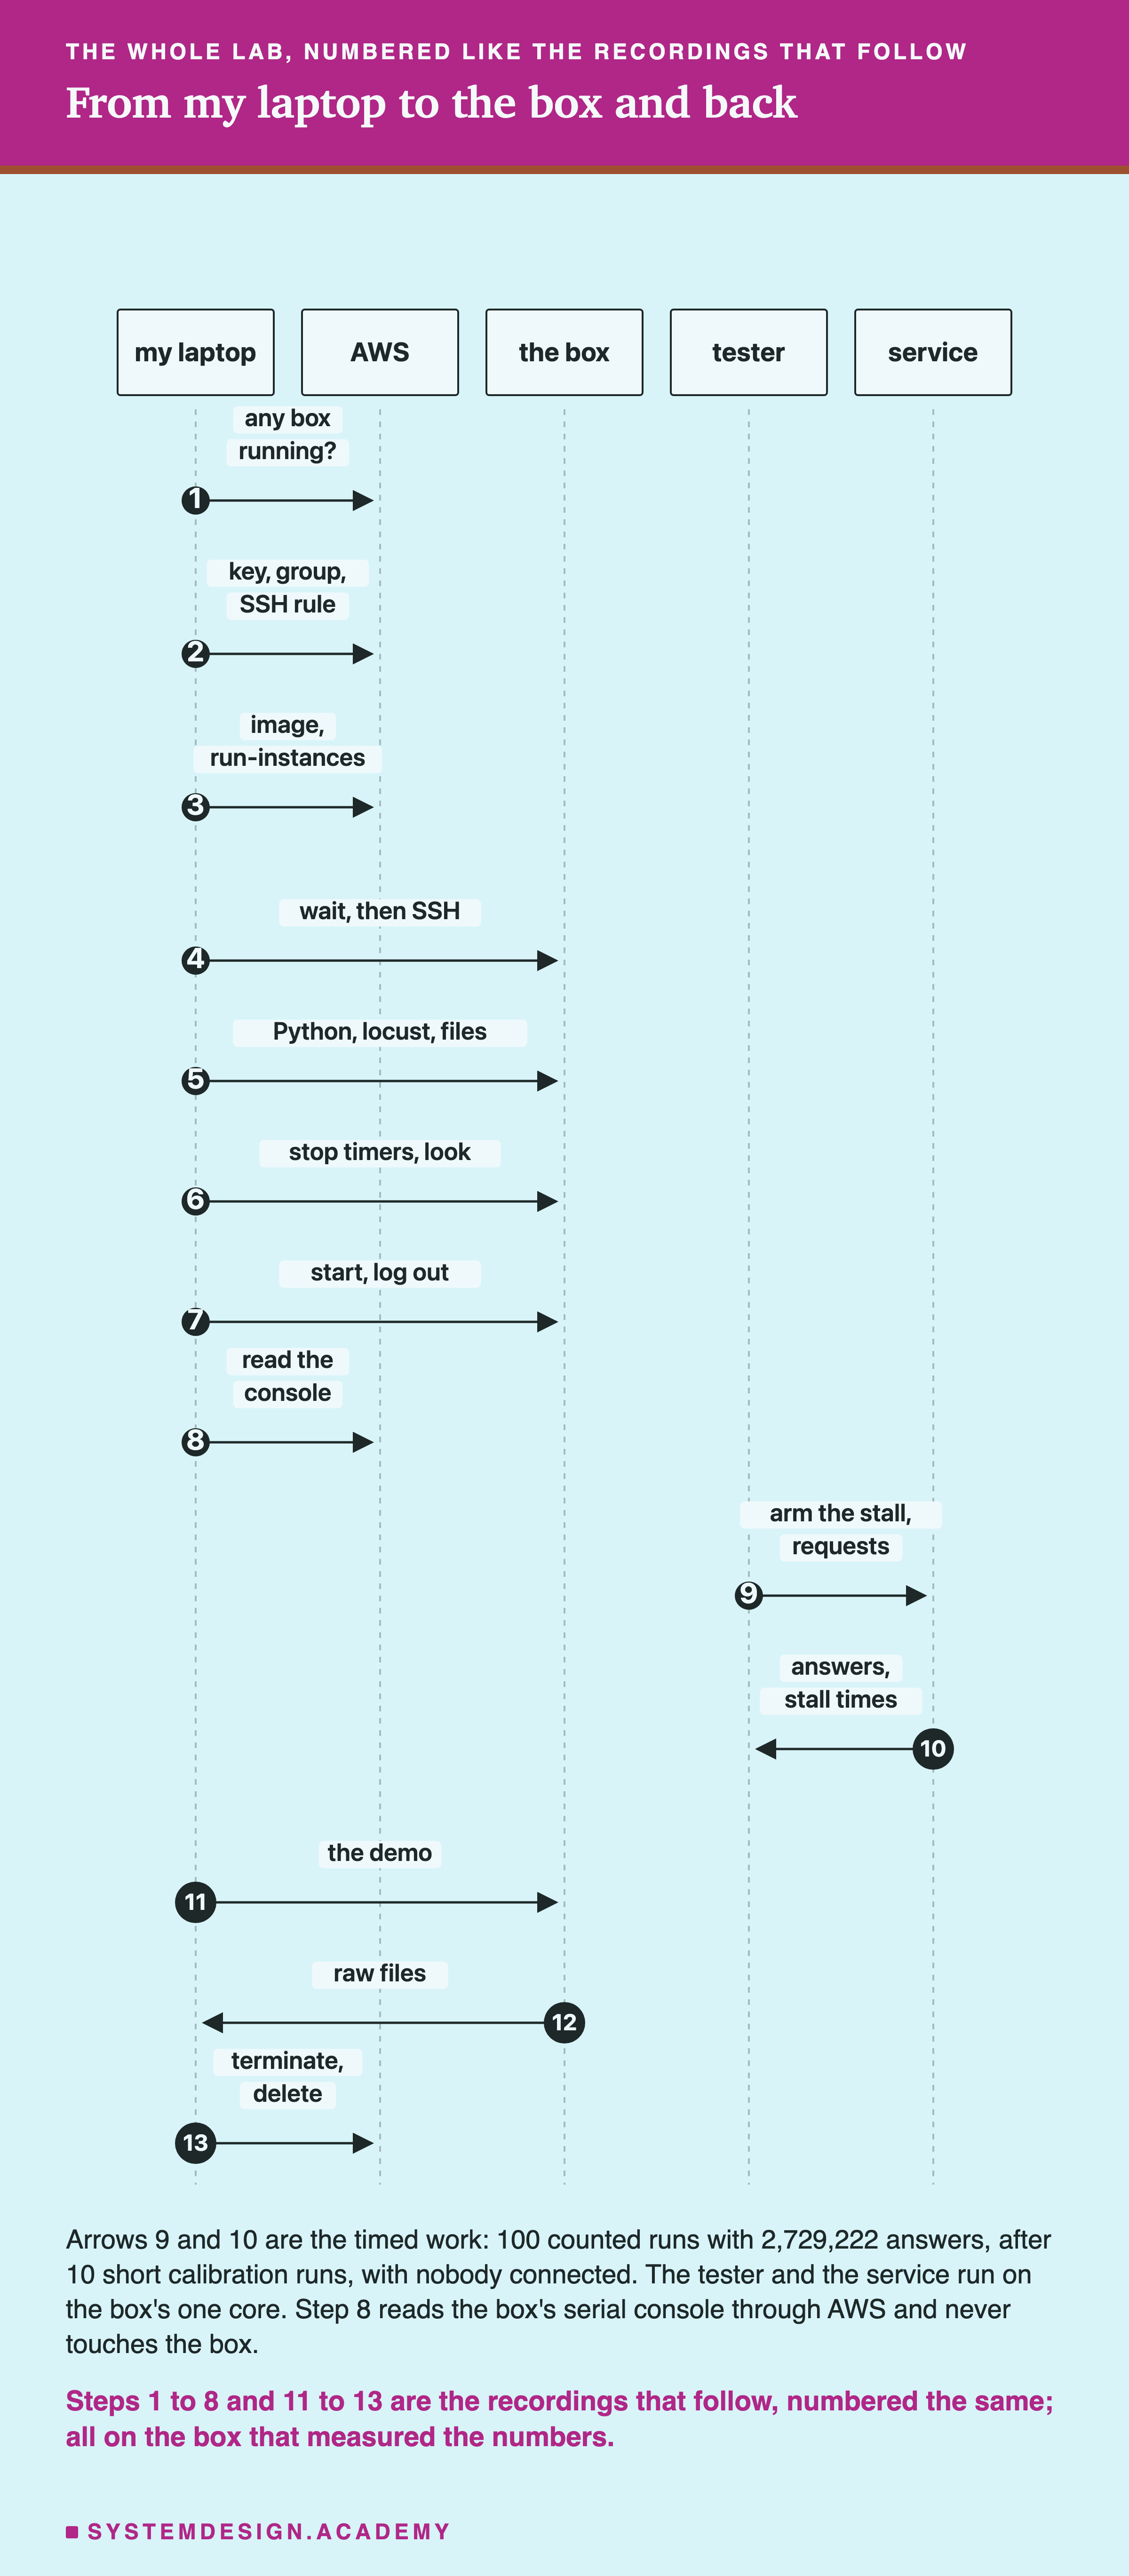
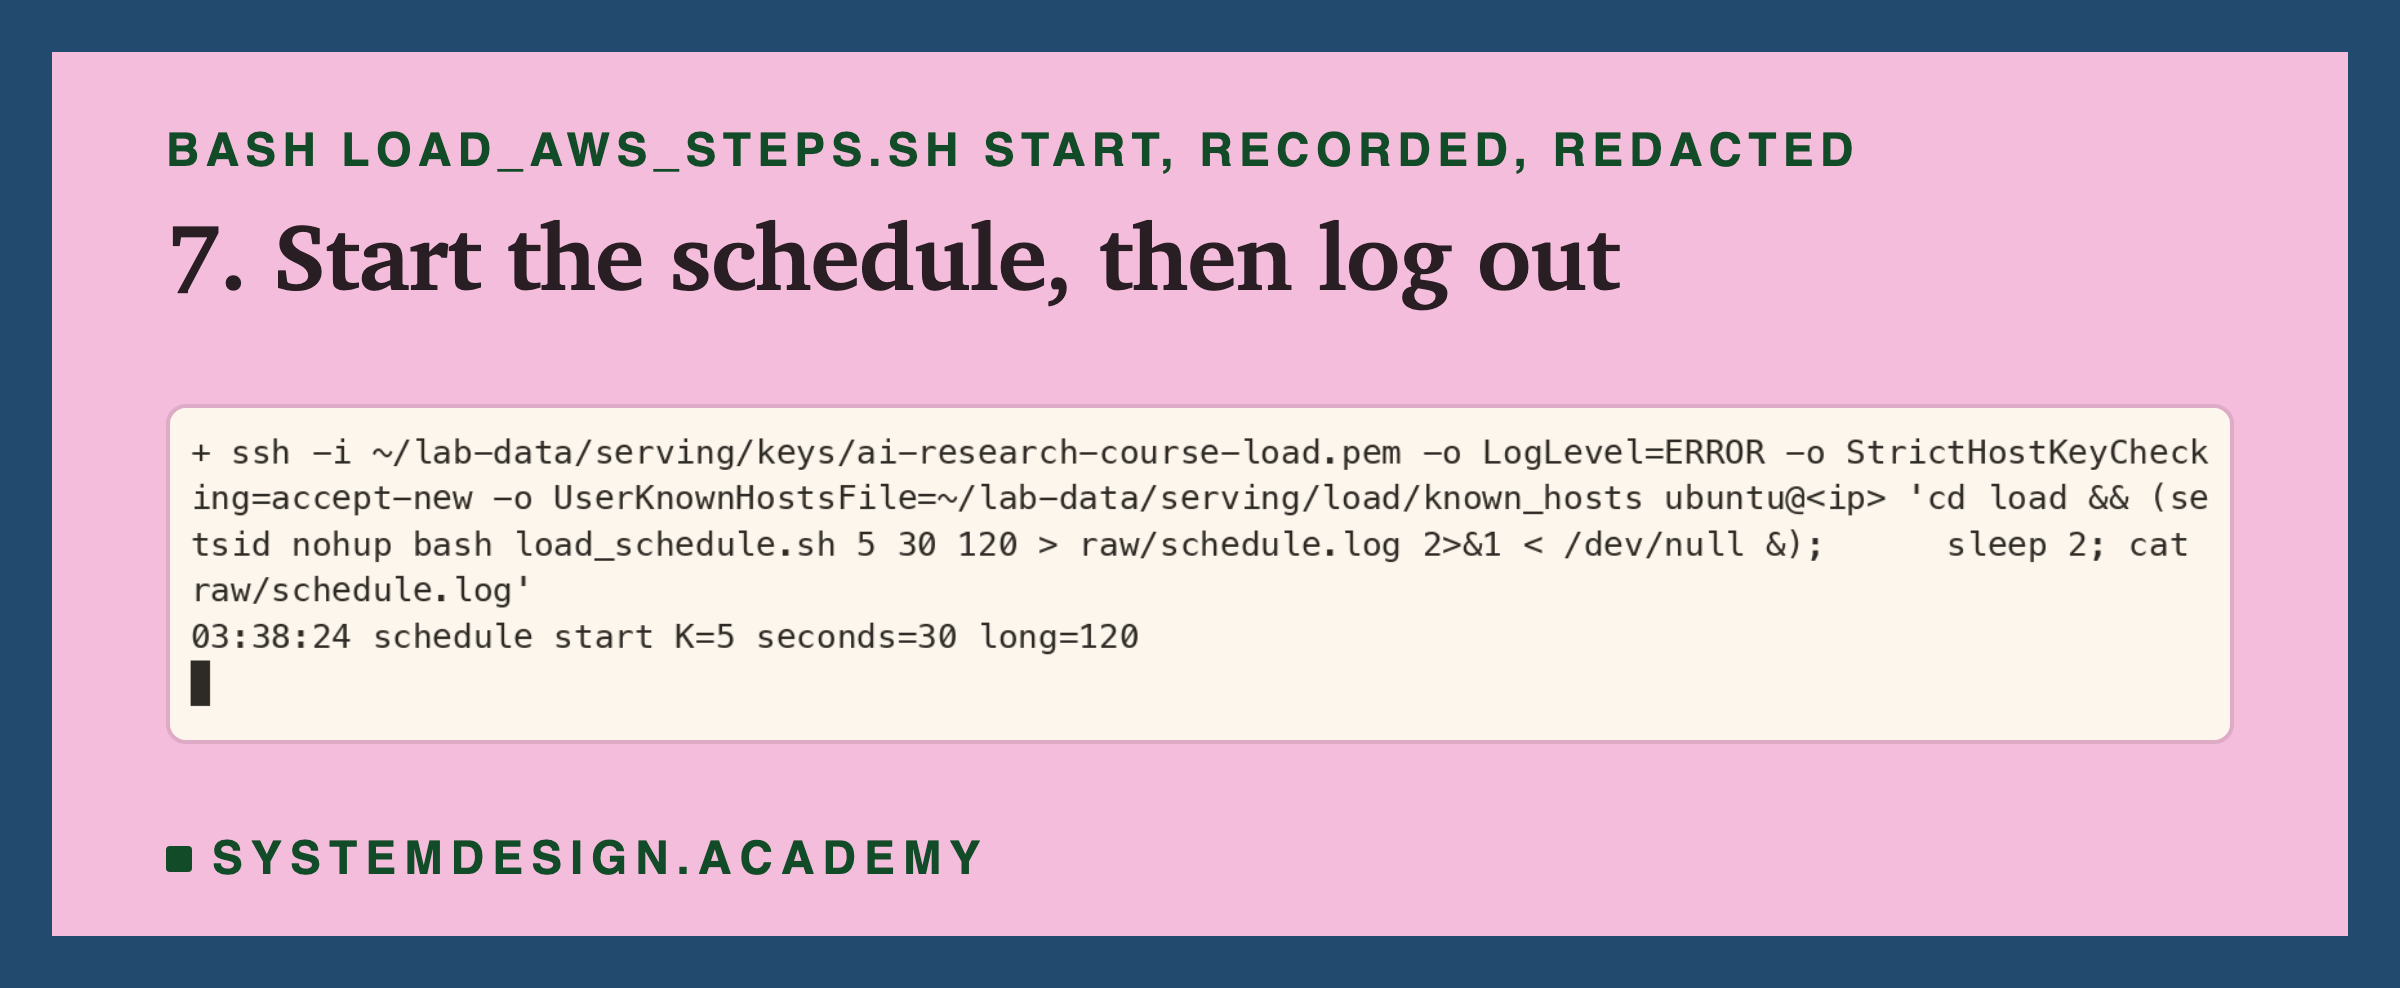
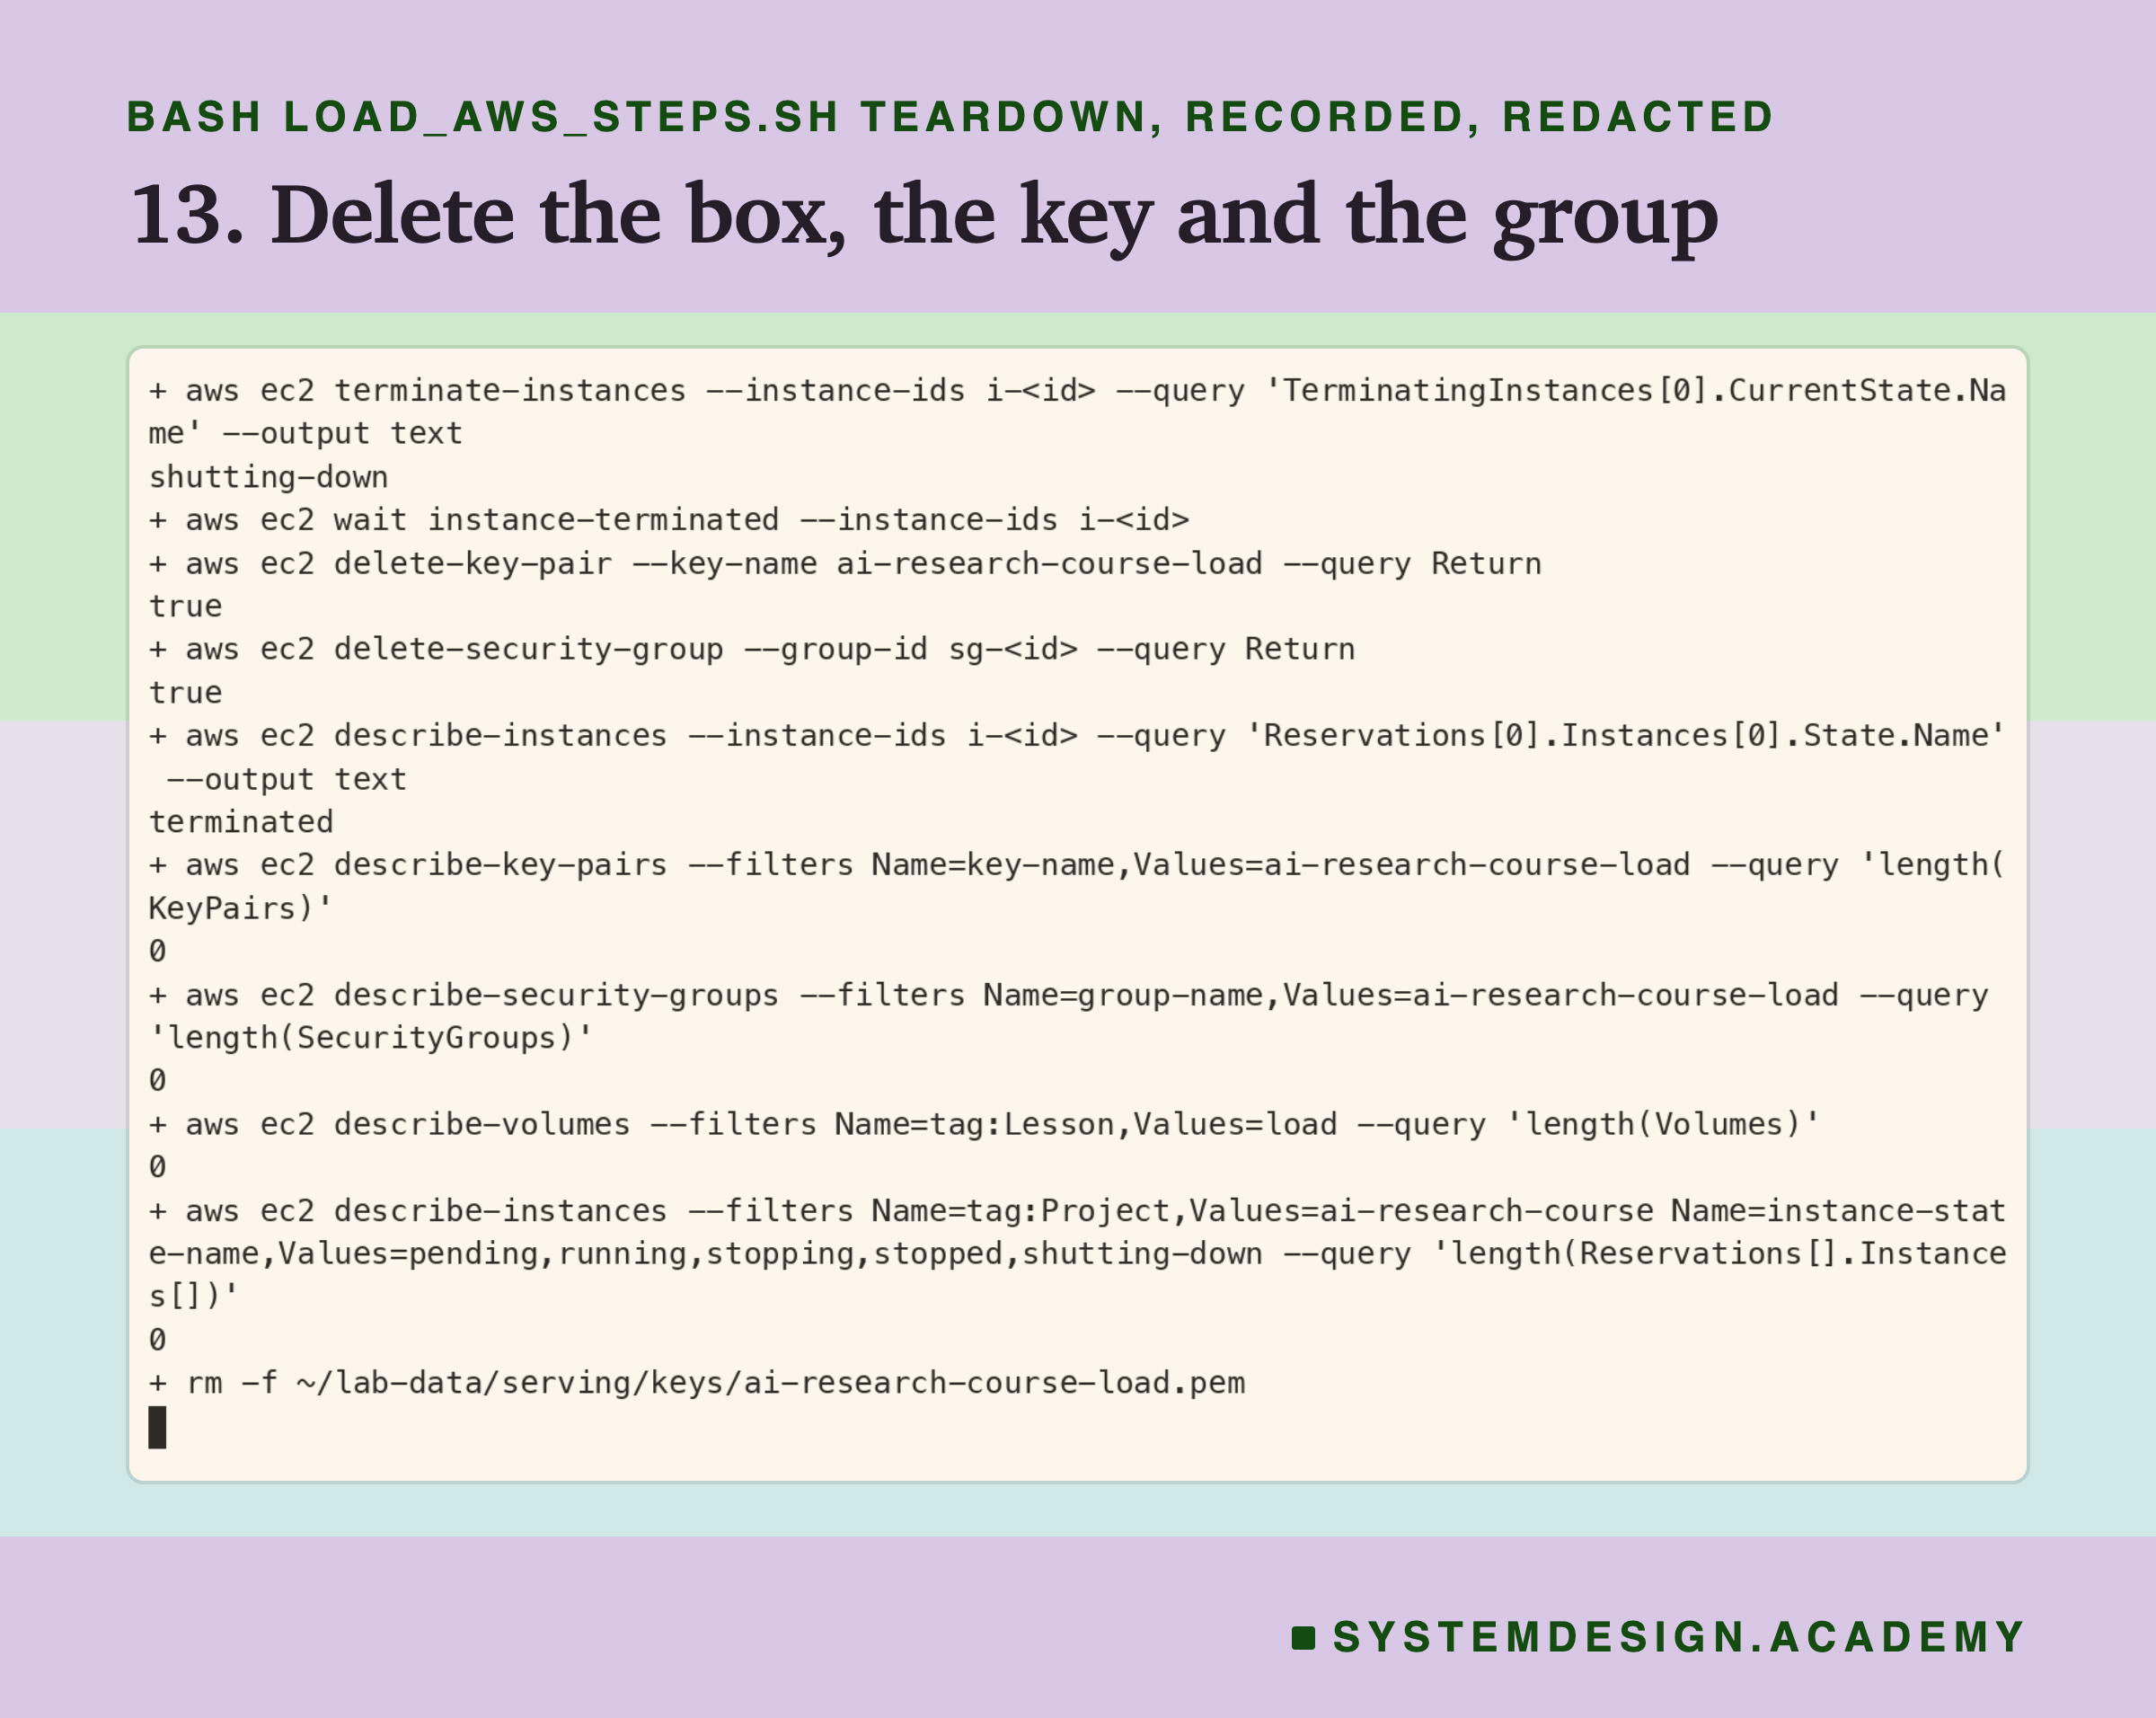
Steps 1 to 7 happen once: check, rent the box, set it up, and start the schedule. Step 8 is how I watched the schedule without touching the box. Arrows 9 and 10 are the timed work. Each counted run begins with the tester arming the stall. It ends with the service handing back the exact times of its stalls, read on the same clock as the tester's. Steps 11 to 13 come after the schedule: the student demo, the copy of the results to my laptop, and the deletion of everything.
Build the Lab Box Yourself
The rented box is part of the lab, so I show every step of it. You can rent the same kind of box and run the same schedule.
Which box you see. Every recording comes from the box that measured this lesson's numbers. No recording and no SSH happened during a timed run. Two steps were recorded twice. In step 2, the first recording lost its top lines. So, before renting anything, I deleted that key and group and made them again for the recording you see. In step 5, the same thing happened, and I ran the step again on the same box; it is safe to repeat.
What you need first. An AWS account, the AWS command line tool (aws) set up with your keys, and ssh, scp, rsync and curl. All the steps live in one file, scripts/labs/serving/load_files/load_aws_steps.sh. You run it from the scripts/labs/serving folder, one step at a time: bash load_files/load_aws_steps.sh check, then access, and so on. Every code block below is copied word for word from that file.
The blocks use a few names the file sets at its top. Run these lines first, from the scripts/labs/serving folder, if you paste the blocks by hand. All of them are copied from the file, except HERE=$PWD: the file works out that folder from its own location, which a pasted line cannot do.
export AWS_DEFAULT_REGION=us-east-1 AWS_PAGER=""
NAME=ai-research-course-load
HERE=$PWD
STATE=${LOAD_STATE:-$HOME/lab-data/serving/load}
KEY=$HOME/lab-data/serving/keys/$NAME.pem
K=${K:-5}; SEC=${SEC:-30}; LONG=${LONG:-120}
mkdir -p "$STATE" "$HOME/lab-data/serving/keys"
SSHO=(-o LogLevel=ERROR -o StrictHostKeyChecking=accept-new -o "UserKnownHostsFile=$STATE/known_hosts")
[ -f "$STATE/id" ] && ID=$(cat "$STATE/id")
[ -f "$STATE/ip" ] && IP=$(cat "$STATE/ip")
[ -f "$STATE/sg" ] && SG=$(cat "$STATE/sg")
B=/home/ubuntu/load
Steps 1 to 3: Check, Lock the Door, Rent the Box
Step 1: is any other course box running? My account allows one box of this kind at a time, and another lesson may be using it. So the first command counts the course's boxes that are not yet deleted. It must print 0.
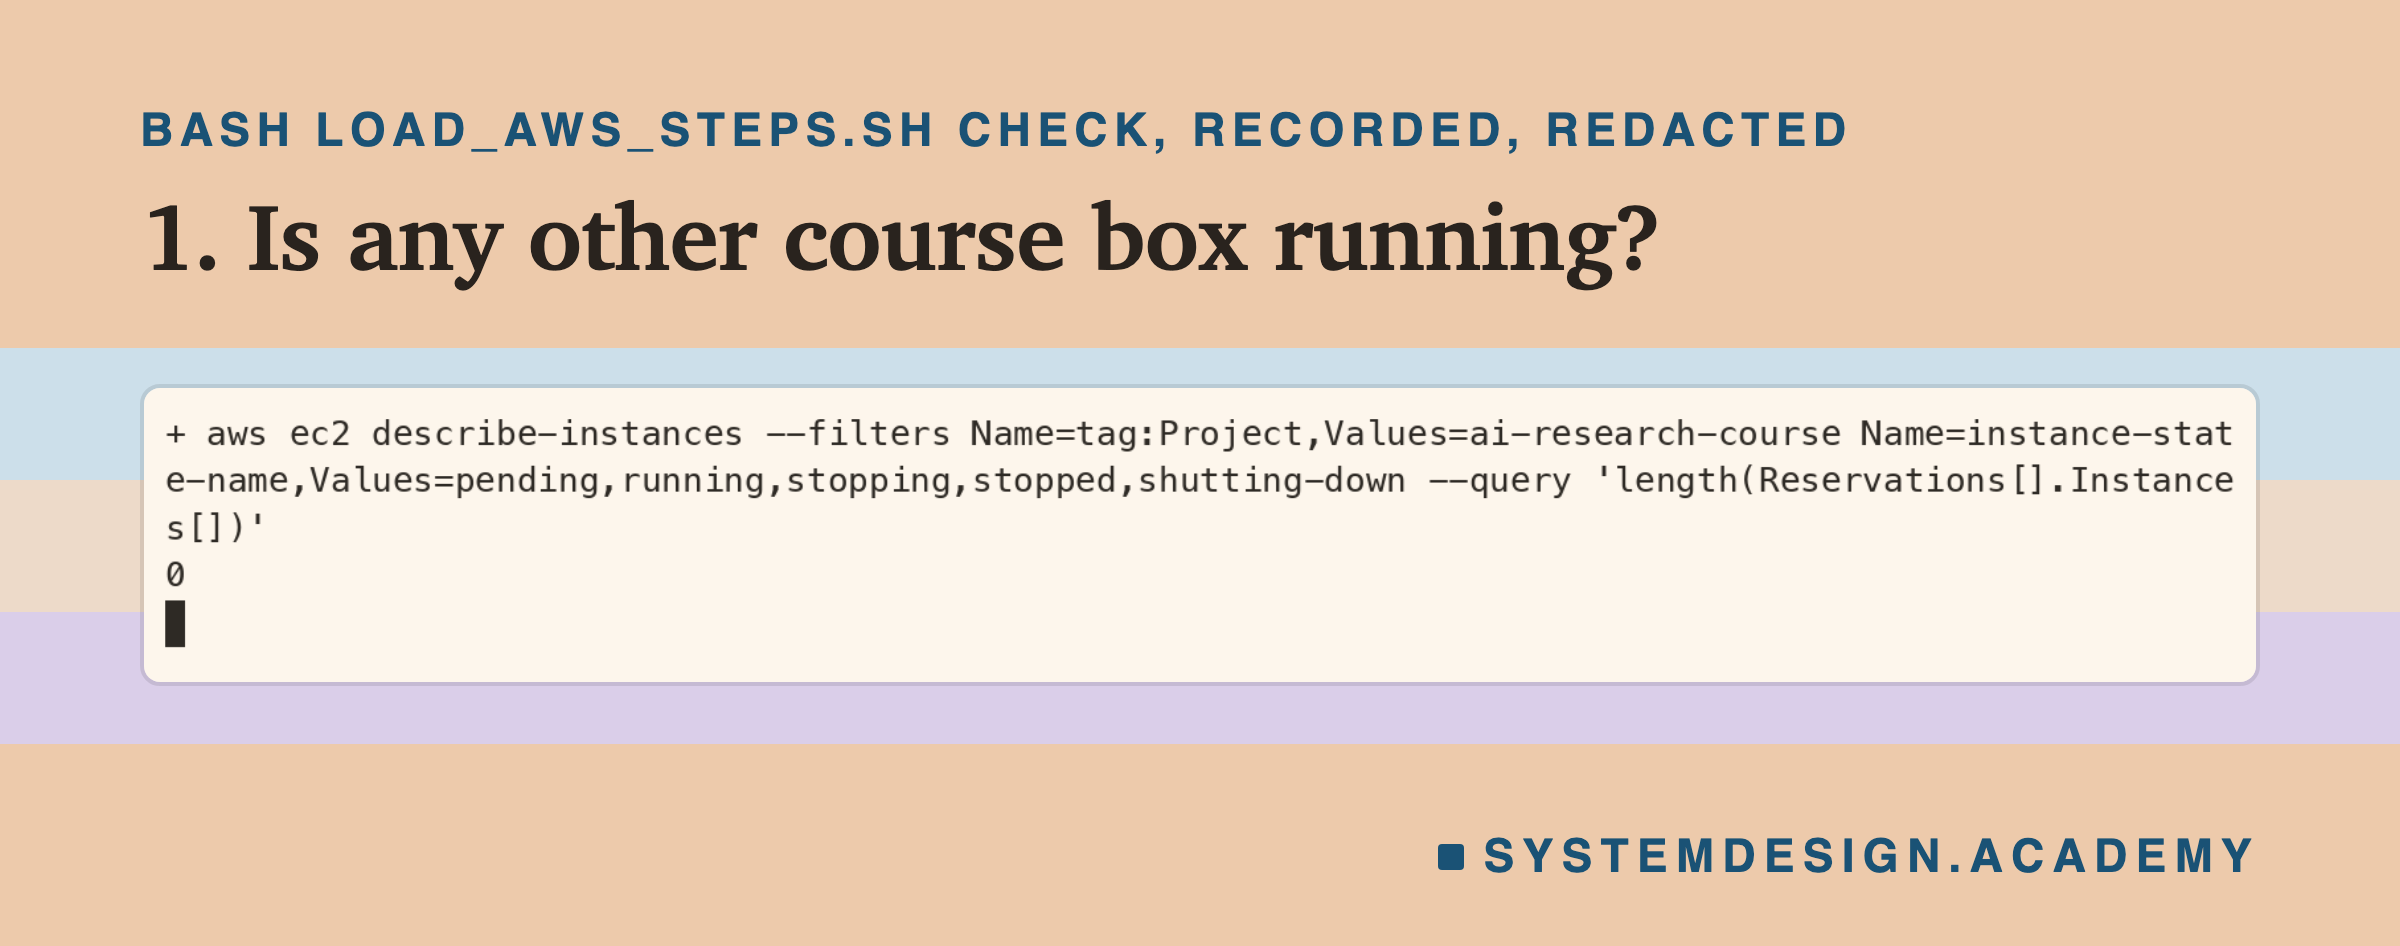
The recording shows the command and its answer, 0, so no other course box was alive. This is the command:
  aws ec2 describe-instances --filters "Name=tag:Project,Values=ai-research-course" \
    "Name=instance-state-name,Values=pending,running,stopping,stopped,shutting-down" \
    --query "length(Reservations[].Instances[])"
Step 2: a key and a locked door. A key pair is how you prove to the box that you are allowed in. AWS keeps one half, and you keep the other half in a file only you can read. A security group is a door rule for the box. Mine opens only port 22, the SSH port, and only to my own address. Both get tags, labels that say which project and lesson they belong to.
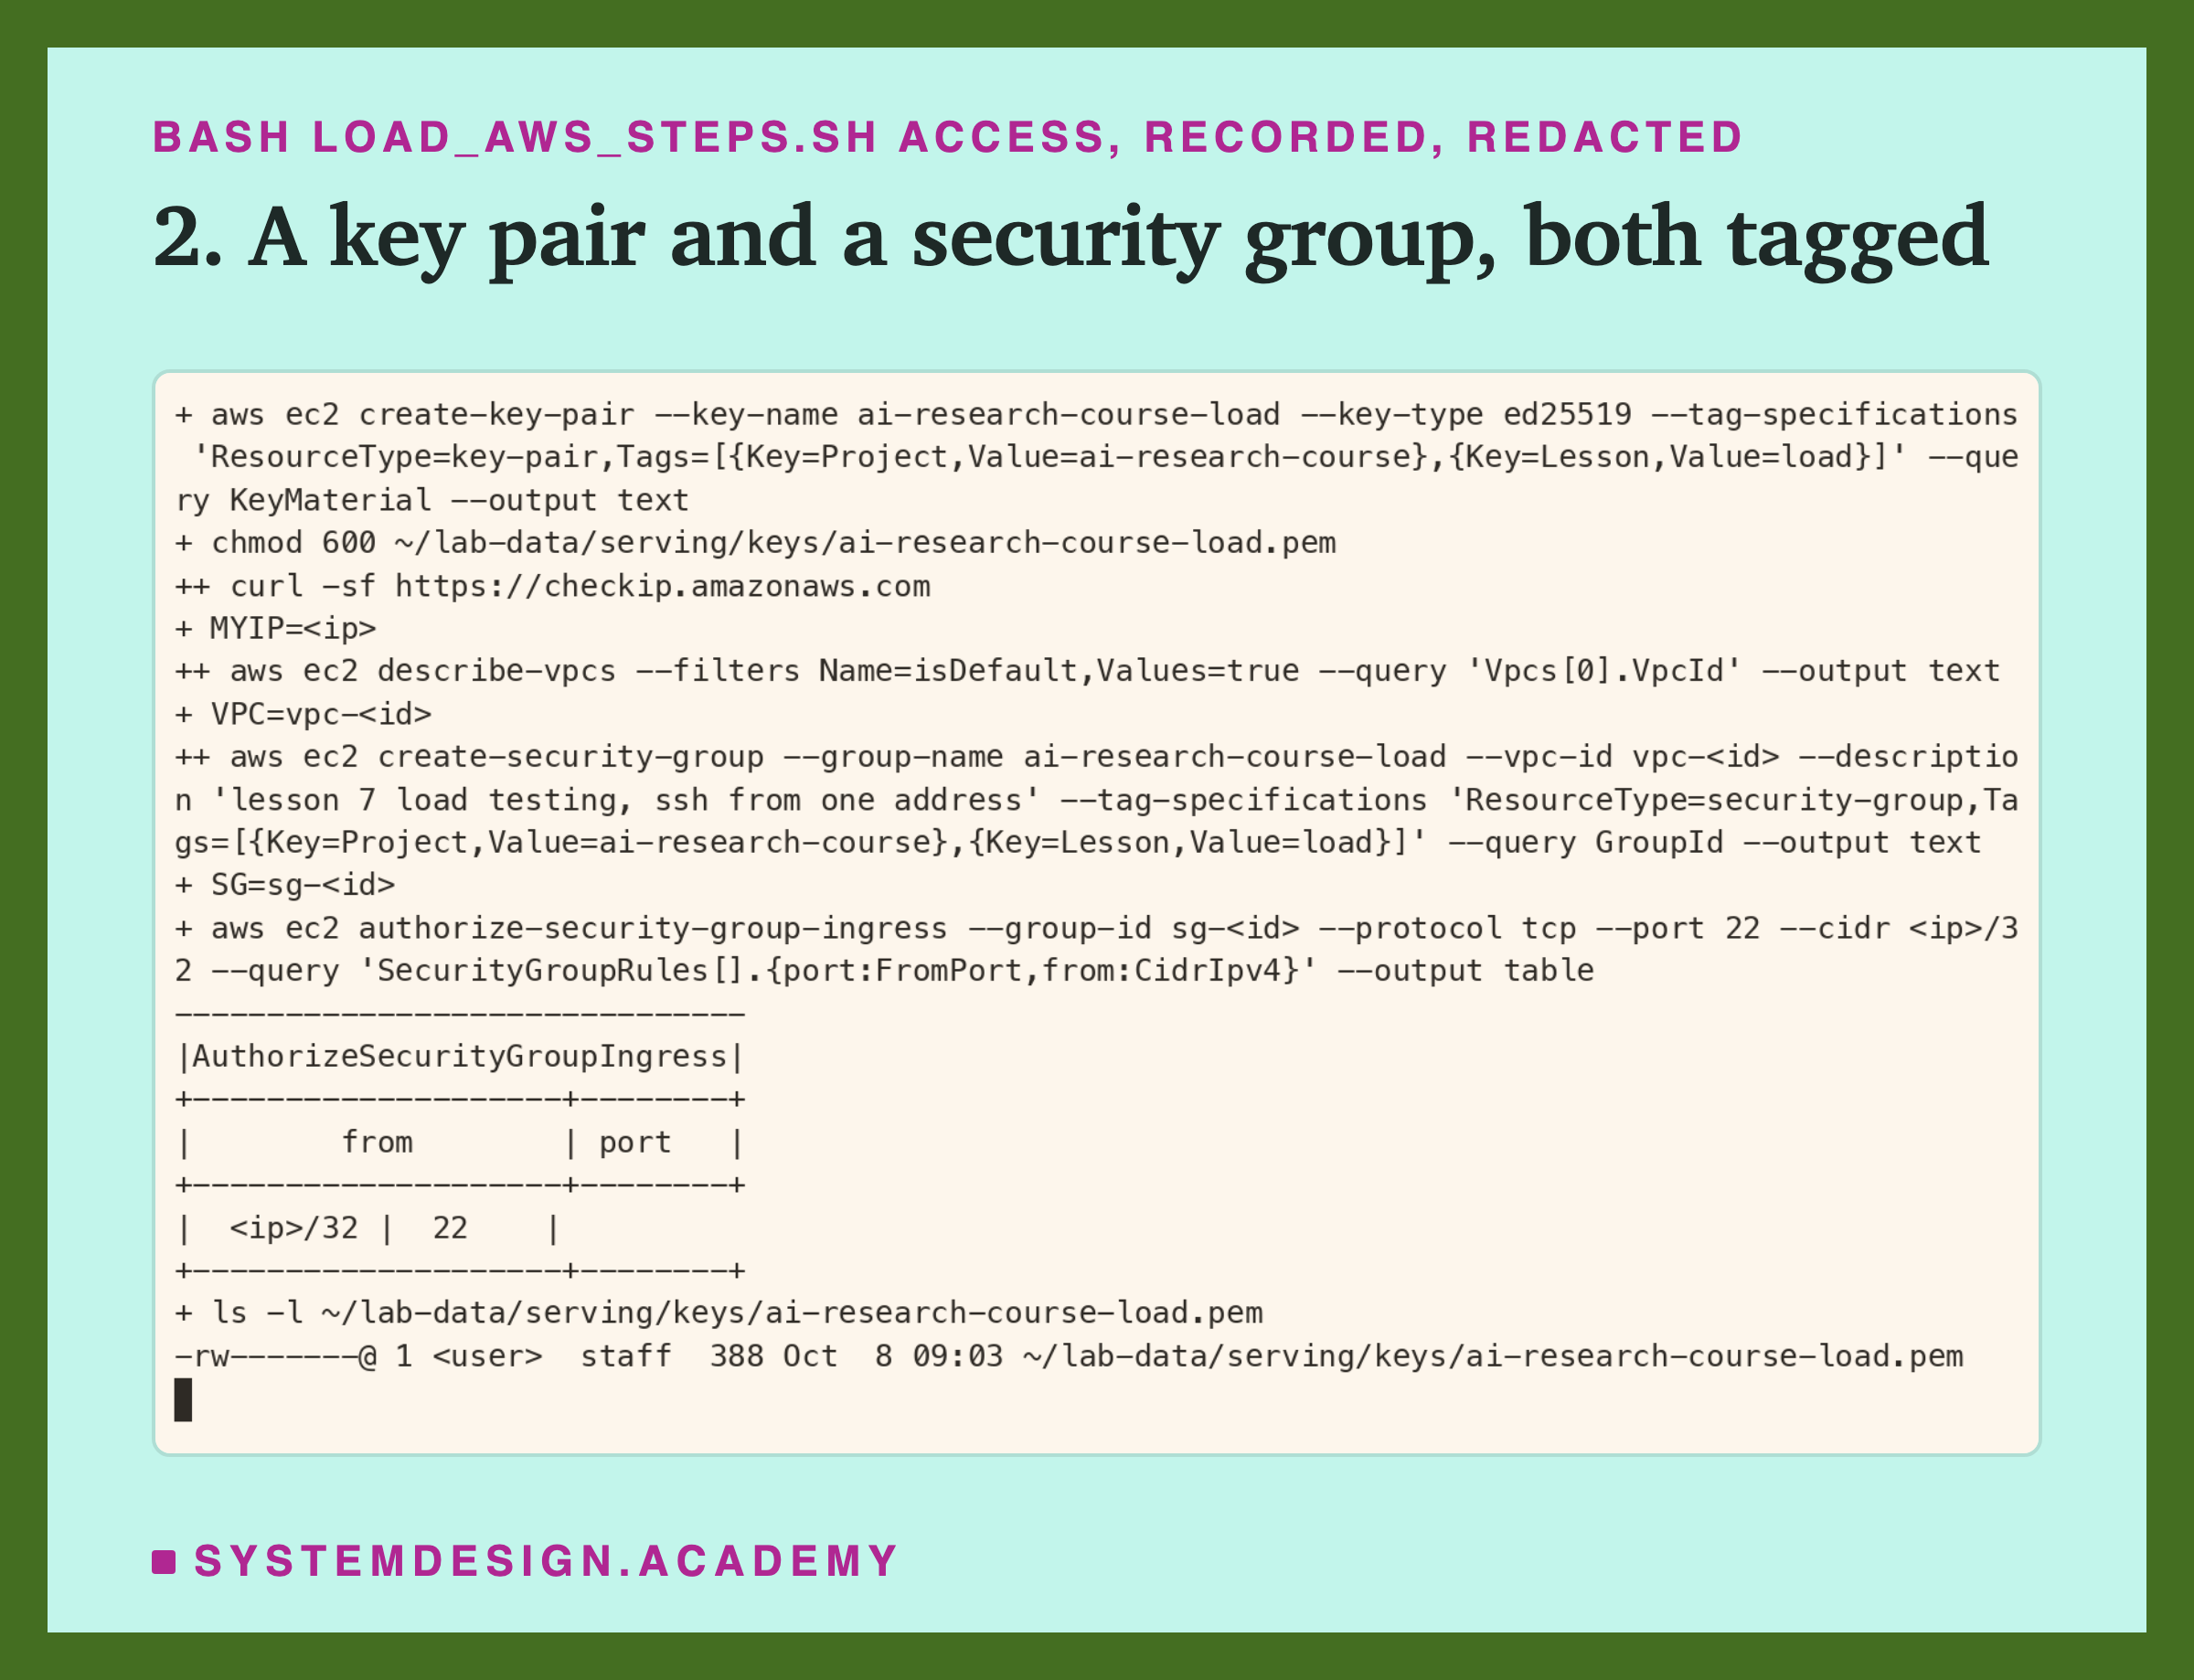
The key material went straight into the file and was never printed, and the door rule names only my own address. These are the commands:
  aws ec2 create-key-pair --key-name ai-research-course-load --key-type ed25519 \
    --tag-specifications "ResourceType=key-pair,Tags=[{Key=Project,Value=ai-research-course},{Key=Lesson,Value=load}]" \
    --query KeyMaterial --output text > ~/lab-data/serving/keys/ai-research-course-load.pem
  chmod 600 ~/lab-data/serving/keys/ai-research-course-load.pem
  MYIP=$(curl -sf https://checkip.amazonaws.com)
  VPC=$(aws ec2 describe-vpcs --filters Name=isDefault,Values=true --query "Vpcs[0].VpcId" --output text)
  SG=$(aws ec2 create-security-group --group-name ai-research-course-load --vpc-id "$VPC" \
    --description "lesson 7 load testing, ssh from one address" \
    --tag-specifications "ResourceType=security-group,Tags=[{Key=Project,Value=ai-research-course},{Key=Lesson,Value=load}]" \
    --query GroupId --output text)
  aws ec2 authorize-security-group-ingress --group-id "$SG" --protocol tcp --port 22 --cidr "$MYIP/32" \
    --query "SecurityGroupRules[].{port:FromPort,from:CidrIpv4}" --output table
Steps 4 to 7: Wait, Set Up, Look, Start
Step 4: wait until it runs. The AWS tool waits until the box is running. Then the script reads the box's public address into IP, and tries SSH every five seconds until the box answers.
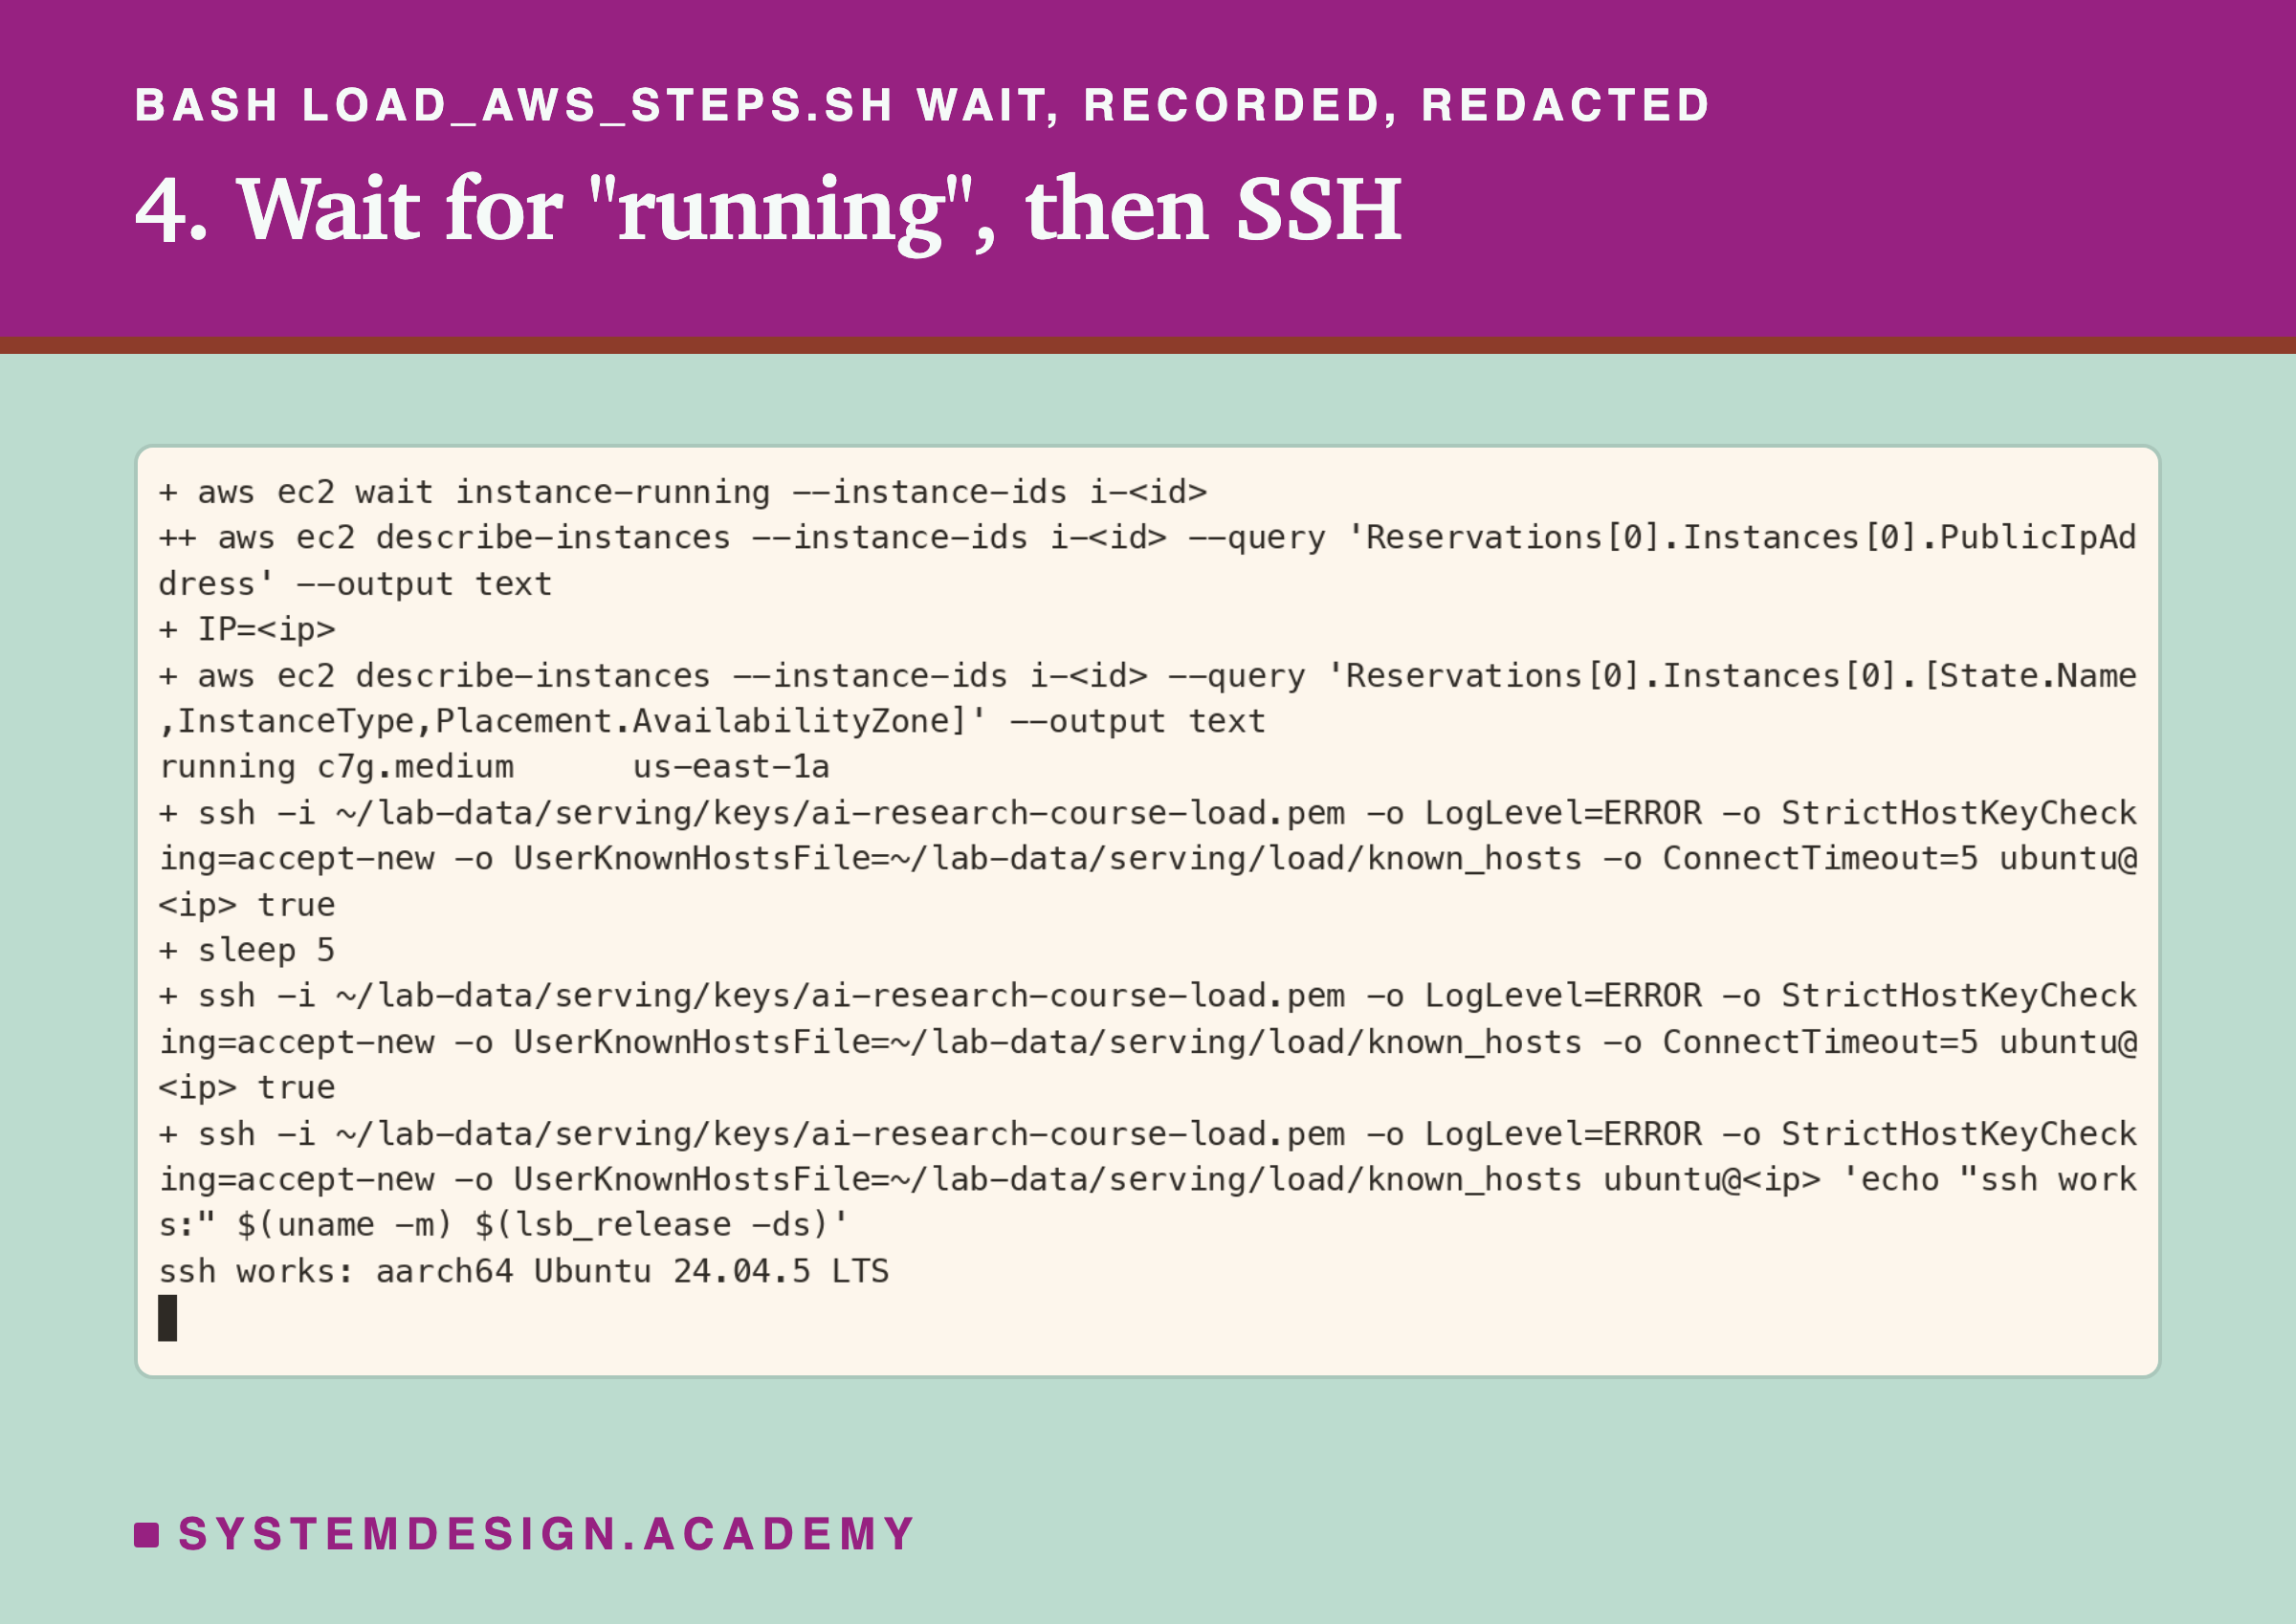
The first SSH try failed because the box was still starting, and the second answered. These are the main commands:
  aws ec2 wait instance-running --instance-ids "$ID"
  IP=$(aws ec2 describe-instances --instance-ids "$ID" \
    --query "Reservations[0].Instances[0].PublicIpAddress" --output text)
  until ssh -i ~/lab-data/serving/keys/ai-research-course-load.pem "${SSHO[@]}" -o ConnectTimeout=5 \
    ubuntu@"$IP" true 2>/dev/null; do sleep 5; done
  echo "$IP" > "$STATE/ip"
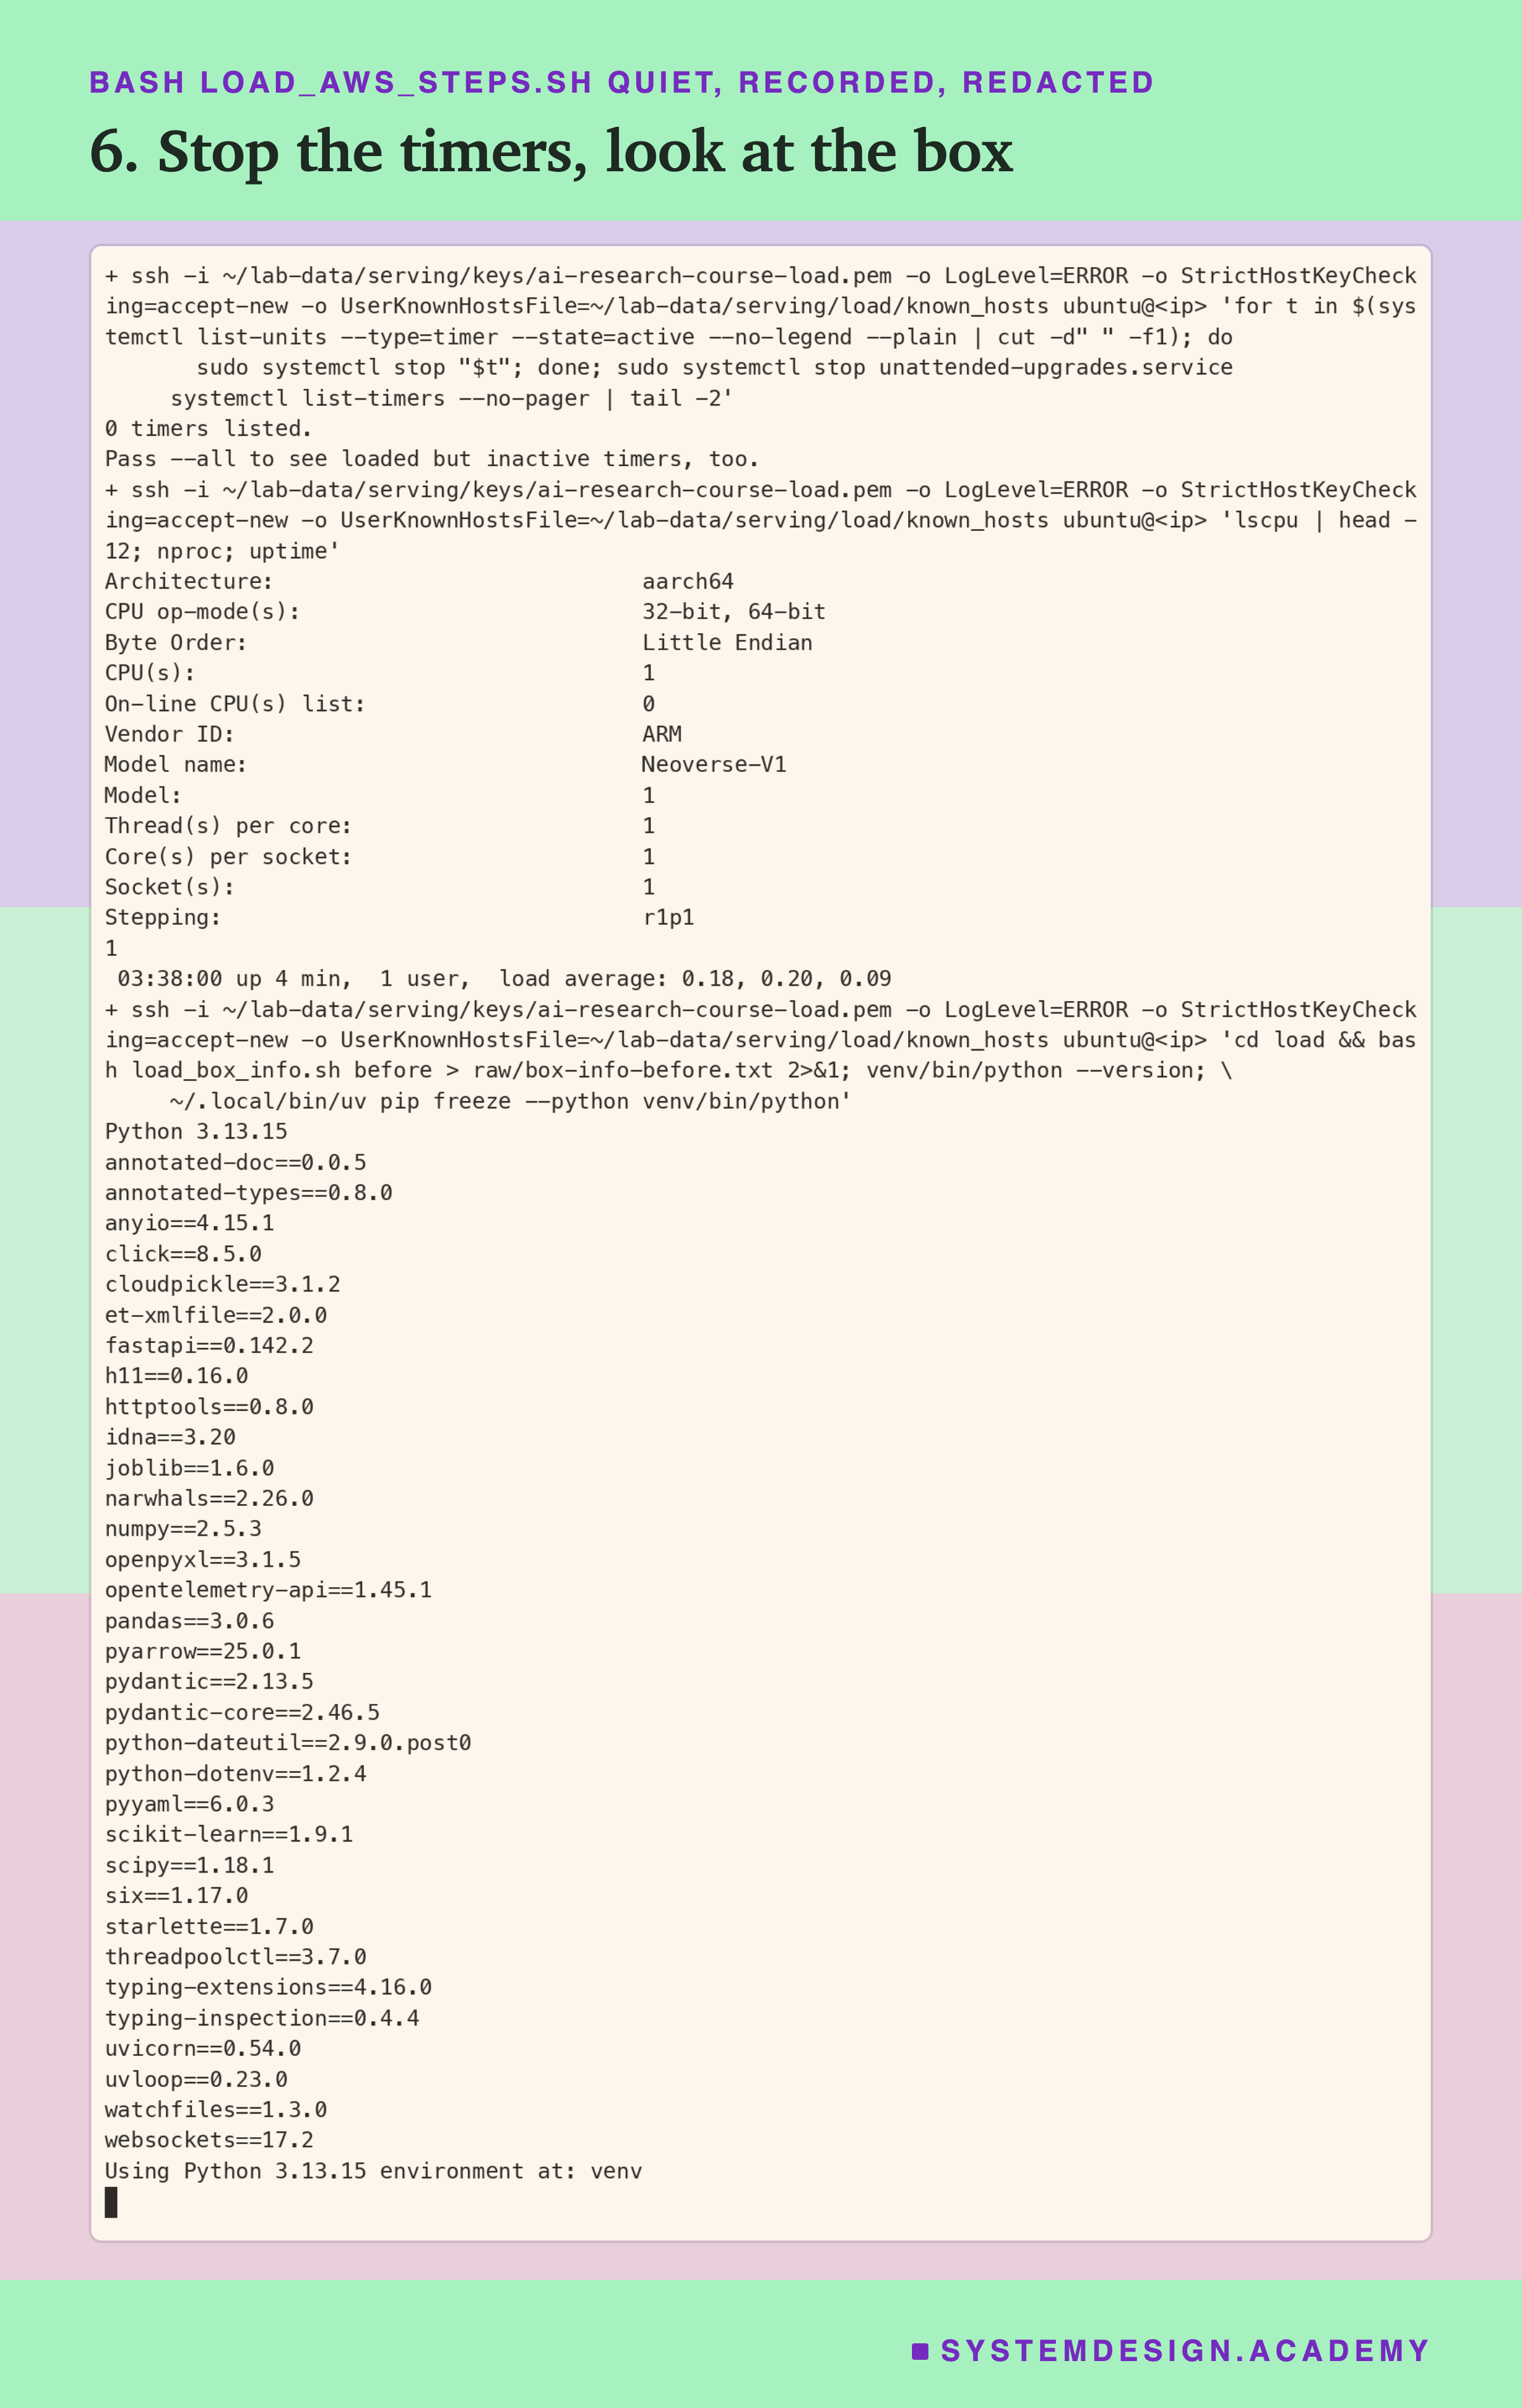
Step 5: Python, locust and the lab files. The box gets the same Python, 3.13.15, and the same pinned library versions as lessons 2 to 6, through uv, a fast installer for Python. locust gets a second, separate environment, so it cannot change the service's libraries. Then scp, a copy command that works through SSH, sends the files over. The last command builds the SQLite feature table, computes the reference score of every request row, and prints the files' sha256 fingerprints.
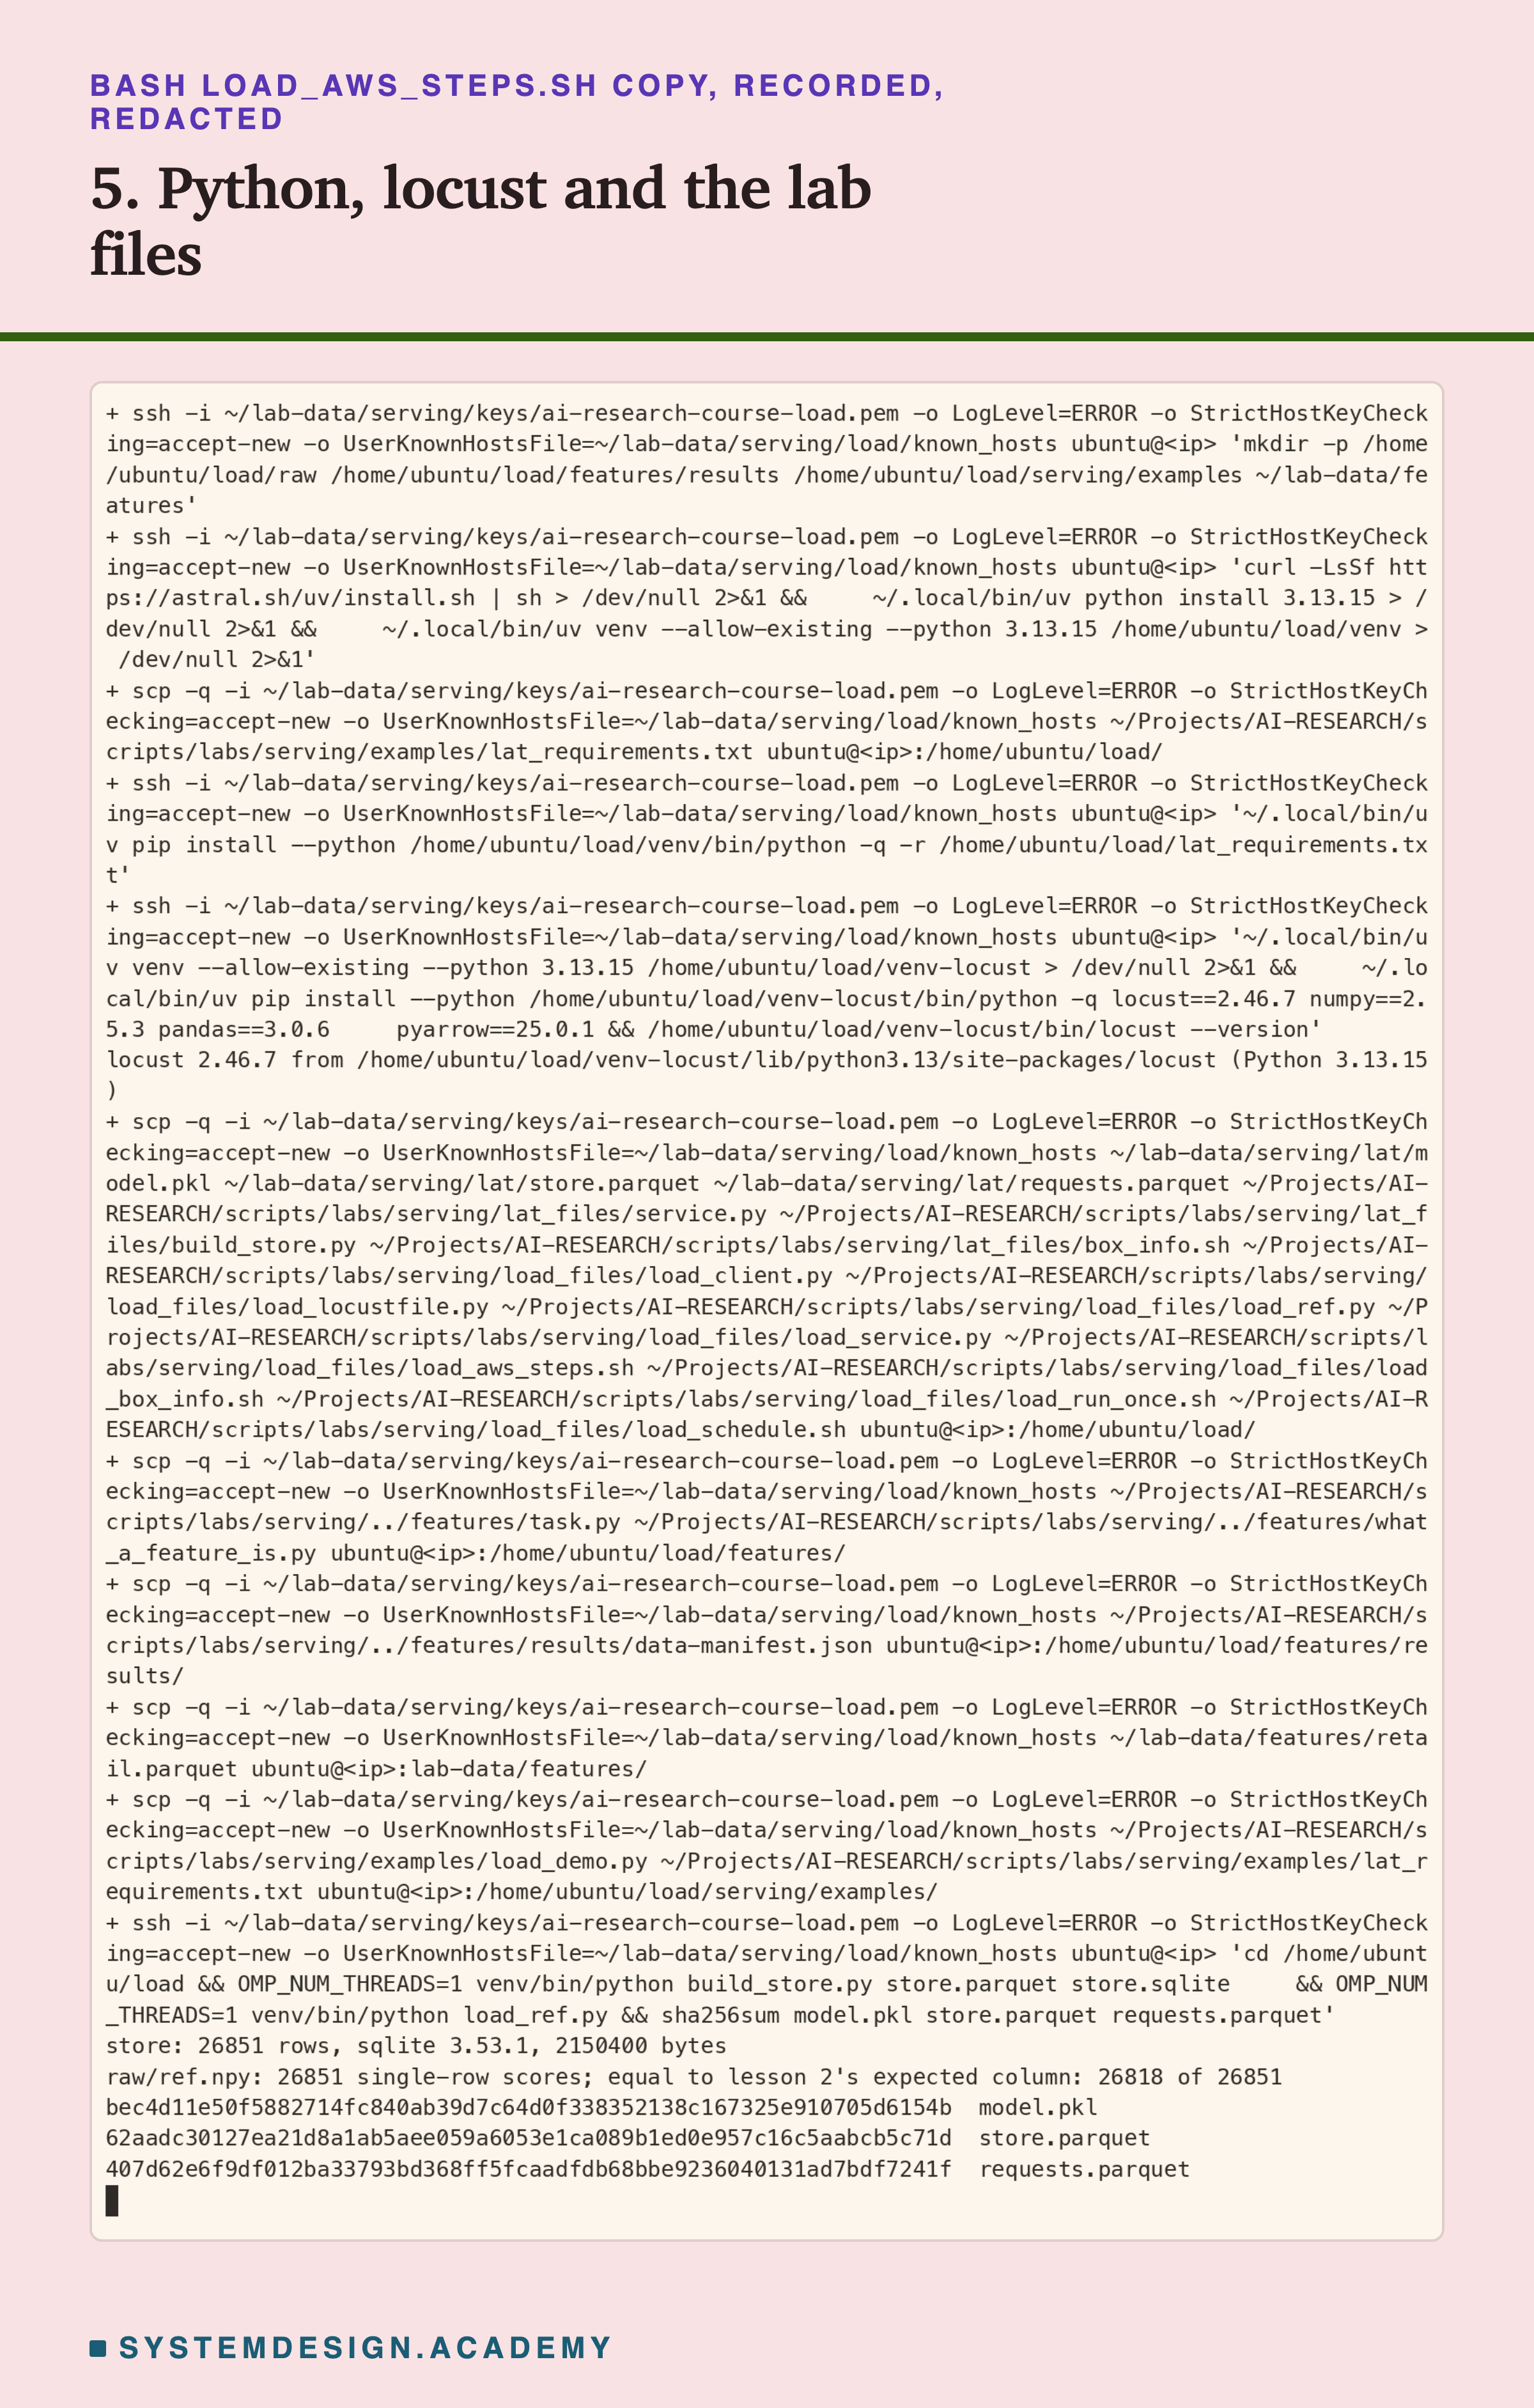
Steps 8 and 11 to 13: Watch, Demo, Bring It Home, Delete
Step 8: watch without touching. While it runs, the schedule writes one progress line to the box's serial console after every run. The serial console is a log that AWS keeps for the box, and you can read it through AWS without logging in.
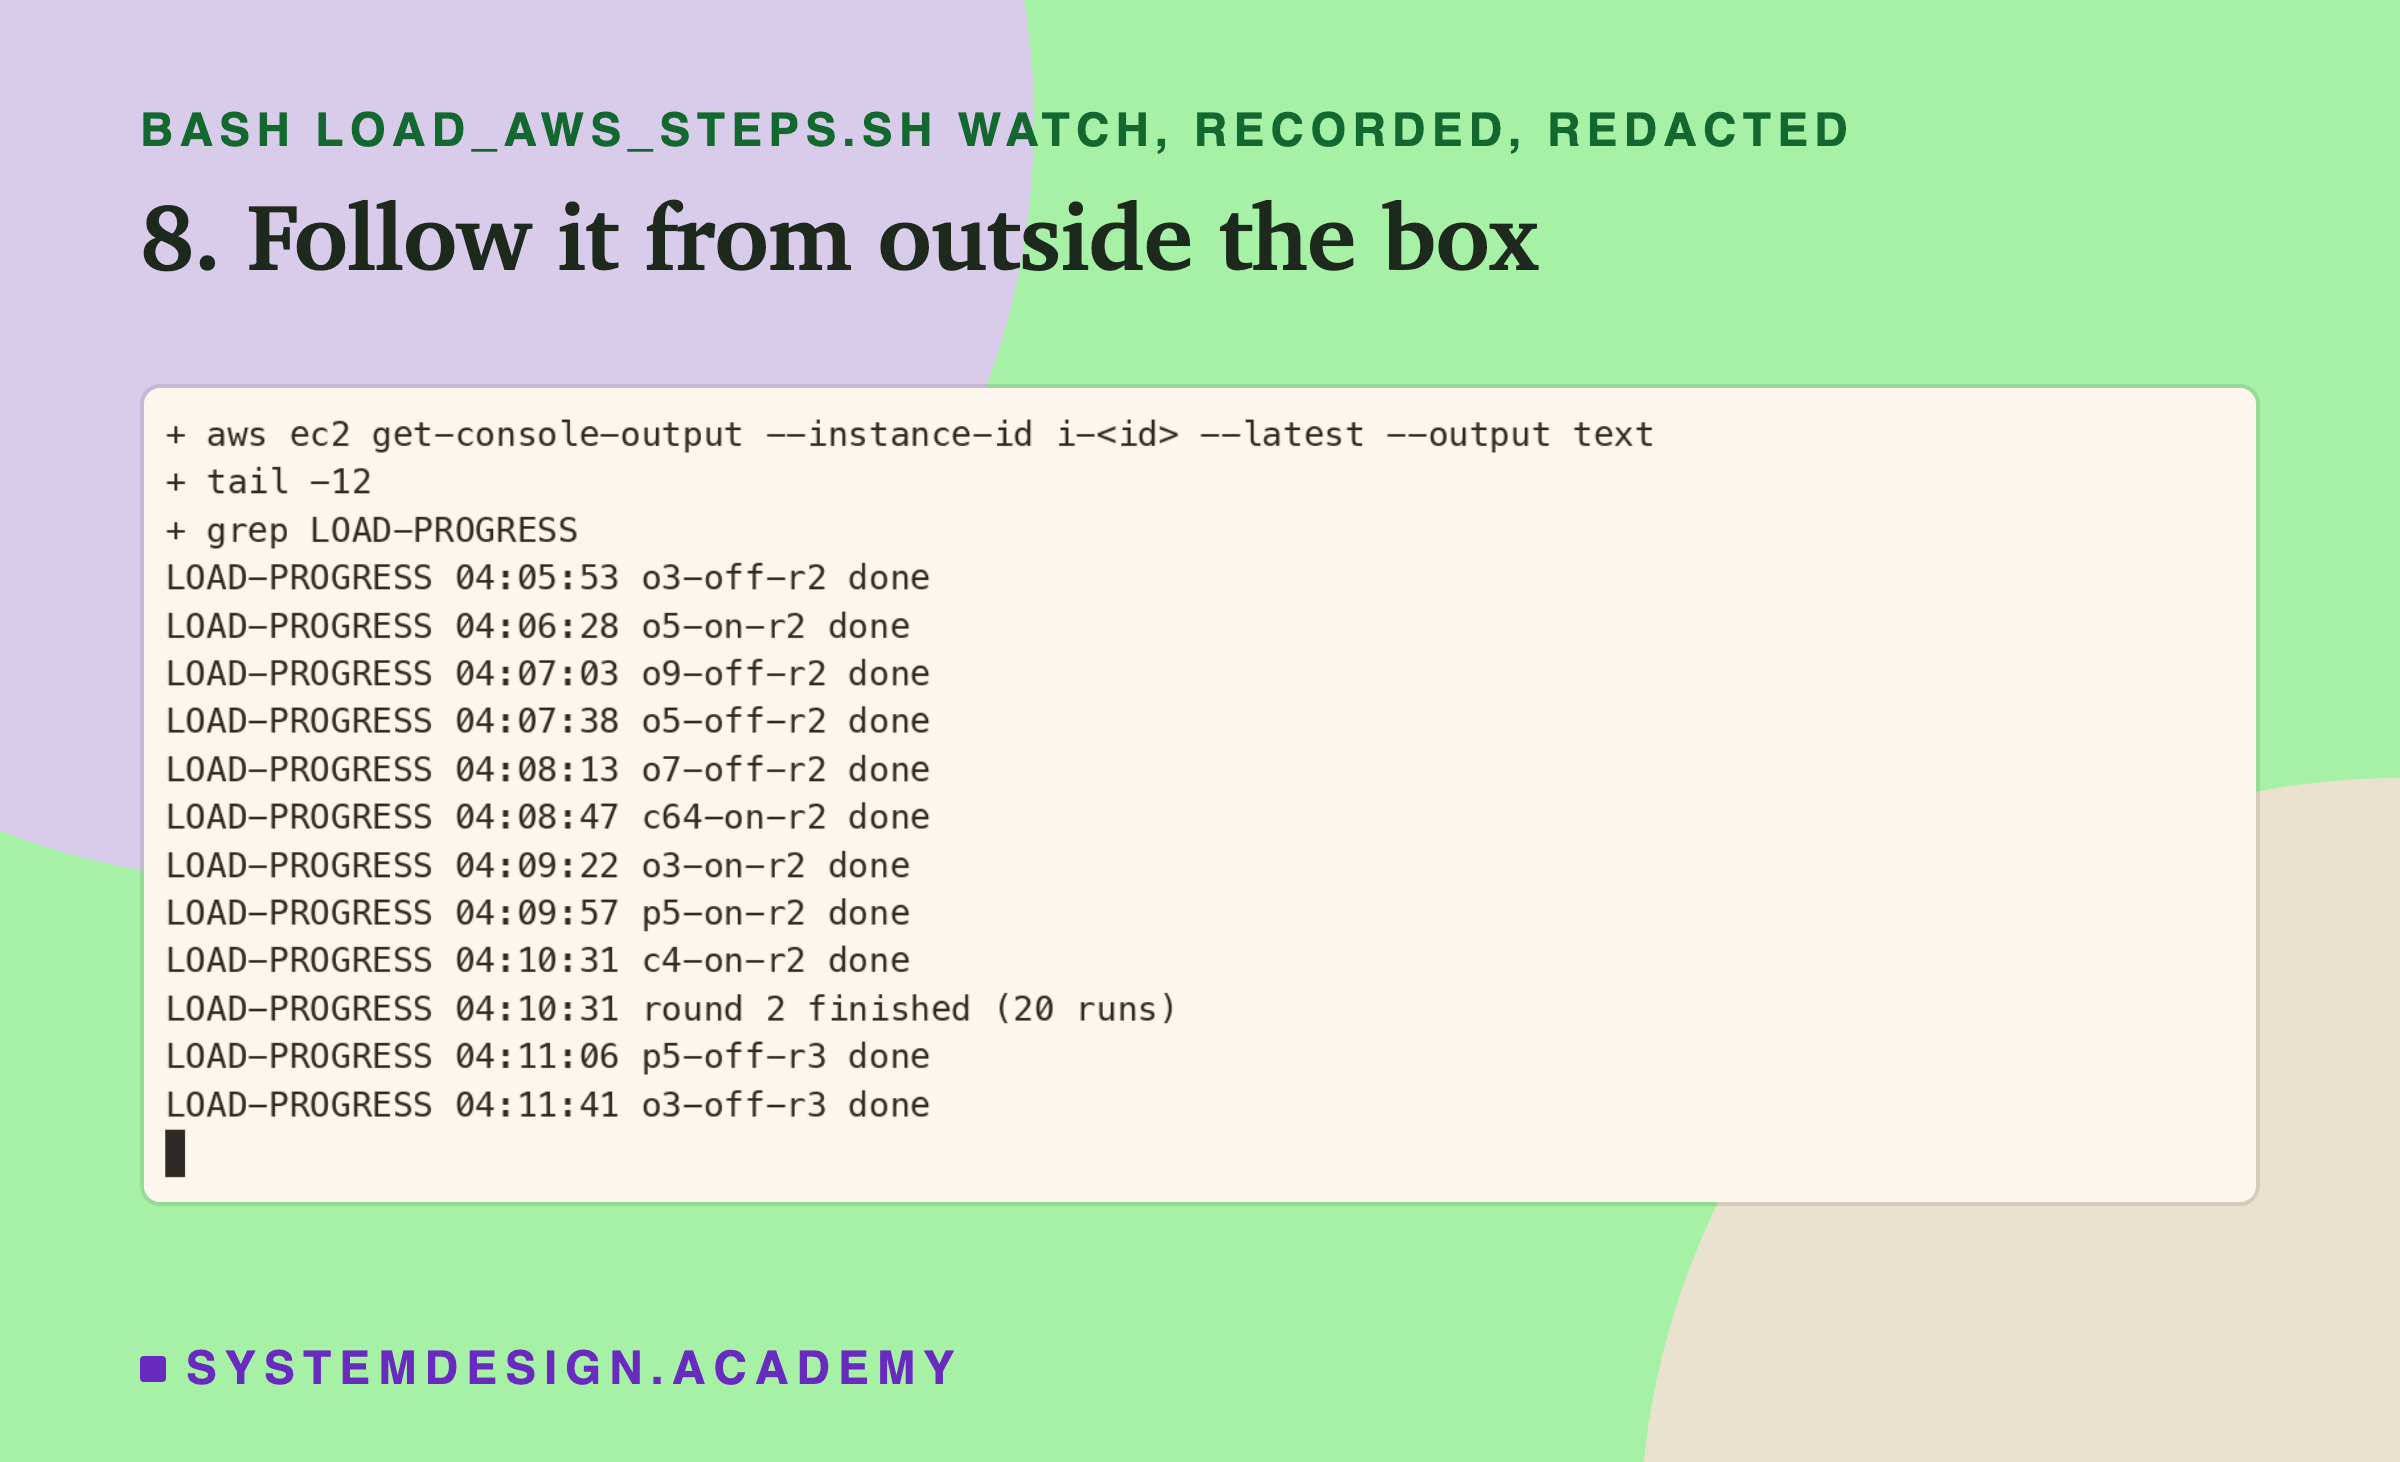
These lines came from AWS's copy of the console while the runs went on, so the box was never touched. This is the command:
aws ec2 get-console-output --instance-id "$ID" --latest --output text | grep LOAD-PROGRESS | tail -12
Step 11: the student demo, on the same box. After the schedule, I ran the demo you will meet later, so you can see what it prints on one core.
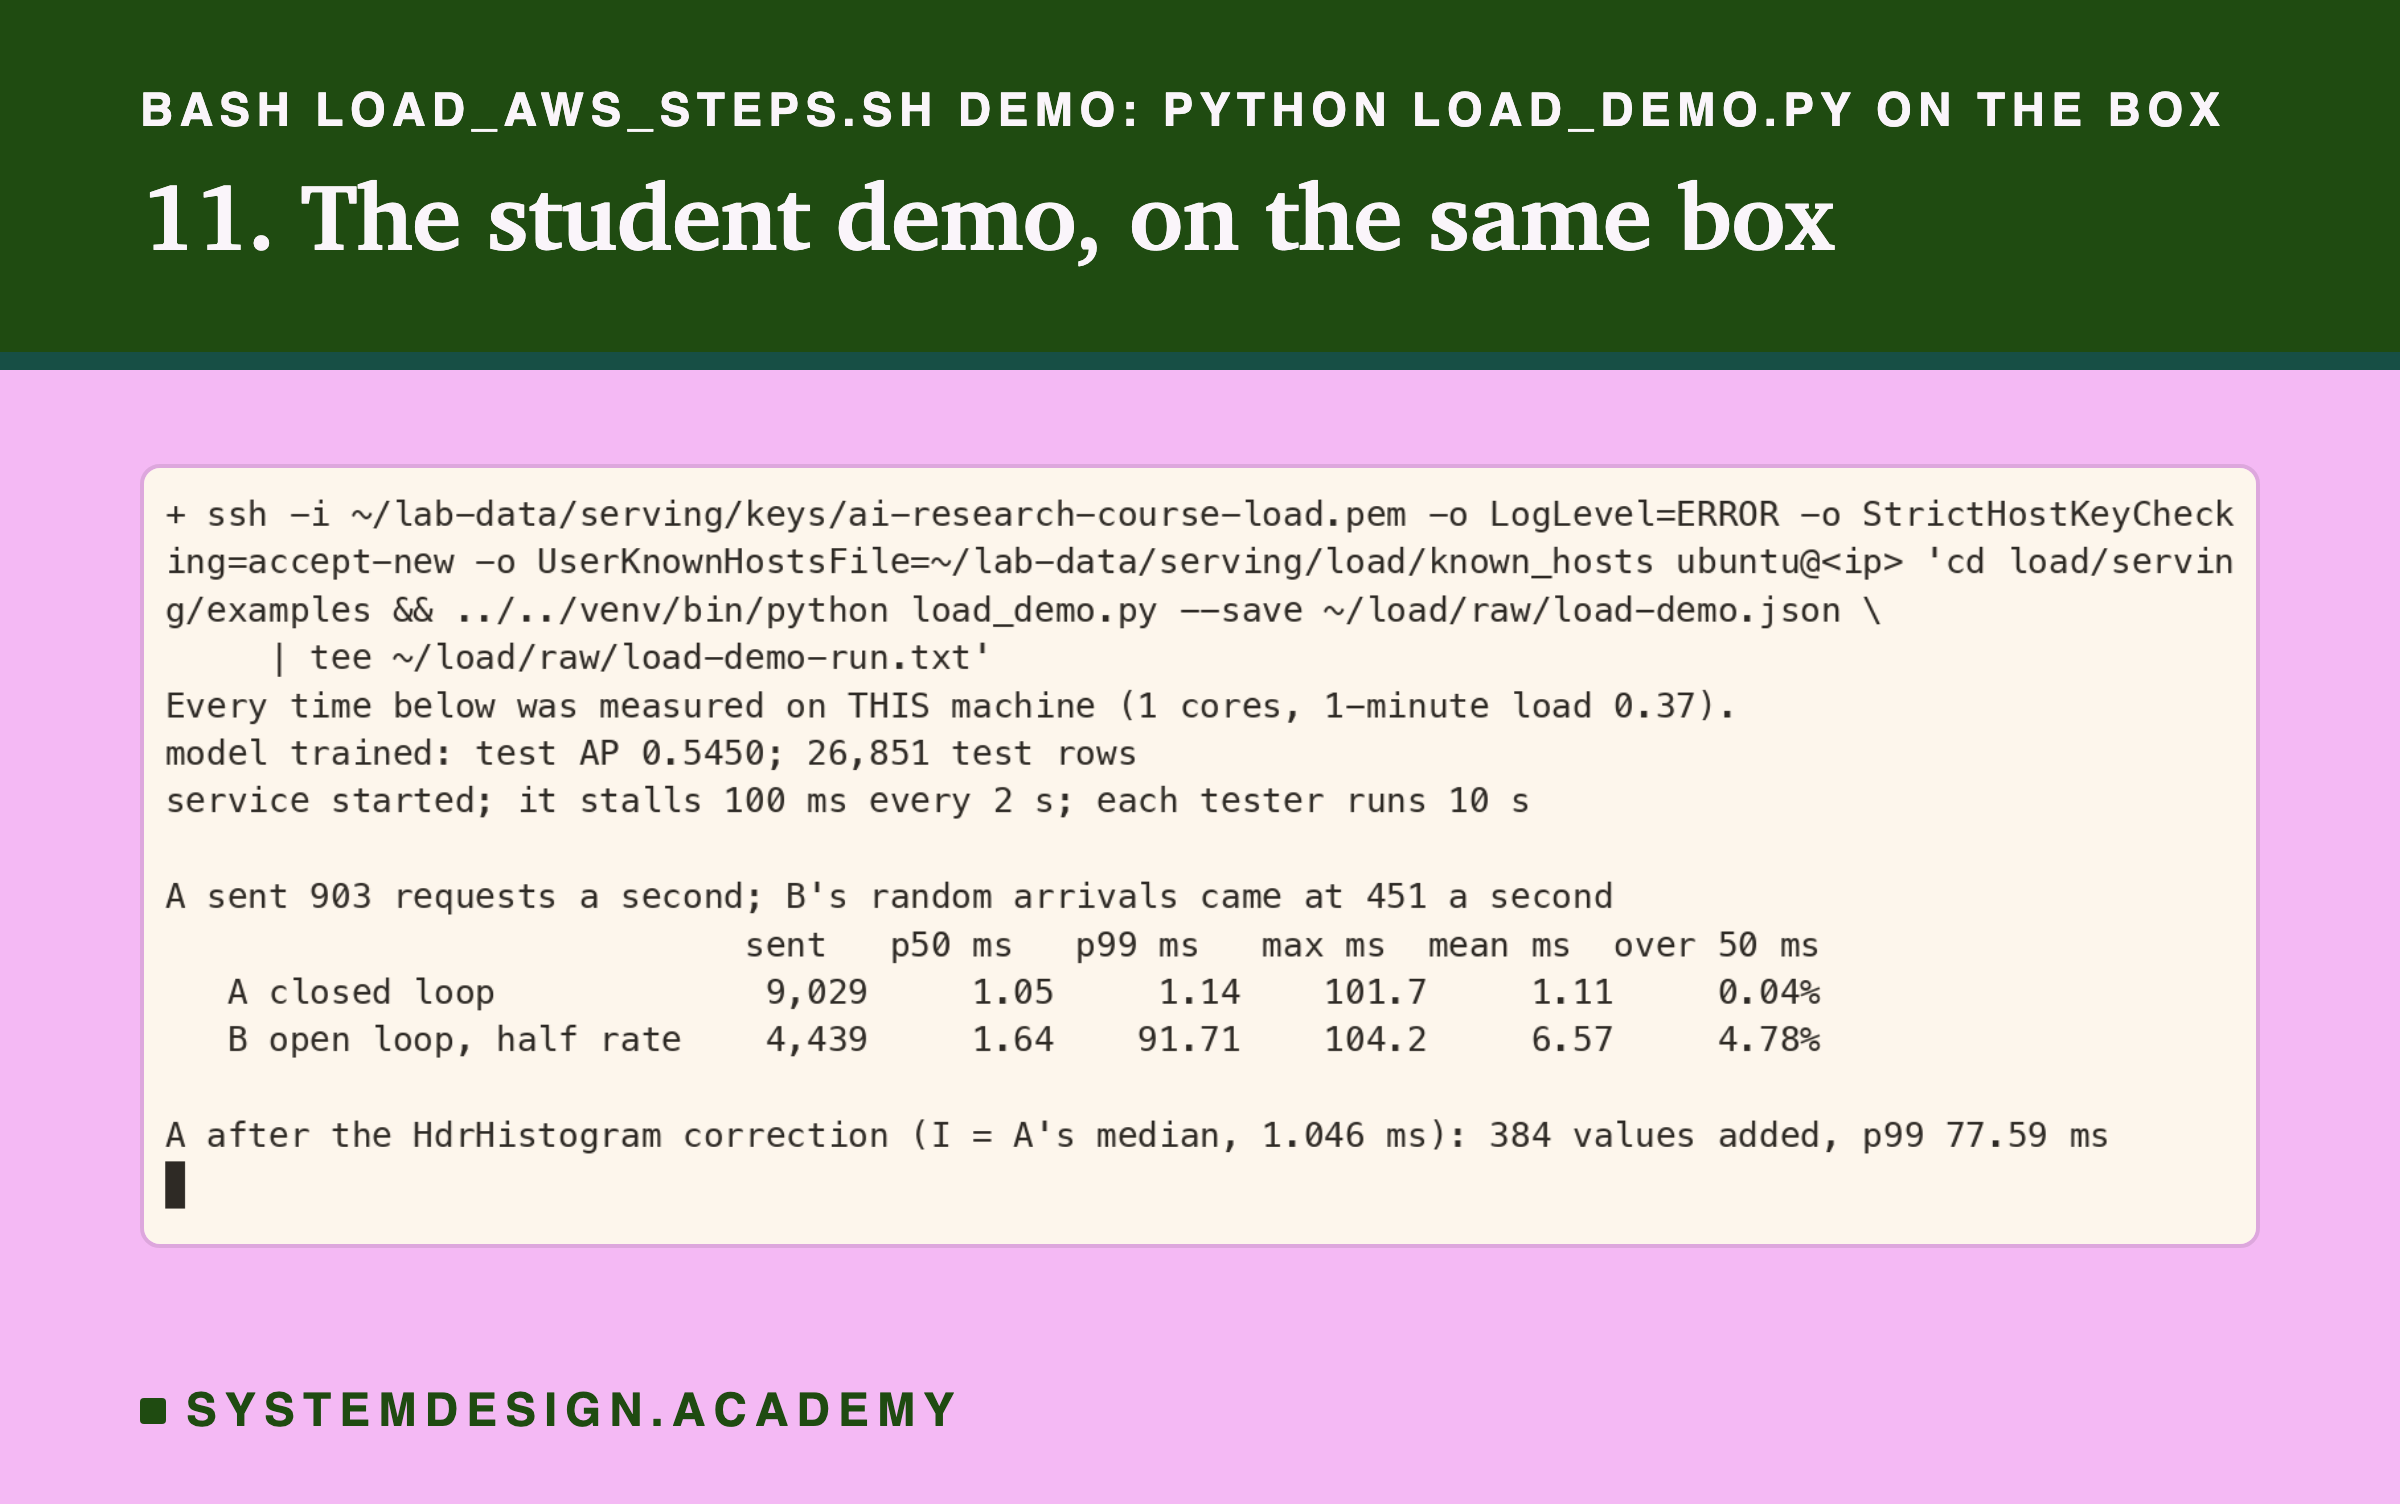
This run happened after the last timed run had finished, so it could not disturb any timing. Its first line says "1 cores", which is how my demo prints the count; it is the box's one core. This is the command:
  ssh -i ~/lab-data/serving/keys/ai-research-course-load.pem "${SSHO[@]}" ubuntu@"$IP" \
    'cd load/serving/examples && ../../venv/bin/python load_demo.py --save ~/load/raw/load-demo.json \
     | tee ~/load/raw/load-demo-run.txt'
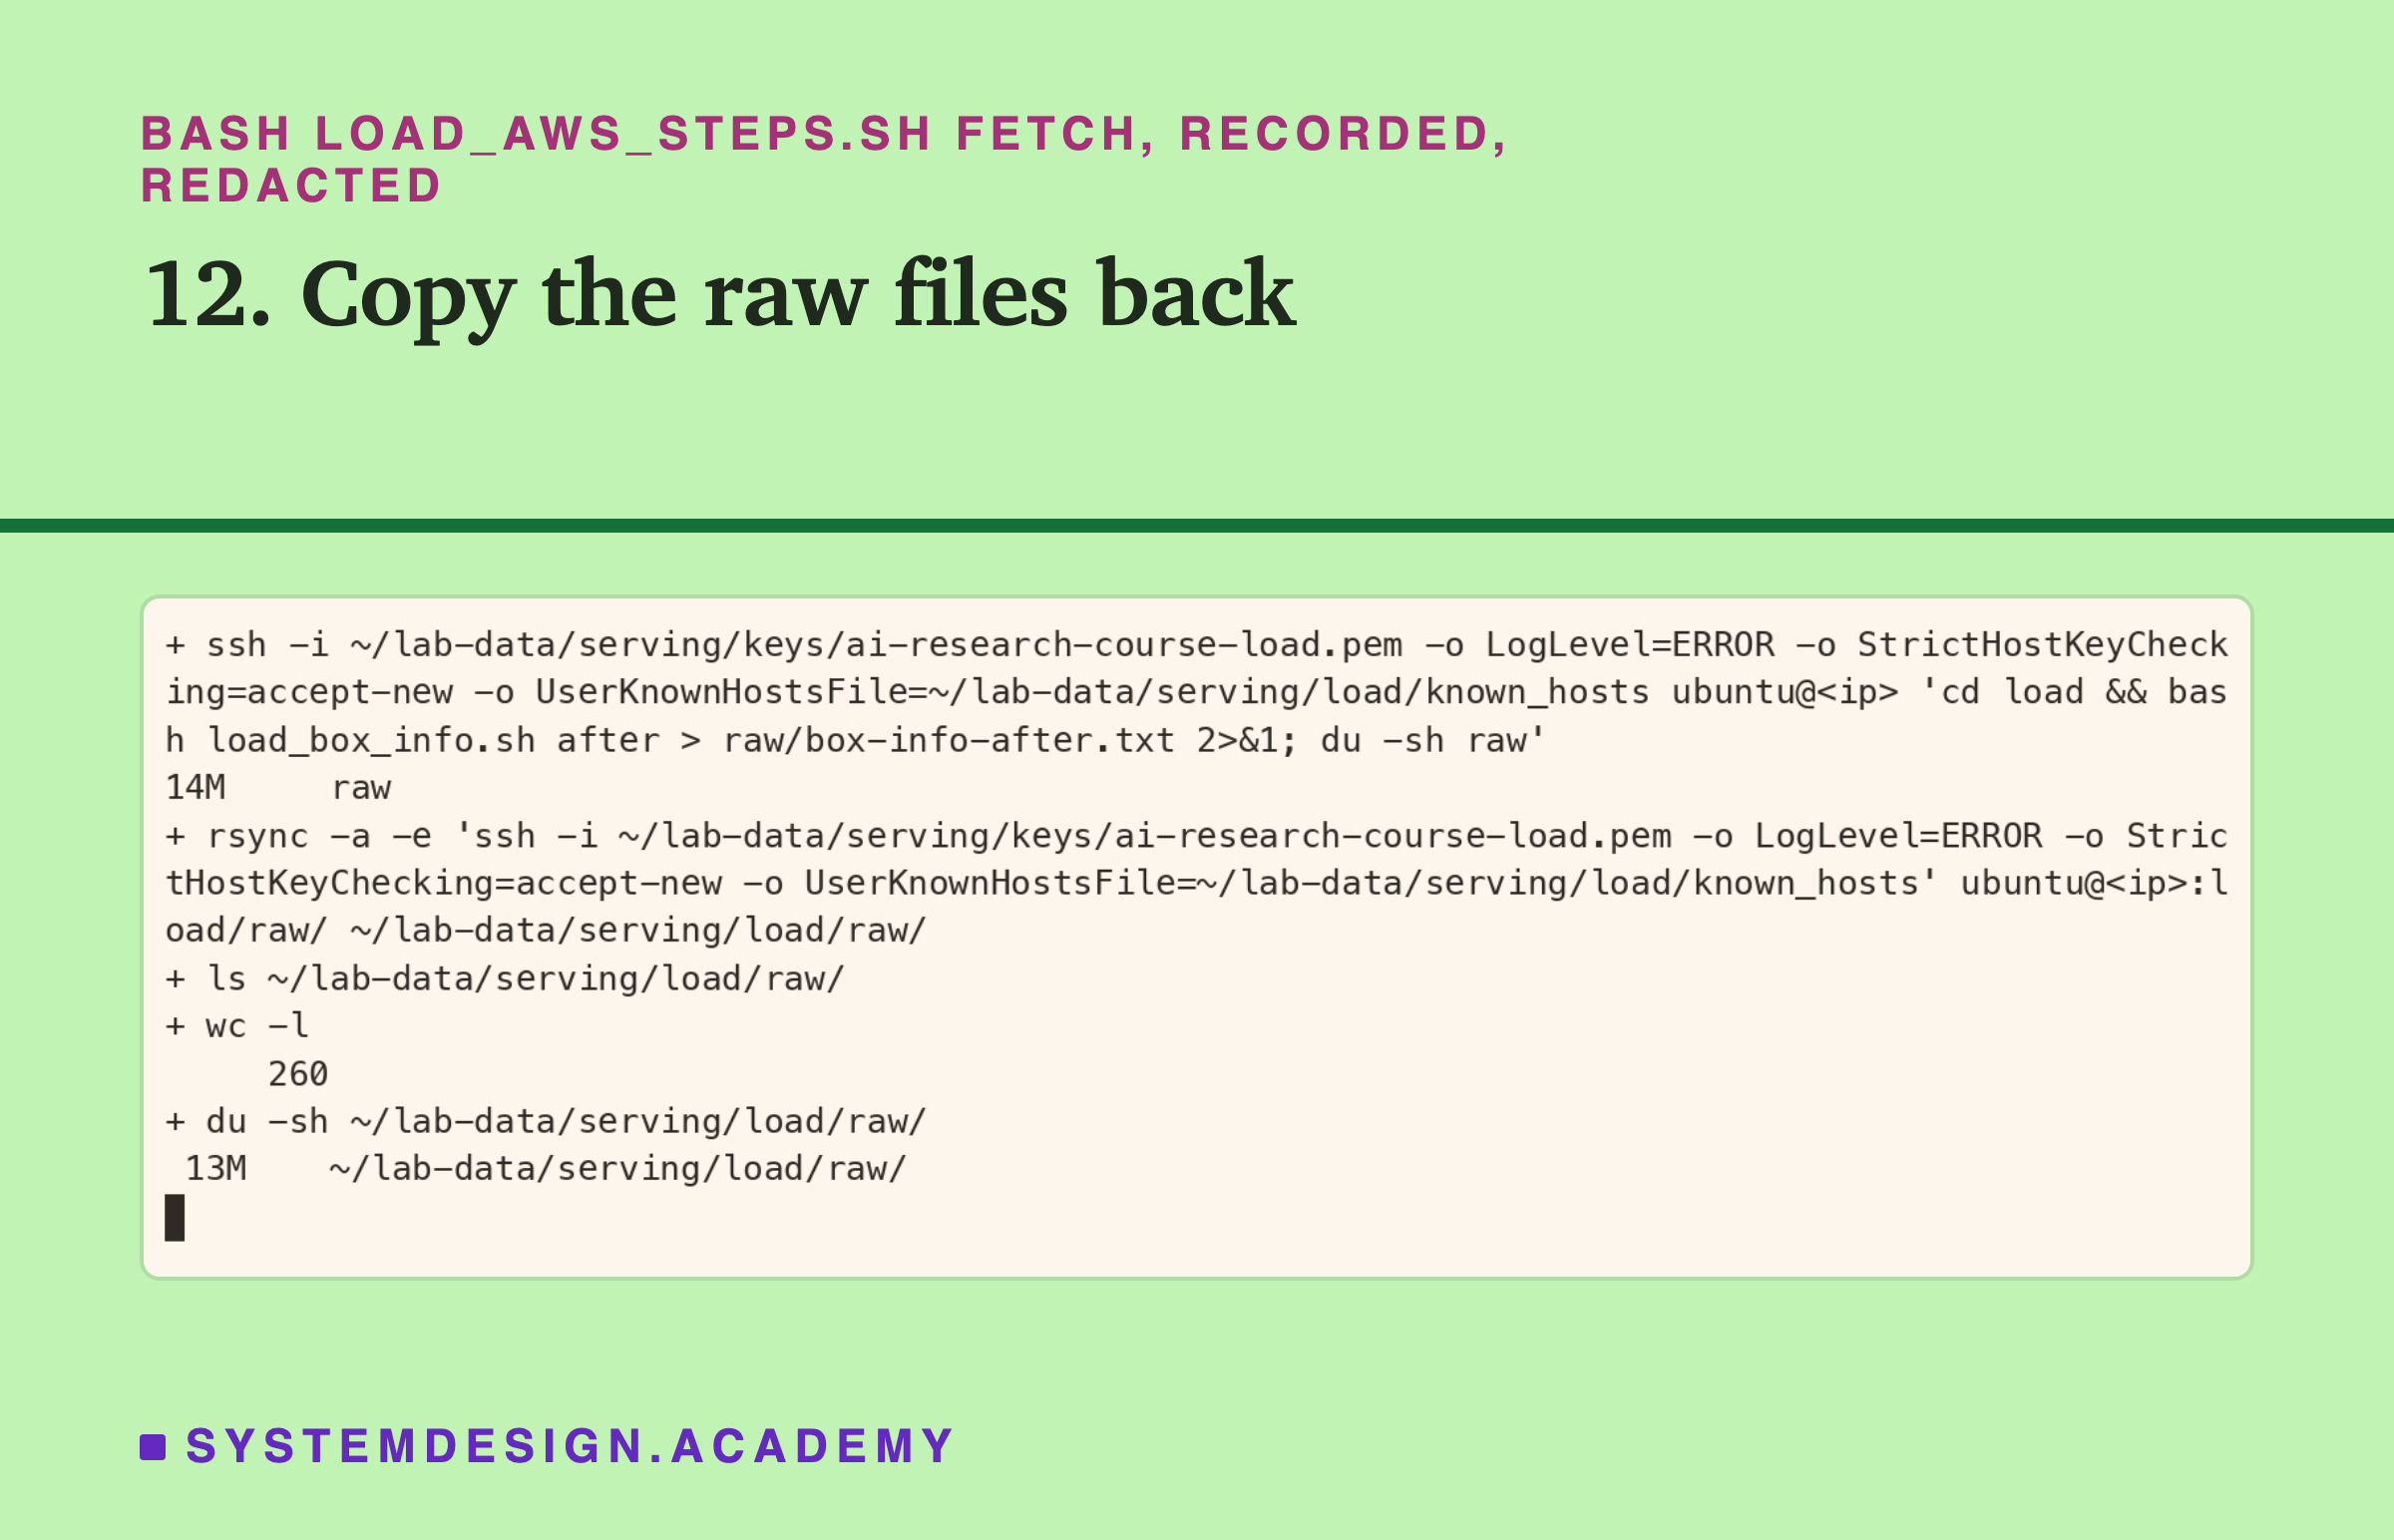
Step 12: bring the results home first. Lesson 3 lost a whole box of results because it was deleted before anyone copied them. So the moment the runs finish, the raw files come back, before anything else.
The Lab's Report, Running
This is a real recording of the report script, load_report.py. It ran on my laptop, but it times nothing. It reads the raw files the box measured and does all the arithmetic again with its own code.
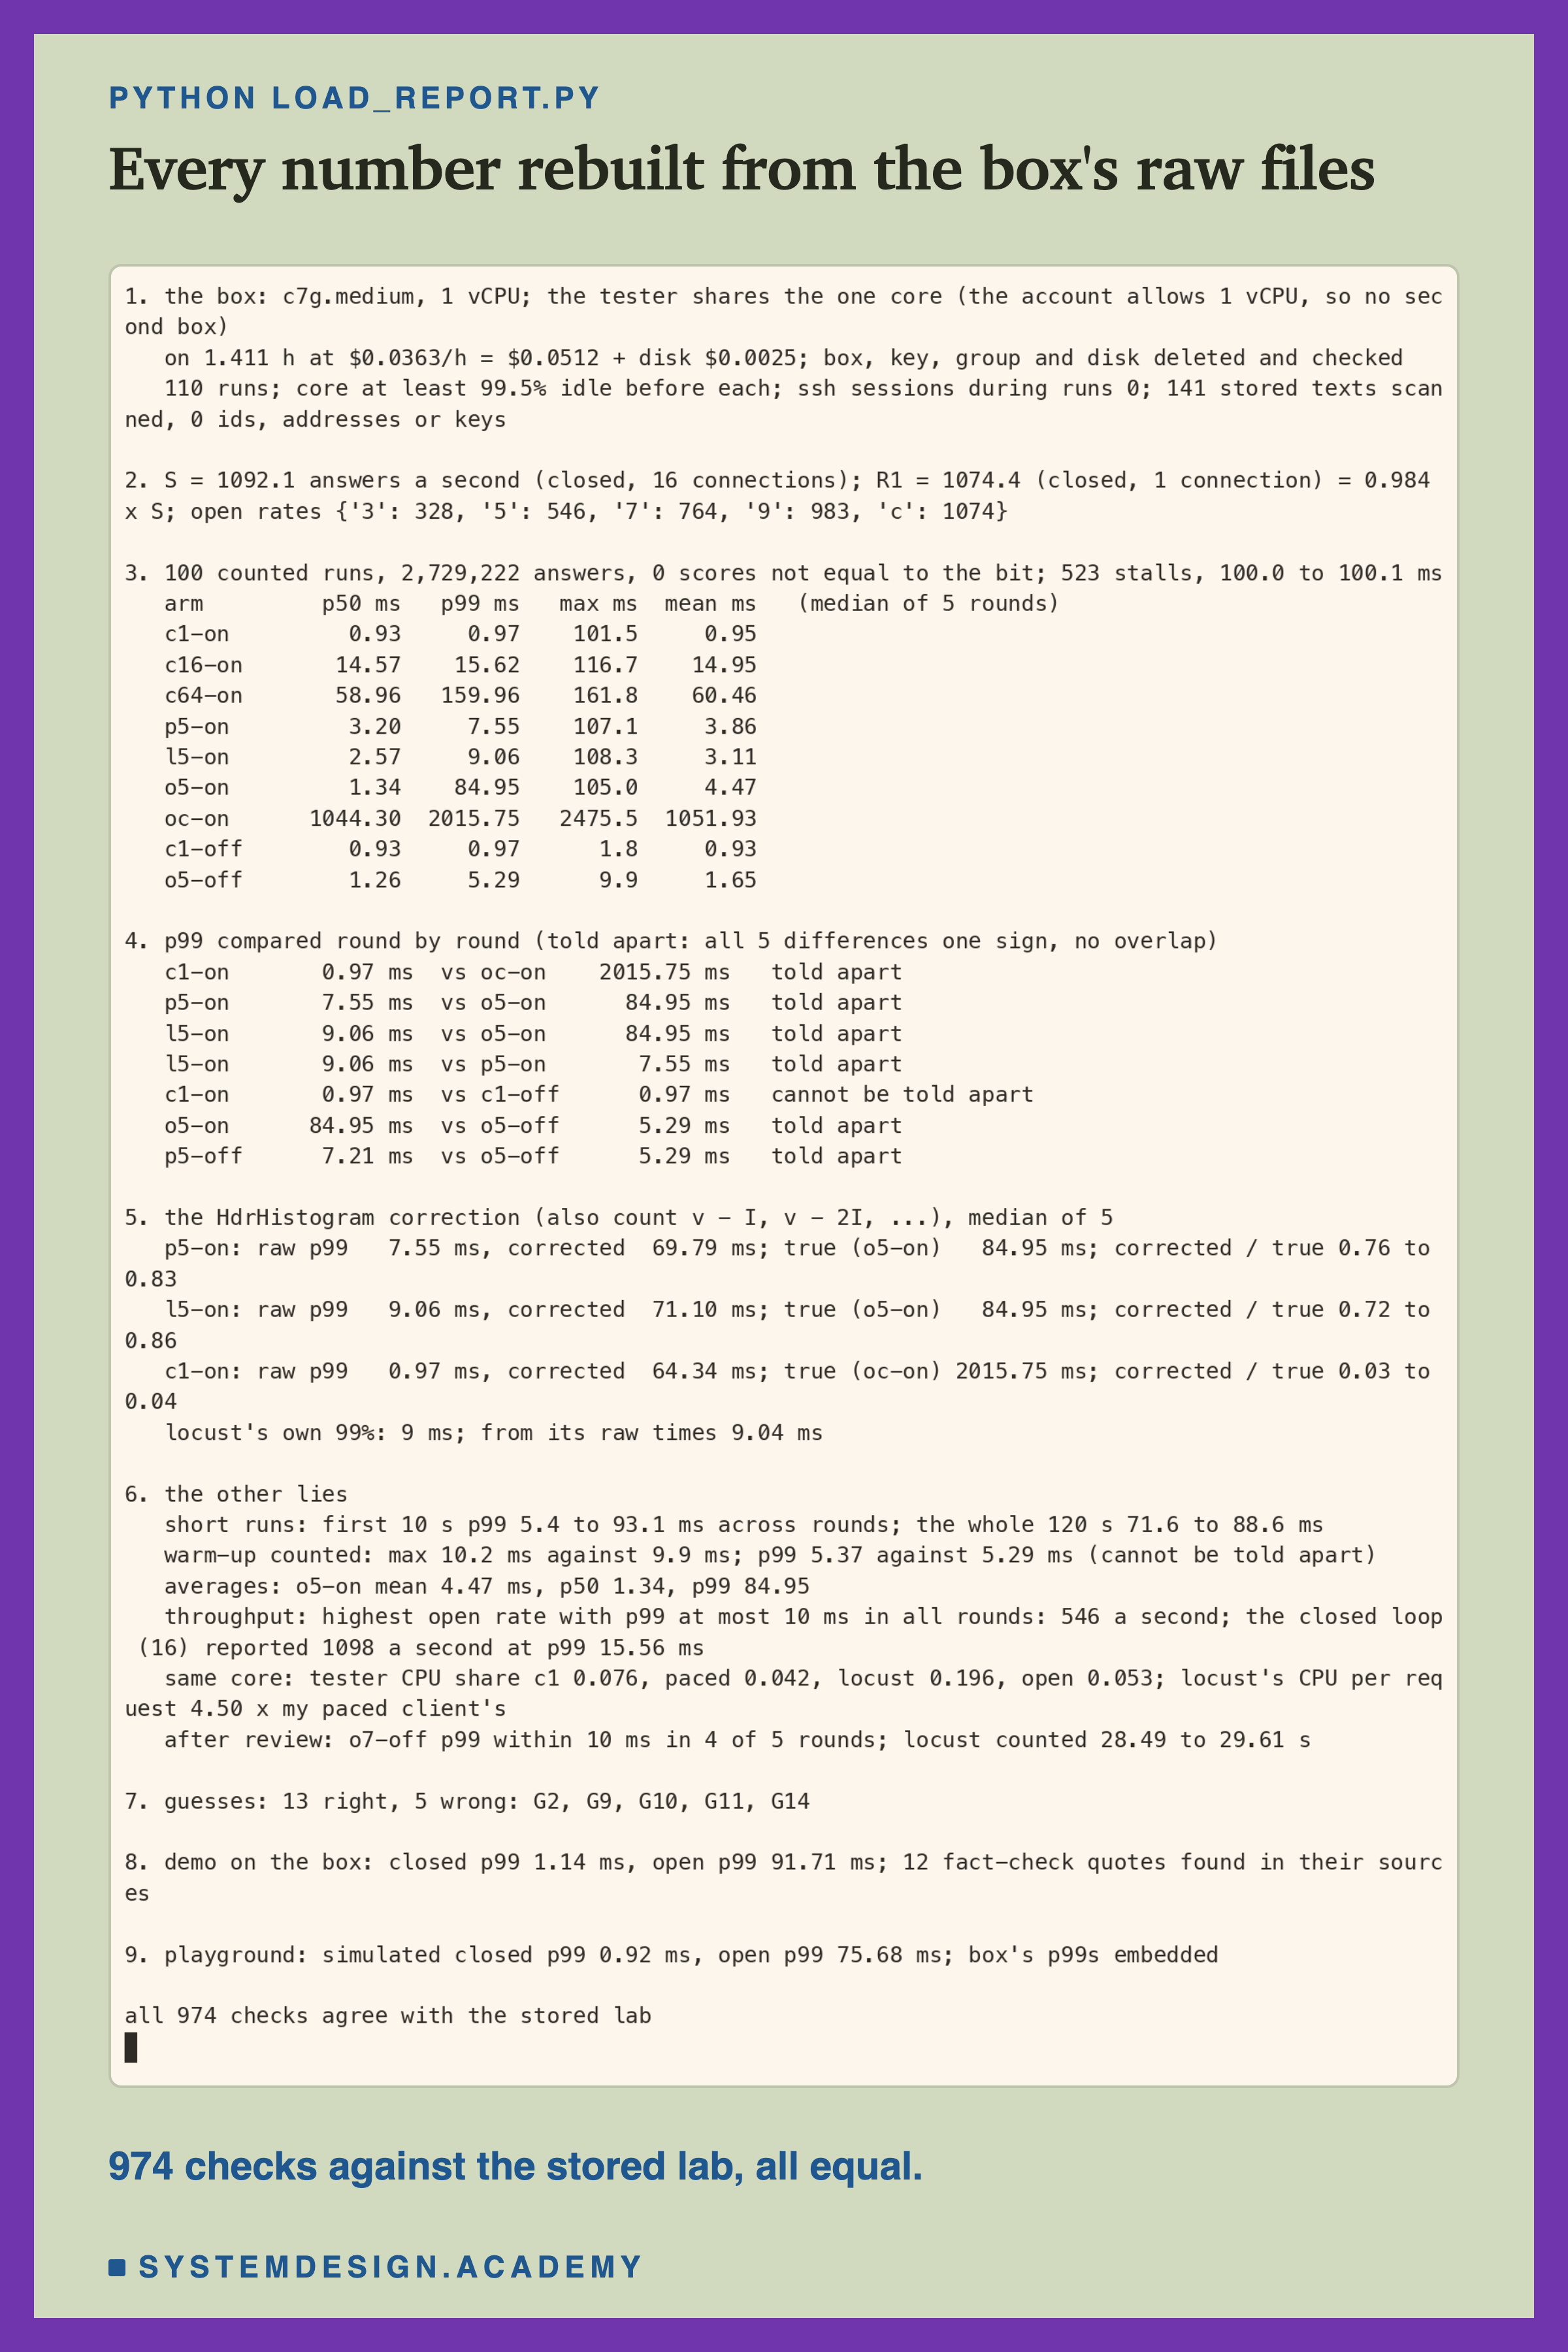
The report does not import the lab. It reads the small copy of the raw files kept in the repo. It computes its own percentiles, its own correction, its own paired differences and its own verdicts. Then it compares every one with the lab's results file. If any number disagreed, it would stop with an error. I checked that too. I changed one p99 in a copy of the results file by 1 microsecond, and the report printed "1 MISMATCHES" and stopped with an error.
Section 1 also scans every stored file, including the text inside the compressed .npz files and the terminal recordings. It looks for my account number, IP addresses, host names, AWS ids, key fingerprints and my home folder. The first scan found 3 hits. All three were the version string of a maths library, "0.3.34.106.0": five numbers in a row, like an address with one extra part. I made the scan match exactly four numbers, and it then found 0.
During a Stall, the Closed Loop Stops Sending
Why did the closed loop's p99 not show the stalls? The tester wrote down when it sent every request, and the service wrote down when every stall began. So I could line up every stall and count the requests sent around it.
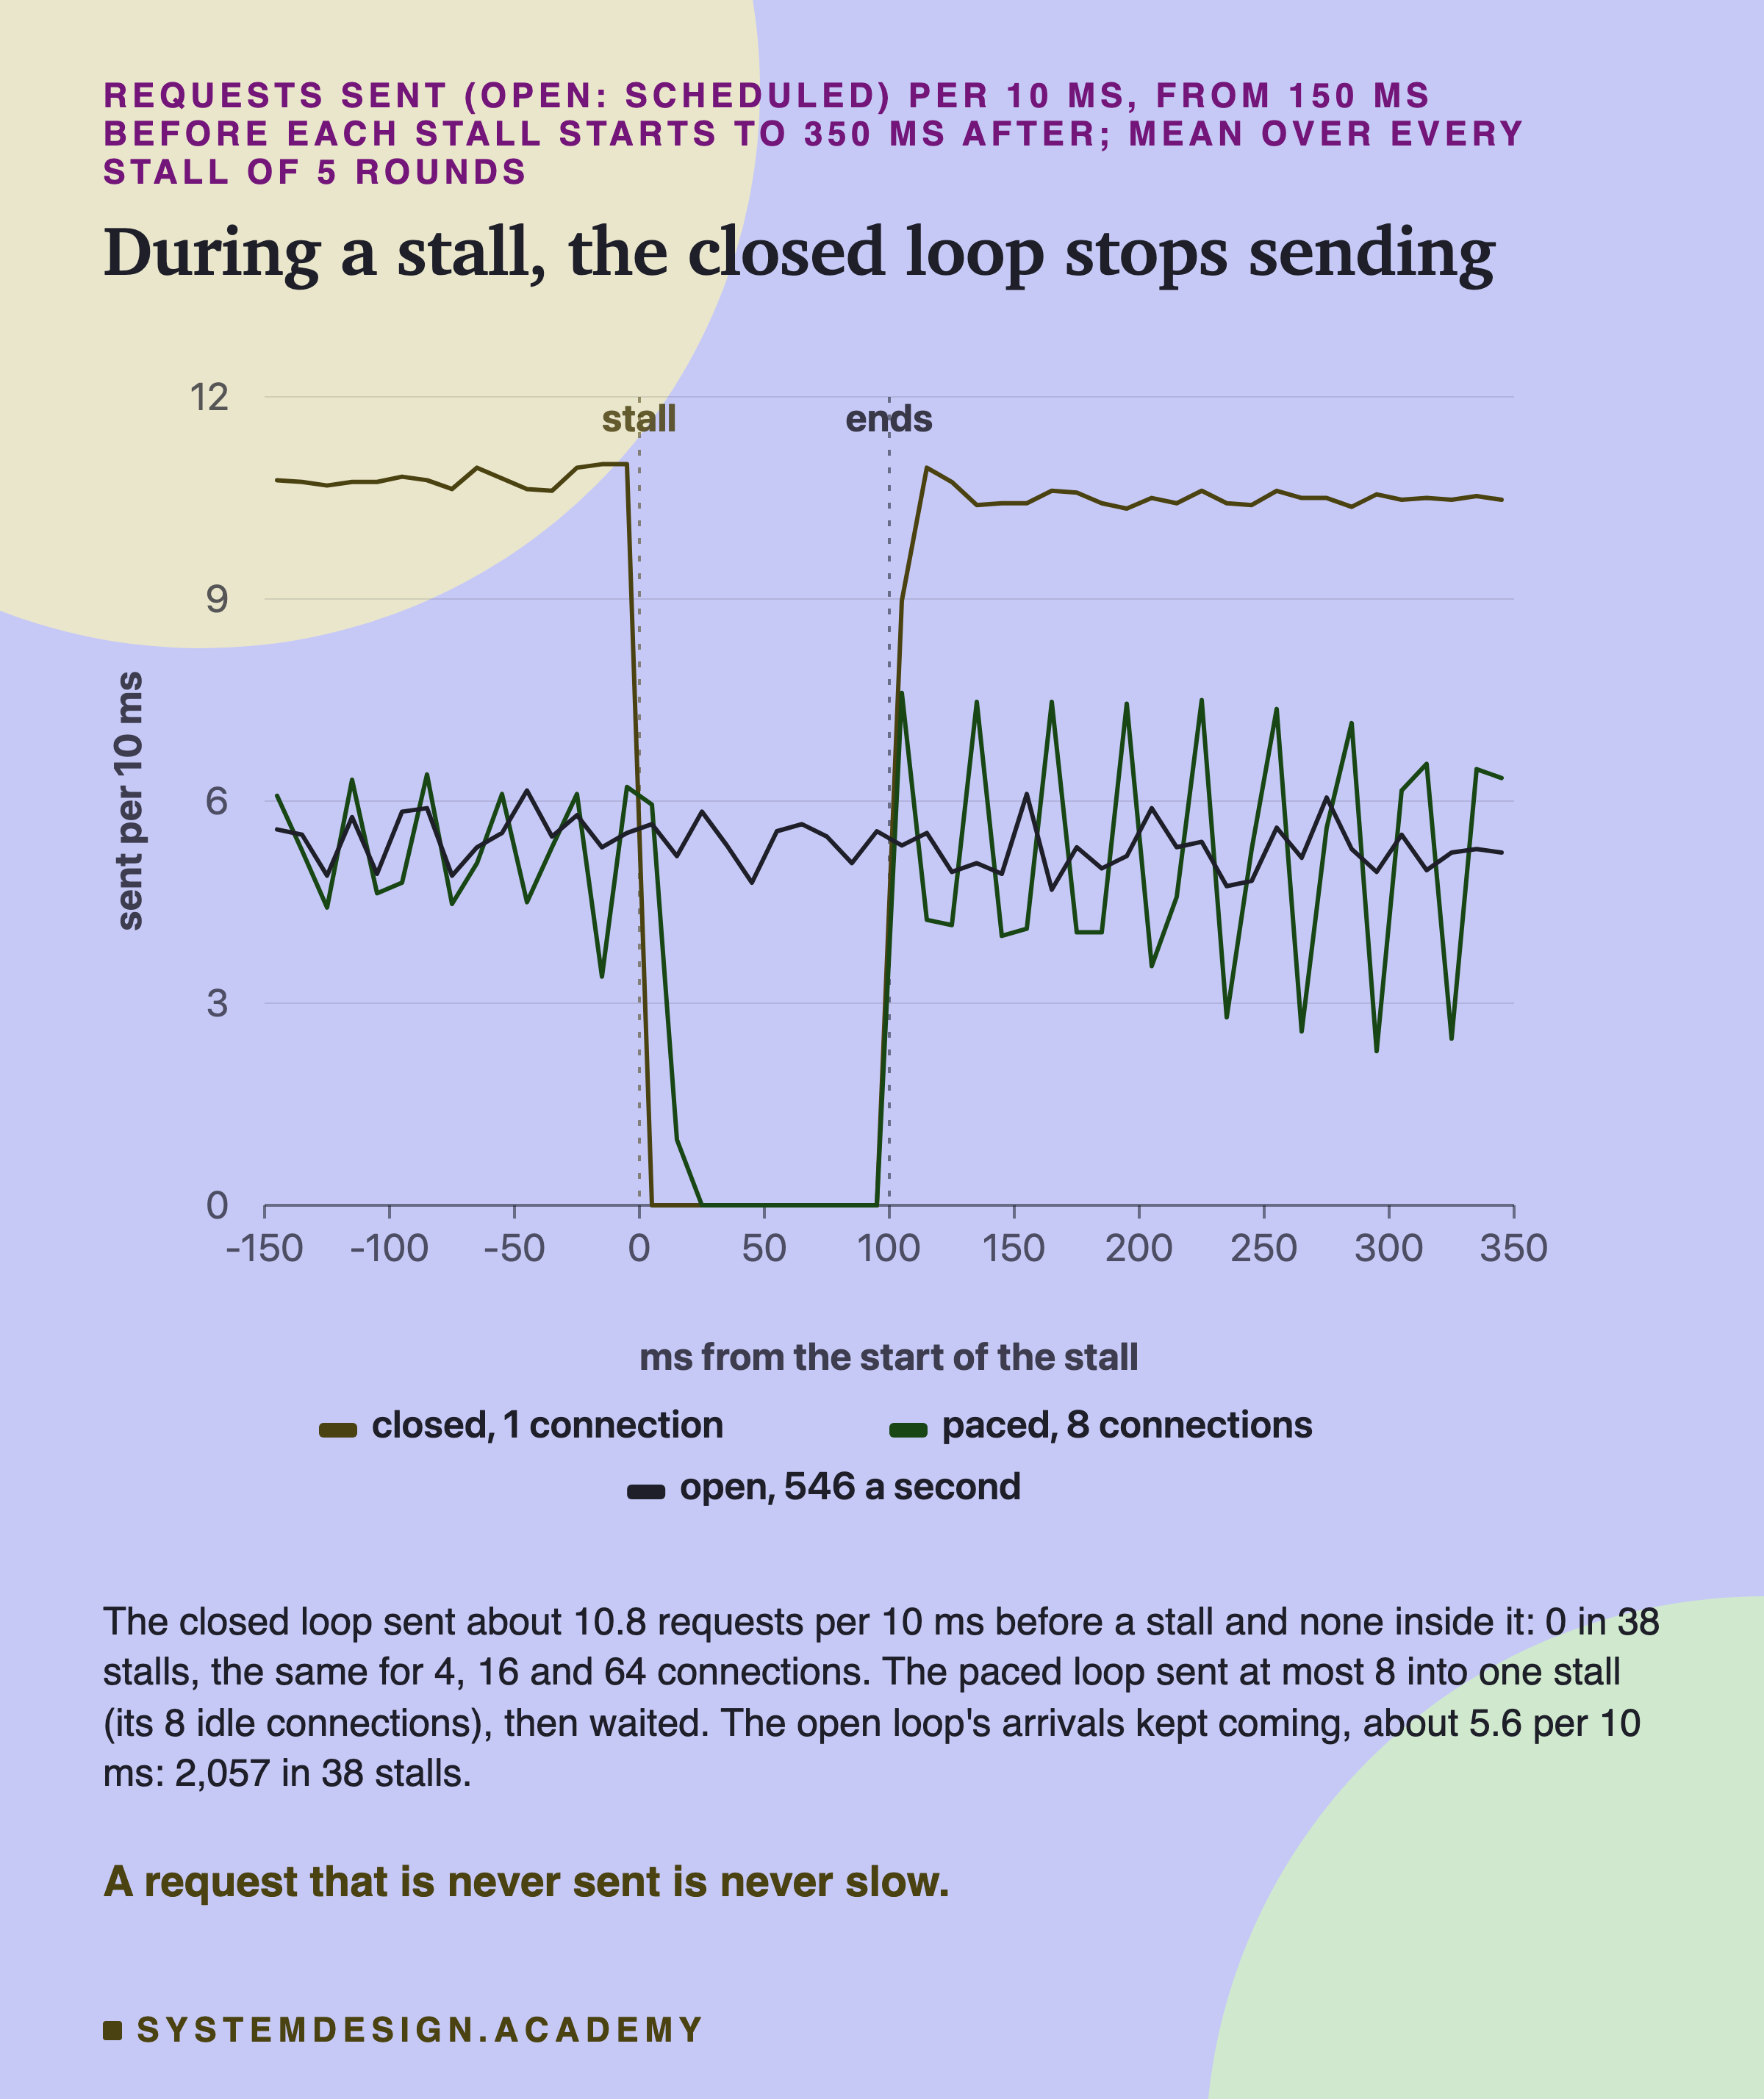
The closed loop's line falls to zero for exactly the length of the stall. Its one connection had a request in flight when the stall began, and it could not send another until the answer came. This is not a finding: a closed loop works this way by design. It is a check that the stall happened and the tester behaved as designed.
The paced loop sent a few requests just after the stall began, then stopped. Its 8 connections were each waiting for their next time slot. The ones whose slot came during the stall sent their request, and then waited like the closed loop. It sent at most 8 requests into any one stall.
The open loop's line did not move. Its arrivals came on their own clock, about 5 to 6 per 10 ms, and it sent them all, 2,057 requests into 38 stalls. Each was timed from its scheduled moment, so each one's wait behind the stall was counted. That is the whole difference between the testers, in one picture.
Who Waits Behind the Stall
Here is the same idea as a drawing, for one stall.
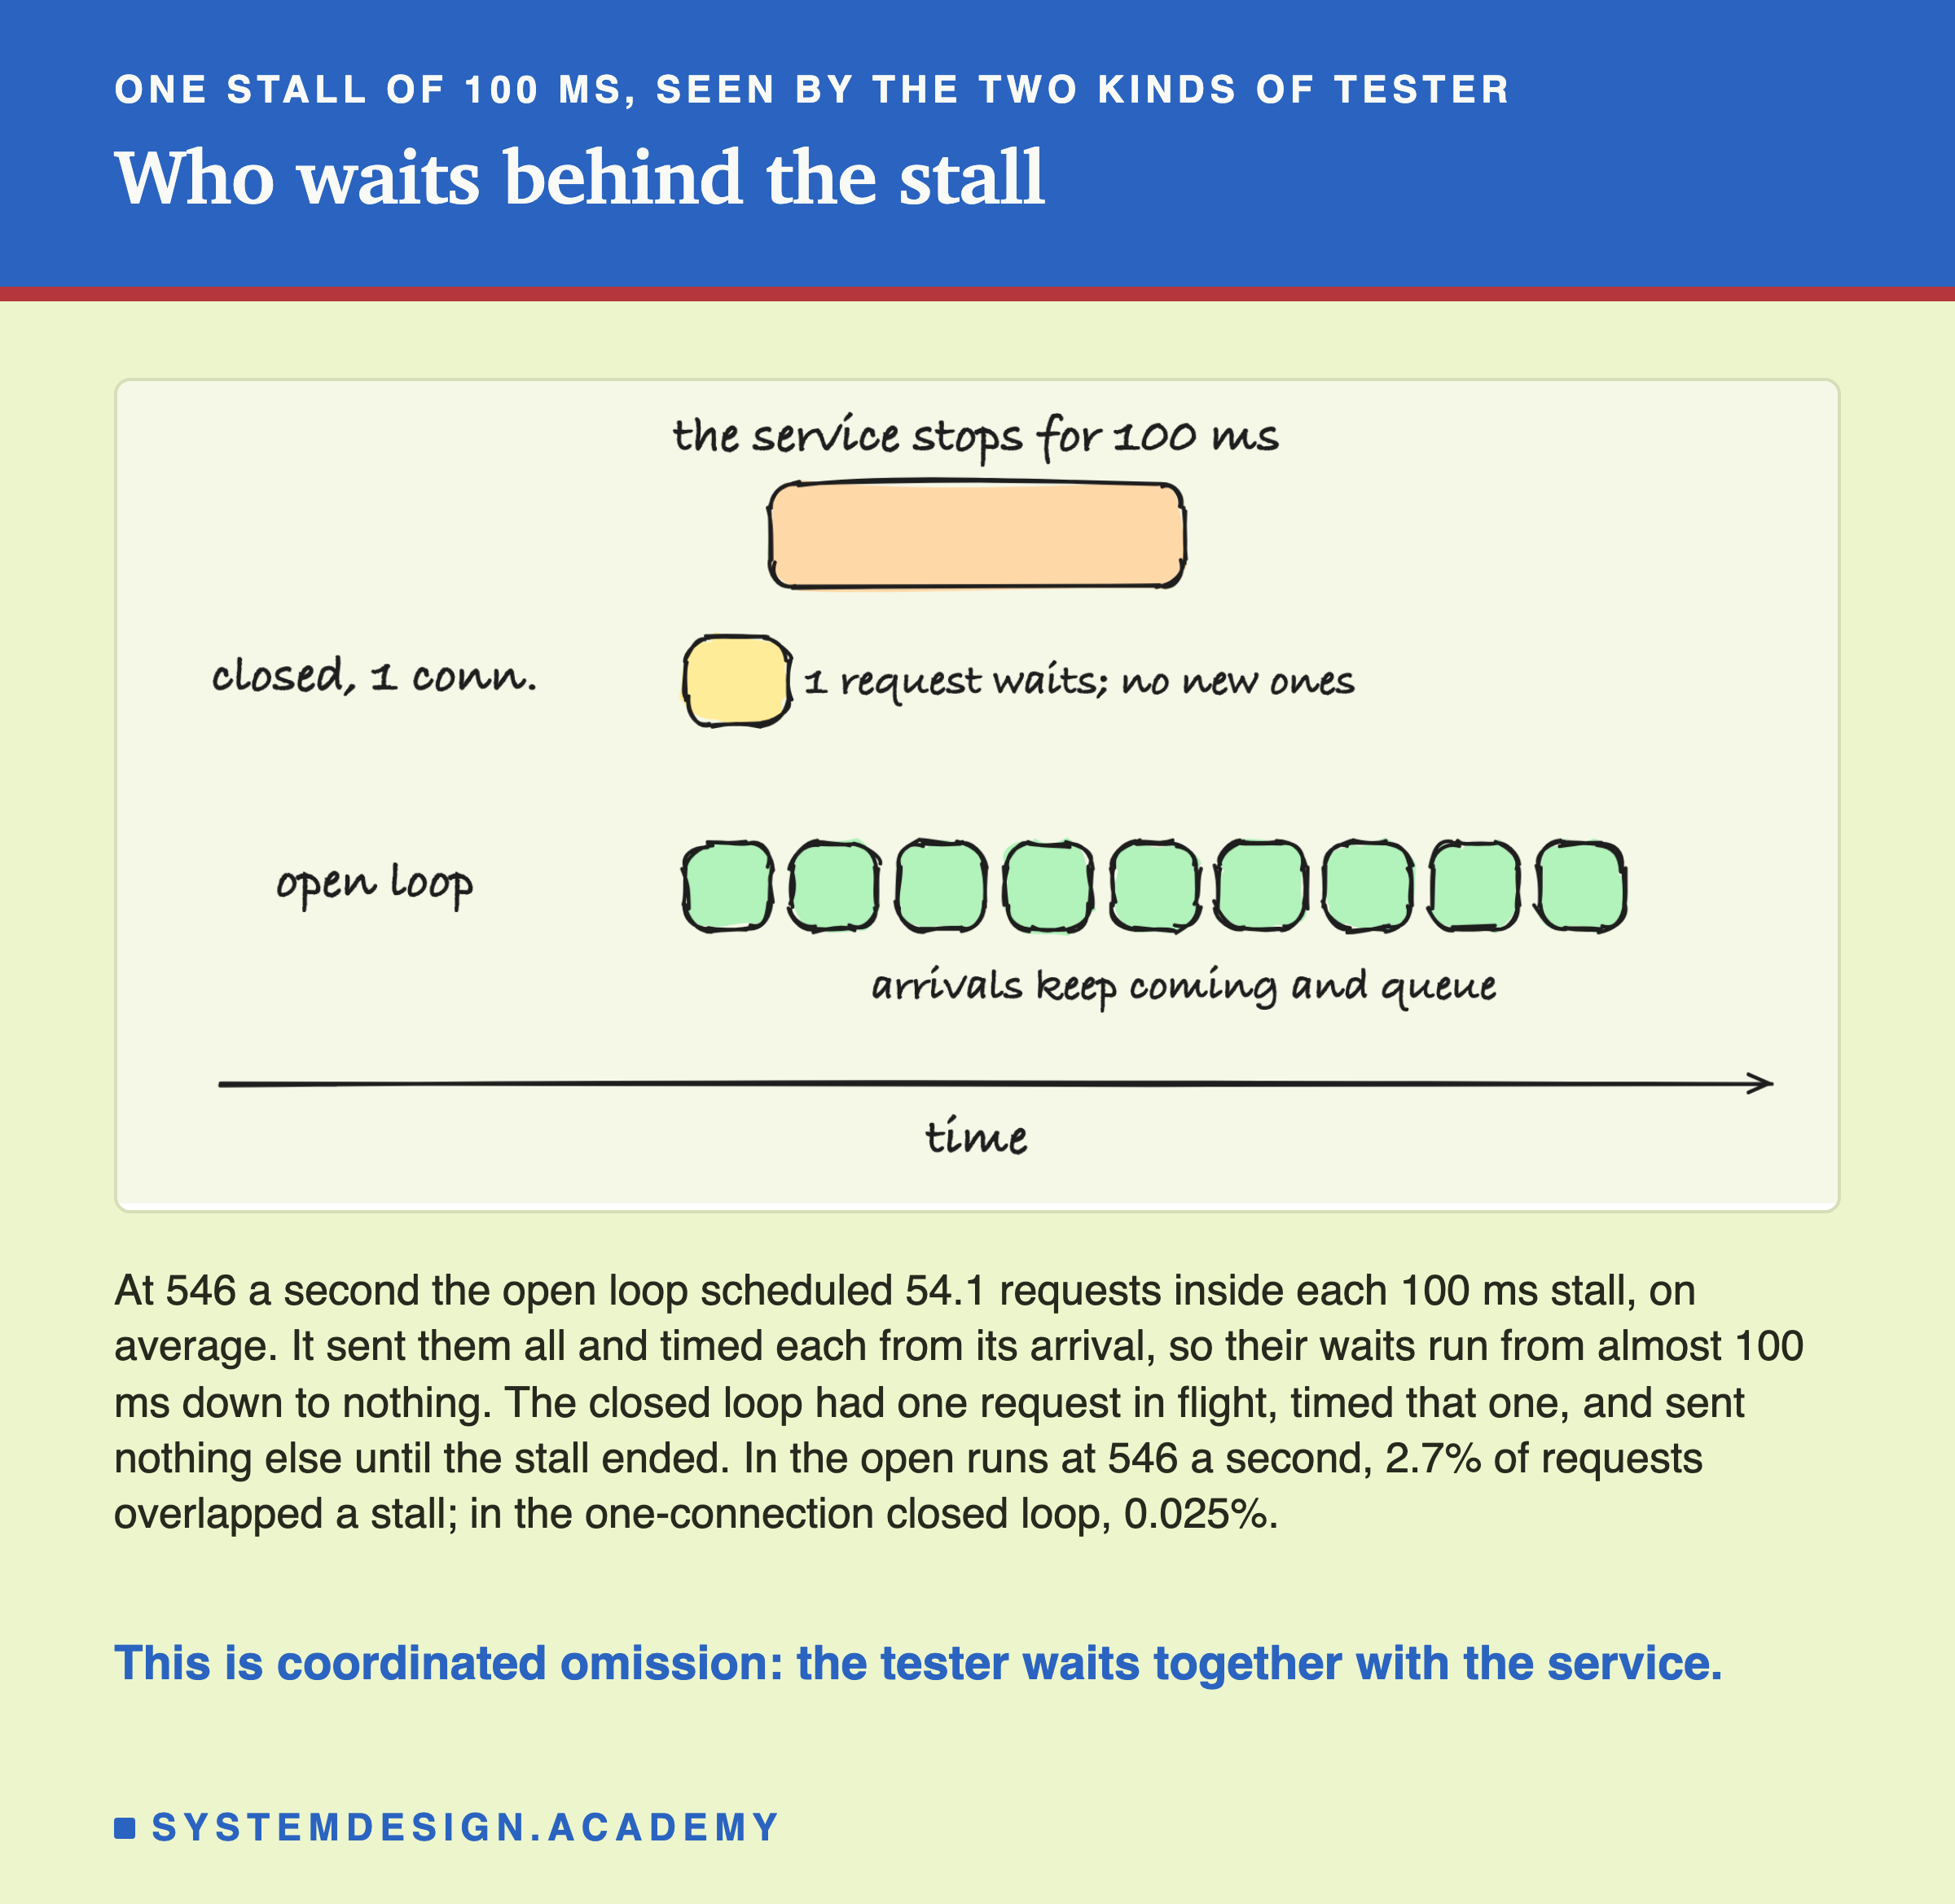
Now count. A p99 is the time that 99 of every 100 requests beat, so it looks at the slowest 1%. In the open loop at 546 a second, 2.7% of all requests overlapped a stall. That is more than 1%, so the p99 landed inside the stalled requests: 84.95 ms.
In the closed loop with one connection, only 0.025% of requests overlapped a stall: one per stall, out of about a thousand answers a second. That is far less than 1%, so the slowest 1% was made only of ordinary requests. The p99 was 0.97 ms, the same as with no stall at all.
Gil Tene named the problem in a post to the mechanical-sympathy mailing list on 4 August 2013. He described it as a "common measurement technique problem" and wrote that it "can often render percentile data useless". My lab shows that sentence in numbers: the closed loop's p99 was a correct percentile of the requests it sent, and those requests were the wrong sample.
What Each Tester Reported
Here is every tester's p99 with the stall on, every round as a dot.
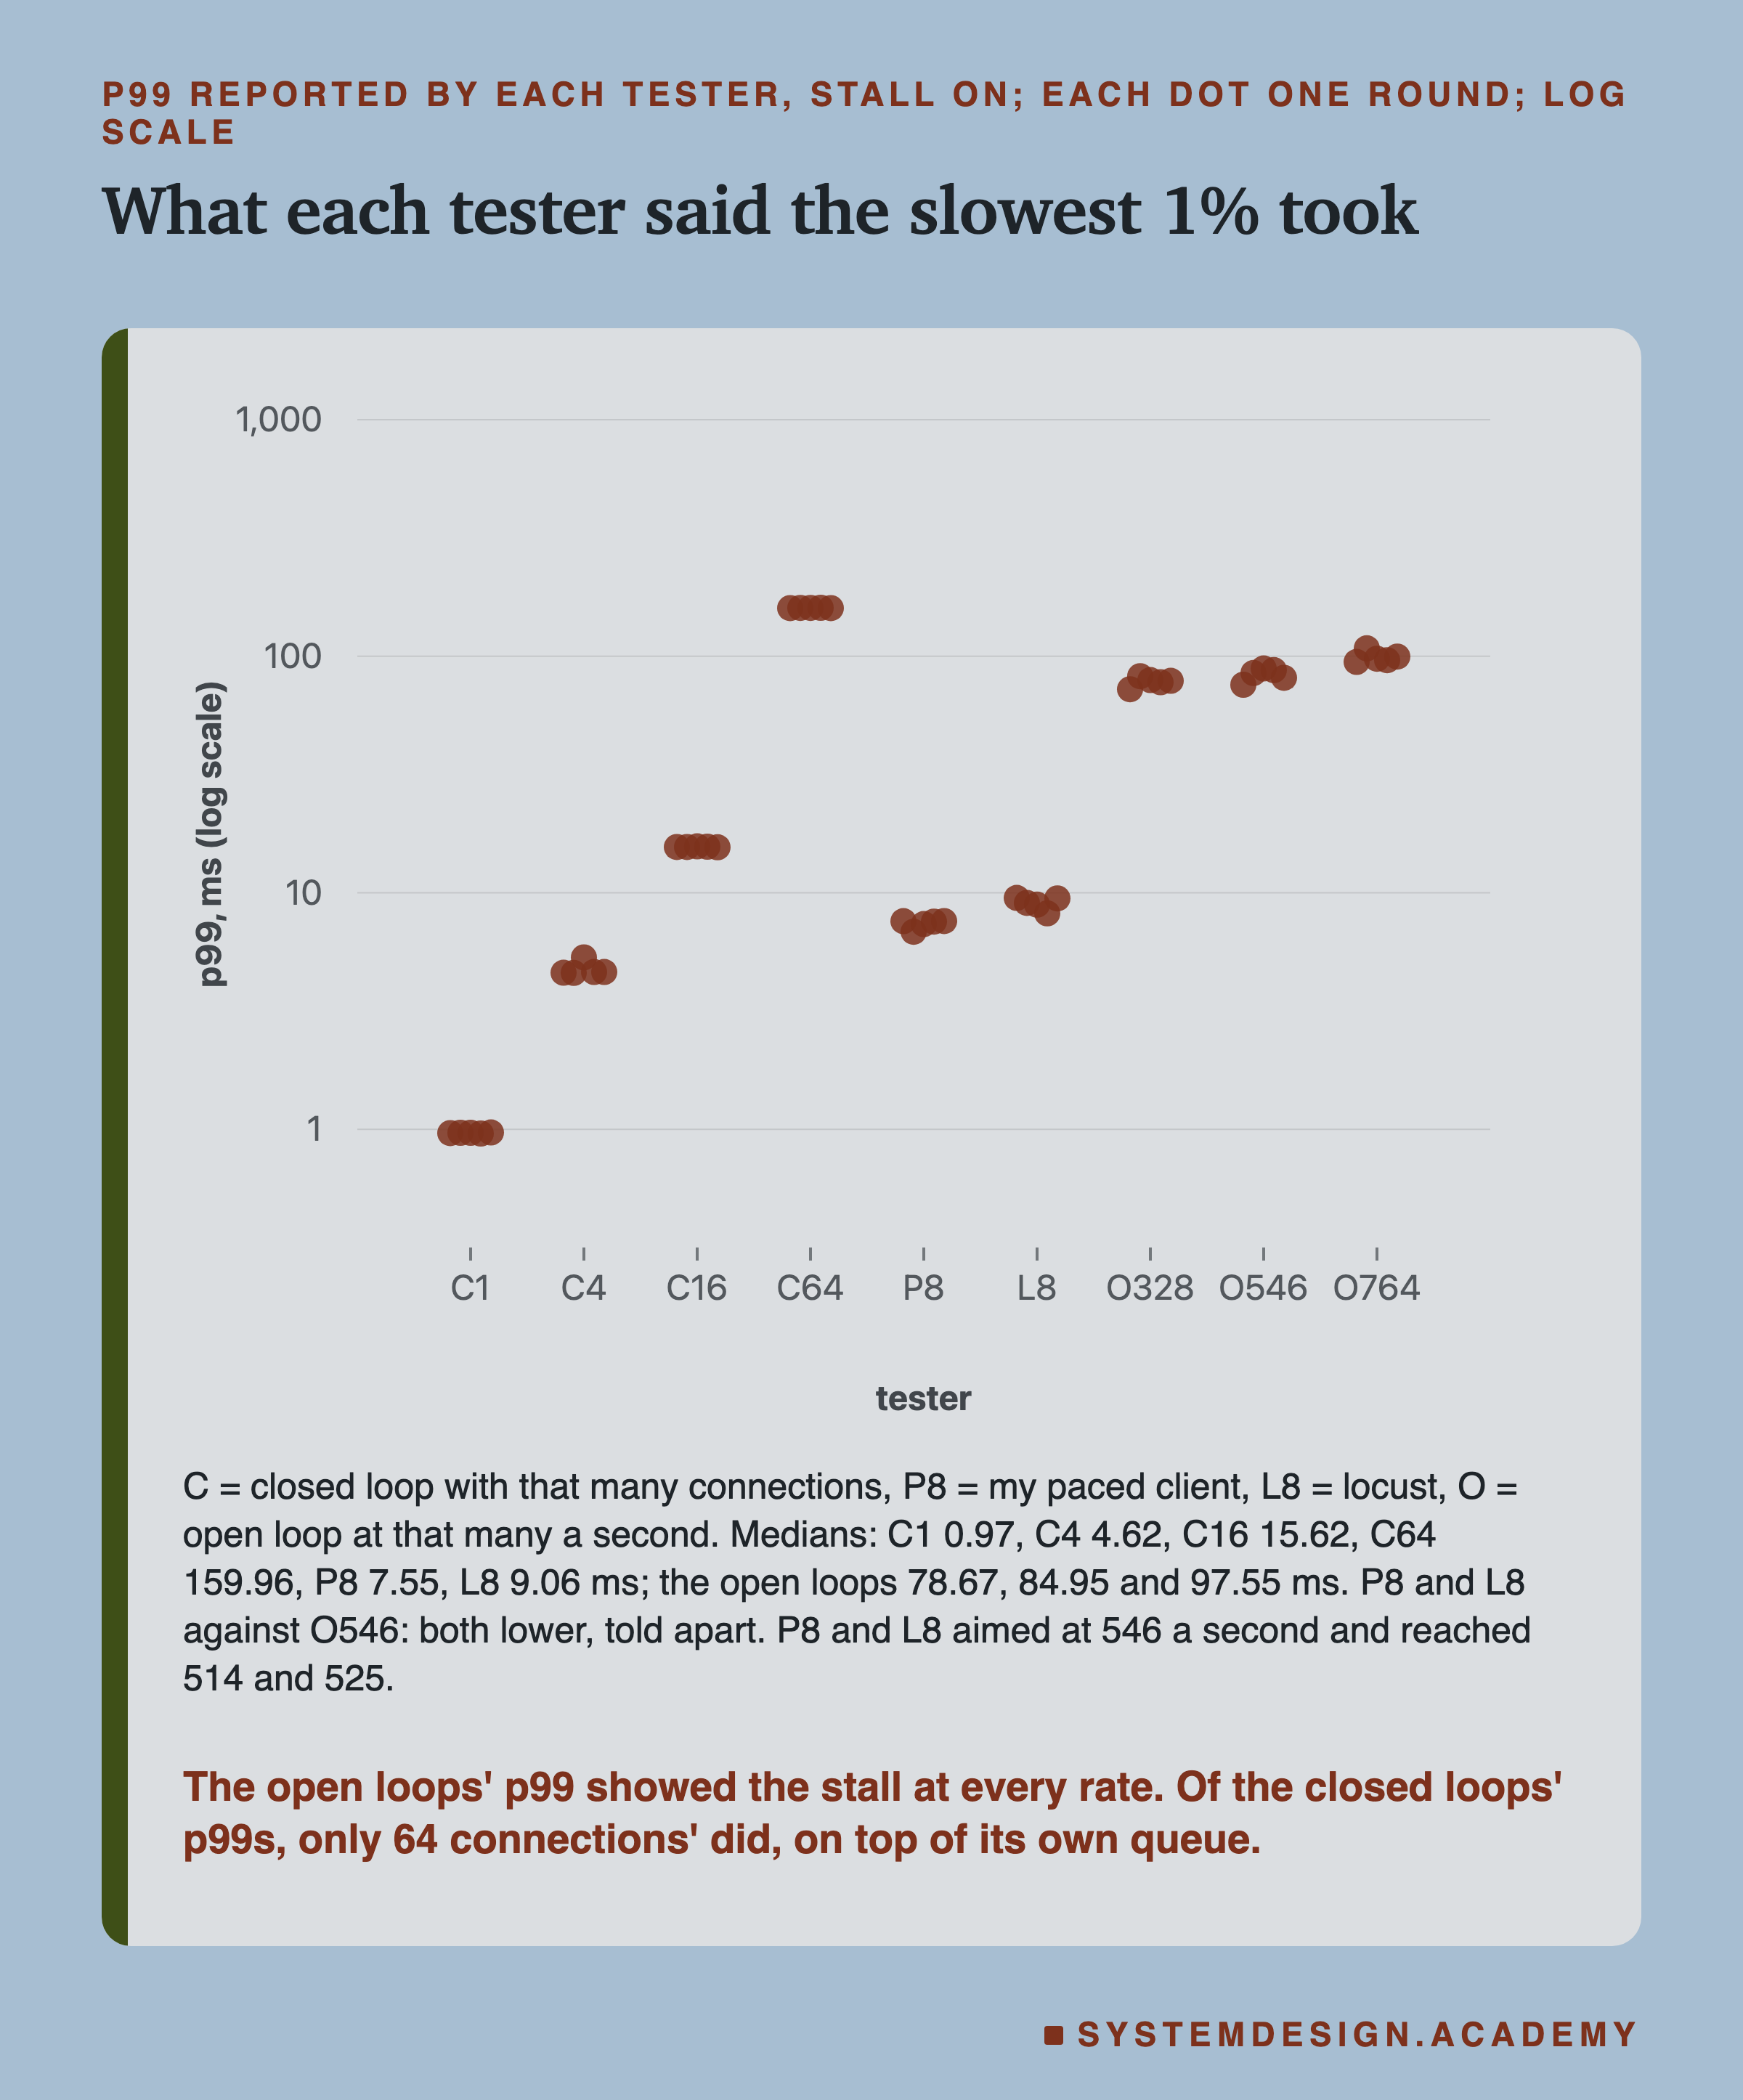
The open loops' p99 showed the stall at every rate. At 328, 546 and 764 a second their p99 was 78.67, 84.95 and 97.55 ms. Without stalls, the same arrivals gave 3.39, 5.29 and 9.77 ms. At every rate, stall on against stall off was told apart.
The paced testers' p99 missed it at about the same rate. They aimed at 546 a second and reached 514 and 525. My paced client reported 7.55 ms and locust 9.06 ms, against the open loop's 84.95 ms at 546 a second. Both were told apart from the open loop, round by round. They were 0.086 and 0.107 of it, as medians of the five rounds.
The closed loops' p99 grew with their connections, and that is the next slide. Only the one with 64 connections reached the stall's size.
One thing about the paced client surprised me. Even with no stall, it reported a p99 of 7.21 ms against the open loop's 5.29 ms at the same rate, told apart. And it sent 524.6 requests a second, not the 546 it aimed at. One possible reason is that it waits with a timer that rounds up to whole milliseconds, so its sends drift late and bunch up. I did not test that.
More Connections: The Closed Loop's Own Queue
What if the closed loop opens more connections? Then more requests are in flight when a stall begins, and more of them wait through it.
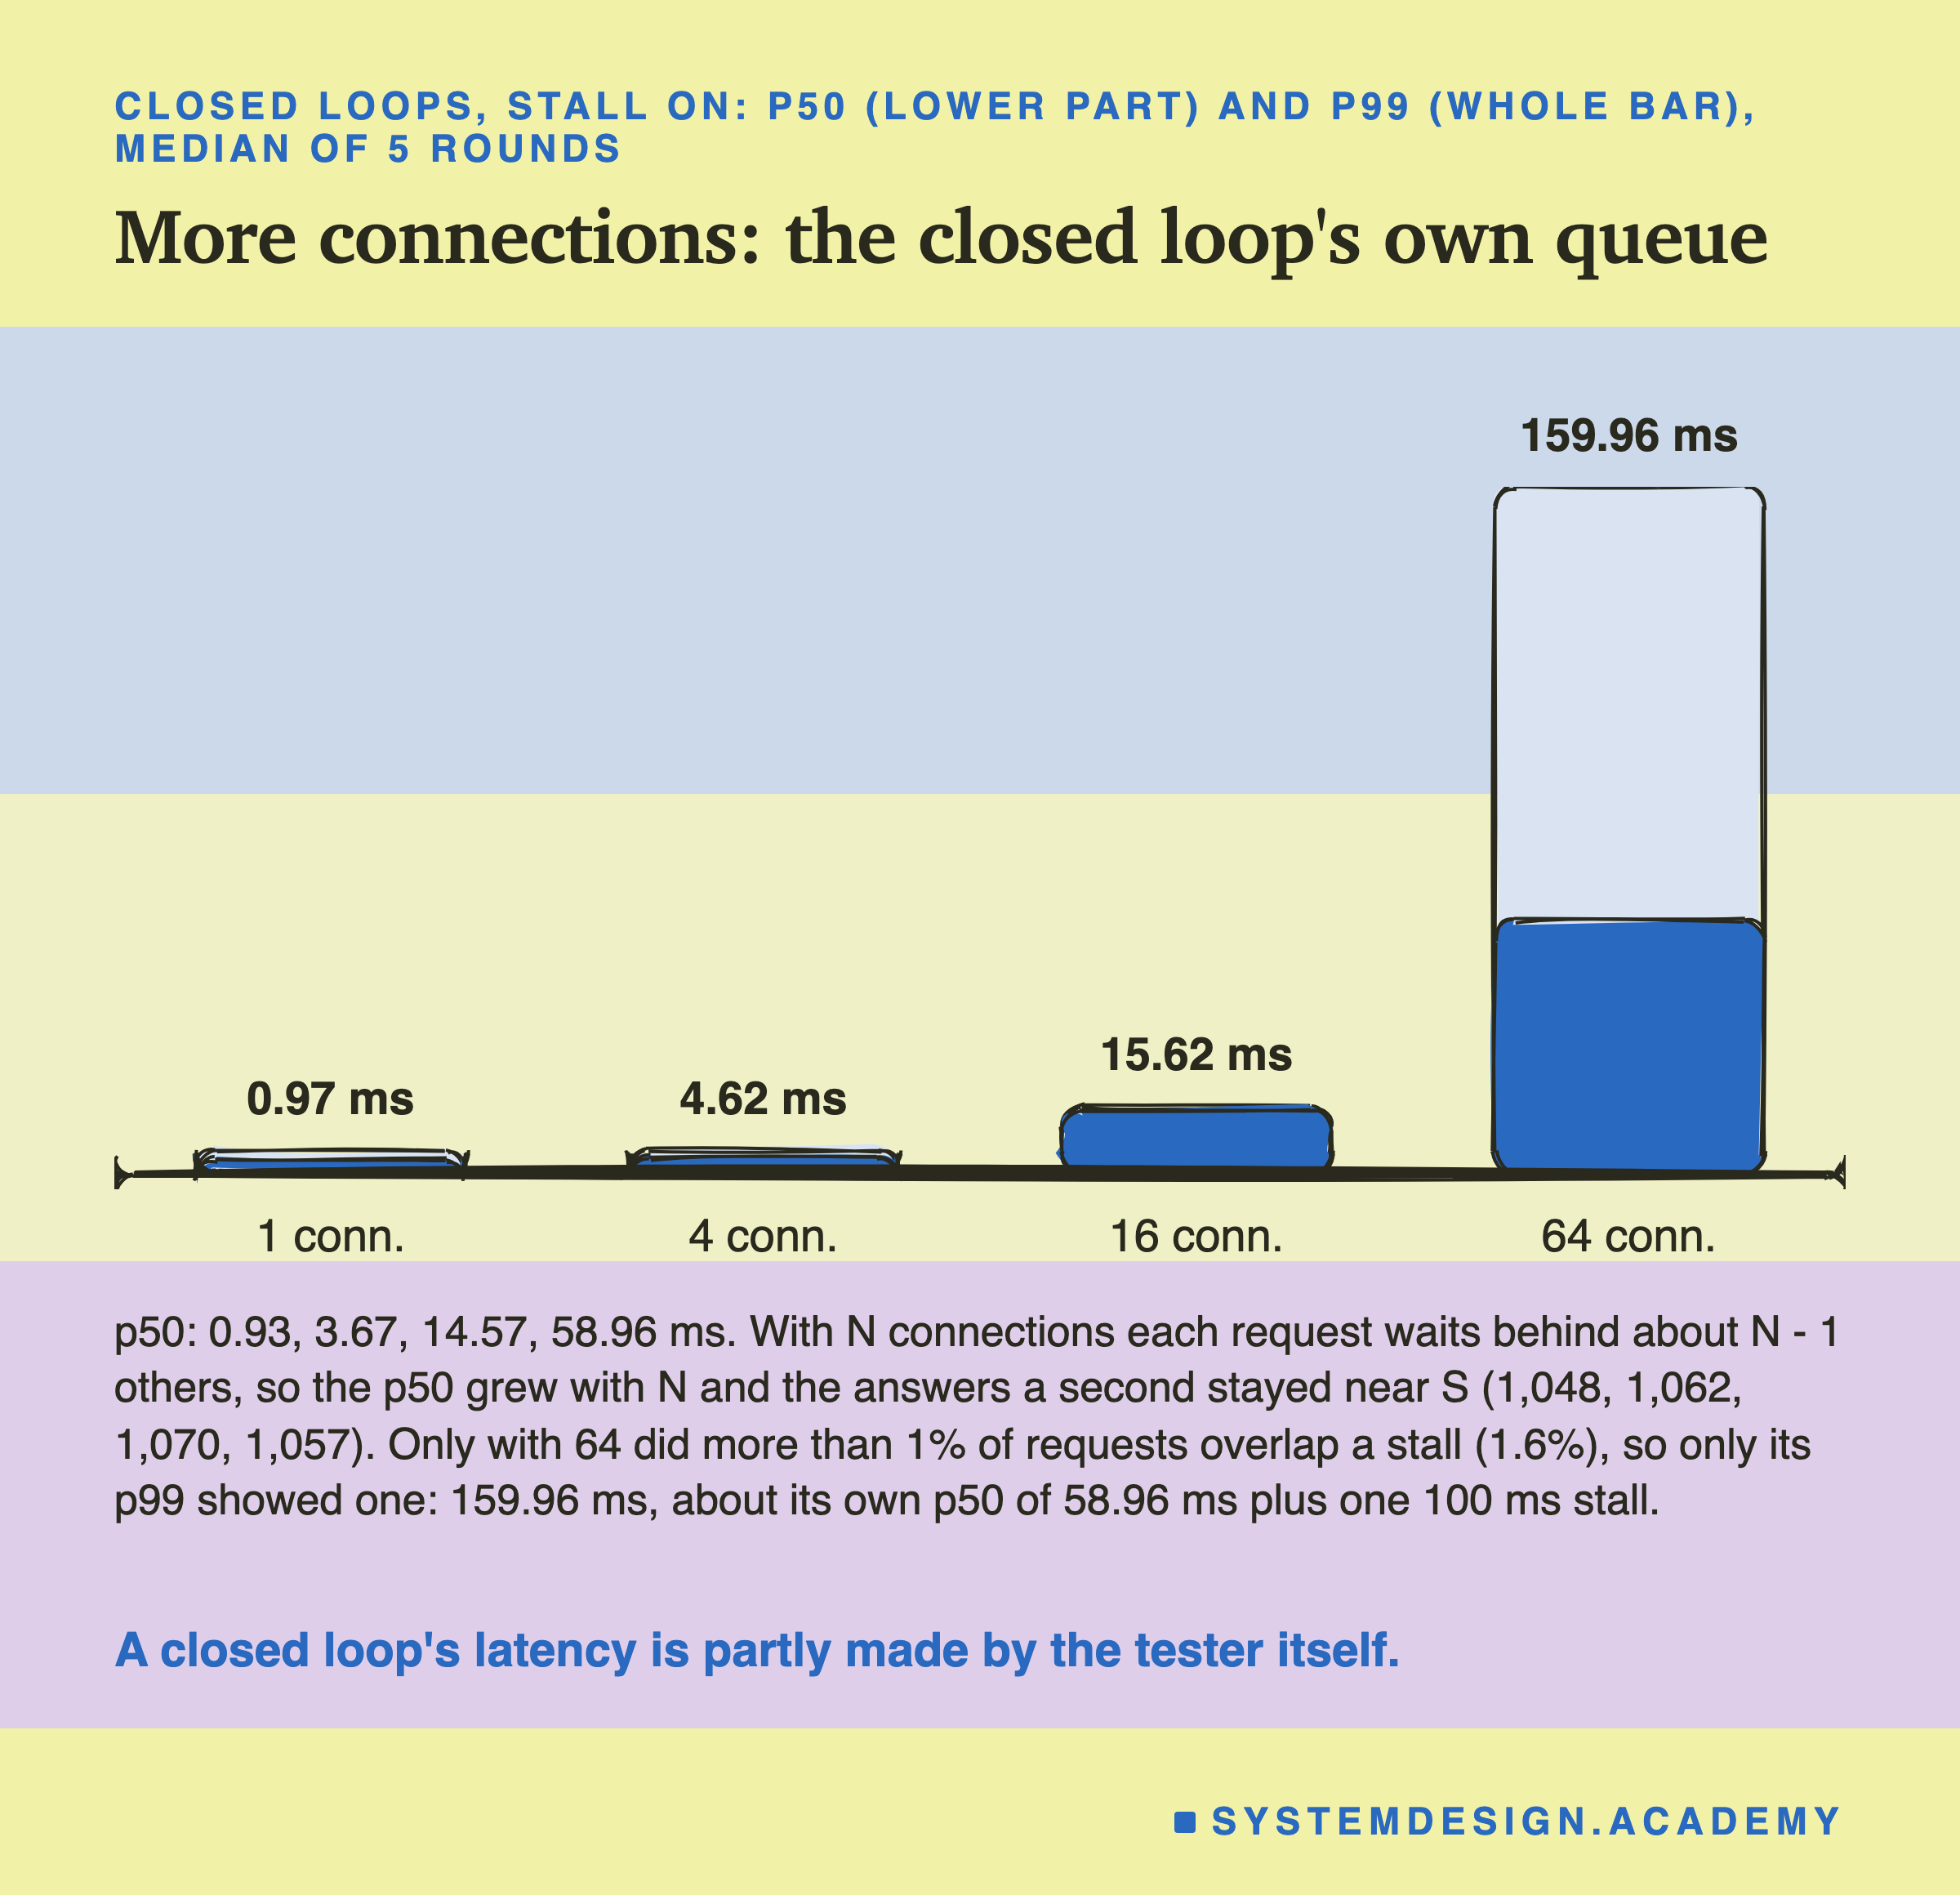
With 64 connections the p99 was 159.96 ms. That is about 59 ms of waiting behind the other 63 requests, plus one 100 ms stall. So here the closed loop did see a stall, but mixed with a queue that it made itself. Its p50, 58.96 ms, is all its own queue. Users arriving on their own at that rate would not wait behind 63 others, unless they really came at the same moment.
The answers a second hardly moved: 1,048, 1,062, 1,070 and 1,057 for 1, 4, 16 and 64 connections. One connection already kept the one core almost fully busy, because the tester and the service take turns on it.
So a closed loop gives you two dials, and neither is "what users see". Few connections hide the stall. Many connections add a queue of their own. A closed loop tells you most about the most a service can answer, which is how lessons 4 and 5 used it. It tells you least about the waits of users.
The HdrHistogram Correction
There is a known repair for a closed or paced tester. HdrHistogram is a library for recording latencies, written by Gil Tene. Its method recordValueWithExpectedInterval takes each recorded v and an expected interval I, the time between two requests when nothing goes wrong. If v is larger than I, it also records v - I, v - 2I, and so on, while they are at least I. Its documentation says it will "auto-generate an additional series of decreasingly-smaller" values, standing in for the requests the tester should have sent while it waited.
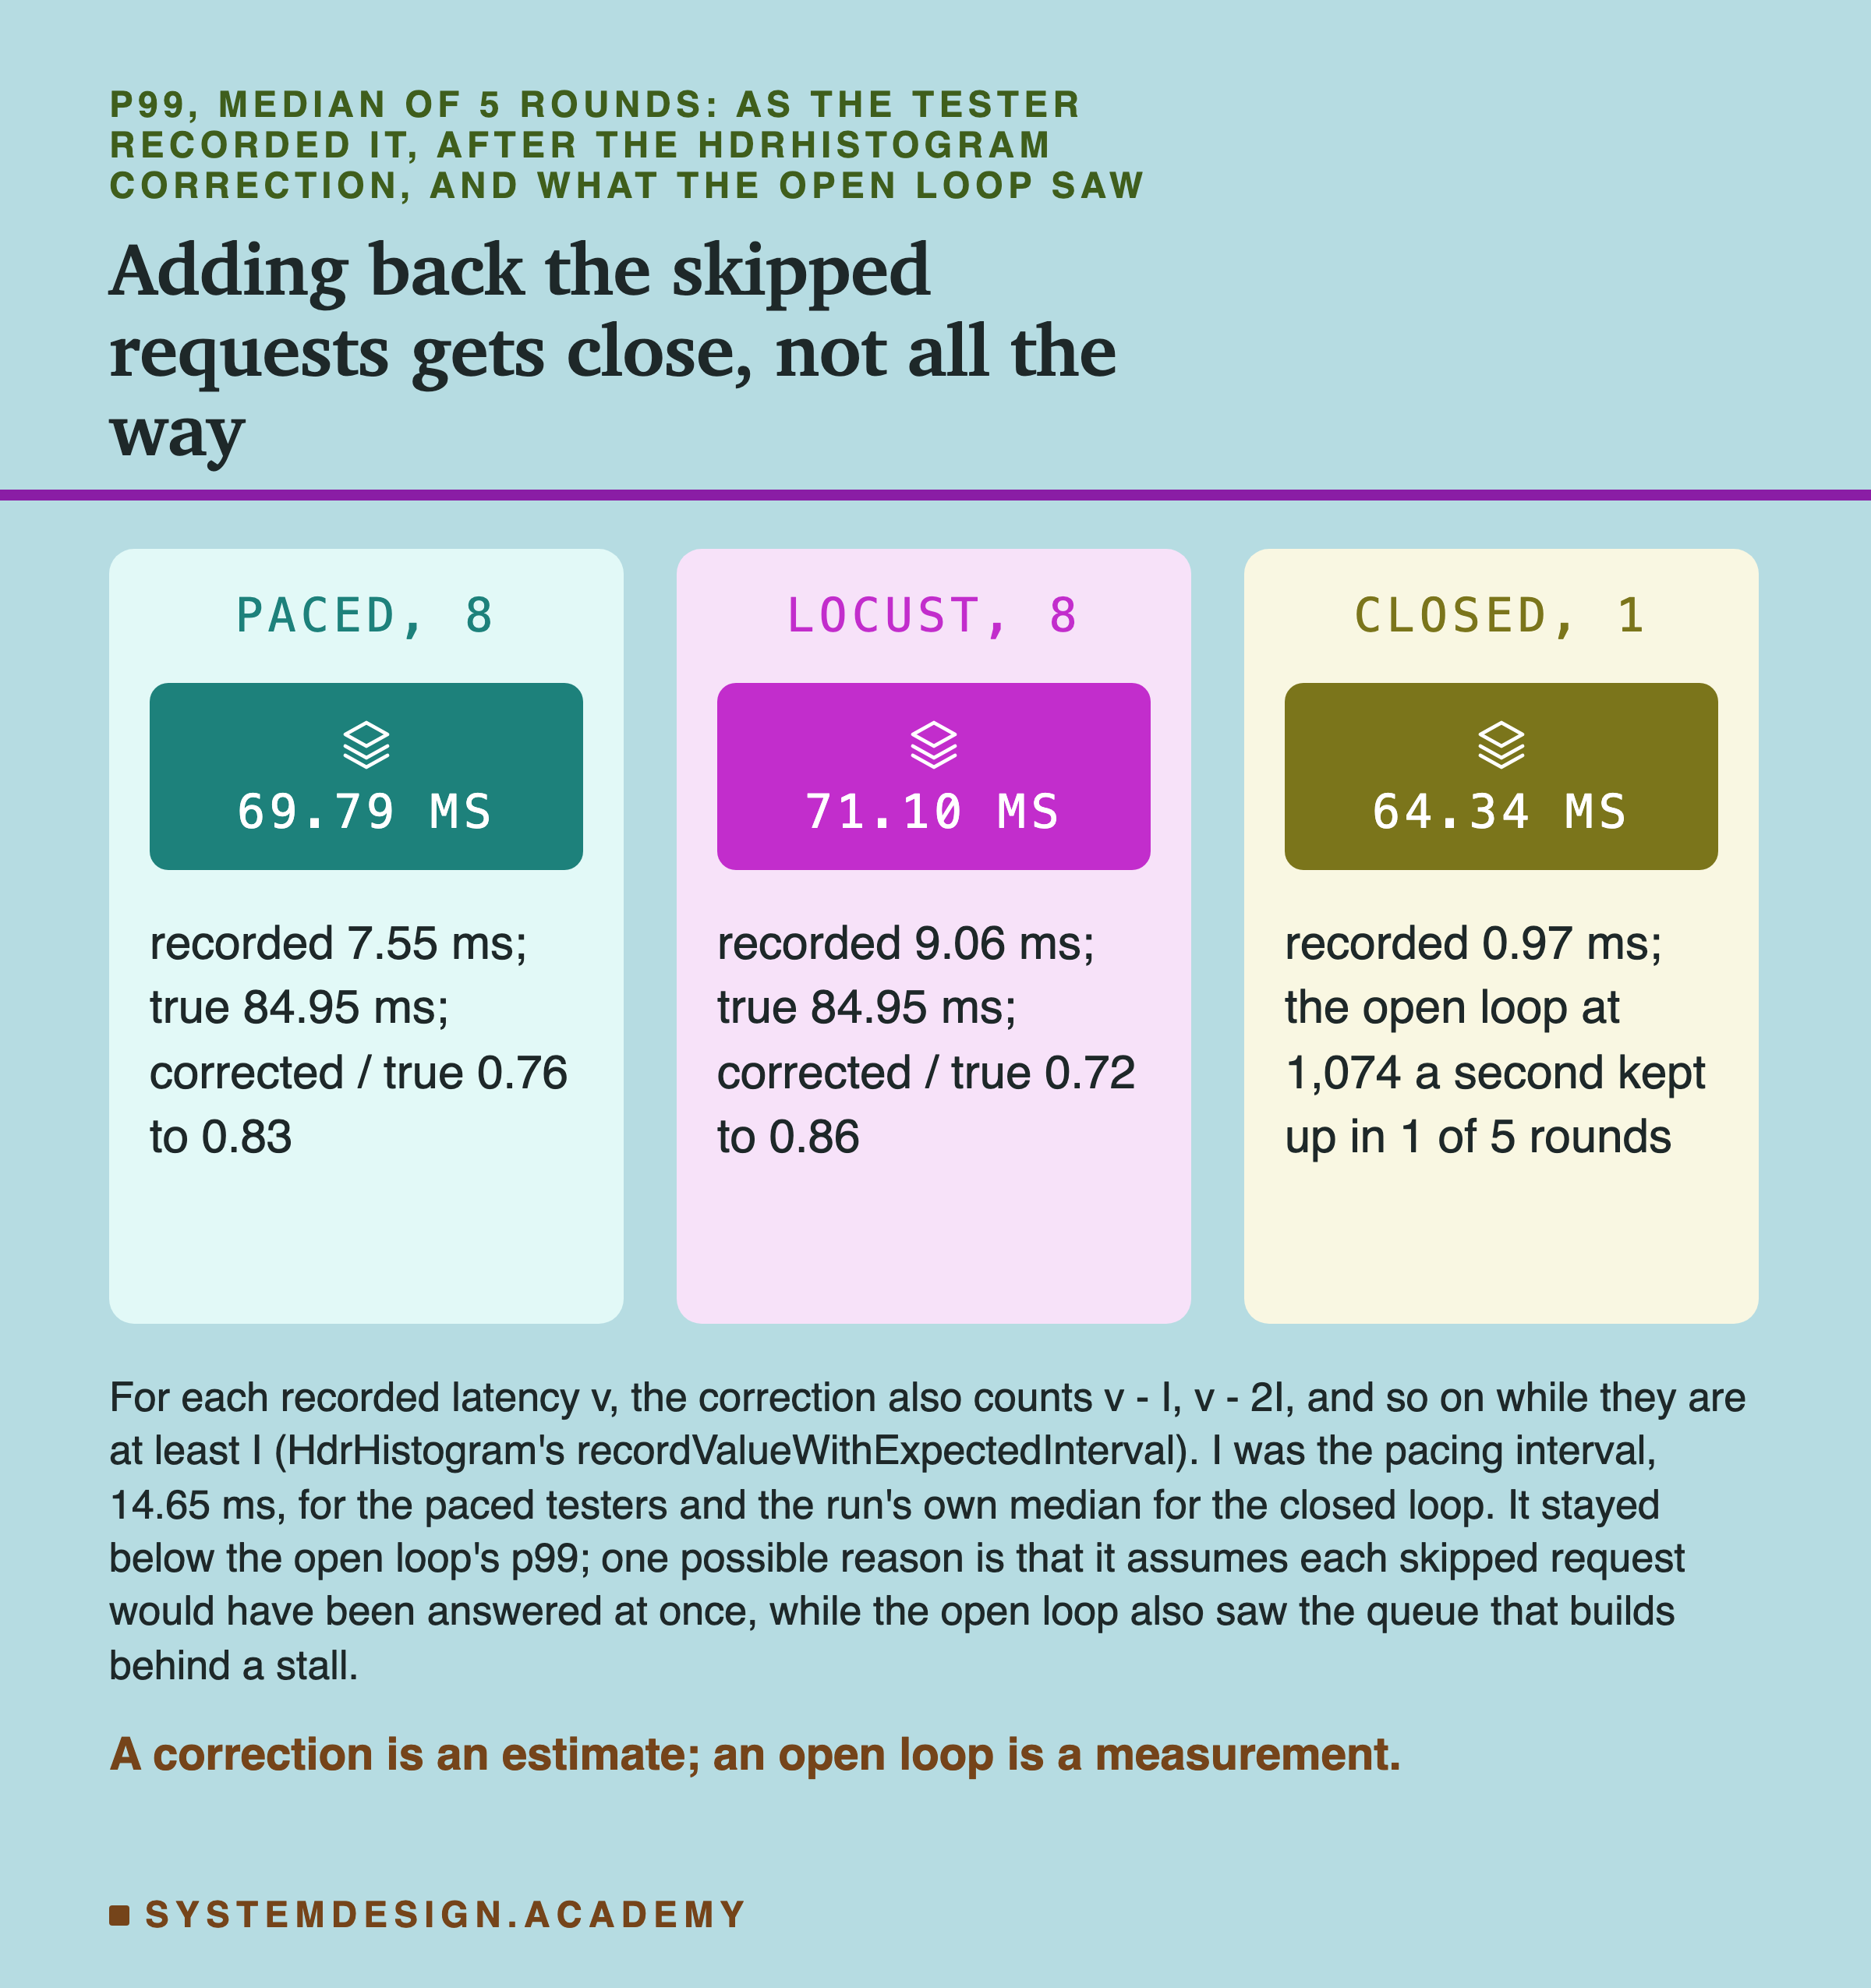
I applied it to the stored latencies, with I chosen before the runs. For the paced testers I was the pacing interval: 8 connections at 546 a second is 14.65 ms. For the closed loop it was the run's own median latency, which was about 0.3% below the median gap between its sends.
For the paced testers it got most of the way. My client went from 7.55 ms to 69.79 ms, and locust from 9.06 ms to 71.10 ms. The open loop at the same rate said 84.95 ms. Corrected over true was 0.76 to 0.83 for mine and 0.72 to 0.86 for locust, across the five rounds, and still below the truth in every round. Even with no stall, my paced client's p99 was 1.36 times the open loop's, so part of its 7.55 ms is its own pacing.
For the one-connection closed loop, the correction went from 0.97 ms to 64.34 ms. But the truth for its rate is hard to state. It sent 1,048 requests a second with the stalls. Arrivals on their own clock at 1,074 a second were more than the service could keep up with. The open loop at that rate kept up in only 1 of 5 rounds. Its p99, 2,016 ms, only says that the queue never emptied. So the corrected 64.34 ms is far below that truth.
I guessed the correction would land within 0.8 to 1.2 of the truth for the paced client. It landed at 0.76 to 0.83, so that guess was wrong, but not by much.
A Real Tool: locust
I wanted one real, widely used tool on the same service. locust is a load-testing tool written in Python and installed with pip.
Its users run tasks, and a task waits for its answer before the user goes on. In its source at version 2.46.7, a user runs a task and then calls self.wait() before the next one. Its constant_pacing wait aims at a fixed time between task starts. Its own docstring says: "If a task execution exceeds the specified wait_time, the wait will be 0 before starting" the next one. Its FastHttpUser times a request from start_perf_counter = time.perf_counter(), just before the request goes out. So locust is a paced closed loop, the same model as my paced client.
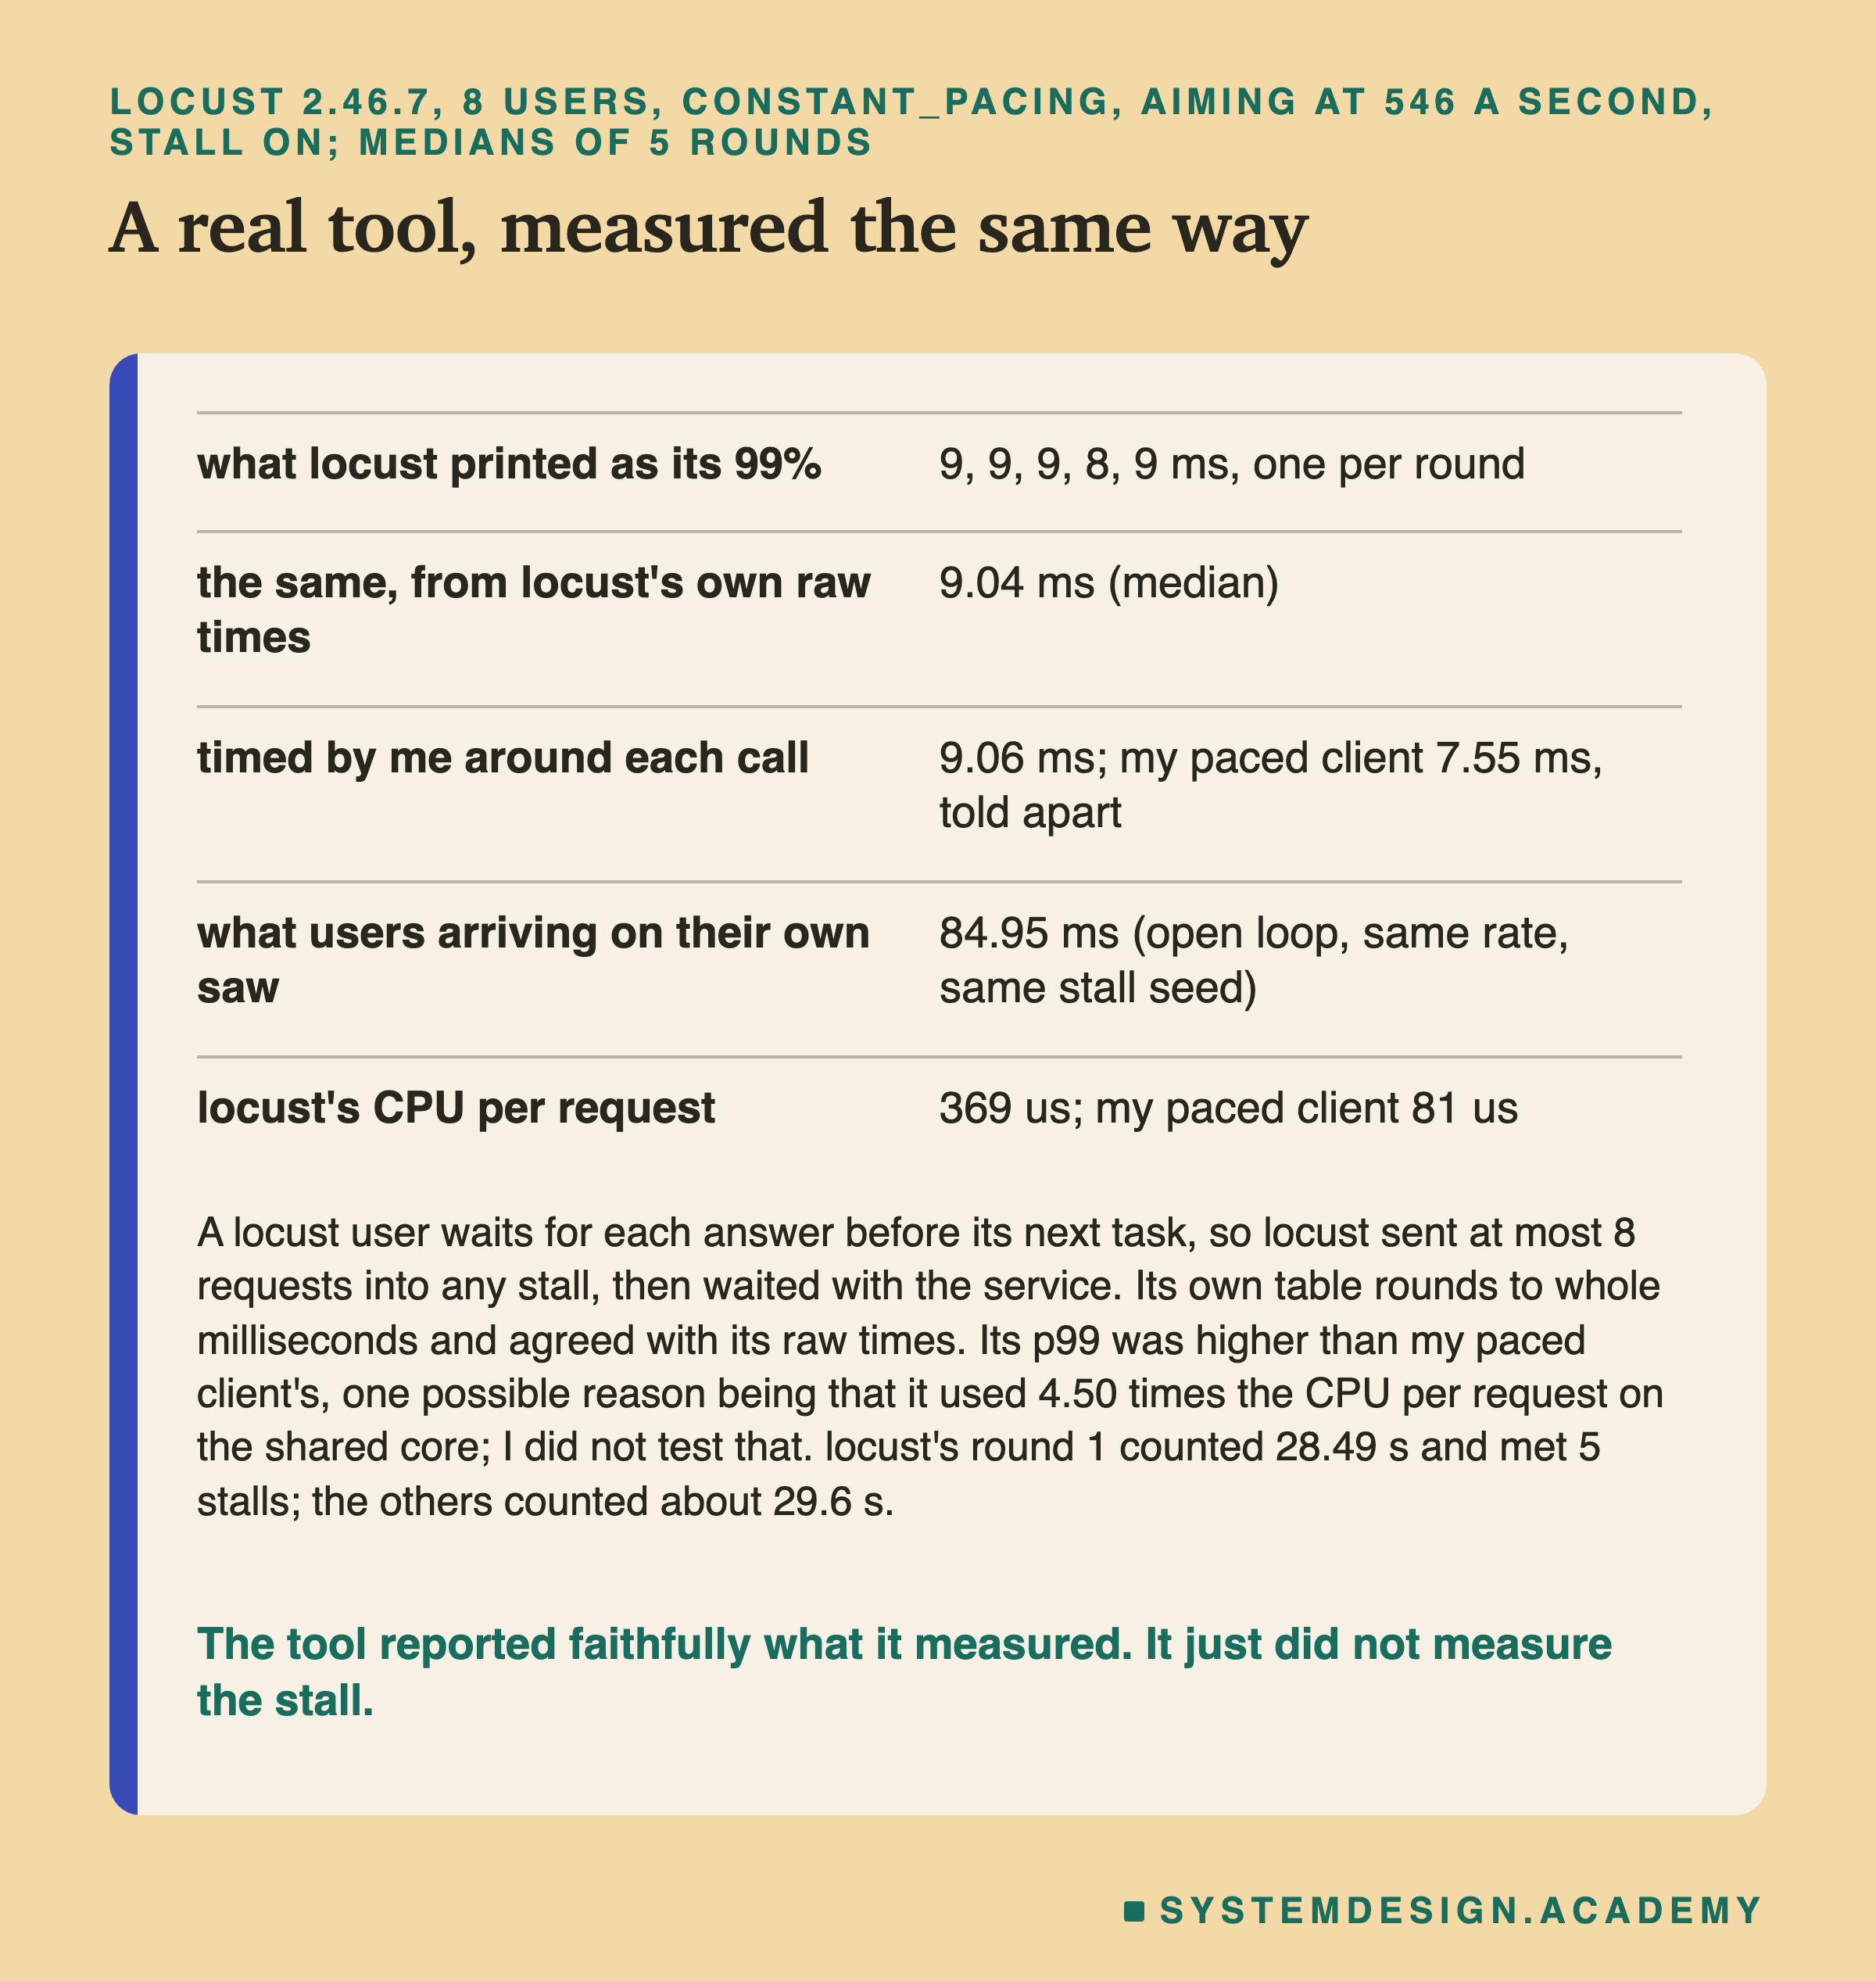
locust's own table said 9 ms in four rounds and 8 ms in one. Its raw response times gave 9.04 ms, and my own clock around each call gave 9.06 ms. So locust reported faithfully what it measured. It simply measured the same sample my paced client did, and that sample left out the stall.
One caution about locust's numbers. Its round 1 counted only 28.49 s, because its 30 s includes its own start. That round met 5 stalls where the open loop's round 1 met 6; the other rounds counted about 29.6 s. I divided its answers by a fixed 30 s, so its 525 a second reads a little low: by its own counted span it was 531 to 537. Round 1 also gave its lowest corrected ratio, 0.72.
Other Lie 1: The Run Was Too Short
Coordinated omission is the big lie here, but not the only one. The next four slides each take one more, measured on the same data.
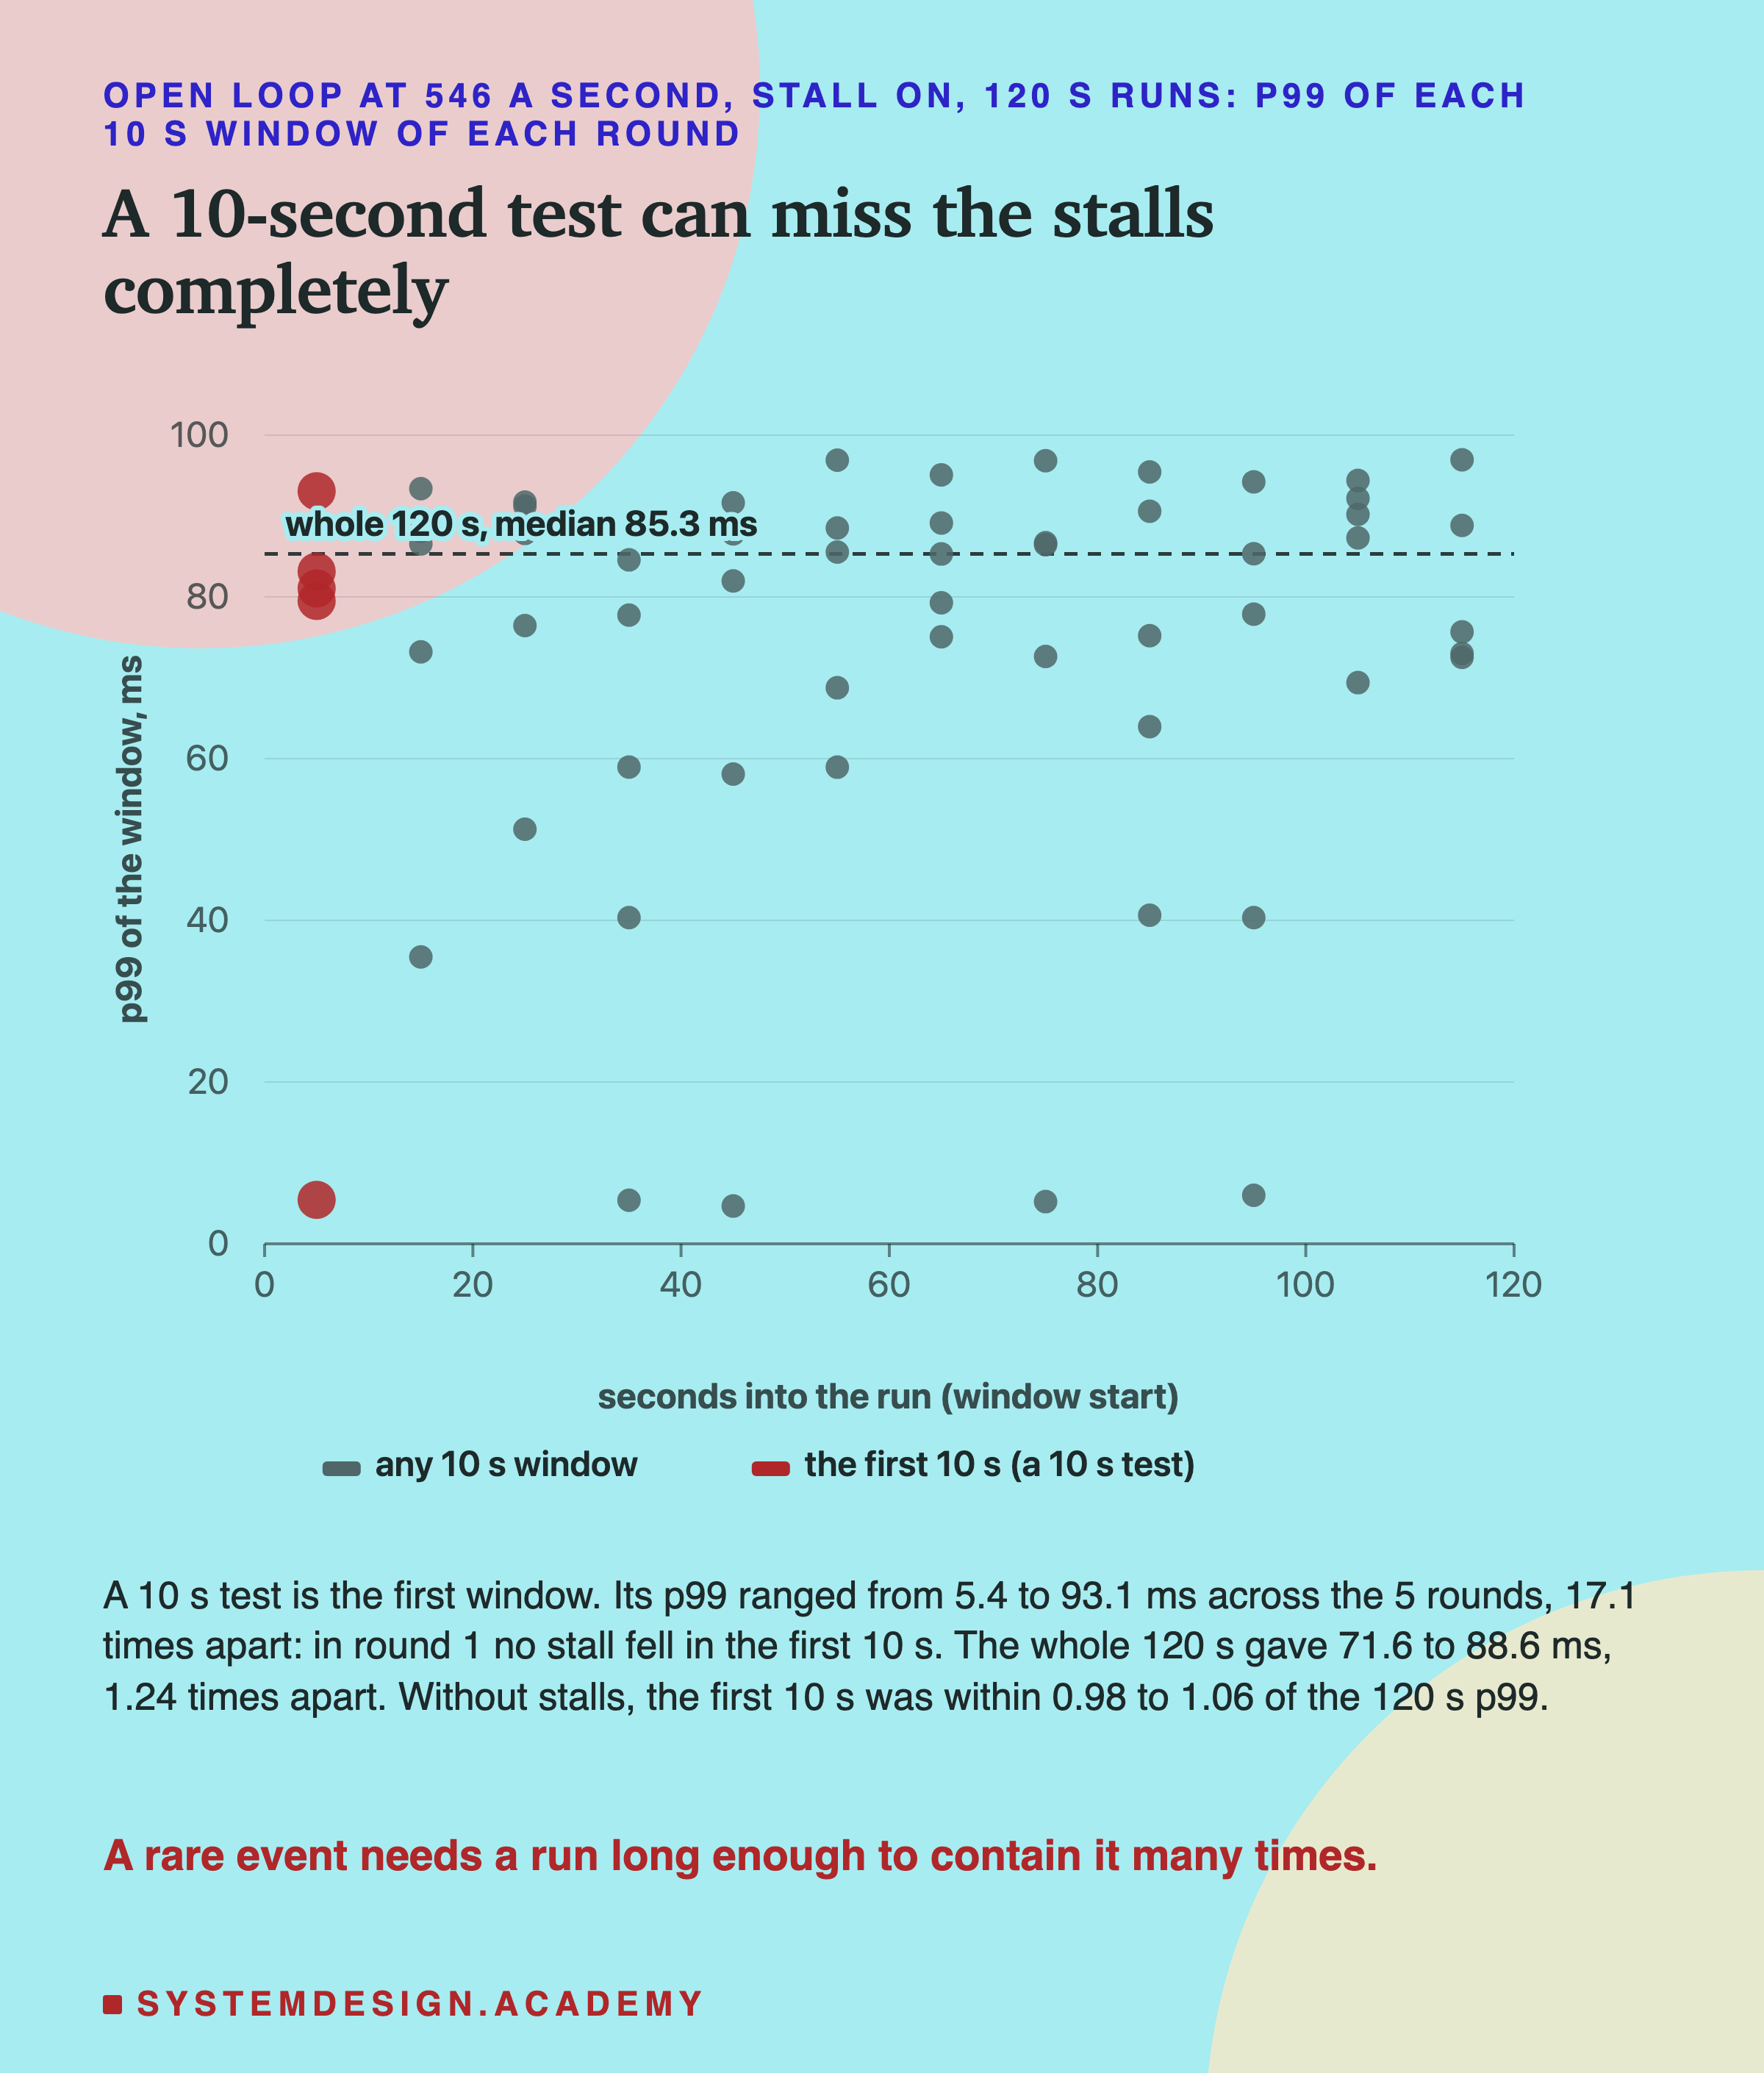
Two of the arms ran for 120 seconds instead of 30, with the stall on and off. I cut each run into twelve windows of 10 seconds. The first window is exactly what a 10-second load test would have reported.
With stalls, a 10-second test could say anything. One of five 10-second tests missed every stall and reported 5.4 ms; the other four reported 79.5 to 93.1 ms, so the five were 17.1 times apart. In that round no stall happened in the first 10 seconds, so a 10-second test would have said the service never stalls. Over the whole 120 seconds, the p99 ranged only from 71.6 to 88.6 ms, 1.24 times apart.
Without stalls, 10 seconds was enough. The first window was within 0.98 to 1.06 of the 120-second p99 in every round. So run length matters most when the slow event is rare. Here a stall came on average every 4 seconds. A real pause that comes once a minute would need a run of many minutes to show up even a few times.
Other Lie 2: The Average
Many dashboards still show the average , called the mean: the total of all latencies divided by how many there were.
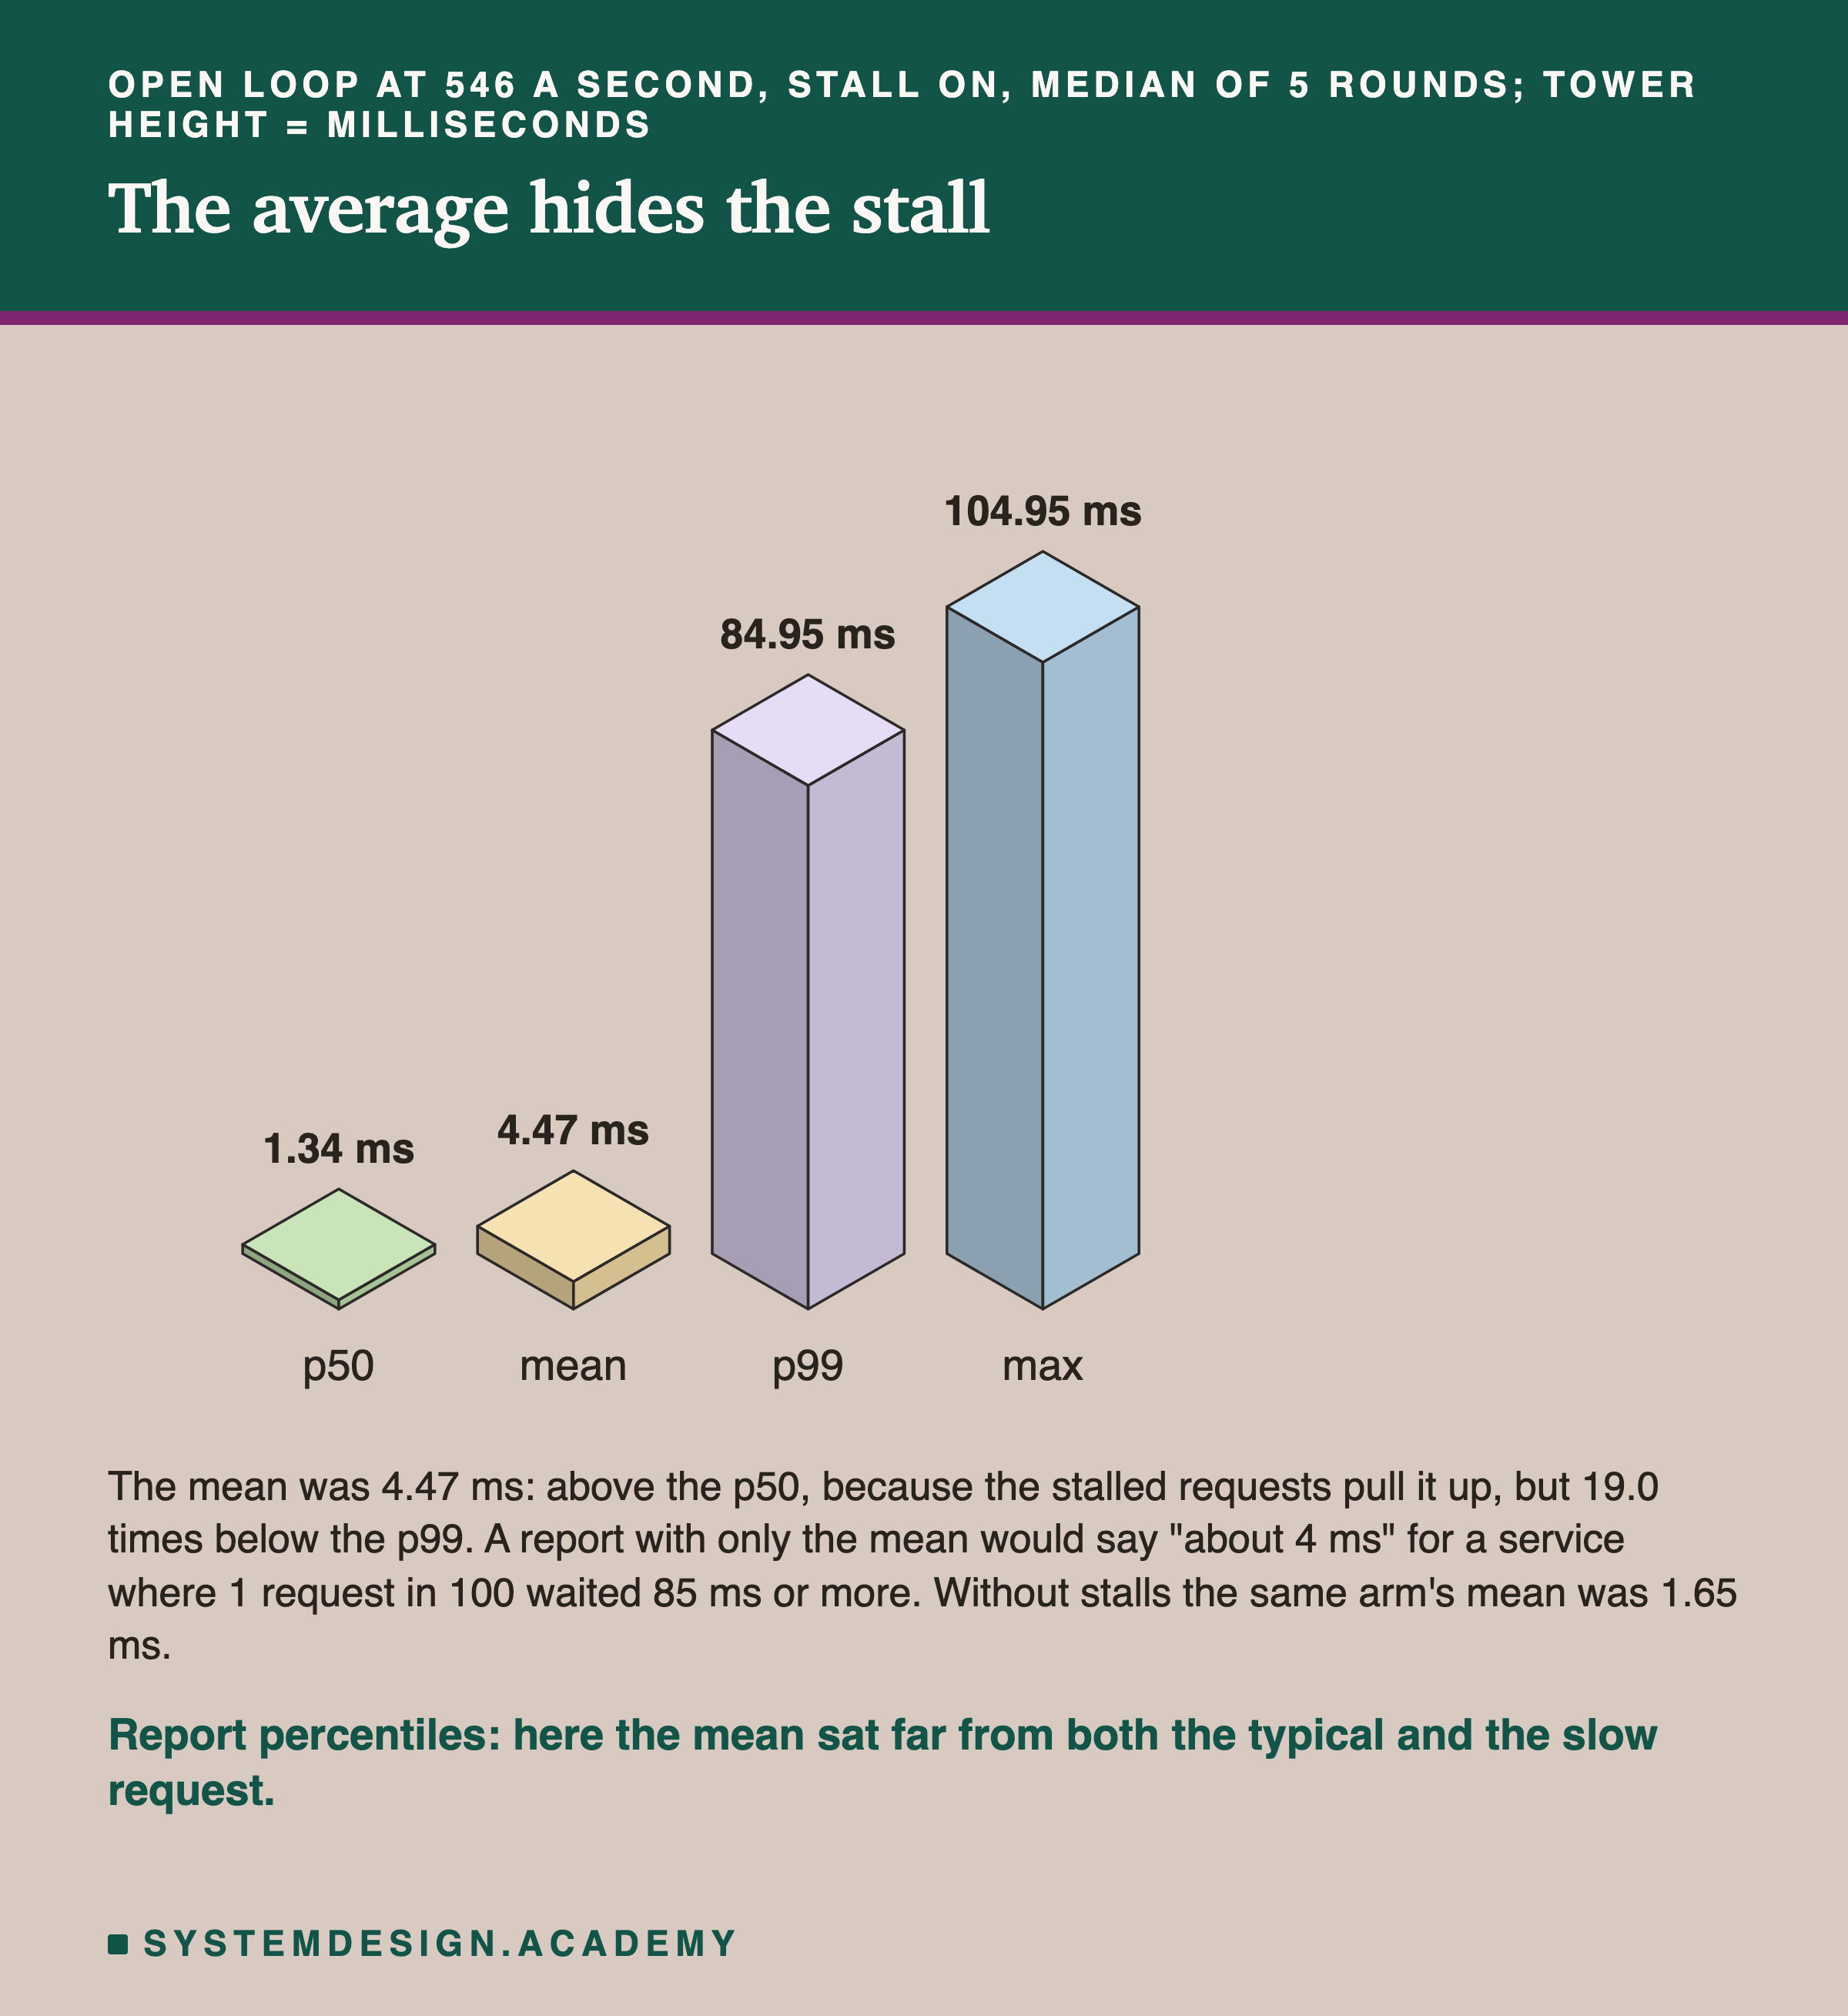
With the stall on and the open loop at 546 a second, the mean was 4.47 ms. The p50 was 1.34 ms, the p99 84.95 ms and the slowest request 104.95 ms.
The mean matched almost no request. Most requests took about a millisecond. The ones caught by a stall took tens of milliseconds. The mean, 4.47 ms, sits between the two groups, where few requests actually were. A report with only the mean would say "about 4 ms" for a service where 1 request in 100 waited 85 ms or more.
The mean did move with the stalls, from 1.65 ms without them to 4.47 ms with them, so it is not useless. But it hides the shape. Report the p50, the p99 and the max, and look at all three.
Other Lie 3: Throughput With No Latency Bound
The most common number in a load test report is : how many requests a second the service handled. A closed loop with many connections gives a big one.
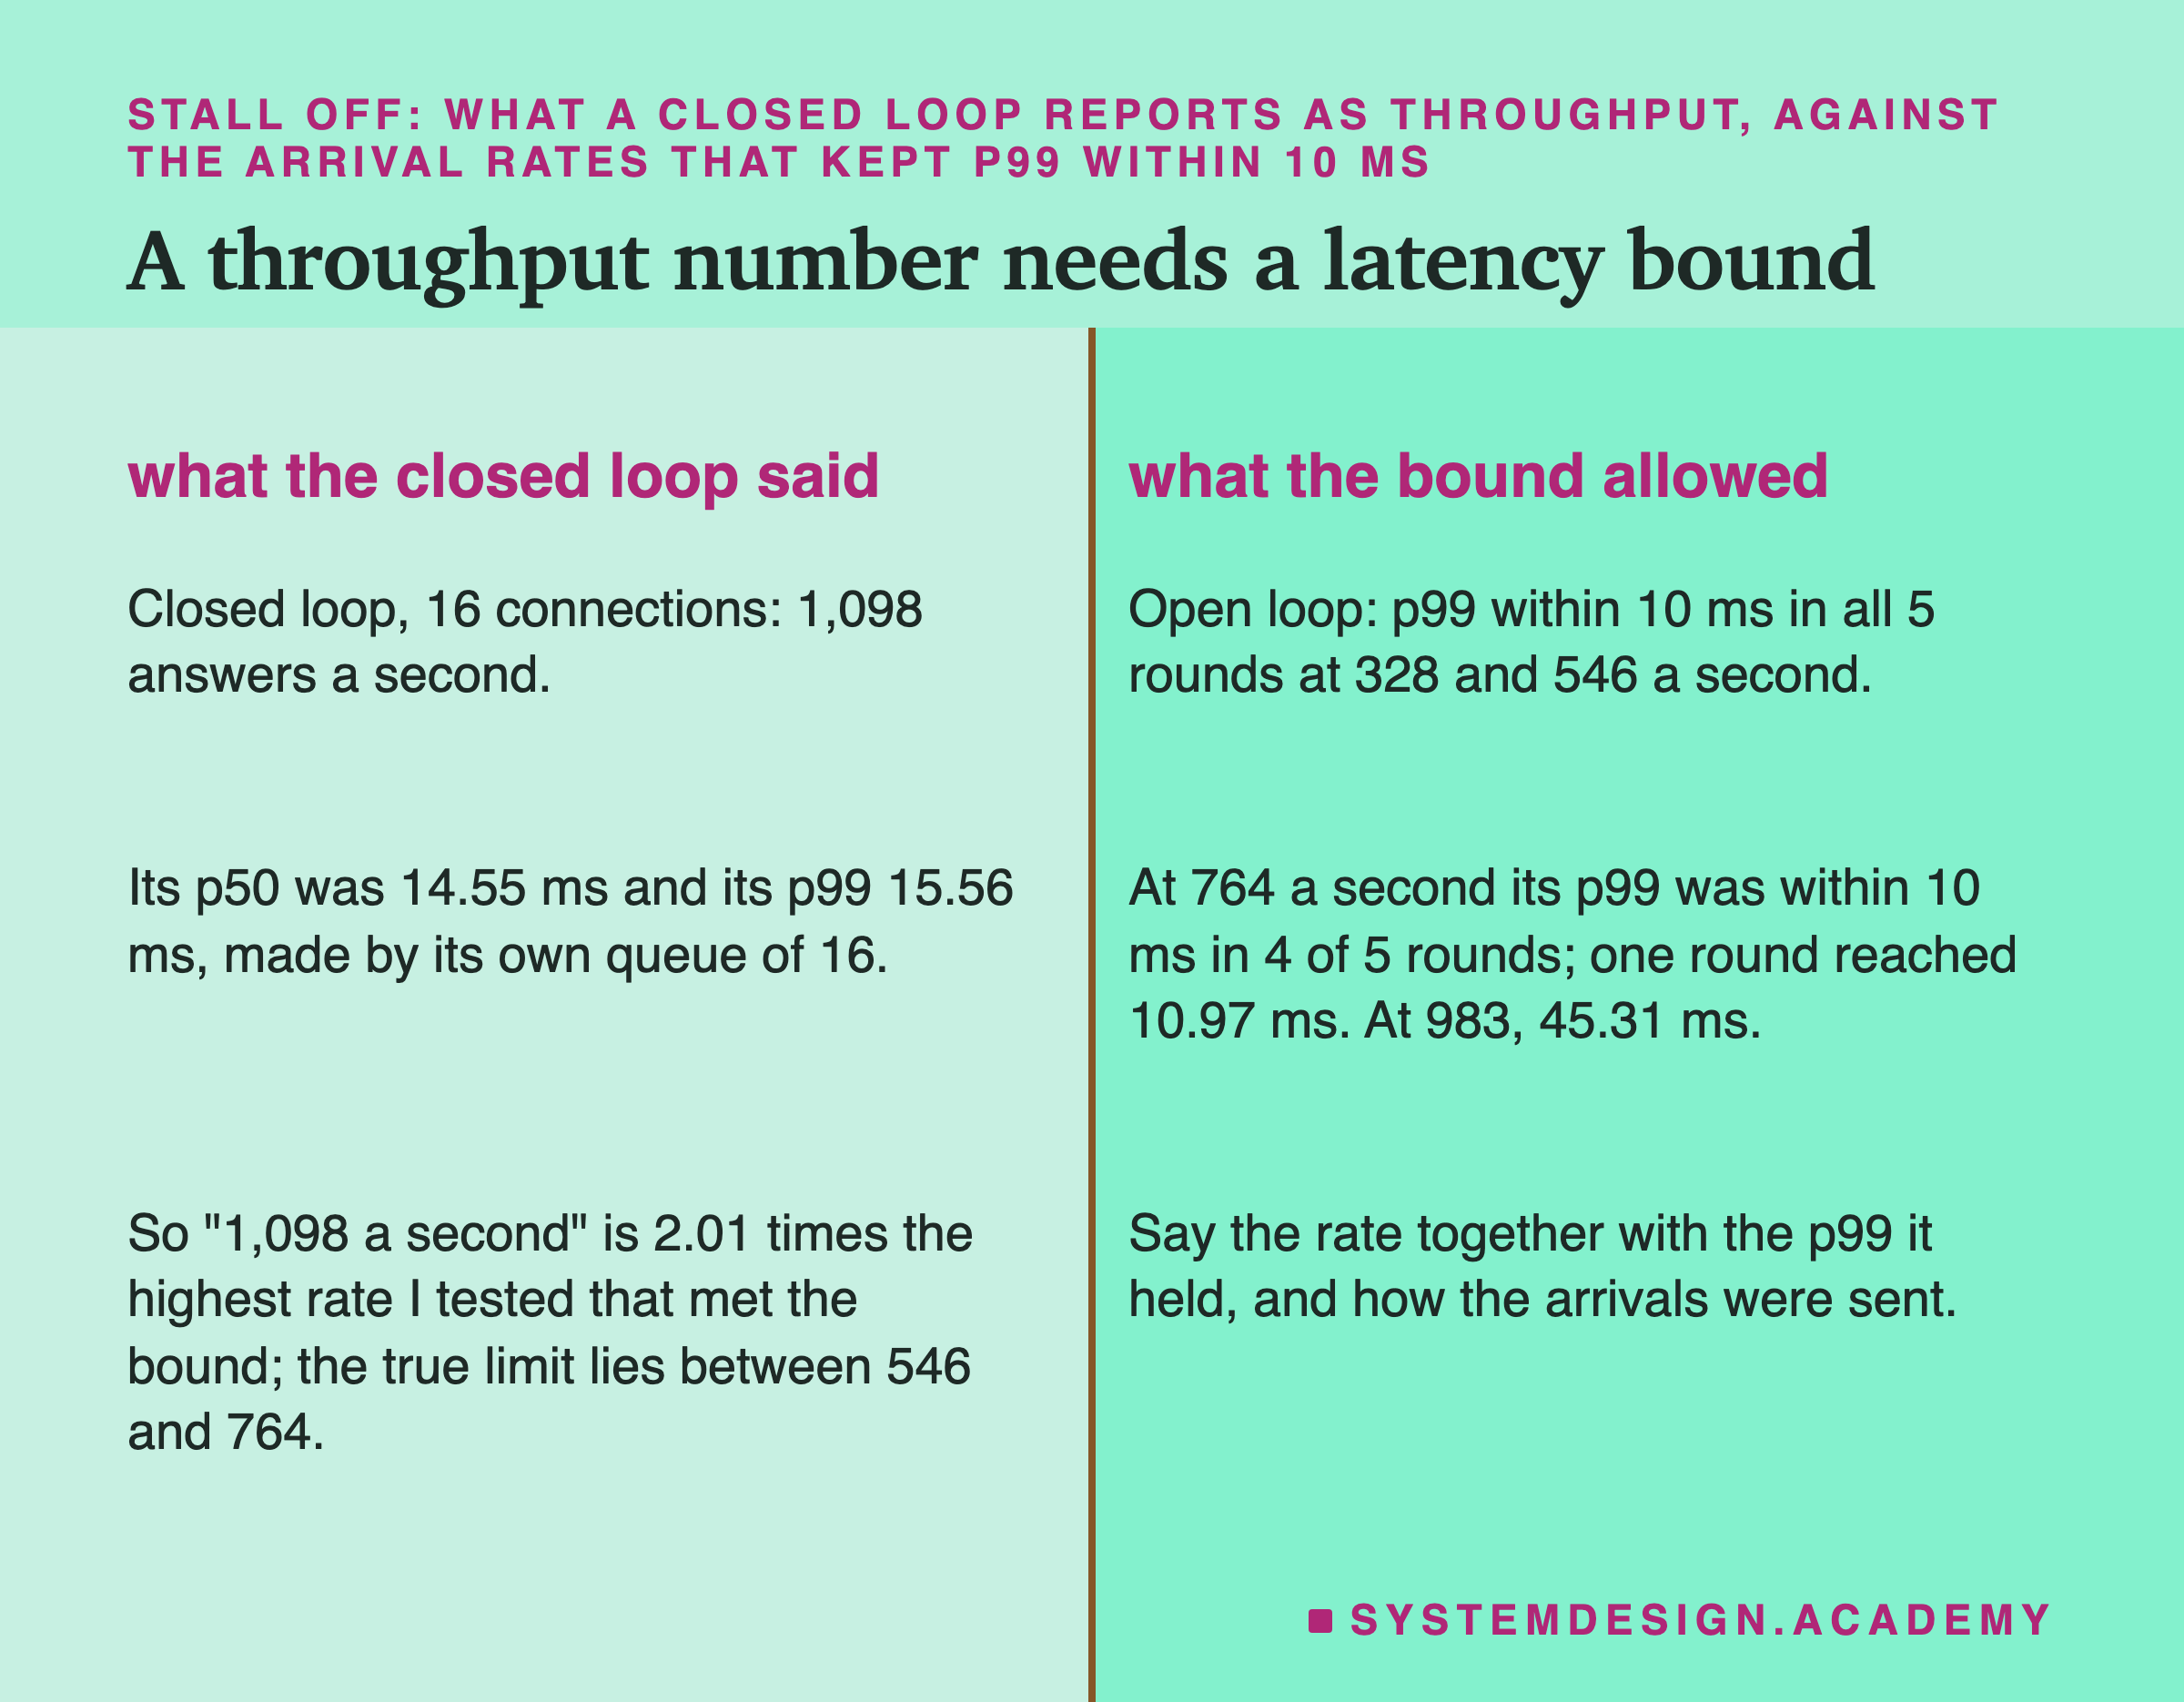
The closed loop with 16 connections, with no stall, reported 1,098 answers a second. That is a true number: the service did answer that many. But every one of those answers waited behind 15 others, so the p50 was 14.55 ms.
With a bound, the answer changes. Before the runs I chose a bound: p99 at most 10 ms. Then I asked the open loop.
At 328 and 546 arrivals a second, the p99 stayed within 10 ms in all five rounds. At 764 a second its p99 was within 10 ms in 4 of 5 rounds; one round reached 10.97 ms. At 983 a second it was 45.31 ms. So the honest statement is "546 a second at a p99 of 5.29 ms", not "1,098 a second". The closed loop's number was 2.01 times the highest rate I tested that met the bound. I tested only 328, 546, 764 and 983 a second, so the true limit lies between 546 and 764 a second.
A throughput number without a latency bound answers the question "how busy can I make it?". Users ask a different question: "how long will I wait?"
Other Lie 4: The Tester Shares the Core
On this box there was no second machine for the tester, so every tester ran on the same one core as the service. Every microsecond the tester used was one the service did not get.
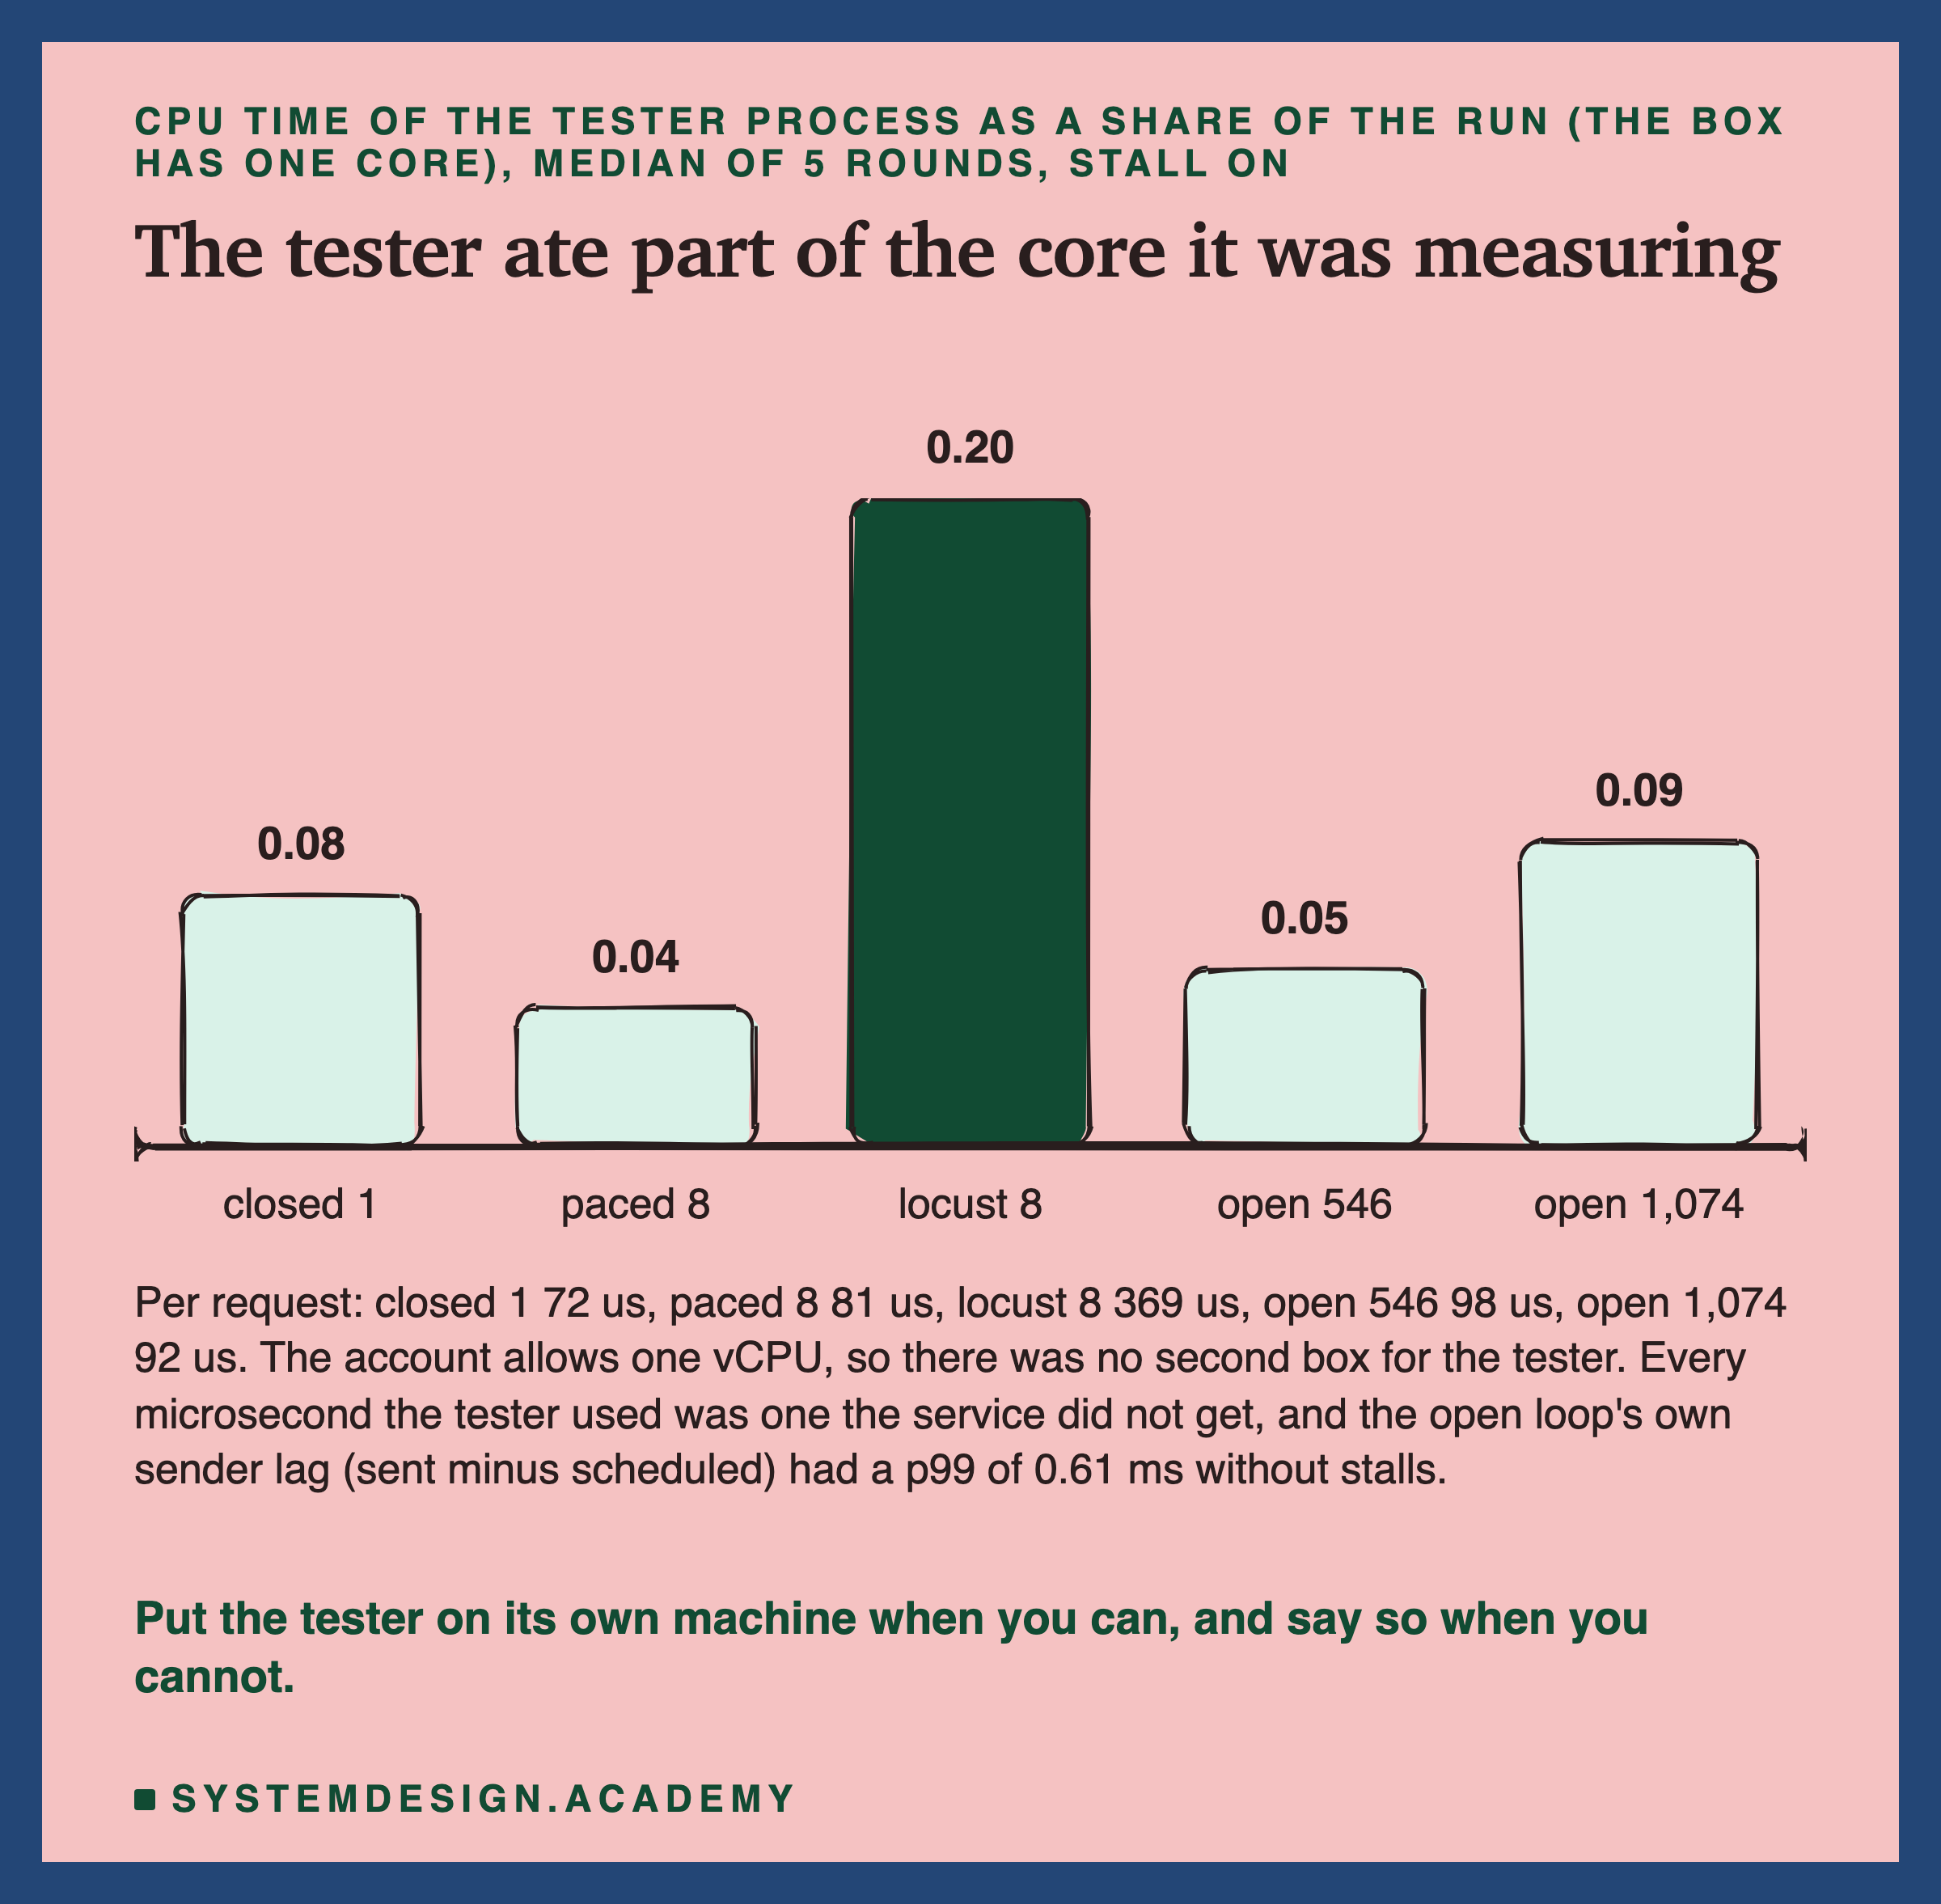
My testers used 0.04 to 0.09 of the core. locust used 0.20, with 369 microseconds of CPU per request against 81 for my paced client, 4.50 times as much, told apart.
The open loop has its own small lie too. It has to send each request at its scheduled moment, but on a shared core it is sometimes a little late. I measured the gap between scheduled and actually sent: with no stall at 546 a second its p99 was 0.61 ms. That lateness is counted in the , because the clock starts at the schedule, which is honest. But it is the tester's time, not the service's.
I cannot show here what a separate tester machine would change, because I could not rent one. What I can say is the size: in these runs the tester took up to a fifth of the core.
One Lie That Turned Out Small: The Warm-Up
The last lie on my list was counting the warm-up. A fresh service is slow on its first requests, so a test that counts them reports a slower service than the one users meet later. I ran the open loop at 546 a second with no stall, counted from the very first request a fresh service ever answered. Then I compared it with the normal runs, which had 400 warm-up requests first.
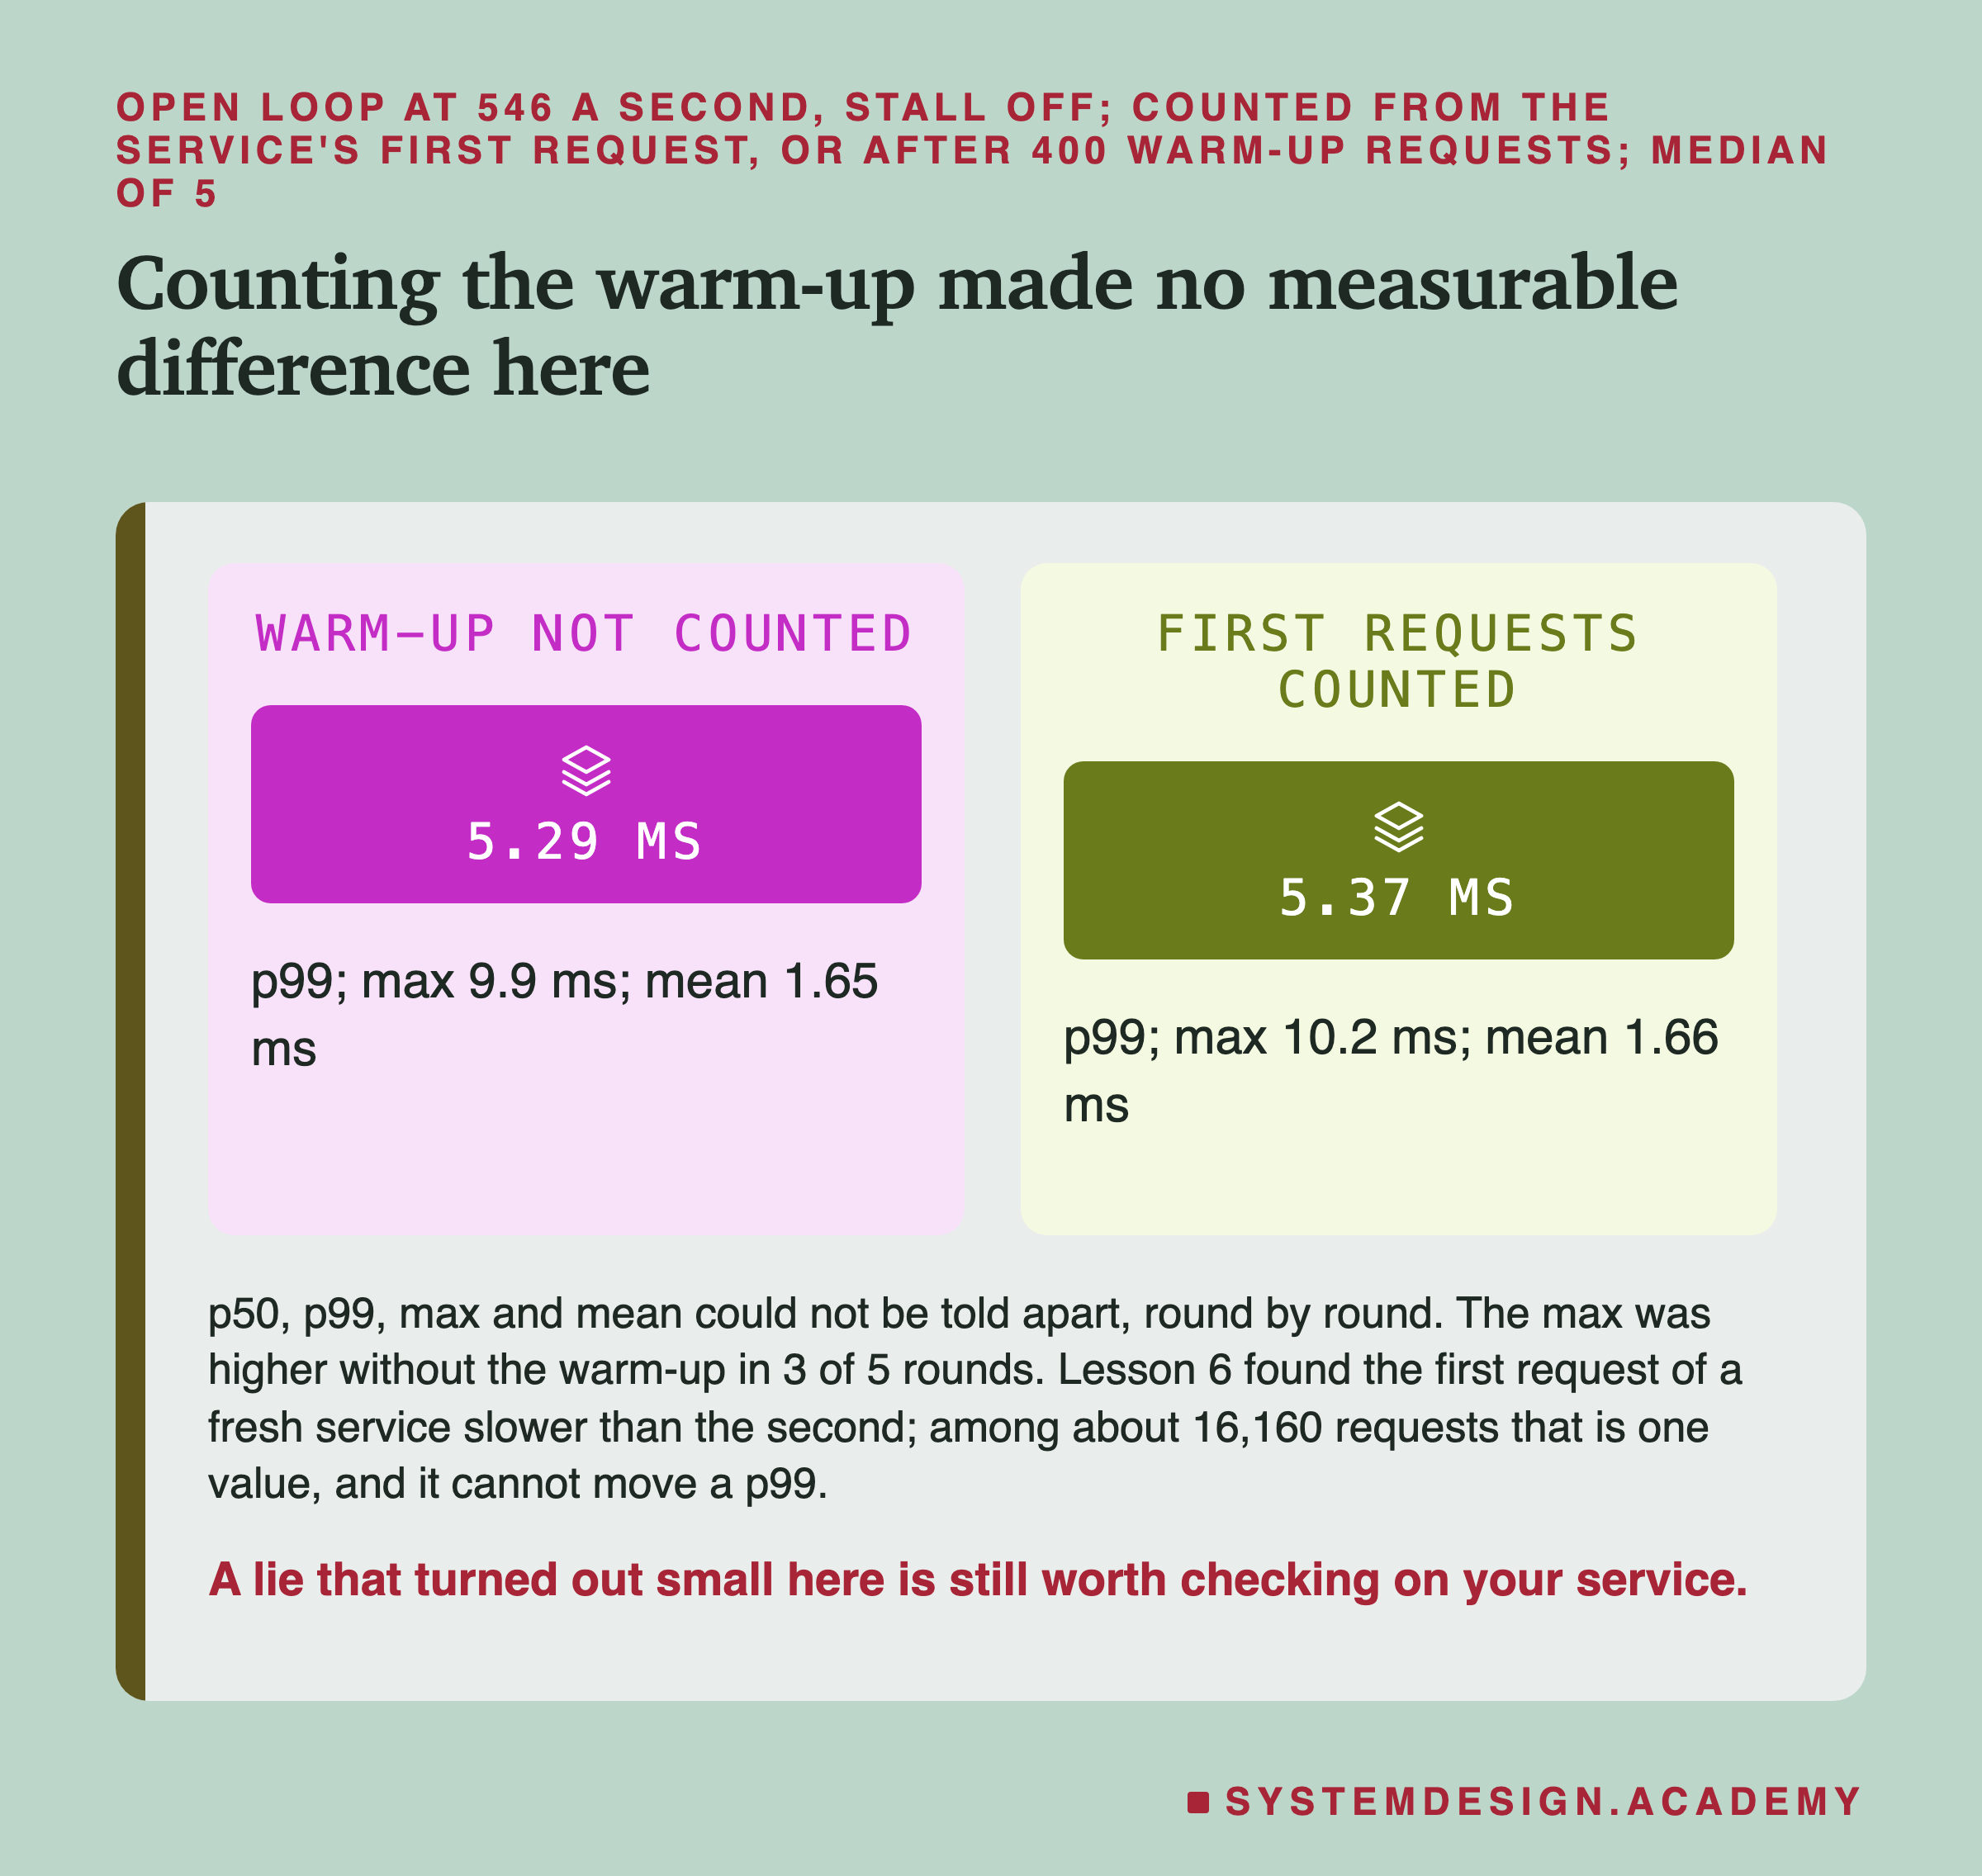
Here it made no measurable difference. The p99 was 5.37 ms against 5.29 ms, the max 10.2 against 9.9 ms, and none of p50, p99, max or mean could be told apart. The max was higher without the warm-up in only 3 of 5 rounds. I had guessed 4 of 5, so that guess was wrong.
The reason is size. A 30-second run at 546 a second holds about 16,000 requests. Even if the first few are slow, they are a handful of values among sixteen thousand. On a service with a slow first minute, such as a large model loading on demand, or with short tests, the warm-up could matter a lot. Check it on your own service rather than trust my small number.
My Eighteen Guesses Before the Run, Checked
I wrote eighteen guesses into the lab before it ran. Each is quoted here word for word from the docstring. Thirteen were right and five were wrong.
-
"G1. S between 1,000 and 1,200 answers a second (lesson 5: 1,077.1)." Right: 1,092.1.
-
"G2. R1 between 0.70 and 0.95 x S." Wrong: 0.984. One connection kept the one core almost as busy as sixteen.
-
"G3. every armed run records all its planned stalls, each between 100 and 110 ms long." Right, 100.0 to 100.1 ms, but only after I fixed my check (see the limits slide).
-
"G4. o5-on p99 between 60 and 100 ms in every round (reasoned: 100 - 0.01 x (1 - 0.5) x 4,000 = 80 ms)." Right: 75.8 to 88.7 ms.
-
"G5. c1-on p99 below 3 ms in every round, below oc-on's p99, told apart; oc-on's at least 20 x c1-on's." Right, but only because the open loop at that rate was overloaded, so this says nothing about the stall.
-
"G6. c1-on p99 at most 1.25 x c1-off p99 in every round (one connection does not see the stall in its p99)." Right: at most 1.006 times.
-
"G7. p5-on p99 below 10 ms in every round; o5-on's at least 5 x p5-on's, told apart." Right.
-
"G8. l5-on p99 (locust's raw response times) below 10 ms in every round; locust's own "99%" within 1 ms of it." Right.
-
"G9. corrected p5-on p99 between 0.8 and 1.2 x o5-on p99 in every round." Wrong: 0.76 to 0.83.
Try It Yourself
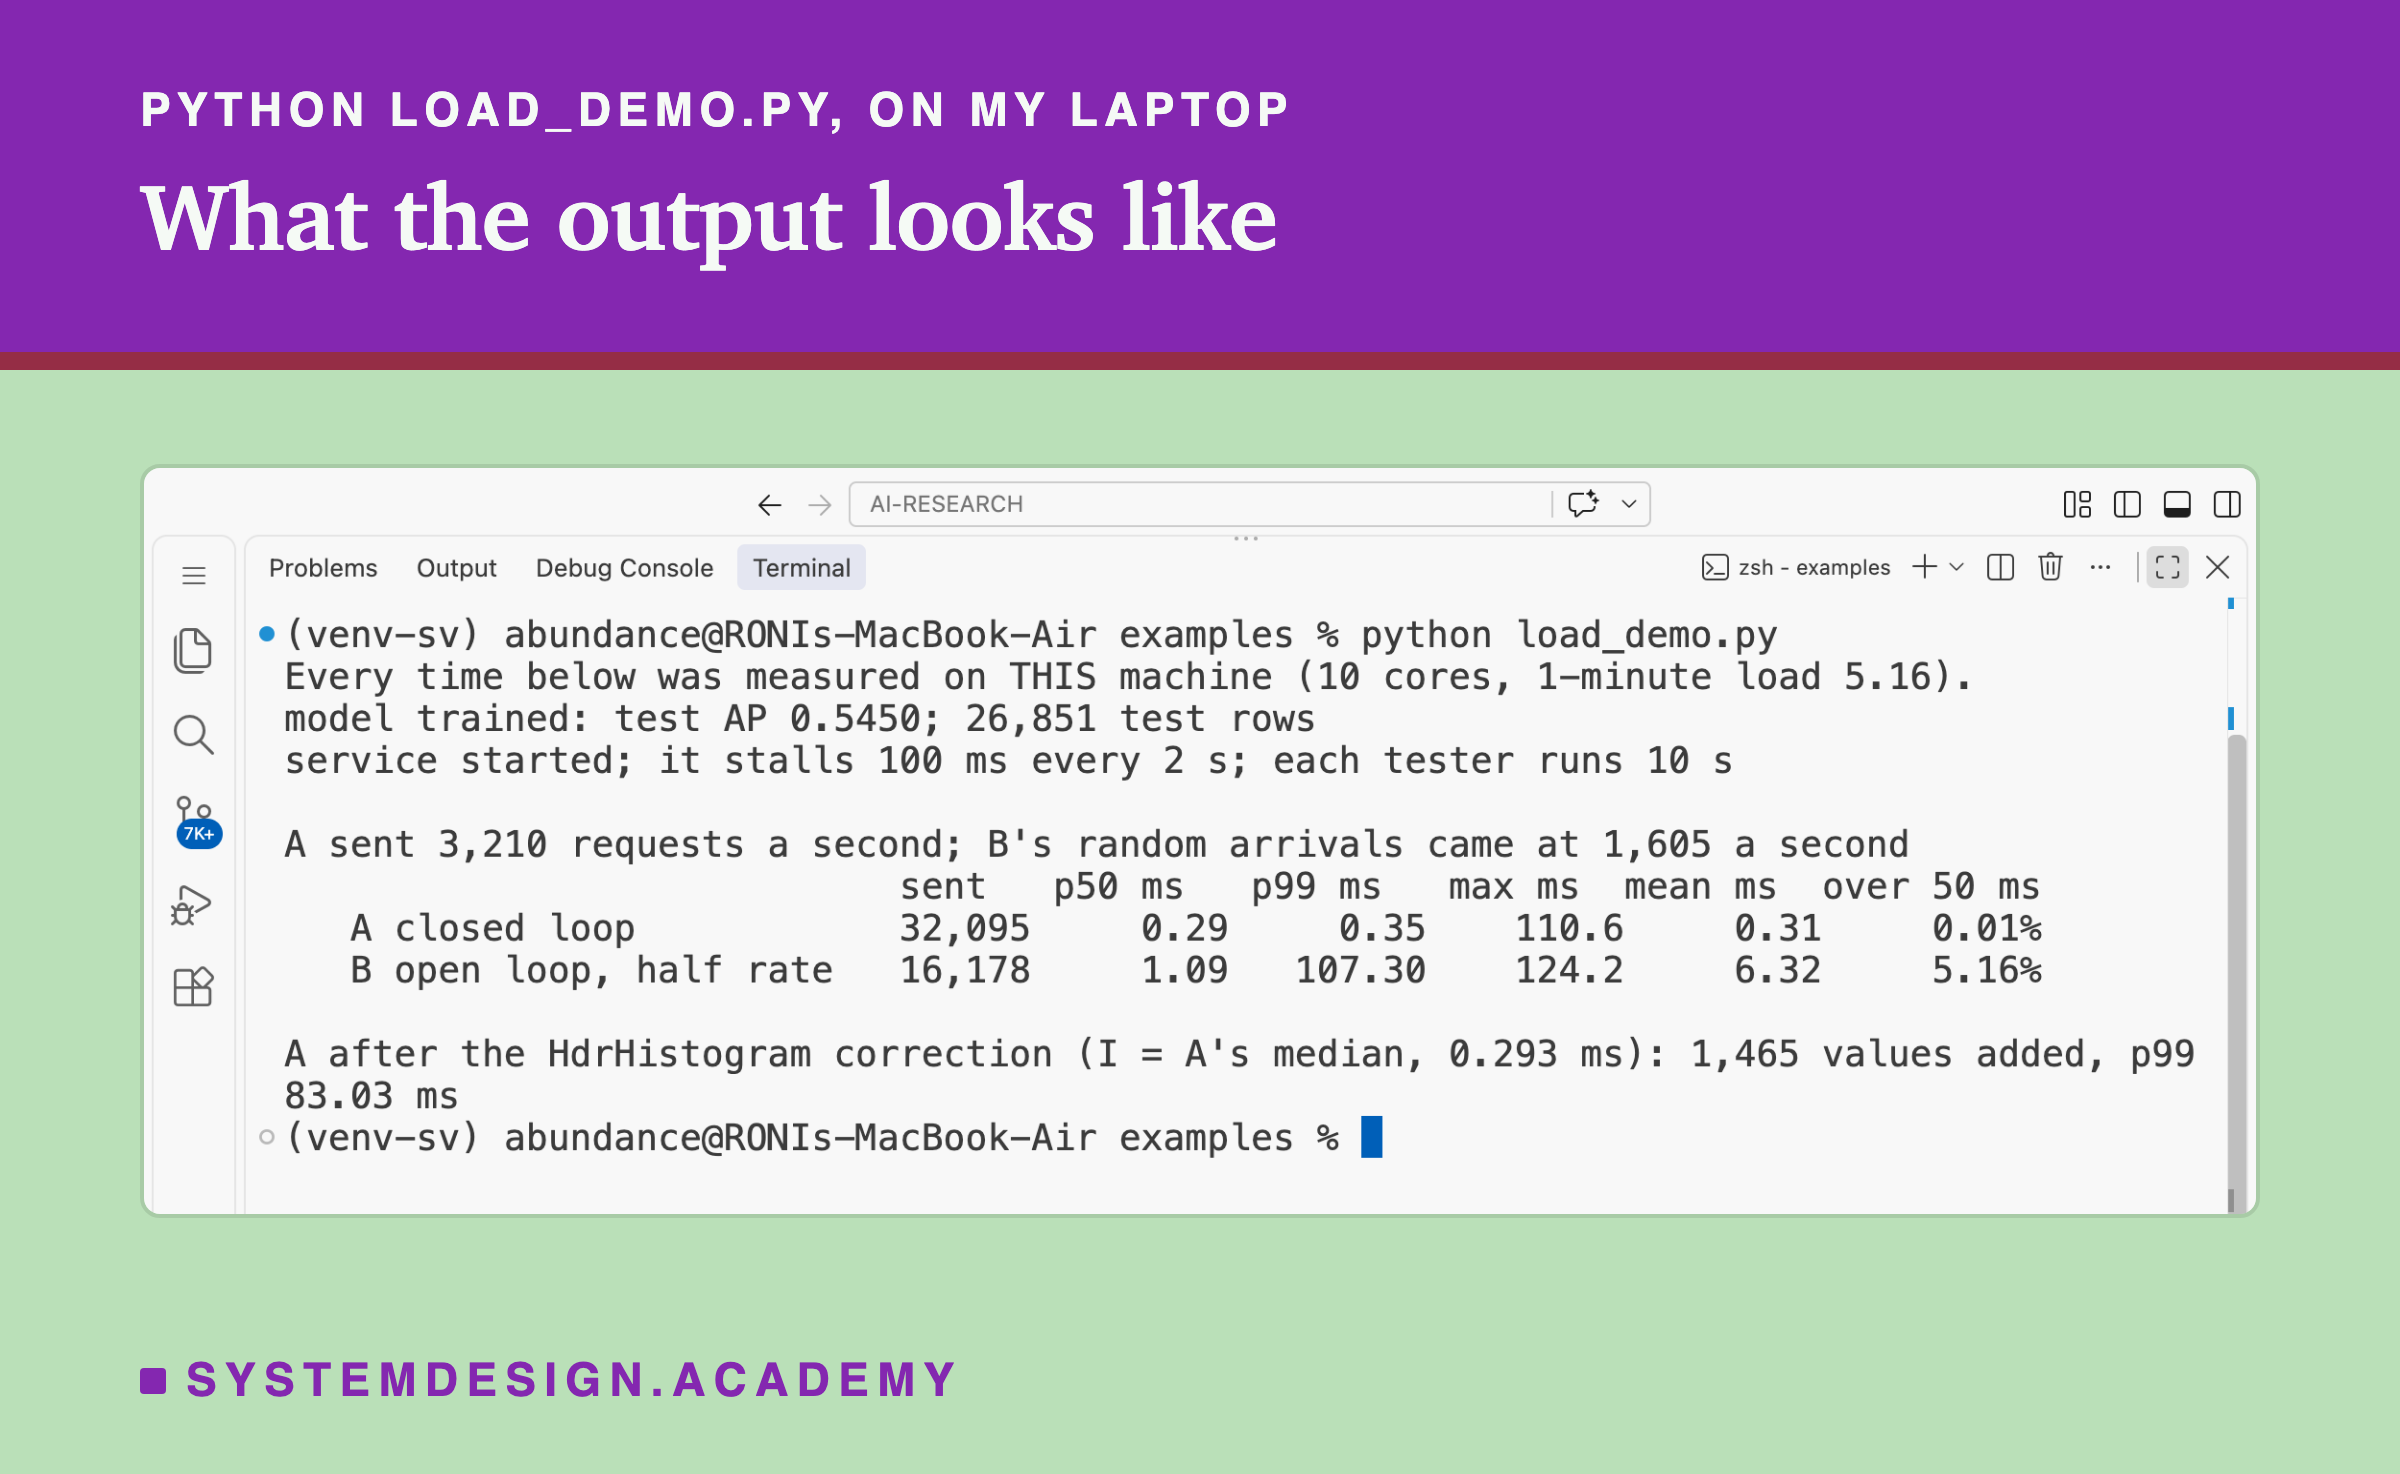
The full lab needs a rented box and about an hour and a half. The demo, load_demo.py, runs on your own computer. It starts a small stalling service and measures it with a closed loop and an open loop.
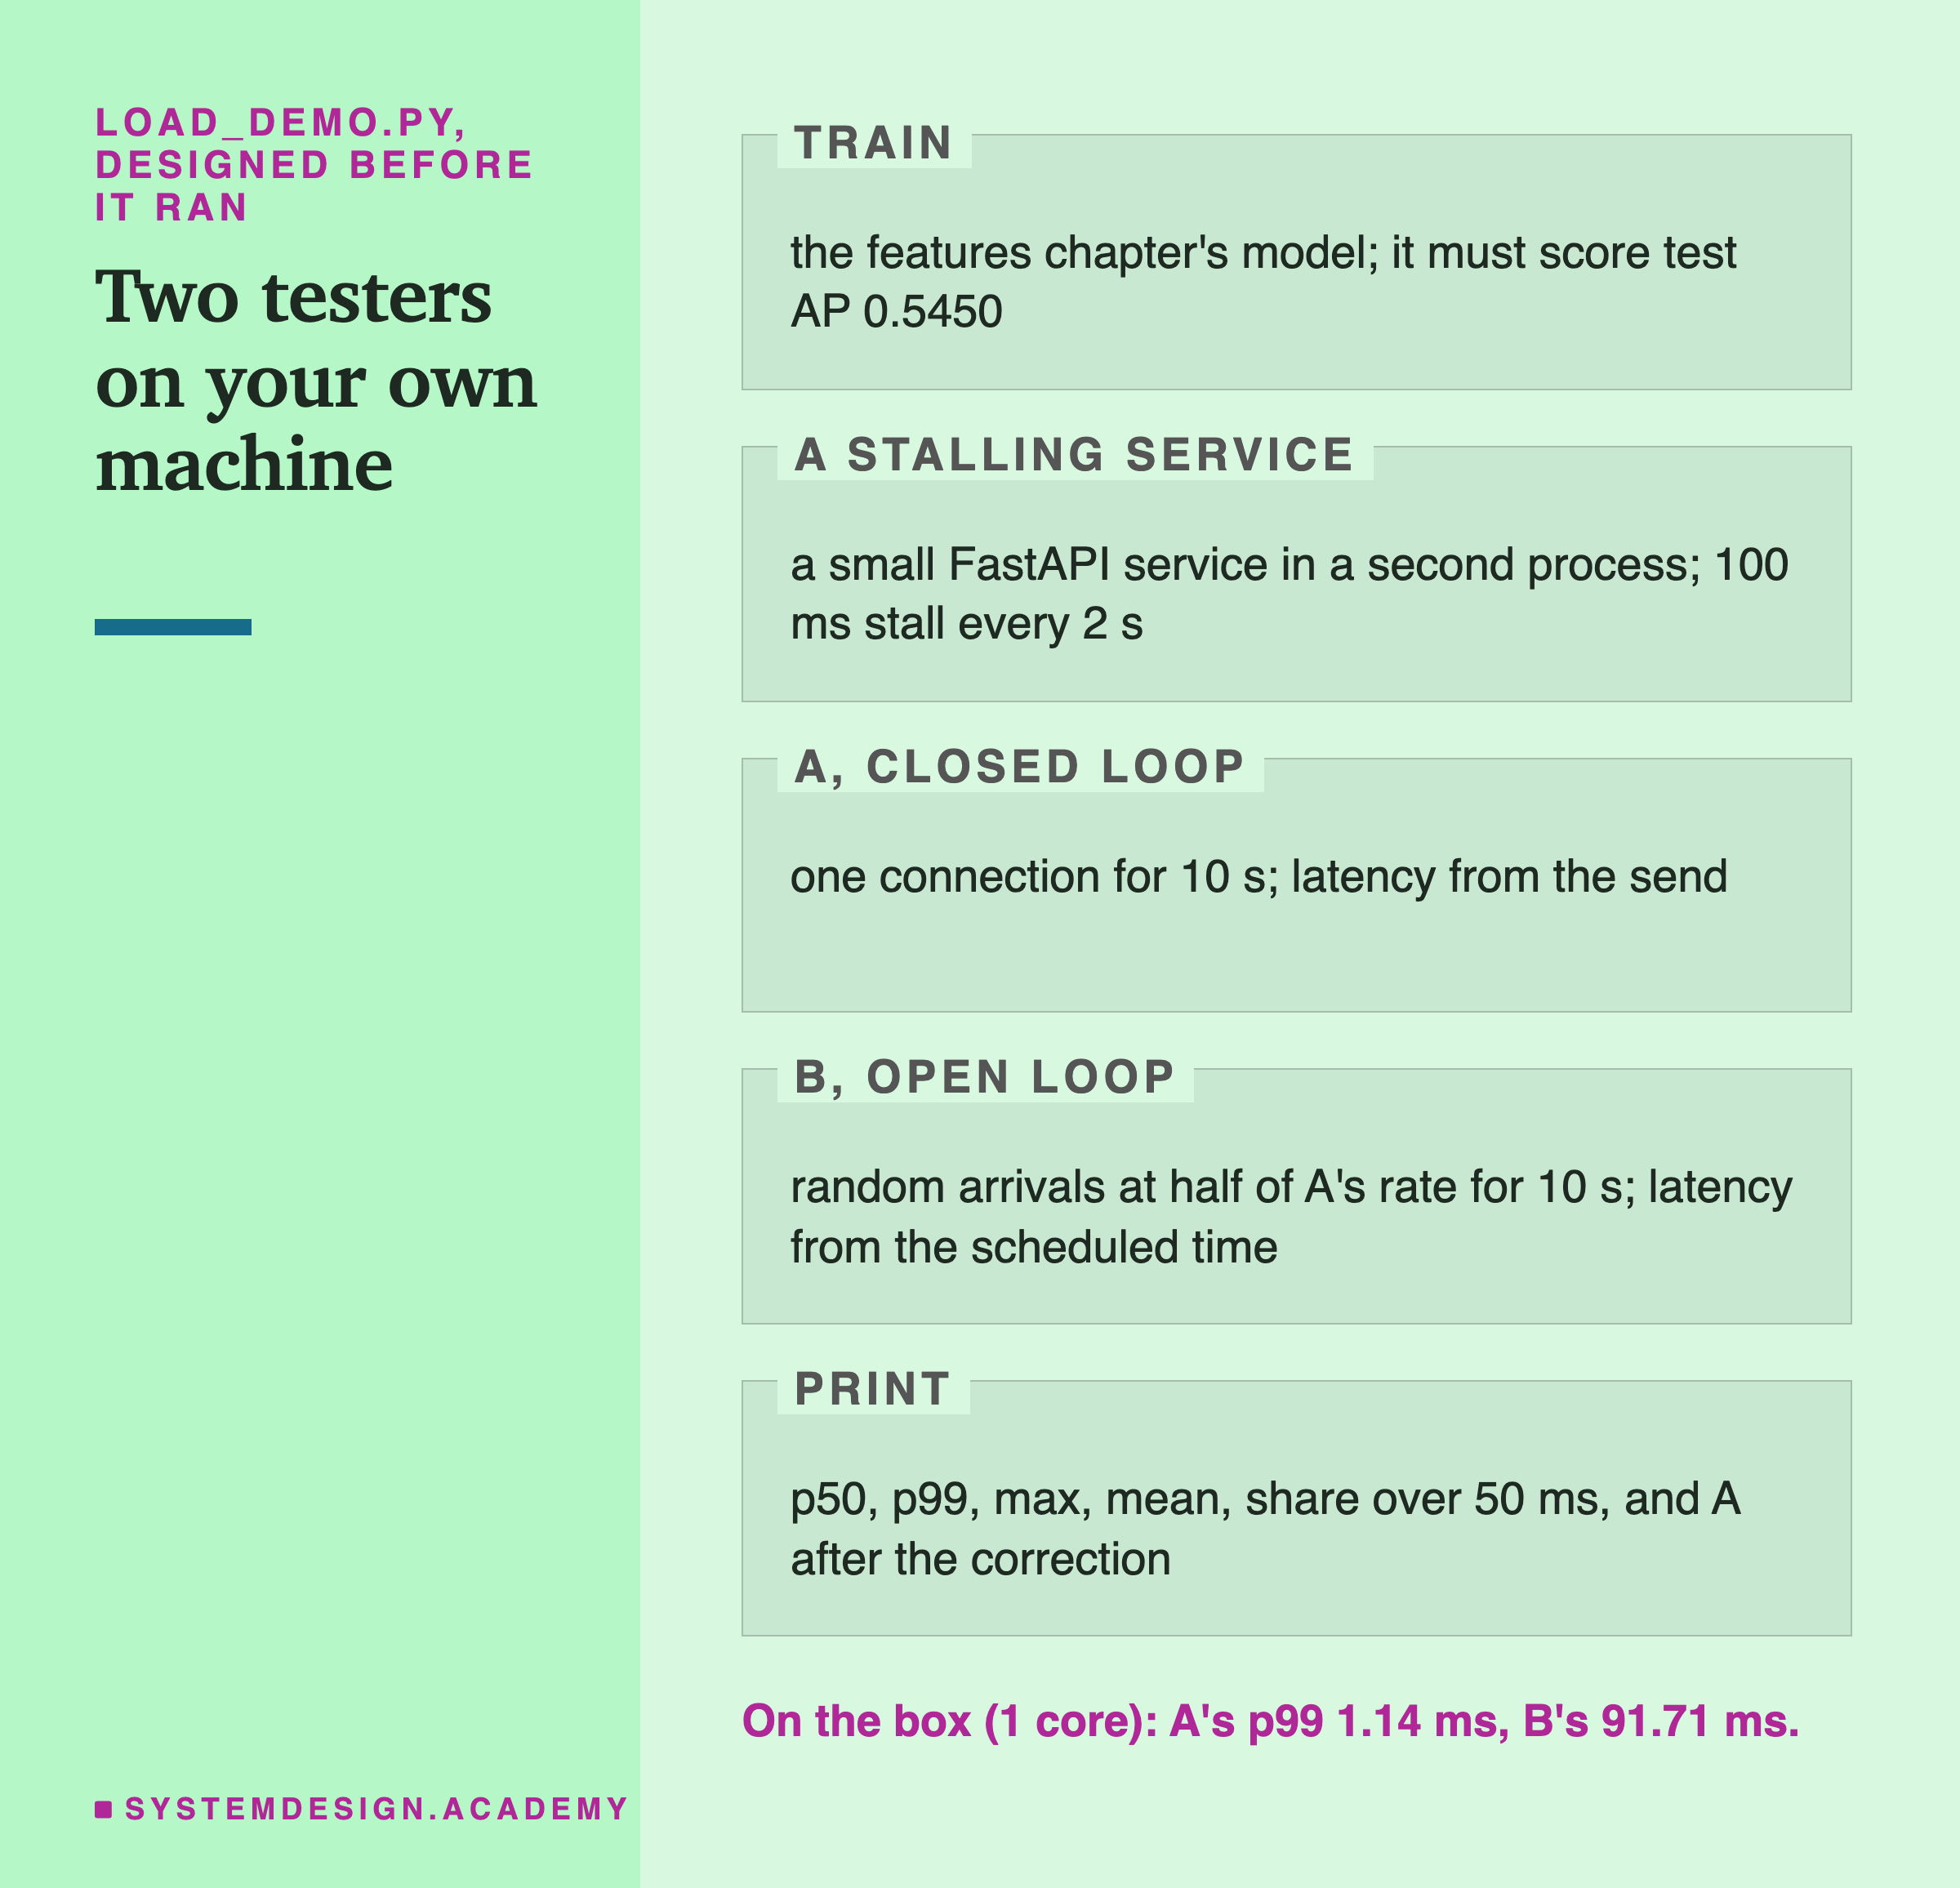
I wrote the demo's design into its docstring after the lab's design and before the demo first ran.
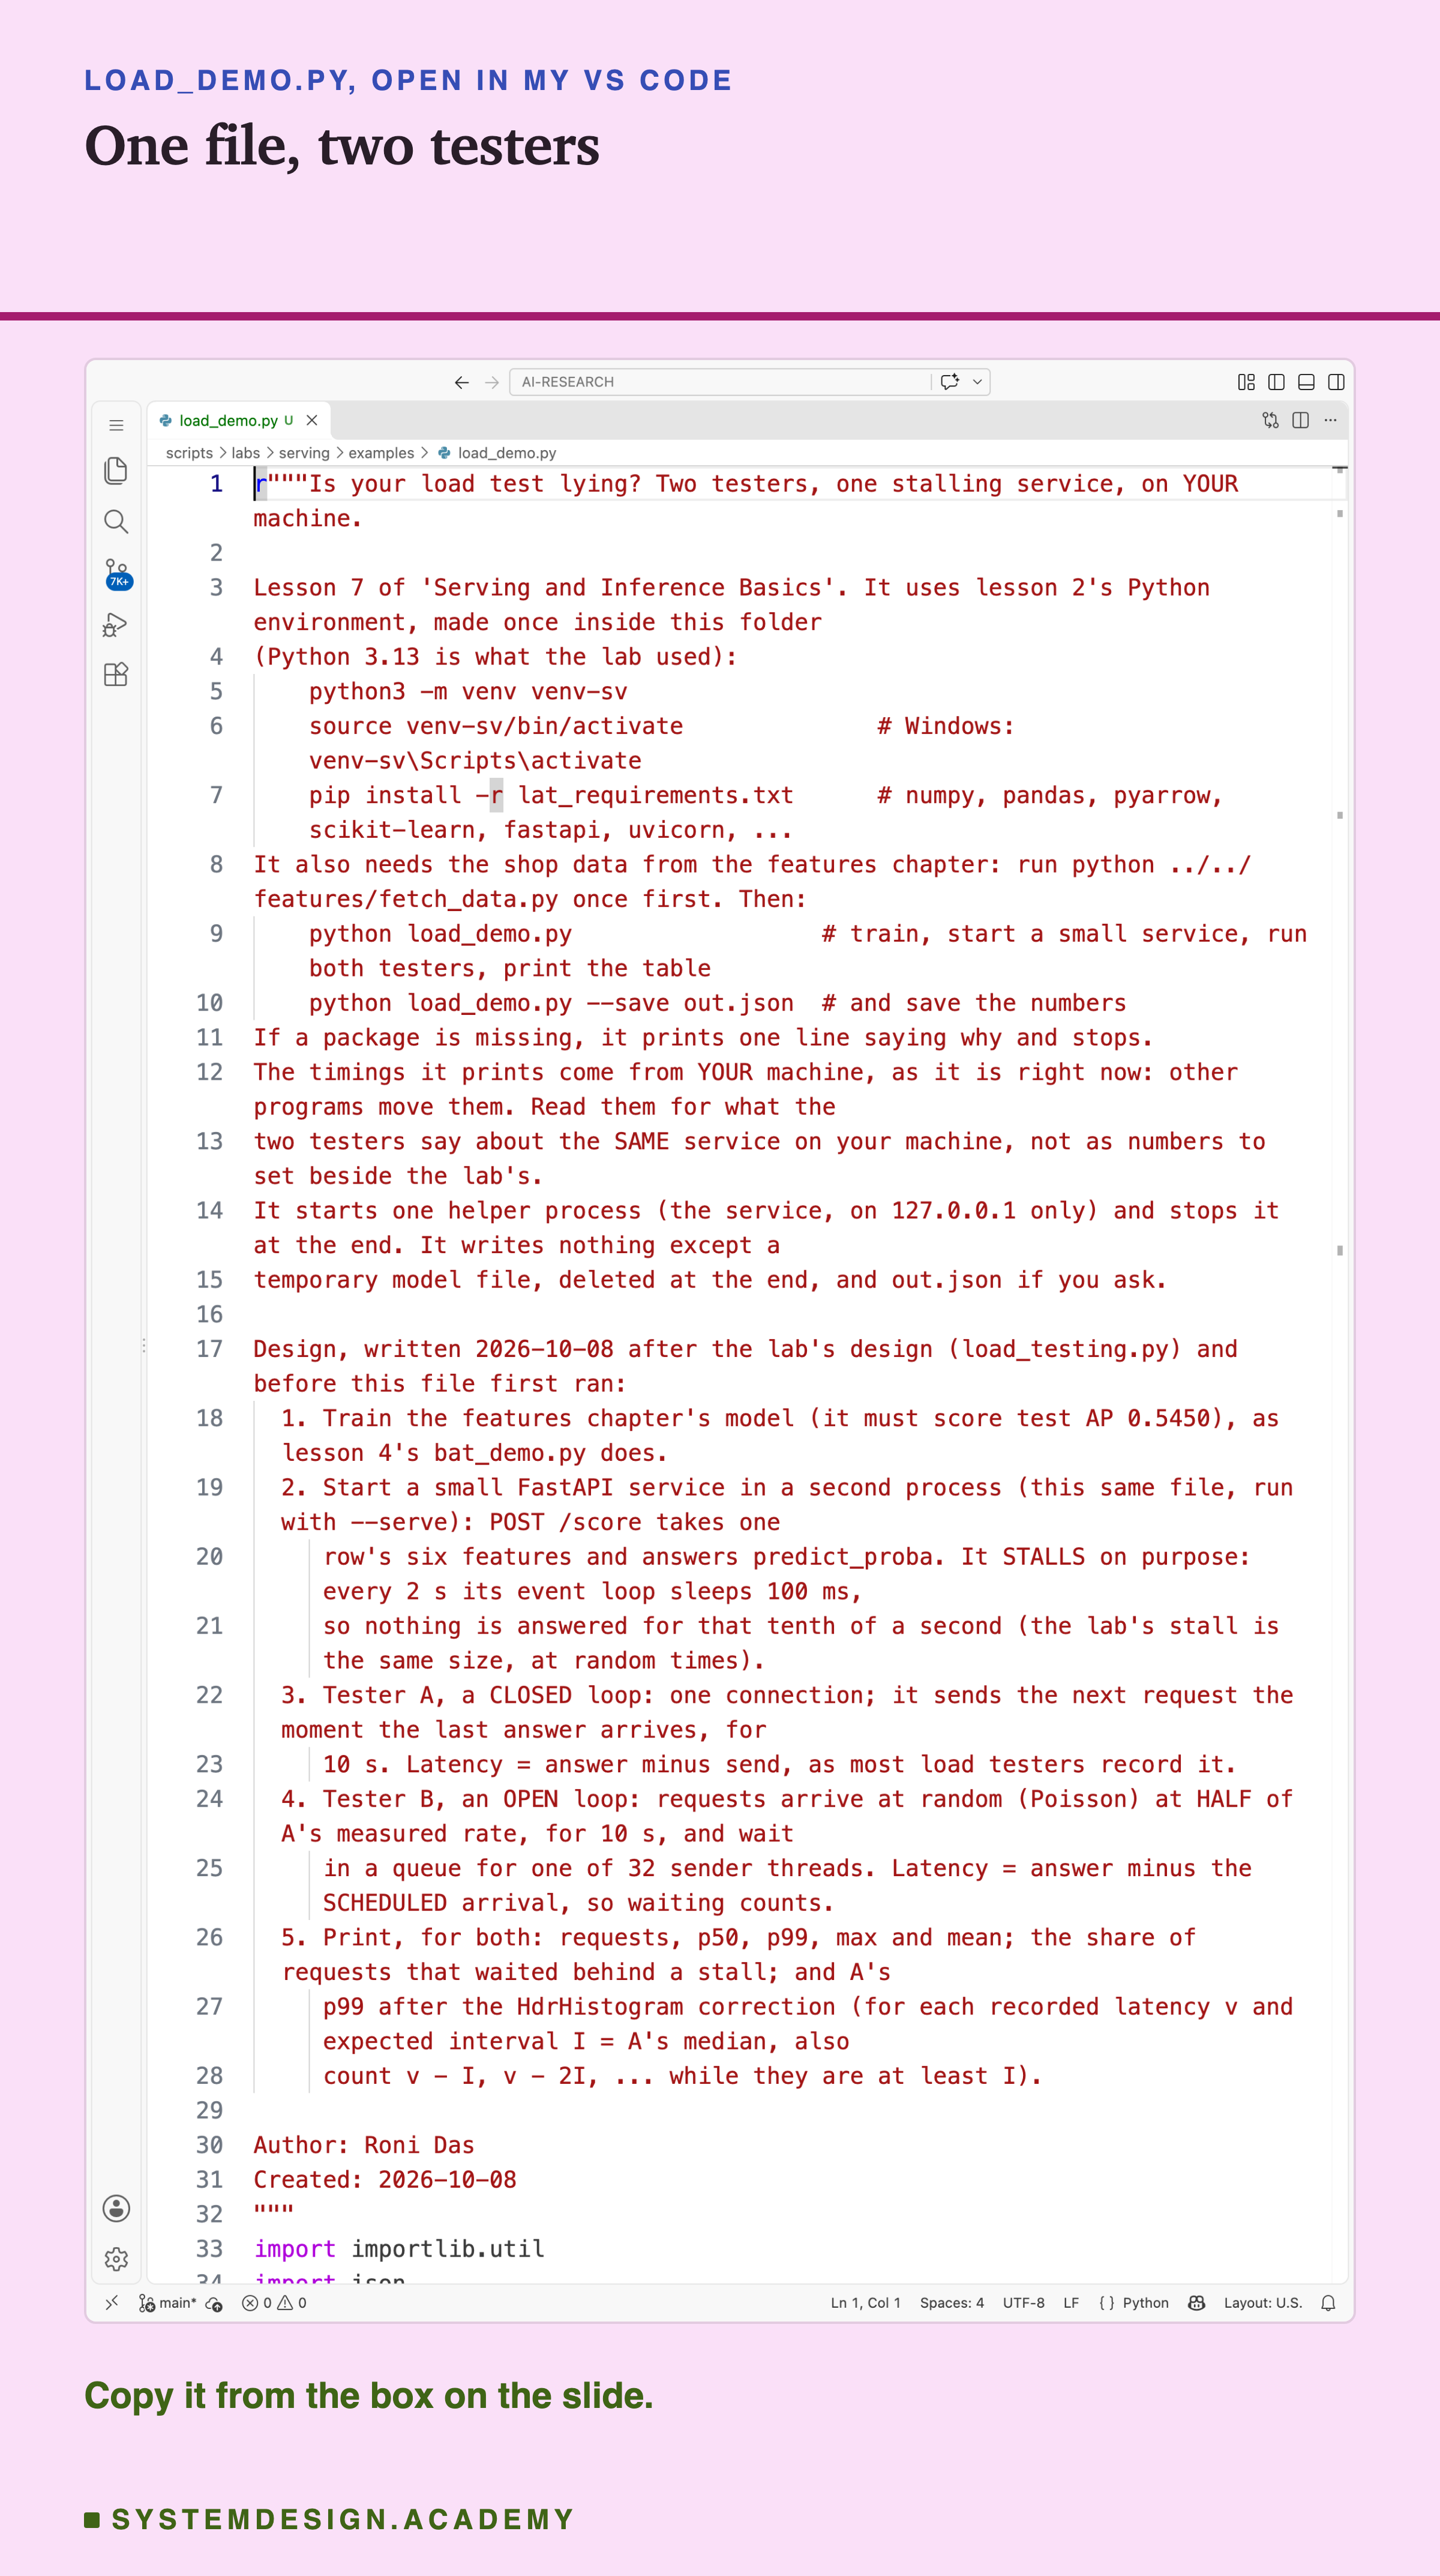
Before you run this lab. The demo uses lesson 2's Python environment, with the same library versions as the lab's box. If you made it for lessons 2 to 6, use it again. If not, make it once, inside the scripts/labs/serving/examples folder:
python3 -m venv venv-sv
source venv-sv/bin/activate        # on Windows: venv-sv\Scripts\activate
pip install -r lat_requirements.txt
I used Python 3.13. Then run python ../../features/fetch_data.py once, which downloads the shop data. Now run python load_demo.py. It needs no GPU and no cloud account. It starts its own small service on your machine only (127.0.0.1) and stops it at the end. If a package is missing, it prints one line saying why and stops.
The first line it prints says the times come from your machine, with its number of cores and its load at that moment. Read the two testers against each other, on your machine. Does the closed loop's p99 stay near its p50? Does the open loop's p99 land near the stall's 100 ms? How close does the correction get?
Simulate a Stalling Server
This box runs in your browser and needs nothing but Python. It is a simulation: a pretend server that answers one request at a time, in the time the lab's box took per request. It stalls for STALL_MS at random moments. A pretend closed loop and a pretend open loop measure it with a pretend clock. It has no model and no network, so it shows the mechanism, not the box's numbers. The box's real p99s are printed under it.
Press Run. Then try CONNS = 64, and watch the closed loop's p99 grow from its own queue. Try RATE = 1000, close to the most this pretend server can answer, and watch the open loop's p99 grow. Try STALL_MS = 0, and the two testers almost agree.
The report script writes this box from the lab's results and runs it. It checks that the simulated open loop sees the stall and the simulated closed loop does not.
The Lab's Code, Piece by Piece
The lab has one file that runs on my laptop, a few small files that run on the box, and the step script you saw above.
load_testing.py, on my laptop, holds the design in its docstring, written before any run. Its commands are check (lesson 2's files match by sha256), status (reads the box's serial console), collect, cost, factcheck and restat. collect calls load_stats.py, which copies the box's raw files into results/load-raw/, passes every log line through load_redact.py, and does all the arithmetic.
load_files/load_service.py is the service. It imports lesson 2's service file unchanged, so the model, the SQLite table and the handler are lesson 2's. It adds the stall. /arm draws the stall times from a seed and schedules each on the event loop. /stalls returns when each one really started and ended.
load_files/load_client.py holds my three testers. The open loop is lesson 4's client, copied with credit. It draws arrival times first, has a sender thread and a receiver thread and 512 kept-alive connections, and times from the scheduled arrival. The closed loop and the paced loop are new. All three check every score against the box's own single-row score.
How to Set Up a Load Test You Can Trust
Here is the order I would follow, using only what this lab measured.
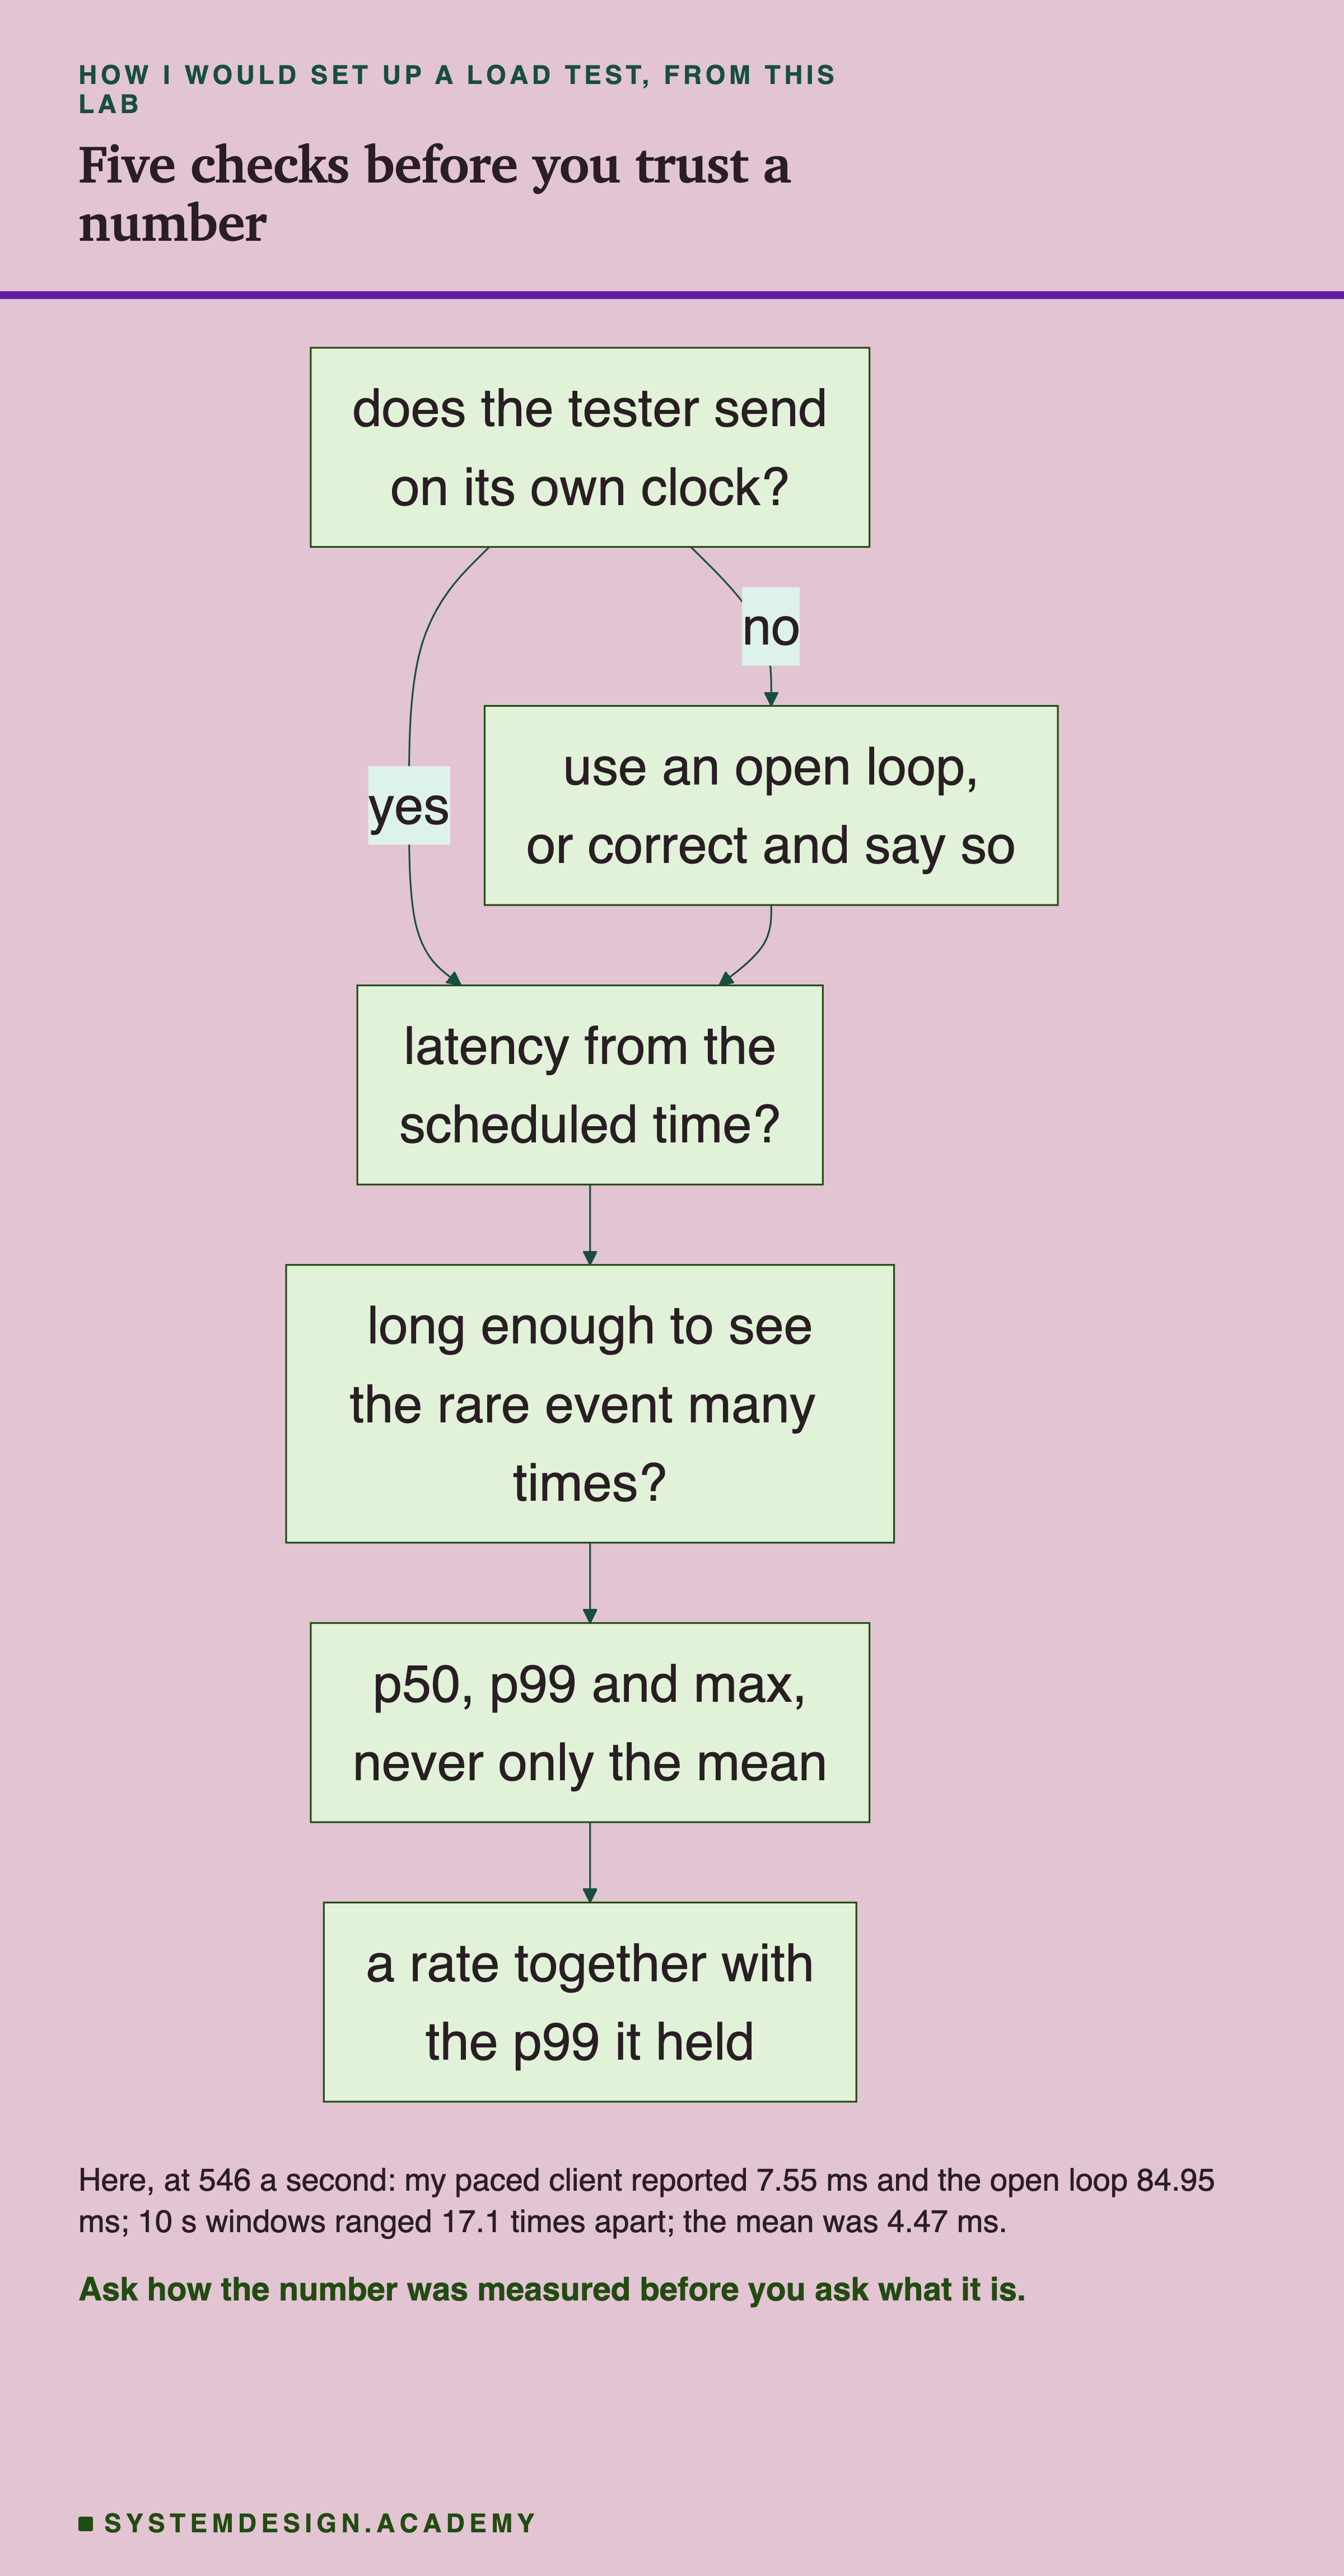
The chart starts with the question this whole lesson is about: does the tester send on its own clock? Here are the same checks in words, each with the number from this lab behind it.
-
Find out your tool's loop. Read its documentation or its source. Does a connection or a user wait for its answer before sending again? Here, locust did, and at 546 a second it reported 9.06 ms against the open loop's 84.95 ms.
-
Time from the schedule. Use a tester that sends on its own clock and times each request from when it should have gone out. If you must use a closed or paced tester, apply the correction and say that you did. Here it reached 0.72 to 0.86 of the truth.
-
Run long enough. Long enough to hold the rare slow event many times. Here, 10-second runs ranged 17.1 times apart, and 120-second runs 1.24 times.
-
Report percentiles. The p50, the p99 and the max, never the mean alone. Here the mean was 4.47 ms while the p99 was 84.95 ms.
-
Give a rate with its bound. Say "546 a second at a p99 of 5.29 ms", and say how the arrivals were sent. Here a closed loop said 1,098 a second, 2.01 times the rate that met a 10 ms bound.
-
Say where the tester ran. Here it shared the one core, and took up to a fifth of it.
When Each Kind of Tester Is the Right One
A closed loop is right for one question: the most a service can answer. Keep enough connections busy and you learn its ceiling, as lessons 4 and 5 did. Its latencies are then mostly its own queue, so do not report them as what users see.
An open loop is right when you want to know what users will wait. Users do not wait for each other before they click. They arrive on their own, and an open loop copies that. Here it was the only tester whose p99 showed the stalls at every rate.
A paced loop, such as locust with constant_pacing, is right for scripted user journeys. In those, each step really does wait for the last: log in, then search, then buy. There it models one user honestly. But a fleet of such users still goes quiet together when the service stalls, so its percentiles can miss the stall. Here it reported 7.55 ms and 9.06 ms where the open loop said 84.95 ms.
The correction is right when you cannot change the tester. It moved the paced results most of the way, to 0.72 to 0.86 of the truth. It is an estimate, and it needs an expected interval you choose.
None of them is right at a rate the service cannot hold. At 1,074 arrivals a second, near this service's limit with stalls, the open loop kept up in 1 of 5 rounds. Its p99 only described a growing queue.
What This Lab Cannot Tell You
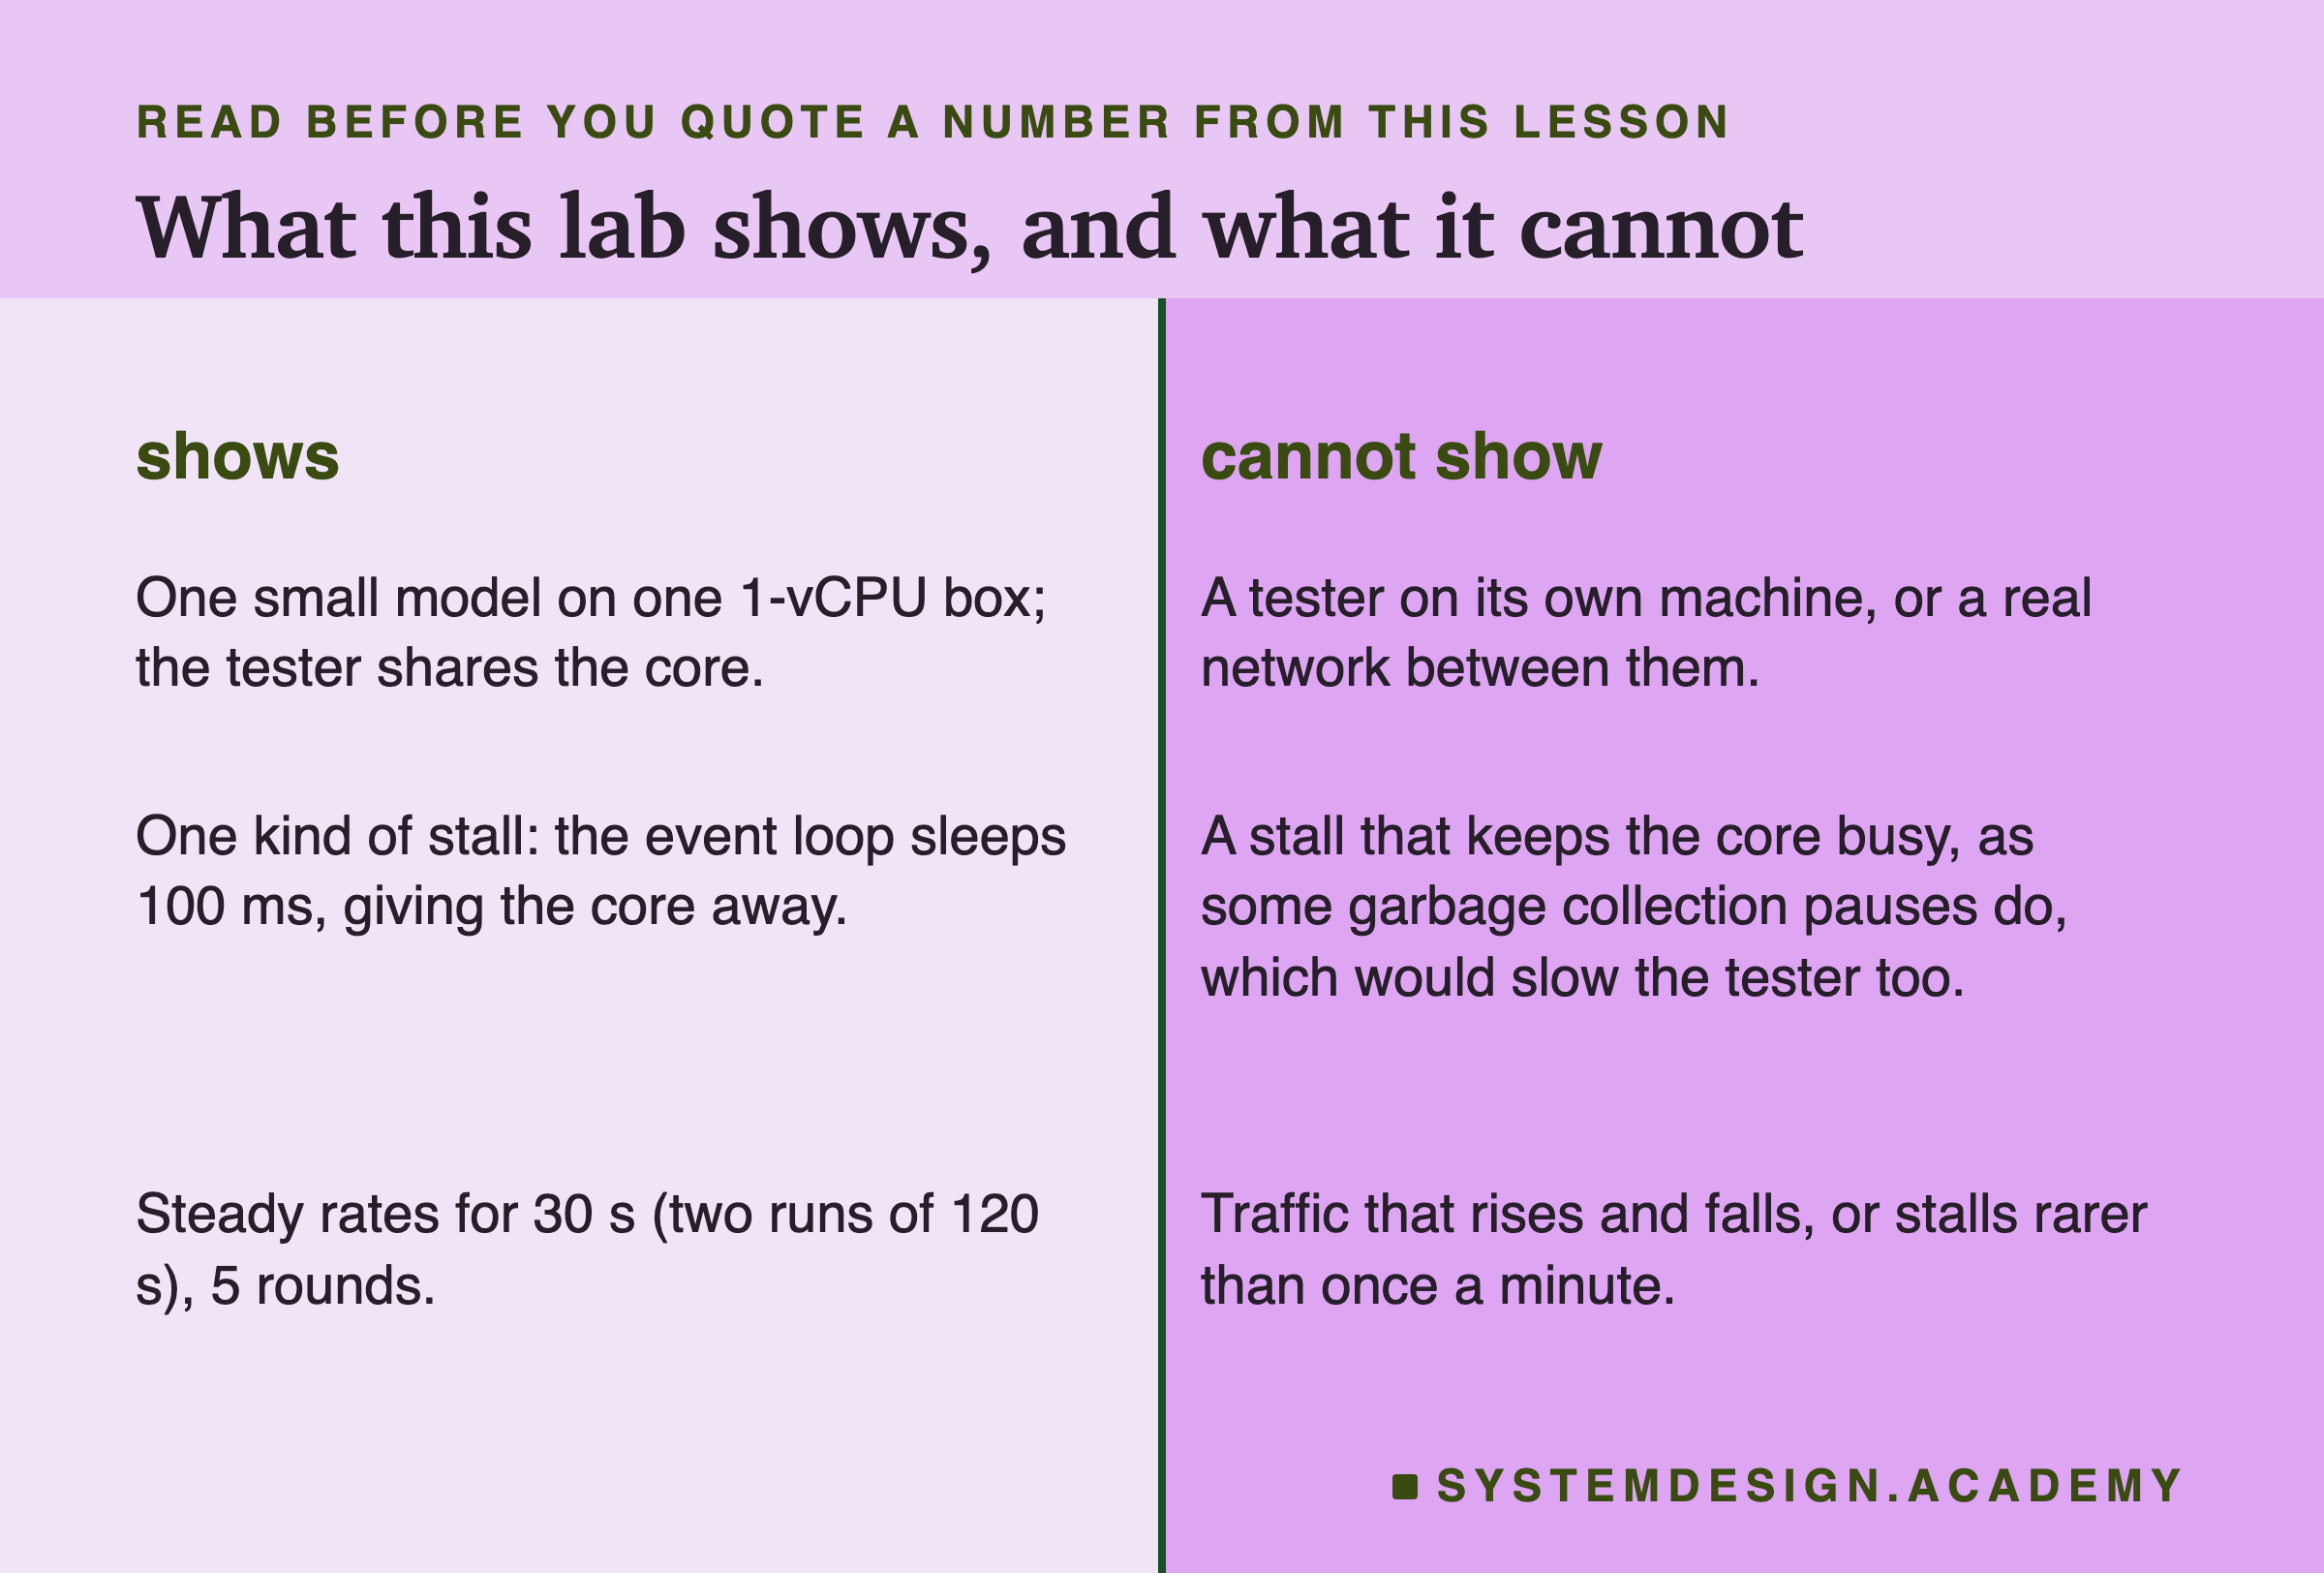
One core, and the tester on it. The account's limit made this a one-core lesson. With the tester on another machine, a real network would add its own delays and the service would get the whole core.
One kind of stall. My stall sleeps, so it gives the core to the tester. A stall that burns the core would also slow the tester on the same core, which is a different lie that I did not test.
Rates near the limit. The open loop at 1,074 a second, the rate the one-connection tester reached, kept up in only 1 of 5 rounds. So for the closed loop with one connection I have no clean "true" p99 to compare with, only a queue that grew for the whole run.
Labelled changes after the results. My first check of the stalls compared every PLANNED stall with the ones that happened. But the service plans stalls up to 2 seconds past the end of a run. So in 12 of 55 armed runs, one planned stall fell after the run had ended and was counted as missing. I changed the check to "every stall planned inside the counted part happened", and then it held. The leak scan's address pattern was narrowed after it matched a version string, as the report slide says. The step 2 and step 5 recordings were each the second try.
What to Do on Monday
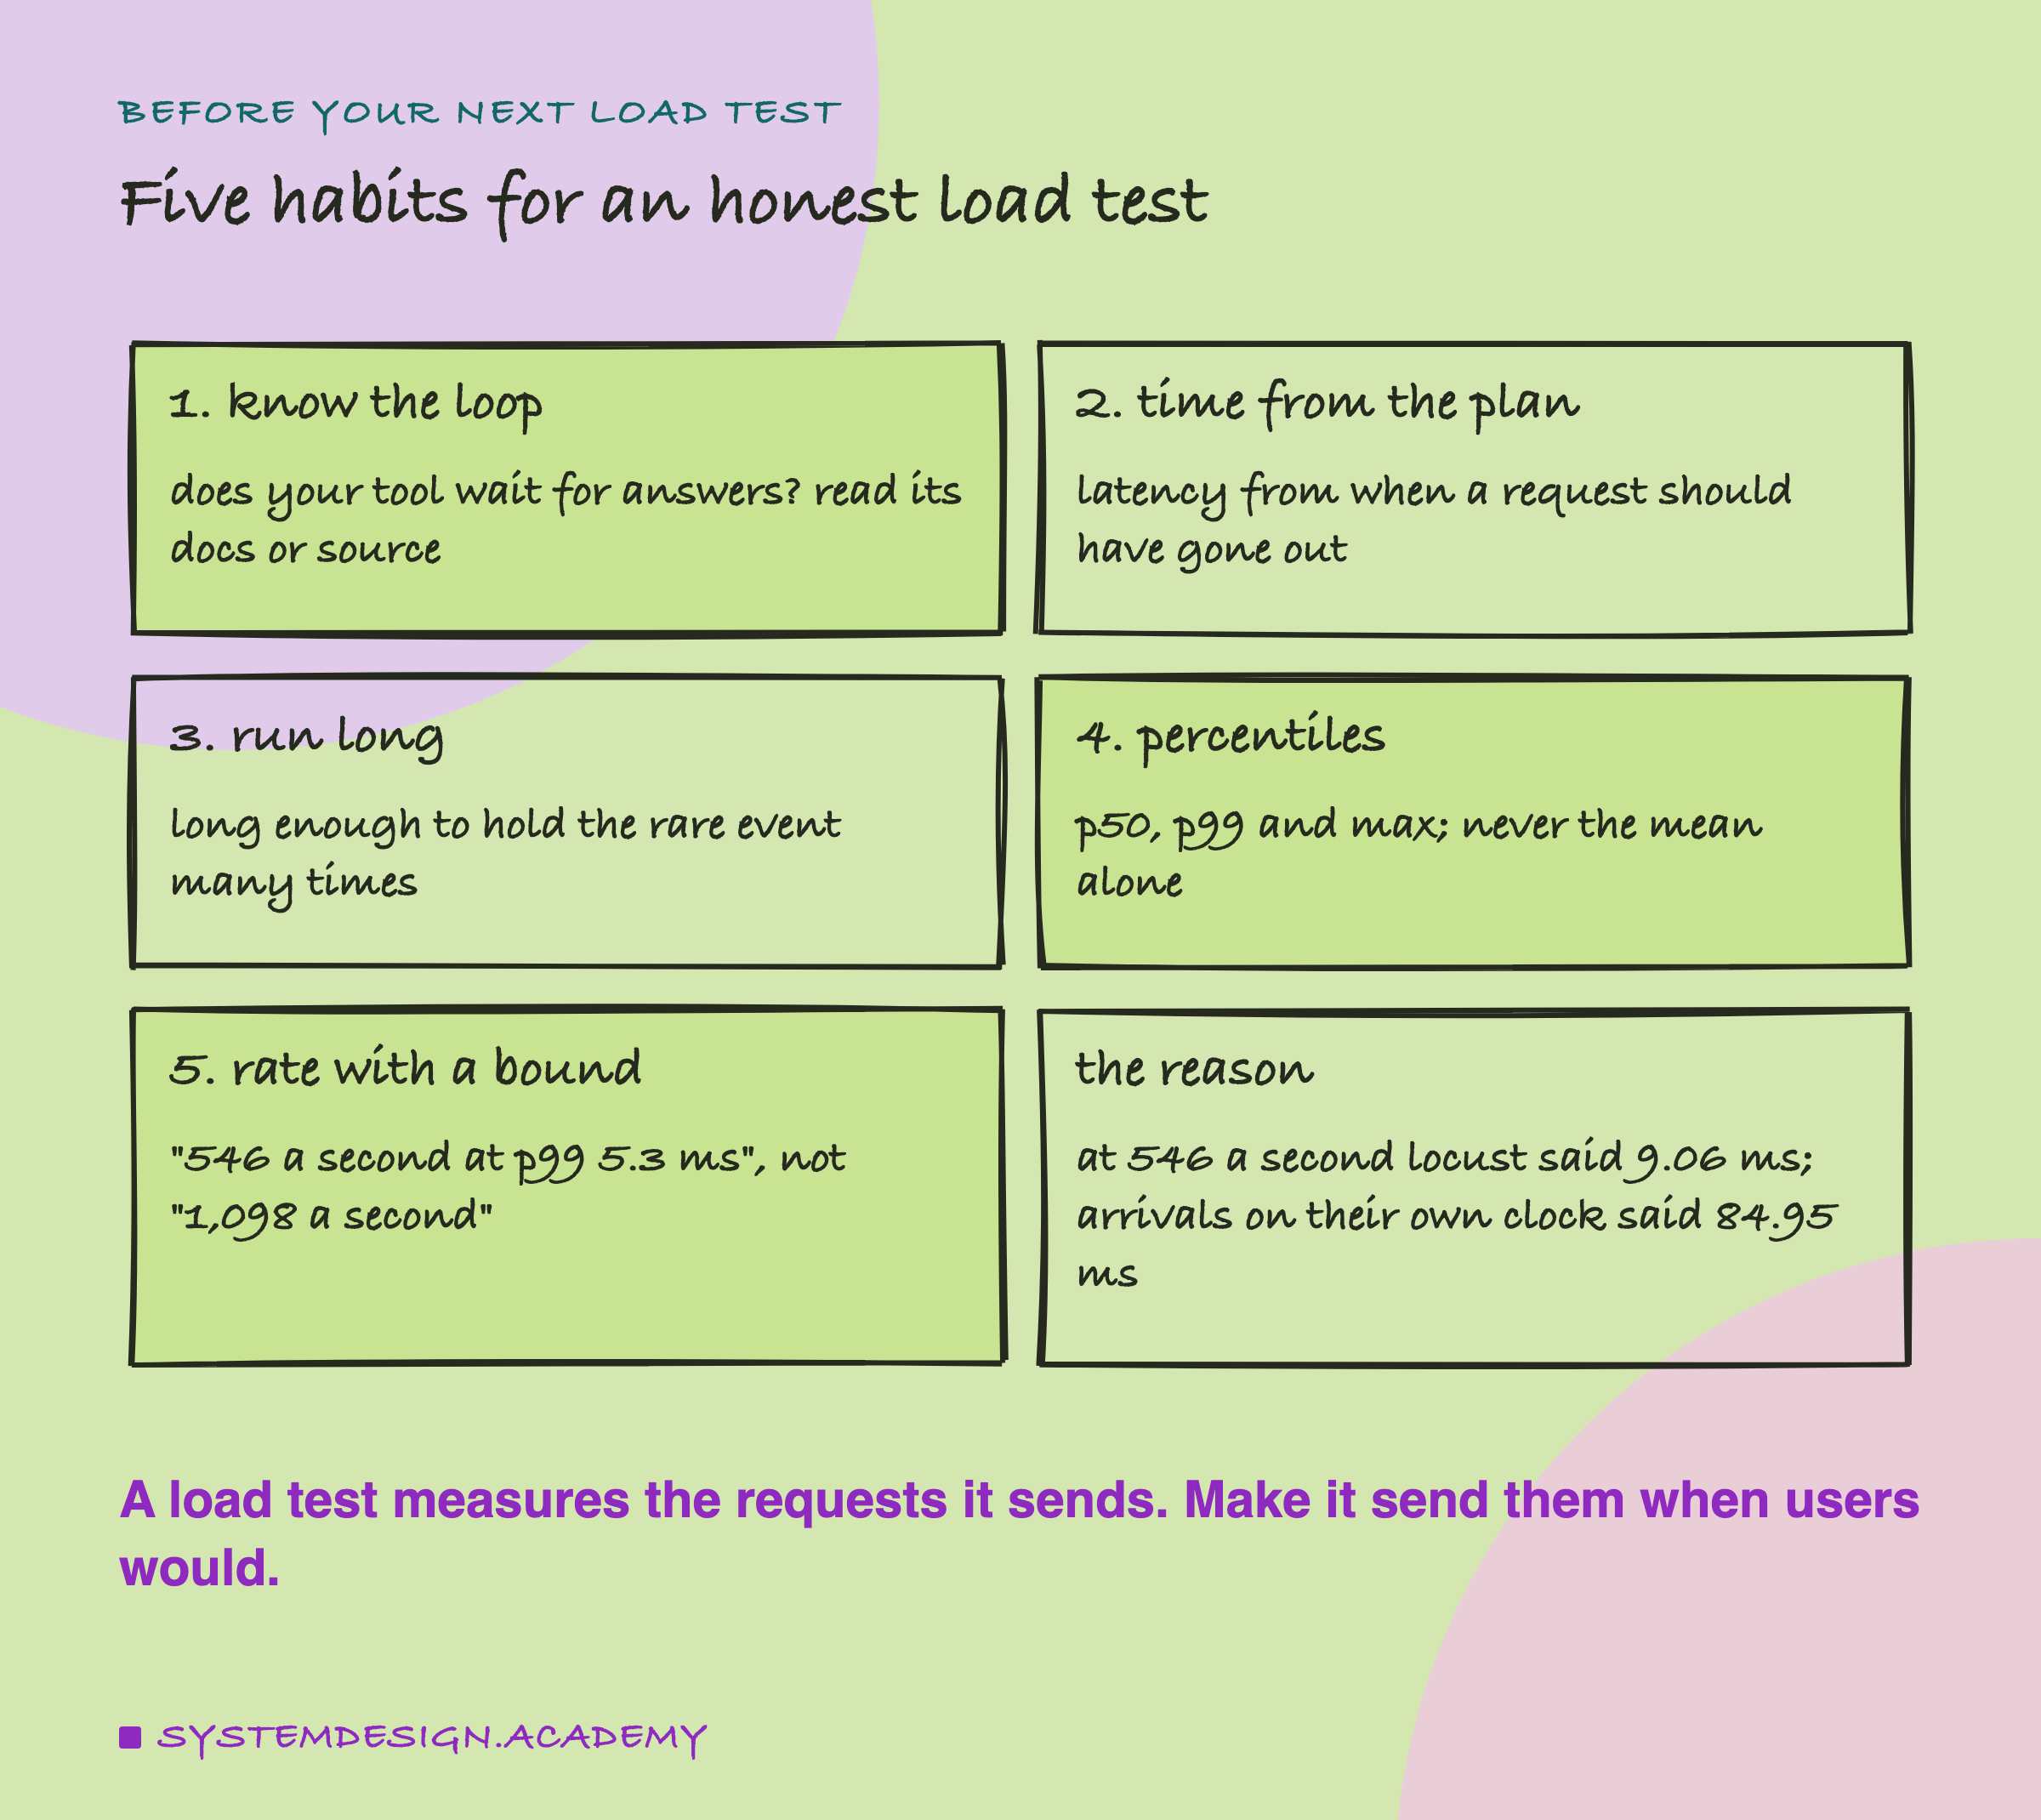
If you take one thing to work on Monday, open your last load test report and find out how its tool sends requests. If each connection or user waits for its answer before the next one, its p99 may be hiding every pause the service had.
Then run the same test with an open-loop tester at the same rate, for long enough, and put the two p99s side by side. If they agree, you have learned that your service has no long pauses at that rate. If they do not, you have found the pauses your users already feel.
The one idea to keep: a tester can only time the requests it sends. If it stops sending when the service stops answering, the slow moments never reach the report.
Knowledge Check
Knowledge Check
4 questions - Score 80% to pass
With the stall on, the closed loop with one connection reported a p99 of 0.97 ms. Why did it miss the 100 ms stalls?
At 546 requests a second with the stalls on, which tester's p99 showed the stalls?
What did the HdrHistogram correction do to the paced client's p99?
A closed loop with 16 connections reported 1,098 answers a second. What is the honest way to state this service's capacity, by this lesson?