The Full Shelf
Let me start in a small library.
The library has one long shelf near the front desk. Readers ask for books, and the librarian fetches them. A book on the shelf comes in seconds. A book in the store room downstairs takes a few minutes, because someone has to walk down, find it and carry it up.
The shelf is full. A new book arrives that many readers want. Where does it go?

The librarian has to take a book off the shelf first. A sensible librarian takes the one nobody has asked for in the longest time. If she guesses wrong, the next reader who wants that book waits for the walk downstairs.
A computer that serves many machine learning models has the same problem. Its memory is the shelf. Its disk is the store room. Each model is a book. In this lesson I measure how big each book is, how many fit on one shelf, and what the walk downstairs costs, on a real rented computer.
Where This Lesson Starts
This is lesson 10 of the chapter on serving a model. Serving a model means running it as a small program that answers questions while people wait.
The model is the features chapter's model. It looks at six numbers about one customer of a real online shop, such as the days since their last order. It gives a score between 0 and 1: how likely they are to buy again in the next 30 days.
The model is a tree model. A tree is a chain of yes or no questions about a customer, like a flowchart. The model asks many trees and adds up their answers.
Lesson 5, workers and threads, found that each copy of the service used about 220 MB of memory. Almost none of that was the model: the model file was only 0.2 MB. The rest was Python and its libraries. A library is a ready-made box of code that other programs use. That lesson had one model. This lesson asks what happens with many.
Why many models? A real company often has one model per country, per shop or per customer. Each one may be small, but there may be hundreds. Giving each its own computer is expensive. So the question is: how many models fit on one computer, and what happens when they do not?
The Words You Need First
Please read this slide slowly if any word is new. Every slide after it uses these words, and each one comes with an everyday picture first.
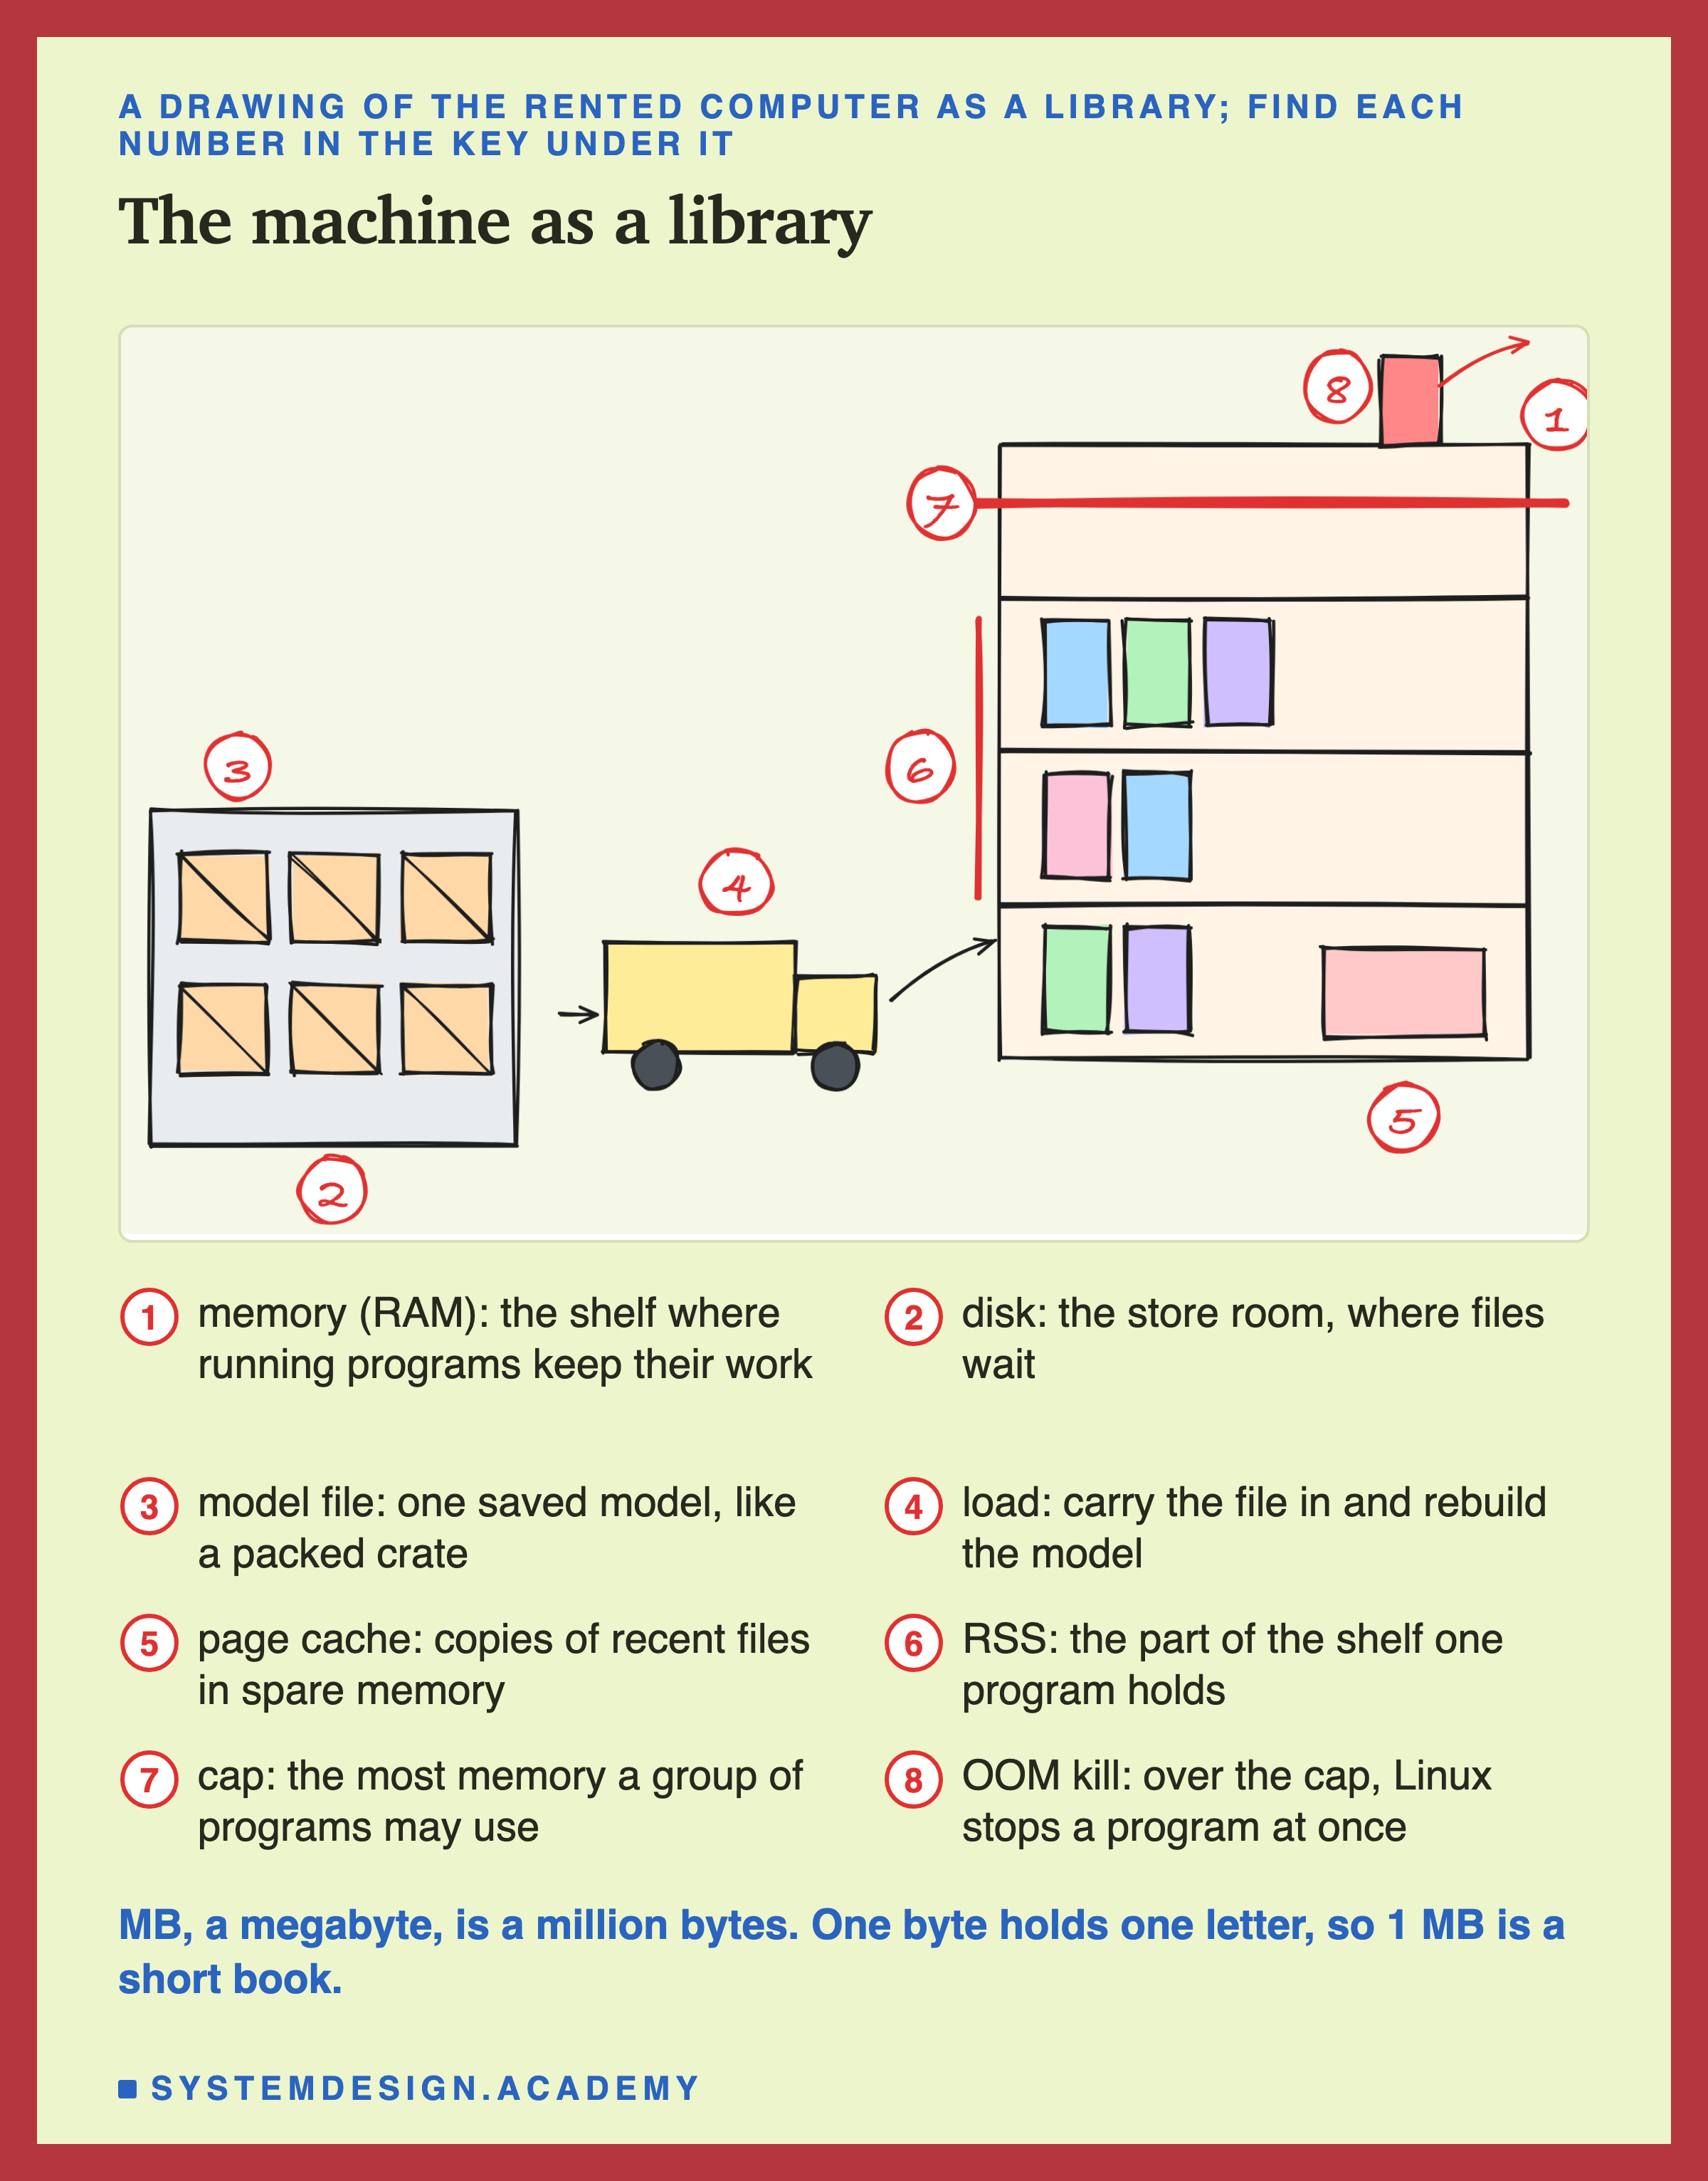
Memory, also called RAM, is where a running program keeps what it is working on. It is fast, like the shelf by the front desk. The disk is where files are kept when nobody is using them. It is slower, like the store room. A byte is the space for one letter. One MB, a megabyte, is a million bytes, about the size of a short book written in plain text.
numpy and scikit-learn are the Python libraries that hold the numbers and run the model. A model file is a trained model saved to the disk. To use it, a program must load it: read the file and rebuild the model in memory. Here the files are saved with pickle, Python's standard way to save what it holds in memory to a file.
Linux is the main program that runs this computer, its operating system. Its core part is called the kernel. A cache is a small, fast place that keeps copies of things used often. The page cache is where Linux keeps copies of files it read recently, in memory that nobody else is using. It is like the librarian keeping returned books on a trolley by the desk. A second read of the same file comes from the trolley, not the store room. I call that a warm load. A load that has to go to the disk is a load.
The Headline: What One Model Costs
Here is the main result first, as a shop receipt for one of the bigger models I made. It has 250 trees.
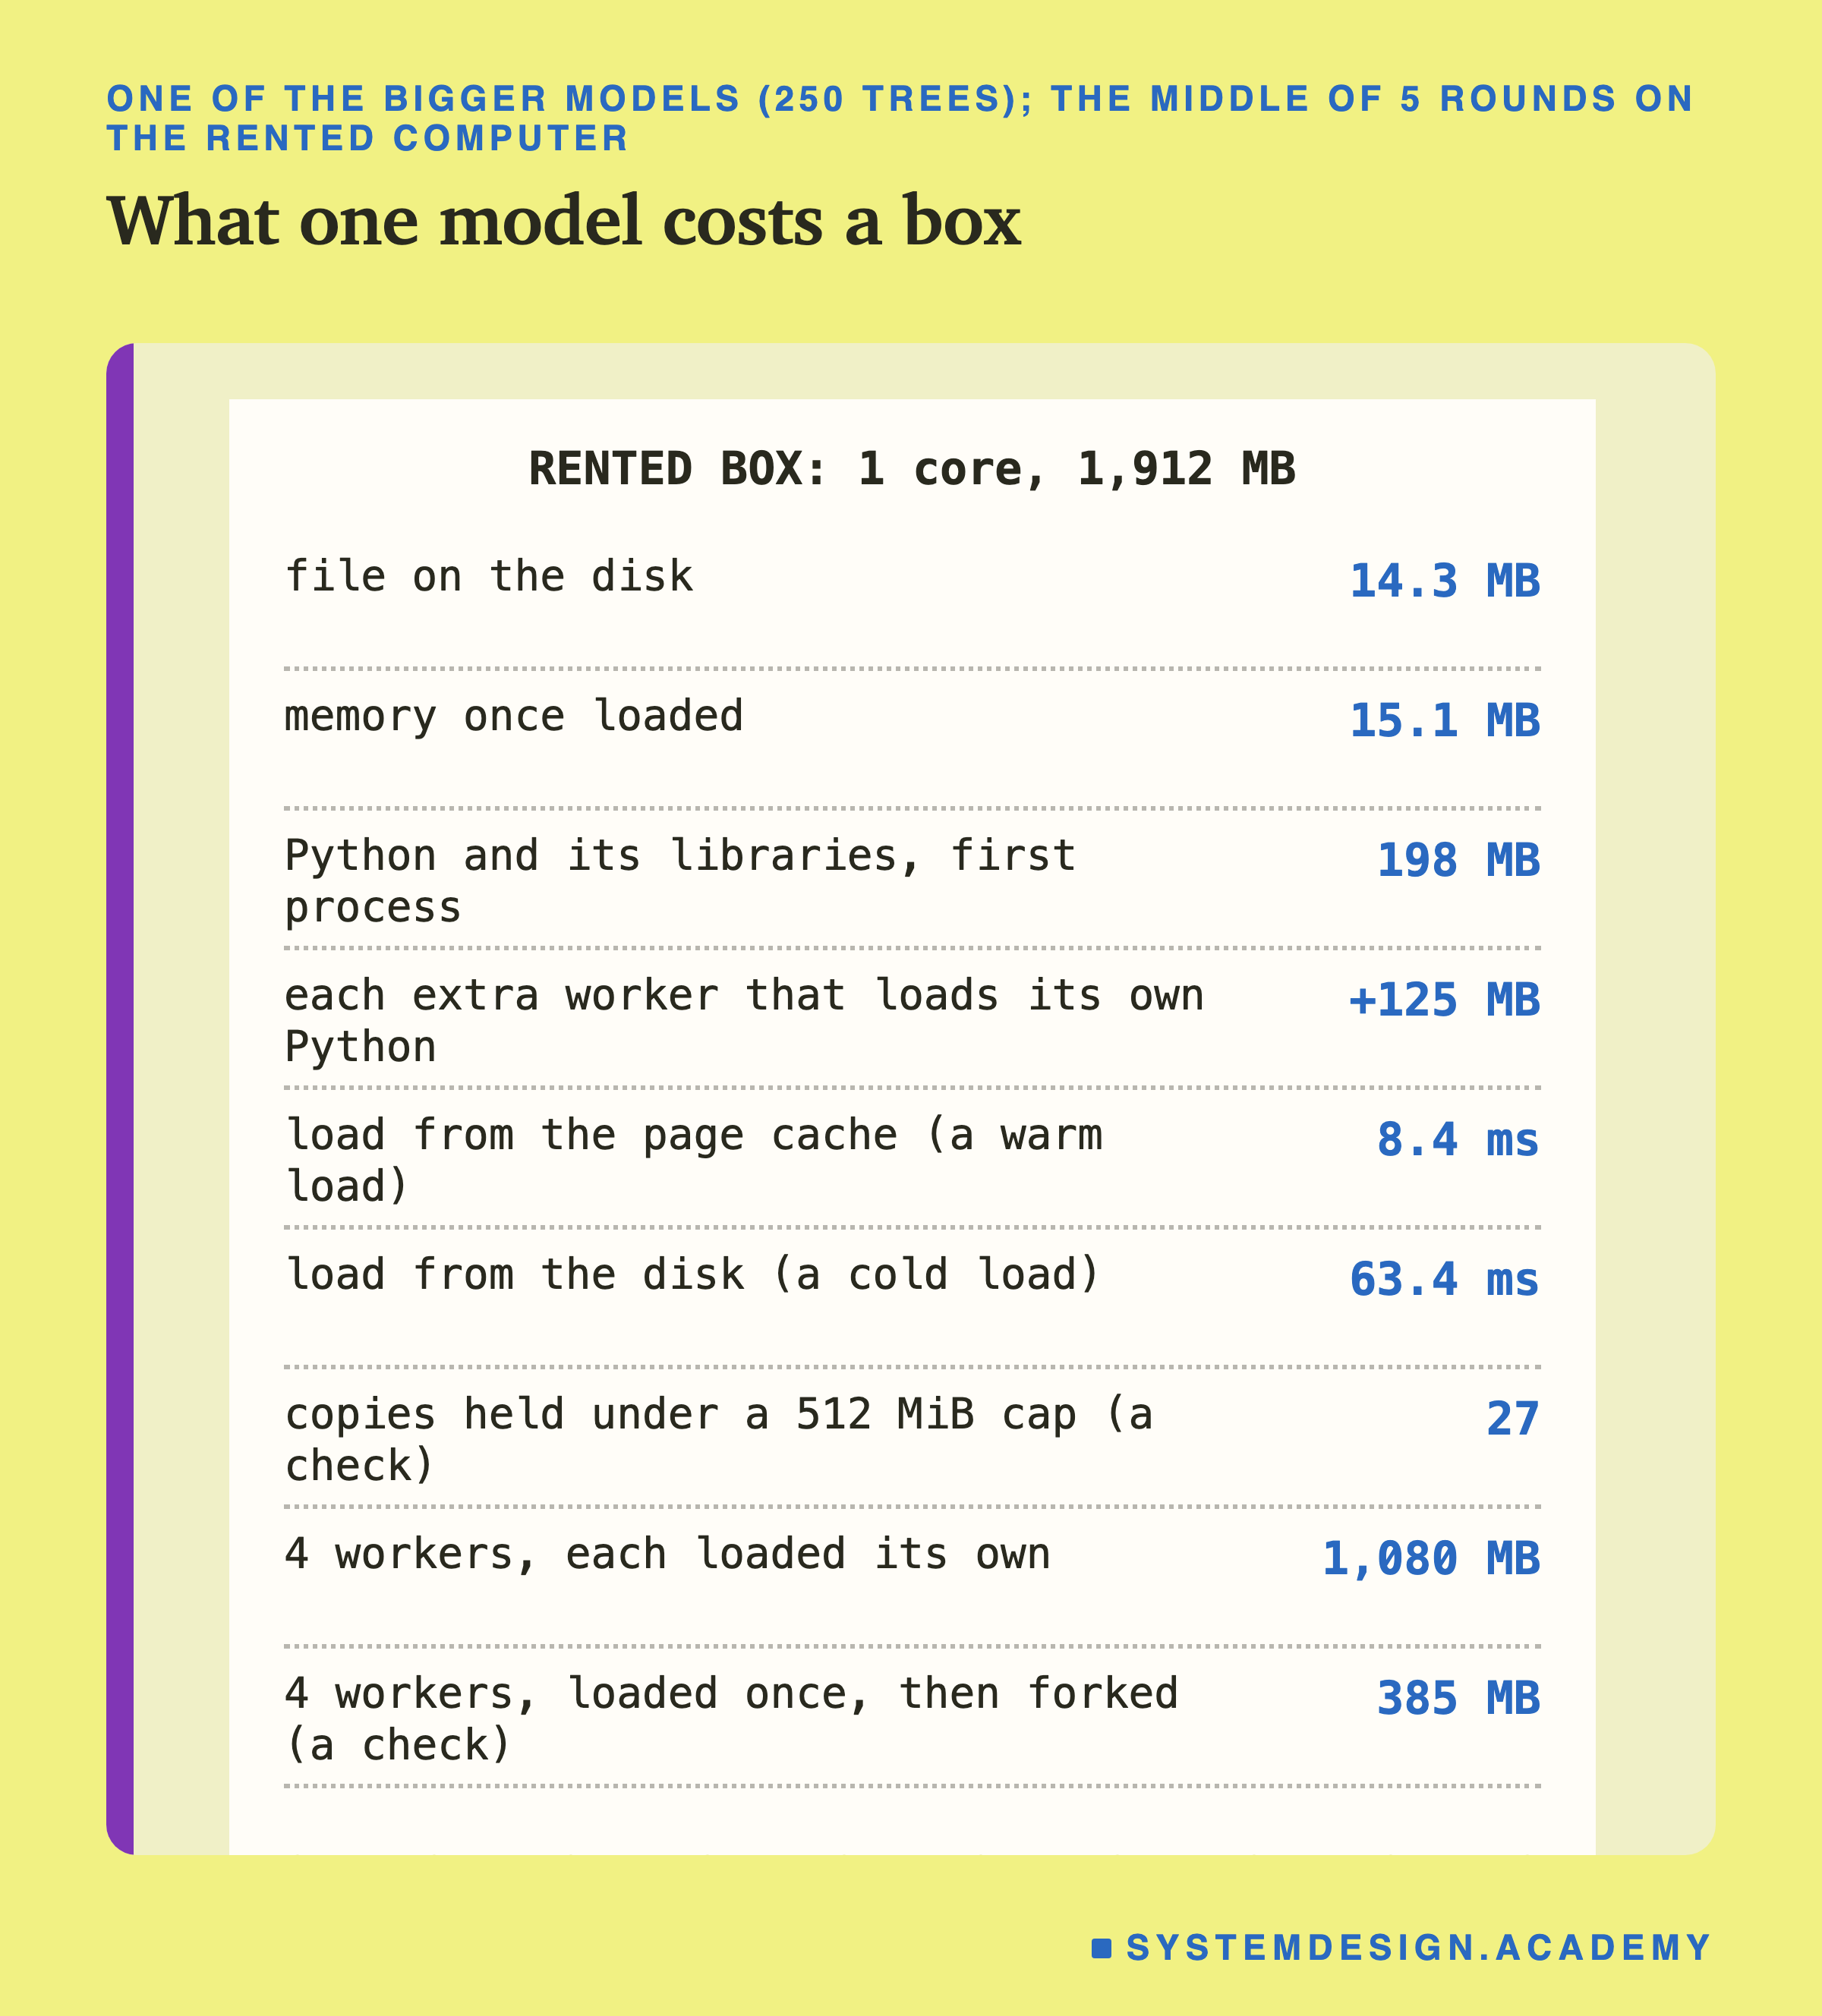
Once loaded, the model took about the size of its file. The file was 14.3 MB, and the program's memory grew by 15.1 MB when it loaded it. For tree models from scikit-learn the two are close. That is not true for every kind of model, so measure yours.
Python and its libraries cost more than thirteen such models. A fresh Python with numpy and scikit-learn already held 198 MB before any model. Each extra copy of the program cost about 125 MB more, not another 198 MB, because the library files on the disk are shared between copies.
A load from the disk took 7.6 times as long as a load from the page cache: 63.4 ms against 8.4 ms. A millisecond (ms) is a thousandth of a second.
Under a 512 MiB cap, 27 copies fit. That is a check, not a finding: the files are all the same size, so the count could not change between rounds. The finding is how the end looks. Linux stopped the program while it was loading the 28th copy, with no error message from Python at all.
Four workers that loaded the models once and then forked used 385 MB in total, against 1,080 MB when each loaded its own. Sharing faded only a little as requests came in. But one full run of Python's garbage collector, its memory cleaner, copied about 45 MB more per worker. gc.freeze stopped that.
How the Lab Was Built
Before any run, I wrote the lab's plan at the top of the program file, scripts/labs/serving/many_models.py. That note at the top of a Python file is called a docstring. It names every setting and the rule for "clearly different". It also lists sixteen guesses, written down first so they could be checked later and could be wrong.
The models. I trained 20 models on the features chapter's task, on the rented computer. The ladder is five sizes: the chapter's own model (0.2 MB) and four bigger ones, up to 57.3 MB. I made them bigger on purpose, with more and bigger trees. They are not better models: their test scores were lower, as the code slide shows.
The fleet is sixteen models of the same size, 14.3 MB each. Each was trained with a different random seed. A seed is the number that starts the random choices, like writing down the dice rolls first, so a run can be repeated exactly. The fleet plays sixteen shops' models on one computer.
Four parts. Part 1 measures one model's size and load time, each in a fresh program. Part 2 loads copies under a memory cap until Linux stops it. Part 3 runs gunicorn with 1, 2 or 4 workers in three ways. Part 4 serves all sixteen models from a service with room for only some.
Rounds. Each part ran 5 rounds. A round is one full pass through all the settings of a part. I call each setting an arm, like one recipe in a cooking test. Each round ran its arms in a new random order, so time of day could not favour one arm.
The rule. I call a difference clearly different only if one arm beat the other in all 5 rounds, and even its worst round beat the other's best. Otherwise it is too close to call.
The Machine
Every number in this lesson comes from a small computer I rented from Amazon Web Services (AWS).
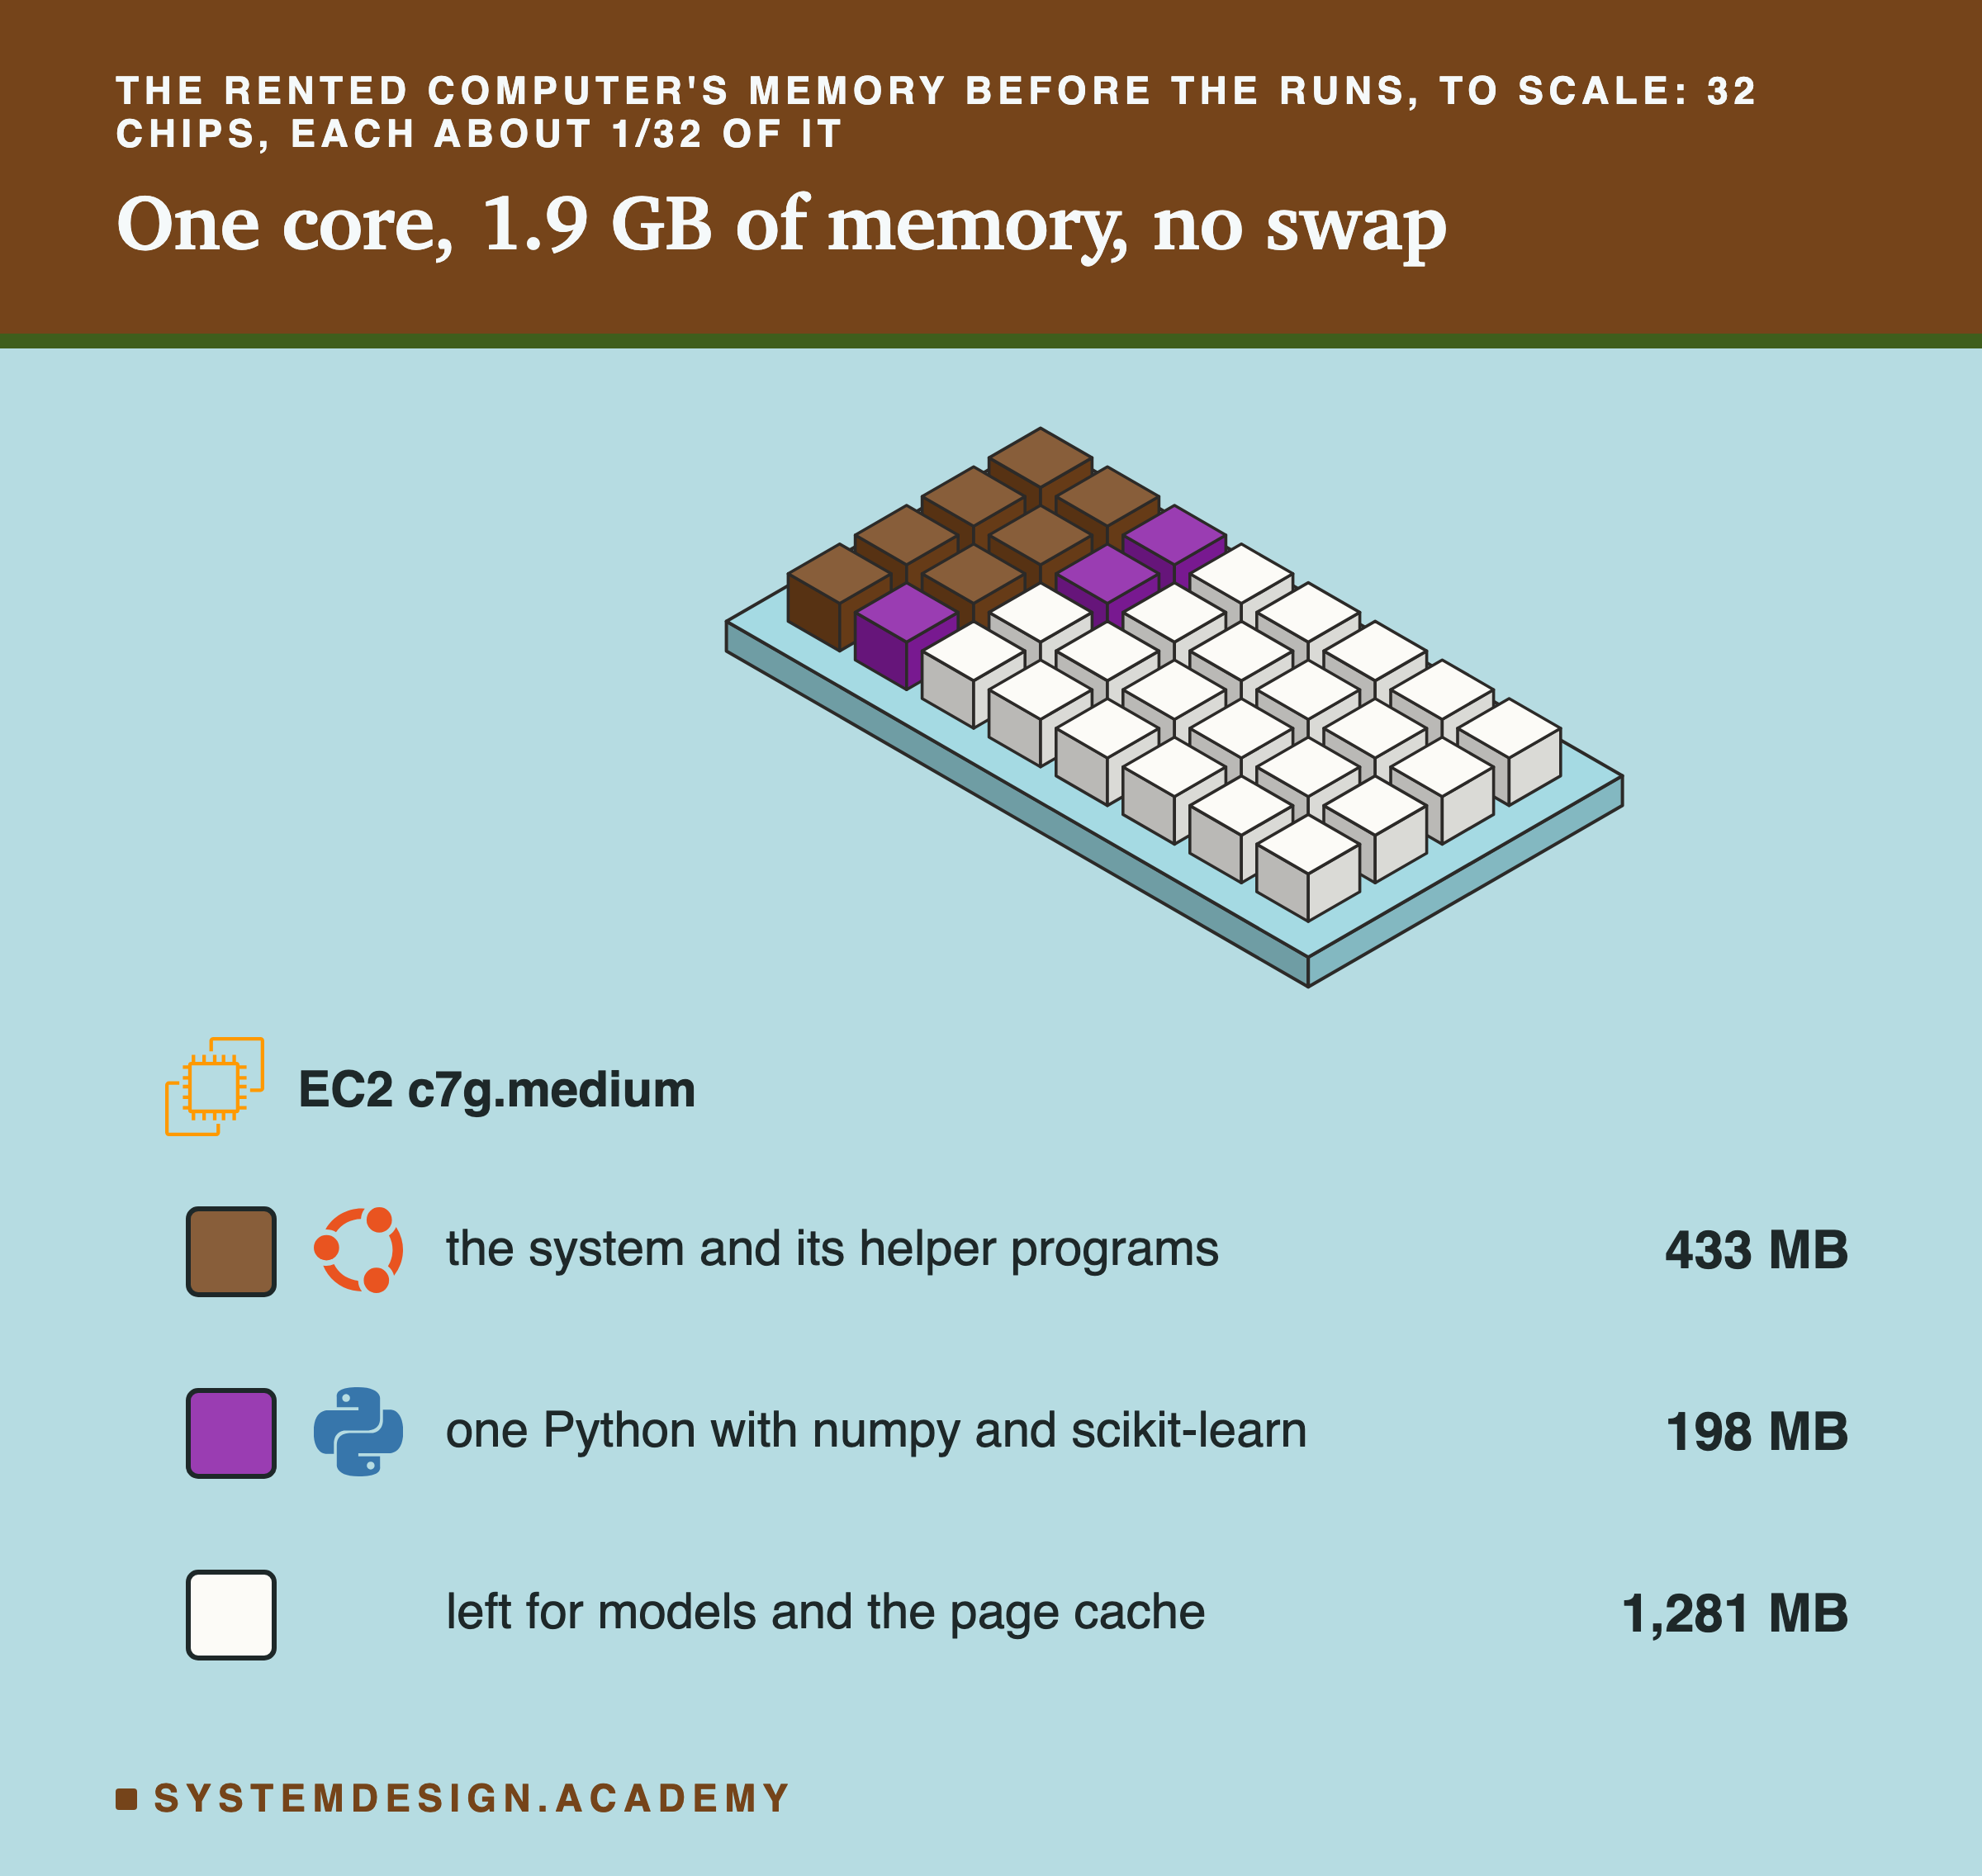
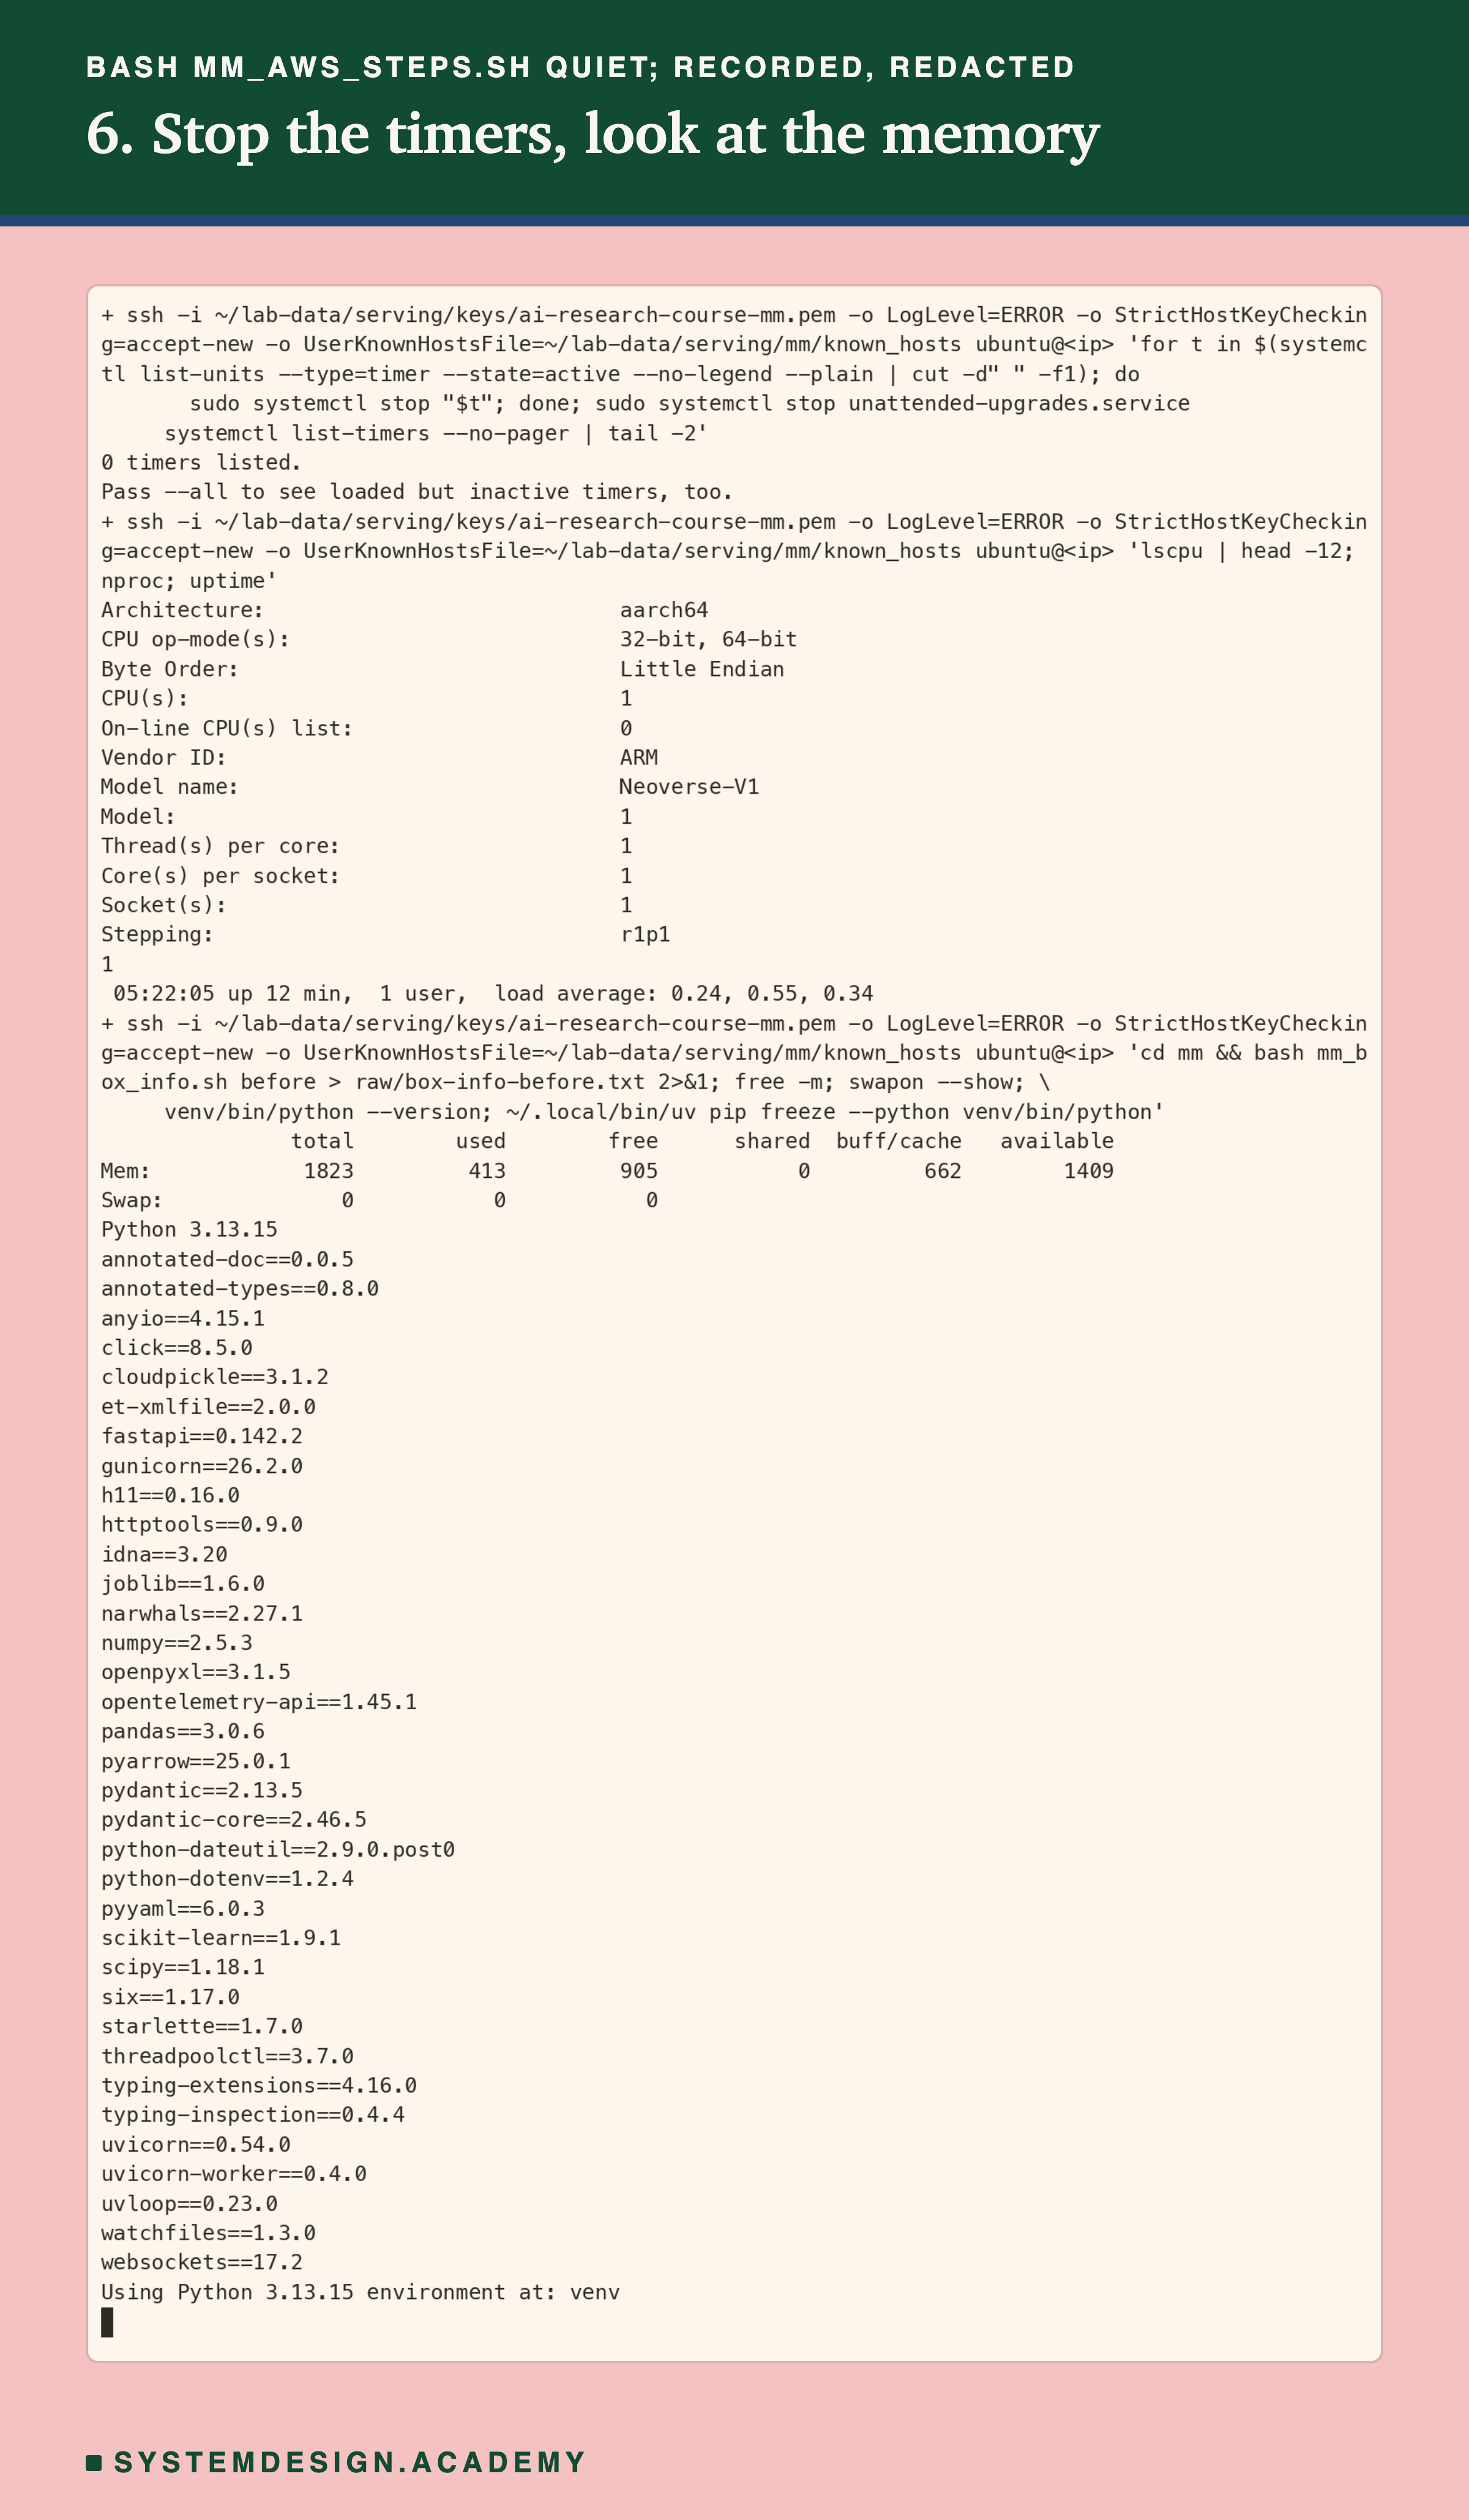
The computer is an EC2 c7g.medium. EC2 is Amazon's service for renting computers by the hour. AWS's own records list it with 1 virtual CPU and 2,048 MiB of memory. A virtual CPU, or vCPU, is one worker inside the chip that runs one program step at a time. My AWS account may run only one at a time. Linux reported 1,912 MB of memory it could use, which is small. That suits a lesson about memory: the limits arrive quickly.
One more unit, because Linux uses it. A MiB is 1,048,576 bytes, a little more than one MB. The caps in this lesson are set in MiB, so I give both: 512 MiB is 537 MB.
The computer runs Ubuntu, a popular version of Linux. The standard Ubuntu setup has no swap. Swap is disk space that Linux can use as slow extra memory when memory runs out. The computer showed Swap: 0 before the runs, and in every capped run it moved 0 pages to or from swap. So in this lab, memory that runs out is simply gone.
The system and its helper programs already used 433 MB before any run. Before every timed run, the core had to be at least 95% idle over two seconds. In all 115 timed runs it was at least 99.5% idle. Steal, time the big computer underneath lends to other customers, was 0.00%. Nobody was logged in during any run I kept.
The Whole Lab in One Picture
Here is the whole lab as one numbered sequence. The numbers on the arrows match the numbers on the recordings that follow.
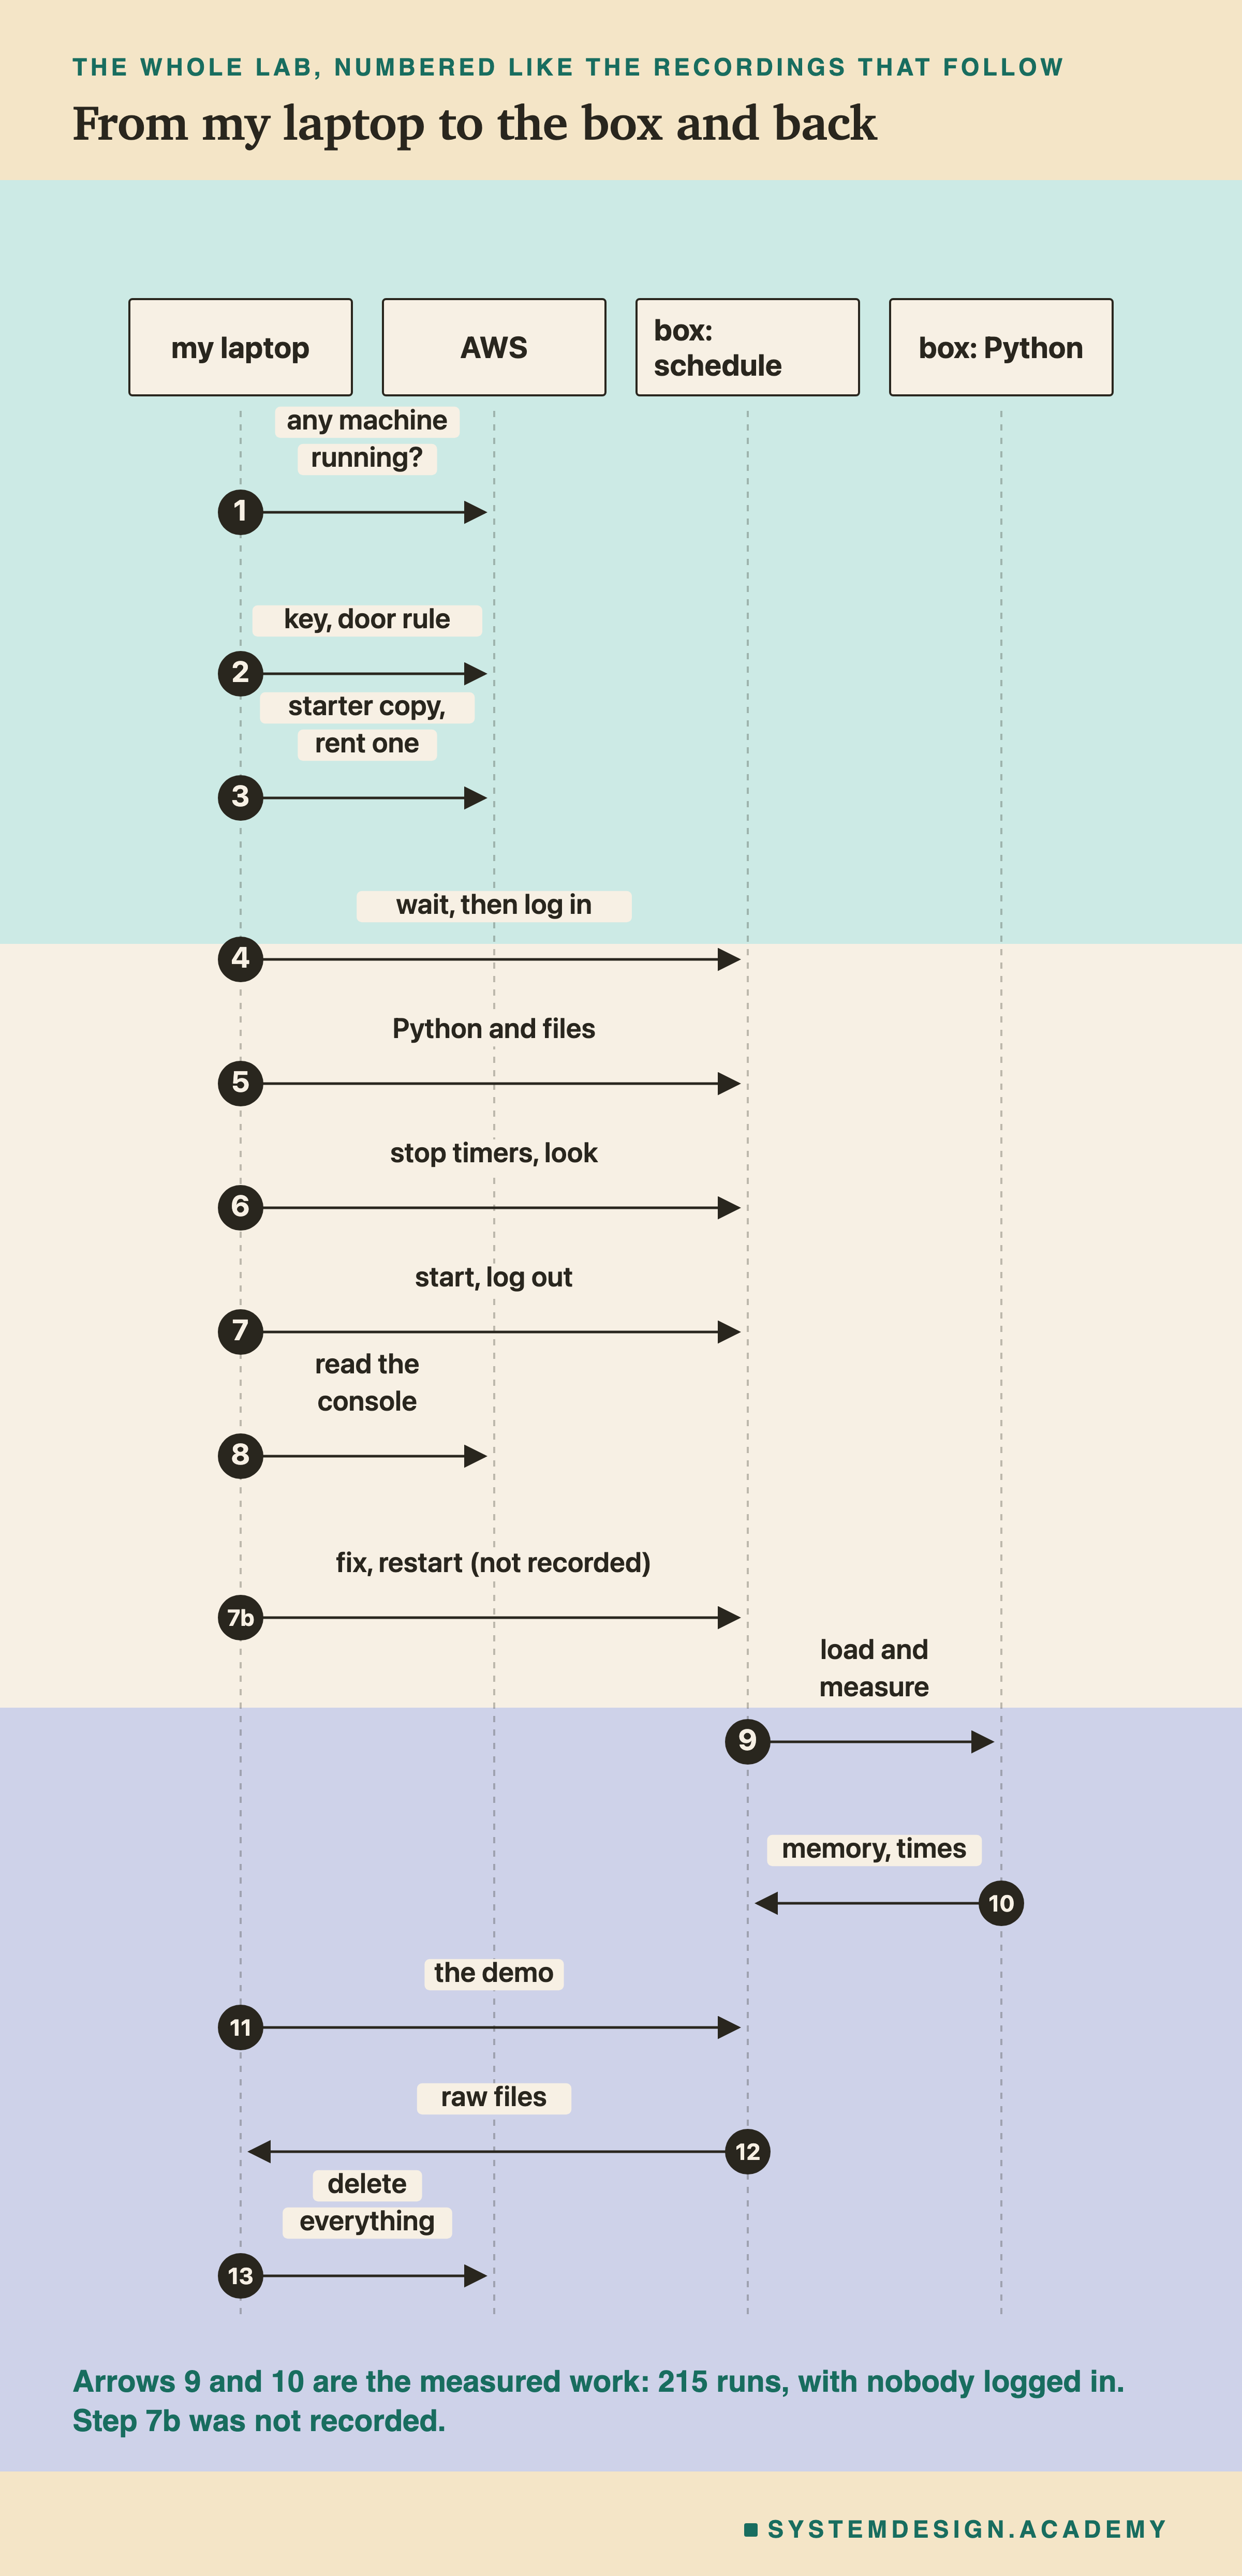
Steps 1 to 7 happen once: check, rent the computer, set it up, and start the schedule. Step 8 is how I watched the schedule without logging in. Step 7b is a restart I had to make, which I explain below; it was not recorded. Arrows 9 and 10 are the measured work: the schedule starts Python programs that load the models and write down memory and times. Steps 11 to 13 come after: the student demo, the copy of the results to my laptop, and the deletion of everything.
Build the Lab Box Yourself
The rented computer is part of the lab, so I show every step of it. You can rent the same kind of computer and run the same schedule.
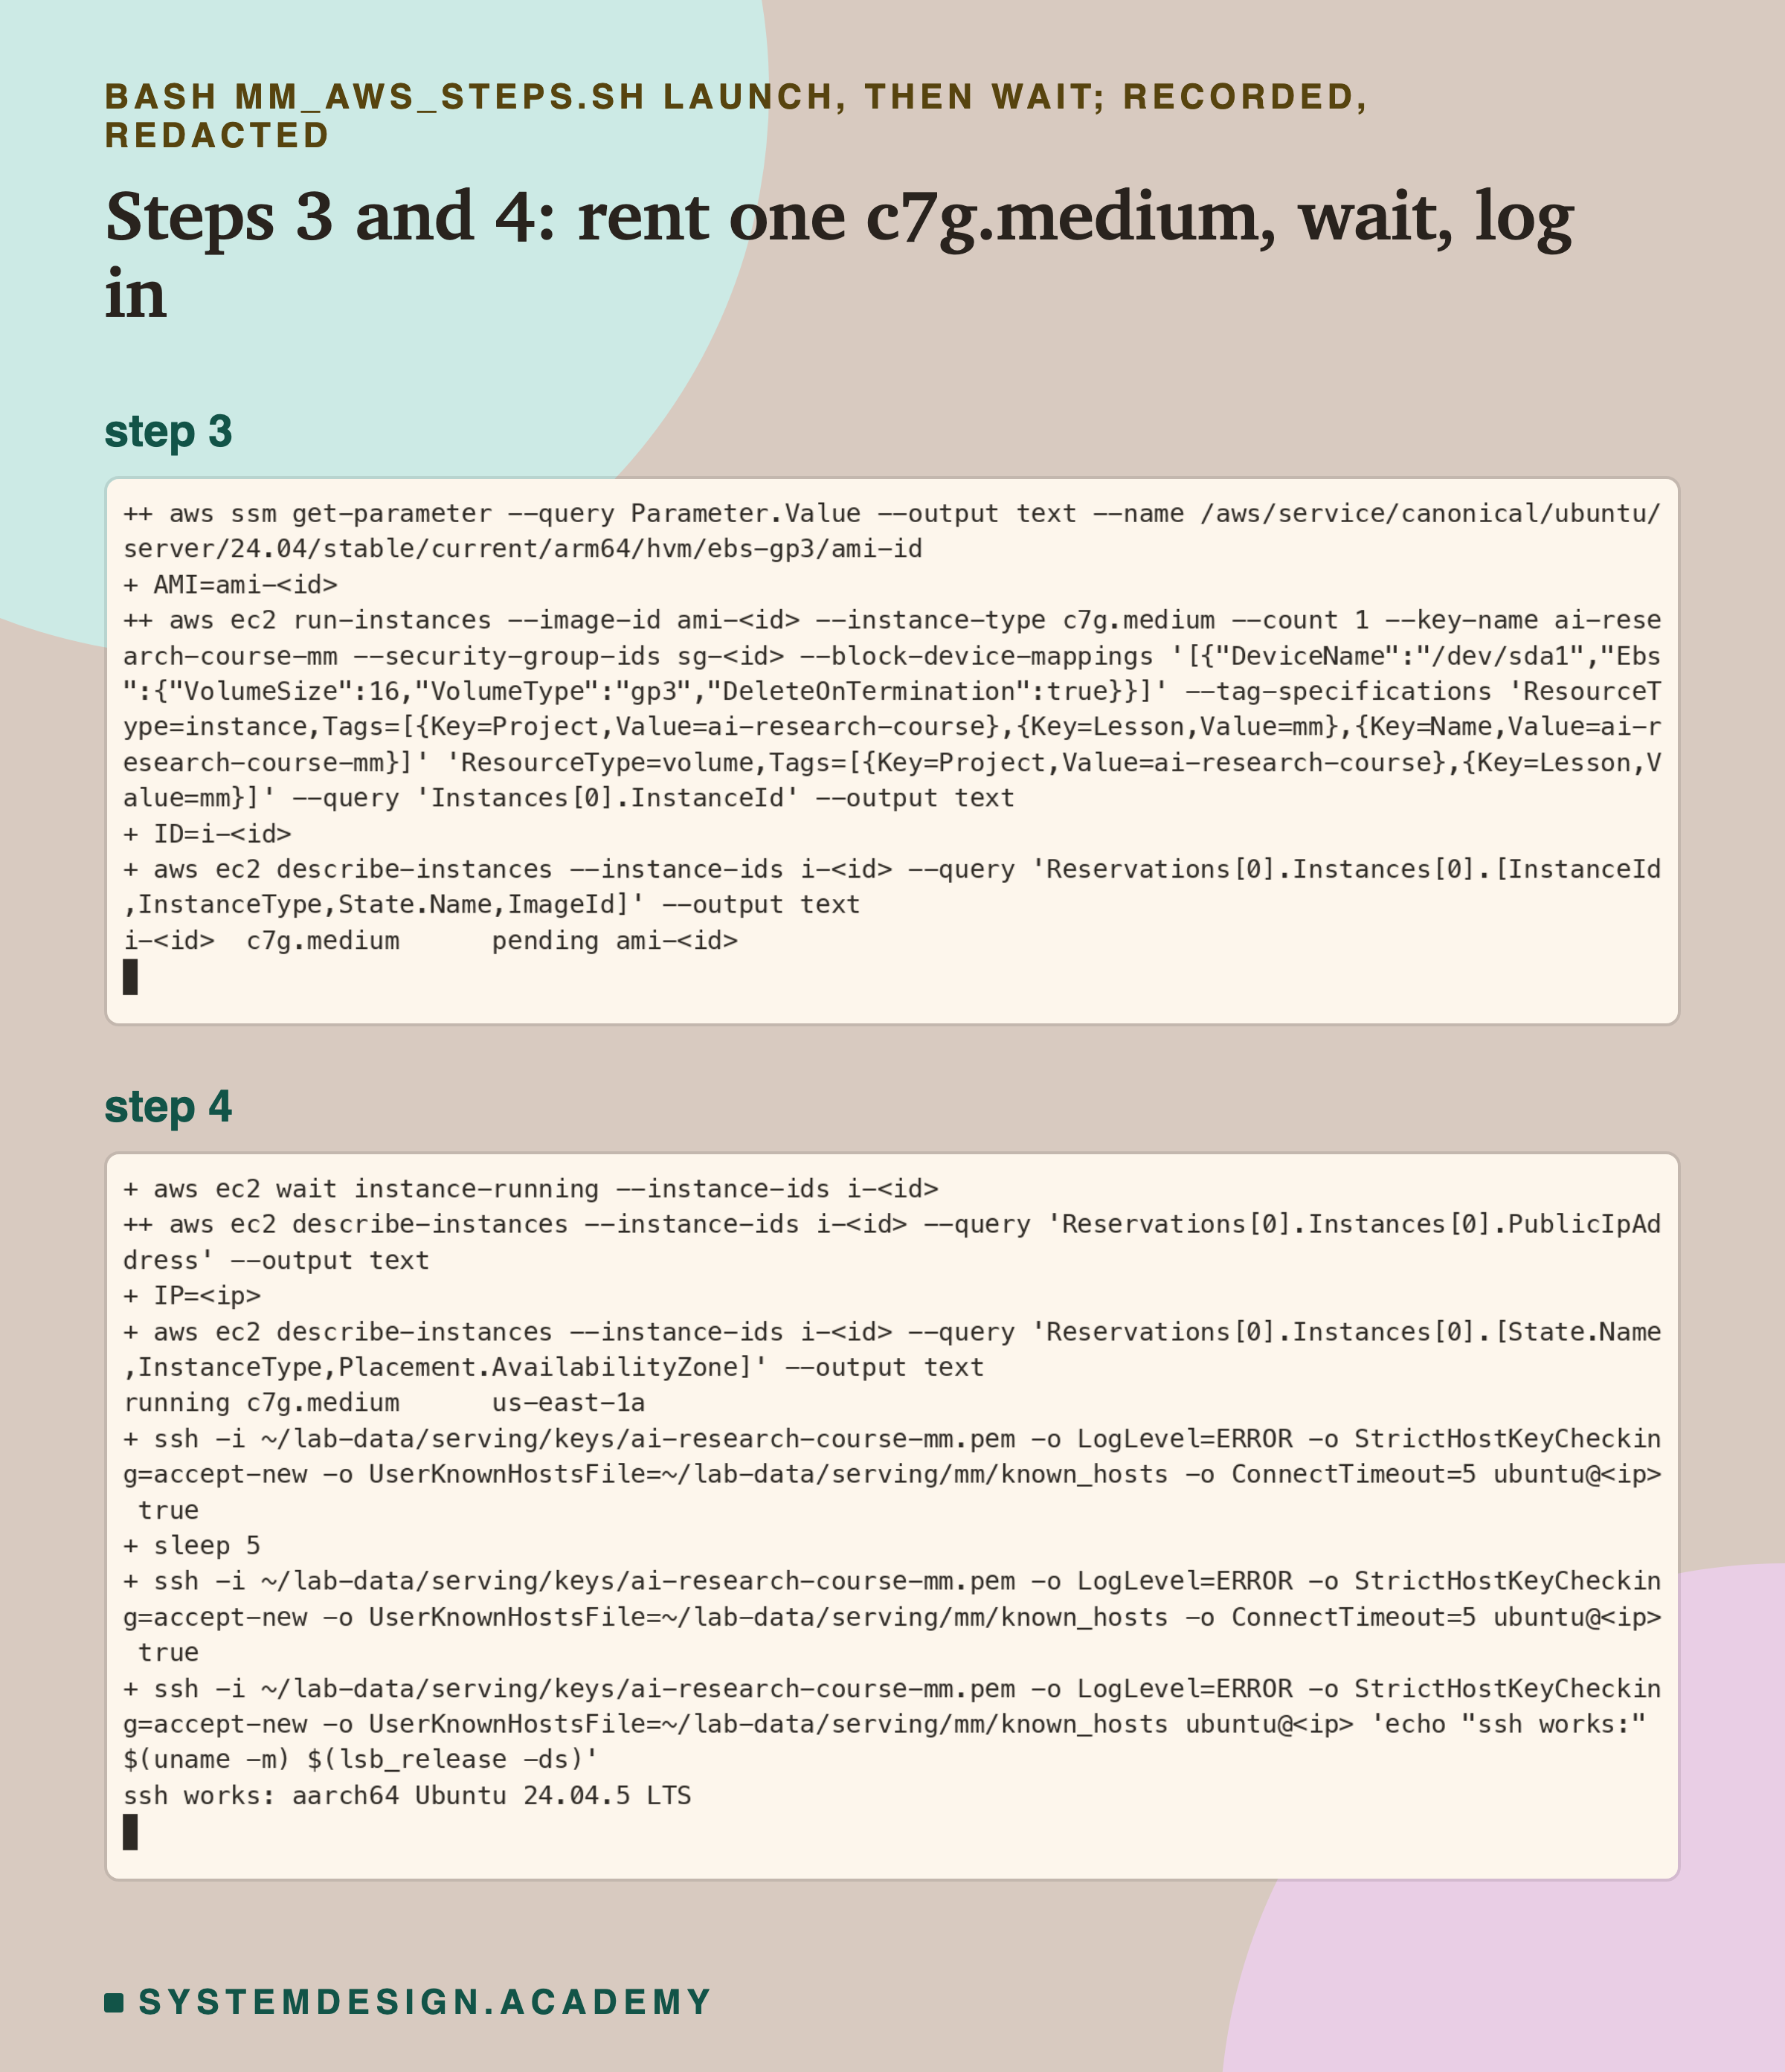
Which computer you see. Every recording comes from the computer that measured this lesson's numbers. Step 5 was recorded three times: the first two recordings were too short for the screen, so their top lines scrolled away. The step is safe to repeat, so I ran it again on the same computer for the one you see. That last run came after a short test of each part, so its file list shows a models folder. I deleted the test runs' files; no number in this lesson comes from them.
What you need first. An AWS account and the AWS command line tool (aws), a program you type commands into, set up with your keys. You also need ssh, which logs in to another computer; scp and rsync, which copy files to and from it; and curl, which downloads a web page. All the steps live in one file, scripts/labs/serving/mm_files/mm_aws_steps.sh. You run it from the scripts/labs/serving folder, one step at a time: bash mm_files/mm_aws_steps.sh check, then access, and so on. Every code block below is copied word for word from that file.
The blocks use a few names that the file sets at its top. If you paste the blocks by hand, run these lines first, from the scripts/labs/serving folder. All of them are copied from the file, except . The file works out that folder from its own location, which a pasted line cannot do.
Steps 1 to 4: Check, Lock the Door, Rent the Computer, Log In
Step 1: is any other course computer running? My account allows one computer of this kind at a time, and another lesson may be using it. So the first command counts the course's computers that are not yet deleted. It must print 0.
Step 2: a key and a locked door. A key pair is how you prove to the computer that you are allowed in. AWS keeps one half, and you keep the other half in a file only you can read. A security group is a door rule. A port is a numbered door on a computer where a program waits for visitors. My door rule opens only port 22, the door that SSH uses, and only to my own address. Both get tags, small labels that say which project and lesson they belong to.
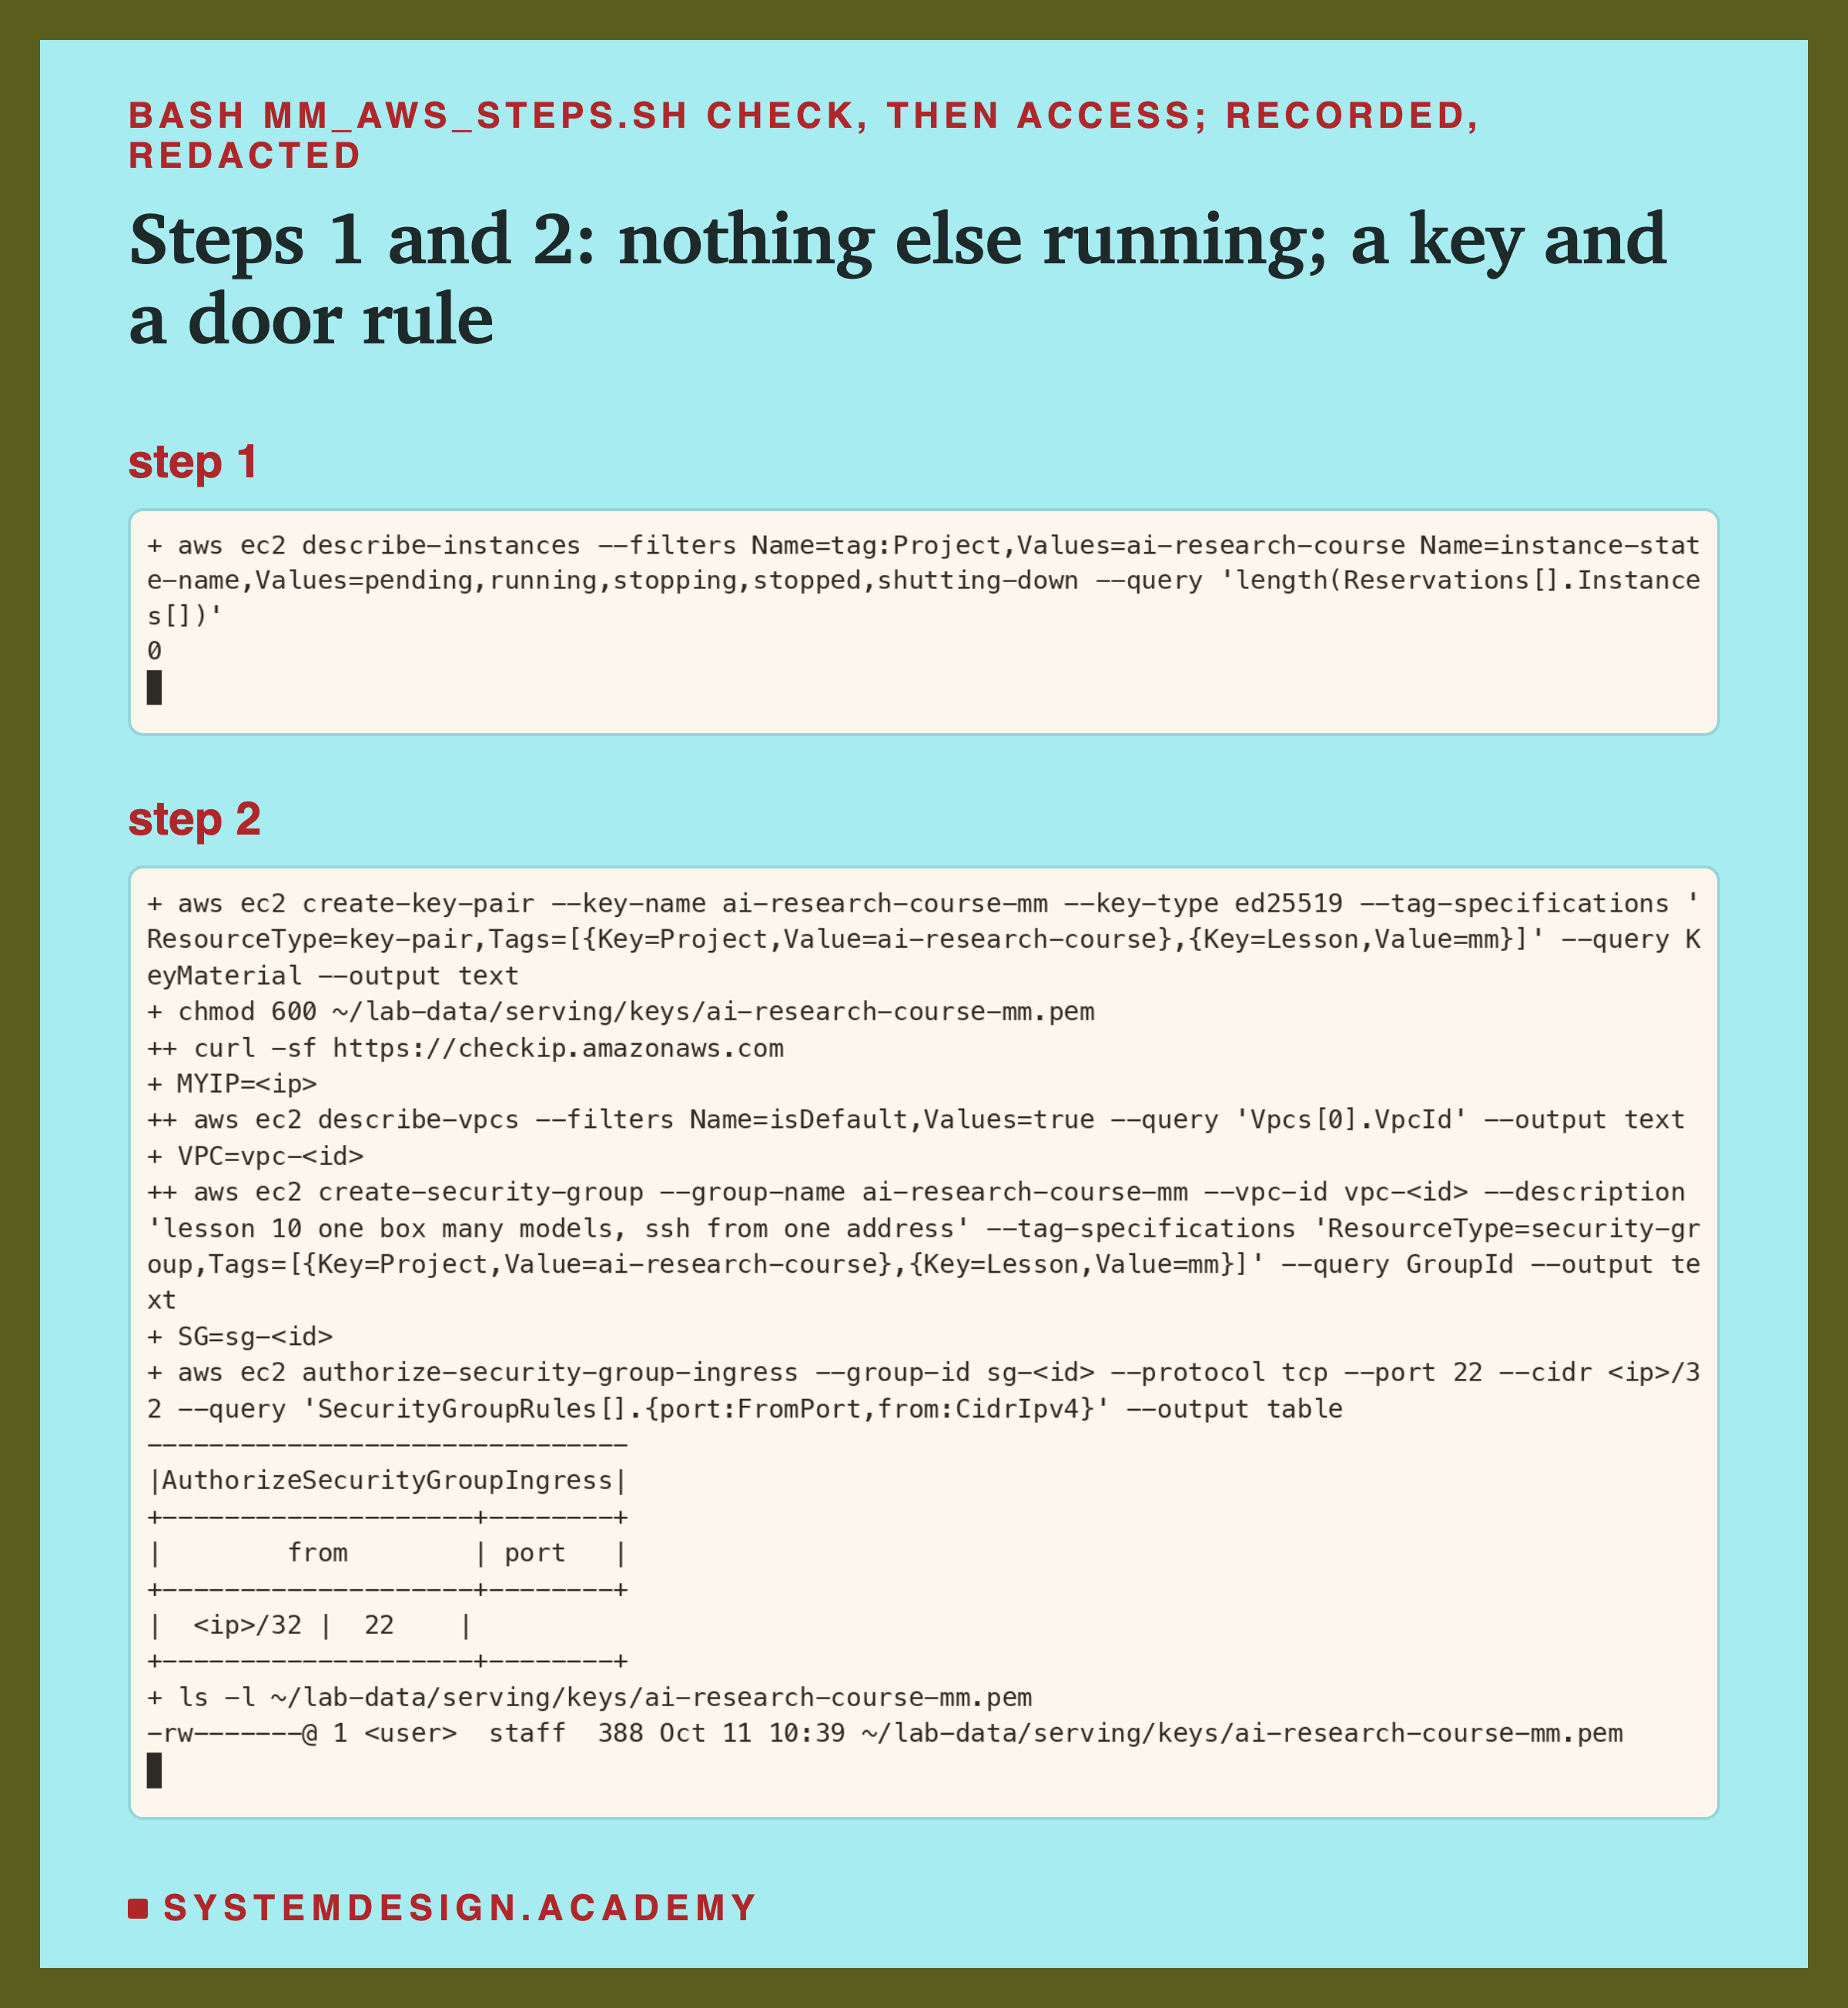
Step 1 printed 0, so no other course computer was alive. In step 2 the key went straight into the file and was never printed, and the door rule names only my own address. This is step 1's command:
  aws ec2 describe-instances --filters "Name=tag:Project,Values=ai-research-course" \
    "Name=instance-state-name,Values=pending,running,stopping,stopped,shutting-down" \
    --query "length(Reservations[].Instances[])"
These are step 2's commands:
  aws ec2 create-key-pair --key-name ai-research-course-mm --key-type ed25519 \
    --tag-specifications "ResourceType=key-pair,Tags=[{Key=Project,Value=ai-research-course},{Key=Lesson,Value=mm}]" \
    --query KeyMaterial --output text > ~/lab-data/serving/keys/ai-research-course-mm.pem
  chmod 600 ~/lab-data/serving/keys/ai-research-course-mm.pem
  MYIP=$(curl -sf https://checkip.amazonaws.com)
  VPC=$(aws ec2 describe-vpcs --filters Name=isDefault,Values=true --query "Vpcs[0].VpcId" --output text)
  SG=$(aws ec2 create-security-group --group-name ai-research-course-mm --vpc-id "$VPC" \
    --description "lesson 10 one box many models, ssh from one address" \
    --tag-specifications "ResourceType=security-group,Tags=[{Key=Project,Value=ai-research-course},{Key=Lesson,Value=mm}]" \
    --query GroupId --output text)
  aws ec2 authorize-security-group-ingress --group-id "$SG" --protocol tcp --port 22 --cidr "$MYIP/32" \
    --query "SecurityGroupRules[].{port:FromPort,from:CidrIpv4}" --output table
  ls -l ~/lab-data/serving/keys/ai-research-course-mm.pem
  echo "$SG" > "$STATE/sg"
Steps 5 and 6: Set Up, Look
Step 5: Python, the packages and the lab files. The computer gets the same Python, 3.13.15, and the same library versions as lessons 2 to 9, through uv, a fast installer for Python. A venv is a private toolbox folder for one project's Python, with the exact tool versions written down. This lesson adds two tools to lesson 2's list: gunicorn, and the piece that lets gunicorn run the chapter's service. Then scp sends the files. The last command checks the shop data file against the fingerprint the features chapter recorded. A sha256 fingerprint changes if even one byte of a file changes.
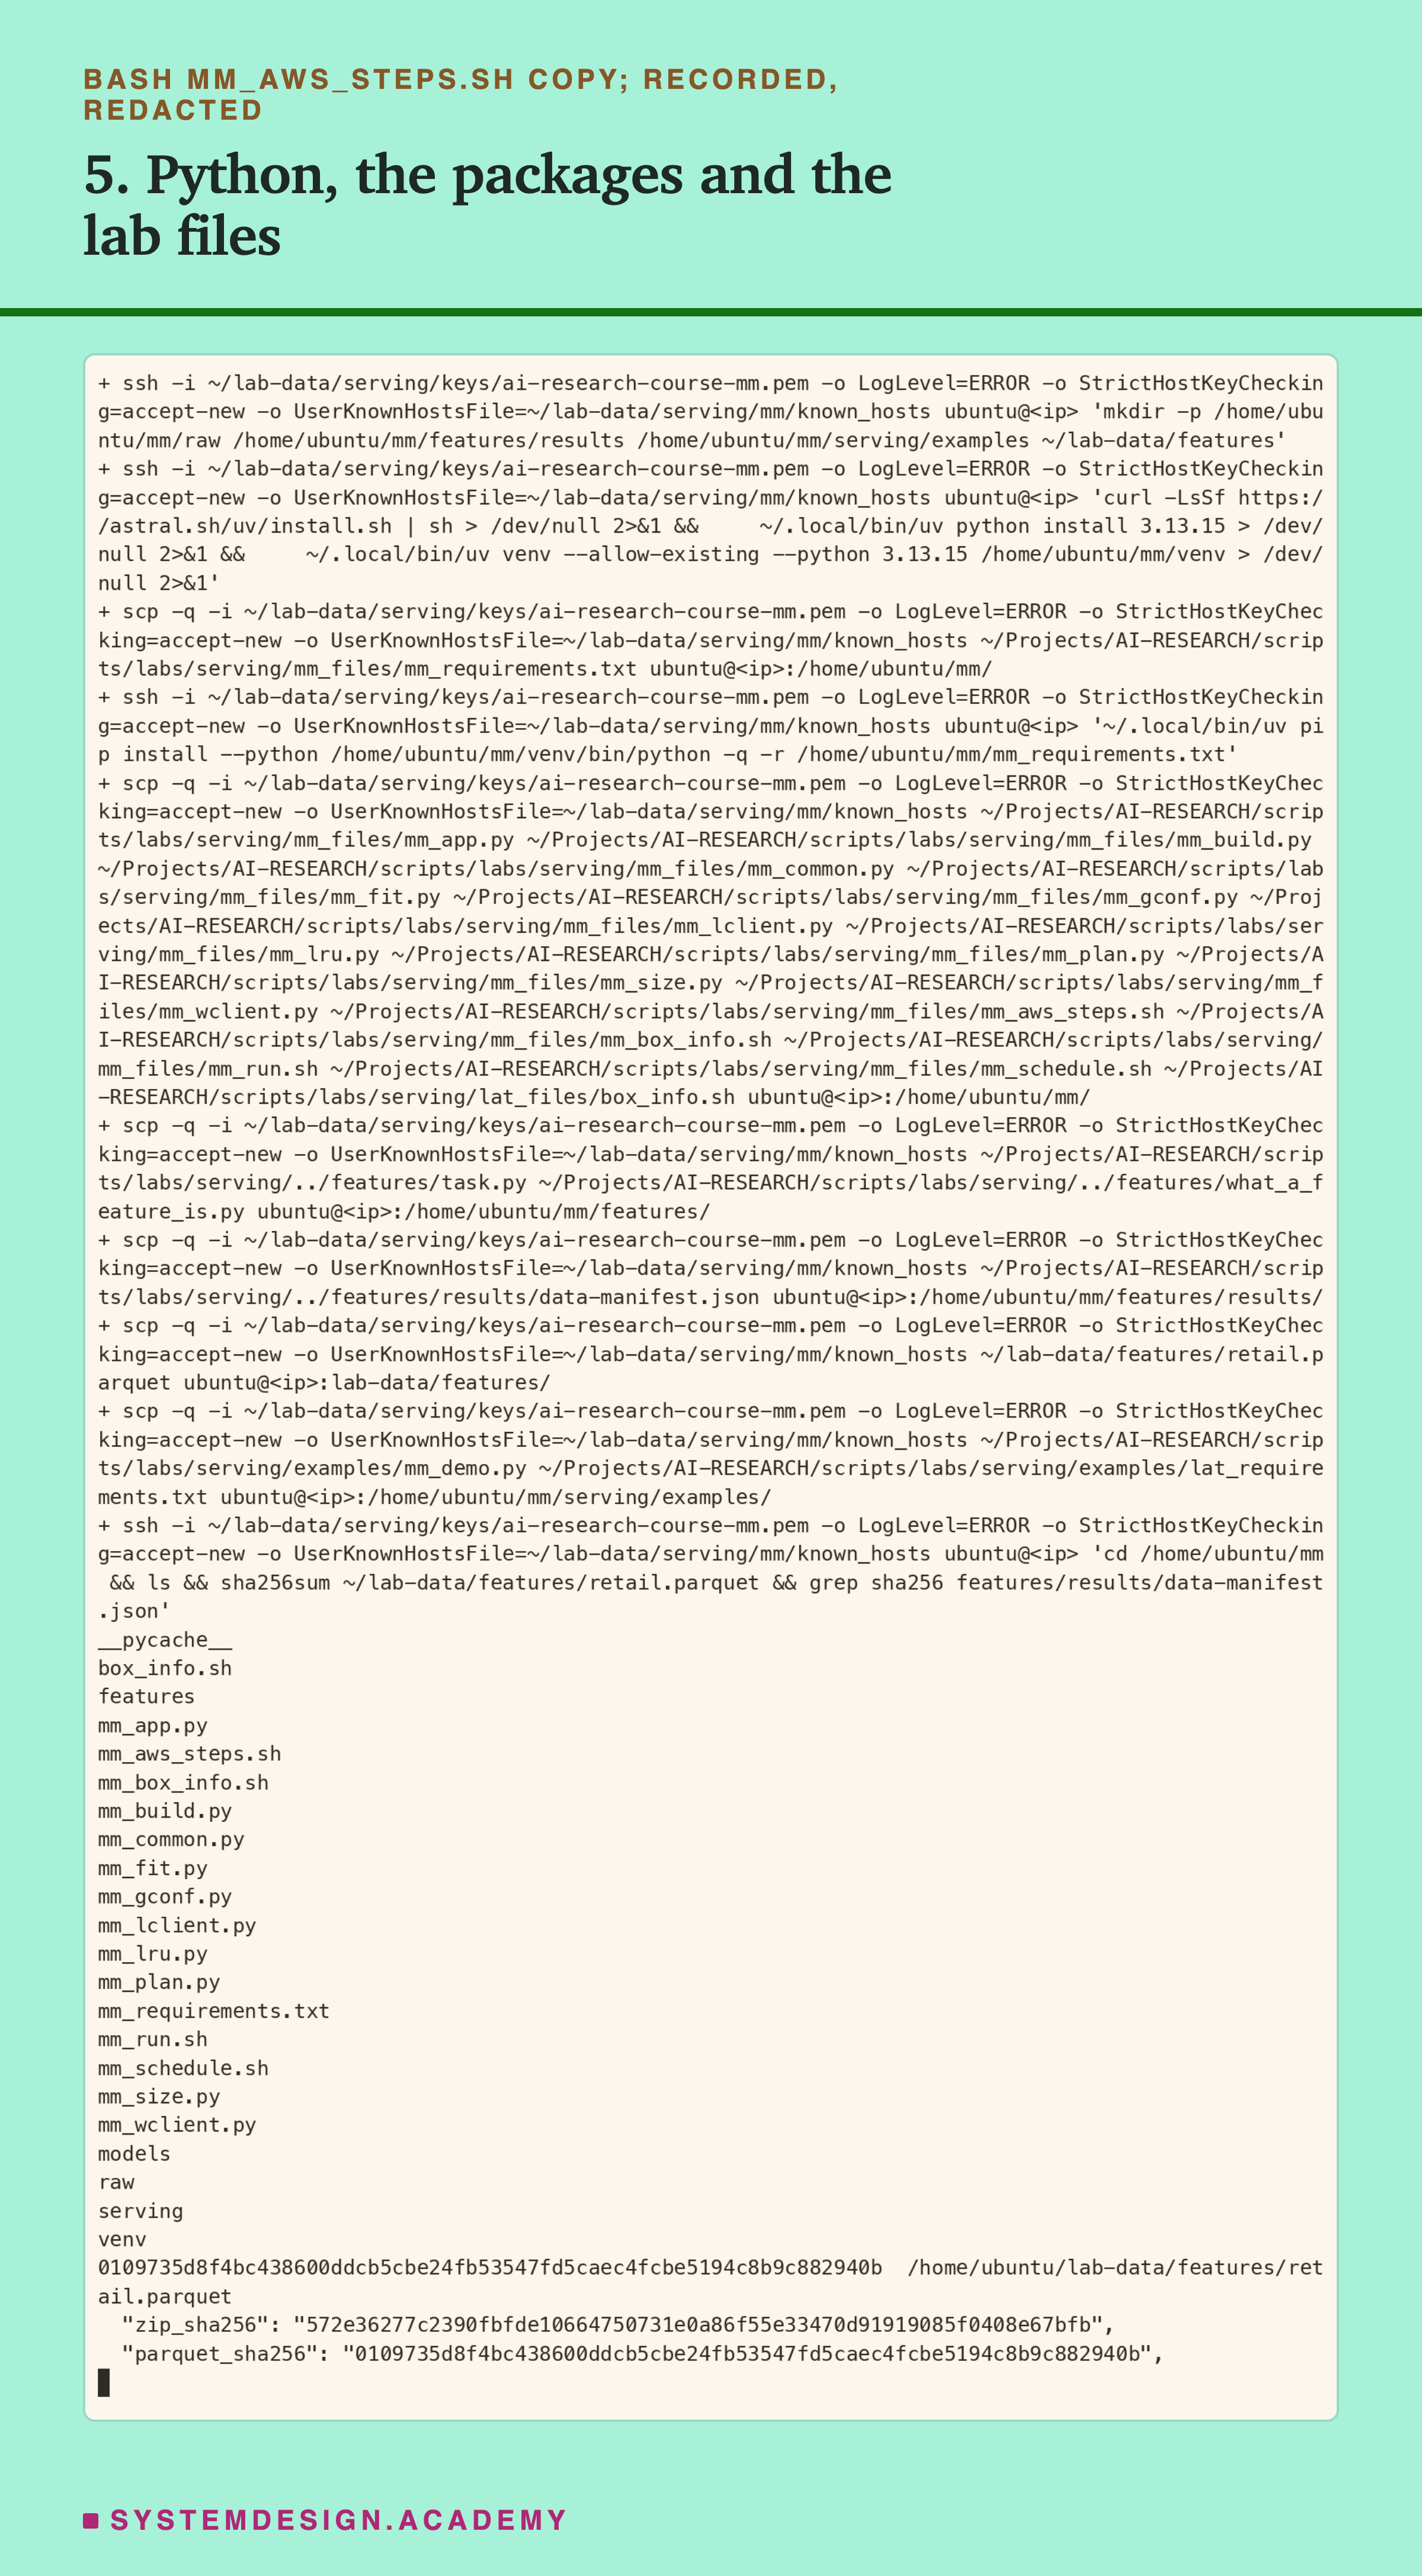
The two fingerprints match, so the computer trains on the same data as the features chapter. These are all the commands of the step, run after step 4 has set IP:
  S=(ssh -i "$KEY" "${SSHO[@]}" ubuntu@"$IP")
  C=(scp -q -i "$KEY" "${SSHO[@]}")
  "${S[@]}" "mkdir -p $B/raw $B/features/results $B/serving/examples ~/lab-data/features"
  "${S[@]}" "curl -LsSf https://astral.sh/uv/install.sh | sh > /dev/null 2>&1 && \
    ~/.local/bin/uv python install 3.13.15 > /dev/null 2>&1 && \
    ~/.local/bin/uv venv --allow-existing --python 3.13.15 $B/venv > /dev/null 2>&1"
  "${C[@]}" "$HERE/mm_files/mm_requirements.txt" ubuntu@"$IP":$B/
  "${S[@]}" "~/.local/bin/uv pip install --python $B/venv/bin/python -q -r $B/mm_requirements.txt"
  "${C[@]}" "$HERE"/mm_files/mm_*.py "$HERE"/mm_files/mm_*.sh "$HERE/lat_files/box_info.sh" ubuntu@"$IP":$B/
  "${C[@]}" "$FEAT/task.py" "$FEAT/what_a_feature_is.py" ubuntu@"$IP":$B/features/
  "${C[@]}" "$FEAT/results/data-manifest.json" ubuntu@"$IP":$B/features/results/
  "${C[@]}" "$HOME/lab-data/features/retail.parquet" ubuntu@"$IP":lab-data/features/
  "${C[@]}" "$HERE/examples/mm_demo.py" "$HERE/examples/lat_requirements.txt" ubuntu@"$IP":$B/serving/examples/
  "${S[@]}" "cd $B && ls && sha256sum ~/lab-data/features/retail.parquet && grep sha256 features/results/data-manifest.json"
Steps 7, 8 and 7b: Start, Watch, and One Restart
Step 7: start the schedule, then leave. The schedule starts in the background with setsid nohup, a command that keeps a program running after I log out. Nobody logs in again until it ends.
Step 8: watch without touching. While it runs, the schedule writes one progress line to the computer's serial console after every run. The serial console is a log that AWS keeps for the computer, and you can read it through AWS without logging in.
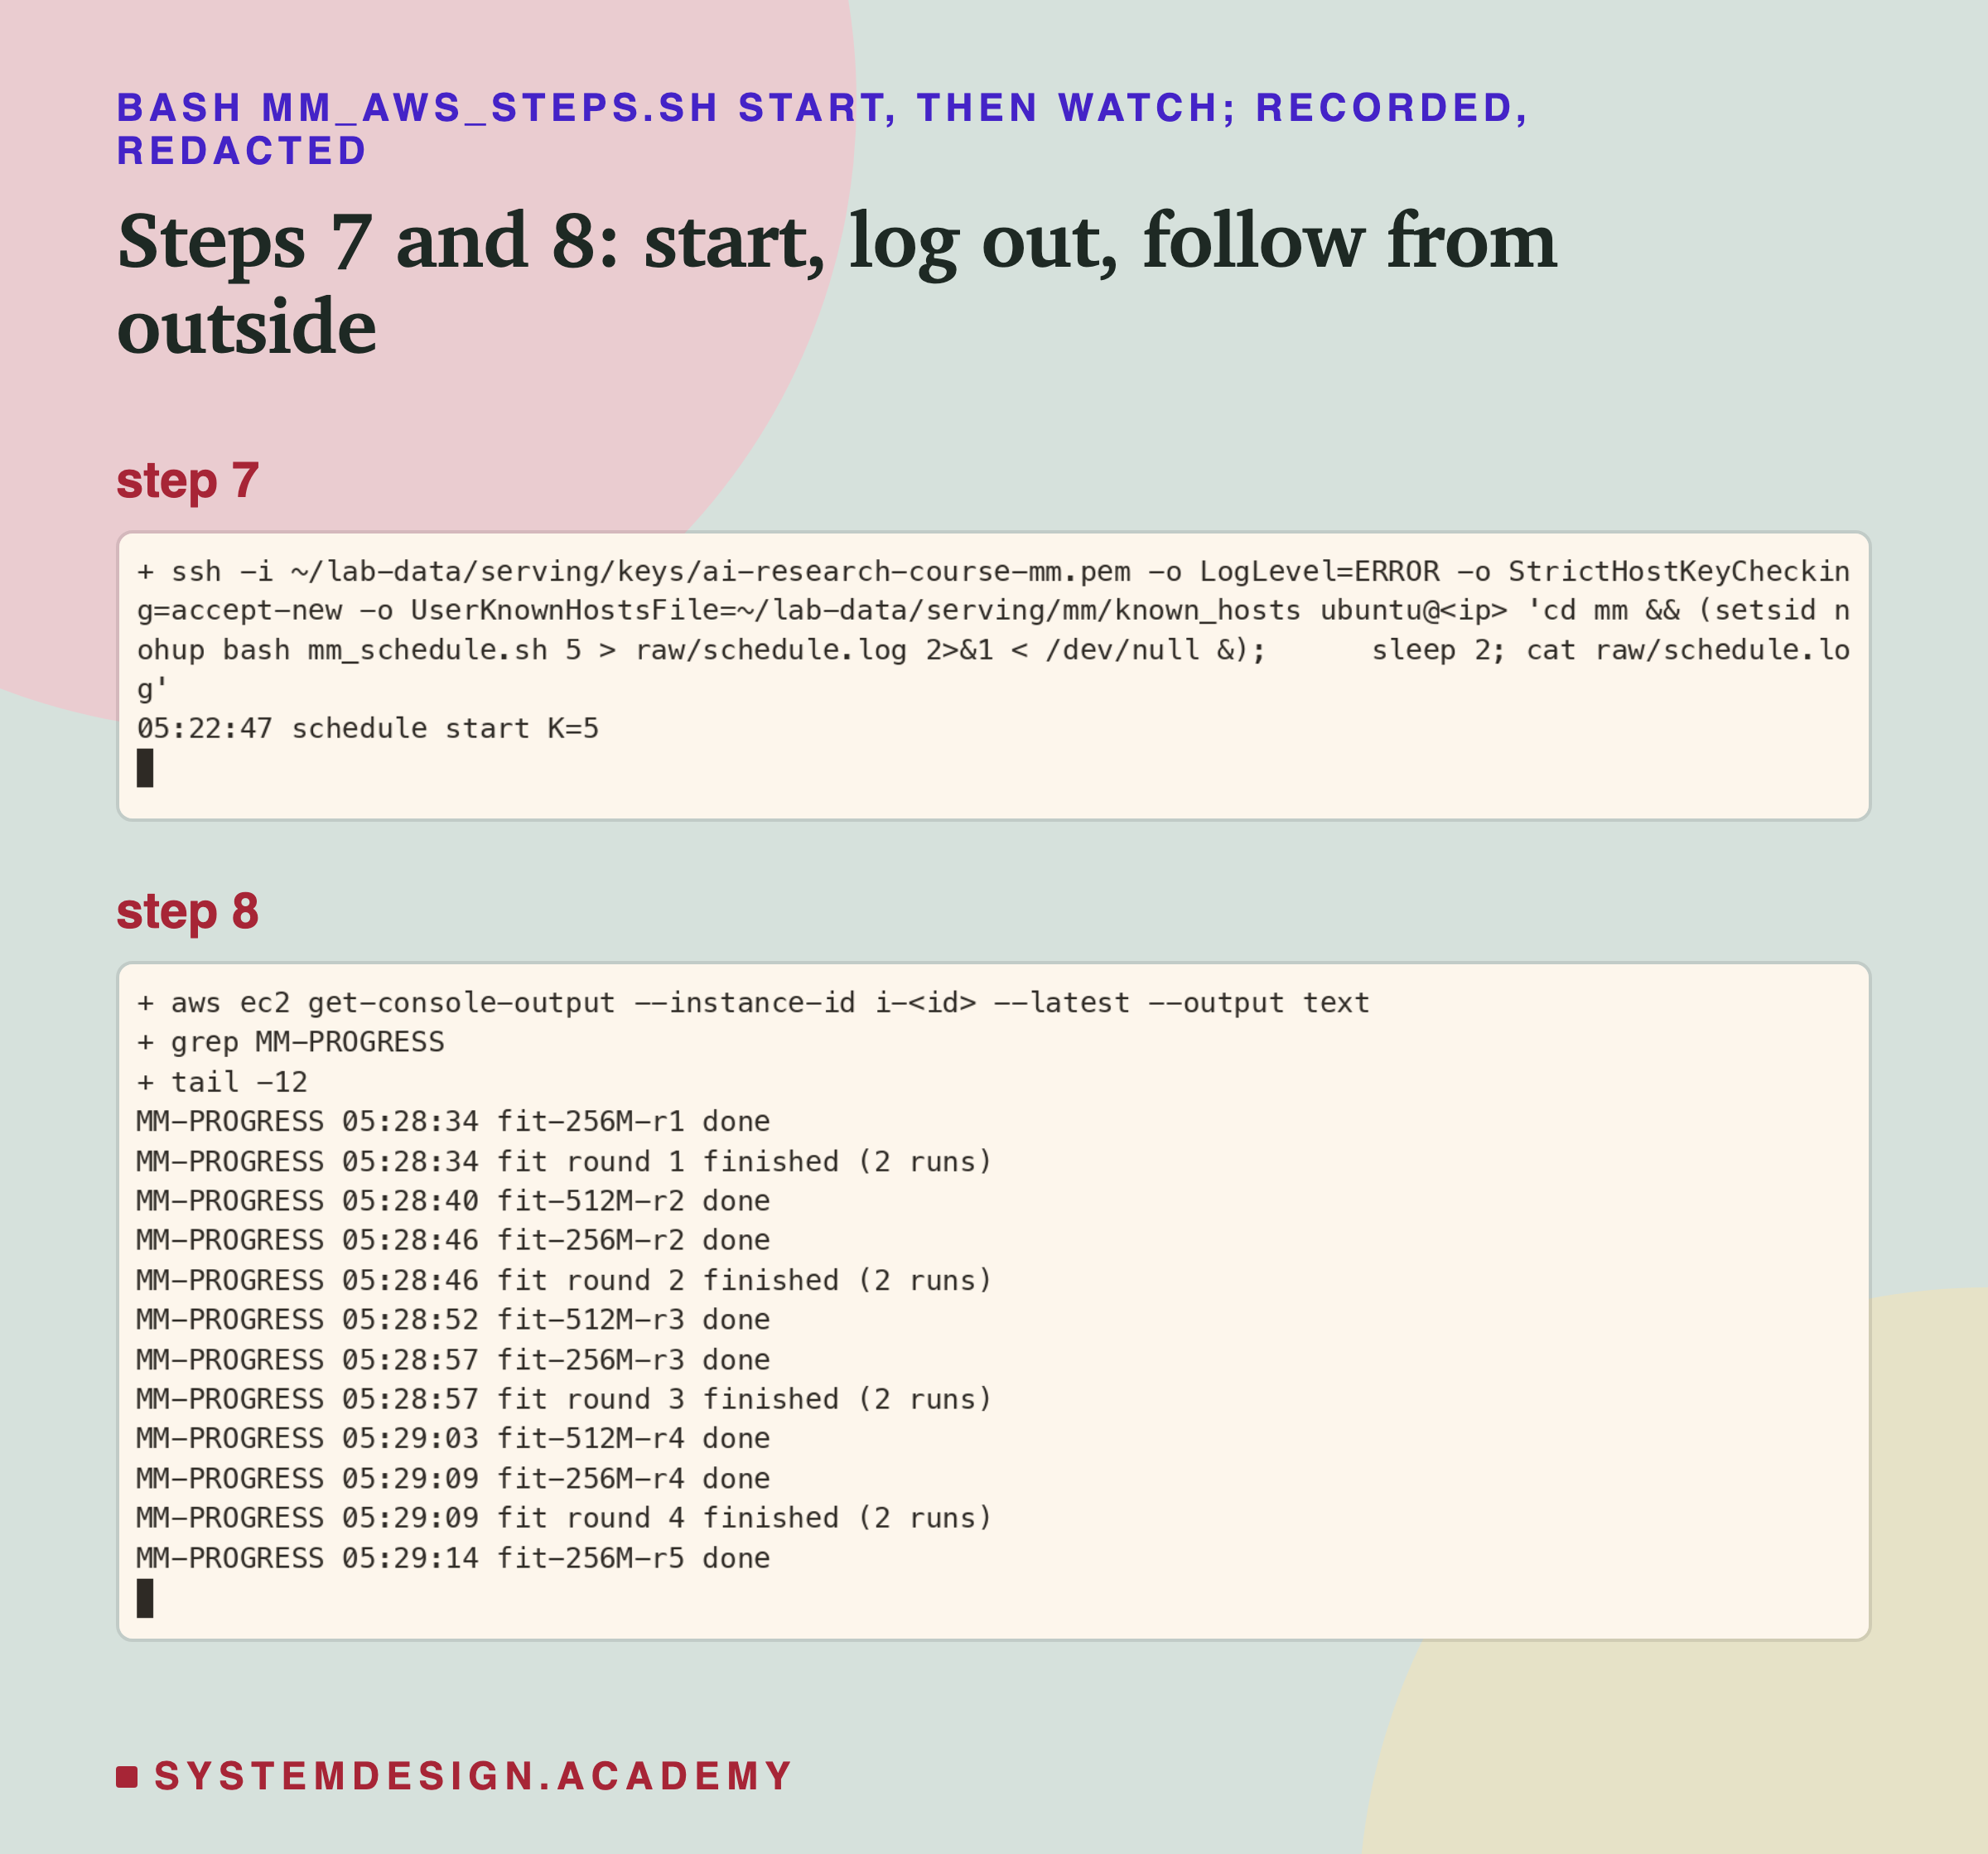
The log's first line appeared two seconds after the start. The number 5 is the count of rounds. The progress lines came from AWS's copy of the console while the runs went on. These are the two commands:
  ssh -i ~/lab-data/serving/keys/ai-research-course-mm.pem "${SSHO[@]}" ubuntu@"$IP" \
    "cd mm && (setsid nohup bash mm_schedule.sh $K > raw/schedule.log 2>&1 < /dev/null &); \
     sleep 2; cat raw/schedule.log"
  aws ec2 get-console-output --instance-id "$ID" --latest --output text | grep MM-PROGRESS | tail -12
Step 7b: I logged in once, and restarted part of the schedule. I did not record this step. Watching the console, I saw two runs of the workers part take more than five minutes each instead of about 35 seconds. I logged in to look. My tester had read a worker's "ready" note while the worker was still writing it. It found an empty file and stopped with an error, and it left that gunicorn running. Every later run then found its port taken, and failed.
I stopped the schedule. My first stop command was too broad: it also ended my own login. So I stopped the two programs that were left by their process numbers. Then I fixed the tester: the workers now write each note under a temporary name and rename it when it is done. I tested the fixed tester once on the computer (that test is not counted), and copied the fixed files over.
I set the first try's workers files aside, in , together with the first schedule's log, which shows the slow runs. Then I started the workers part again from round 1, and the cache part for the first time. The size and fit parts had finished before the bug, so I kept them. No number in this lesson comes from the first try's workers runs.
Steps 11 to 13: Demo, Bring It Home, Delete
Step 11: the student demo, on the same computer. After the schedule, I ran the demo you will meet later, so you can see what it prints on one core.
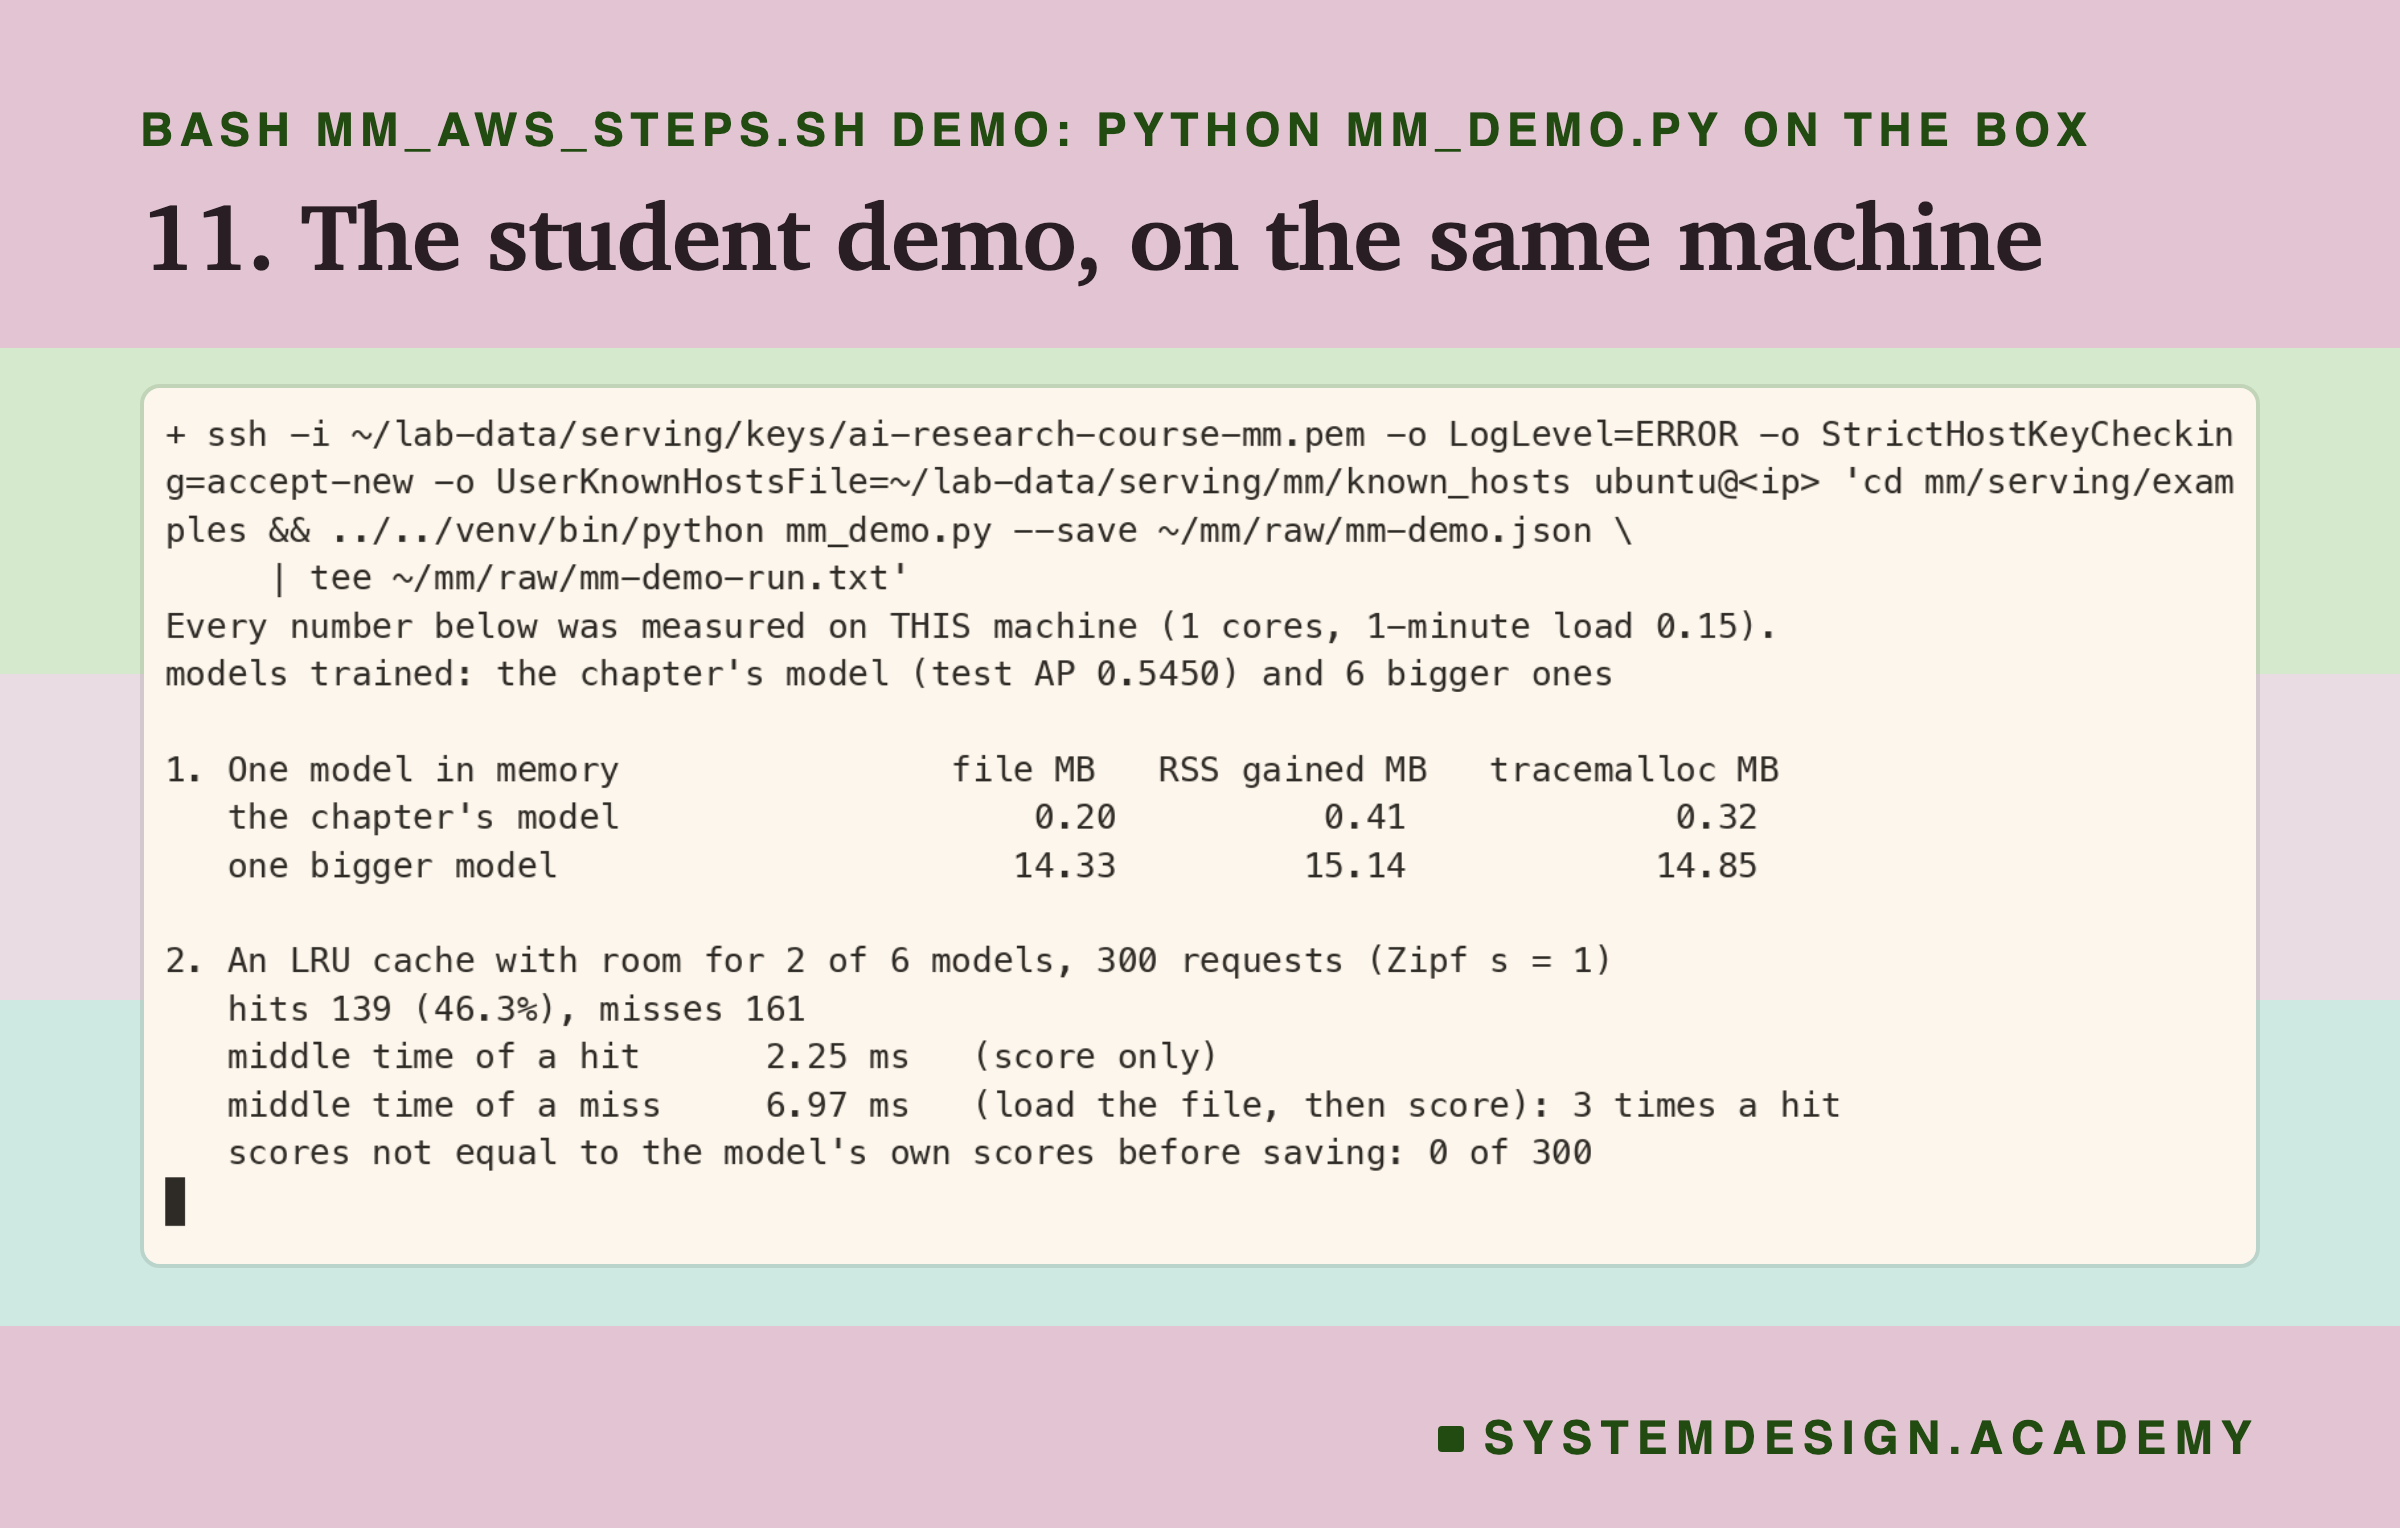
This run happened after the last measured run had finished, so it could not disturb any number. Its first line says "1 cores", which is how my demo prints the count. "Test AP" is the chapter's score for how well a model puts the real buyers near the top of its list; the code slide says more. This is the command:
  ssh -i ~/lab-data/serving/keys/ai-research-course-mm.pem "${SSHO[@]}" ubuntu@"$IP" \
    'cd mm/serving/examples && ../../venv/bin/python mm_demo.py --save ~/mm/raw/mm-demo.json \
     | tee ~/mm/raw/mm-demo-run.txt'
Step 12: bring the results home first. A whole box of results was lost once in this chapter, because it was deleted before anyone copied them. So the raw files come home before anything is deleted.
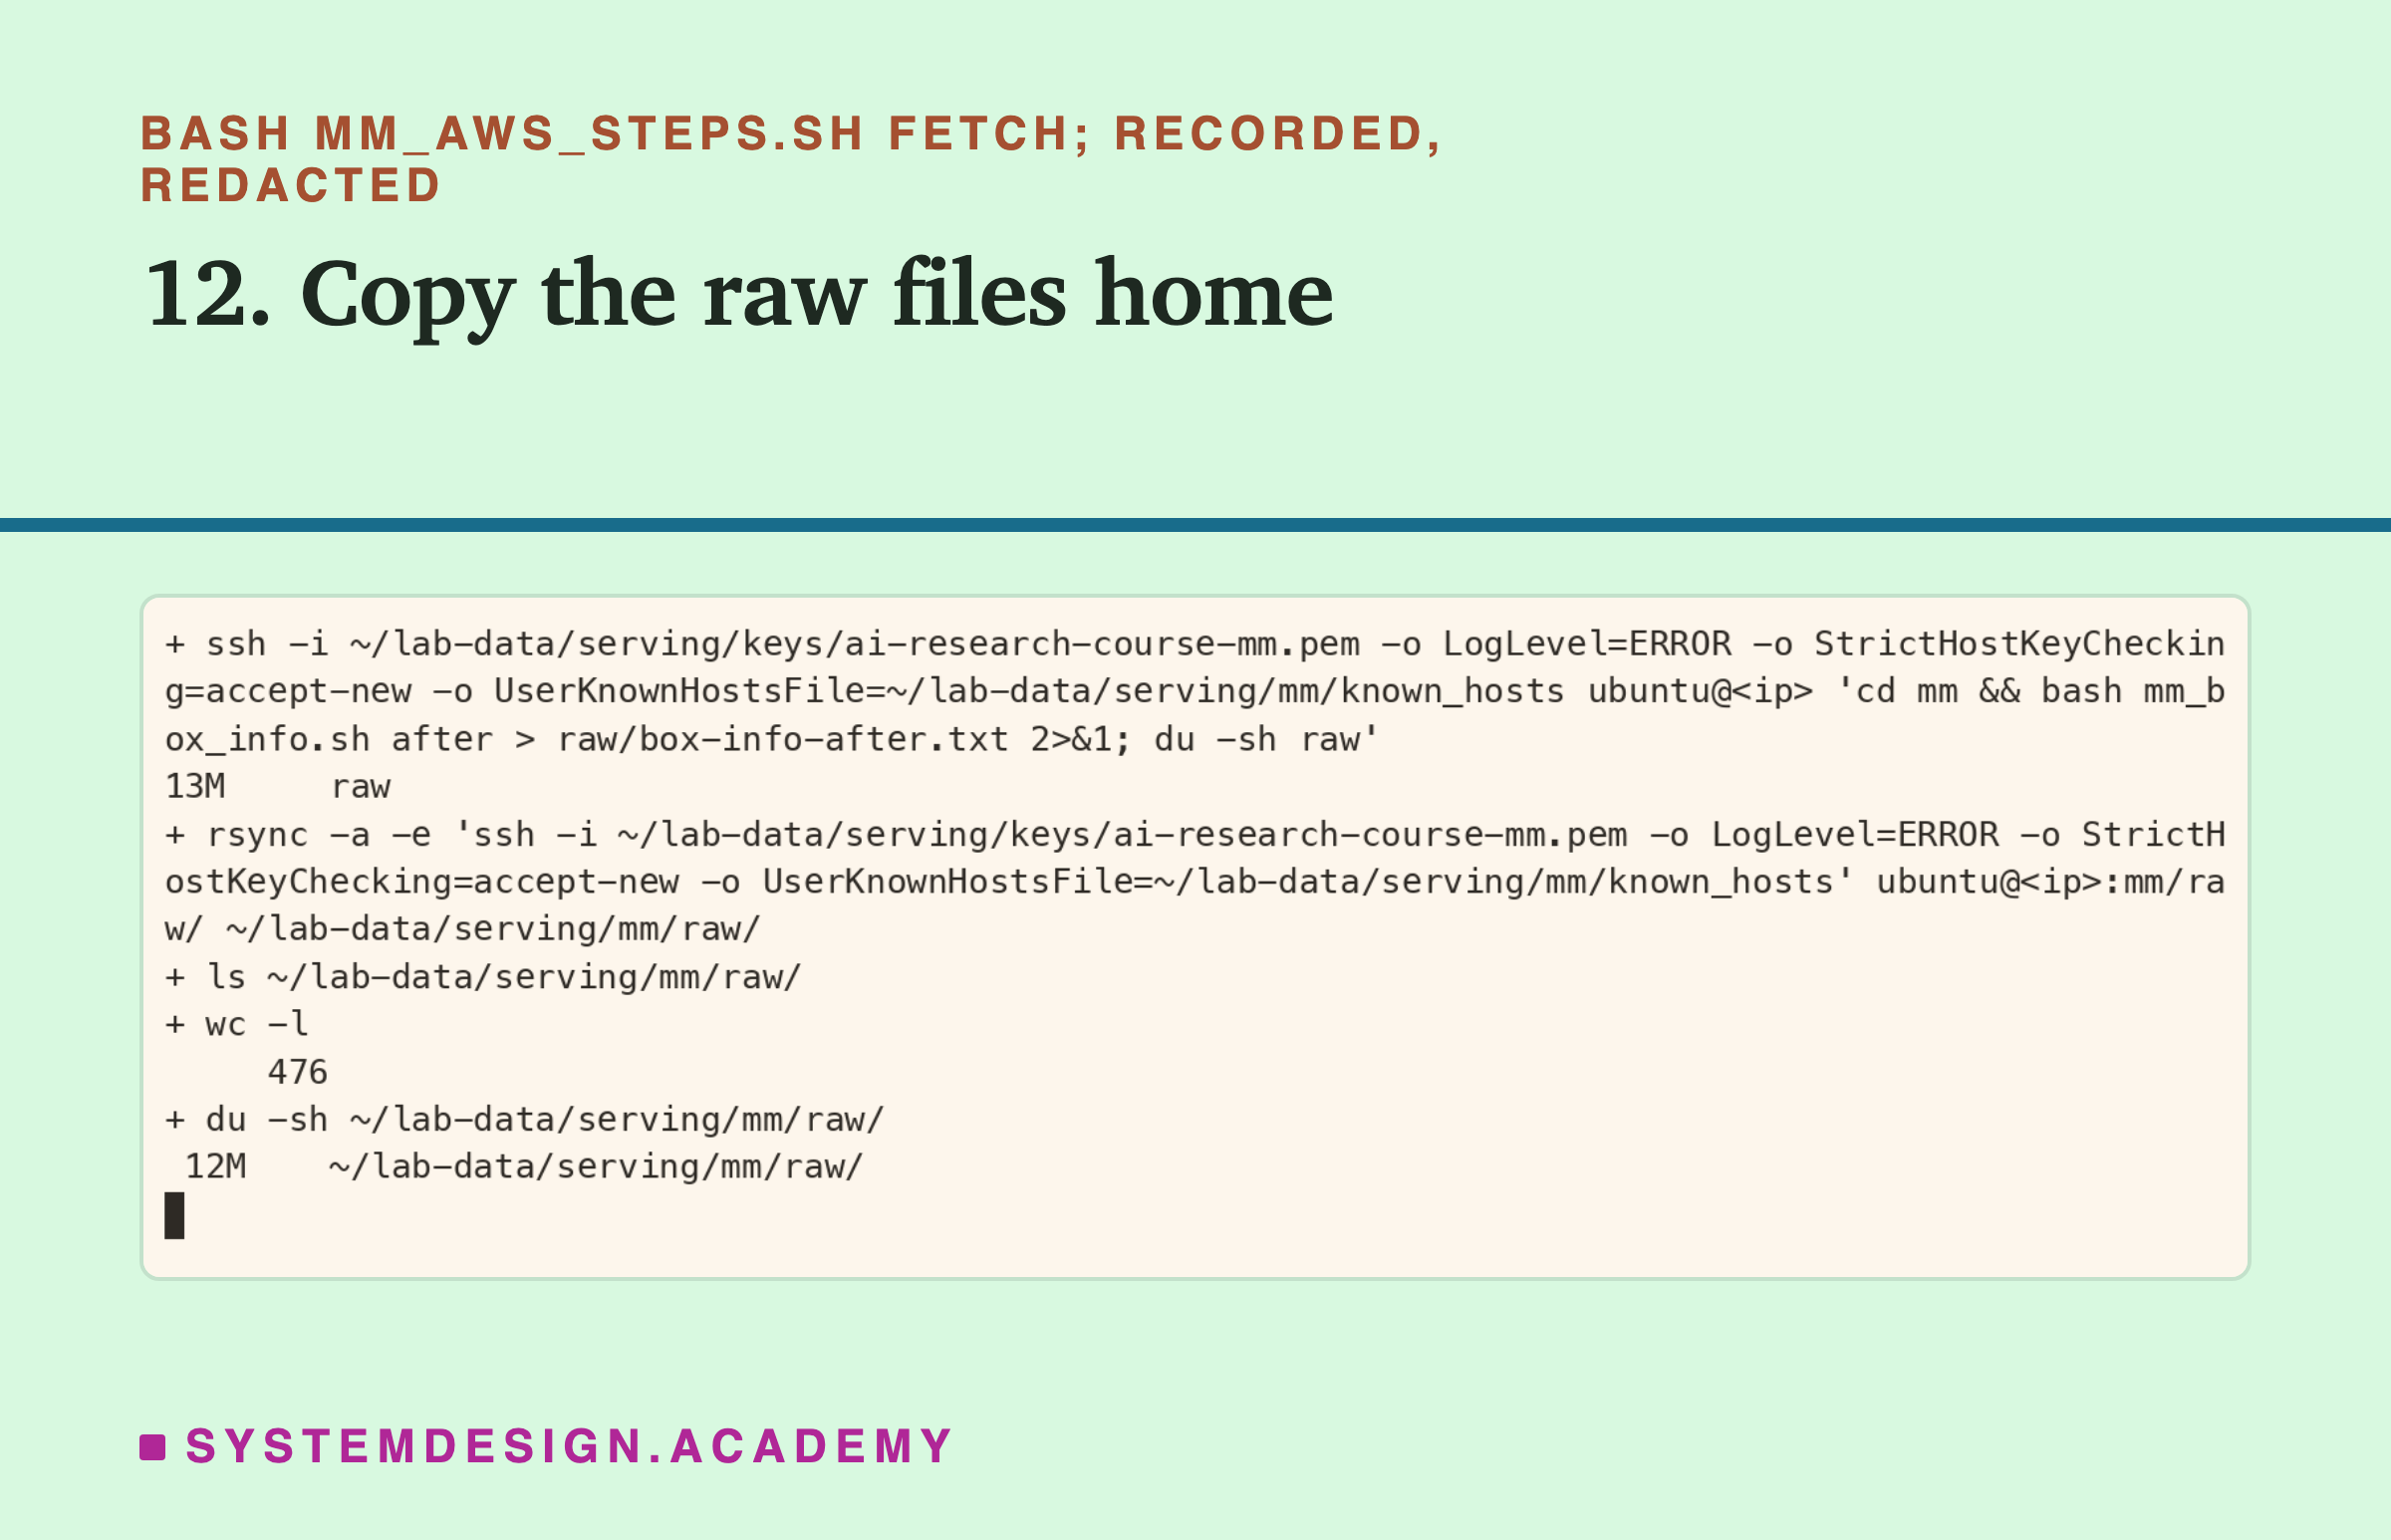
The 476 files came to 12 MB. I keep a copy of 4.7 MB in the repo, without the trained models and their saved scores, which the schedule can make again. These are the commands:
  ssh -i ~/lab-data/serving/keys/ai-research-course-mm.pem "${SSHO[@]}" ubuntu@"$IP" \
    'cd mm && bash mm_box_info.sh after > raw/box-info-after.txt 2>&1; du -sh raw'
  rsync -a -e "ssh -i $KEY ${SSHO[*]}" ubuntu@"$IP":mm/raw/ ~/lab-data/serving/mm/raw/
  ls ~/lab-data/serving/mm/raw/ | wc -l
  du -sh ~/lab-data/serving/mm/raw/
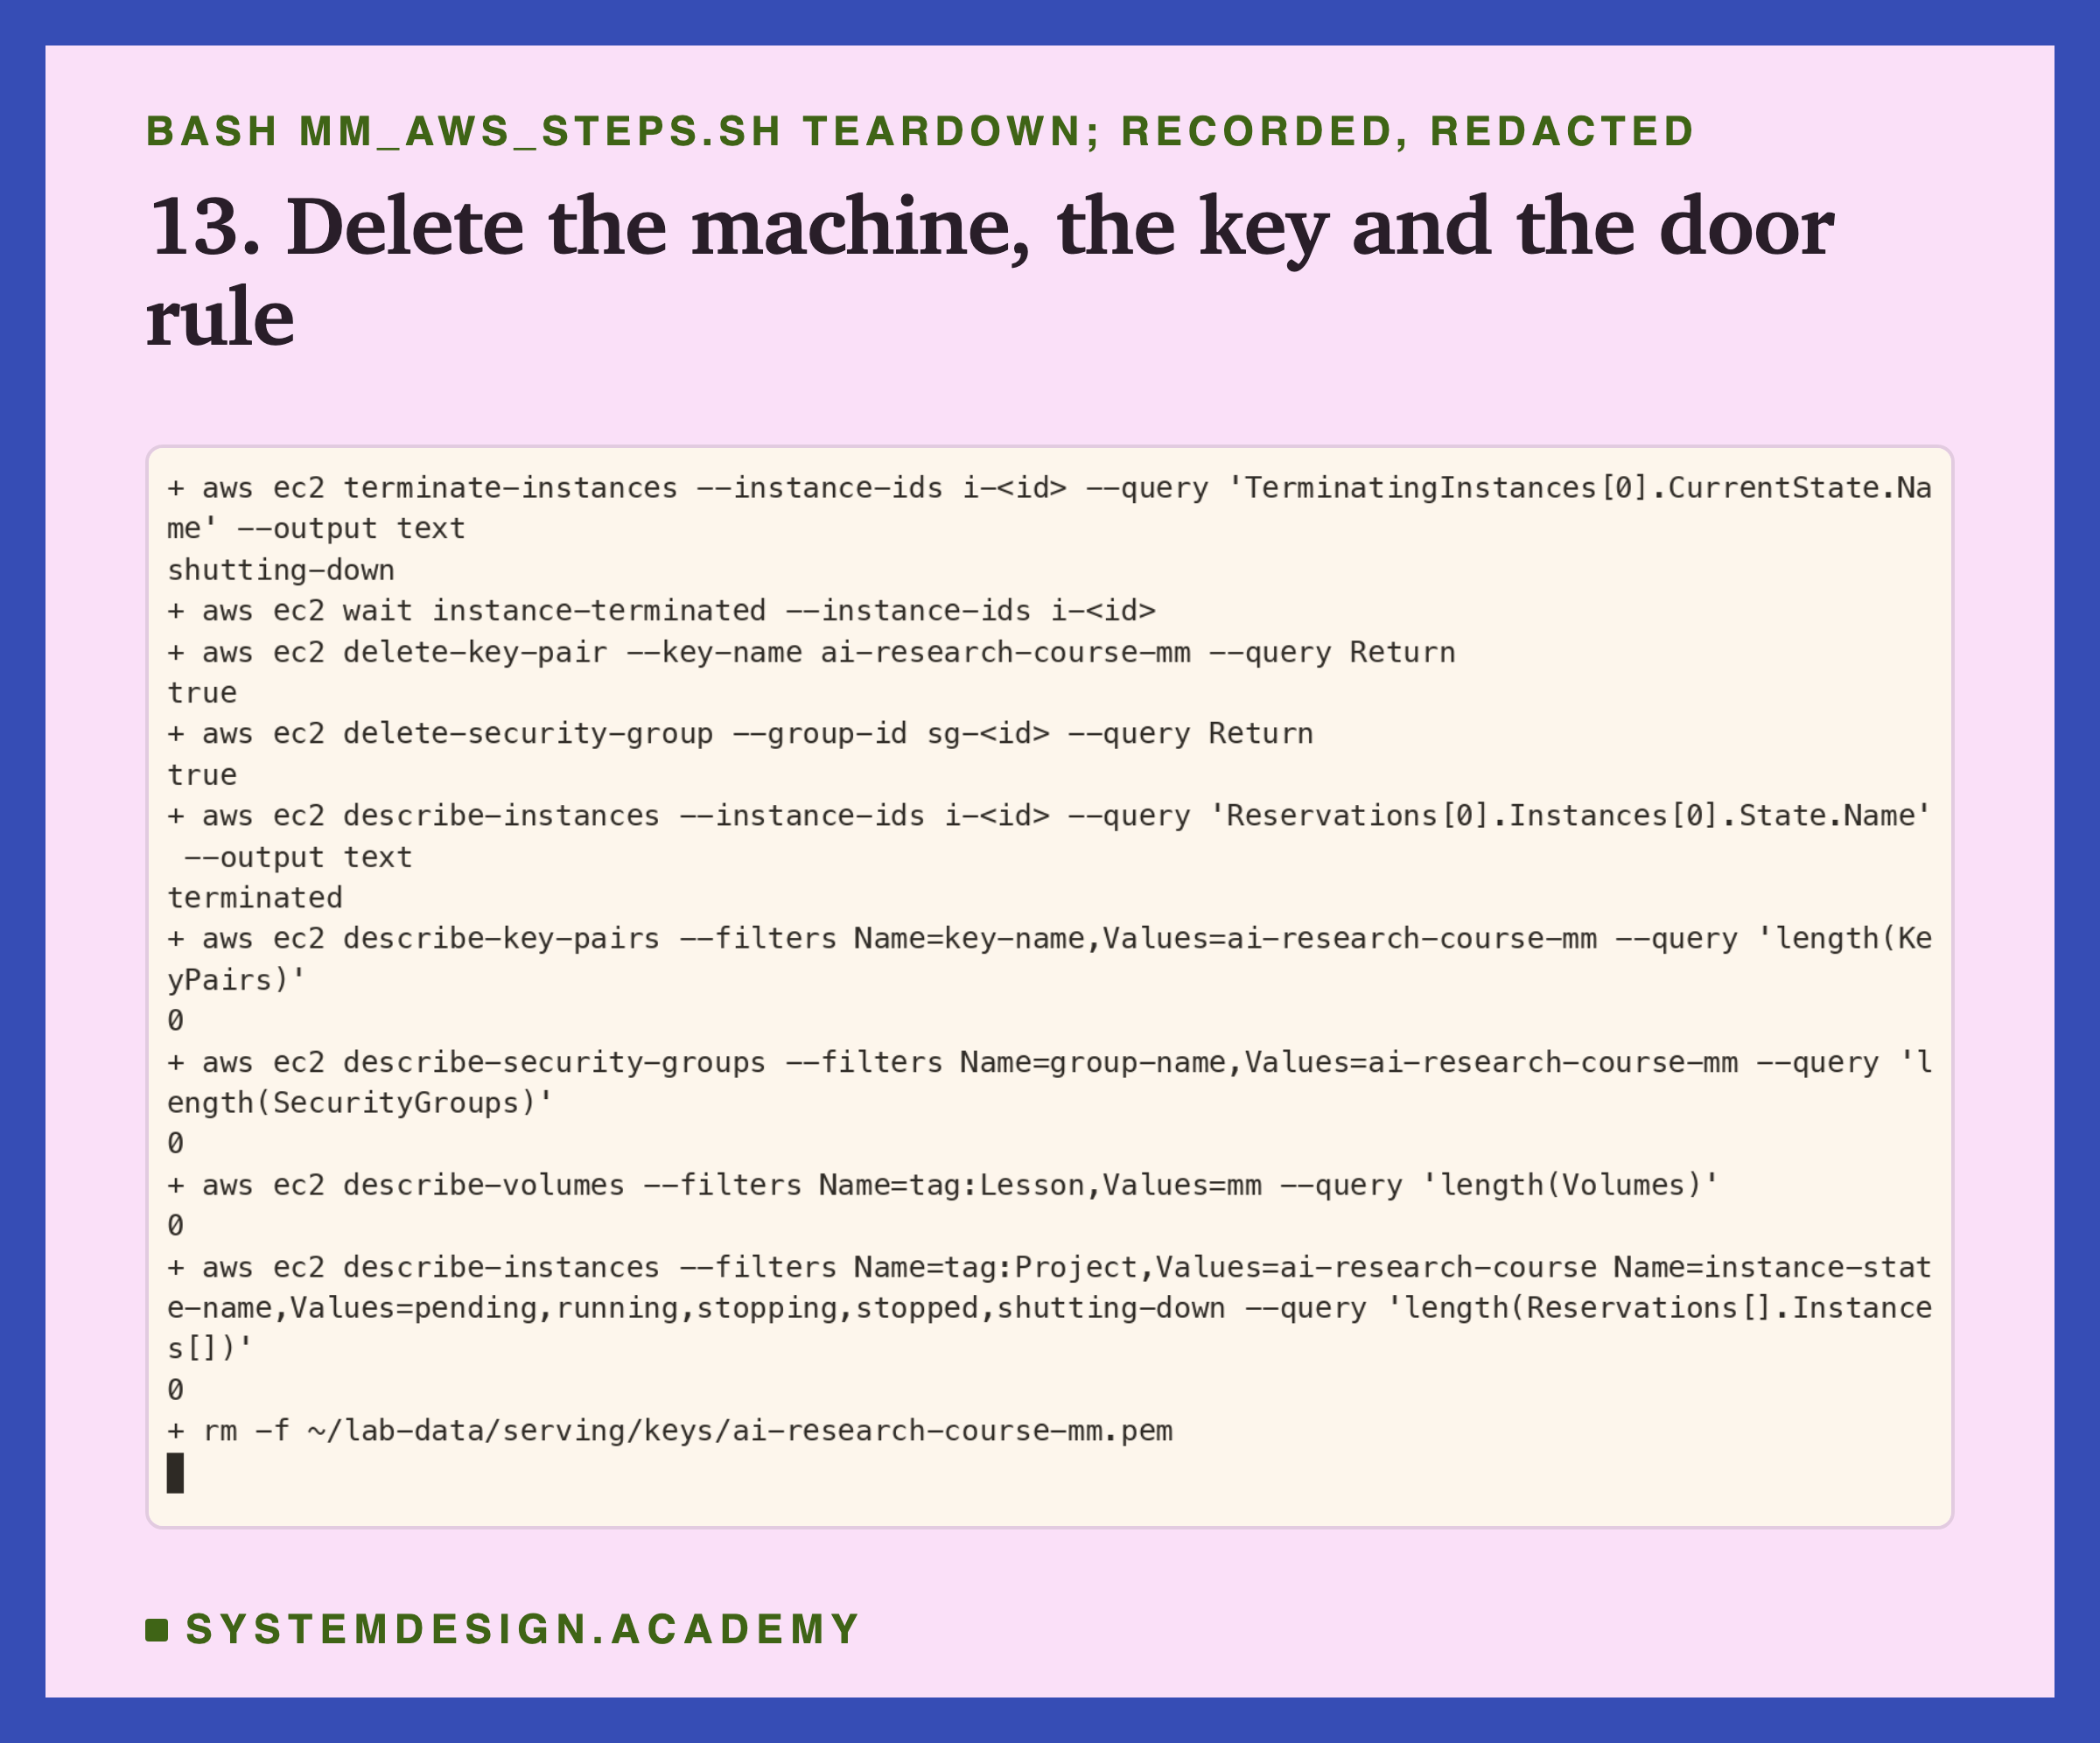
Step 13: delete the computer, the key and the door rule, and check. A computer you forget keeps costing money. The script deletes the computer, waits until says "terminated", then deletes the key pair and the security group, and asks AWS again.
The Lab's Report, Running
This is a real recording of the report script, mm_report.py. It ran on my laptop, but it measures nothing. It reads the raw files the rented computer wrote and does all the arithmetic again with its own code.
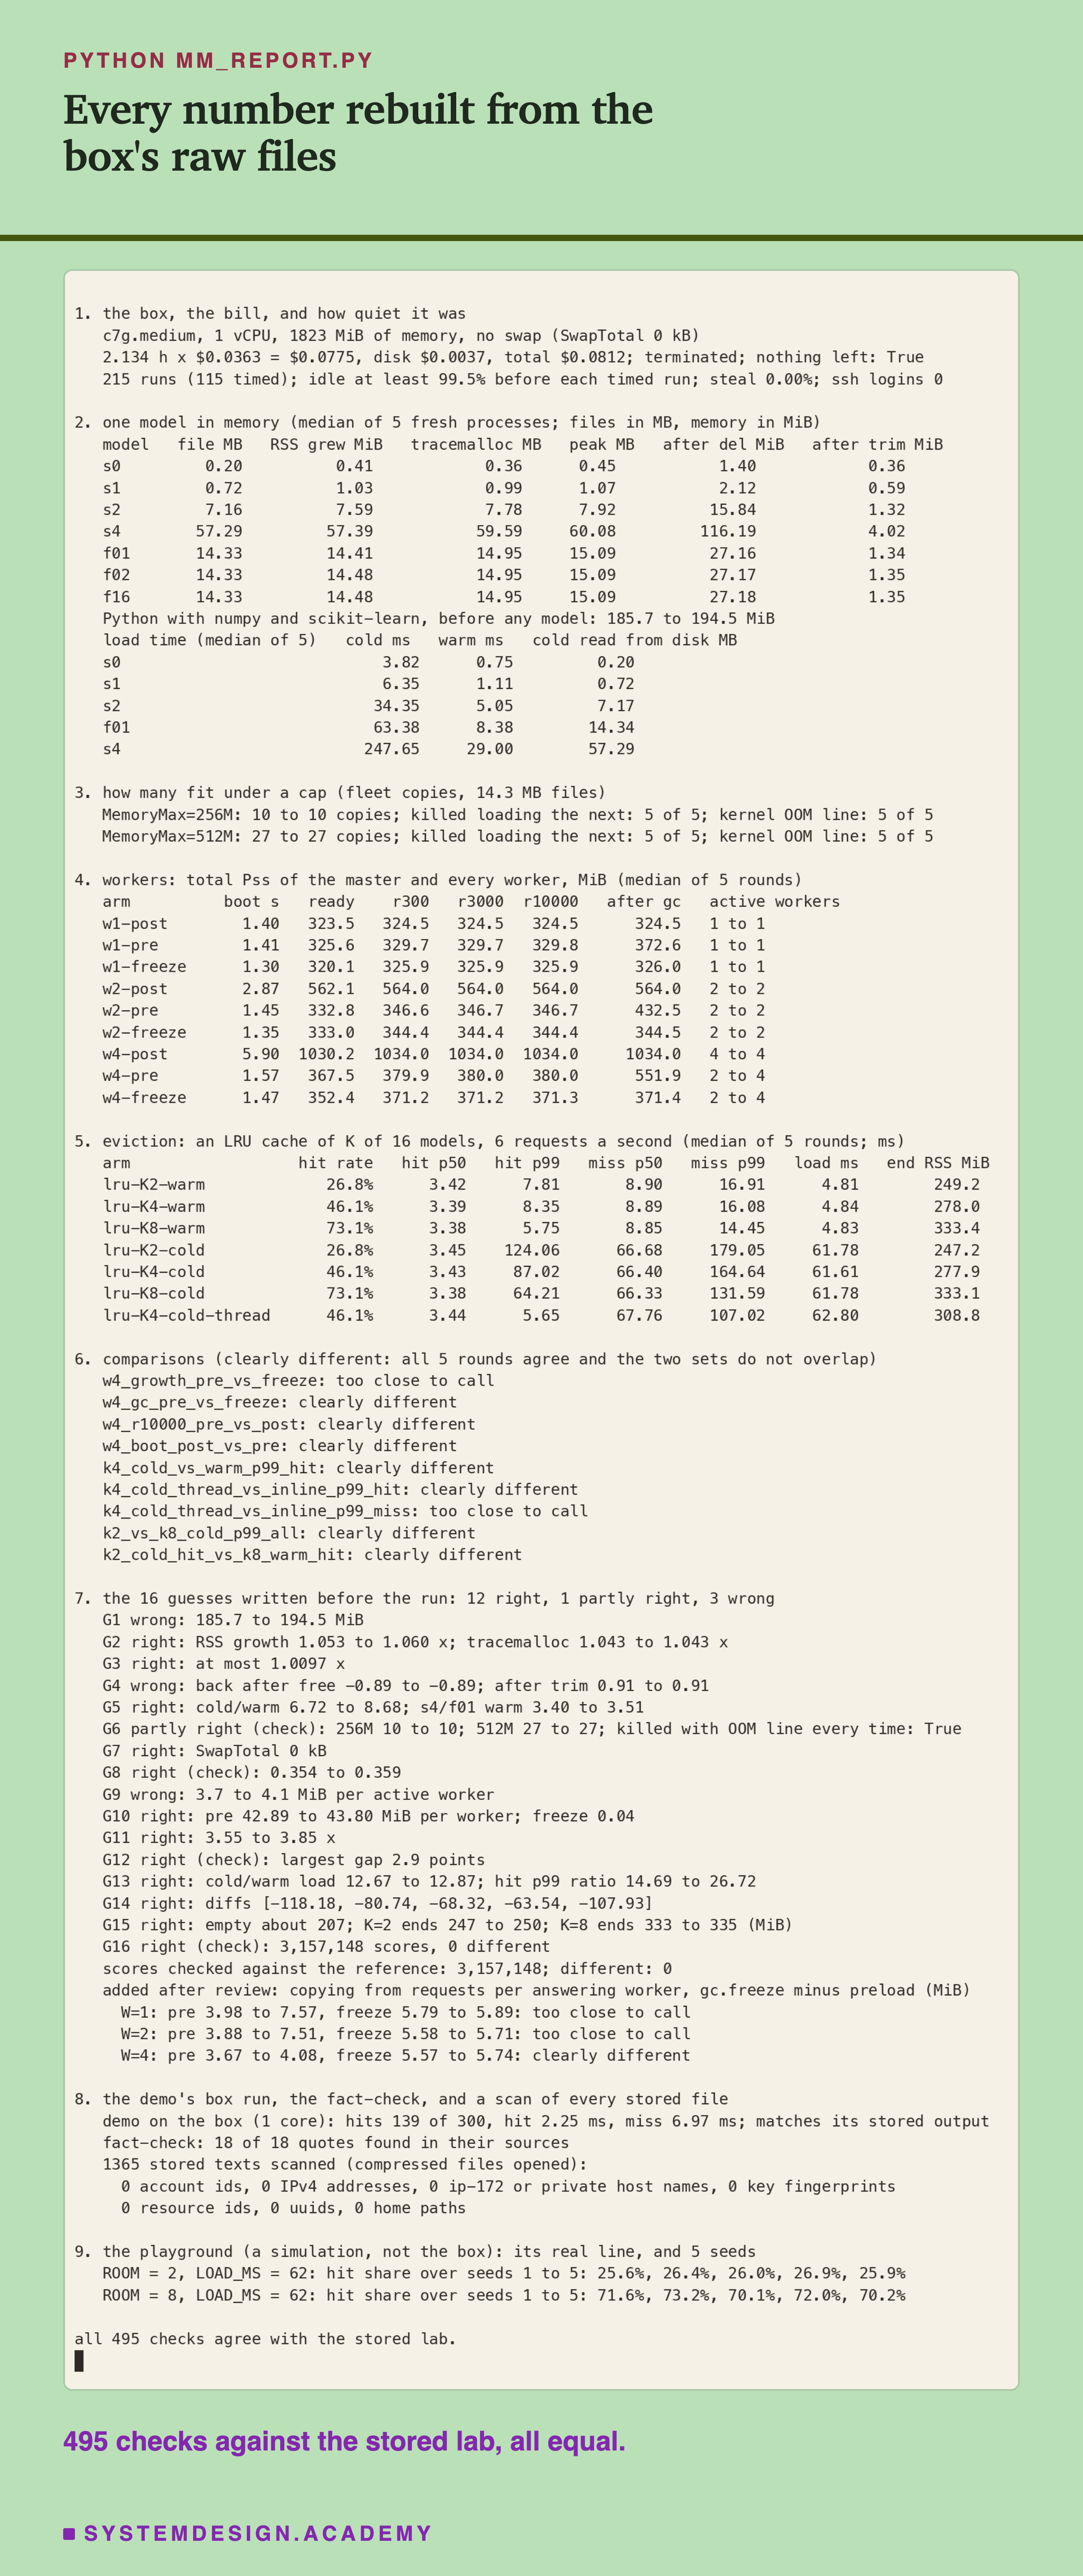
The report does not use the lab's own code. It works out its own middle values, its own slowest 1 in 100, its own shares and its own verdicts. Then it compares every one with the lab's results file. If any number disagreed, it would stop with an error. I checked that too. I changed one stored wait by a thousandth of a millisecond, and the report printed "1 MISMATCHES" and stopped with an error. Then I put the file back.
Section 8 scans every stored file, even the text inside the packed .npz data files and the terminal recordings. It looks for my account number, IP addresses, host names, AWS ids, secret-looking codes and my home folder. It found 0 of each.
How Big Is One Model in Memory?
The first question sounds simple. If a model file is 14 MB on the disk, how much memory does it take once loaded?
For each of the 20 models, a fresh Python program first loaded numpy and scikit-learn, as a service would. Then it read its own memory (RSS), loaded the model, and read it again. It also asked Python's own counter, tracemalloc, which counts every block of memory Python hands out. Python's documentation calls it "a debug tool to trace memory blocks allocated by Python".
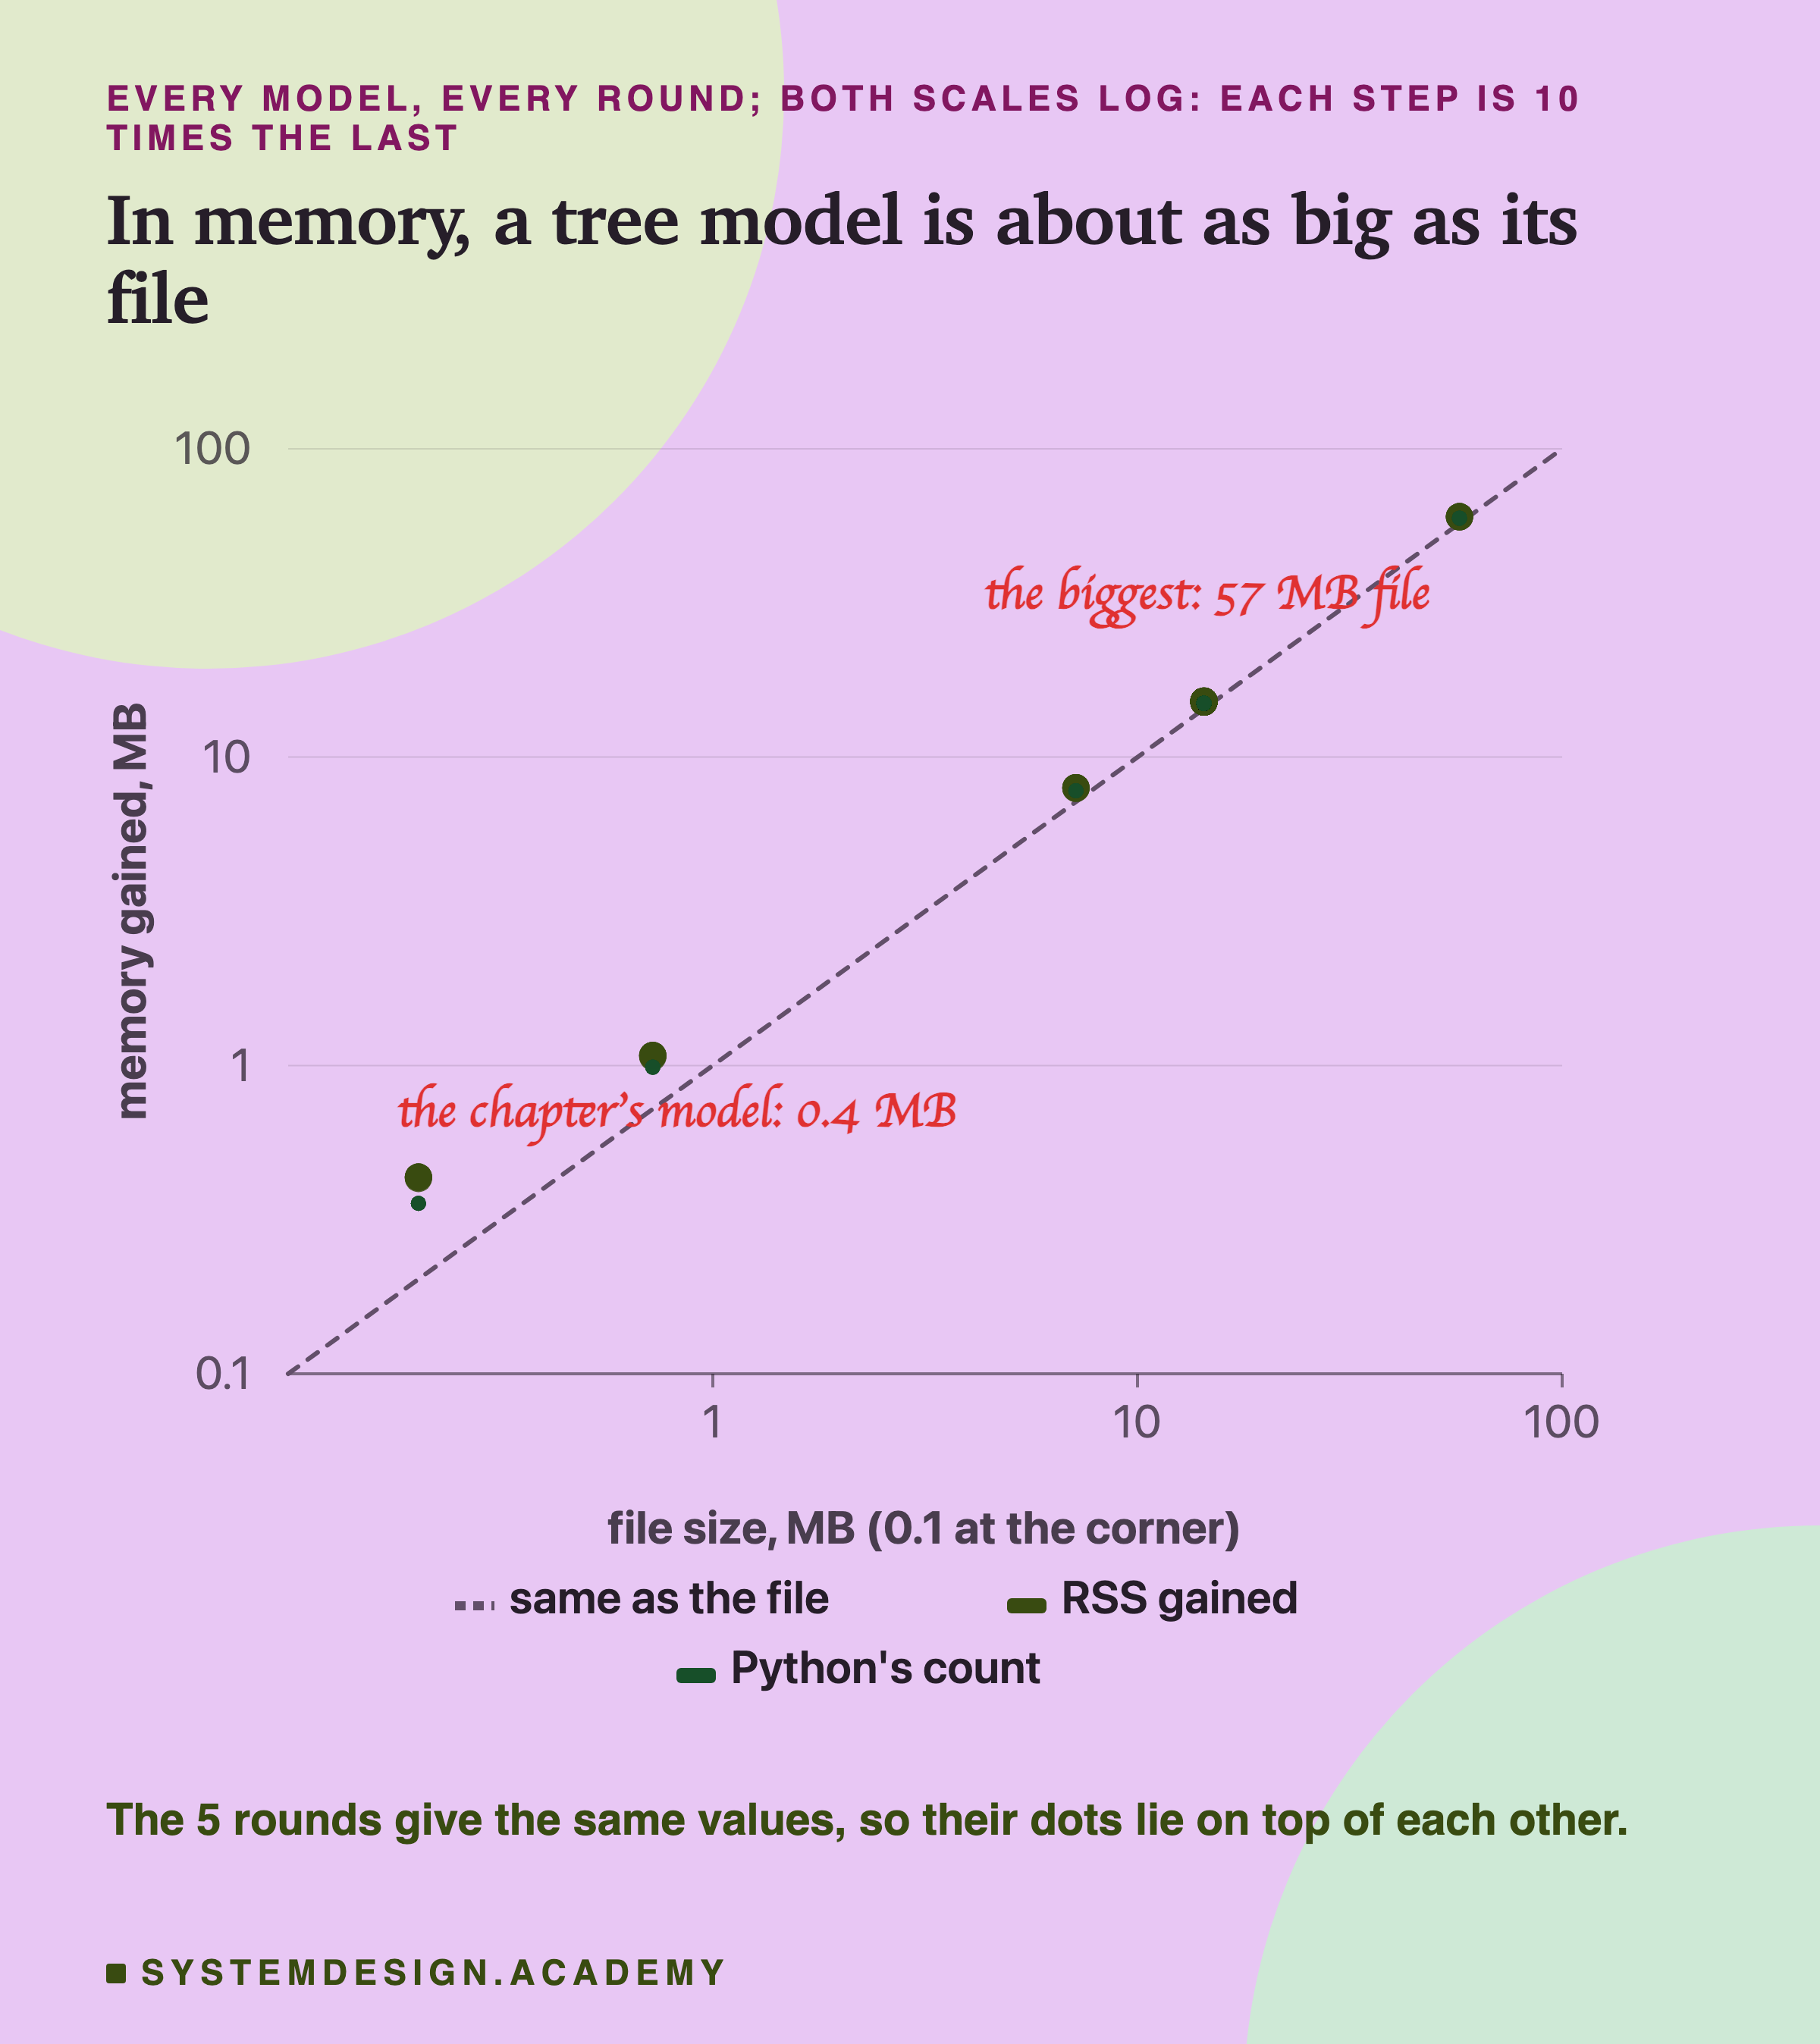
Both scales of this chart are log scales: each step is 10 times the last, so 0.1, 1, 10, 100. That lets a 0.2 MB model and a 57 MB model sit on one picture.
For the bigger models, memory and file size matched closely. The fleet models grew the program's memory by 1.05 to 1.06 times their file size. Python's own count was 1.04 times. A tree model from scikit-learn keeps its trees in long rows of numbers stored side by side, and pickle saves those rows almost byte for byte.
For the smallest model, memory was about twice the file. The chapter's model is 0.20 MB on disk, and the program grew by 0.43 MB. Memory comes in 4 KB pieces, like buying paper by the pad, so a tiny model still uses whole pads.
There was no hidden doubling while loading. Python's highest count during a fleet load was at most 1.01 times its count after the load. So loading did not need a second copy of the model, even for a moment.
A Load Is a Truck: From Near or From Far
Loading a model is like a truck bringing books to the shelf. If the books are on the trolley by the desk, the truck has a short trip. If they are in the store room, it has a long one.

For the warm load, the file was already in the page cache, so nothing came from the disk. For the cold load, the program first asked Linux to forget its saved copy of the file. The command for that is posix_fadvise; its manual says it "attempts to free cached pages associated with the specified region". The program then read 14.3 MB from the disk, the whole file, so the request worked. That is a check, not a finding.
The finding is the size of the gap. 63.4 ms from the disk against 8.4 ms from the page cache, in the middle round. The disk of a rented computer like this is a network disk. It sits in another building and is reached over a cable, like a library store room across the street.
Load time grew with the file in both cases. The biggest model, 57.3 MB, took 29 ms warm and 248 ms cold. The chapter's small model took 0.75 ms warm and 3.8 ms cold. The bigger the file, the bigger the gap. A cold load took 5.1 times as long as a warm one for the smallest model, and 8.5 times for the biggest.
One more small cost: the first score after a load was slower than the second. For the fleet model it took 4.9 ms against 2.3 ms. Lesson 6, cold start, measured that first-call cost; I only note it here.
Deleted Is Not the Same as Given Back
When a service drops a model, does it get that memory back?
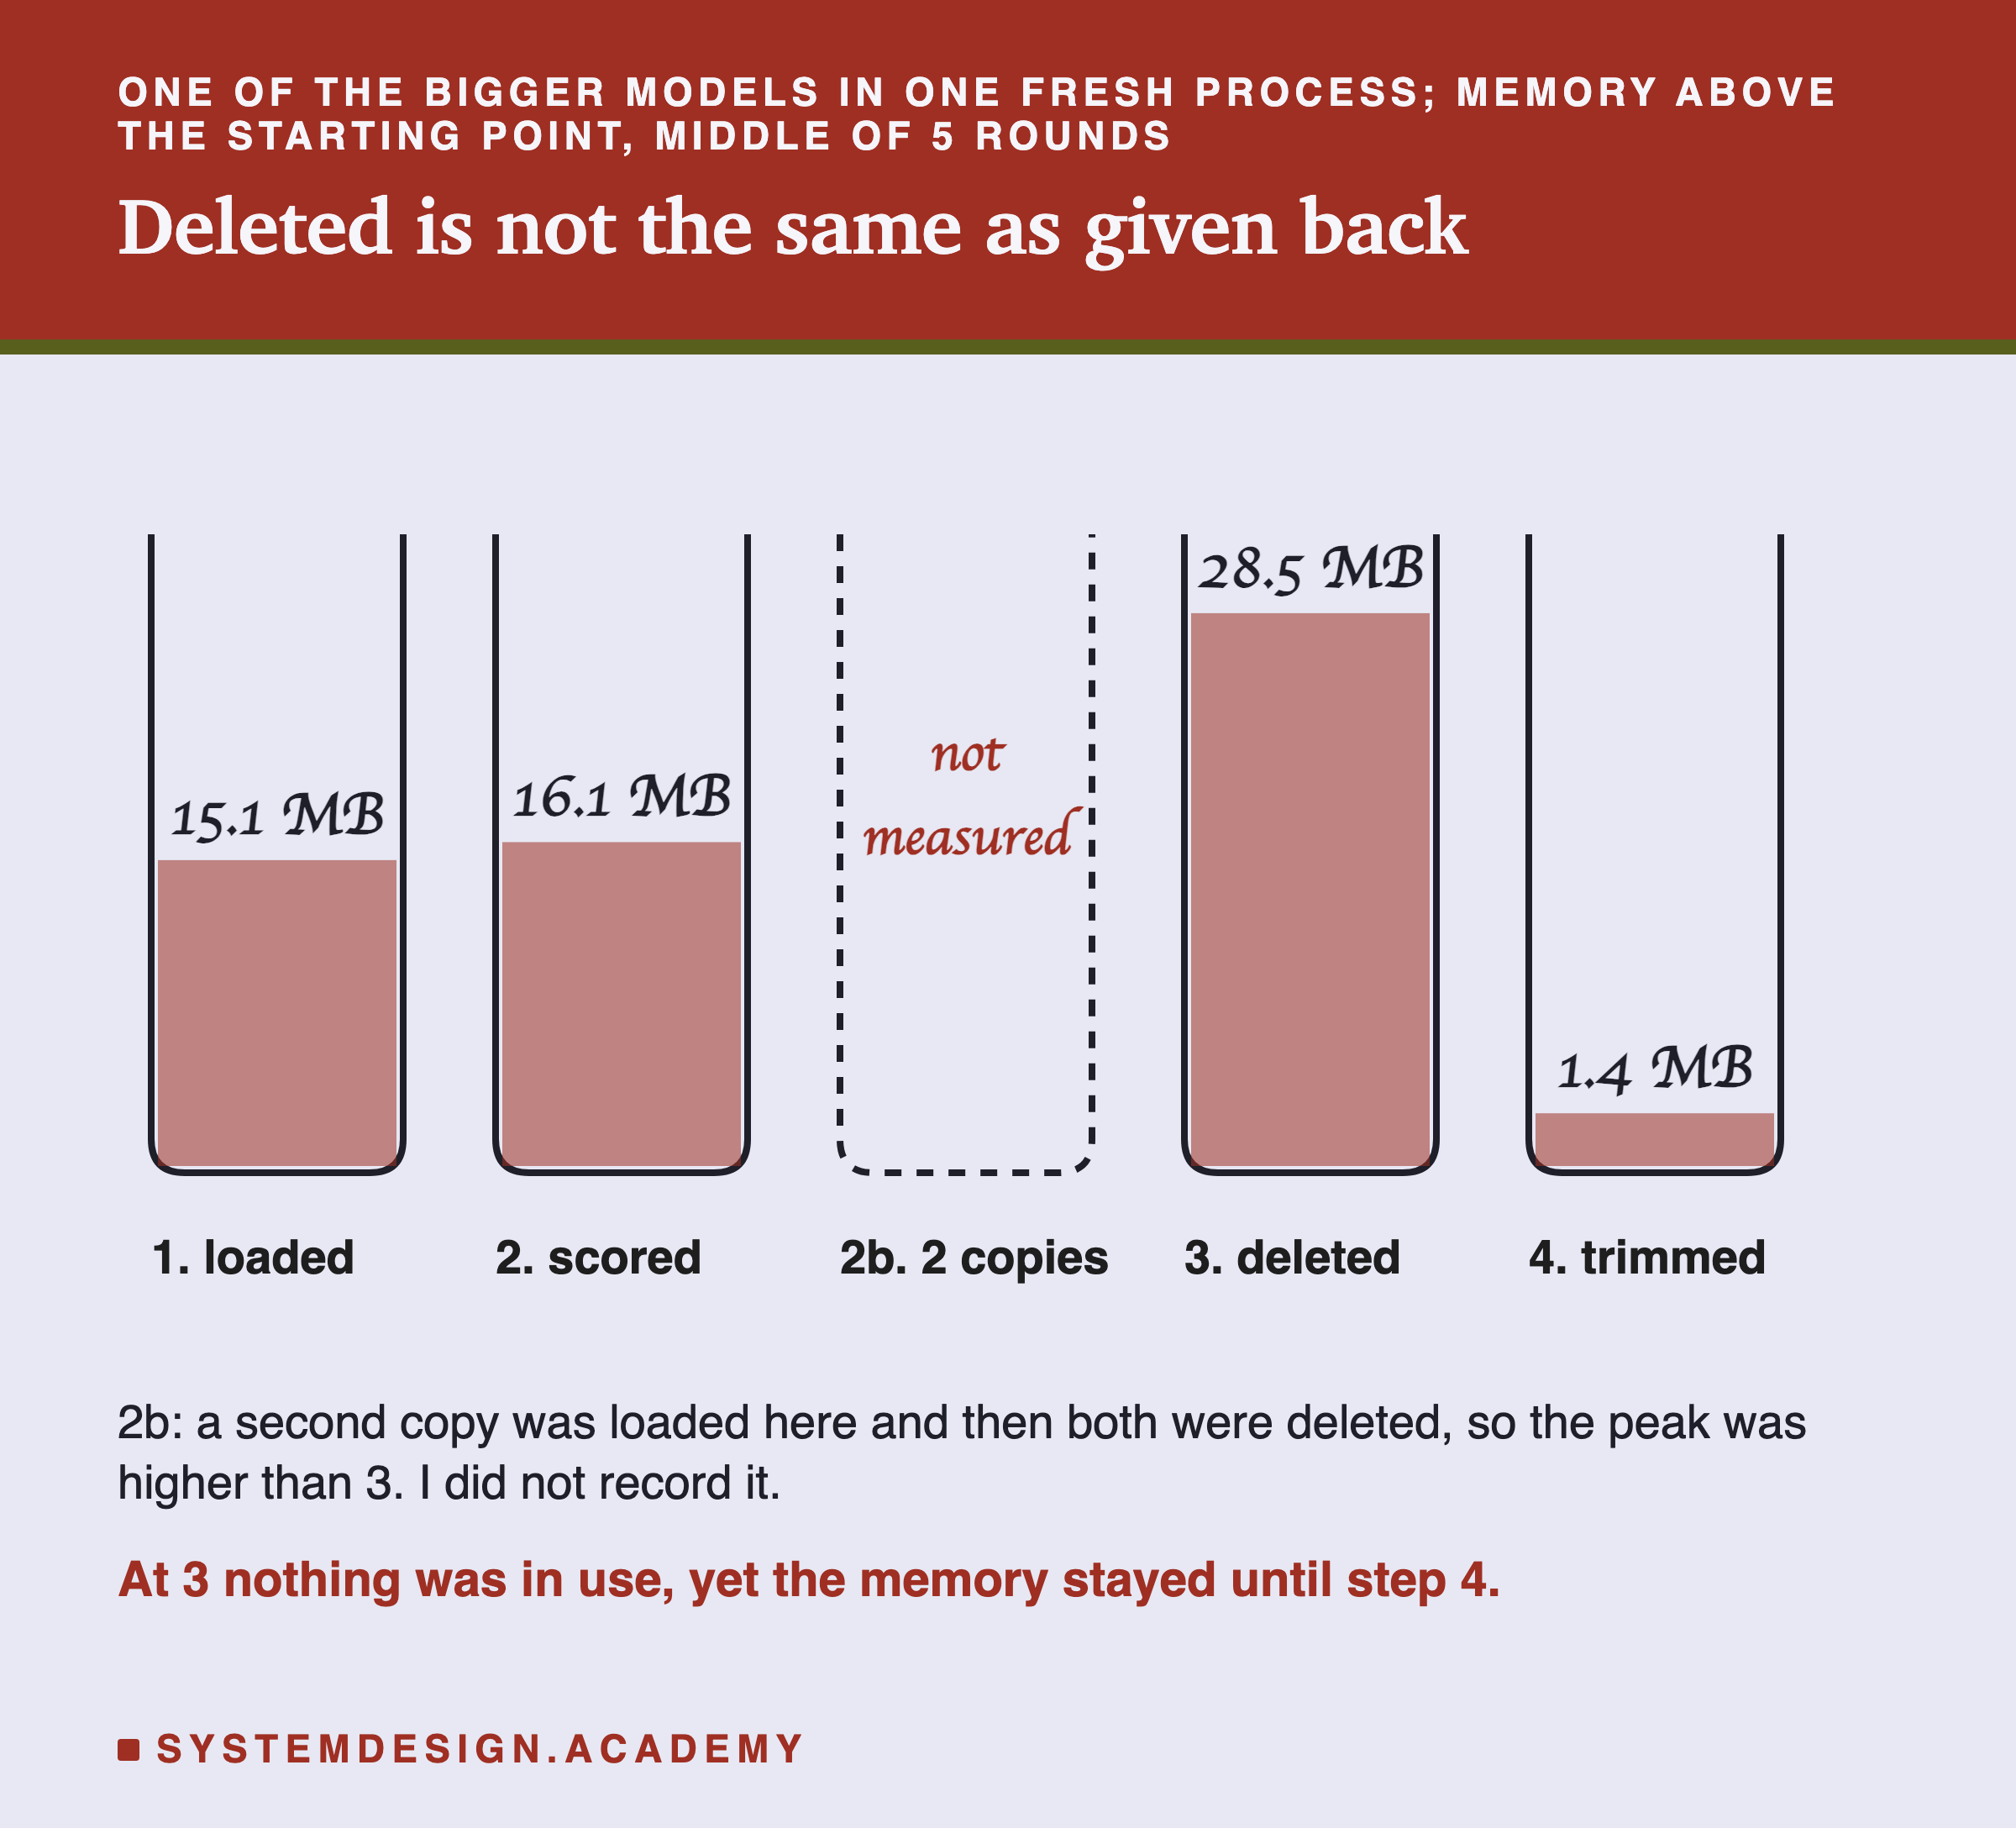
Each jar shows how much memory the program held above its start, at one moment. After loading one fleet model, it held 15.1 MB more. After scoring all 26,851 test rows, 16.1 MB more, because scoring makes some short-lived working space.
Then, at 2b, a second copy was loaded for Python's counter, so for a moment two copies were held. I did not record the memory at that moment, so that jar is empty. Then both copies were deleted and the garbage collector ran. Nothing was left in use. Yet the program still held 28.5 MB more than at the start. So "deleted" was a drop from the two-copy peak, but not back to the start.
The memory was free, but not given back. Python gets memory from a helper called malloc. When Python is done with memory, malloc keeps it for later, like a shop keeping returned boxes in the back room. Only a call named malloc_trim tells malloc to give the empty space back; its manual says it "attempts to release free memory from the heap". After it, the program held 1.4 MB above the start. Malloc still counted 27.3 MB as free space it looks after, but Linux had the real memory back.
Why this matters for many models. A service that drops one model and loads another can reuse that kept memory, so it is not wasted. But no other program can use it, and RSS stays high after an eviction. I come back to this in the cache part.
How Many Fit Under a Cap?
Now the main question. One program loads fleet models one after another and keeps every copy, as if each were another shop's model. It runs inside a cgroup with a memory cap, set with systemd's MemoryMax. systemd is the program that starts and stops the other programs on this computer, and a unit is one group it looks after. The systemd manual says that if memory "cannot be contained under the limit, out-of-memory killer is invoked inside the unit".
I chose caps of 256 MiB (268 MB) and 512 MiB (537 MB), much less than the computer's memory, so the computer itself stayed safe. The whole computer still had at least 1,024 MB free when the capped program was stopped.
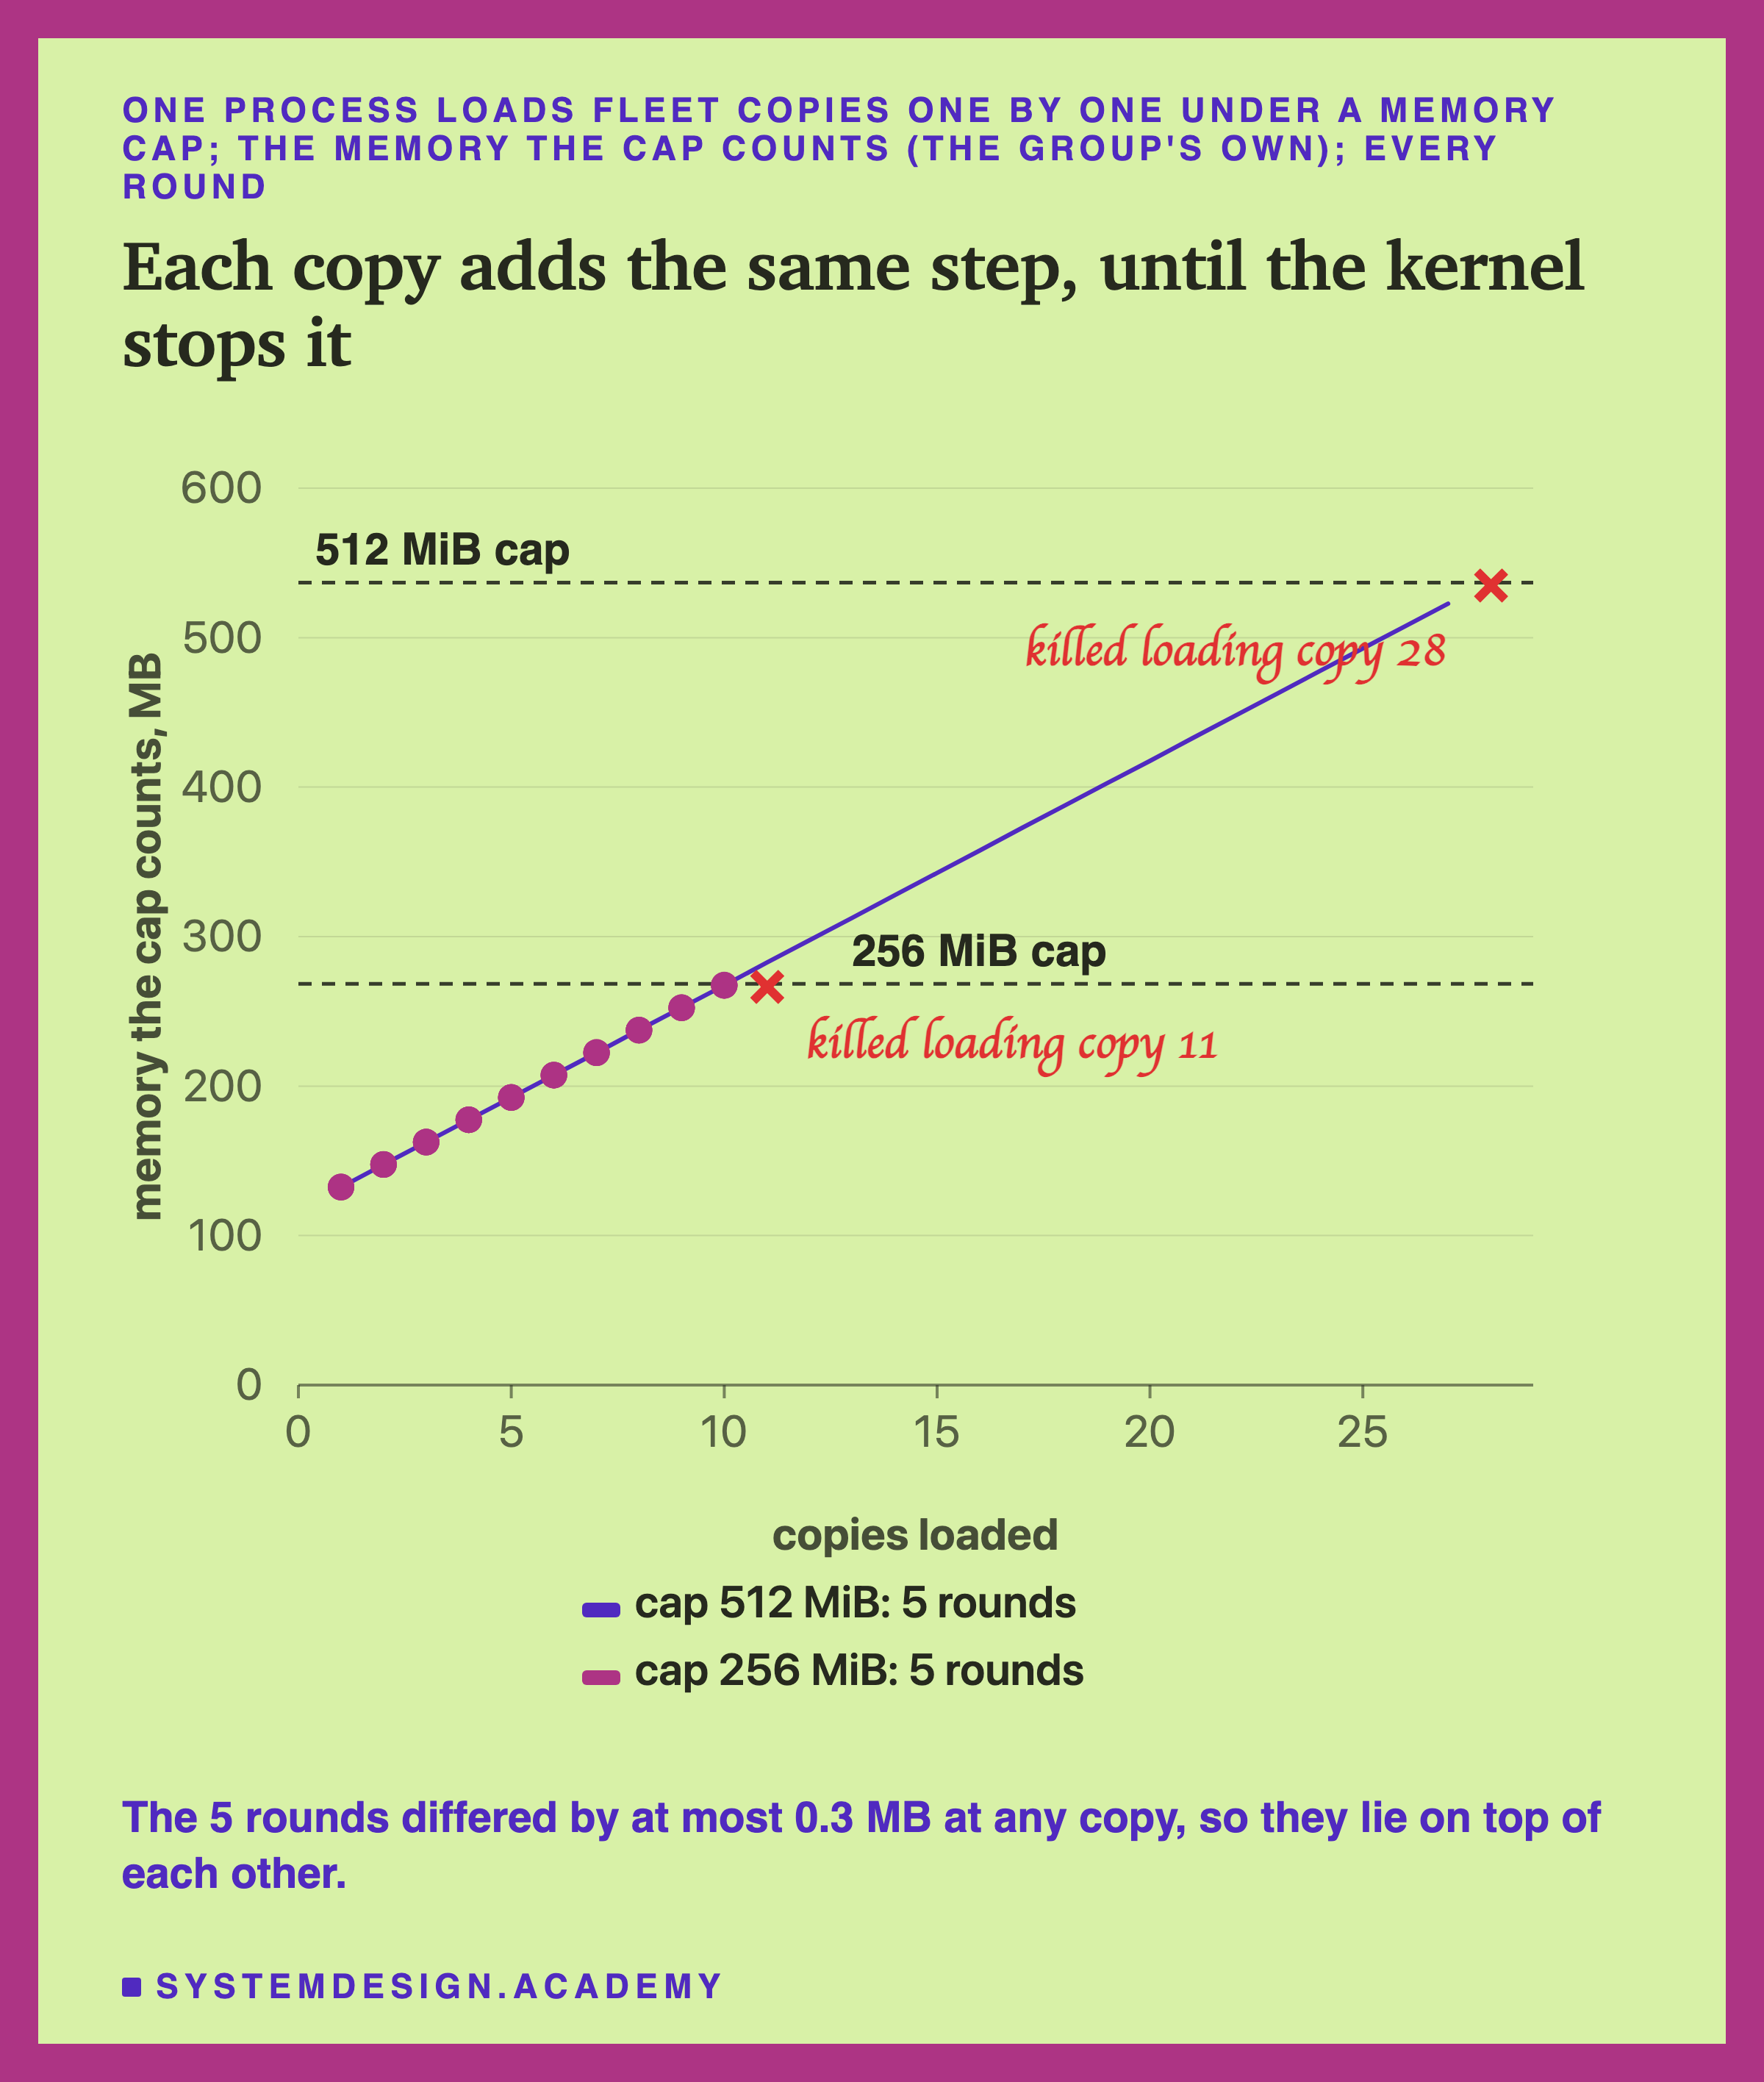
This chart shows what the cap itself counts: the group's own memory. Each copy added about 15 MB. Under 256 MiB, 10 copies fit. Under 512 MiB, 27 fit, in every round.
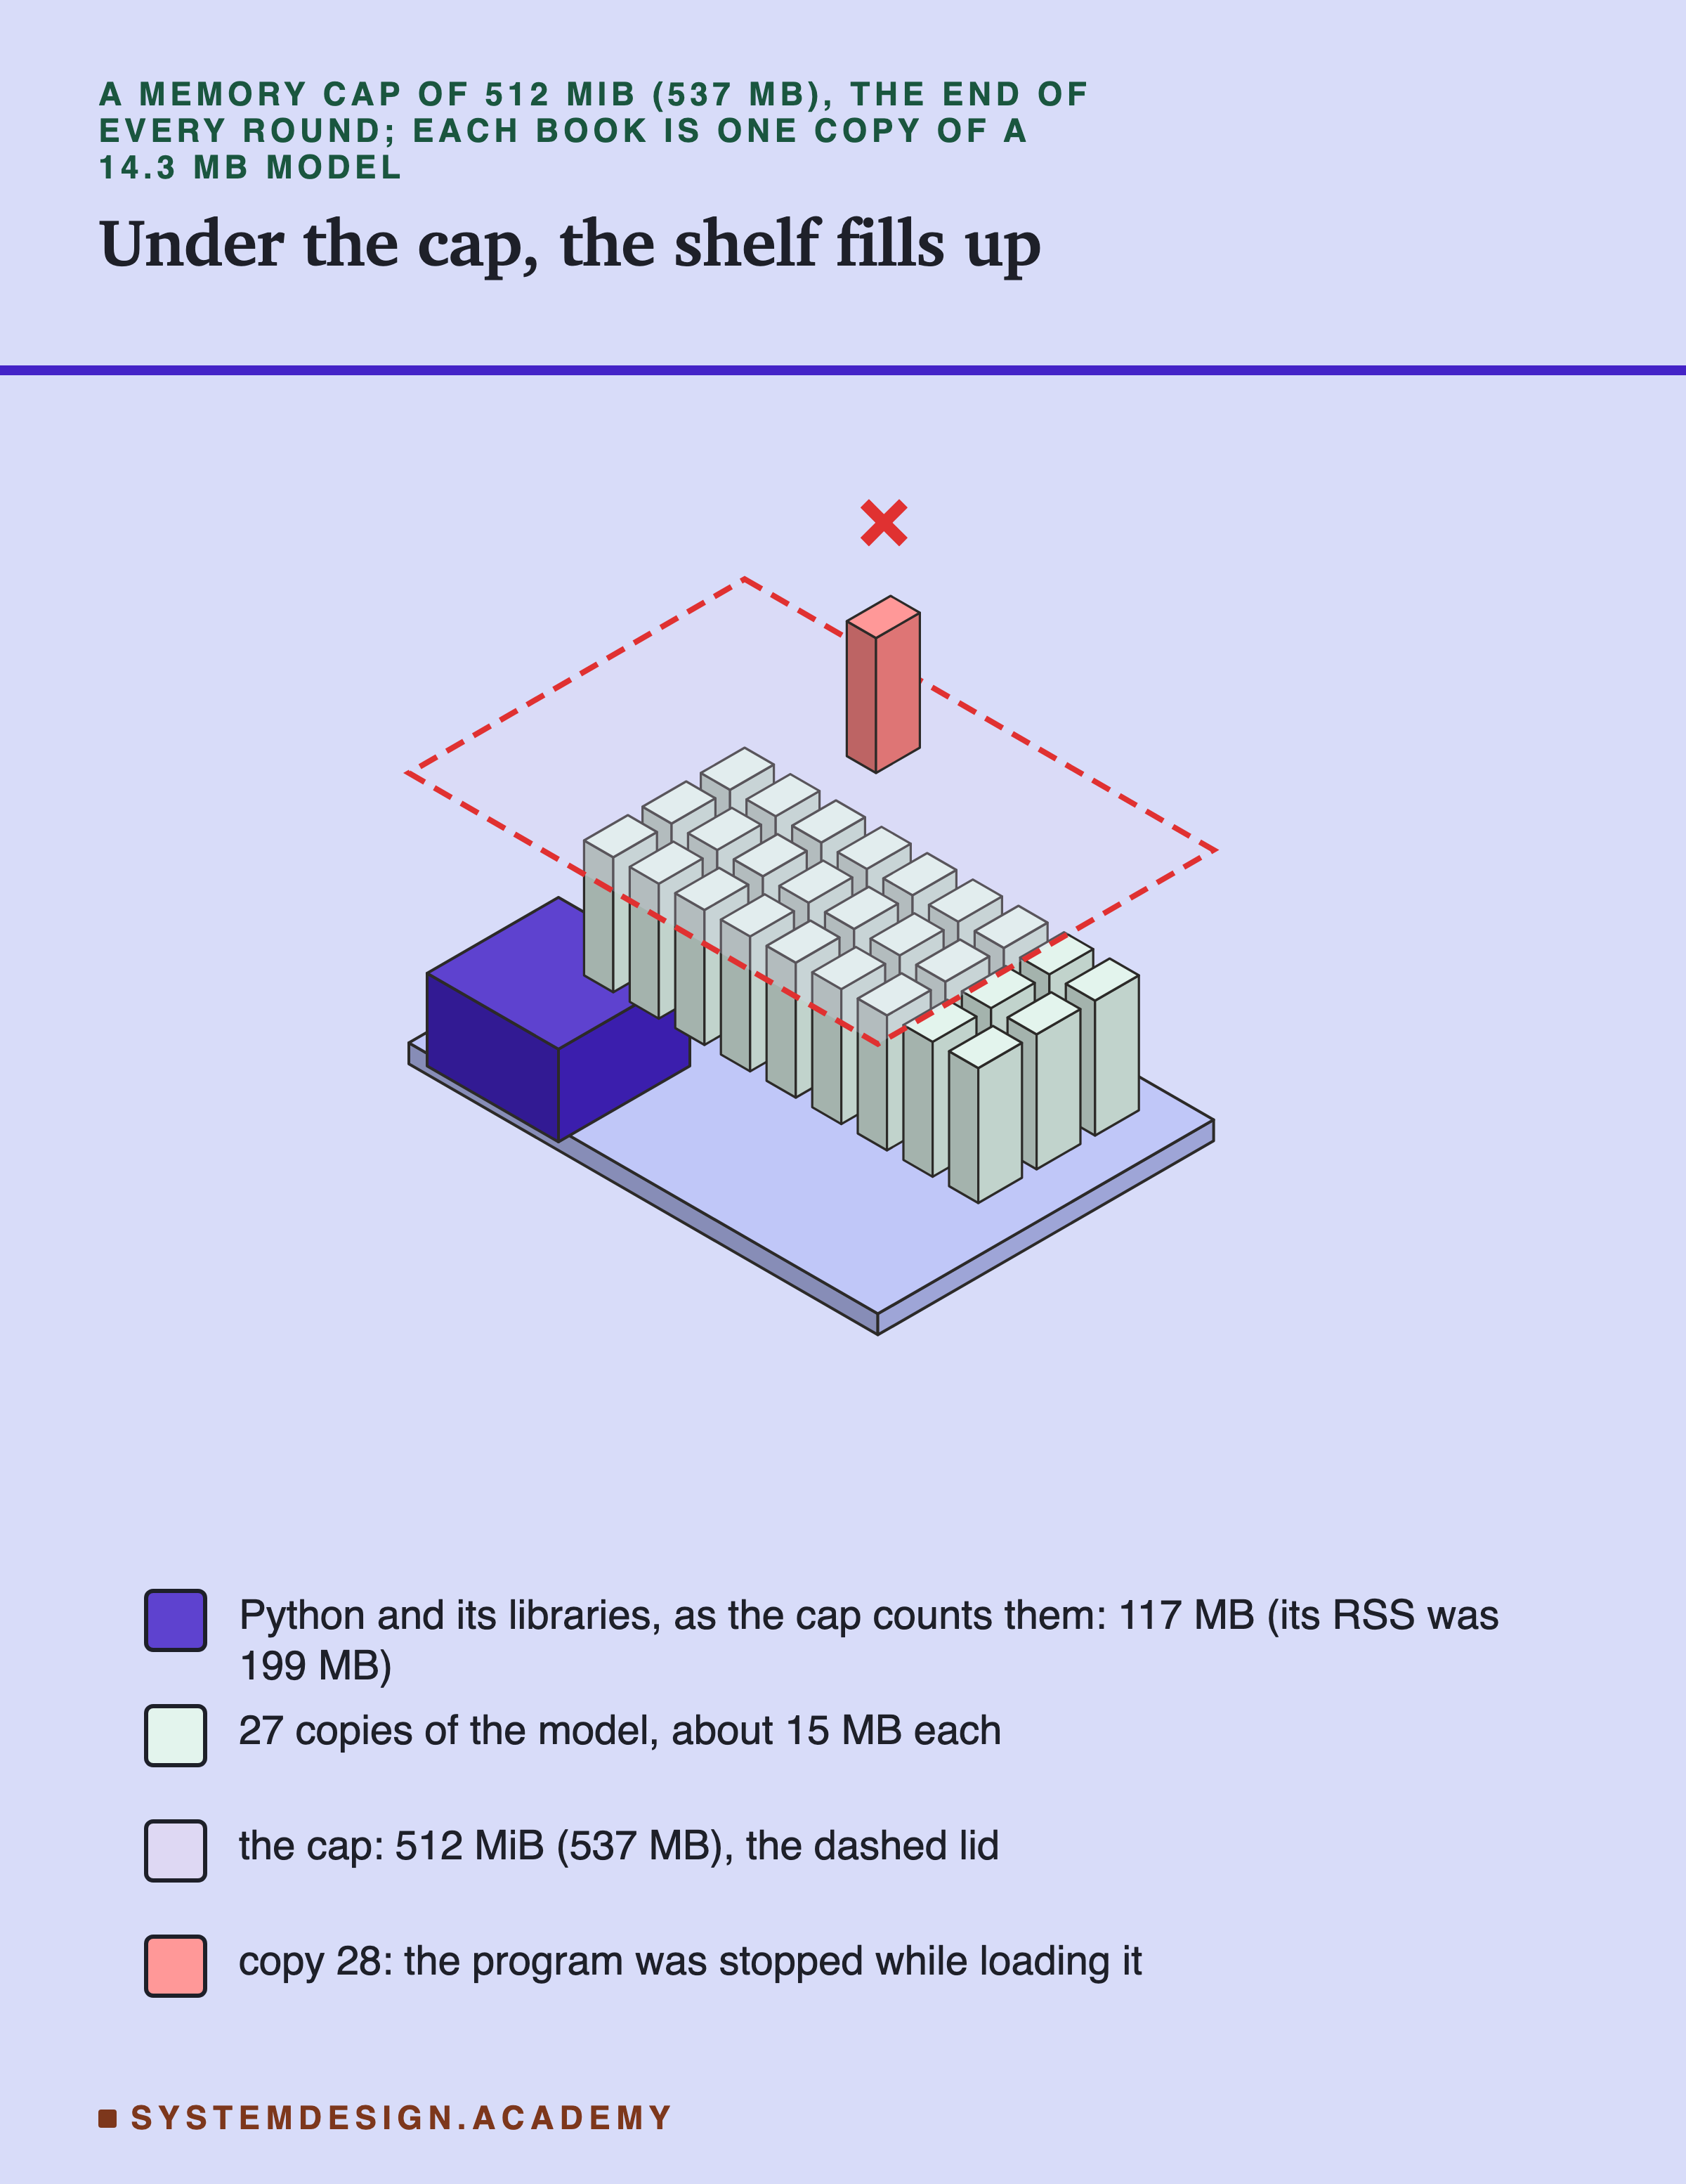
A note on counting. The program's RSS at the start was 199 MB, but the cap counted only 117 MB of it. Some of a program's memory is library files that other programs had loaded first. Linux charges those to whoever loaded them first, not to this group. The cap also counts the copies of files the group read, but Linux can drop those to make room. At the end of round 1 at 512 MiB, the group's count was 498 MiB, just under the cap.
These counts are close to plain arithmetic, so they are a check more than a finding. Take the cap, subtract what the cap counted at the start, and divide by one model: (537 - 117) / 15.0 = 28.0. So 27 whole copies fit, and the 28th fails while it loads. The finding is what the end looks like.
What Happens When One More Does Not Fit
Before each load, the program wrote "about to load" to a file and forced it onto the disk. After each load it wrote "loaded". So when the program died, its last line showed what it was doing.
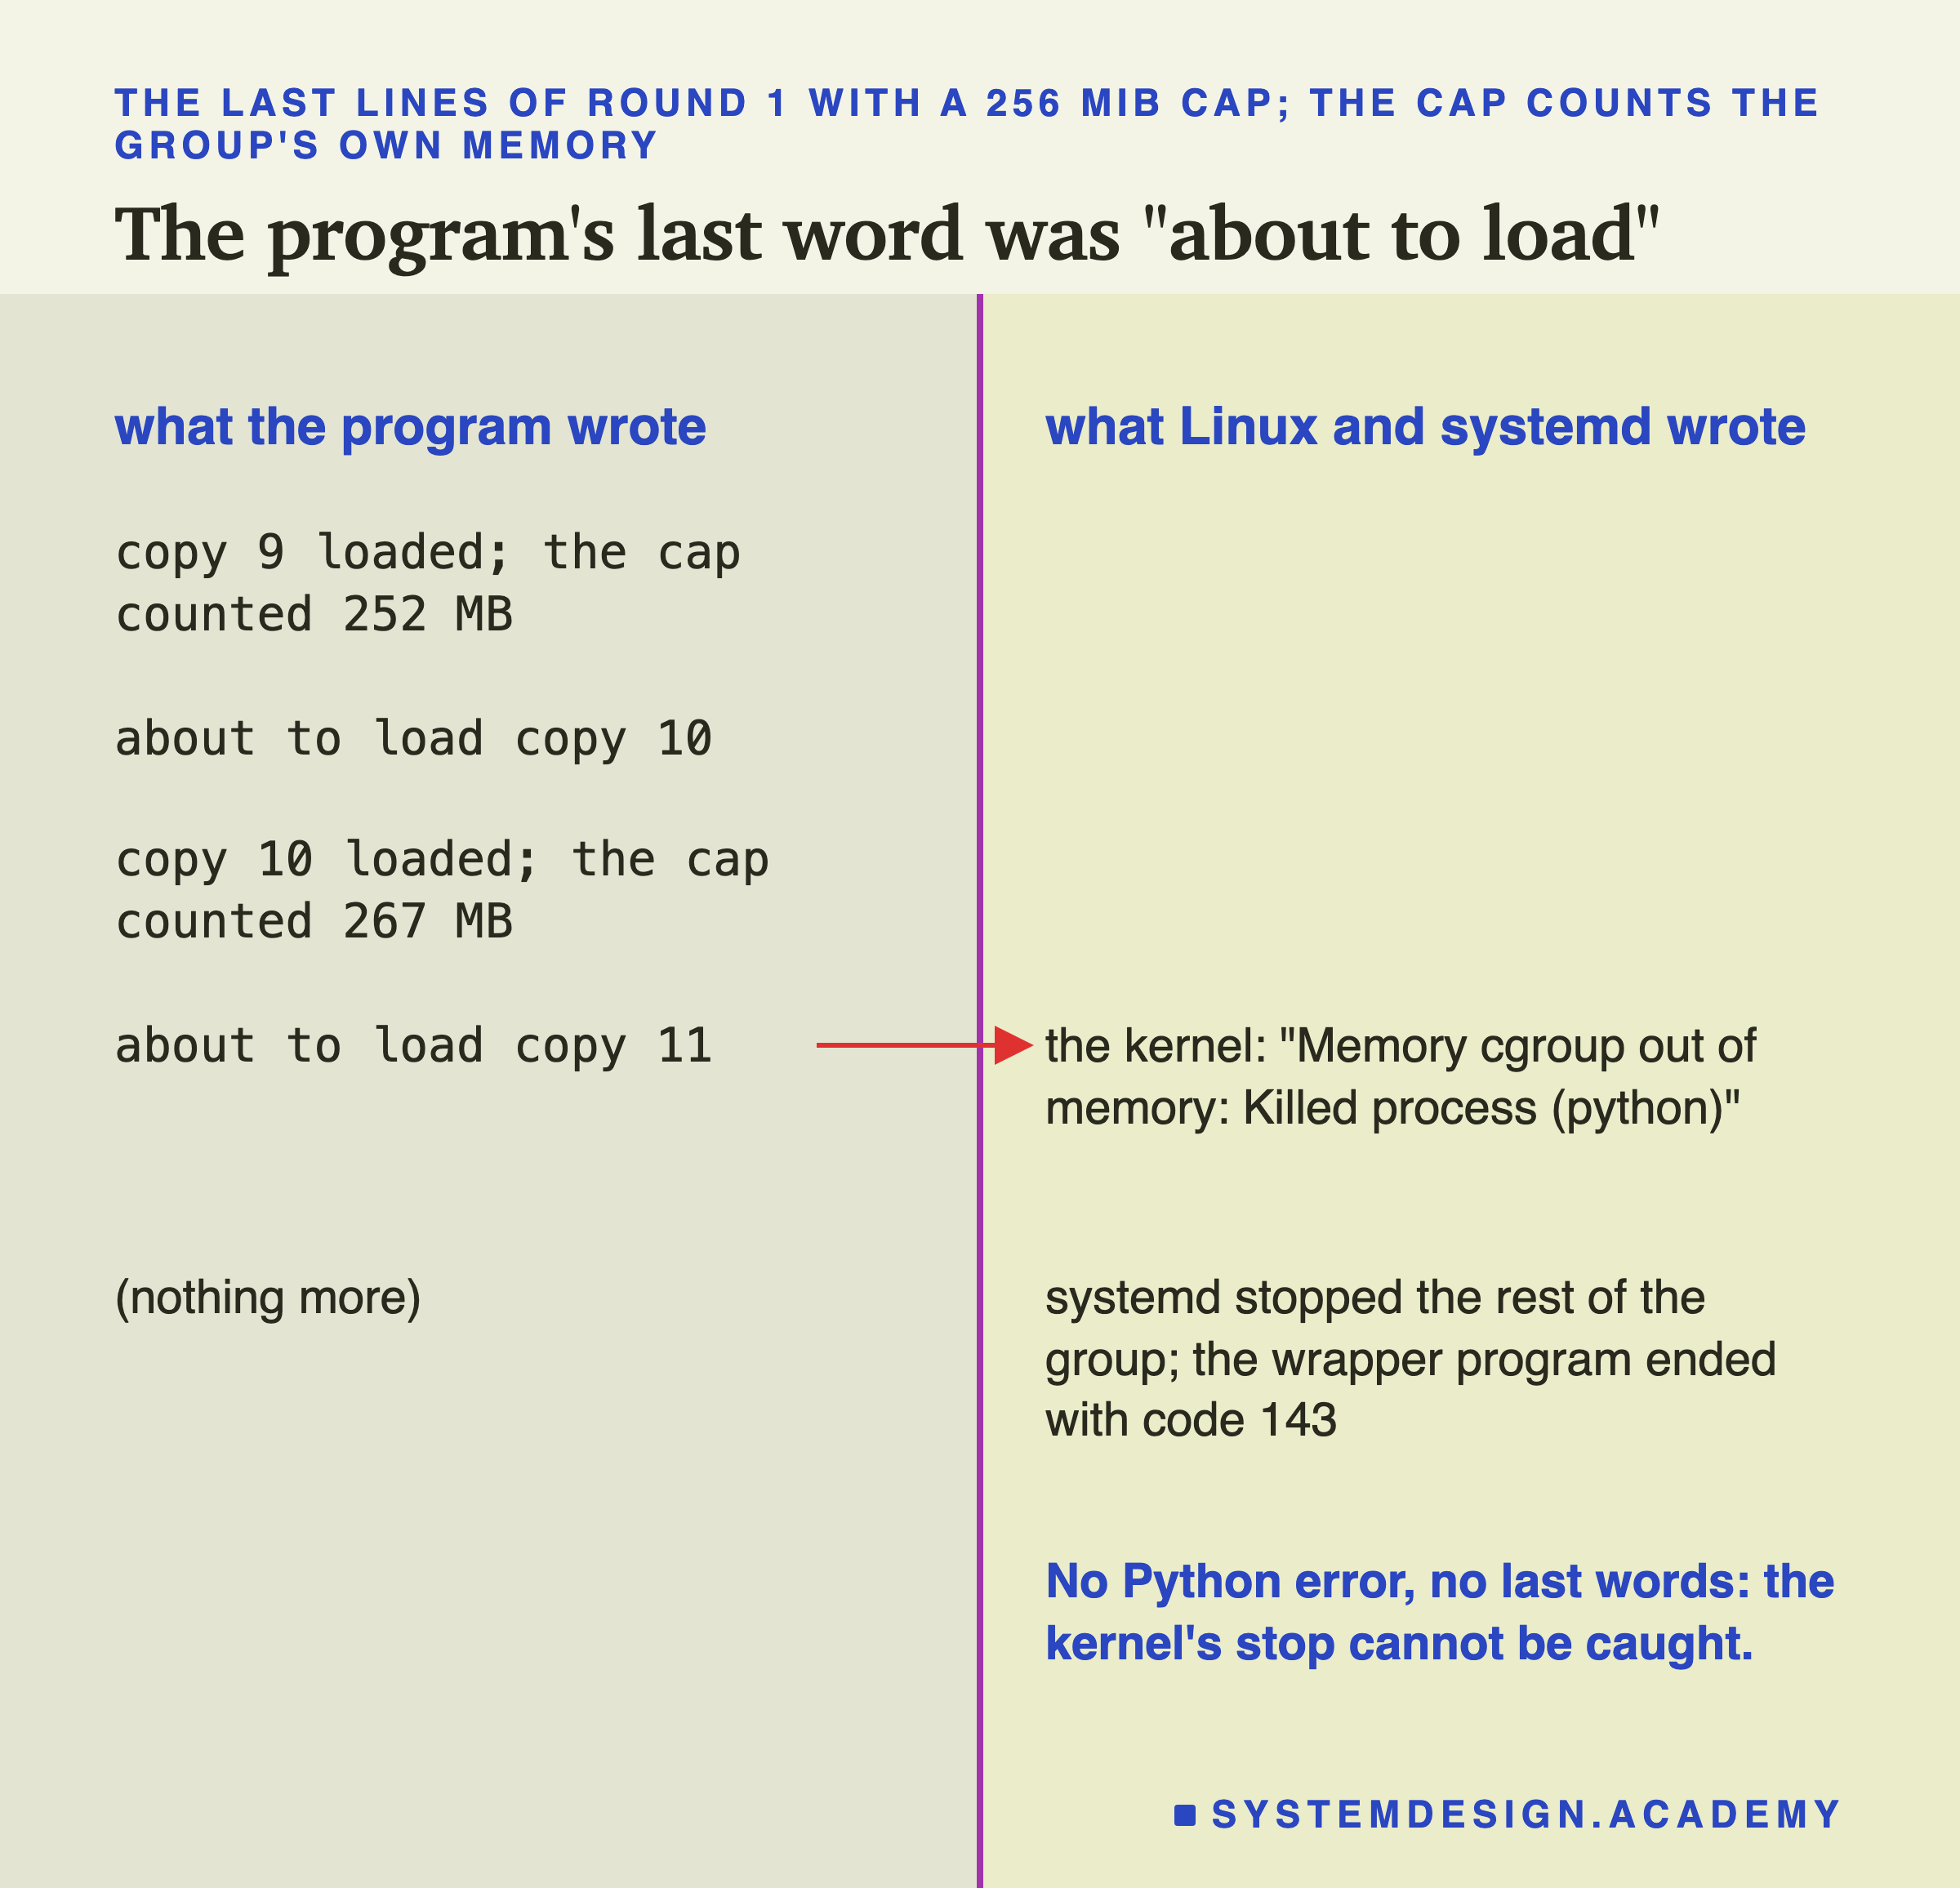
In every run, the last line was "about to load". The program died in the middle of loading the next copy, in all 10 capped runs. It printed no Python error. Python never got a chance. A signal is a message Linux sends to a program, and the kernel sent SIGKILL, a signal that ends a program at once and cannot be caught.
Every program ends with a number, and 0 means all went well. My program was started through a small wrapper program called runuser. After the kill, systemd stopped what was left of the group, and the wrapper ended with code 143. I did not record Python's own end code.
Linux's own log said what happened. You only need the words "Killed process ... (python)". This line is from round 1 at 256 MiB, with the computer's name blacked out:
1791696512.533488 ip-<private> kernel: Memory cgroup out of memory: Killed process 9047 (python) total-vm:579448kB, anon-rss:260076kB, file-rss:82956kB, shmem-rss:0kB, UID:1000 pgtables:1000kB oom_score_adj:0
What this means for a service. A service killed this way drops every request it was working on, with no chance to answer. A supervisor, a program that restarts a service when it dies, would start it again empty, and it must load its models again. The cgroup documentation calls the cap a "Memory usage hard limit". The systemd manual adds advice: "use MemoryMax= as the last line of defense". So plan the memory so the cap is never reached.
Several Workers: Load Once and Fork, or Let Each Load?
A service with several workers can load its models in two places.
Each worker loads its own. gunicorn starts the workers first, and each worker loads its own copy of Python's libraries and the models. That is gunicorn's default. uvicorn is the program that runs the chapter's service, as in lessons 2 to 9. Its own --workers option always works this way: its documentation says "Unlike gunicorn, uvicorn does not use pre-fork, but uses spawn". Spawn starts each worker as a fresh Python. Lesson 5 measured that.
Load once, then fork. With --preload, gunicorn's master loads everything first, and only then forks the workers. Its documentation says this setting will "Load application code before the worker processes are forked", and that "By preloading an application you can save some RAM resources". Each worker starts out sharing the master's pages.
I tried both with 1, 2 and 4 workers, each serving the same 8 fleet models. A third way added Python's gc.freeze recipe, which the next slide explains.
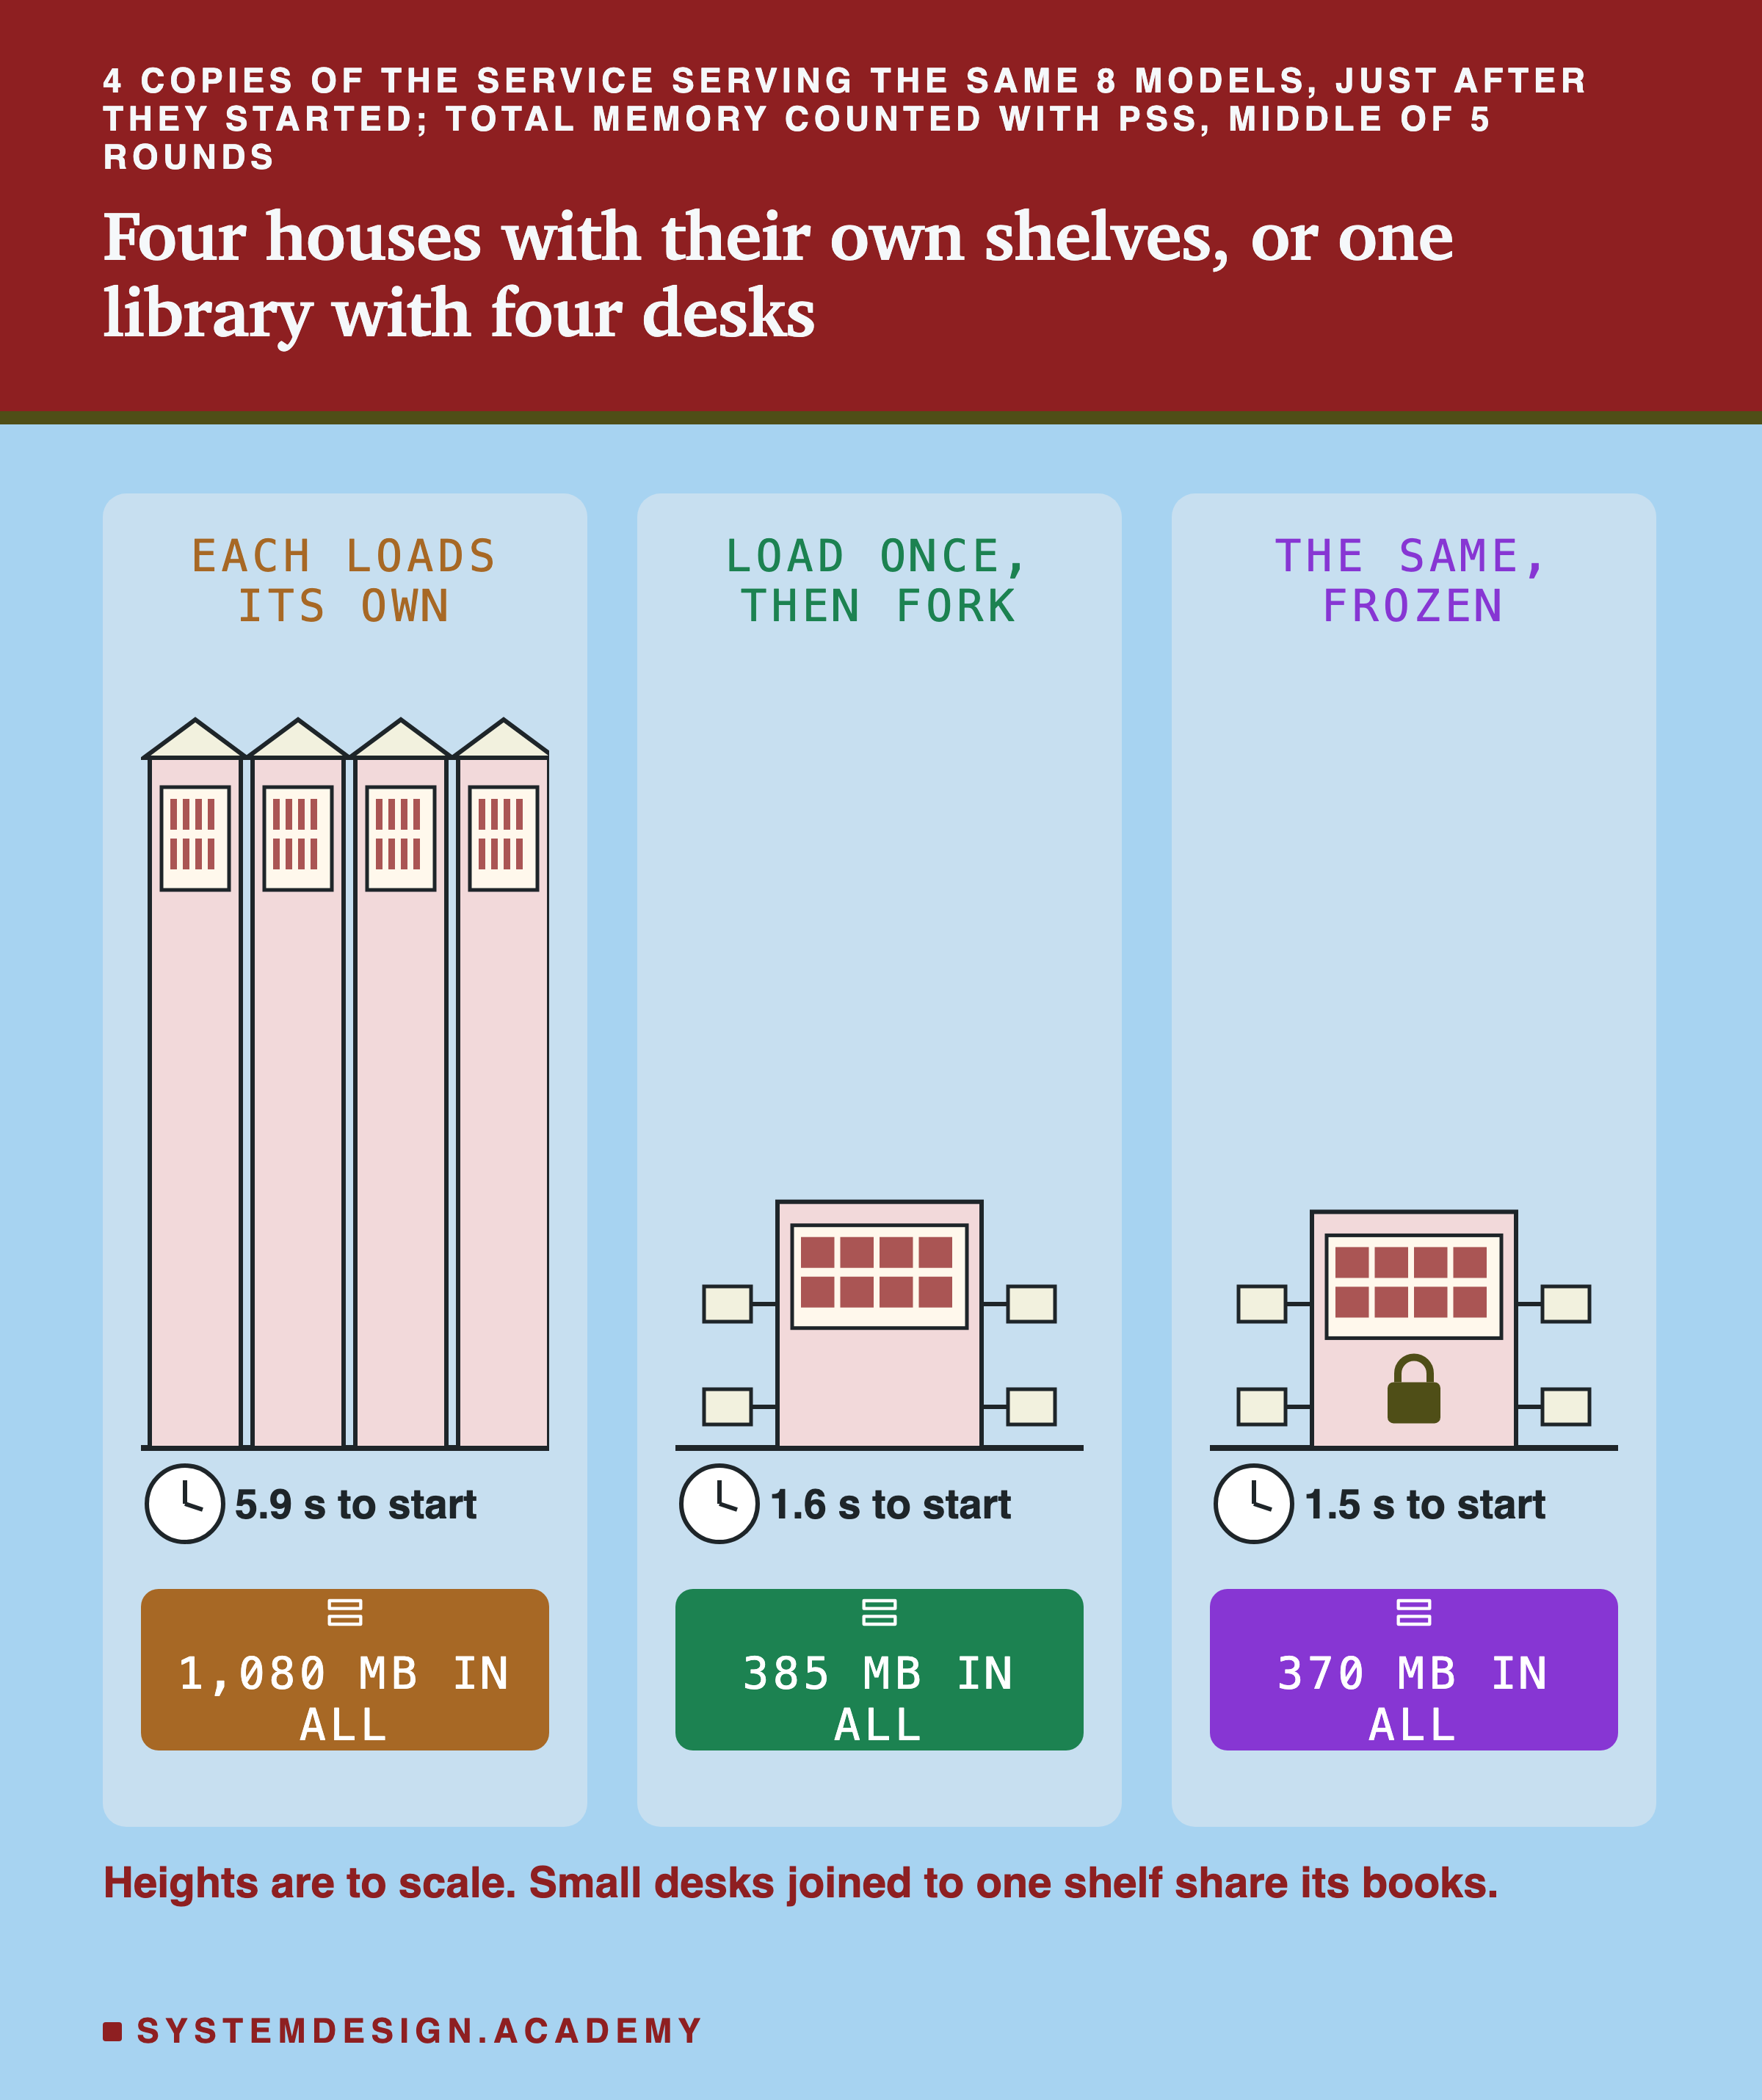
Just after start, 4 workers that loaded once used 385 MB in total, and 4 that each loaded their own used 1,080 MB. That is 0.36 of it. I measured the total with PSS, so shared pages were counted once.
This much is true by design. A freshly forked worker shares every page with its master, so the total at that moment had to be smaller. The fork manual says Linux implements fork "using copy-on-write pages". So it is a check that preload worked, not a finding. The findings are what happens next, as the workers answer requests, and how long the service takes to start.
Every Page a Worker Writes On Becomes Its Own
Sharing lasts only while nobody writes. And Python writes even when your code only reads.
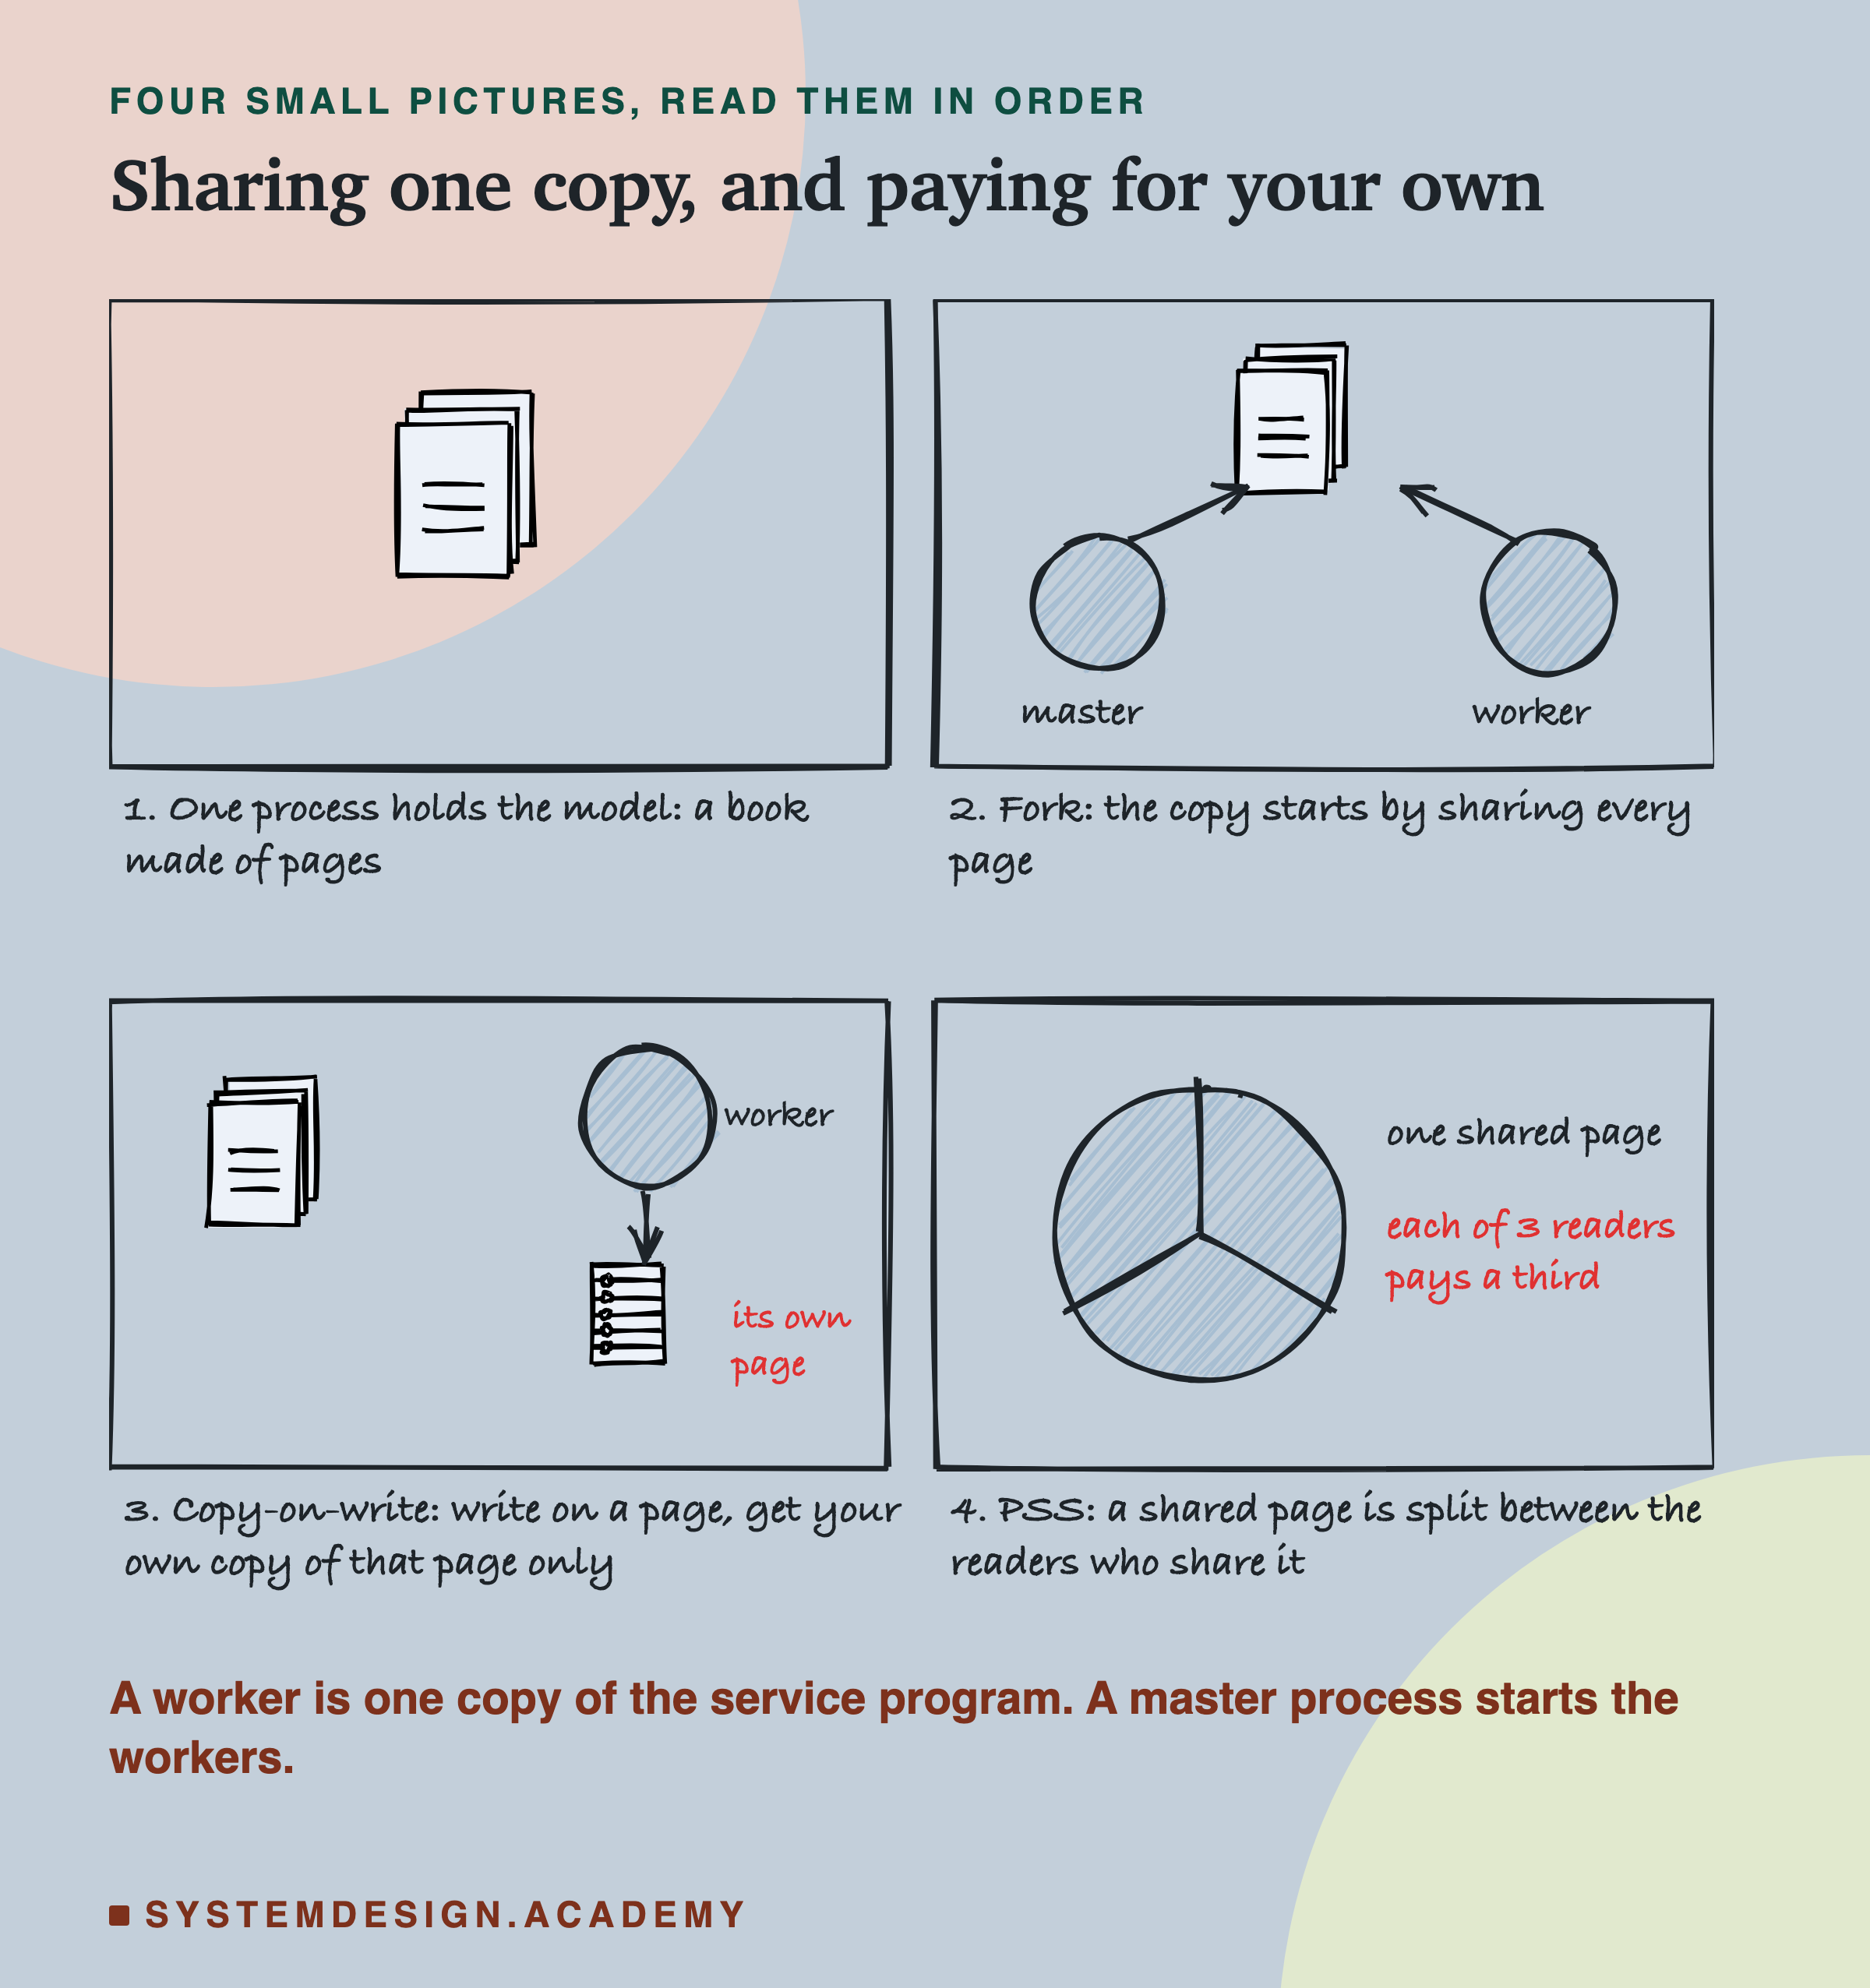
An object is one thing Python keeps in memory: a number, a list, or one tree of the model. Every object carries a count of how many names point at it, called a reference count. Using an object adds one to its count and later takes one away. That is a write. So reading a model in Python writes to the pages that hold its objects, and each such page becomes a private copy for that worker. The long rows of numbers that hold the trees are not touched this way.
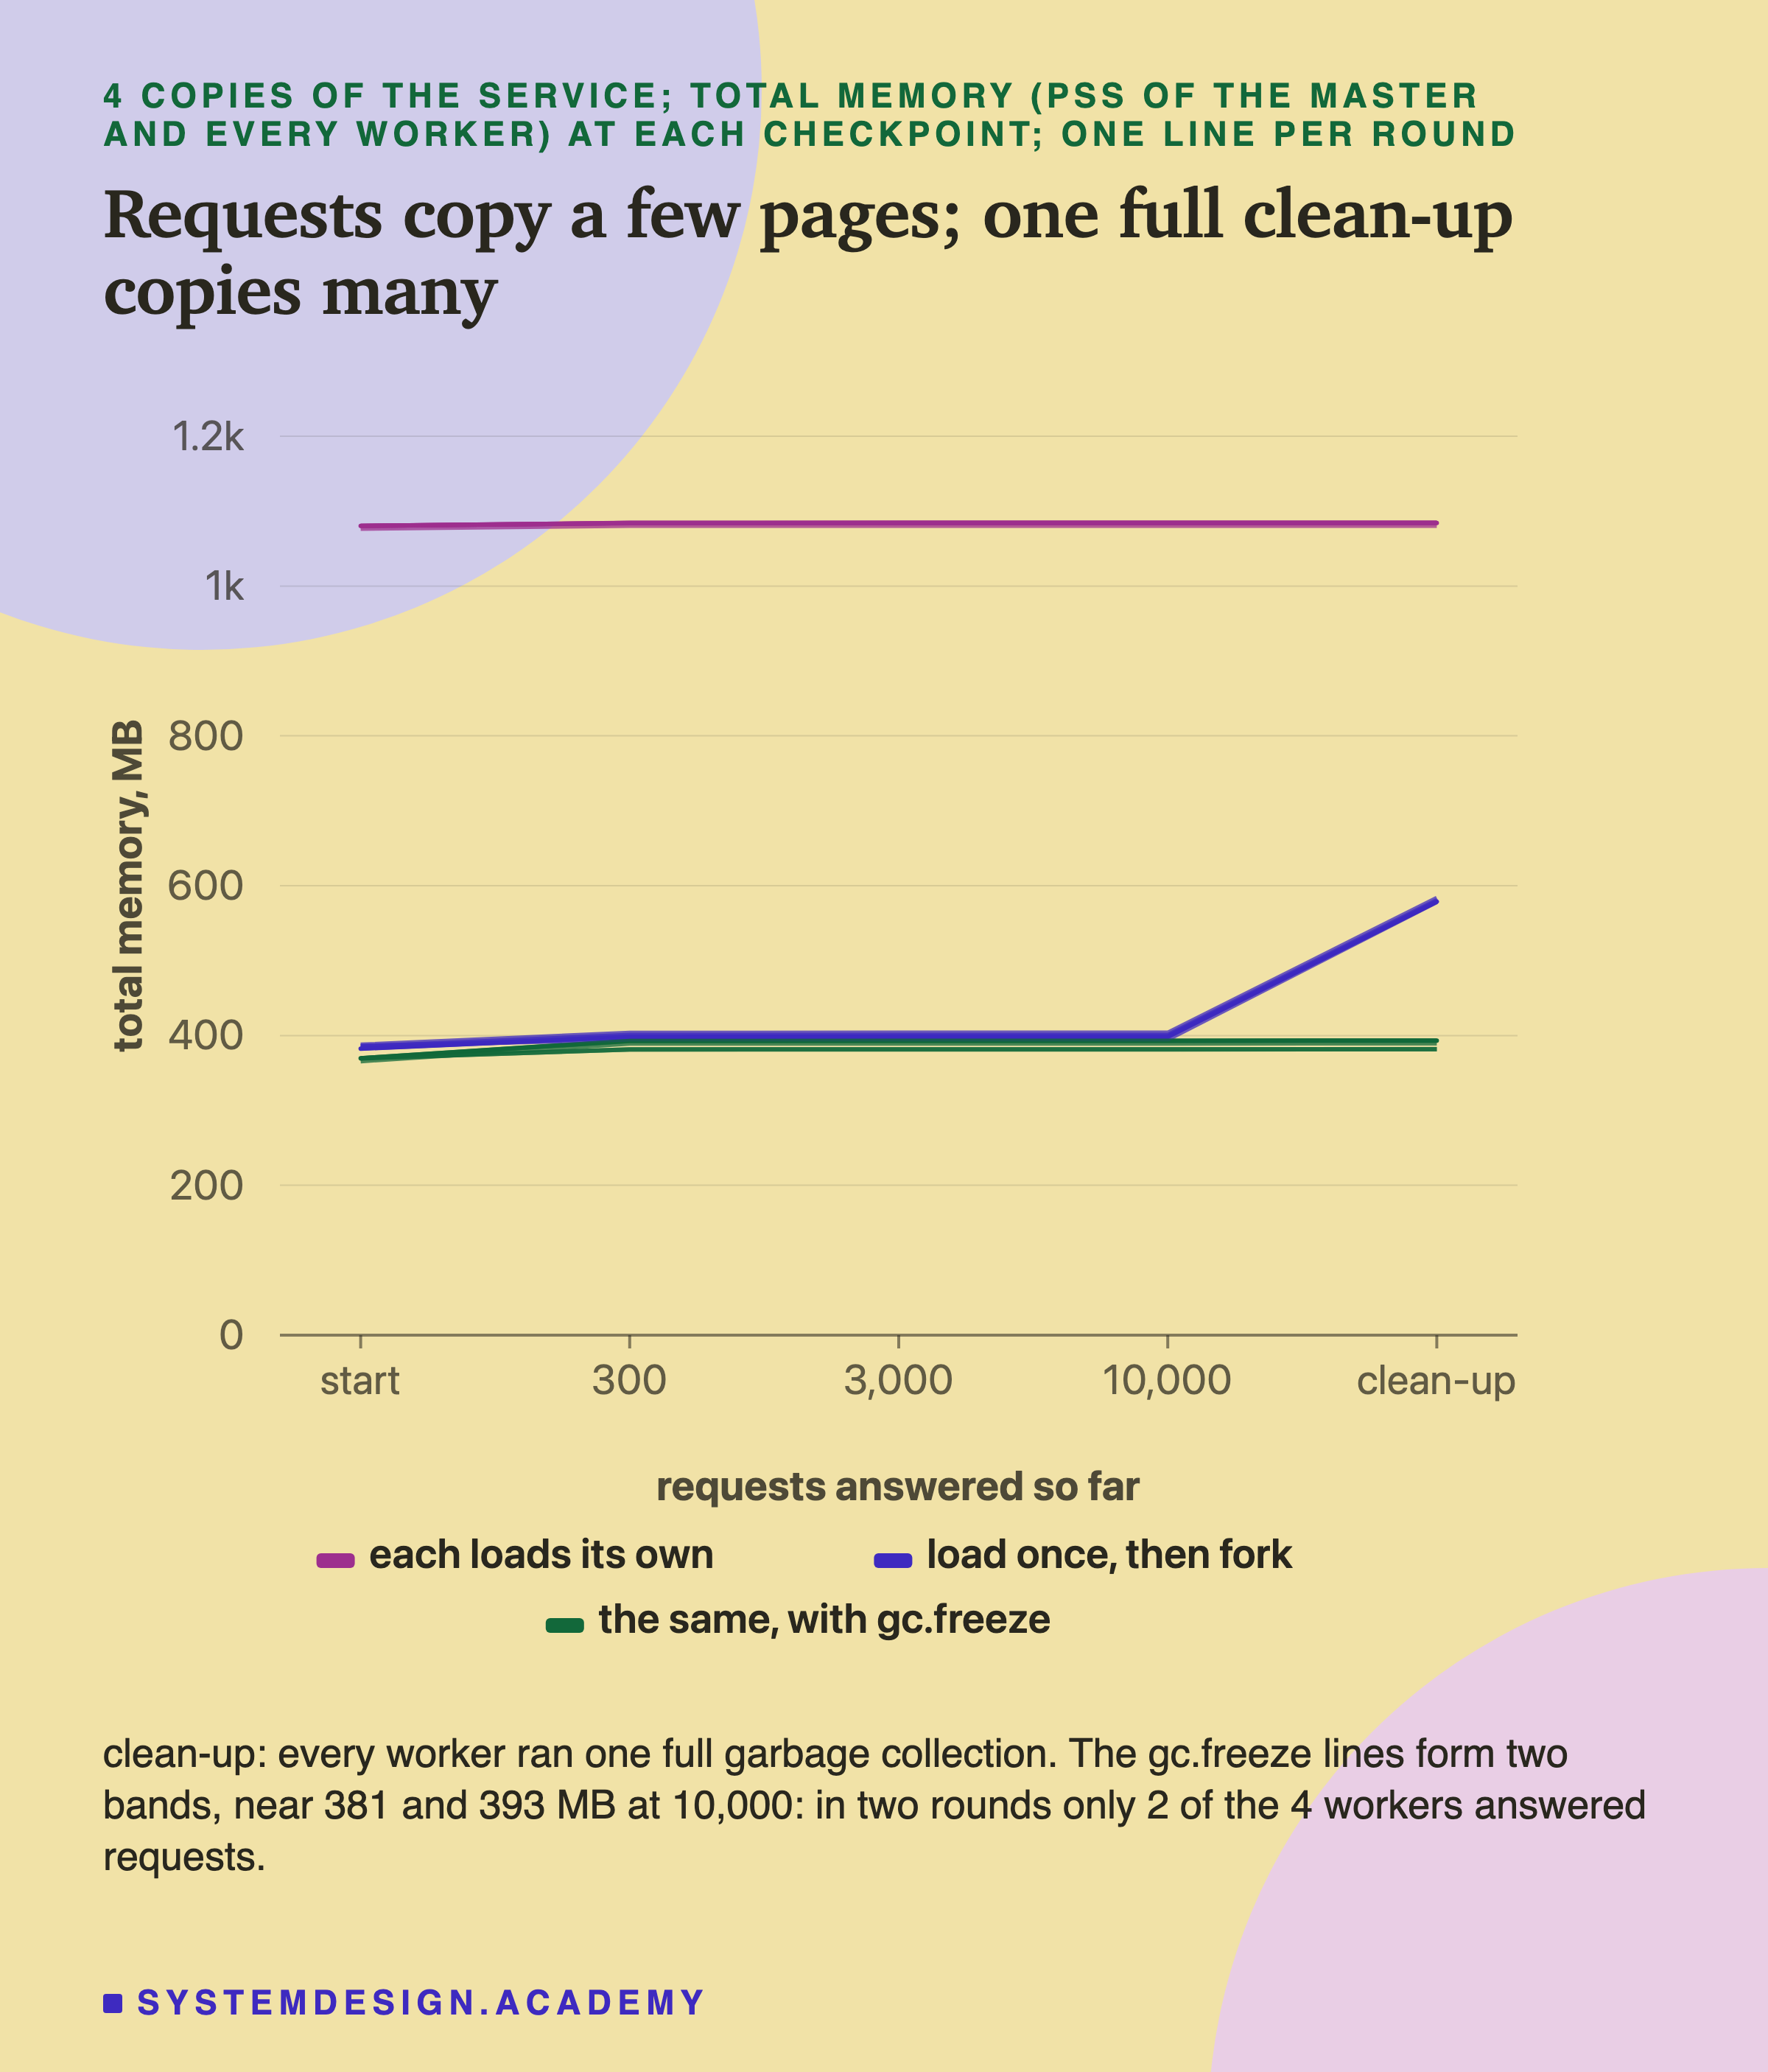
Requests copied only a little, and only at first. With 4 workers that loaded once, the total rose by 16 MB by the 300th request (middle round), about 4 MB for each worker that answered requests. From 300 to 10,000 requests it hardly moved. Each worker had touched the objects it uses once, and after that it reused its own copies. I had guessed requests would copy 10 to 60 MB per worker. That guess was wrong.
One full clean-up copied a lot. At the end, each worker ran one full collection with gc.collect(). The total for 4 workers jumped by 180 MB, about 45 MB per worker. The cleaner writes a note on every object it checks, and that copied the pages holding all of them: numpy's, scikit-learn's and the models'. Even then, 579 MB was about half of the 1,080 MB used without preload.
Python's documentation describes exactly this problem and its fix. gc.freeze will "Freeze all the objects tracked by the garbage collector; move them to a permanent generation and ignore them in all the future collections". The "permanent generation" is a pile the cleaner never looks at. The recipe is: "call gc.disable() early in the parent process, gc.freeze() right before fork() , and gc.enable() early in child processes". are small functions gunicorn runs just before and just after it makes each worker. I used its and hooks to follow that recipe.
When They Do Not All Fit: A Cache of Models
Now the second half of the question. Say sixteen models must be served, but there is room for only a few. The service keeps the most recently used ones in memory and loads the others when asked. This is an LRU cache. Real tools do this. Ray Serve is a tool for serving models on many computers, and one of its features keeps many models in one service and swaps them in and out. Its documentation says that when there are too many models, "Serve uses the LRU policy to evict the least recently used model".
My cache service started empty and had room for K models, where K was 2, 4 or 8. Requests arrived at random moments, 6 a second for 90 seconds. Each asked for one of the sixteen fleet models. I did not count the first 15 seconds, while the cache filled.
Which model? Real traffic is uneven: a few customers are busy and most are quiet. I used a Zipf pattern, a common way to describe that. The most popular model gets the most requests, the second gets half as many, the third a third as many, and so on. With 16 models, the top one gets 29.6% of the requests and the last one 1.8%.
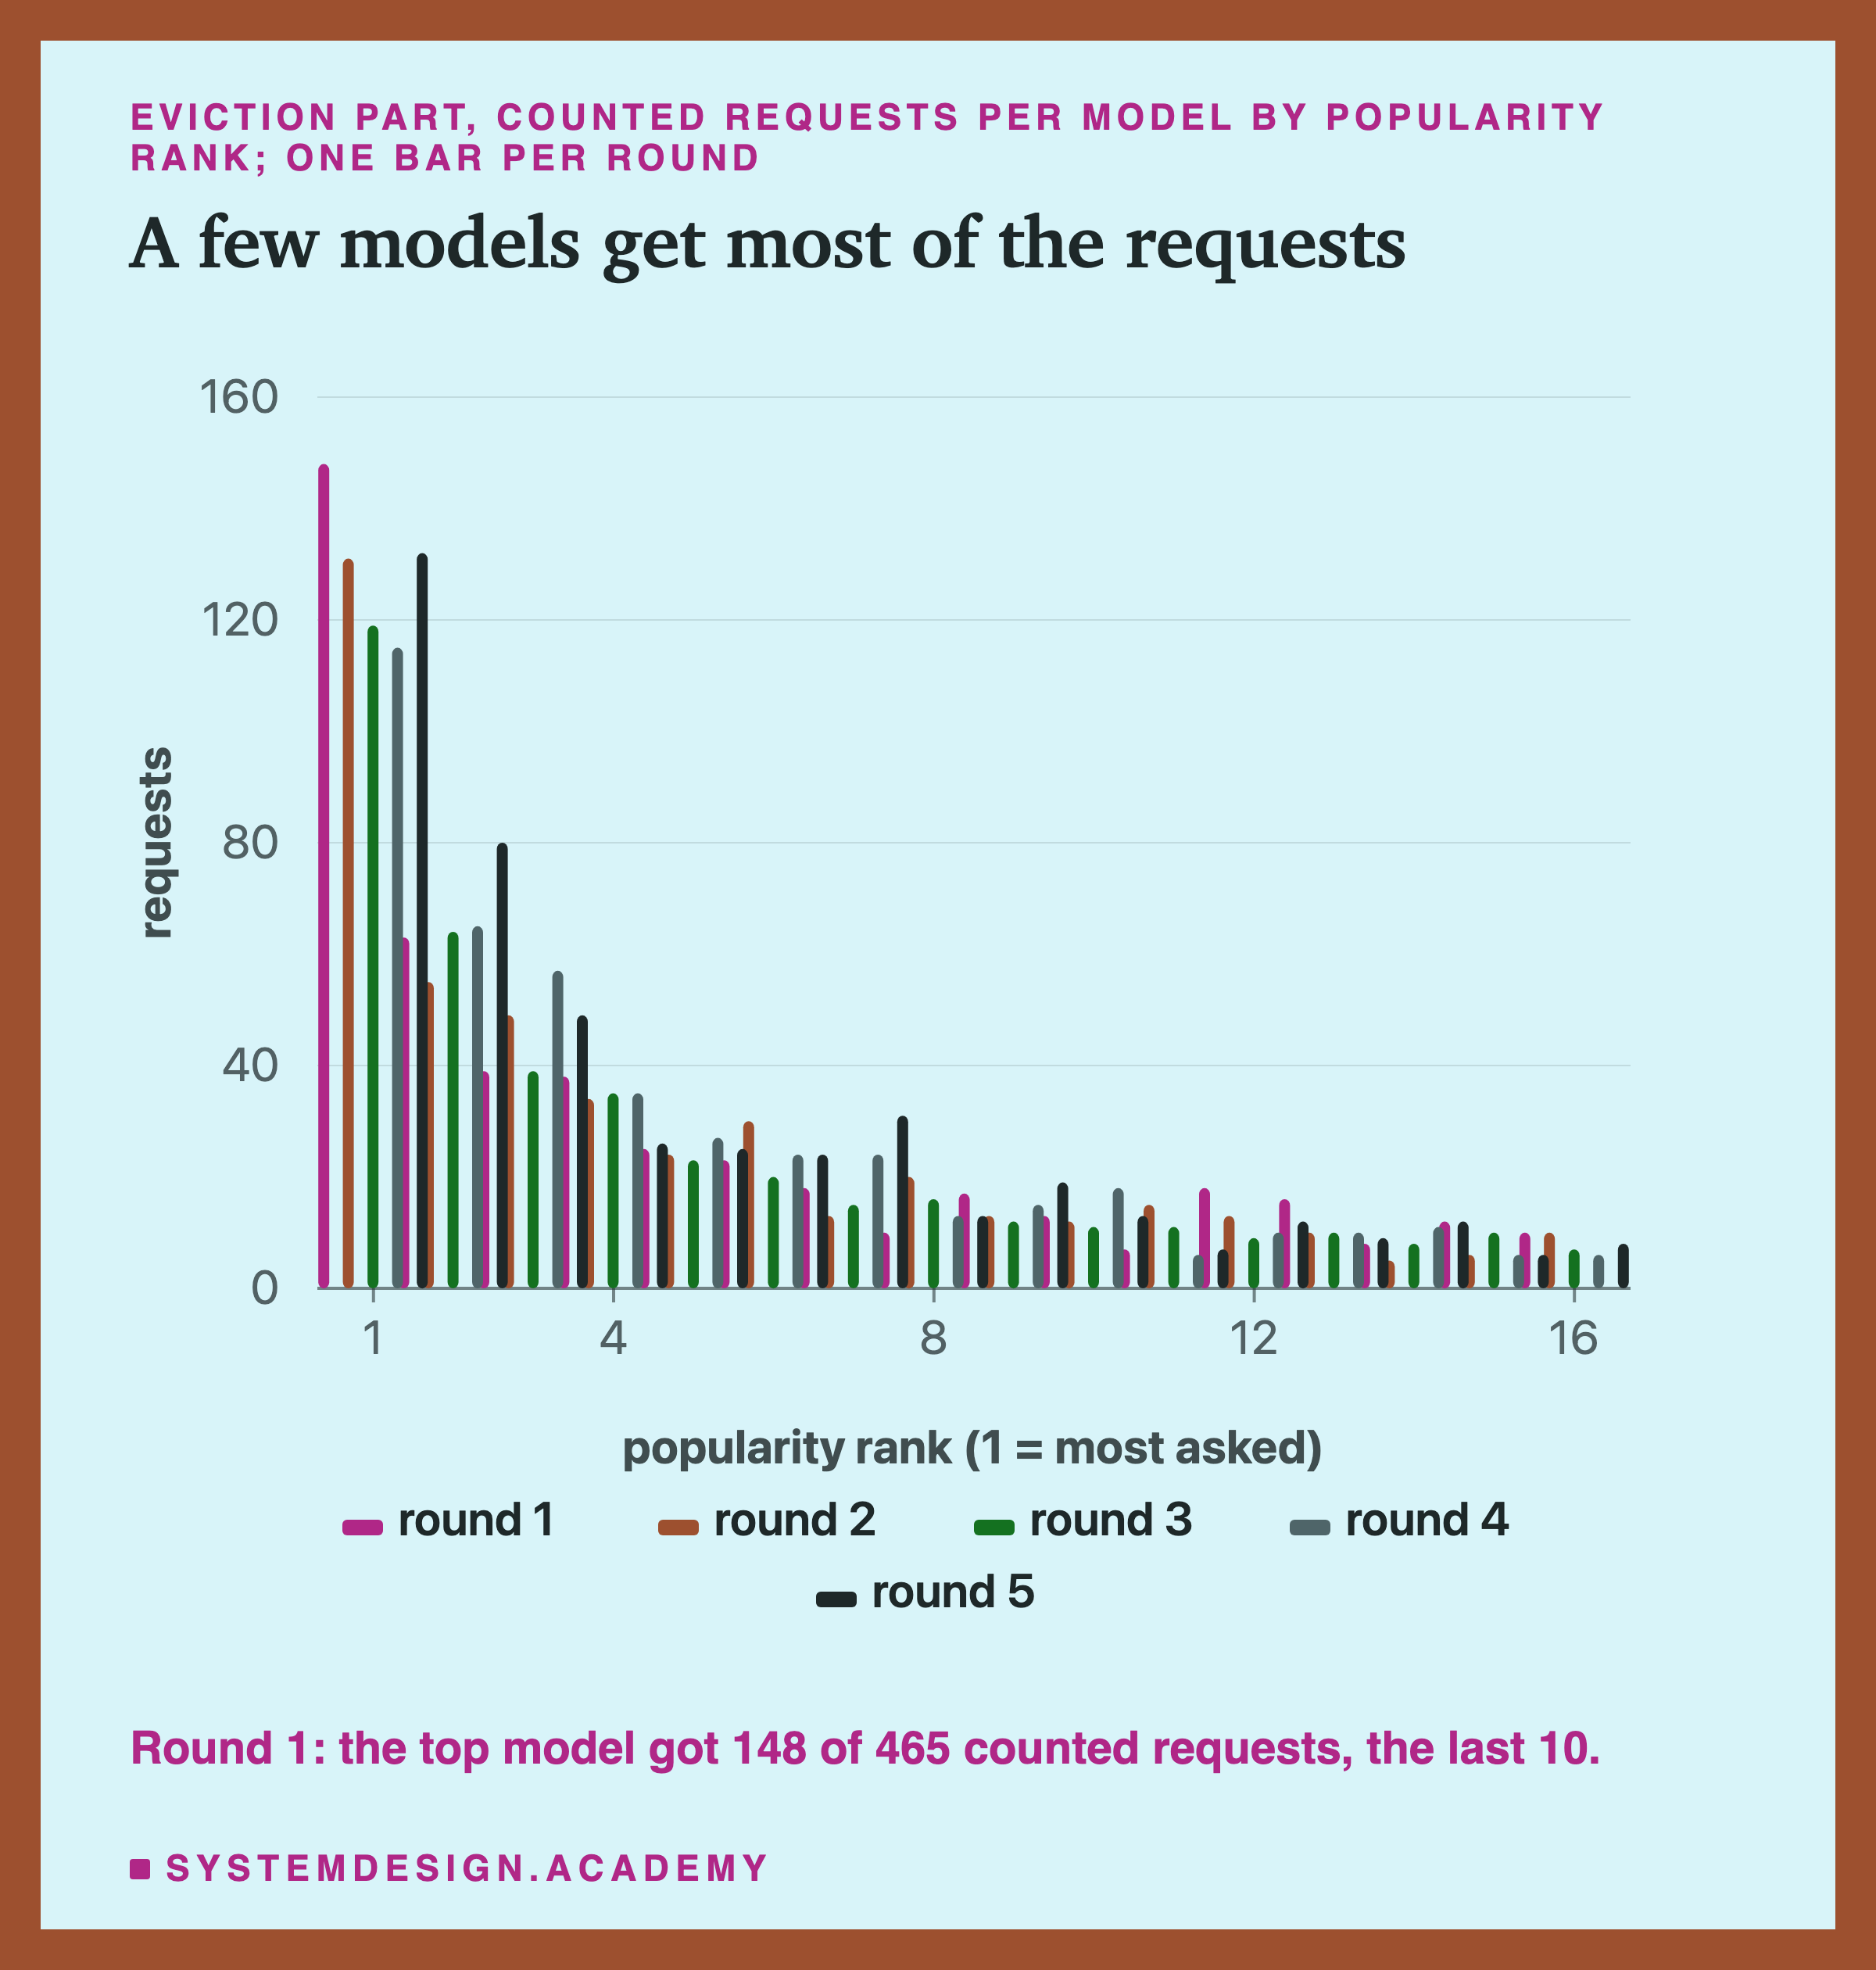
Each run also had a disk setting. Warm: every model file sat in the page cache. Cold: before each load, the service asked Linux to forget that file, so every miss read from the disk. Real services meet both. A file read a minute ago is warm; a file nobody has touched today is cold.
The hit rate is the share of requests whose model was already in memory. With room for 2, 4 and 8 models, it was 26.8%, 46.1% and 73.1% (middle round). That is a check, not a finding. Once you know the room and the pattern of requests, the hit rate follows. A simulation is a make-believe version that counts time instead of measuring it. A small simulation on my laptop predicted 26%, 46% and 72% before the run. The findings are what a miss costs, and who pays for it.
The Cache Is a Table From a Model's Name to Its Place
How does the service find a model? It keeps a small table that maps a model's name to its place in memory, or says it is only on the disk. Here each shop has its own model, named with a letter.
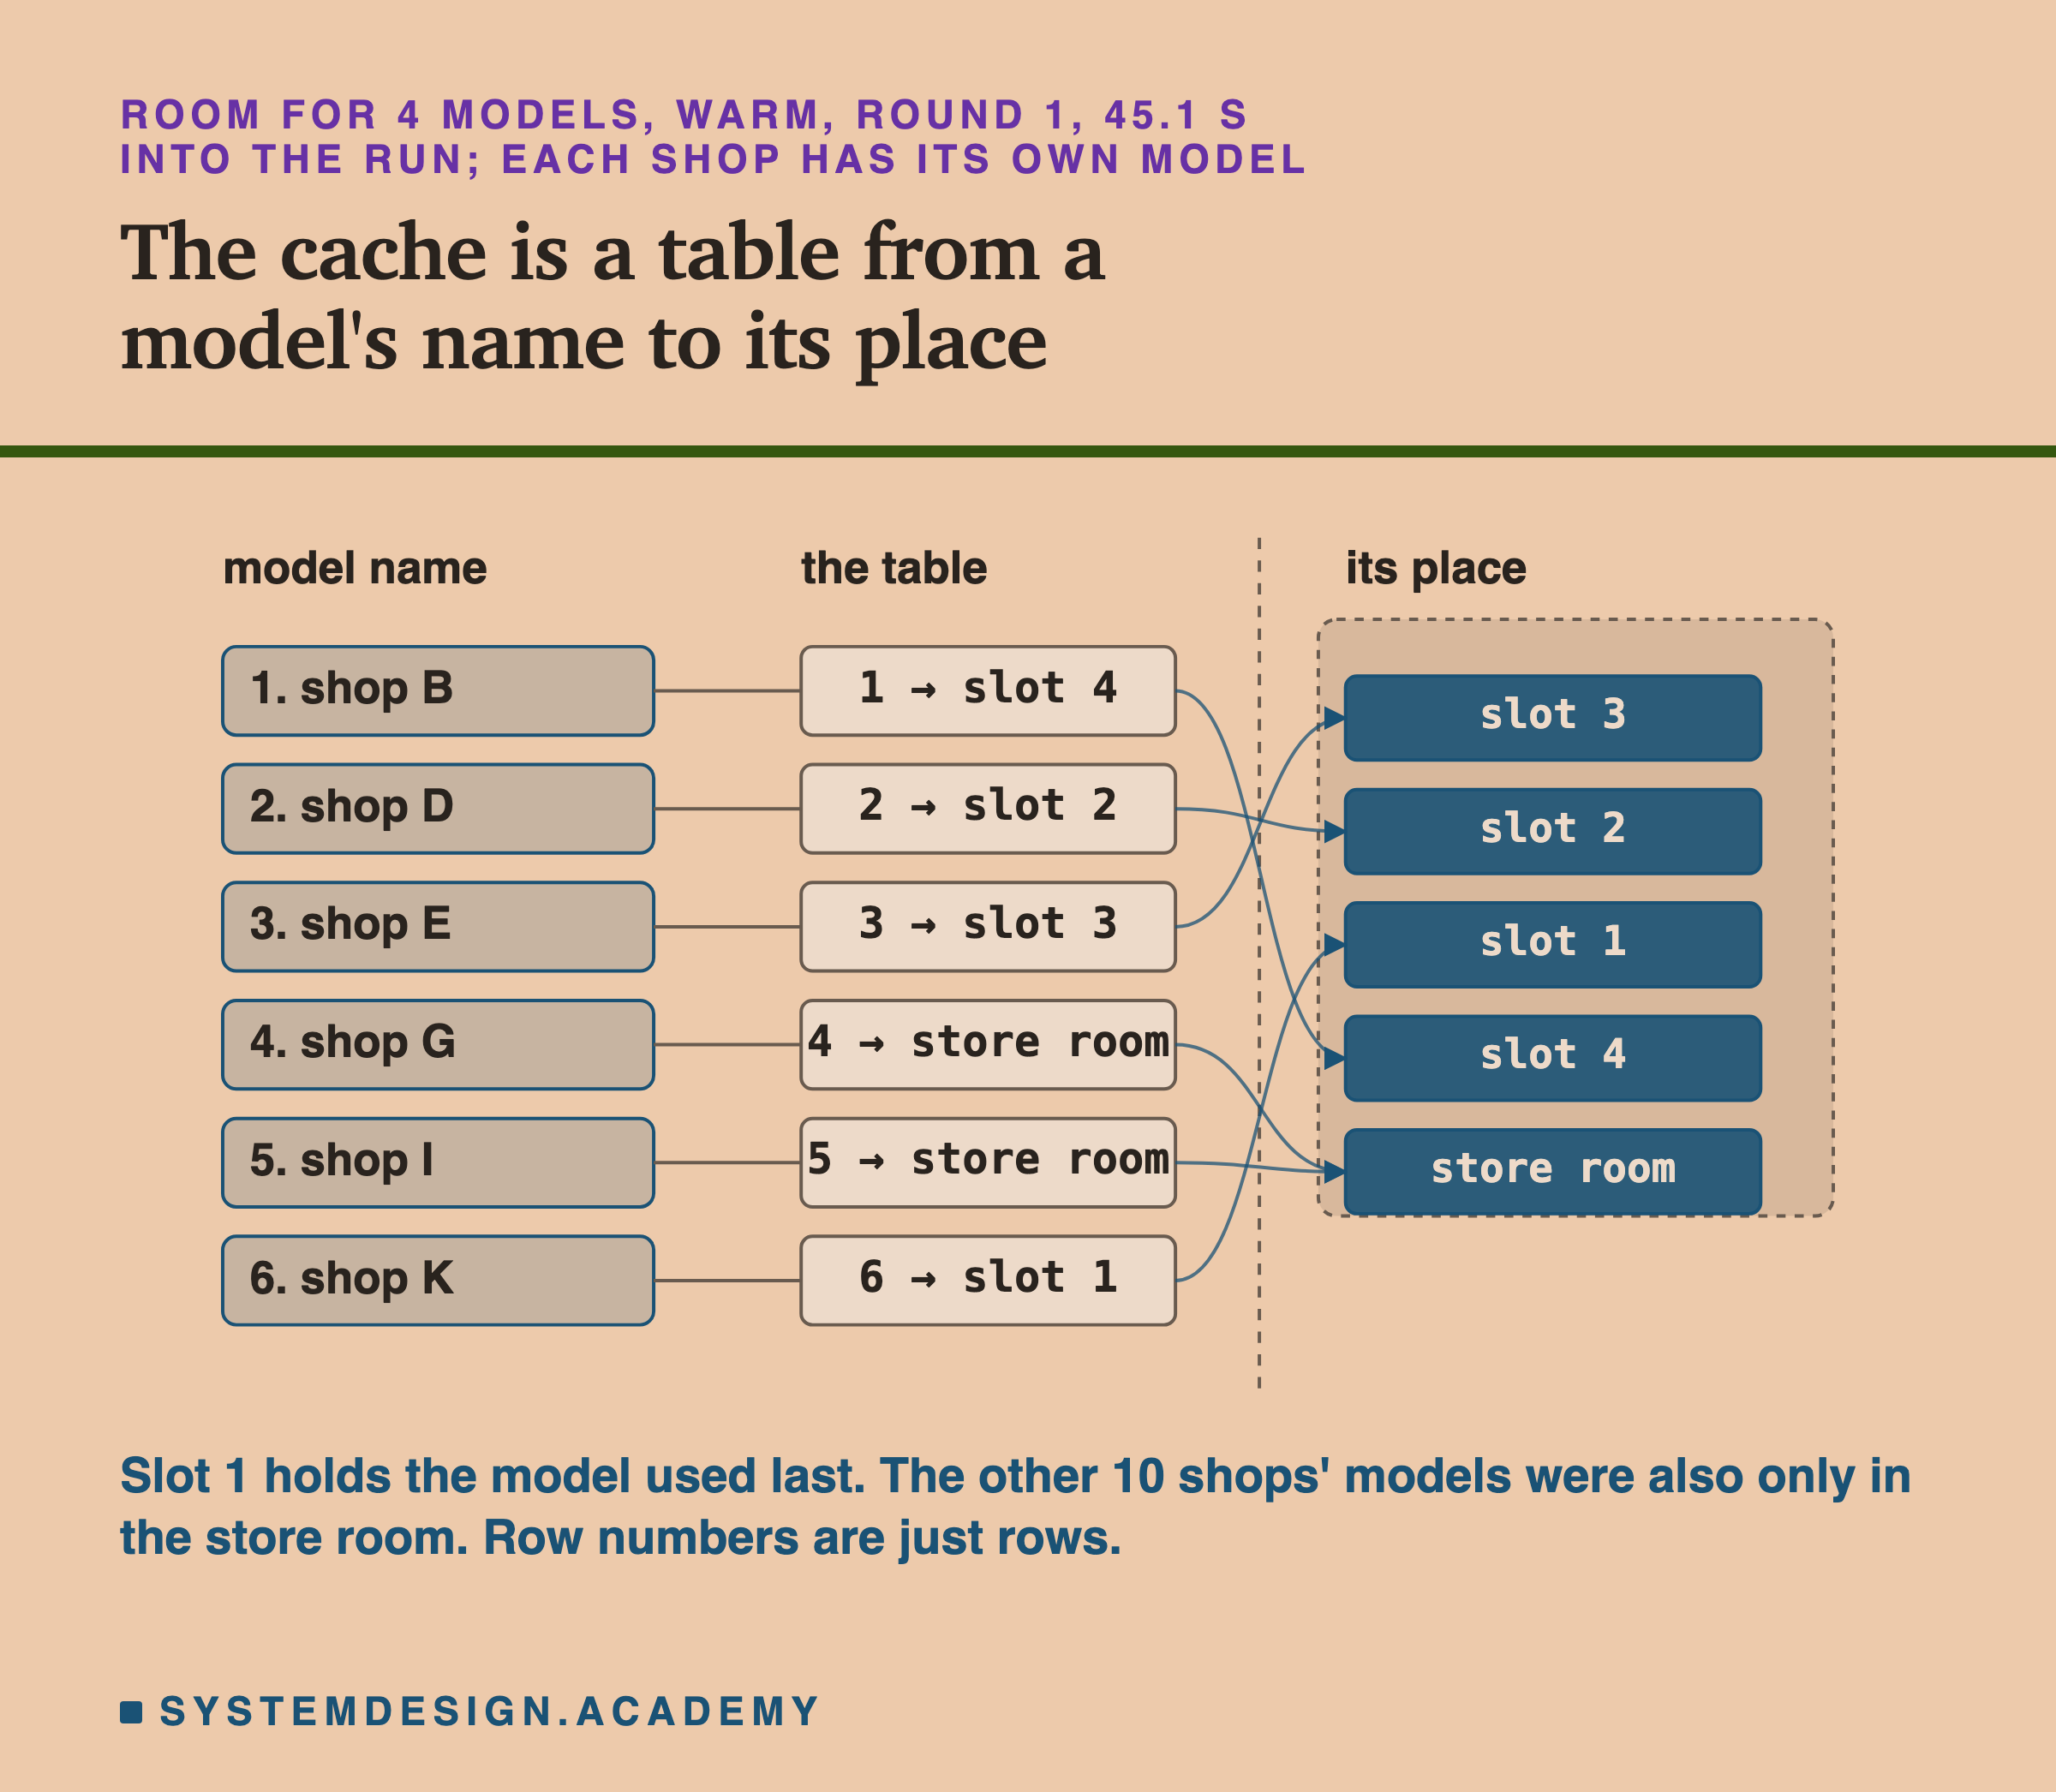
This is a real moment from a real run: room for 4, warm, round 1, 45.1 seconds in. I rebuilt it by replaying the run's own list of requests, and the replay agreed with the service's own hit or miss on all 550 requests. The table is looked up by name. Shop K's model sits in slot 1, so it was used last. Shop G's and shop I's models were only in the store room.
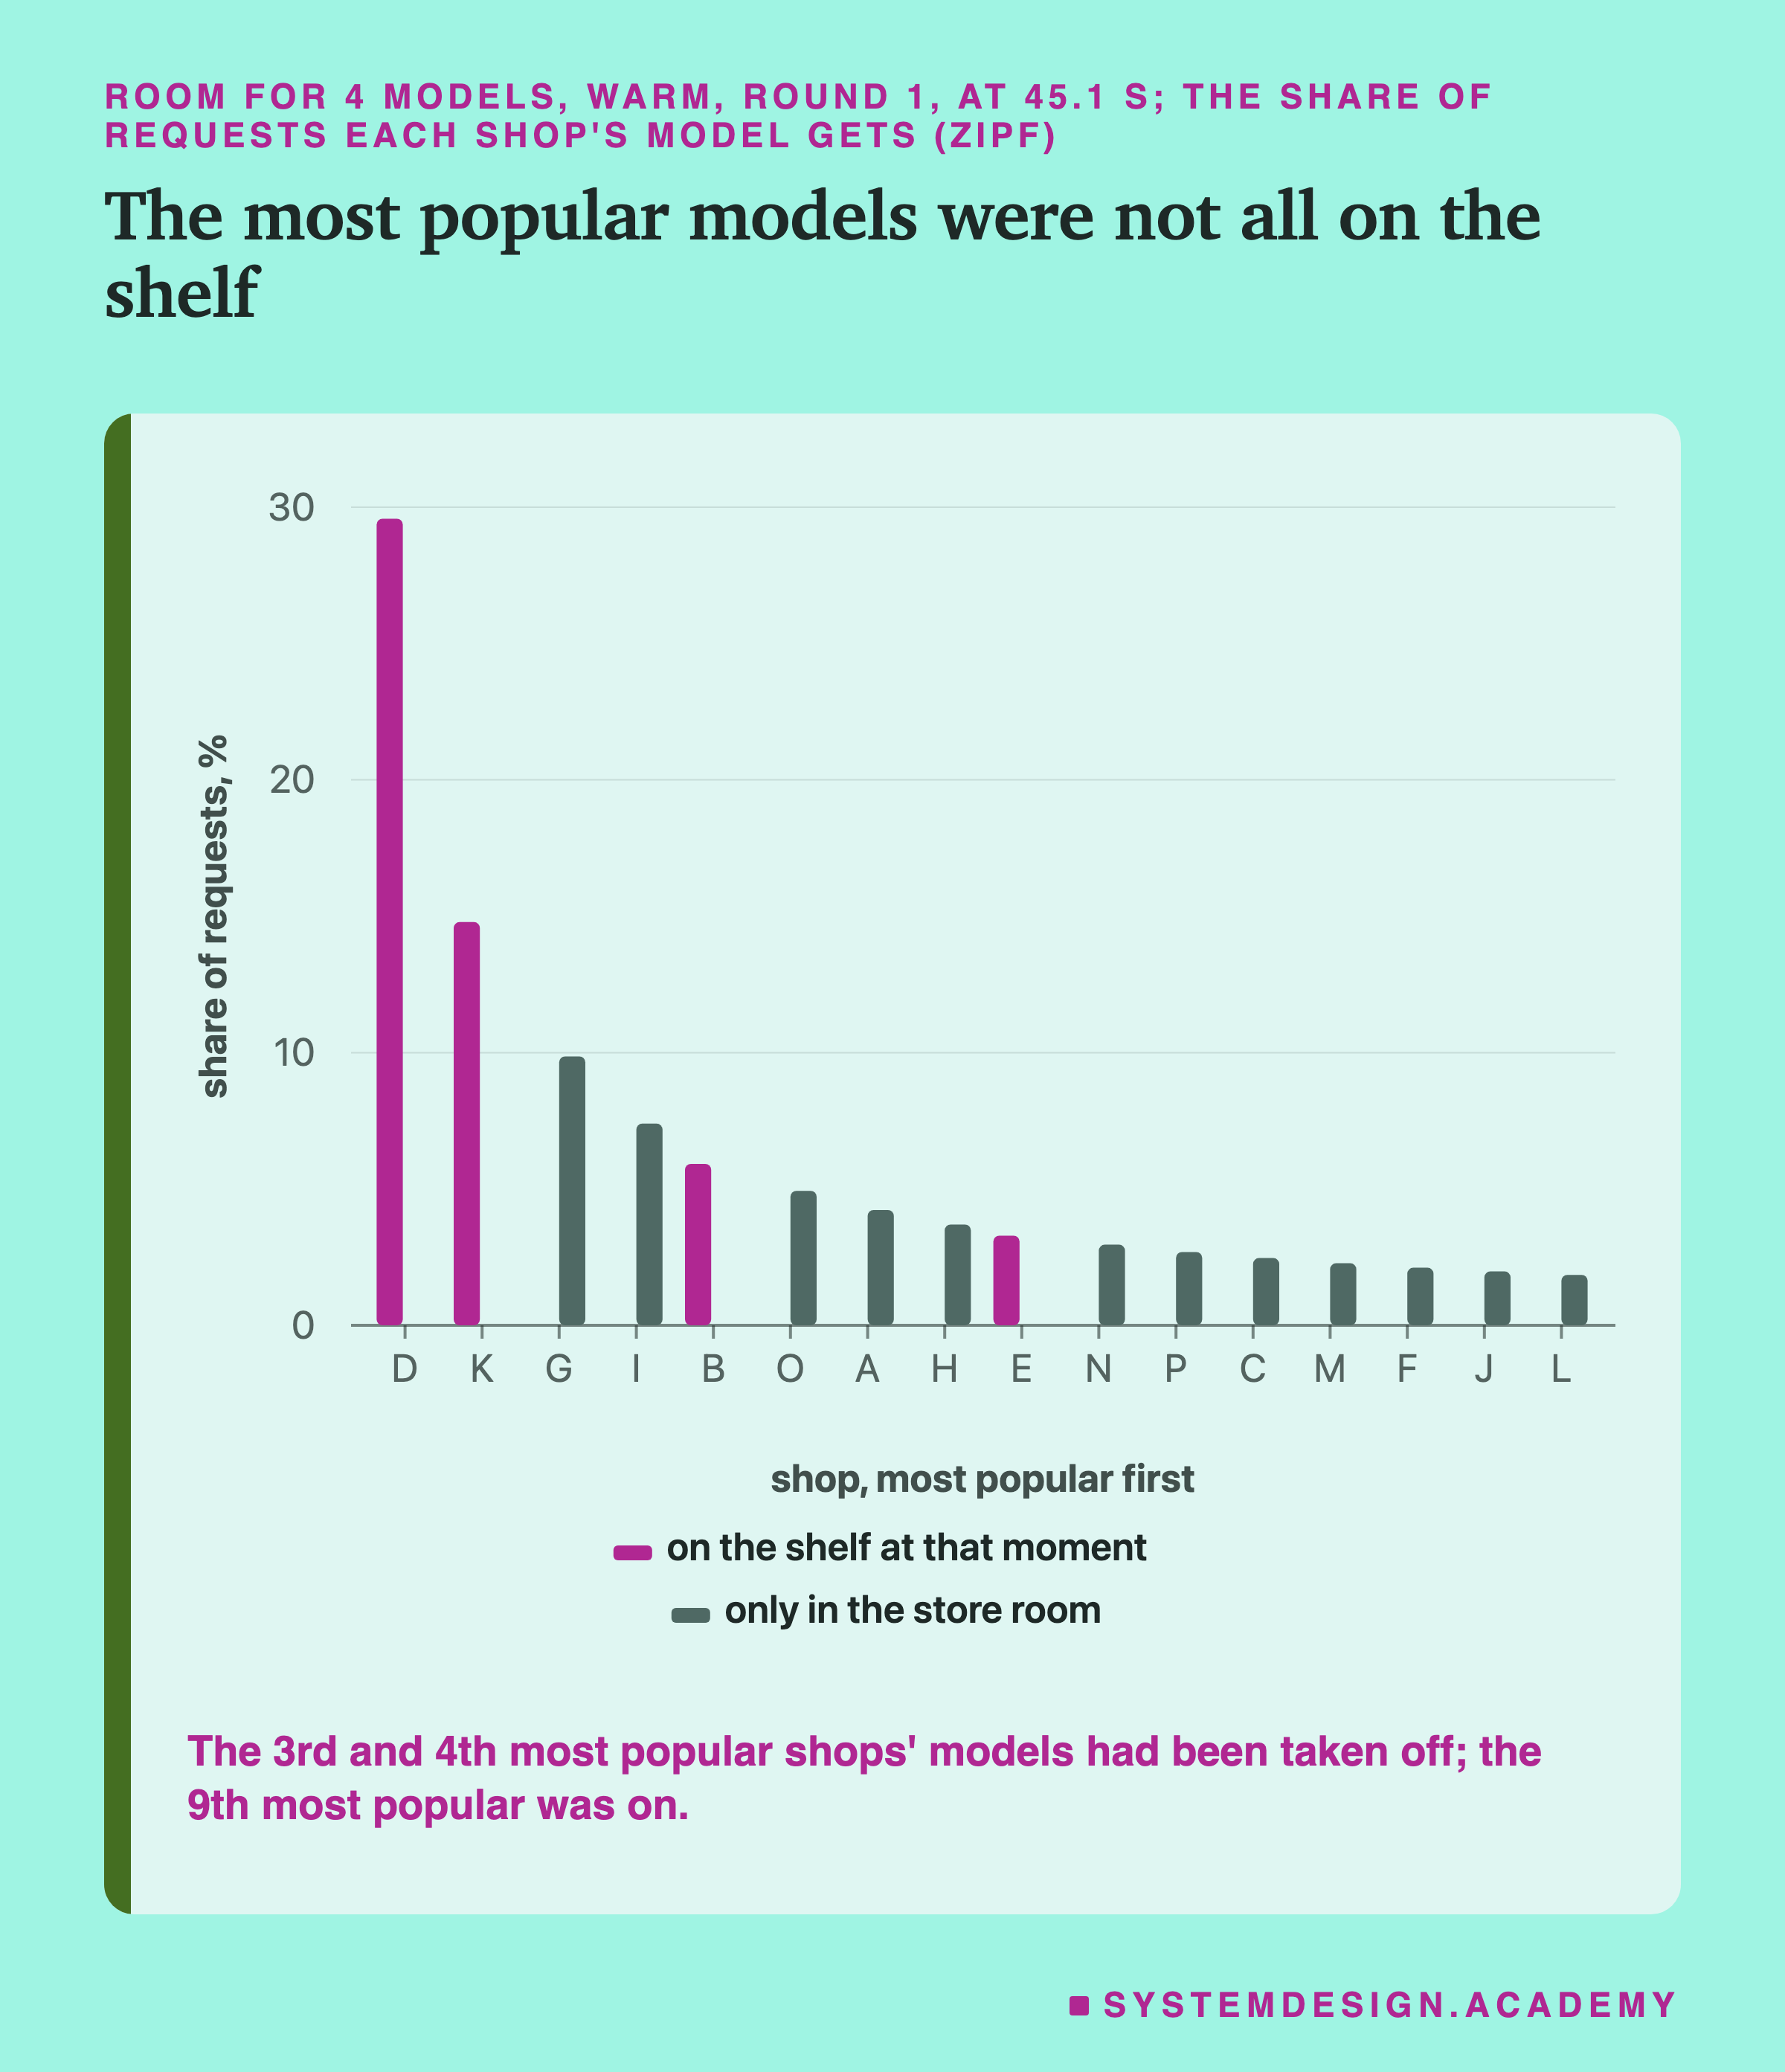
Popular does not mean present. The two most popular models, shops D and K, were in memory. The third and fourth most popular, G and I, were not. Shop E's model, only the ninth most popular, was. Which models are on the shelf changes with every request, so the service must look each one up by name.
A Request That Hits Still Waits Behind a Load
Here is a real 0.7 seconds from the run with room for 2 models and a cold disk. Each bar runs from when a request arrived to when its answer came back.
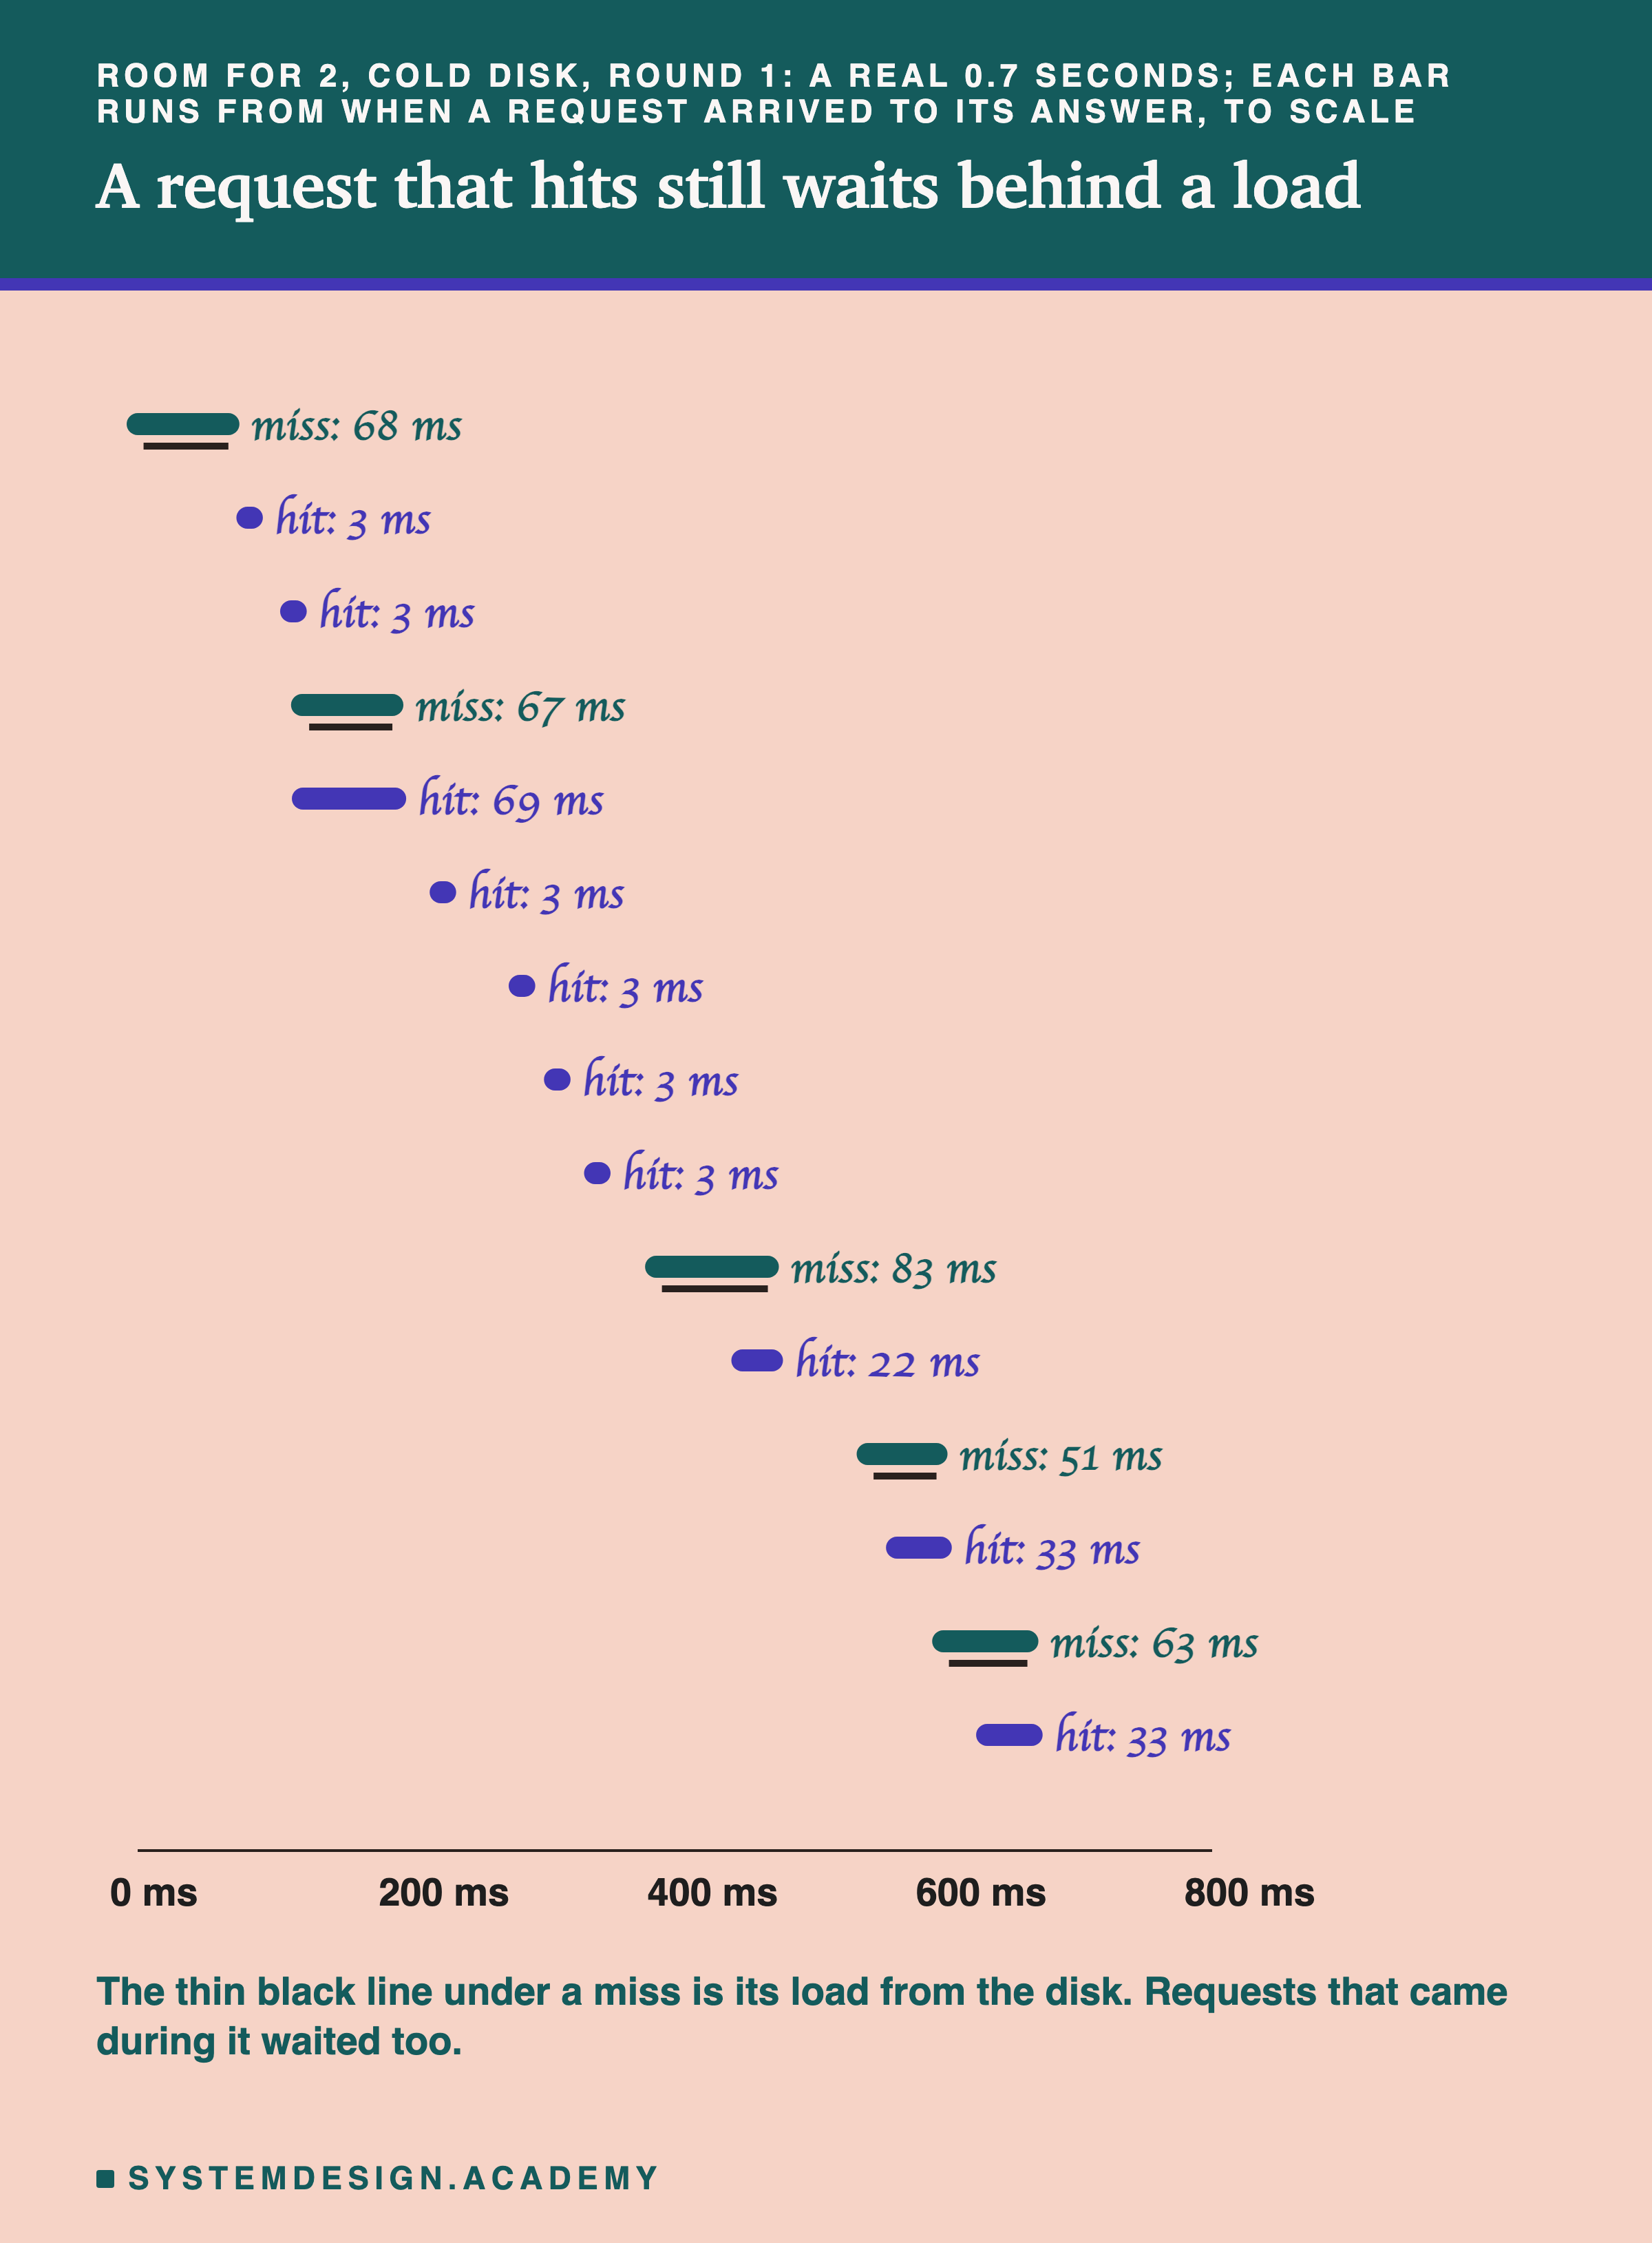
Most hits took 3 ms. But a hit that arrived while a miss was loading took 22 to 69 ms. Its model was in memory the whole time. It waited only because the service was busy loading another shop's model.
Why? This service does one thing at a time. It loads a model inside the request handler, the part of the code that answers a request. While it loads, the event loop is stuck. The event loop is the part of the service that picks up new requests. So every request that arrives in that time waits, even if its model is already in memory.
Lesson 2 warned about slow work inside an async def handler, a handler that shares the event loop with every other request. This is that warning, measured.
The Slowest 1 in 100: Hits and Misses
For waiting times, I use the slowest 1 in 100. Line up all the waits from shortest to longest. The p99 is the wait that 99 of every 100 requests beat. So it tells you about the slowest 1 in 100, and those are the users who complain.
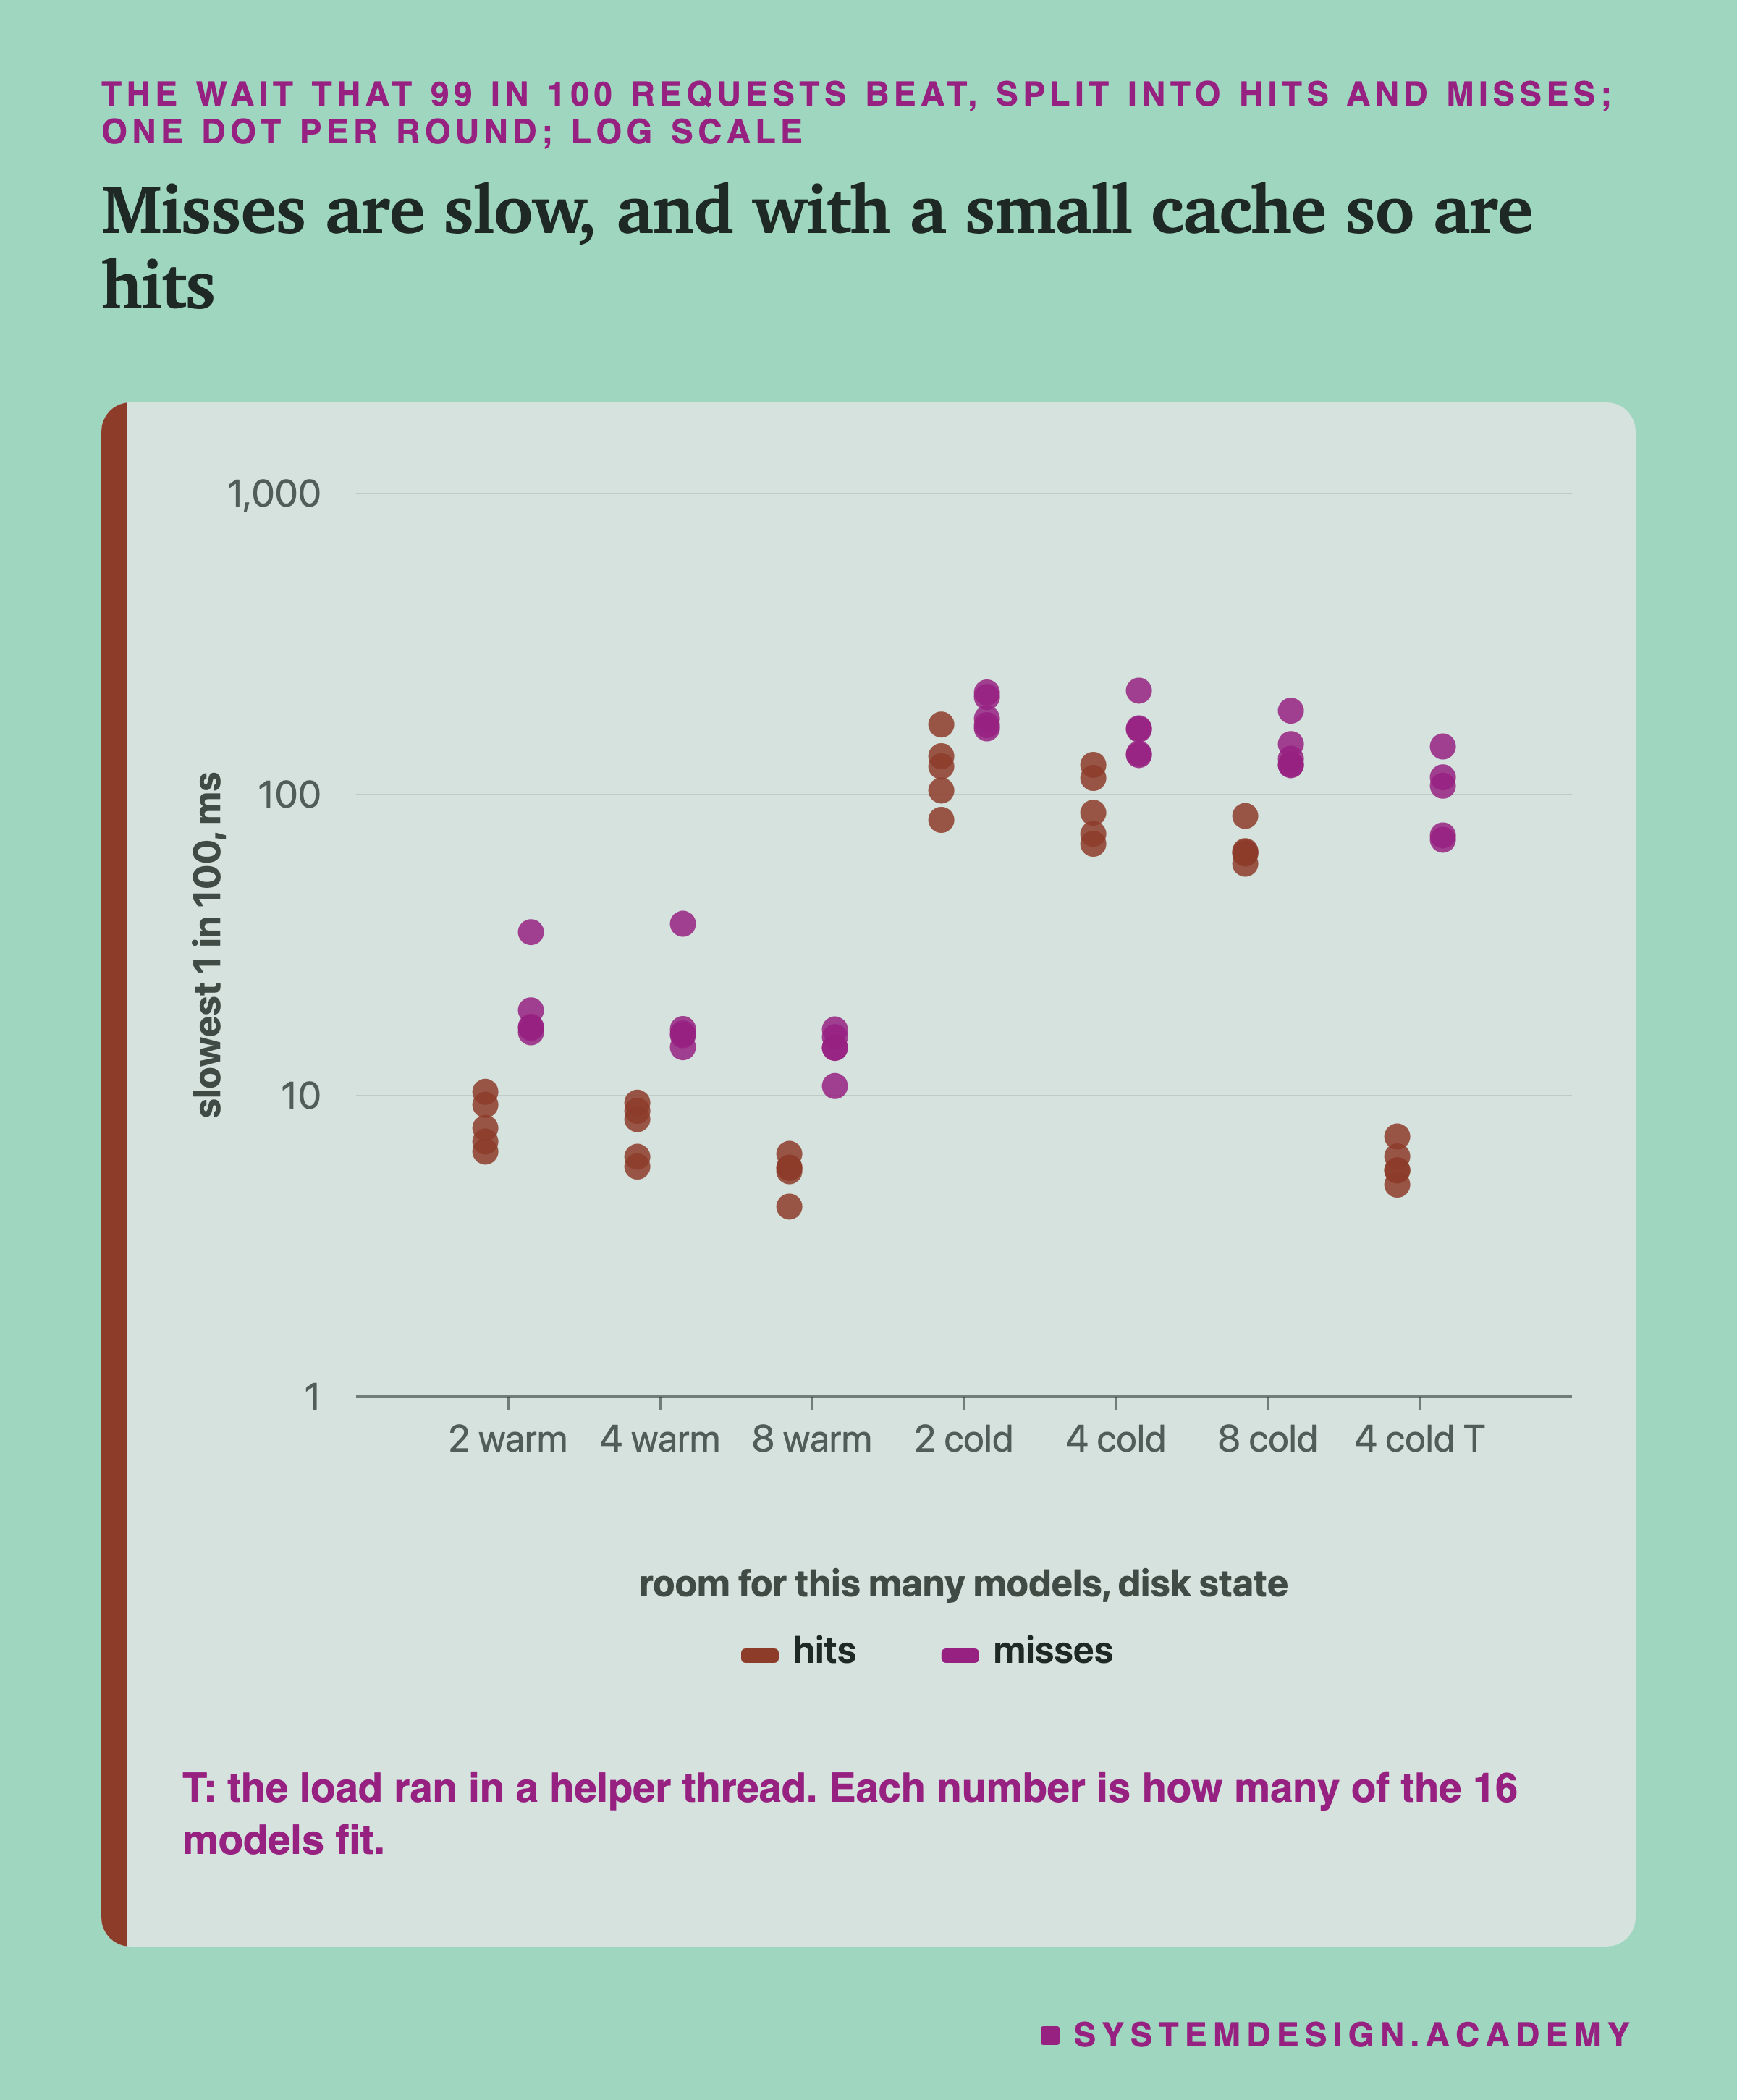
Misses were slow, and a cold disk made them slower. With a warm disk, a miss's slowest 1 in 100 took 14 to 17 ms. With a cold disk, 132 to 179 ms (middle rounds), because each load took about 62 ms.
With a cold disk, hits were slow too. The slowest 1 in 100 hits took 124 ms with room for 2, 87 ms with room for 4 and 64 ms with room for 8. The same hits took 6 ms with room for 8 and a warm disk. These slow hits are the ones that queued behind a load. A smaller cache means more misses, so more loads, so more hits stuck behind them.
Room for 2 against room for 8, both cold, gave clearly different slowest waits over all requests. Cold against warm at room for 4 was clearly different for hits too.
These tails rest on few requests. Each run counted about 440 requests. With room for 2 that is about 119 hits per run, so its slowest 1 in 100 hits is about the second slowest hit. With room for 8 there were about 119 misses per run. Read these tails as rough.
Why was a warm load faster here than in part 1? Inside the cache service a warm load took about 4.8 ms; in a fresh program, 8.4 ms. One possible reason, which I did not test: the service reuses memory it already holds, as the jars showed. A fresh program must get new memory from Linux.
Let a Helper Fetch the Model
One fix is to load the model off the main path, in a helper thread: a second line of work inside the same program. The handler hands the load to the helper and waits, and the event loop is free to serve hits in the meantime.
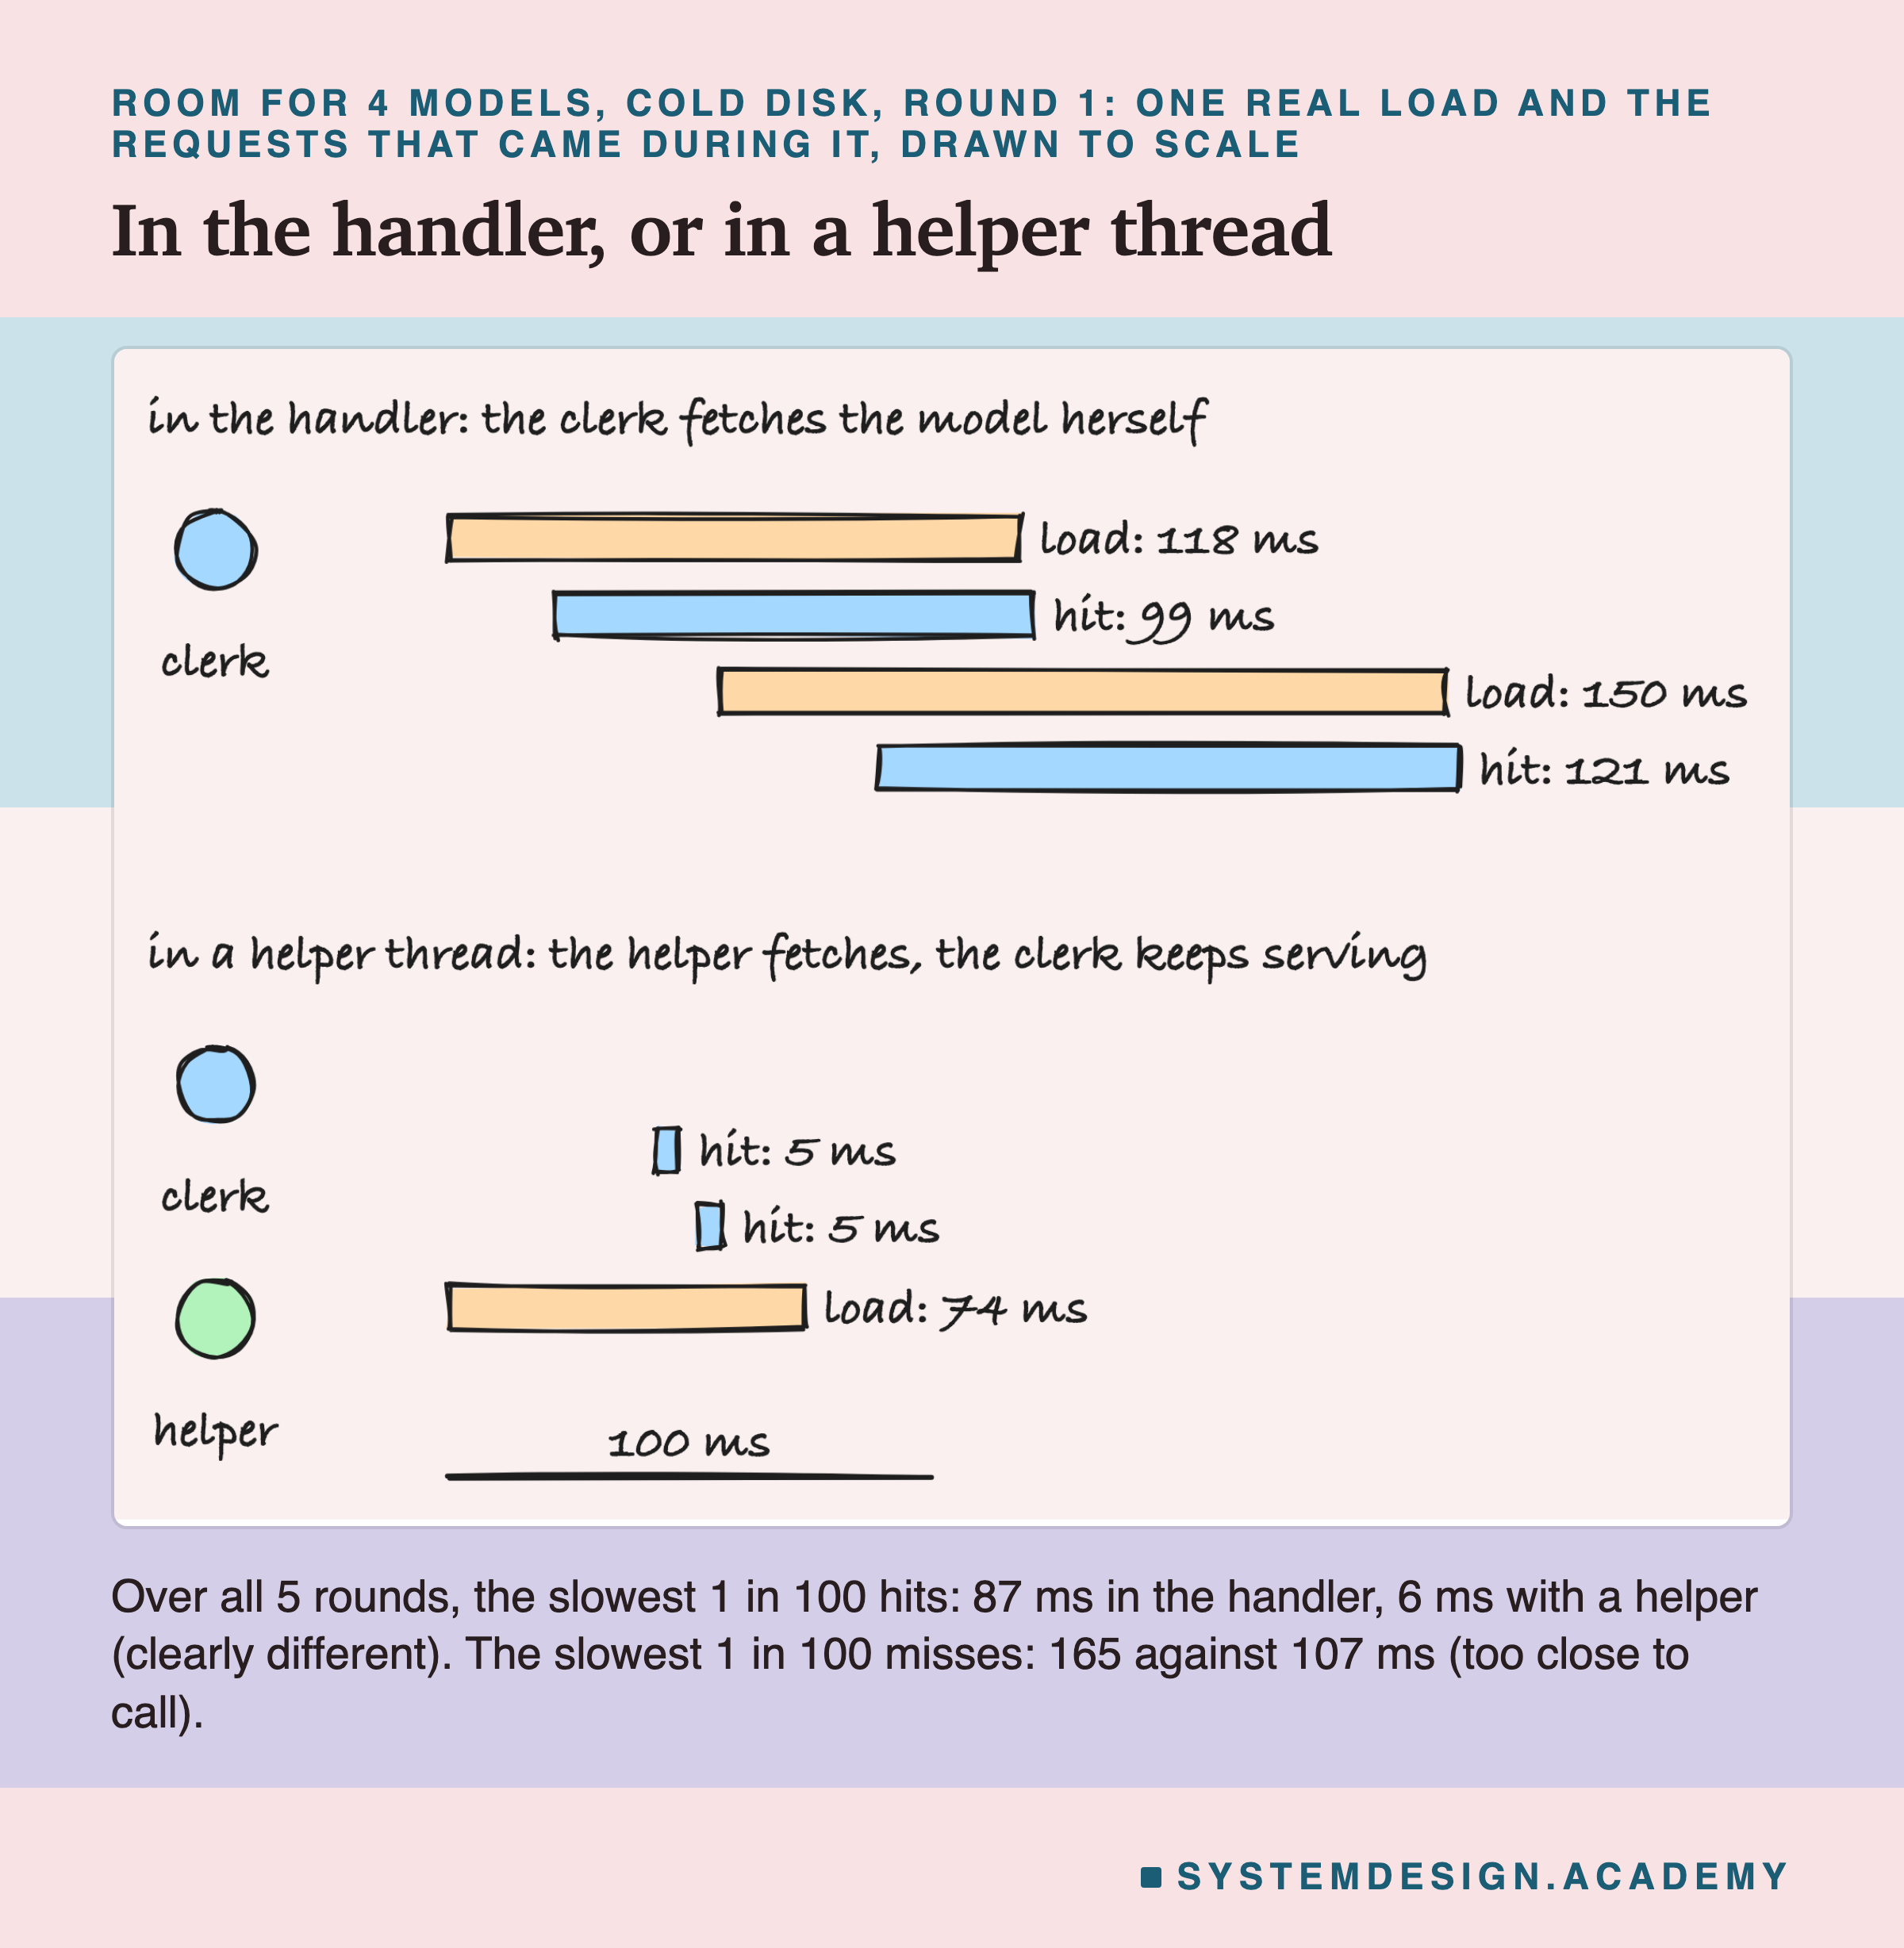
Hits stopped waiting. With room for 4 and a cold disk, the slowest 1 in 100 hits fell from 87 ms to 6 ms. That was clearly different in all 5 rounds. I had guessed it would help.
Misses were too close to call. Their slowest 1 in 100 fell from 165 ms to 107 ms in the middle round, but one round's difference was small. A helper thread can start a second load while a first is still running, so misses may wait less behind other misses.
The price was memory. While a load runs in the helper, the old model has not been dropped yet. With loads overlapping, the service briefly held more models than its room: its memory peaked at 345 MB against 291 MB with the load in the handler.
There is one more catch. Python lets only one line of work run Python code at a time; the lock is the token they pass. Lesson 5 showed that this lock can slow scoring when a helper is busy. Here the load spent most of its time waiting for the disk, so that did not show.
Memory Climbs, Then Levels Off
How much memory did the cache service hold during a run?
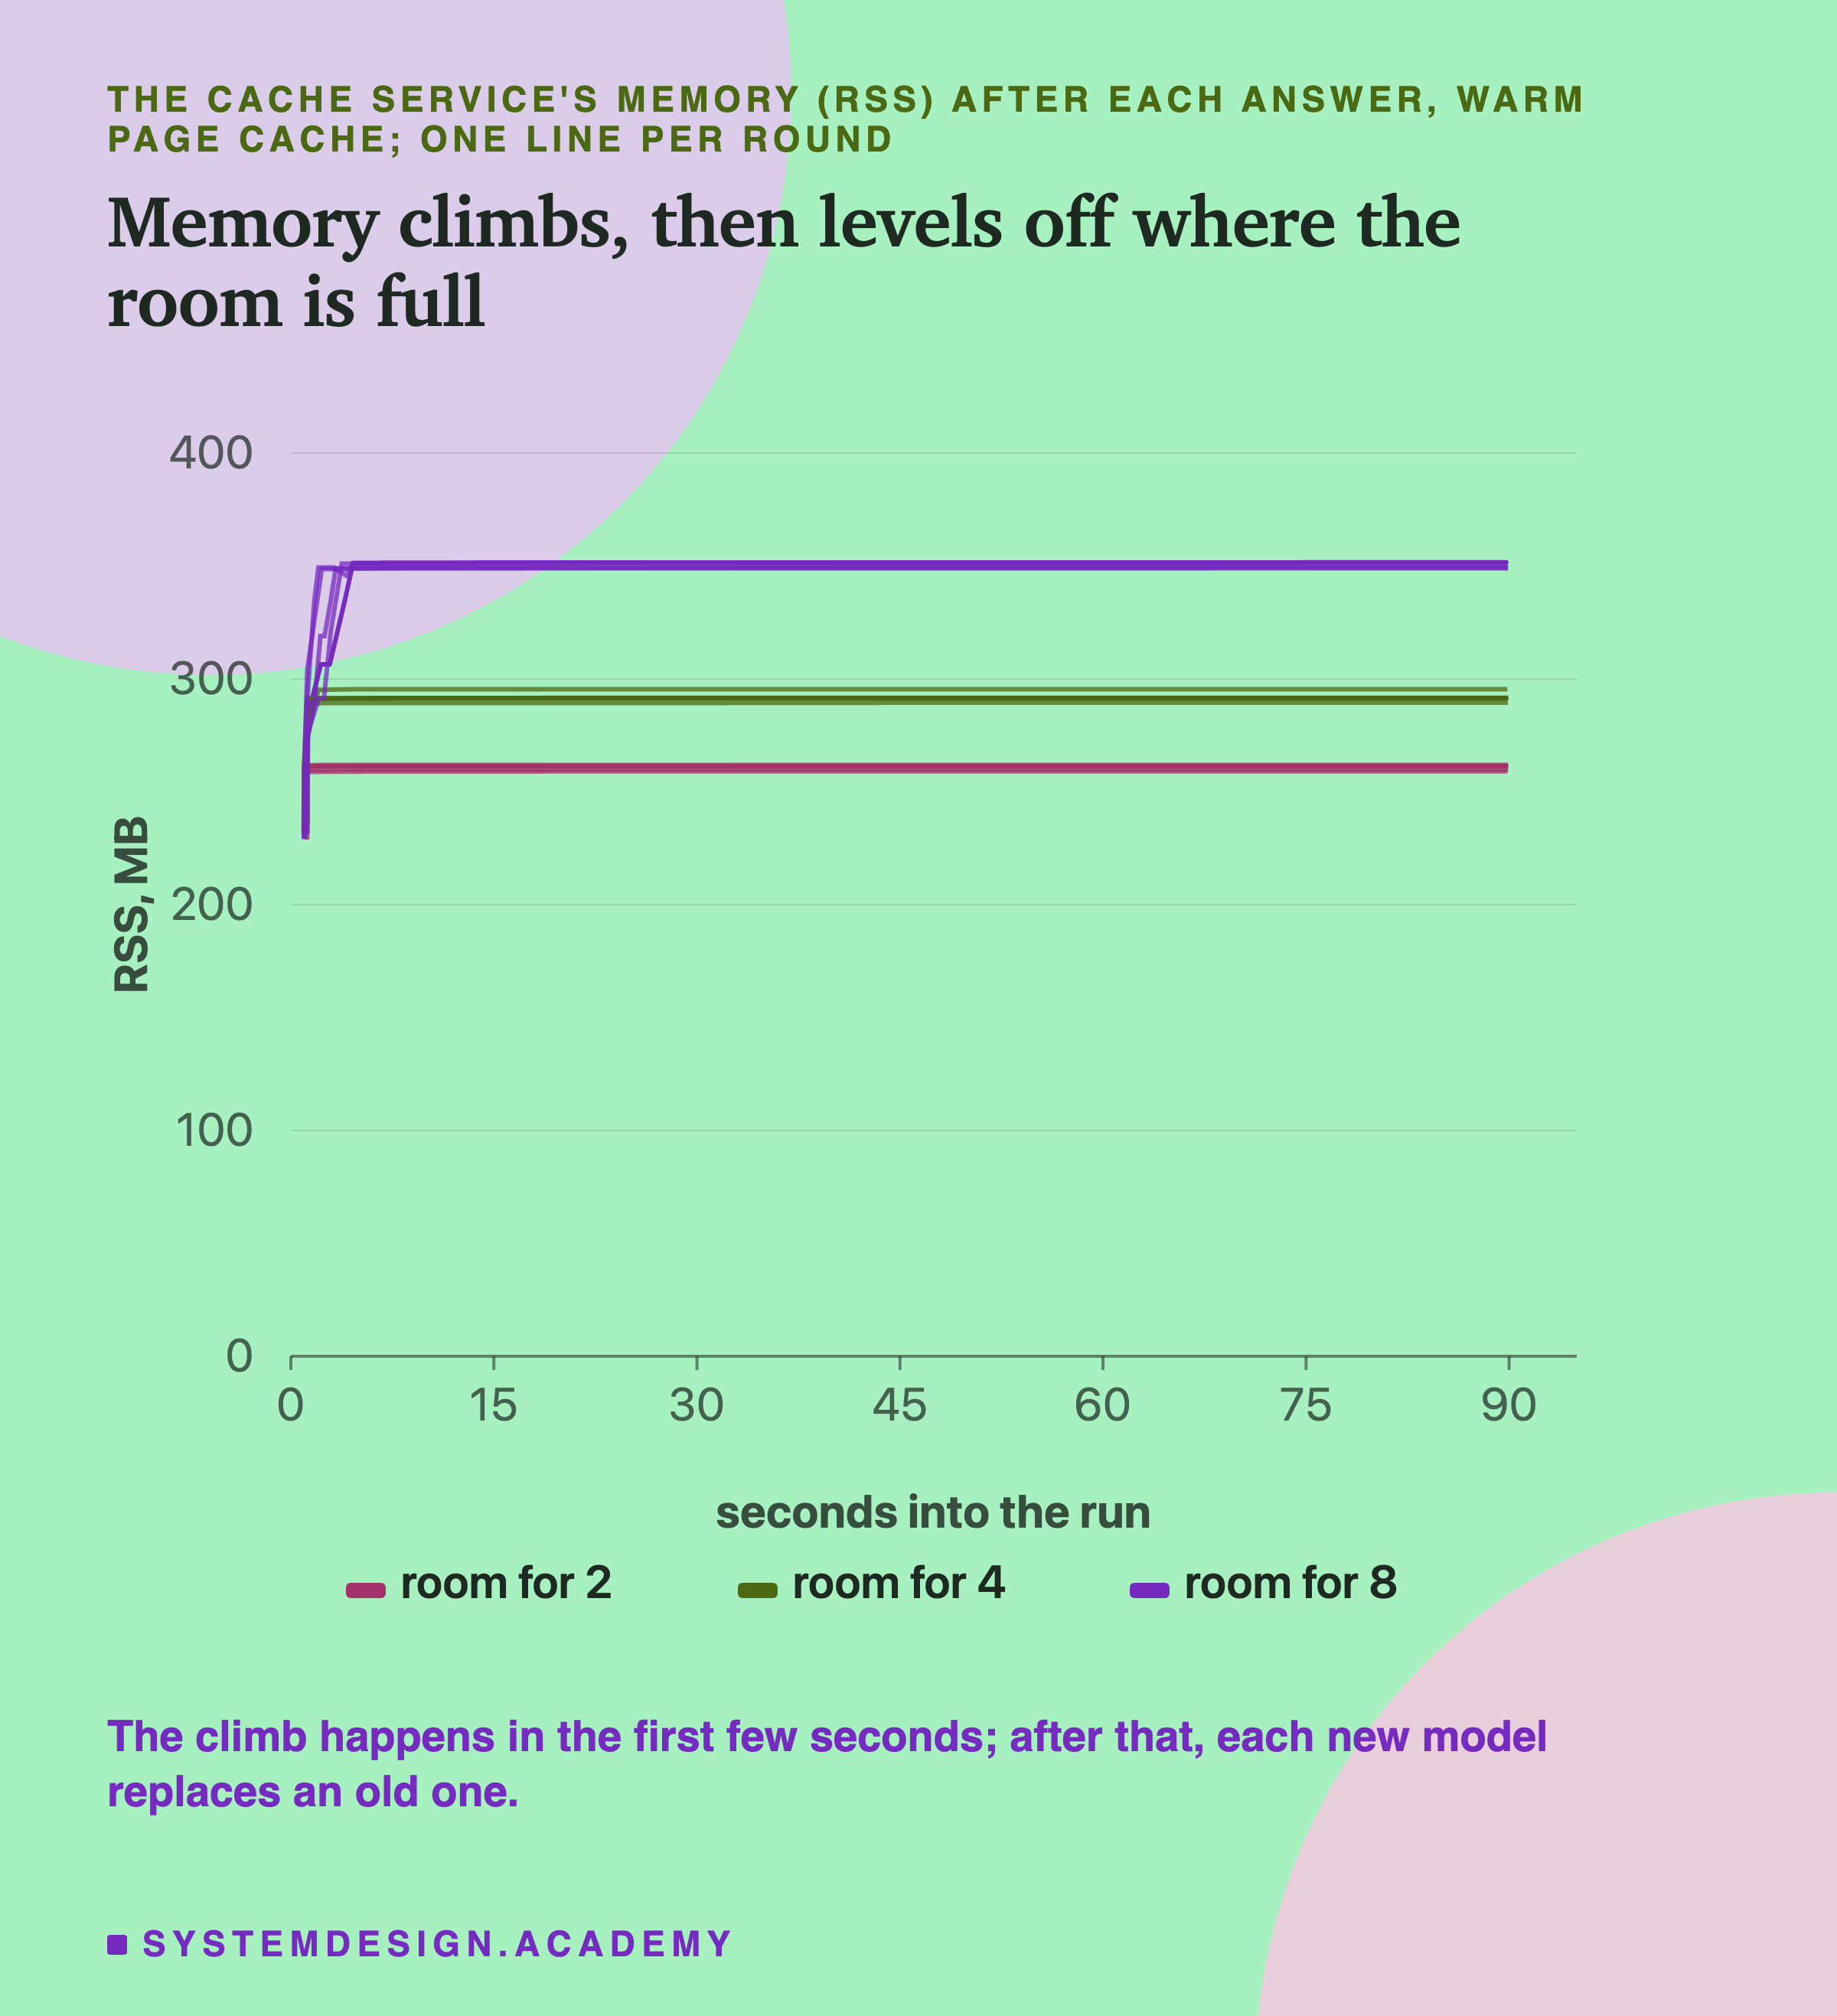
Memory followed the room, not the number of models. At the end of a run, the service held about 261 MB with room for 2. With room for 4 it held 291 MB, and with room for 8, 350 MB. After the first model, each extra place in the room added about 15 MB, one model. Dropped models did not pile up, because the next load reused the memory they left, as the jars slide showed.
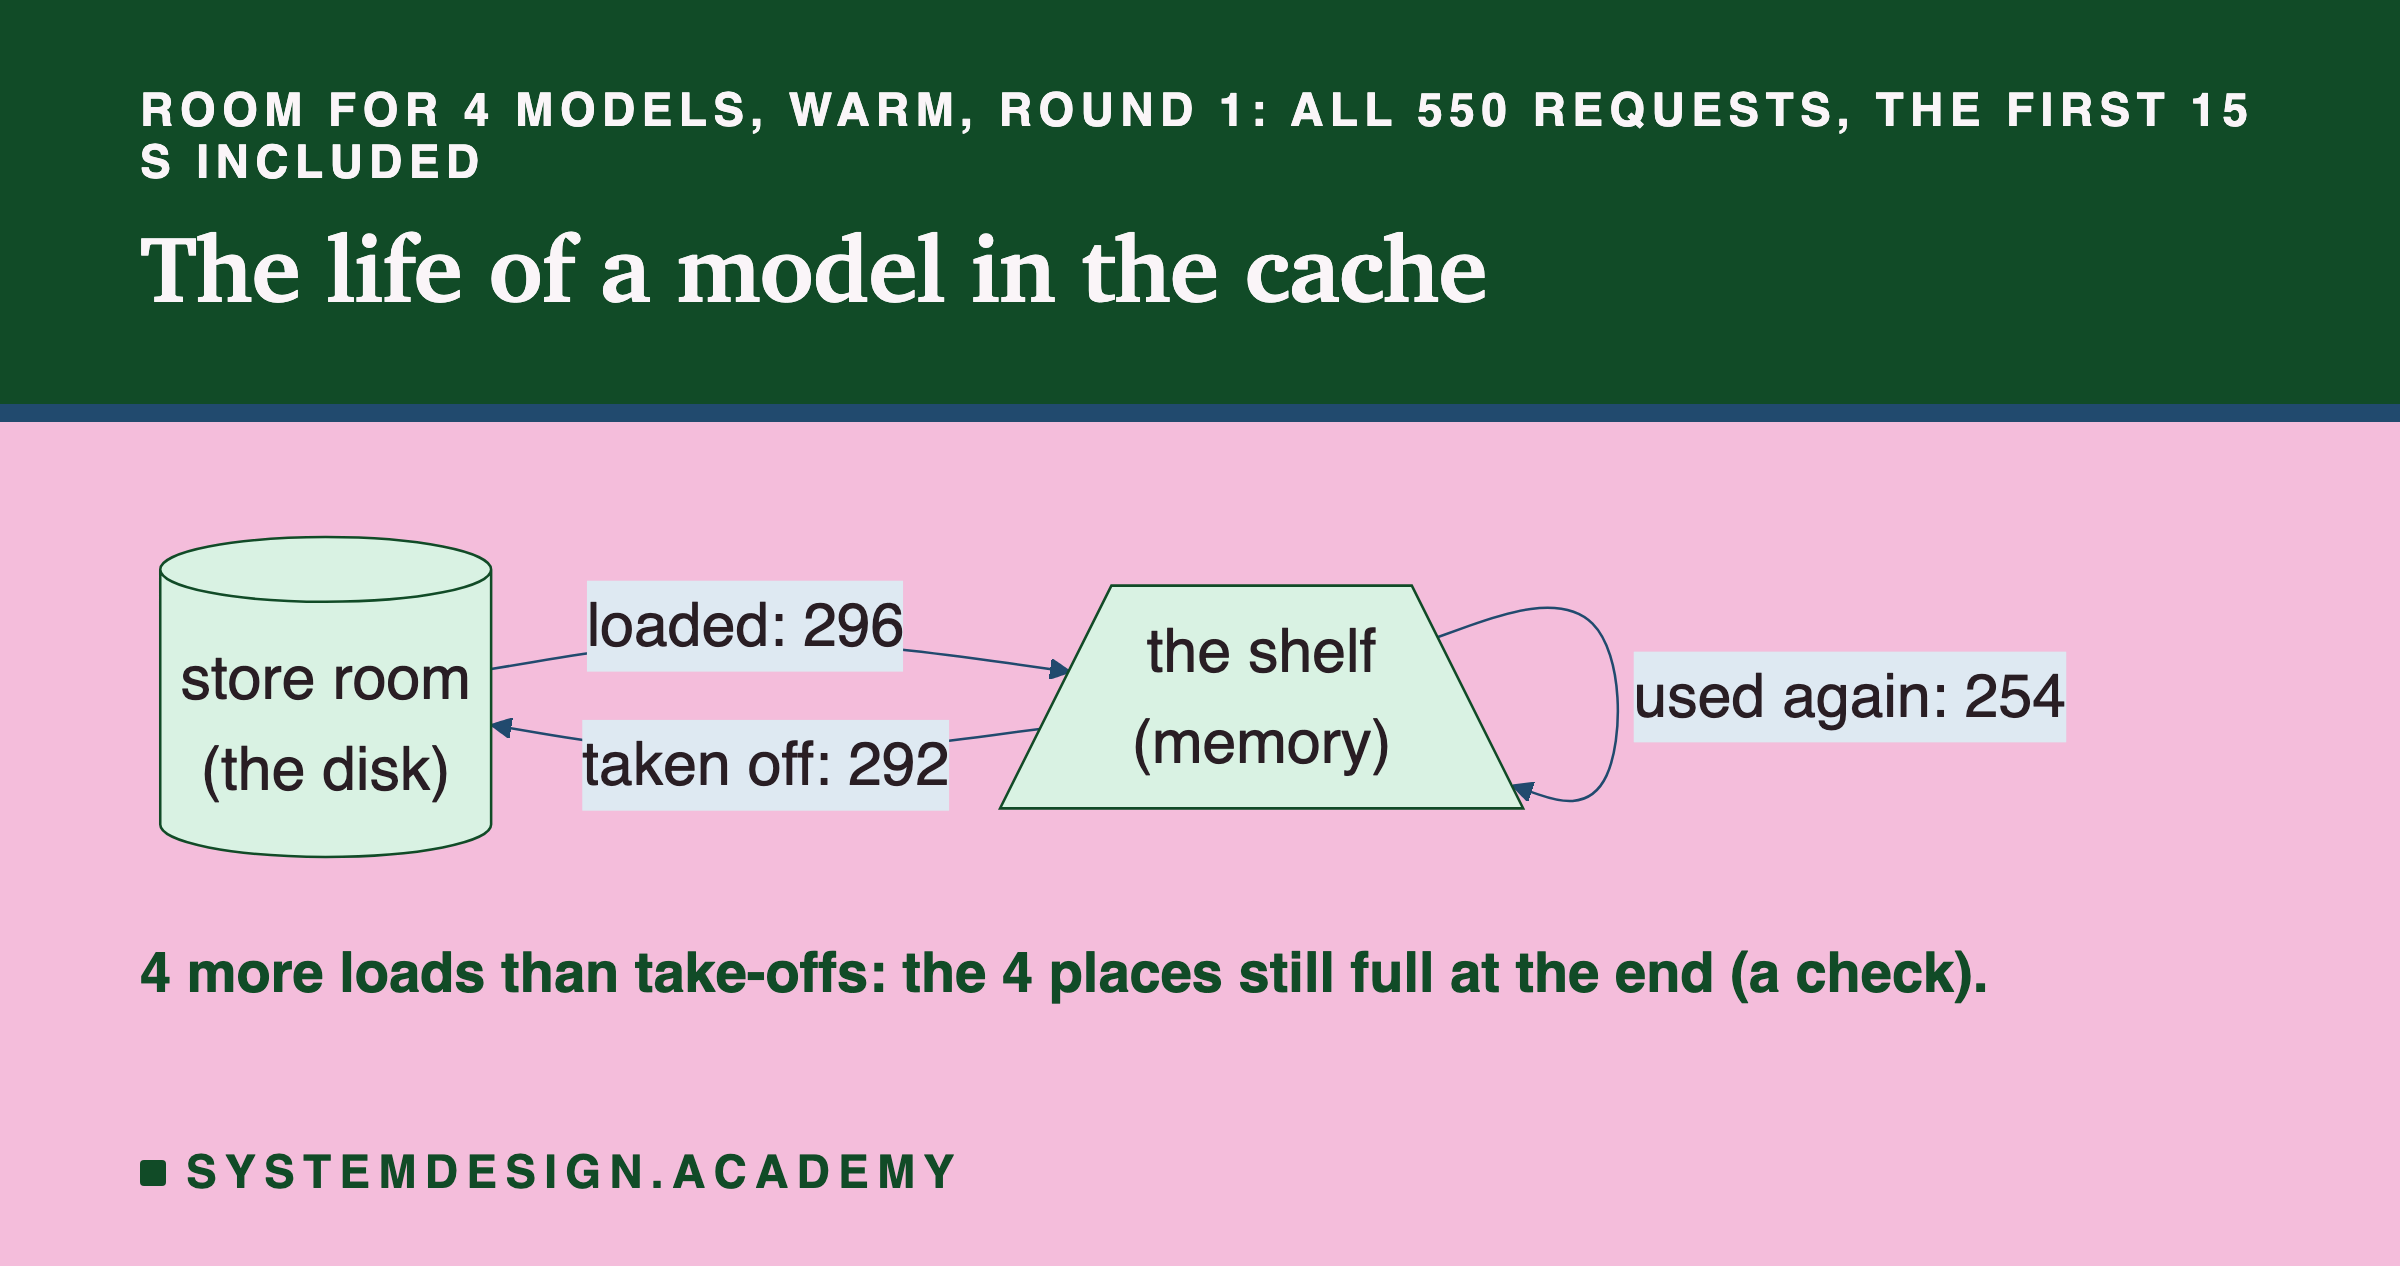
Over one whole run with room for 4 (warm, round 1, all 550 requests, the first 15 seconds included), a model's life looks like this. 296 times a model was loaded from the disk. 254 times a model already in memory was used again. 292 times a model was taken off to make room. Four more loads than take-offs is just the four places still full at the end; that is a check.
My Sixteen Guesses Before the Run, Checked
I wrote sixteen guesses into the lab before it ran. Each is quoted here word for word from the docstring, followed by a plain note. Twelve were right, one was partly right, and three were wrong. Four of them are only checks, true by design, and I mark them.
The guesses use short names. f01 is the first fleet model and s4 the biggest ladder model. pre means loaded once, then forked; post means each worker loaded its own; freeze is pre with gc.freeze. W is the number of workers, r10000 means after 10,000 requests, and K is the room in the cache. Pss is PSS.
-
"G1. Python with numpy and scikit-learn imported, before any model: VmRSS between 60 and 140 MB in every round." (VmRSS is RSS.) Wrong: 195 to 204 MB.
-
"G2. Each fleet model's RSS growth on load is between 0.9 and 1.3 times its file size, and tracemalloc's current count between 0.95 and 1.10 times its file size, for every fleet model in every round." Right: 1.05 to 1.06, and 1.04.
-
"G3. For every fleet model, tracemalloc's peak during the load is at most 1.10 times its current count after it (protocol 5 rebuilds numpy arrays from the pickle's own bytes, without a second copy)." (Protocol 5 is pickle's newest file format.) Right: at most 1.01.
-
"G4. After deleting both copies and gc.collect(), at least half of the RSS growth comes back for f01; after malloc_trim(0), at least 90%." Wrong in its first half: none came back after deleting. After the trim, 91% did.
-
"G5. Cold load at least 3 times the warm load for f01 and s4 in every round; s4's warm load between 3 and 5 times f01's." Right: 6.7 to 8.7 times, and 3.4 to 3.5.
-
"G6. FIT: under 256M the process holds between 8 and 13 fleet copies before it is killed, under 512M between 24 and 32, in every round; it is killed every time (exit 137, SIGKILL) and never prints a Python error; the kernel log says "Memory cgroup out of memory"." Partly right, and the counts are a check. Right on the counts (10 and 27), the kill and the log line. The end-code part could not be checked as written: I recorded the wrapper program's code, 143, not Python's.
How I Would Size a Box
Here is how I would decide how many models one computer can hold, with this lab's numbers. This is worked out, not tested.
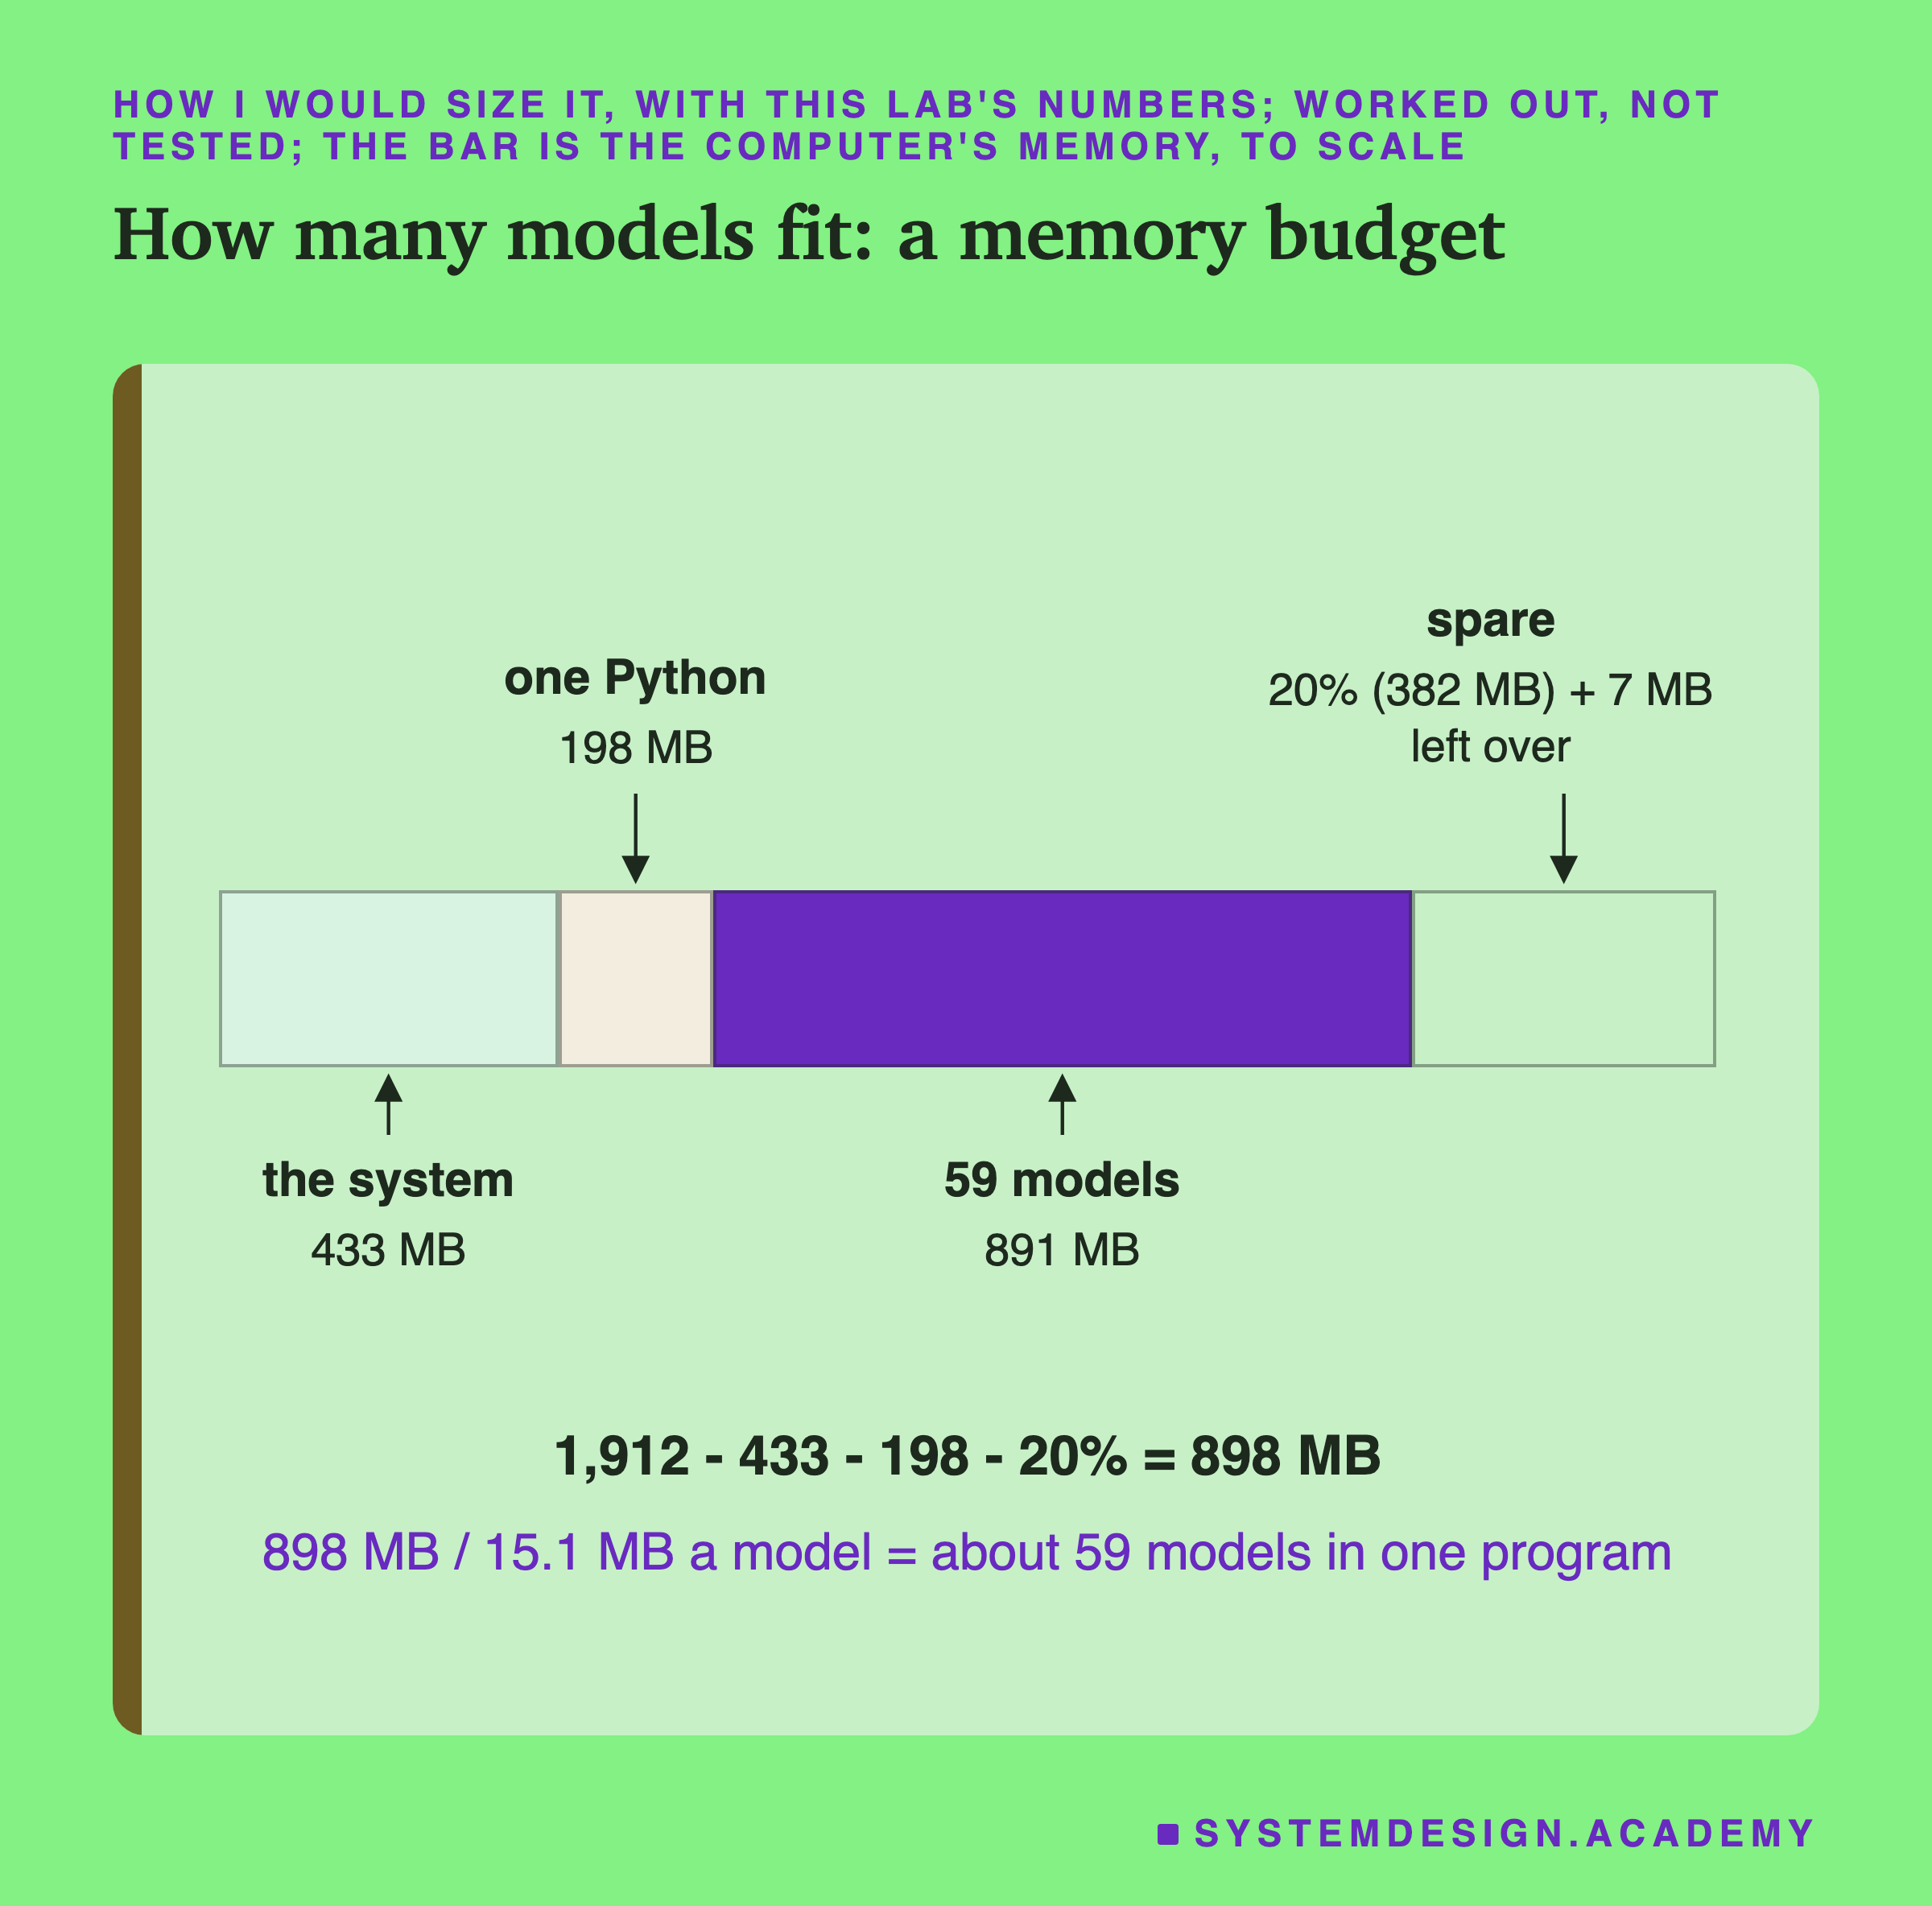
Take the memory and subtract what the system uses. Subtract Python and its libraries for the first program, and about 125 MB for each extra copy. Keep a fifth spare for loads, scoring and the page cache. Divide what is left by one model's measured size. On this computer that gives about 59 fleet models in one program. The spare matters: under a cap, the program died while loading the next copy, not after.
Then I would decide what happens when they do not all fit, before it happens:
-
Measure one model in a fresh program, with your libraries already loaded. Do not trust the file size for other kinds of model.
-
Set a memory cap, so a mistake stops one service and not the whole computer. Leave room for one more load and for the page cache.
-
With several workers, load once and fork, and use the
gc.freezerecipe. Here it kept 4 workers at about a third of the memory, and it stopped a full clean-up from copying 45 MB per worker. -
If they do not all fit, use an LRU cache and count hits and misses. Size the room from the popular models, not from all of them.
-
Keep model loads off the request's path, the steps a request walks through before it gets its answer. Load in a helper, or load the popular ones at start. A miss costs the user who asked, and here it also cost everyone who arrived during the load.
Try It Yourself
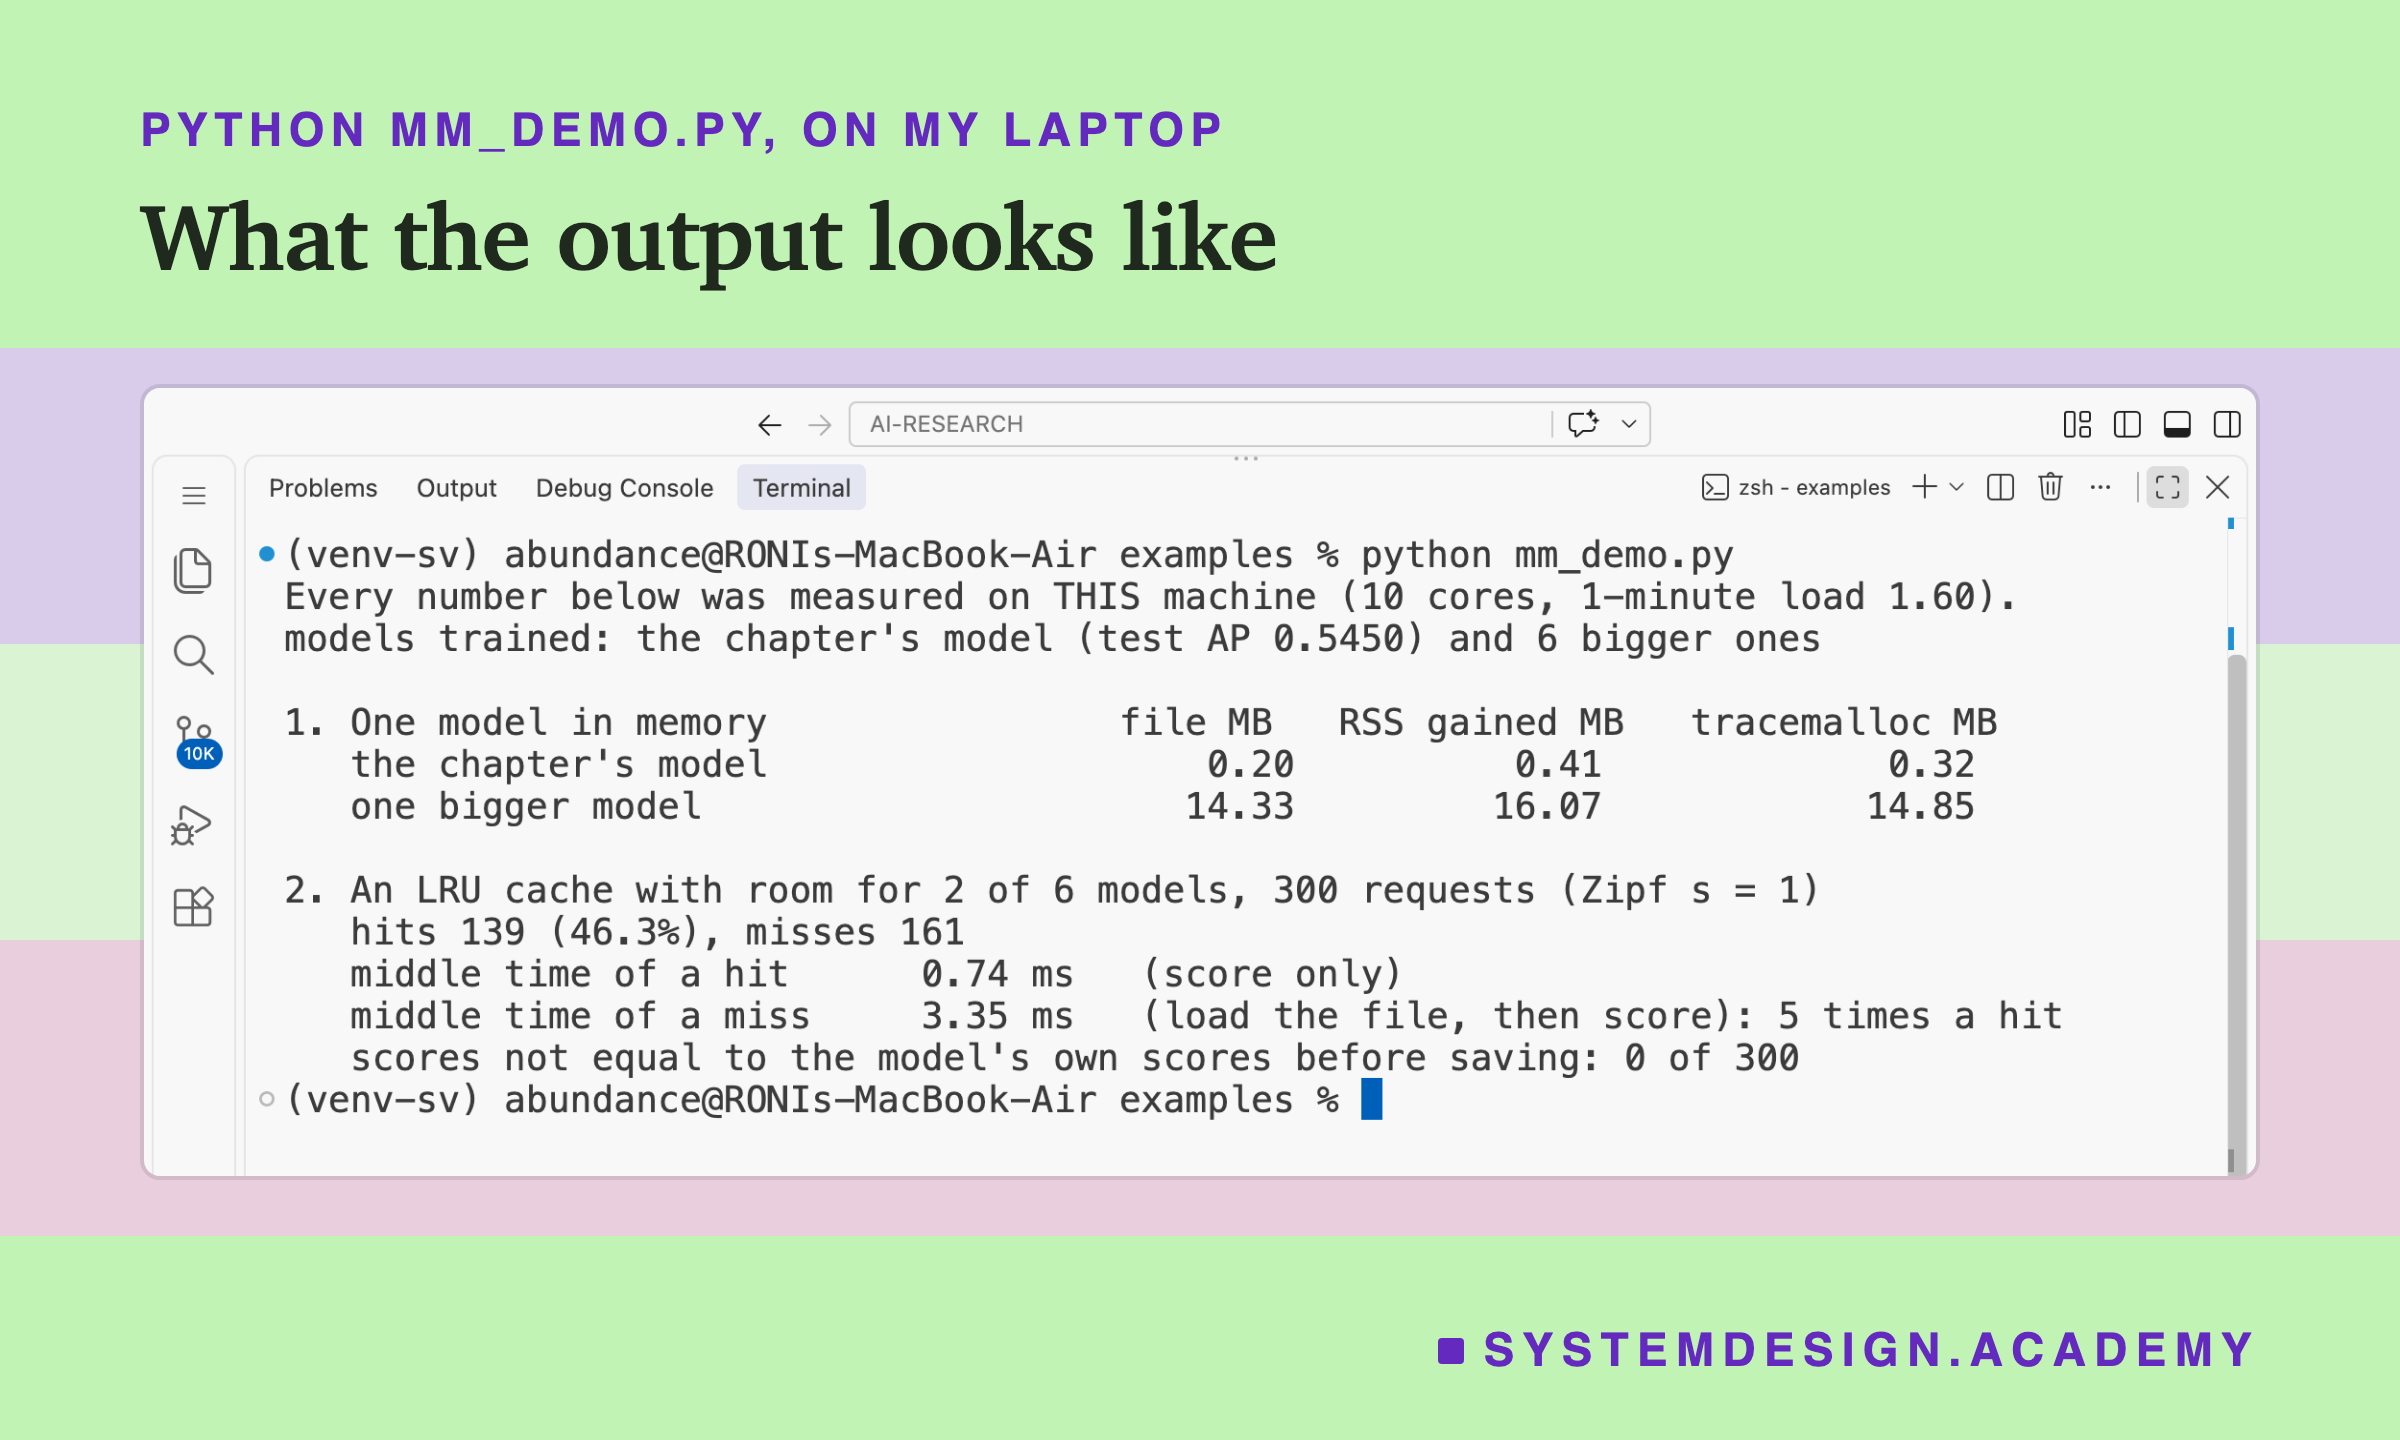
The full lab needs a rented computer for about two hours. The demo, mm_demo.py, runs on your own computer. It measures two models' size in memory and runs a small LRU cache.
I wrote the demo's design into its docstring after the lab's design and before the demo first ran.
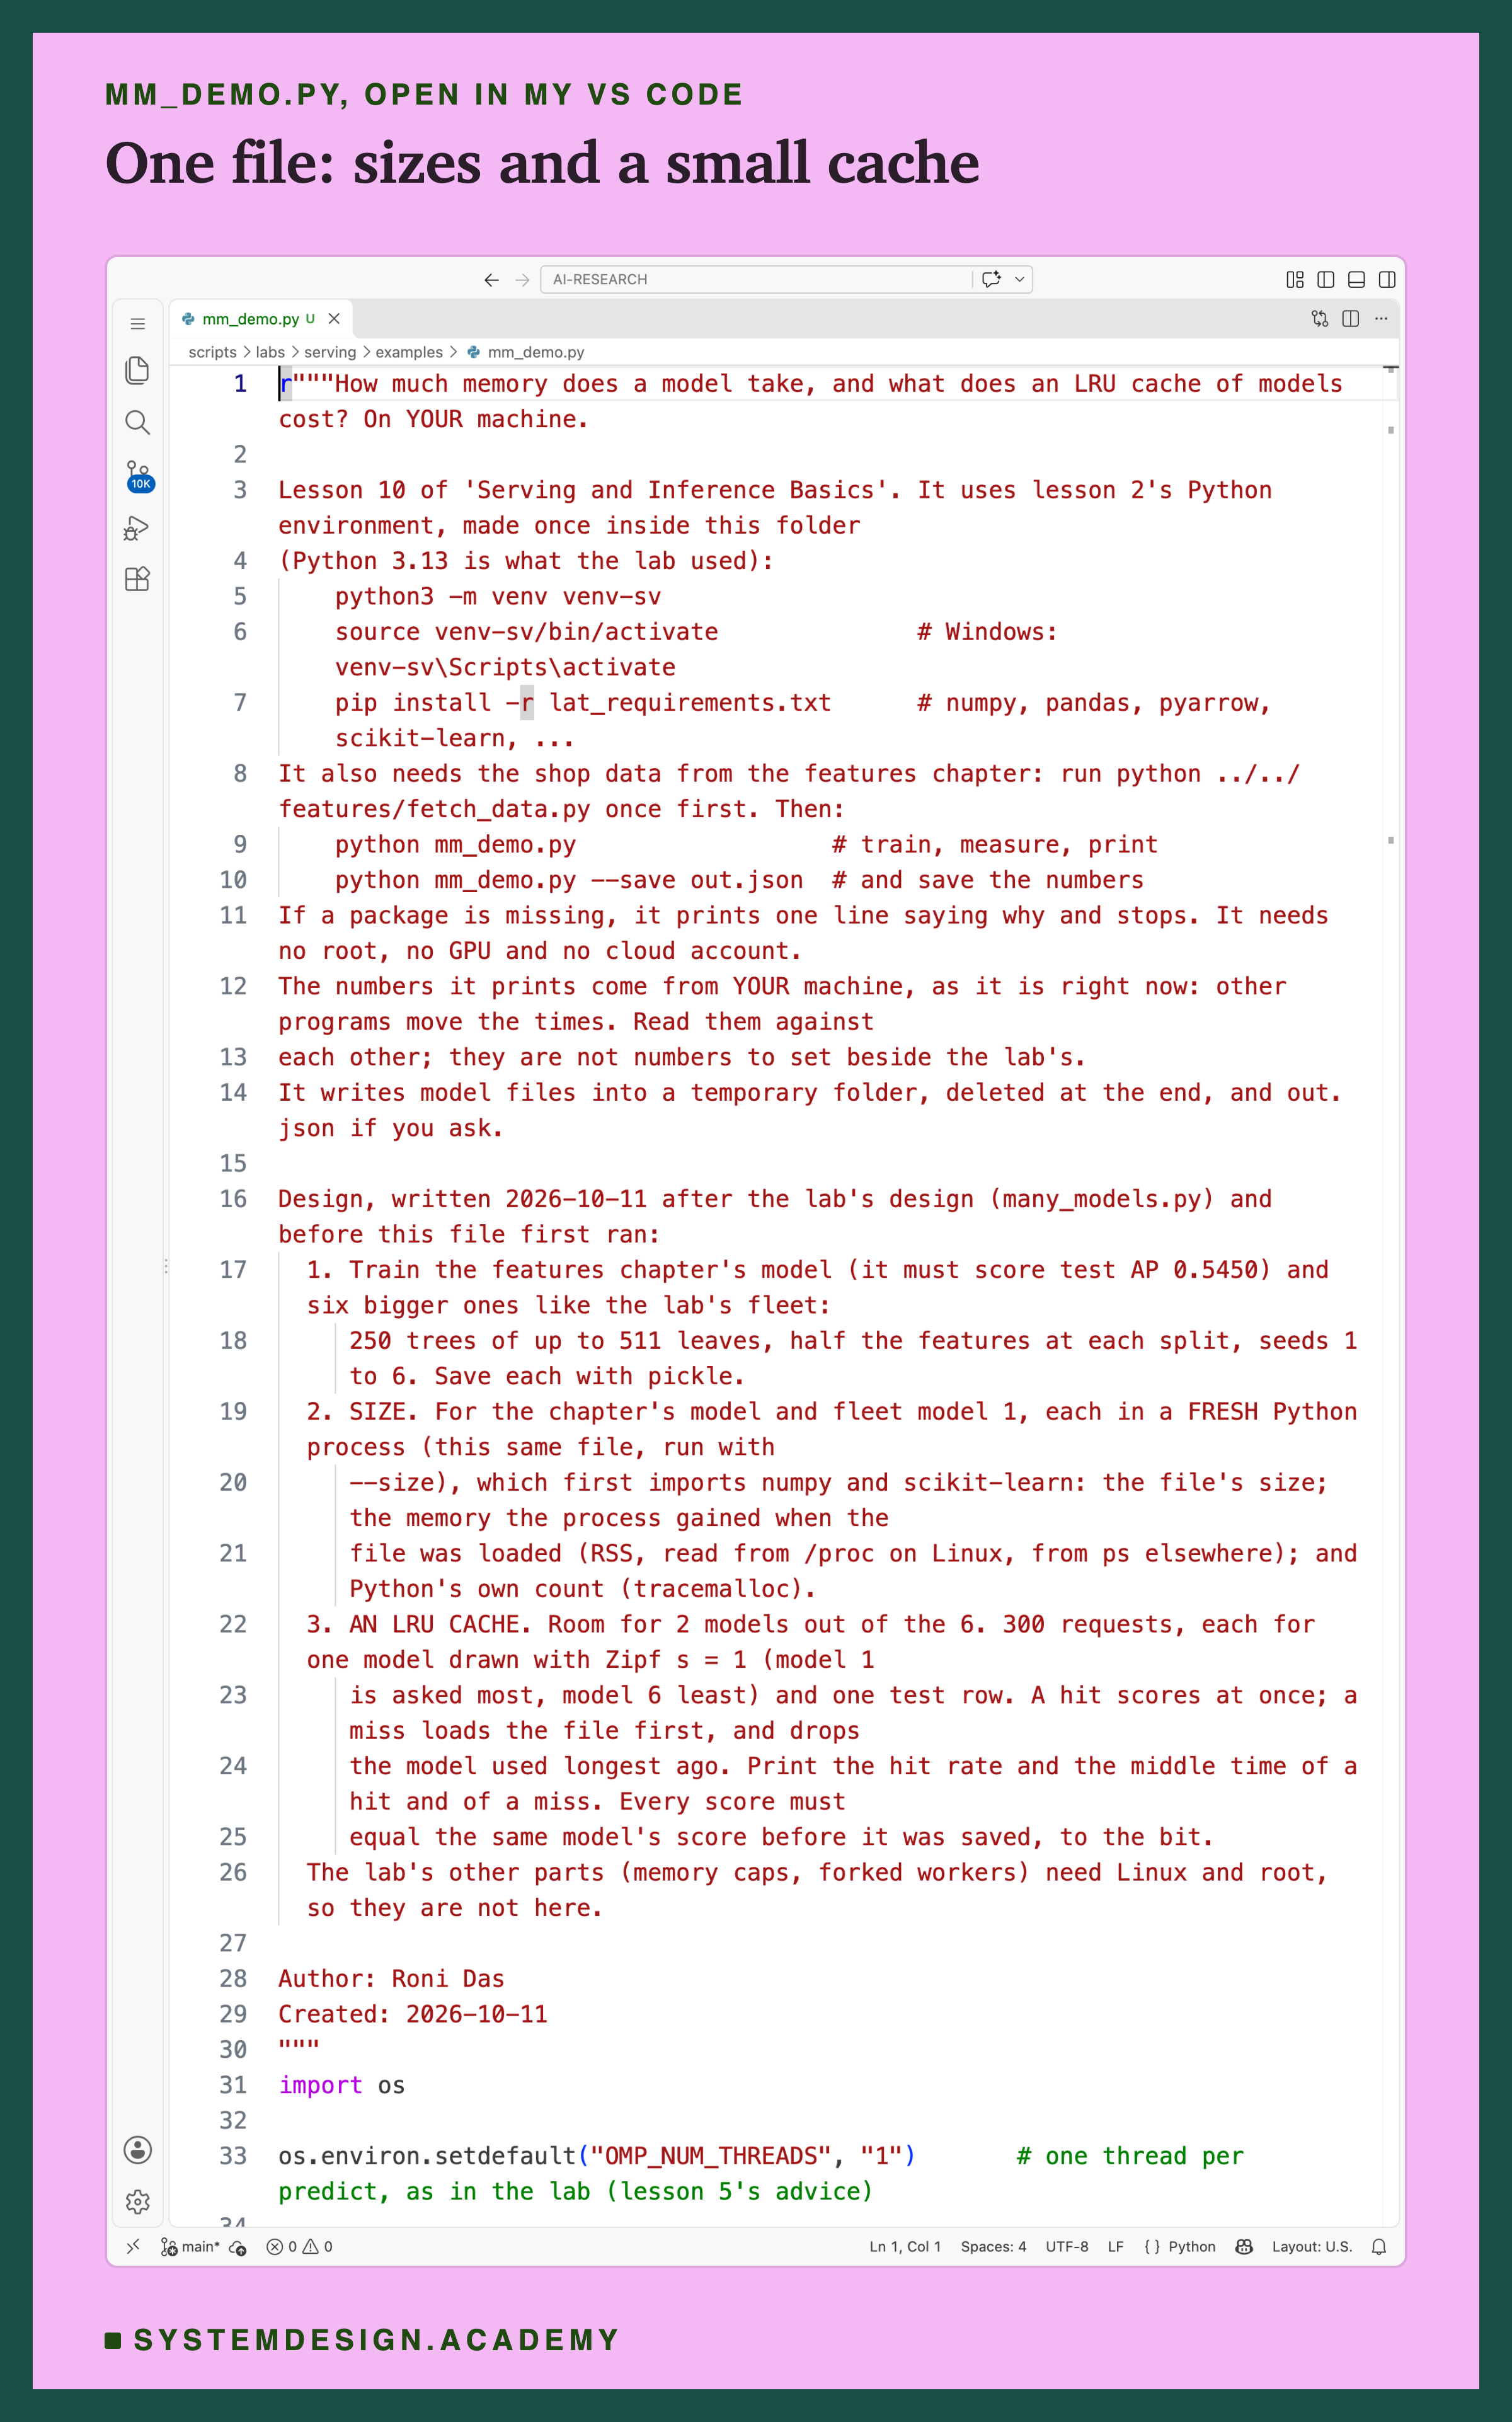
Before you run this lab. The demo uses lesson 2's Python environment, with the same library versions as the lab's computer. If you made it for lessons 2 to 9, use it again. If not, make it once, inside the scripts/labs/serving/examples folder:
python3 -m venv venv-sv
source venv-sv/bin/activate        # on Windows: venv-sv\Scripts\activate
pip install -r lat_requirements.txt
I used Python 3.13. Then run python ../../features/fetch_data.py once, which downloads the shop data. Now run python mm_demo.py. It needs no graphics card, no cloud account and no administrator rights. If a package is missing, it prints one line saying why and stops.
The first line it prints says the numbers come from your computer, with its number of cores and how busy it was at that moment. Read the numbers against each other, on your computer. The memory caps and the forked workers need Linux and administrator rights, so they are not in the demo.
r"""How much memory does a model take, and what does an LRU cache of models cost? On YOUR machine.

Lesson 10 of 'Serving and Inference Basics'. It uses lesson 2's Python environment, made once inside this folder
(Python 3.13 is what the lab used):
    python3 -m venv venv-sv
    source venv-sv/bin/activate              # Windows: venv-sv\Scripts\activate
    pip install -r lat_requirements.txt      # numpy, pandas, pyarrow, scikit-learn, ...
It also needs the shop data from the features chapter: run python ../../features/fetch_data.py once first. Then:
    python mm_demo.py                  # train, measure, print
    python mm_demo.py --save out.json  # and save the numbers
If a package is missing, it prints one line saying why and stops. It needs no root, no GPU and no cloud account.
The numbers it prints come from YOUR machine, as it is right now: other programs move the times. Read them against
each other; they are not numbers to set beside the lab's.
It writes model files into a temporary folder, deleted at the end, and out.json if you ask.

Design, written 2026-10-11 after the lab's design (many_models.py) and before this file first ran:
  1. Train the features chapter's model (it must score test AP 0.5450) and six bigger ones like the lab's fleet:
     250 trees of up to 511 leaves, half the features at each split, seeds 1 to 6. Save each with pickle.
  2. SIZE. For the chapter's model and fleet model 1, each in a FRESH Python process (this same file, run with
     --size), which first imports numpy and scikit-learn: the file's size; the memory the process gained when the
     file was loaded (RSS, read from /proc on Linux, from ps elsewhere); and Python's own count (tracemalloc).
  3. AN LRU CACHE. Room for 2 models out of the 6. 300 requests, each for one model drawn with Zipf s = 1 (model 1
     is asked most, model 6 least) and one test row. A hit scores at once; a miss loads the file first, and drops
     the model used longest ago. Print the hit rate and the middle time of a hit and of a miss. Every score must
     equal the same model's score before it was saved, to the bit.
  The lab's other parts (memory caps, forked workers) need Linux and root, so they are not here.

Author: Roni Das
Created: 2026-10-11
"""
import os

os.environ.setdefault("OMP_NUM_THREADS", "1")       # one thread per predict, as in the lab (lesson 5's advice)

import importlib.util  # noqa: E402
import json
import pickle  # noqa: E402
import subprocess  # noqa: E402
import sys  # noqa: E402
import tempfile  # noqa: E402
import tracemalloc  # noqa: E402
from collections import OrderedDict  # noqa: E402
from pathlib import Path  # noqa: E402
from time import perf_counter_ns  # noqa: E402

NEEDED = ("numpy", "pandas", "pyarrow", "sklearn")
missing = [m for m in NEEDED if importlib.util.find_spec(m) is None]
if missing:
    sys.exit(f"mm_demo.py needs {', '.join(missing)}: make the environment in its docstring "
             f"(pip install -r lat_requirements.txt), then run it with that environment's python.")

import numpy as np  # noqa: E402

FLEET = 6
ROOM = 2
REQUESTS = 300


def rss_mb() -> float:
    """This process's resident memory (RSS), in MB."""
    try:
        with open("/proc/self/statm") as f:
            return int(f.read().split()[1]) * os.sysconf("SC_PAGE_SIZE") / 1e6
    except OSError:
        out = subprocess.run(["ps", "-o", "rss=", "-p", str(os.getpid())], capture_output=True, text=True).stdout
        return int(out.strip()) * 1024 / 1e6


def build():
    """The features chapter's data and model (lesson 7's load_demo.py build step), and six bigger models."""
    from sklearn.metrics import average_precision_score
    here = Path(__file__).resolve().parent
    sys.path.insert(0, str(here.parents[1] / "features"))
    import task
    from what_a_feature_is import HAND_COLS, hgb, joined

    ev = task.load_events()
    lab_tr, _, lab_te = task.splits(ev)
    tr = joined(ev, lab_tr, task.TRAIN_CUTOFFS)
    te = joined(ev, lab_te, task.TEST_CUTOFFS)
    X, y = tr[HAND_COLS].to_numpy(float), tr["label"].to_numpy()
    Xt = np.ascontiguousarray(te[HAND_COLS].to_numpy(np.float64))
    yt, ct = te["label"].to_numpy(), te["cutoff"].to_numpy()
    chapter = hgb(0).fit(X, y)
    p = chapter.predict_proba(Xt)[:, 1]
    ap = float(np.mean([average_precision_score(yt[ct == c], p[ct == c]) for c in np.unique(ct)]))
    assert round(ap, 4) == 0.5450, ap
    fleet = [hgb(s, max_iter=250, max_leaf_nodes=511, early_stopping=False, max_features=0.5).fit(X, y)
             for s in range(1, FLEET + 1)]
    return chapter, fleet, Xt, ap


def size_of(path: Path) -> dict:
    """In a fresh process: load the file once and see how much memory the process gained; again under tracemalloc."""
    out = subprocess.run([sys.executable, __file__, "--size", str(path)], capture_output=True, text=True, check=True)
    return json.loads(out.stdout.strip().splitlines()[-1])


def size_here(path: Path) -> None:
    from sklearn.ensemble import HistGradientBoostingClassifier  # noqa: F401  (imported, as a service would)
    before = rss_mb()
    with open(path, "rb") as f:
        m1 = pickle.load(f)
    gained = rss_mb() - before
    tracemalloc.start()
    with open(path, "rb") as f:
        m2 = pickle.load(f)
    traced = tracemalloc.get_traced_memory()[0] / 1e6
    tracemalloc.stop()
    del m1, m2
    print(json.dumps({"file_mb": path.stat().st_size / 1e6, "rss_before_mb": before, "rss_gained_mb": gained,
                      "traced_mb": traced}))


def main() -> None:
    try:
        load = f"{os.getloadavg()[0]:.2f}"
    except (AttributeError, OSError):
        load = "not available on this system"
    print(f"Every number below was measured on THIS machine ({os.cpu_count()} cores, 1-minute load {load}).")
    chapter, fleet, Xt, ap = build()
    print(f"models trained: the chapter's model (test AP {ap:.4f}) and {FLEET} bigger ones")
    rows = np.random.default_rng(0).integers(len(Xt), size=REQUESTS)
    ref = [m.predict_proba(Xt[rows])[:, 1] for m in fleet]
    out: dict = {"load": load, "cores": os.cpu_count(), "test_ap": ap}
    with tempfile.TemporaryDirectory() as tmp:
        files = []
        for i, m in enumerate([chapter, *fleet]):
            path = Path(tmp) / f"m{i}.pkl"
            path.write_bytes(pickle.dumps(m, protocol=5))
            files.append(path)
        del chapter, fleet

        print("\n1. One model in memory                file MB   RSS gained MB   tracemalloc MB")
        out["size"] = {}
        for name, path in (("the chapter's model", files[0]), ("one bigger model", files[1])):
            s = size_of(path)
            out["size"][name] = s
            print(f"   {name:<34}{s['file_mb']:9.2f} {s['rss_gained_mb']:13.2f} {s['traced_mb']:16.2f}")

        w = 1.0 / np.arange(1, FLEET + 1)
        asks = np.random.default_rng(1).choice(FLEET, size=REQUESTS, p=w / w.sum())
        cache: OrderedDict = OrderedDict()
        hit_ns, miss_ns, neq = [], [], 0
        for j, k in enumerate(asks):
            t0 = perf_counter_ns()
            m = cache.get(k)
            hit = m is not None
            if hit:
                cache.move_to_end(k)
            else:
                with open(files[1 + k], "rb") as f:
                    m = pickle.load(f)
                cache[k] = m
                if len(cache) > ROOM:
                    cache.popitem(last=False)
            s = float(m.predict_proba(Xt[rows[j]:rows[j] + 1])[0, 1])
            (hit_ns if hit else miss_ns).append(perf_counter_ns() - t0)
            neq += s != float(ref[k][j])
        hits = len(hit_ns) / REQUESTS
        mh, mm = float(np.median(hit_ns)) / 1e6, float(np.median(miss_ns)) / 1e6
        print(f"\n2. An LRU cache with room for {ROOM} of {FLEET} models, {REQUESTS} requests (Zipf s = 1)")
        print(f"   hits {len(hit_ns)} ({hits:.1%}), misses {len(miss_ns)}")
        print(f"   middle time of a hit  {mh:8.2f} ms   (score only)")
        print(f"   middle time of a miss {mm:8.2f} ms   (load the file, then score): {mm / mh:.0f} times a hit")
        print(f"   scores not equal to the model's own scores before saving: {neq} of {REQUESTS}")
        out["lru"] = {"room": ROOM, "models": FLEET, "requests": REQUESTS, "hits": len(hit_ns),
                      "hit_ms_median": mh, "miss_ms_median": mm, "scores_neq": int(neq)}
    if "--save" in sys.argv:
        Path(sys.argv[sys.argv.index("--save") + 1]).write_text(json.dumps(out, indent=1))


if __name__ == "__main__":
    if sys.argv[1:2] == ["--size"]:
        size_here(Path(sys.argv[2]))
    else:
        main()
Simulate a Cache of Models
This box runs in your browser and needs nothing but Python. It is a simulation: a make-believe service with a pretend clock, pretend requests and pretend loads. It has no model and no network, so it shows the idea, not the rented computer's numbers. The real numbers are printed under it.
Press Run. Then try ROOM = 2 and ROOM = 8, and watch the hit share and the slowest hits. Try LOAD_MS = 5, about a warm load in the service, and then the cold LOAD_MS = 62. Then set LOAD_IN_THREAD = True and watch the slowest hits drop, as they did on the rented computer.
One seed is luck: try SEED = 1 to 5. The simulation uses three separate dice: one for when requests come, one for which model each asks for, and one for how long each load takes. So changing ROOM does not change which requests come when.
The report script writes the rented computer's real numbers into this box from the lab's results. Over seeds 1 to 5, the simulation's hit share with room for 2 was 25.6% to 26.9%, and with room for 8, 70.1% to 73.2%. The rented computer's were 26.8% and 73.1%. The simulation's helper thread is simpler than the real one: its hits never wait at all, and its misses do not overlap.
The Lab's Code, Piece by Piece
The lab has one file that runs on my laptop, small files that run on the rented computer, and the step script you saw above.
many_models.py, on my laptop, holds the design and my guesses in its docstring, written before any run. Its commands are check, status (reads the computer's console), collect, cost and factcheck. collect calls mm_stats.py, which copies the computer's raw files, the files exactly as the computer wrote them, into results/mm-raw/. It passes every log line through mm_redact.py, which blacks out anything private, and does the arithmetic.
mm_files/mm_build.py trains the 20 models on the computer and saves each with pickle. It also scores all 26,851 test rows with each model in a fresh program. Those are the reference scores: every score in every part must equal them to the last bit. Here are four of the models. AP, average precision, is the chapter's score for how well a model puts the real buyers near the top of its list; higher is better.
When to Use Each One, and When Not To
One program with every model loaded: right when all the models fit with room to spare, as the budget slide works out. Every request is a hit, so it is the fastest. It is wrong when the models together come near the memory cap, because one more model stops the whole program.
Several workers that load once and fork: right when you need more than one worker and the models are big. Here it kept the total at about a third. It has a cost: gunicorn's documentation says that if you instead "defer application loading to each worker process, you can reload your application code easily by restarting workers". With preload, you lose that easy reload.
gc.freeze before the fork: right whenever you preload. It costs a few lines in two hooks, and it stopped a full clean-up from copying 180 MB across 4 workers. It did not reduce the small copying that requests caused; with 4 workers it copied about 2 MB more per answering worker.
An LRU cache of models: right when the models do not all fit and a few get most of the traffic. It is wrong when traffic is spread evenly over many models, because then most requests miss.
Loading inside the request handler: wrong whenever several requests can arrive at once, because every request waits behind a load. Load in a helper, or ahead of time.
What This Lab Cannot Tell You
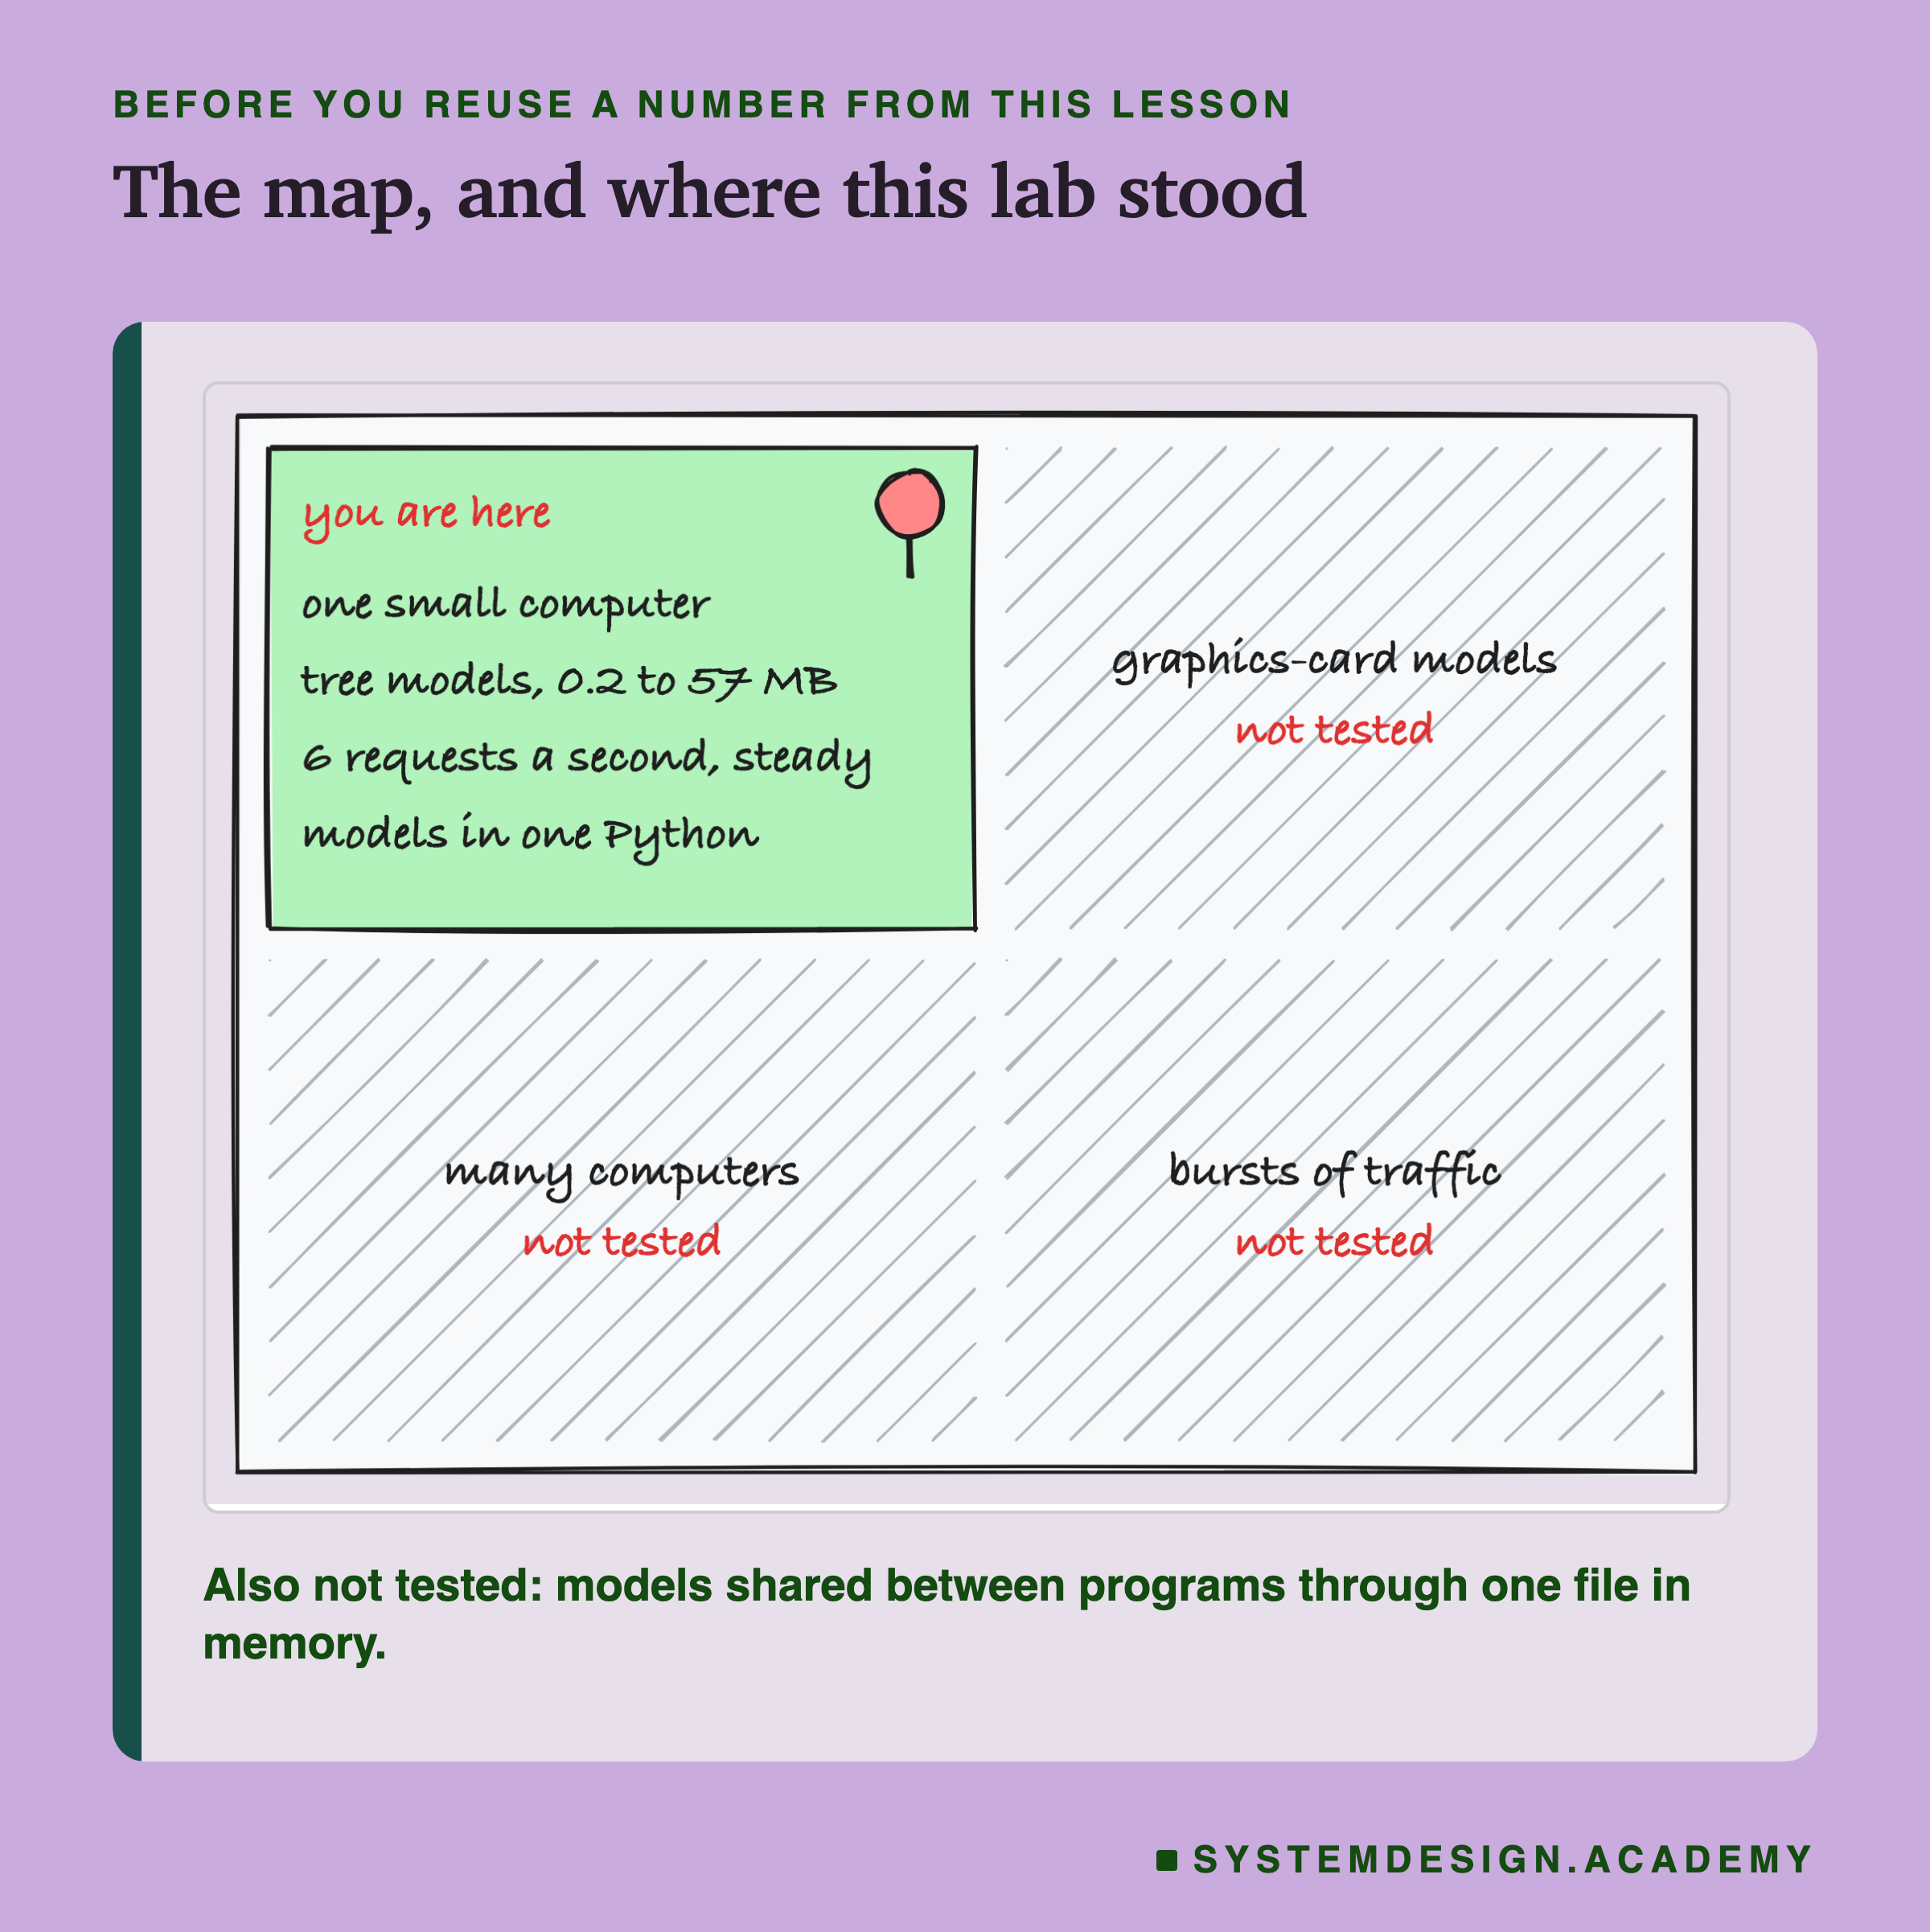
One kind of model. Every model here was a scikit-learn tree model, whose size in memory is close to its file. A large neural network is the kind of model behind chat programs. Loaded onto a graphics card, or unpacked by a library on load, such a model can behave very differently. Measure yours.
One small computer. One core and 1.9 GB. On a bigger computer the same arithmetic holds, but the numbers change.
Steady traffic. Requests came at a steady 6 a second. Real traffic rises and falls, and a burst of misses would cost more.
Things I did not test. Sharing models between programs through memory-mapped files, a way for programs to read one file in memory together without each keeping a copy. Also a cache sized by memory instead of by count, and loading the popular models at start.
Labelled changes during and after the run. The workers part was run twice, as step 7b explains; the second run is the one reported. After the first results, I changed how the figures read memory: the capped chart shows the memory the cap counts, not RSS. I also fixed a leak in my collection step: the first results file still held the computer's private network name in one line of Linux's log. After a review, I added the per-worker count of request copying with and without gc.freeze.
What to Do on Monday
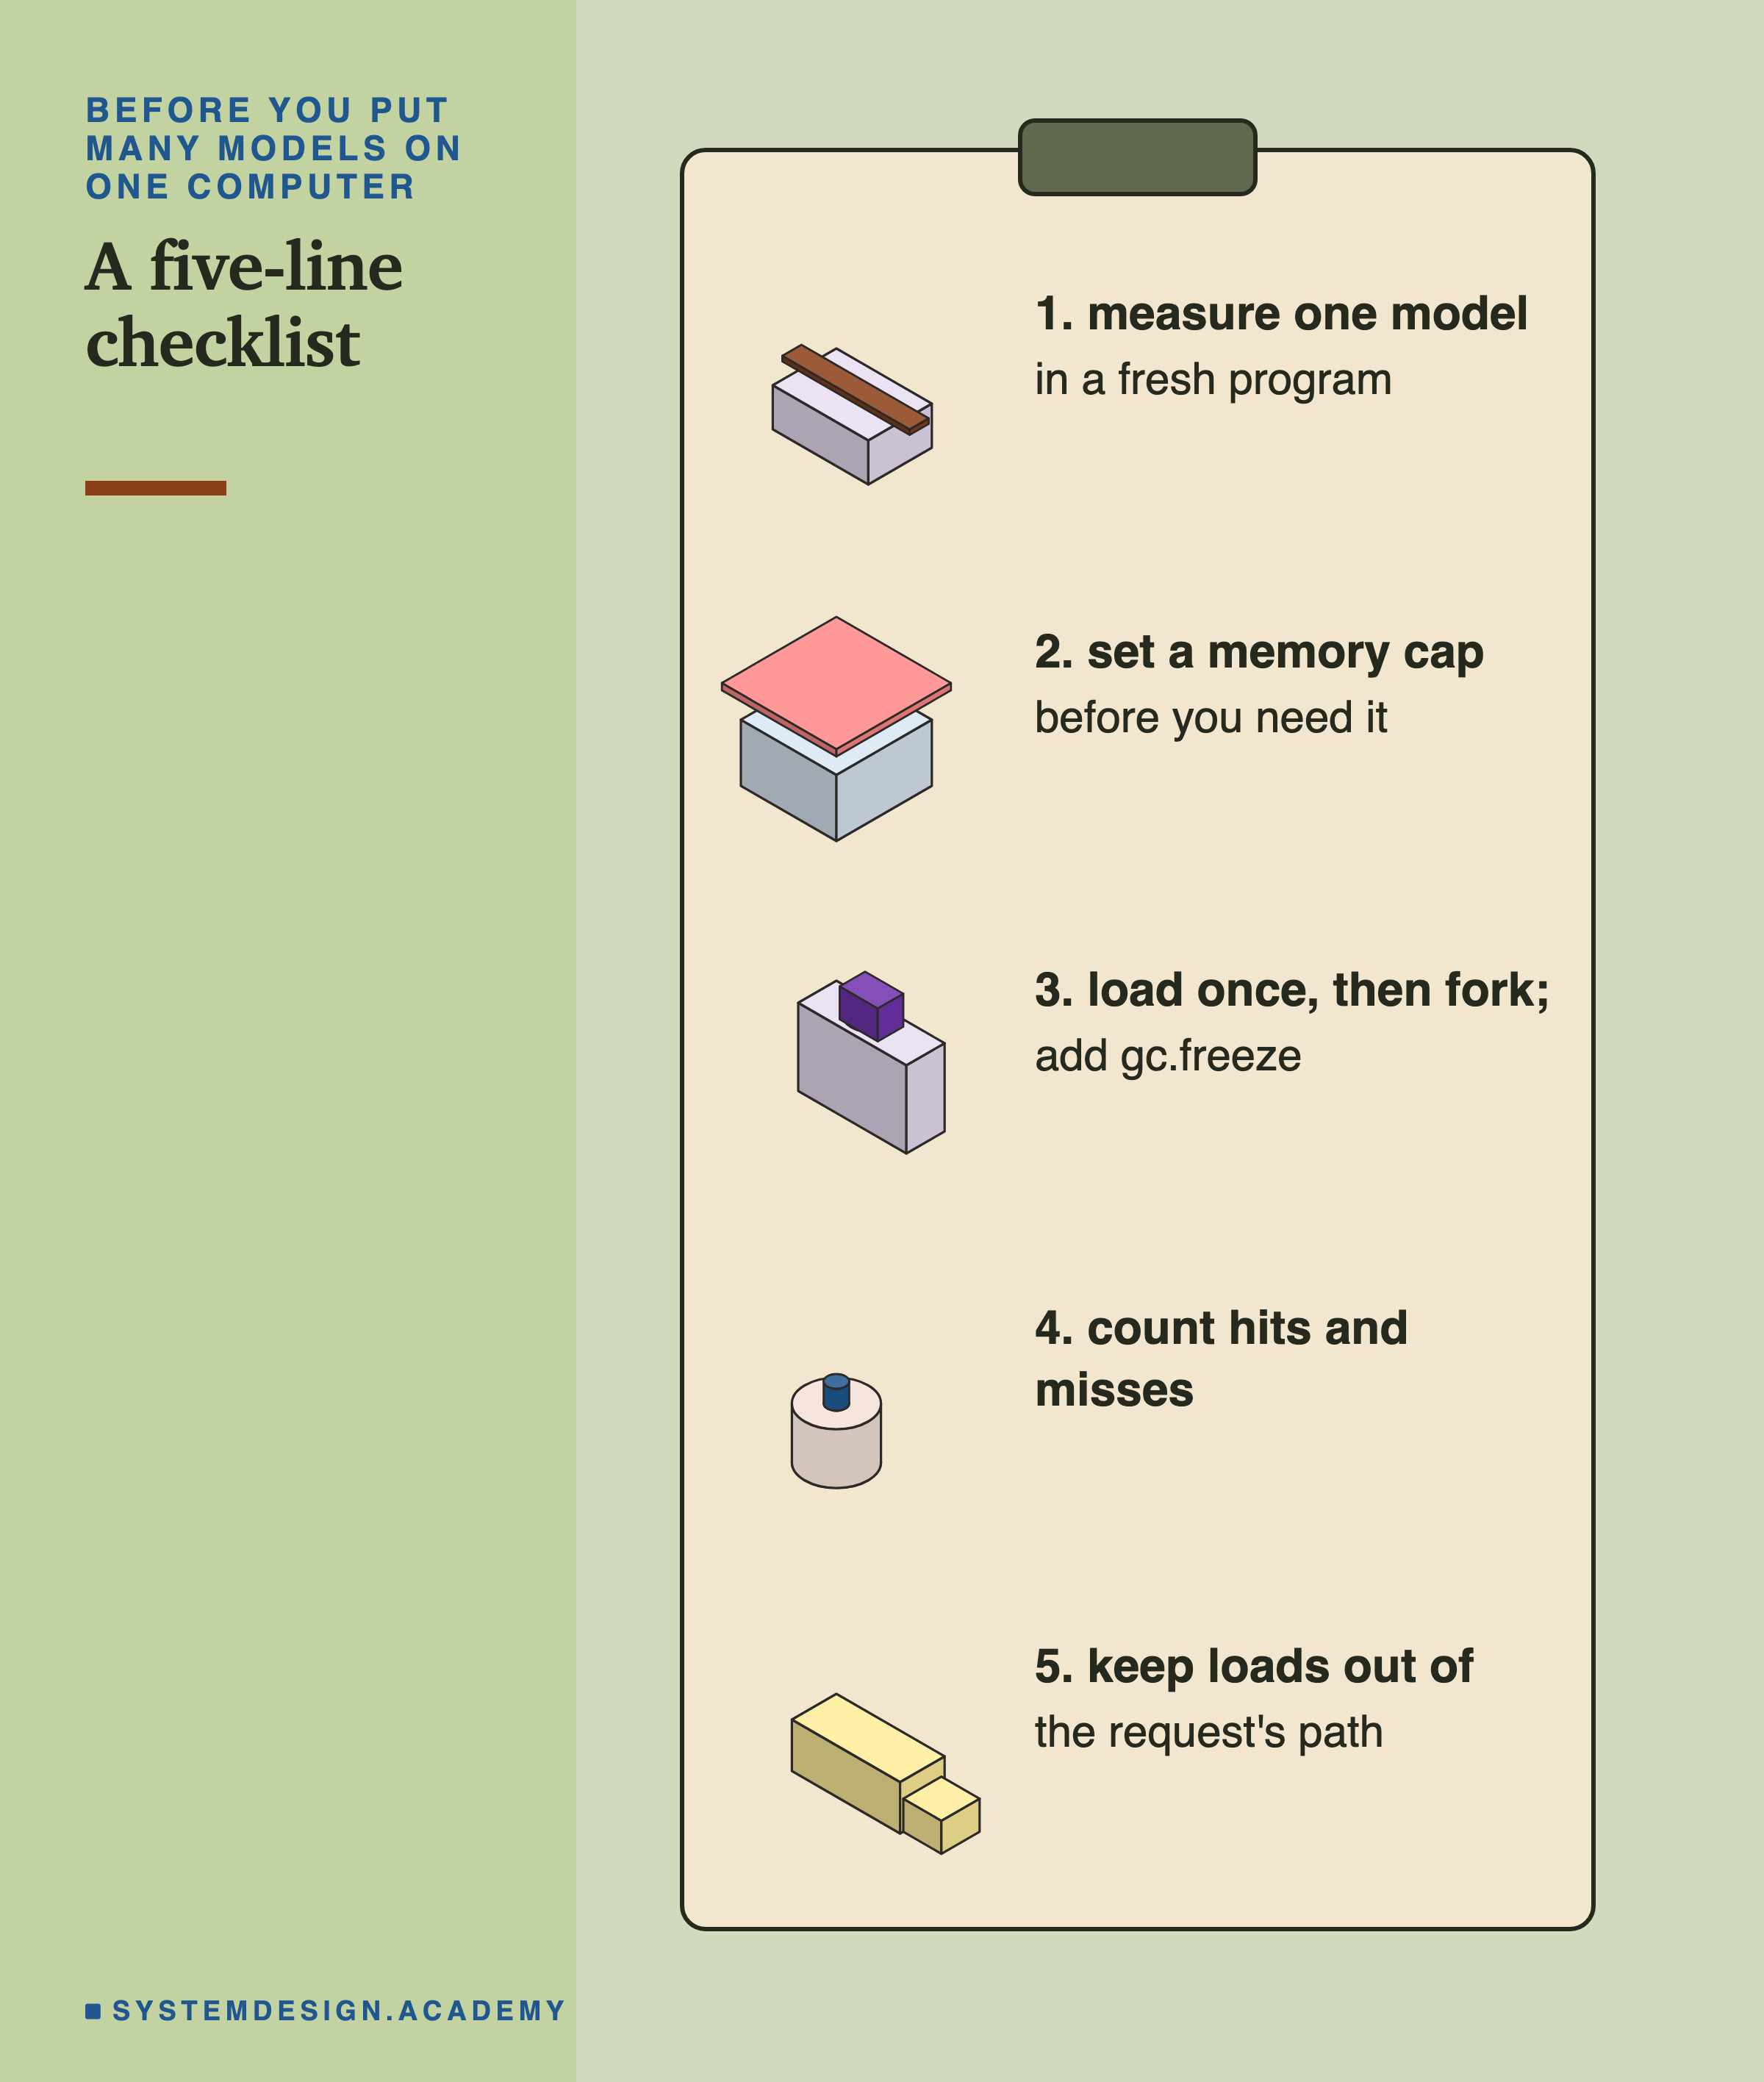
If you take one thing to work on Monday, measure one model in a fresh program, with your libraries loaded. Write down its size in memory and its load time, warm and cold. Every other decision in this lesson starts from those three numbers.
Then look at how your service starts its workers. If each worker loads its own copy, try loading once and forking, with the gc.freeze recipe. Measure the total with PSS, not RSS, because RSS counts shared pages once for every worker.
The one idea to keep: memory is a shelf. Know how big each book is, decide which one leaves when a new one comes, and never let the shelf overflow by surprise.
Knowledge Check
Knowledge Check
4 questions - Score 80% to pass
A program under a 512 MiB (537 MB) memory cap kept loading 15 MB model copies. What happened when the next copy did not fit?
Four copies of a service (gunicorn workers) loaded 8 models before the fork, copied from one program that had already loaded them. What copied the most shared memory into the workers?
With room for 4 of 16 models and a cold disk, why did requests whose model was already in memory sometimes wait over 80 ms?
A scikit-learn tree model's file is 14.3 MB. What did loading it into a fresh Python program cost in memory, on the rented computer?