The Late Order
Let me start in a small cafe.
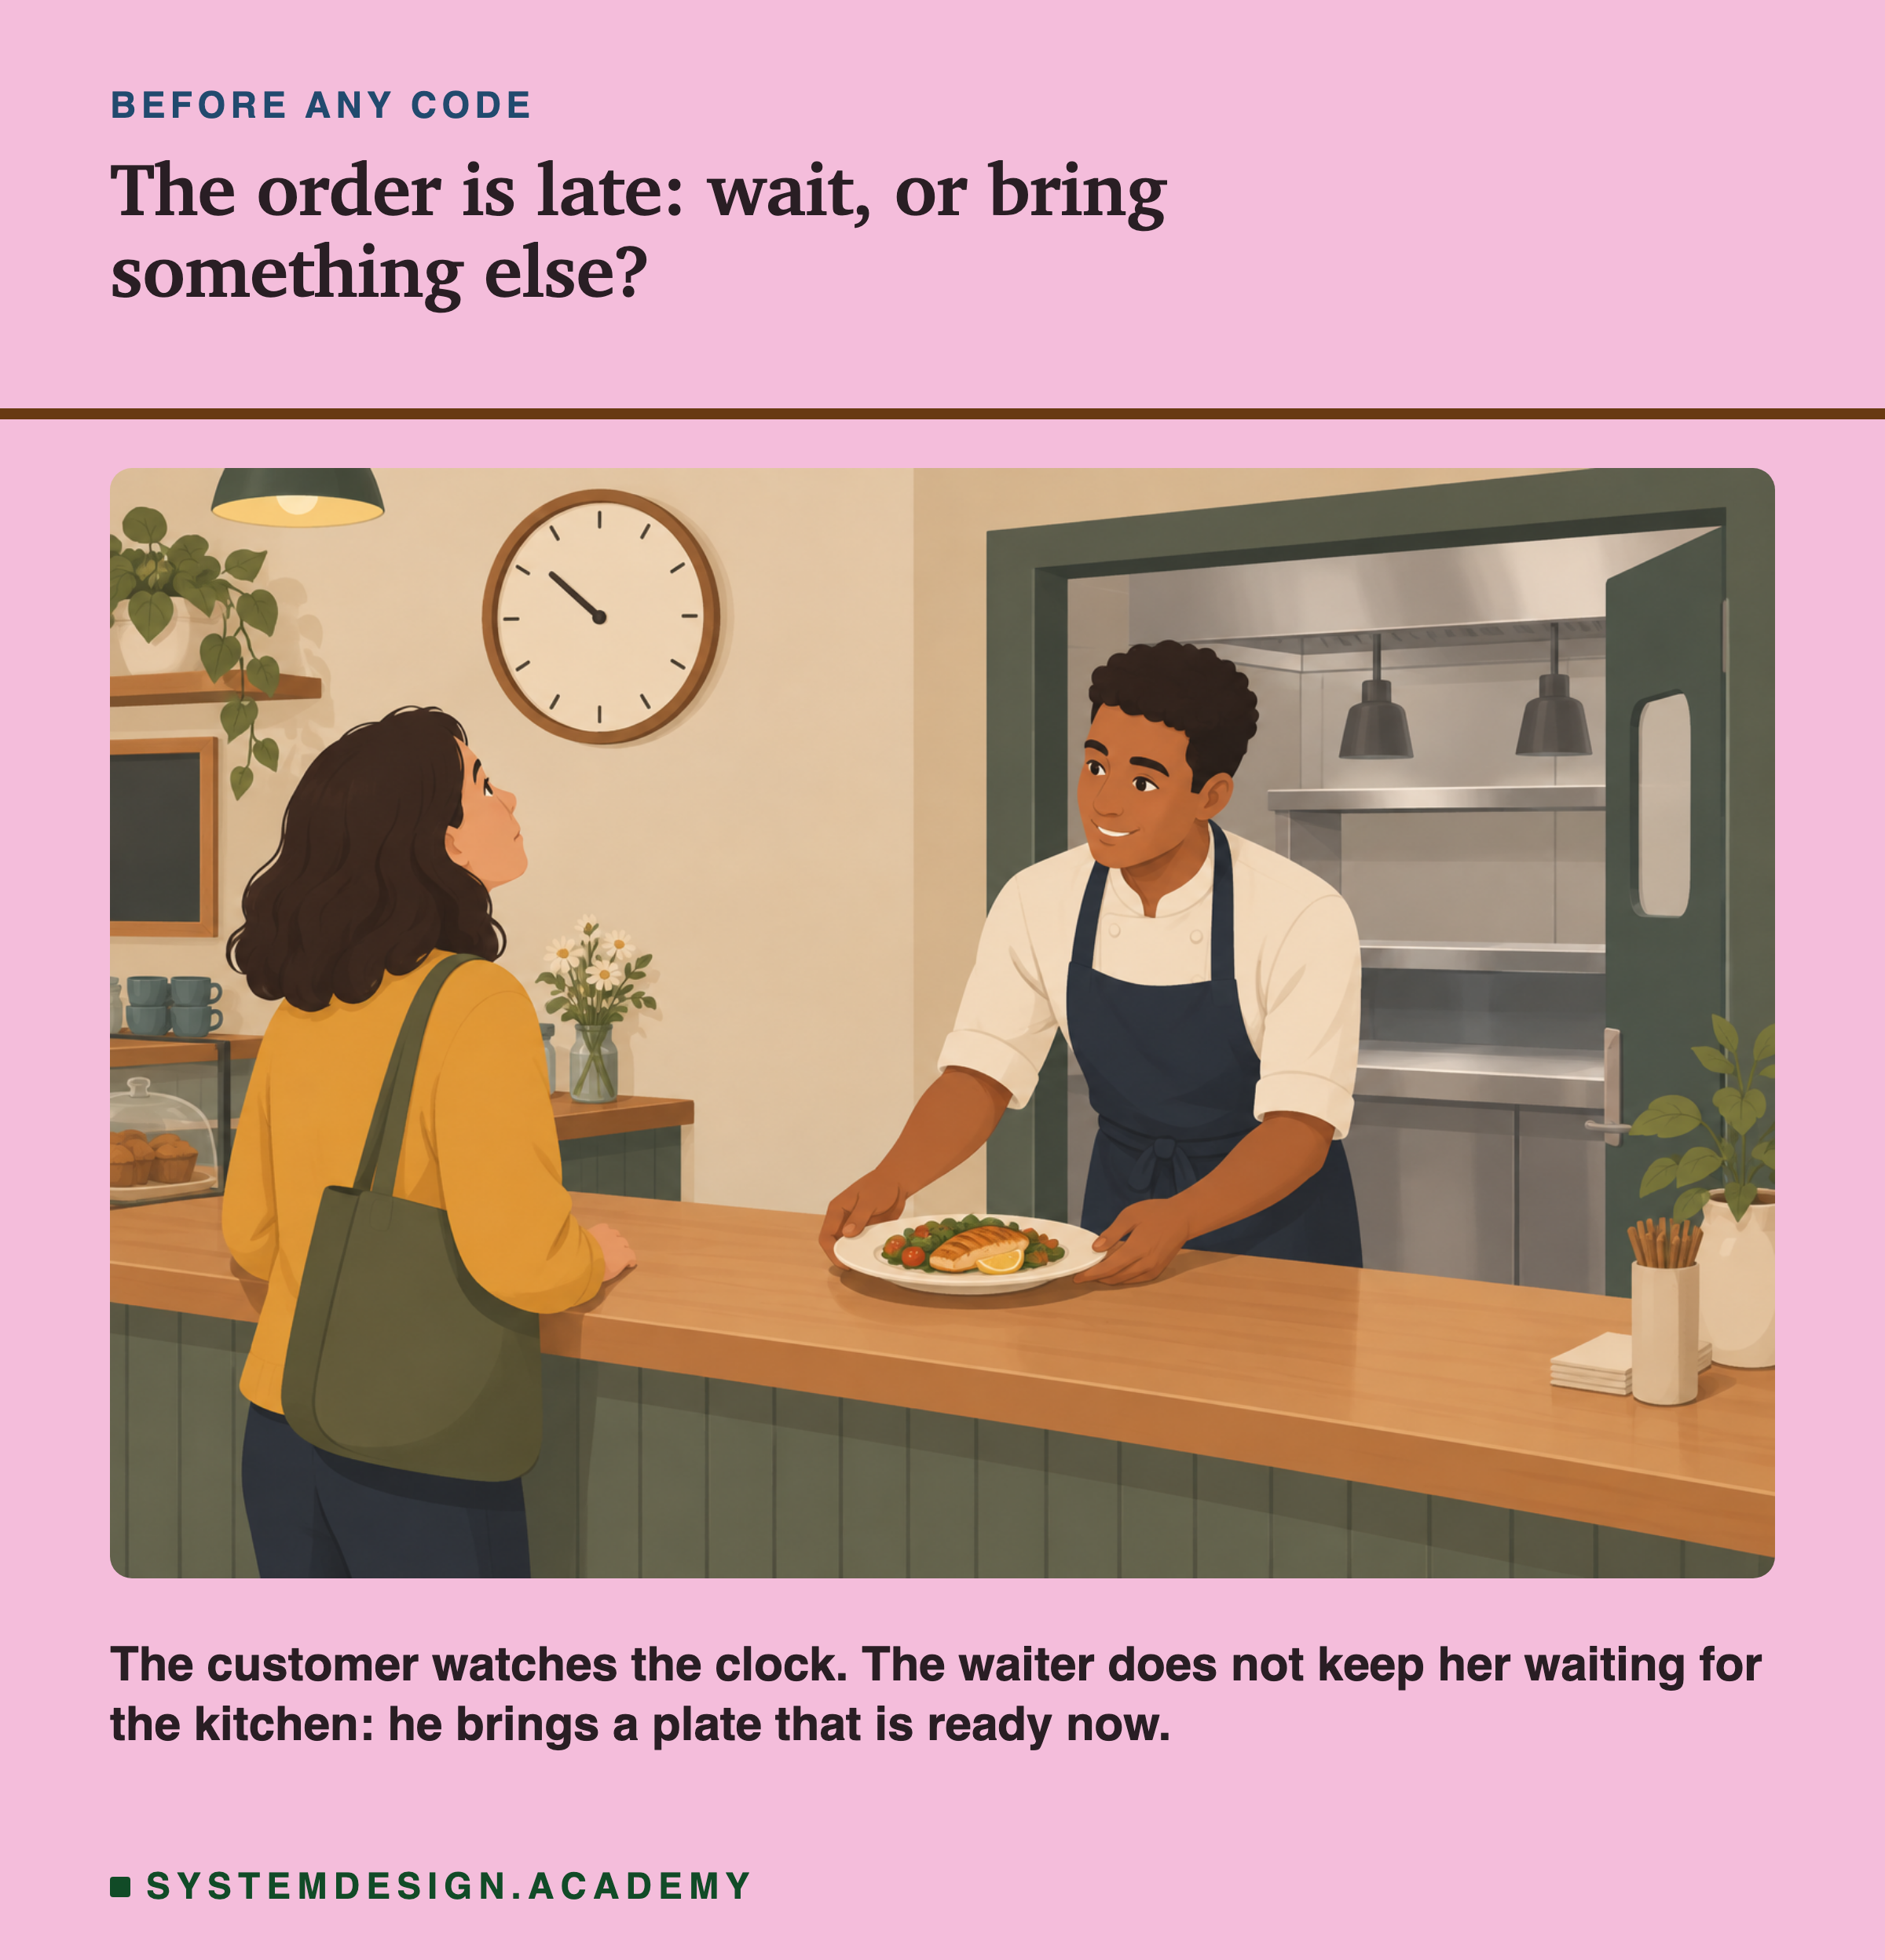
You order a meal at the counter. The waiter takes your order to the kitchen. Most days it comes back in two minutes. Today the kitchen is stuck, and your plate does not come.
What should the waiter do?
He could do nothing and let you stand there. You might wait twenty minutes. The people behind you wait too, because the waiter is busy with you.
He could come back after five minutes and say "sorry, no food today". You leave hungry, but at least you know.
He could come back after five minutes with something that is ready now: a sandwich from the fridge, or the same meal you had last week. It is not exactly what you asked for, but it is food, and it is on time.
He could also run back into the kitchen and shout the order again. If the kitchen is stuck because it is too busy, shouting every order twice makes it busier still.
A prediction service has the same problem. Before it can score a customer, it must fetch that customer's numbers from another system. Most of the time that takes two thousandths of a second. Sometimes it takes two whole seconds. In this lesson I measure what each of the waiter's choices does, on a real rented computer.
Where This Lesson Starts
This is lesson 9 of the chapter on serving a model. It uses the same model and the same small web service as the lessons before it.
The model is the features chapter's model. It looks at six numbers about one customer of a real online shop, such as the days since their last order. It gives a score between 0 and 1: how likely they are to buy again in the next 30 days.
How good is it? I measure that with AP, average precision. Think of a teacher ranking students for a prize: AP is high when the real winners are near the top of the list. On the months I kept aside for checking, this model's AP is 0.5450. Higher is better.
The service is the small web service from lesson 2, latency anatomy. A request comes in. The service looks up the customer's six numbers in a small database. The model scores them, and the answer goes back.
Lesson 7, load testing honestly, built the tester I use here: the program that sends requests and times each answer. Lesson 8 of the features chapter, missing at serving, measured what a model loses when a customer's numbers are missing. I lean on both and do not repeat them.
The machine has one core. A core is one worker inside a computer's chip, and it runs one program step at a time. My AWS account may rent only one core at a time, so, as in lessons 2 to 8, I rent a small computer with just one. The tester, the service and the slow database all share it.
The question: when the database the service depends on is slow, what should the service send back?
The Words You Need First
Please read this slide slowly if any word is new. Every slide after it uses these words, and each one comes with a picture from the cafe first.
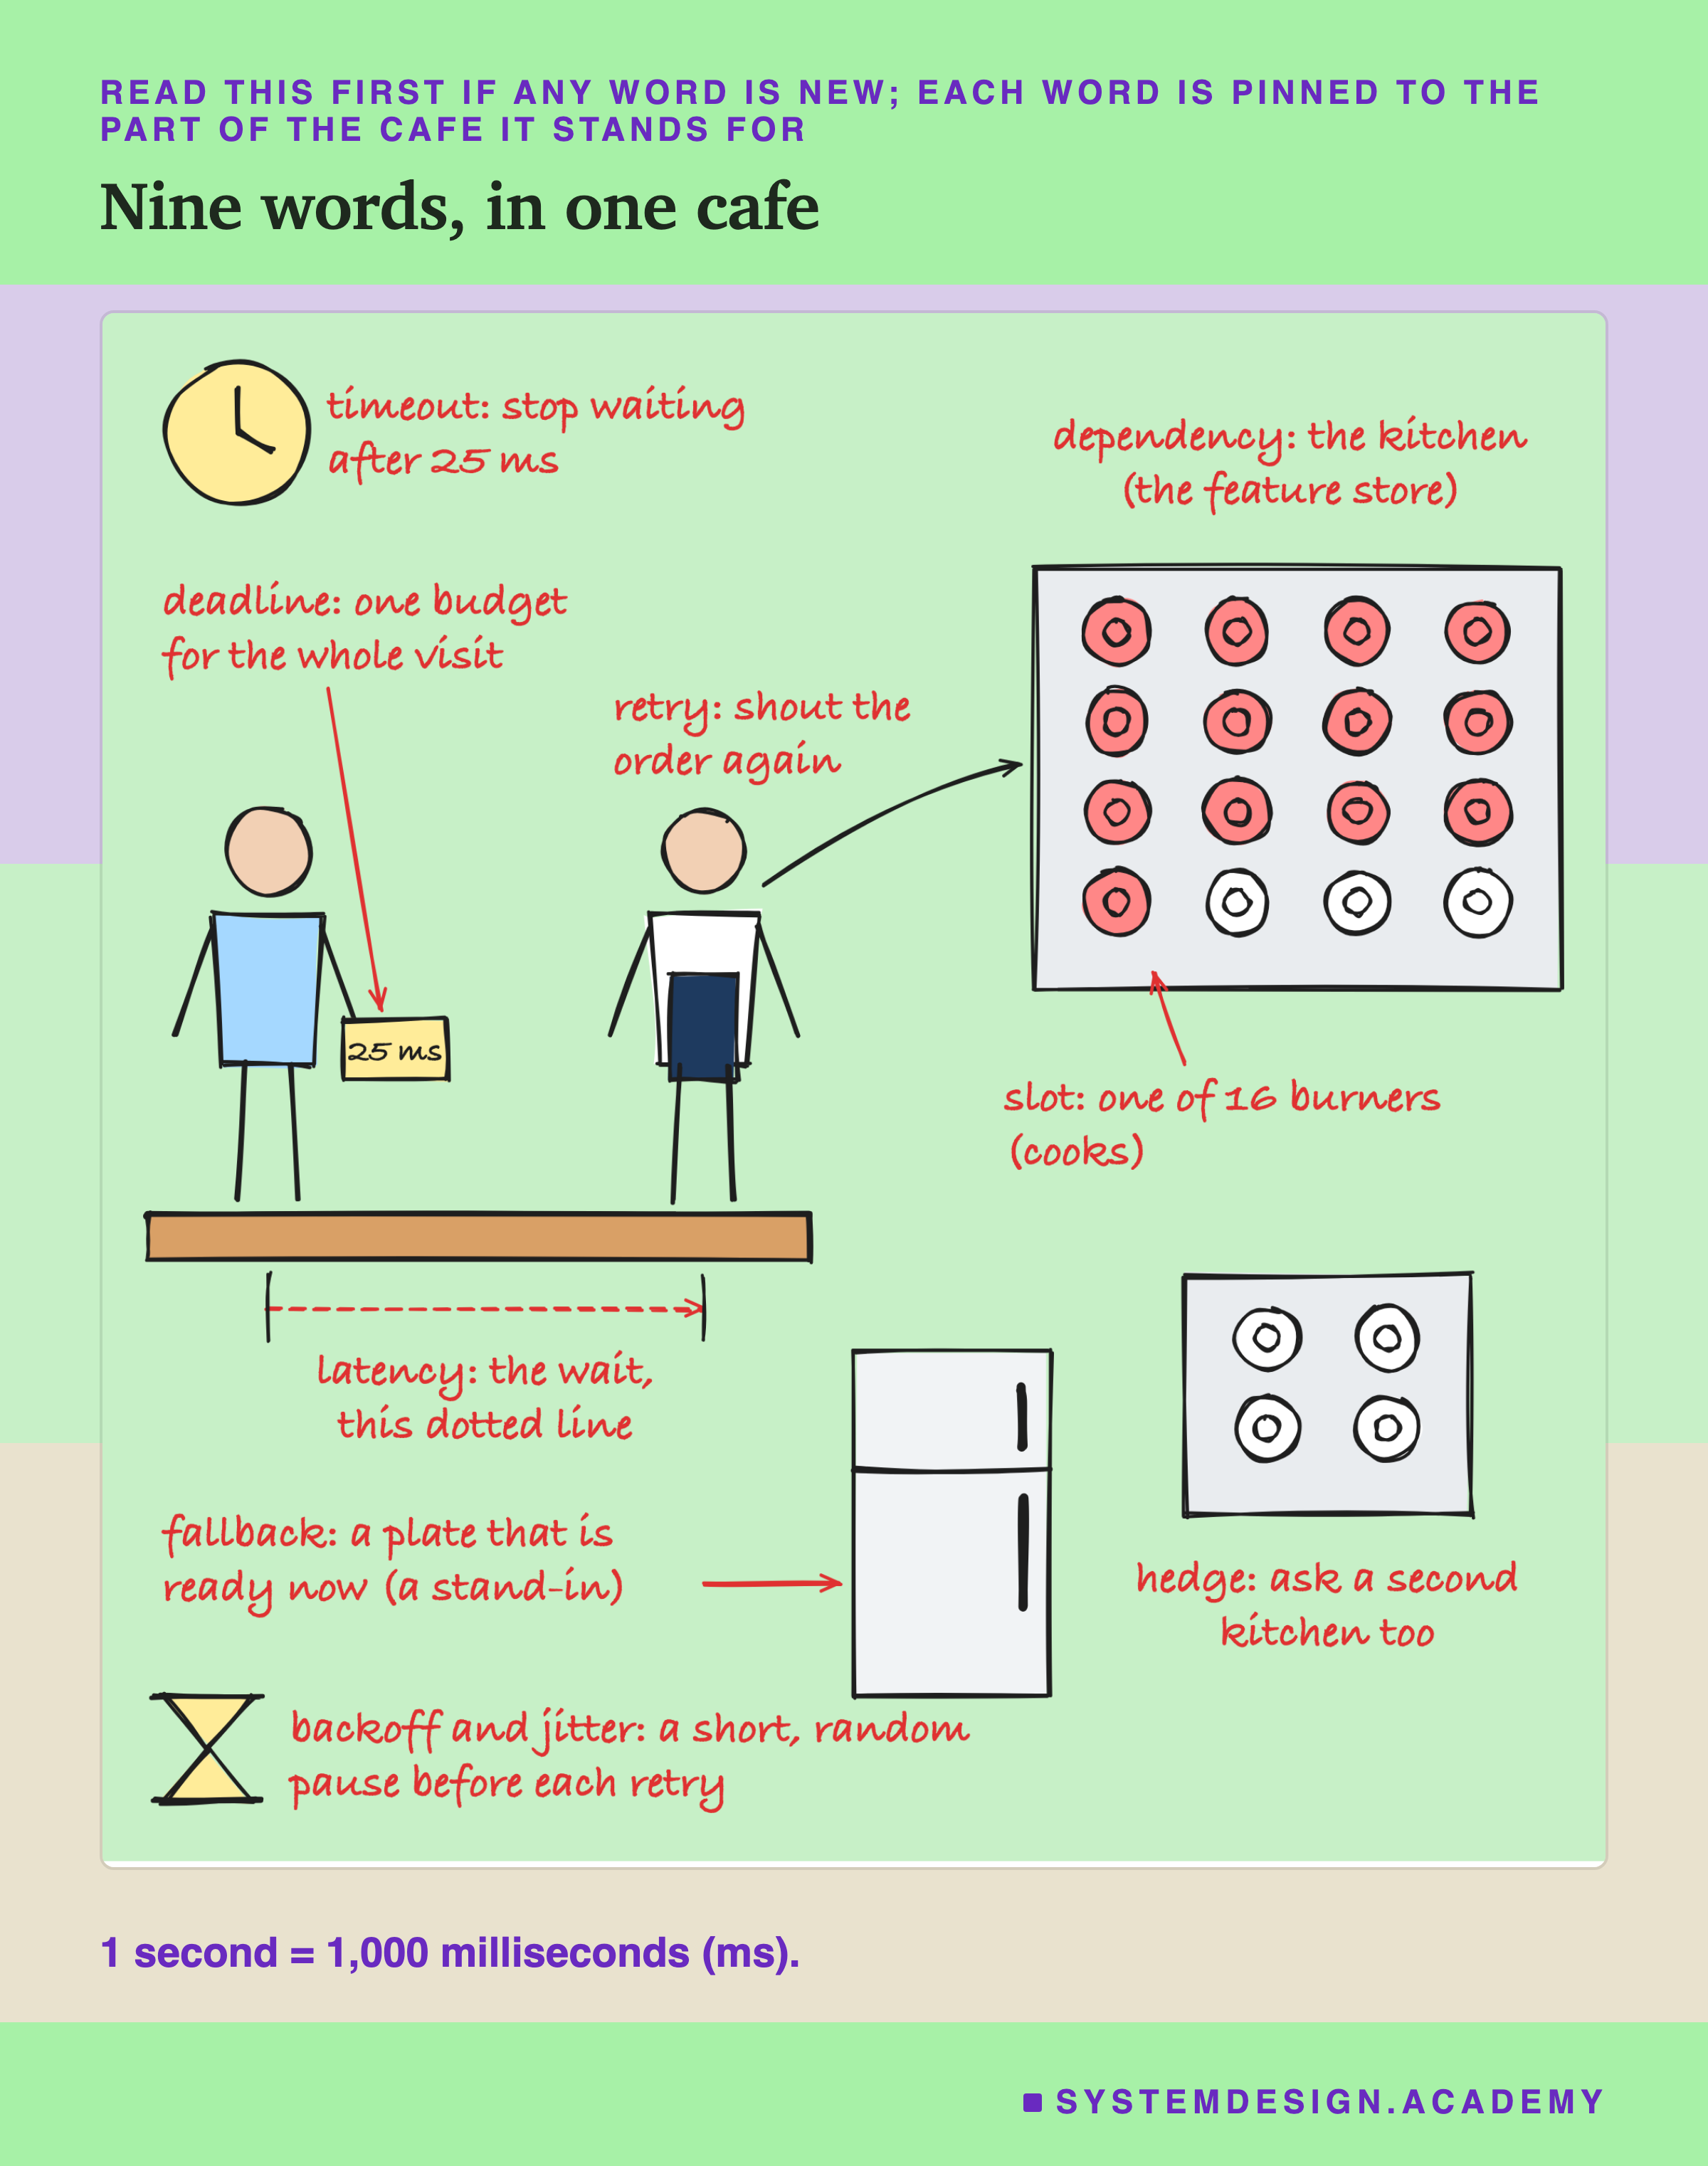
is how long you wait for an answer. In the cafe, it is the time from ordering to getting your plate. Here I measure it in thousandths of a second, called milliseconds (ms). One second is 1,000 ms.
A dependency is another system your service needs before it can answer. The kitchen is the waiter's dependency. Here the dependency is the : the small database that holds each customer's six numbers.
A timeout is a time limit on waiting. "If the kitchen has not sent the plate in five minutes, stop waiting." In code it is one number, such as 25 ms.
A fallback is what you give back when the real answer did not come in time. In the cafe it is the sandwich from the fridge. Here it is a stand-in score: a score that is not the model's fresh answer. I try three kinds.
- The last-known score is the score the same customer got one month earlier, kept in memory.
- The is one number for everyone: the share of buyers in the training data, 23.4%.
Four Answers to a Slow Lookup
When the lookup is slow, the service has four basic choices. They are the waiter's four choices from the cafe.
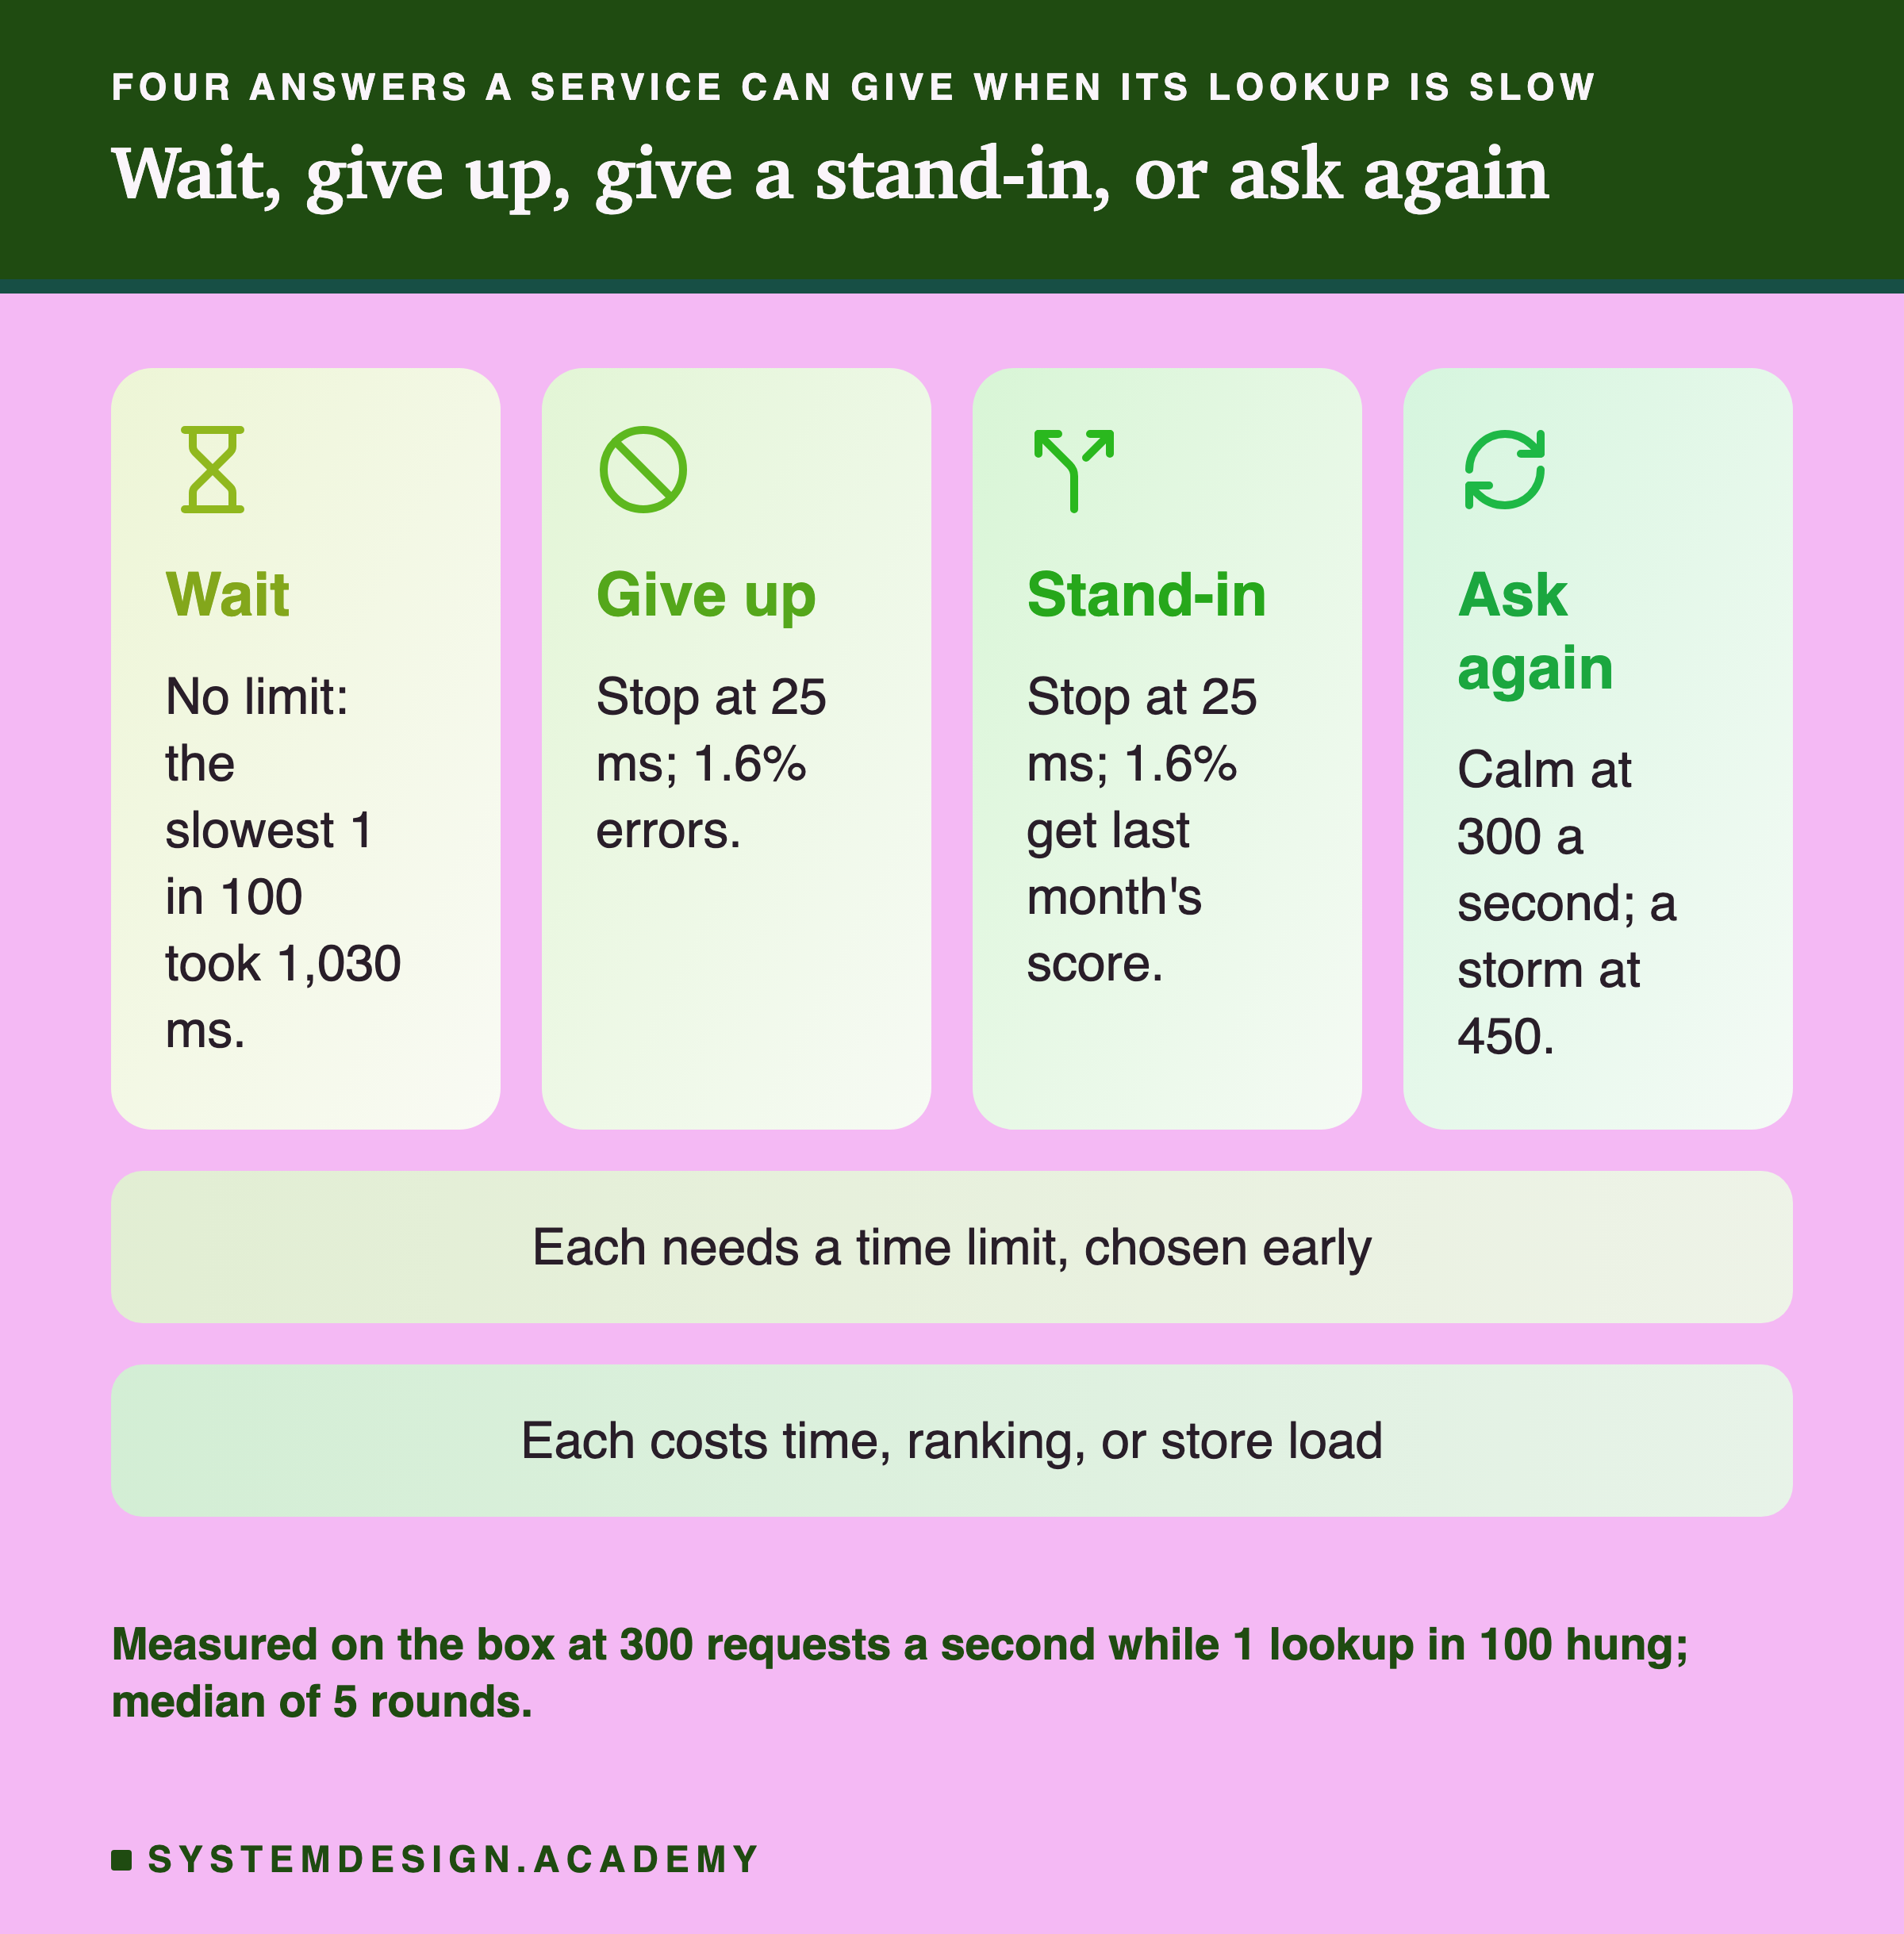
Wait means no time limit at all. Give up means a time limit, and then an error message instead of a score. Stand-in means a time limit, and then a score that is ready now. Ask again means a retry.
The two bands under the cards are the two things I want you to remember from this slide. Every choice needs a time limit that you pick before anything goes wrong. And every choice costs something: the user's time, the quality of the ranking, or extra work for the store.
The Headline: A Time Limit Moves the Needle
Here is the main result first. Each dial shows the slowest 1 in 100. Its scale runs from 1 ms on the left to 3 seconds on the right, and each mark is 10 times the one before it. One lookup in every 100 froze for 1 to 2 seconds, and requests arrived at 300 a second.
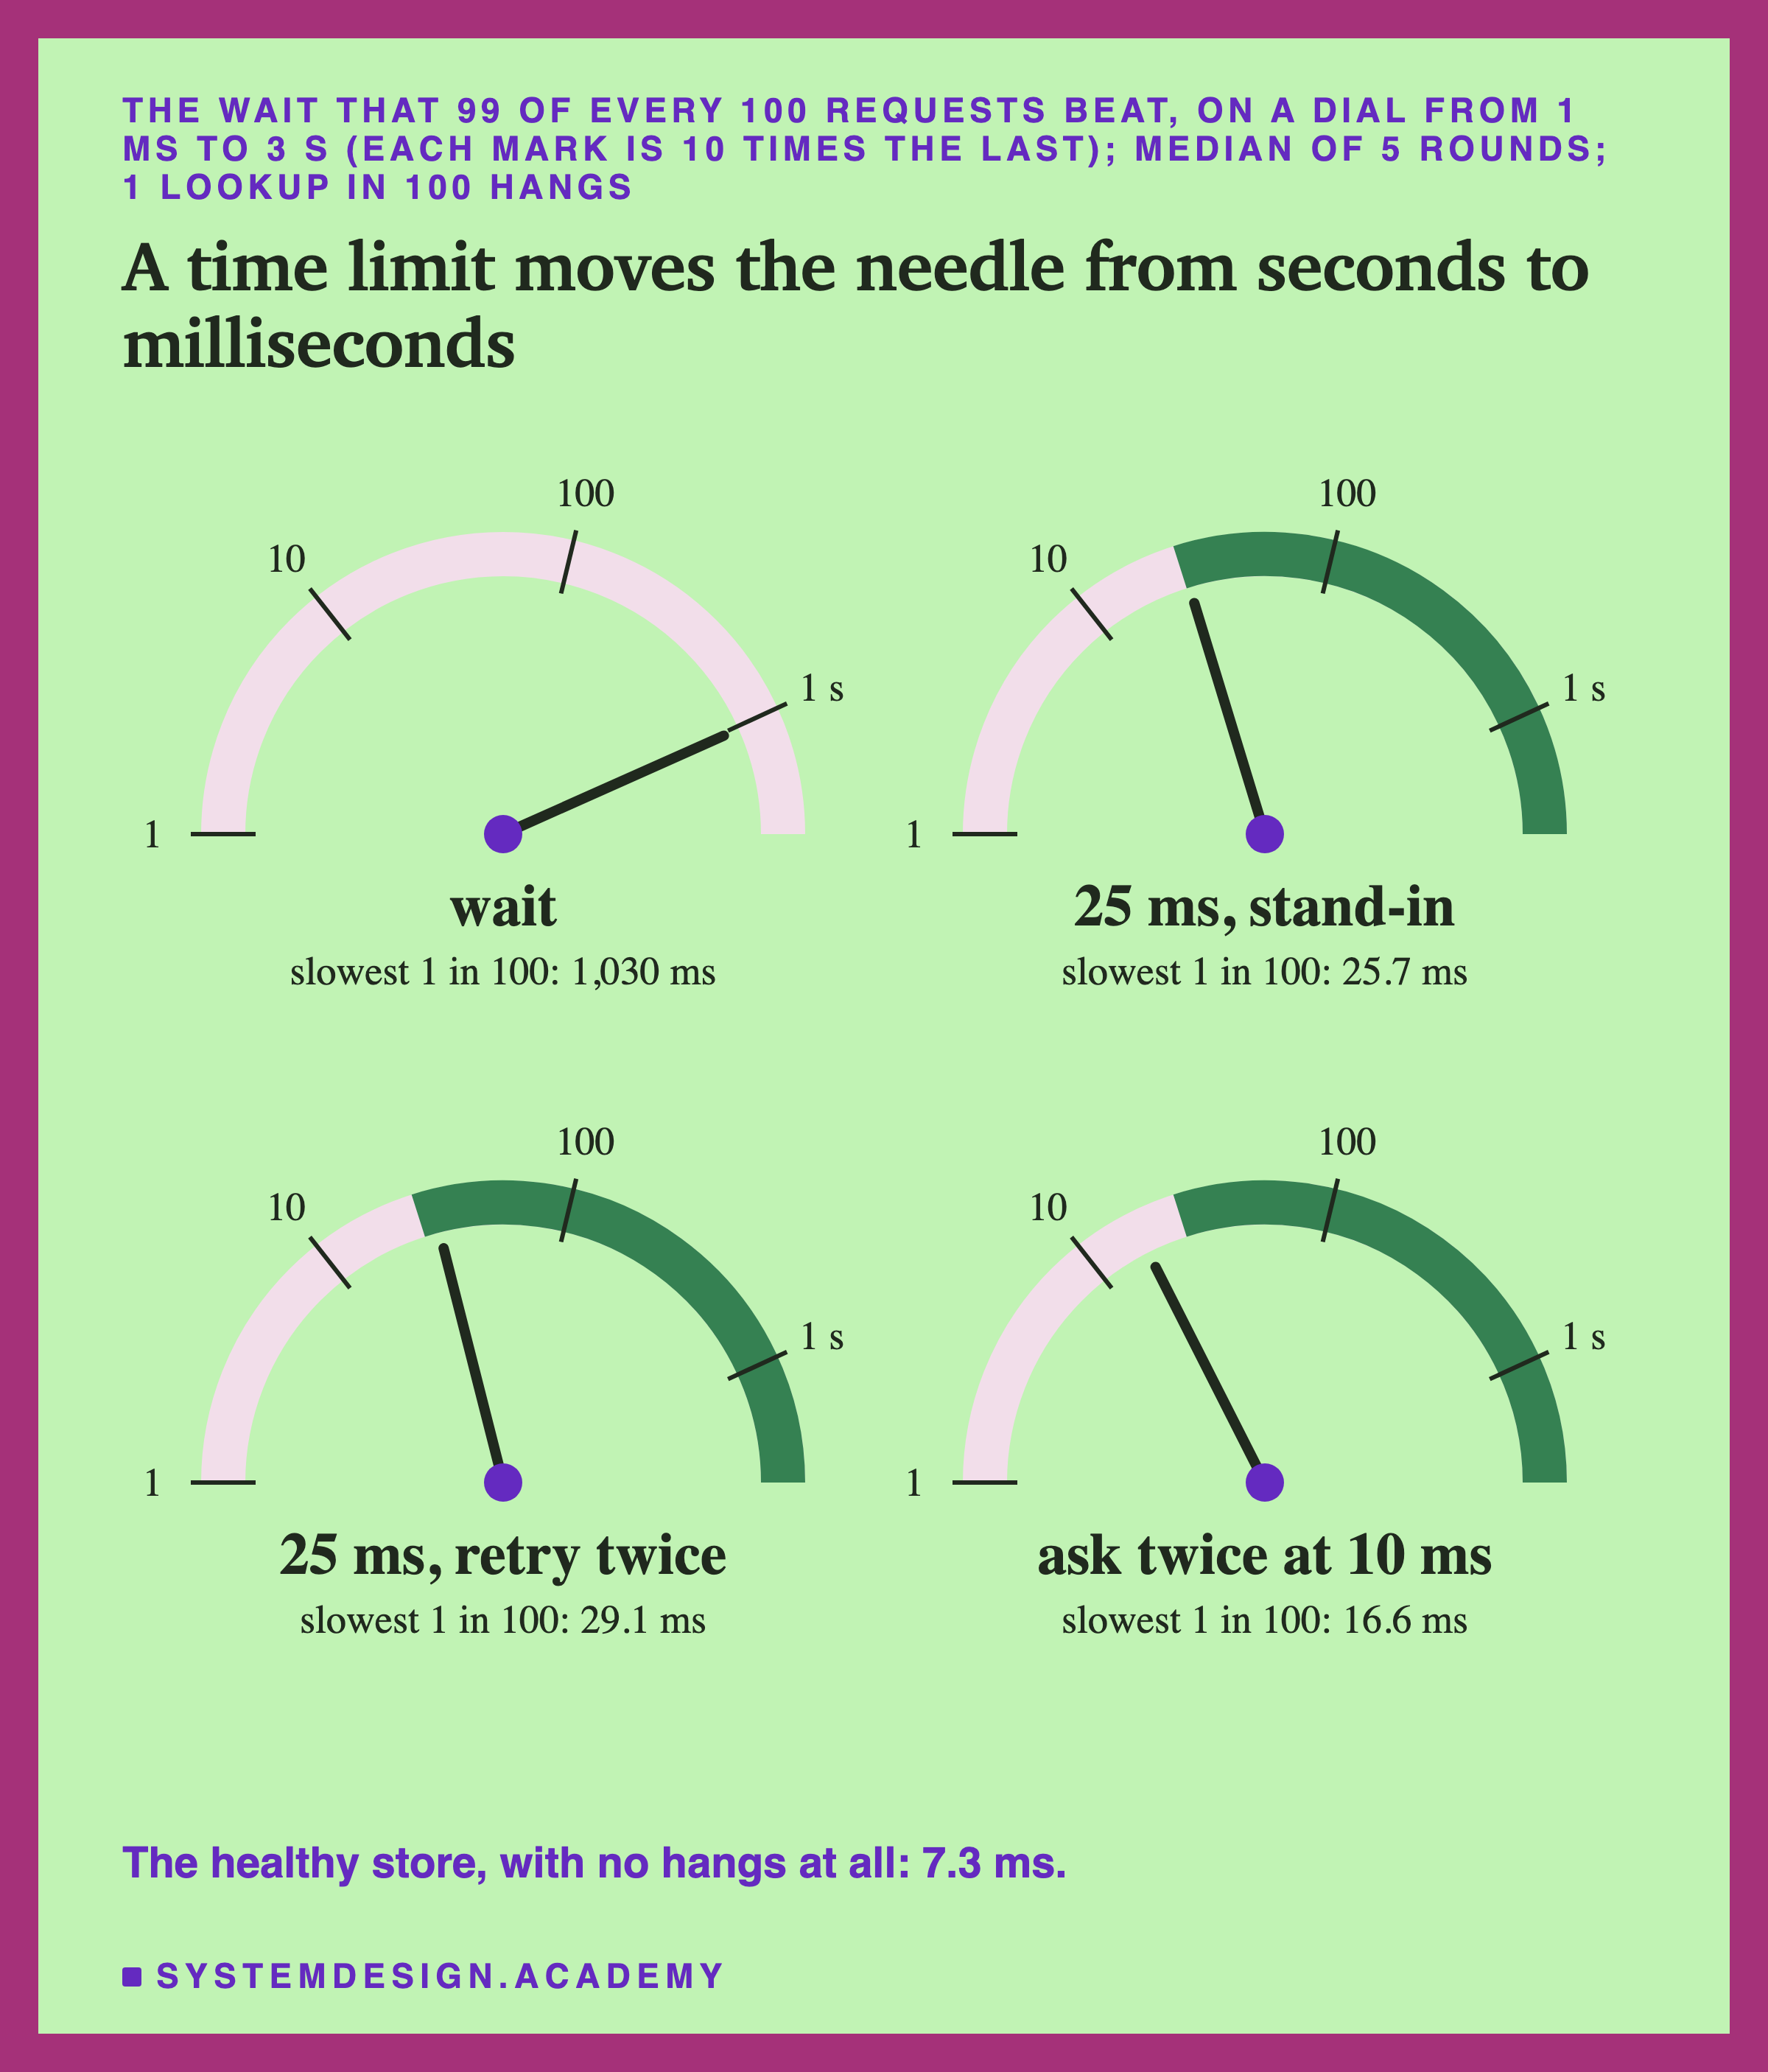
With no time limit, the slowest 1 in 100 took 1,030 ms. About one request in a hundred hit a frozen lookup and waited a second or more. The other 99 were fast.
With a 25 ms limit and a stand-in score, it was 25.7 ms, forty times shorter. The price was that 1.62% of answers were stand-ins, not the model's fresh score. (This is the middle of the 5 rounds; all the rounds together give 1.66%.)
Trying again, up to twice, brought the stand-ins to zero at this rate. That is close to expected: each try draws its own wait, and a second try rarely freezes too. The measured part is the price: 1.7% more calls to the store, and a slowest 1 in 100 of 29.1 ms.
Asking twice after 10 ms gave the shortest wait of all: 16.6 ms, for 6.6% more calls. This held here because each second try drew its own random wait from a store that needs no work from the core. If the whole store is slow, both tries are slow.
One result turned all of this on its head. At 450 requests a second, trying again turned one bad second into a flood that never ended, in 3 of 5 rounds. I come to that later. It is the most important finding of the lesson.
How the Lab Was Built
I wrote the lab's design in the note at the top of the program file scripts/labs/serving/timeouts_fallbacks.py on 2026-10-11, before any timed run. It names every way of running the service, the two speeds, my rule for "clearly different", and fifteen guesses.
Before writing it, I also ran a small make-believe version on my laptop: a pretend store and pretend requests, with no real service. I used it only to choose two settings: the store's 16 slots and the two speeds. I wanted the store busy at 300 requests a second and near its limit at 450. I say so in the note, and no number from it is in this lesson.
The store. In lesson 2, the service read each customer's six numbers from a small database inside its own program. Here I moved that lookup into a separate small program, the pretend , on the same computer. The service asks it over a network connection, the way a real service asks a real feature store. The store holds lesson 2's table and runs lesson 2's lookup. Before it answers, it waits.
The wait comes in three kinds.
- Fixed: every lookup waits 2 ms. This is a healthy store.
- Long tail: most lookups wait about 2 ms, but a few take 10, 20 or 40 ms. It is like a queue where most people take 2 minutes and a few take 20.
- Freezes: the long tail, but 1 lookup in 100 instead freezes for 1 to 2 seconds.
The wait of every lookup is decided in advance from a seed, a number that fixes a random draw so it can be repeated exactly. It is like writing down the dice rolls first, so every way of running the service faces the same rolls.
The ways. I call one way of running the service an arm, like one recipe in a cooking test. There are 21 of them. Some wait. Some give up at 10, 25, 50 or 100 ms, or use a 25 ms limit with a stand-in. Others use a deadline, pass the deadline to the store, try again with or without a pause, or ask twice.
The Store, and Why Slowness Spreads
Before the results, one picture of how a slow store hurts everyone, not only the unlucky request.
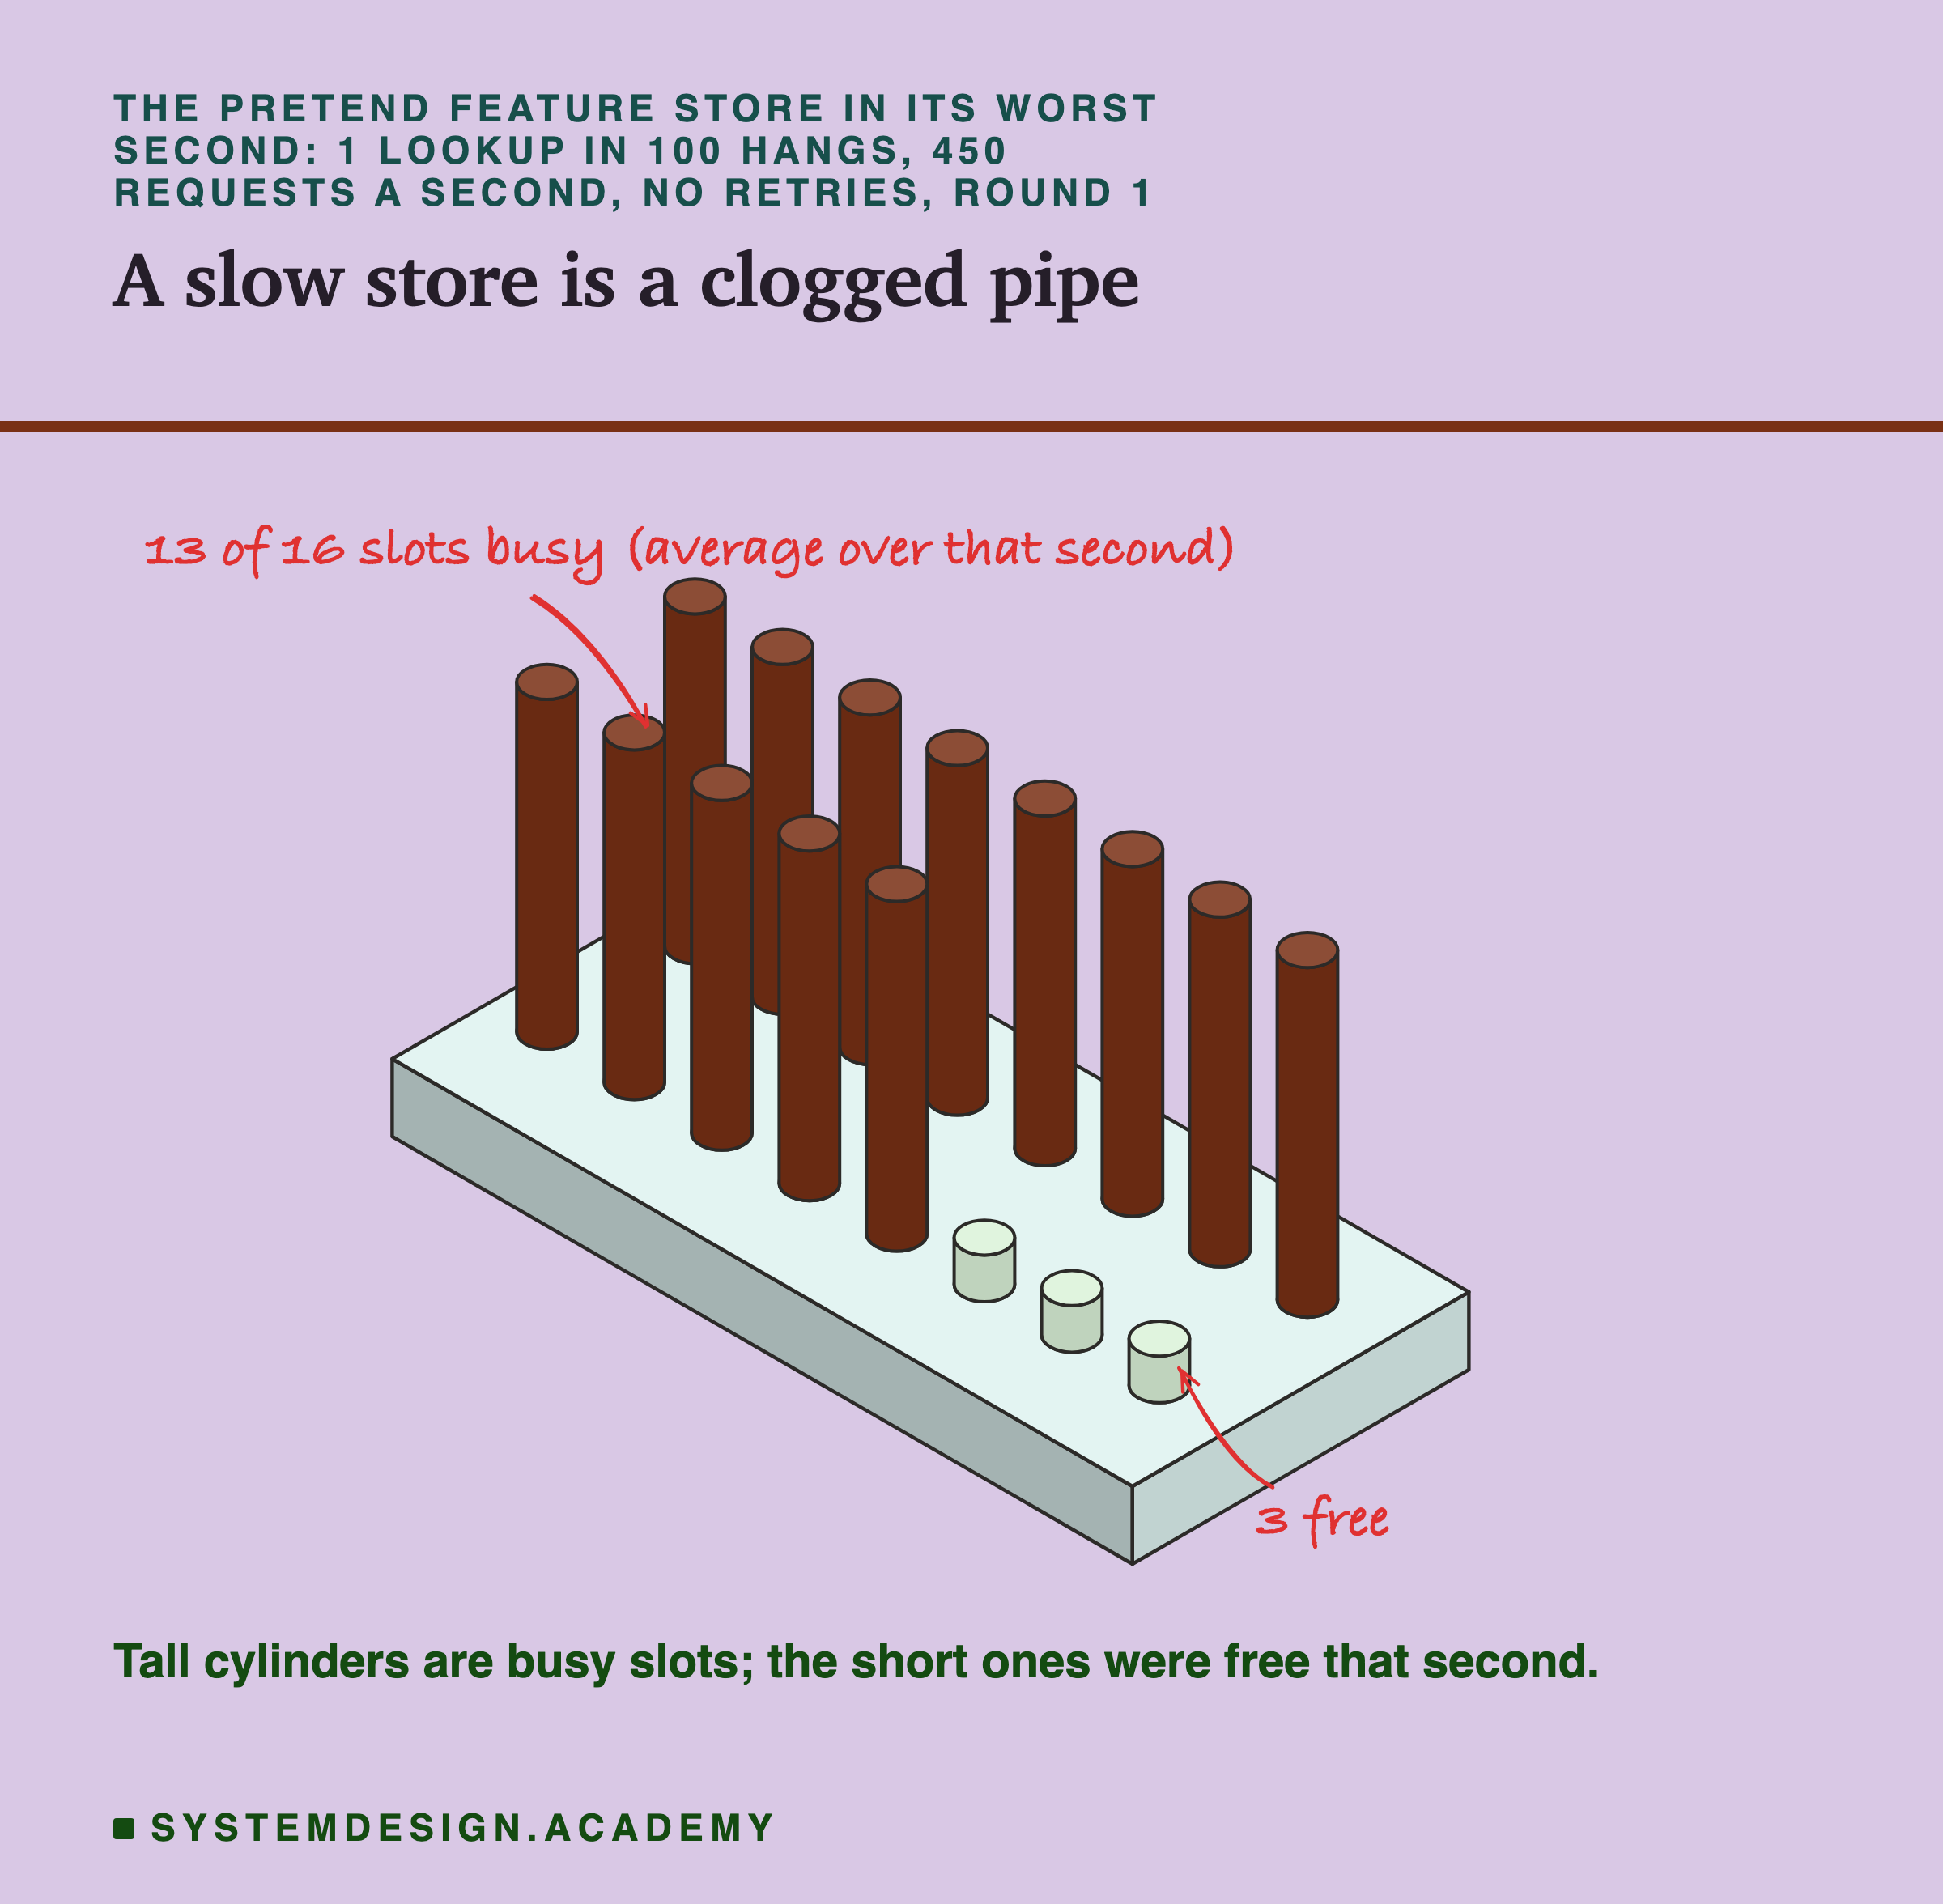
Think of the kitchen with 16 cooks. A normal order takes a cook two minutes. A frozen order keeps a cook busy for an hour. If several frozen orders arrive close together, most cooks are stuck. Then every new order waits in line, even the easy ones.
That is what this drawing shows, from a real second of a real run at 450 requests a second, with no retries. Between 2 and 3 seconds into the run, 13 of the store's 16 slots were busy on average. In that second, 183 of 475 requests got a stand-in. A slow dependency is like a pipe with something stuck in it: everything behind the blockage slows down too.
The Machine
Like lessons 2 to 8, every timing behind a finding comes from a small computer I rented from Amazon Web Services.
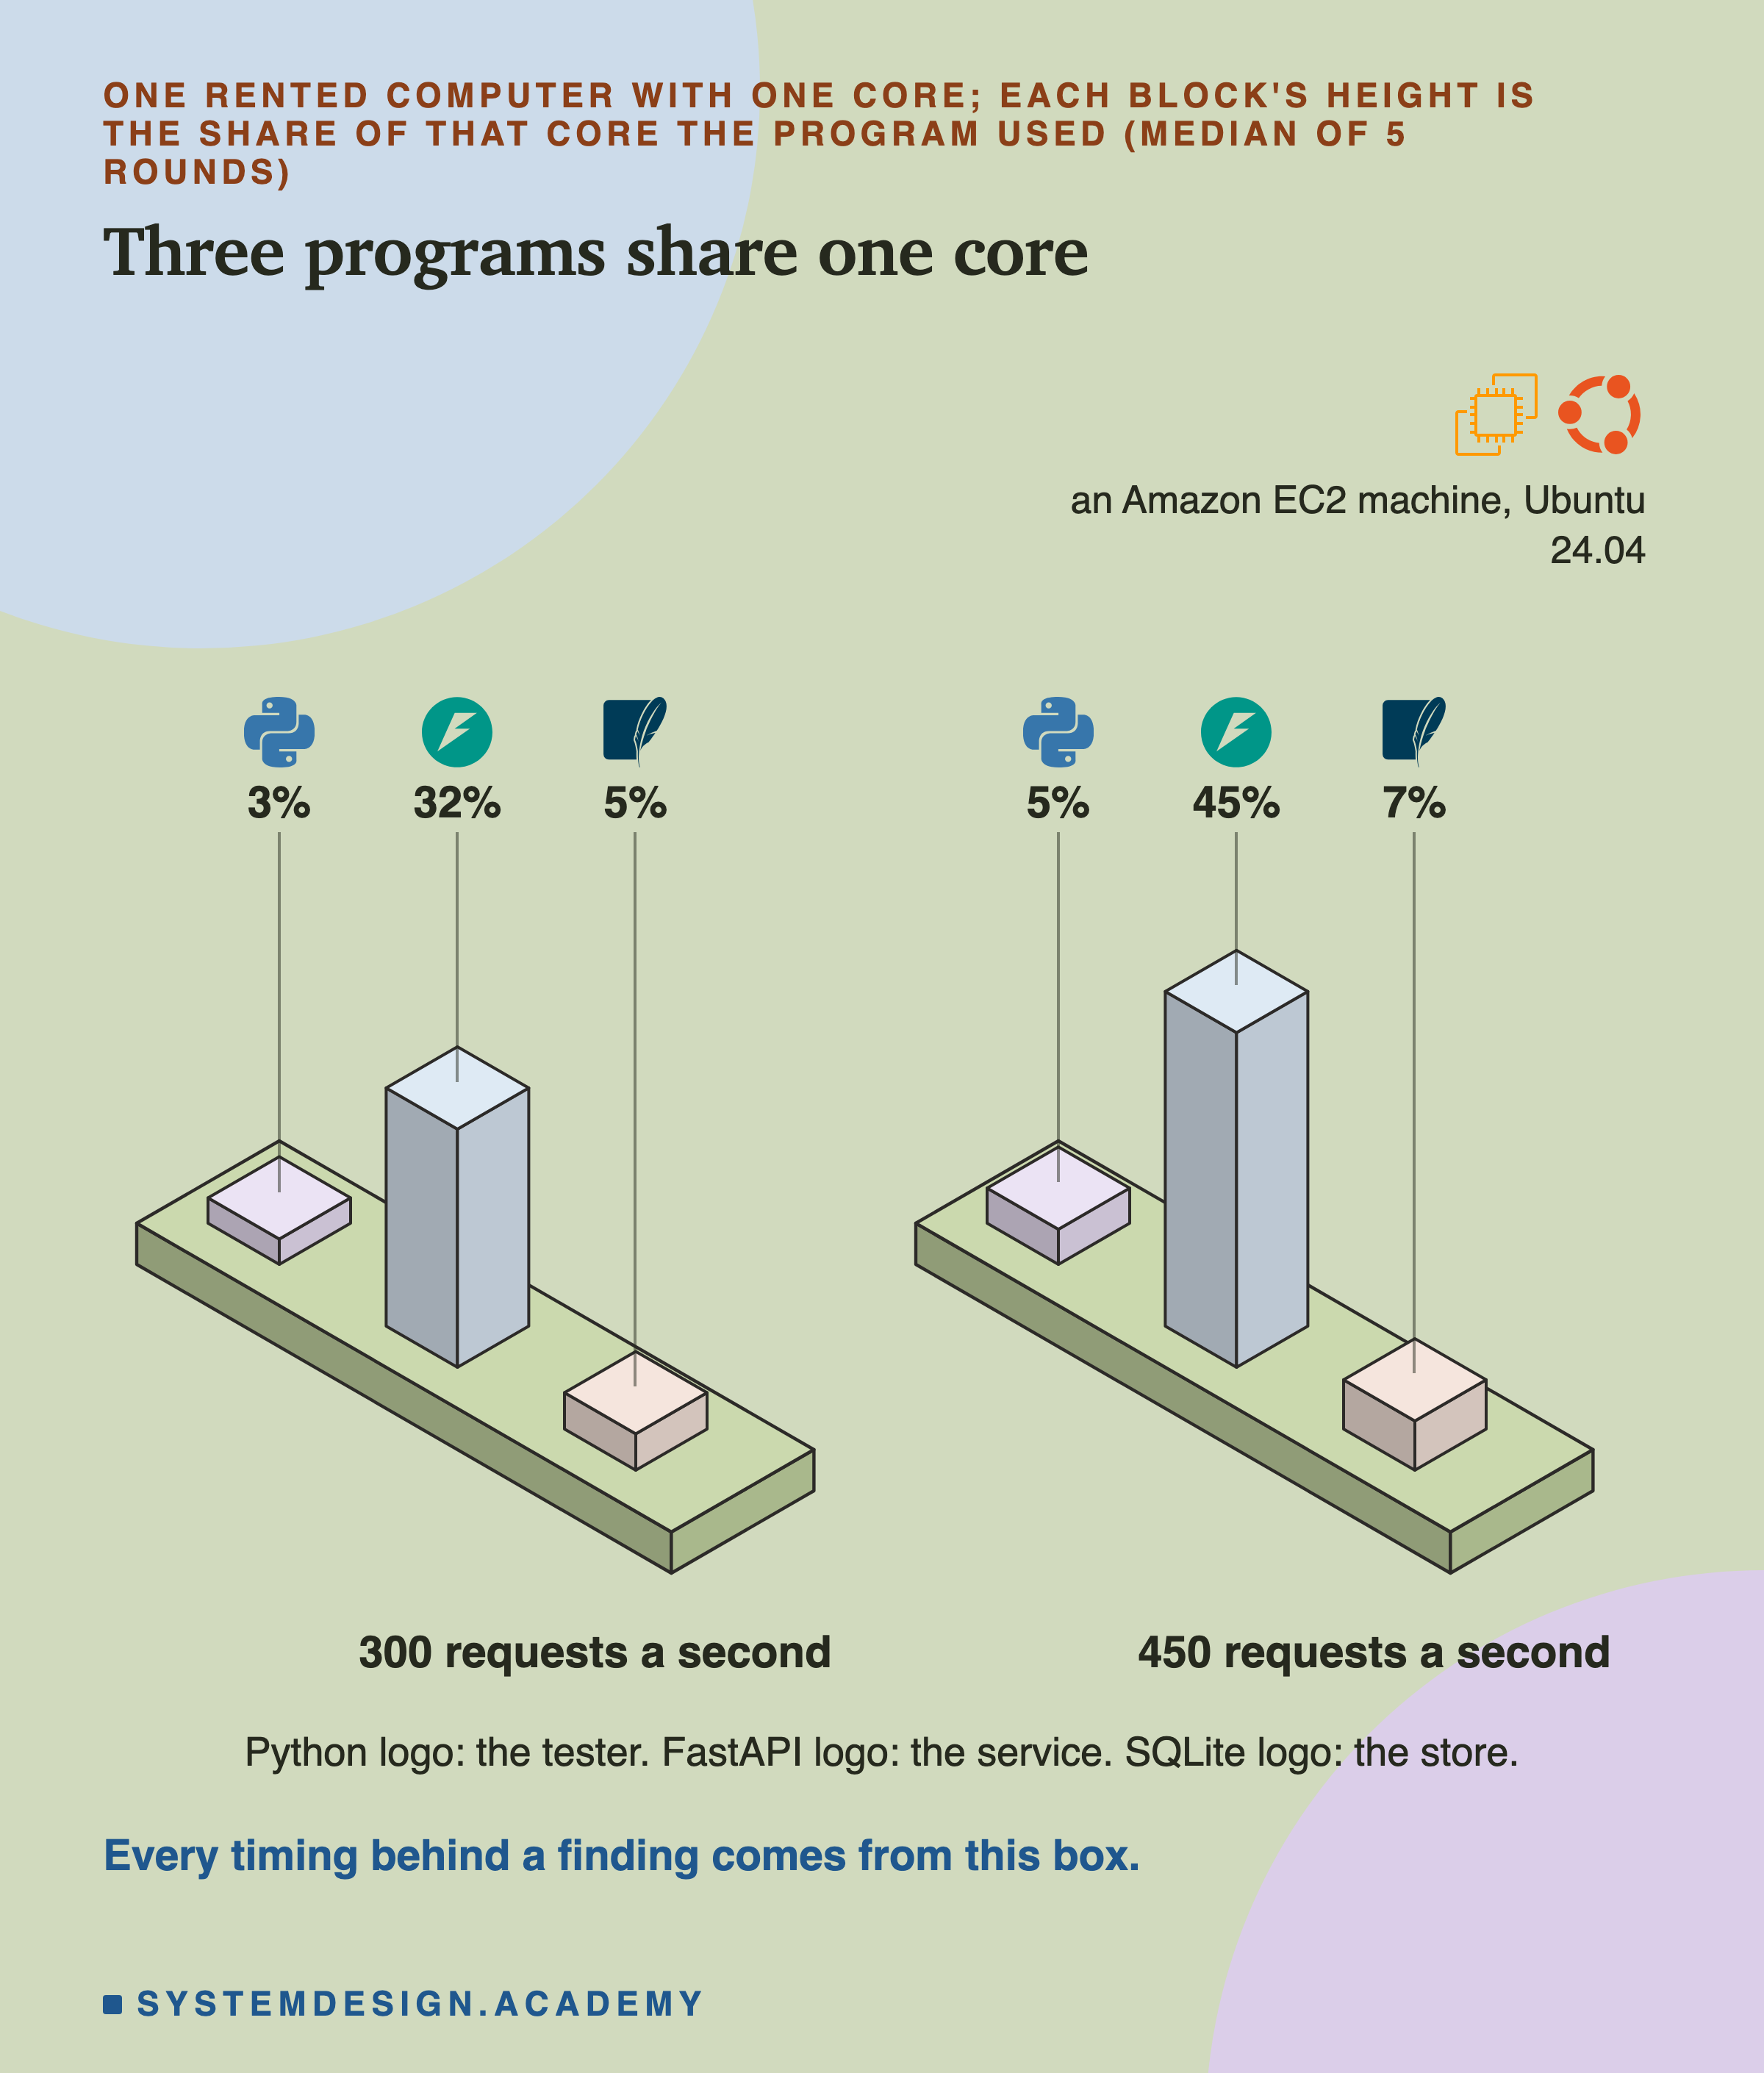
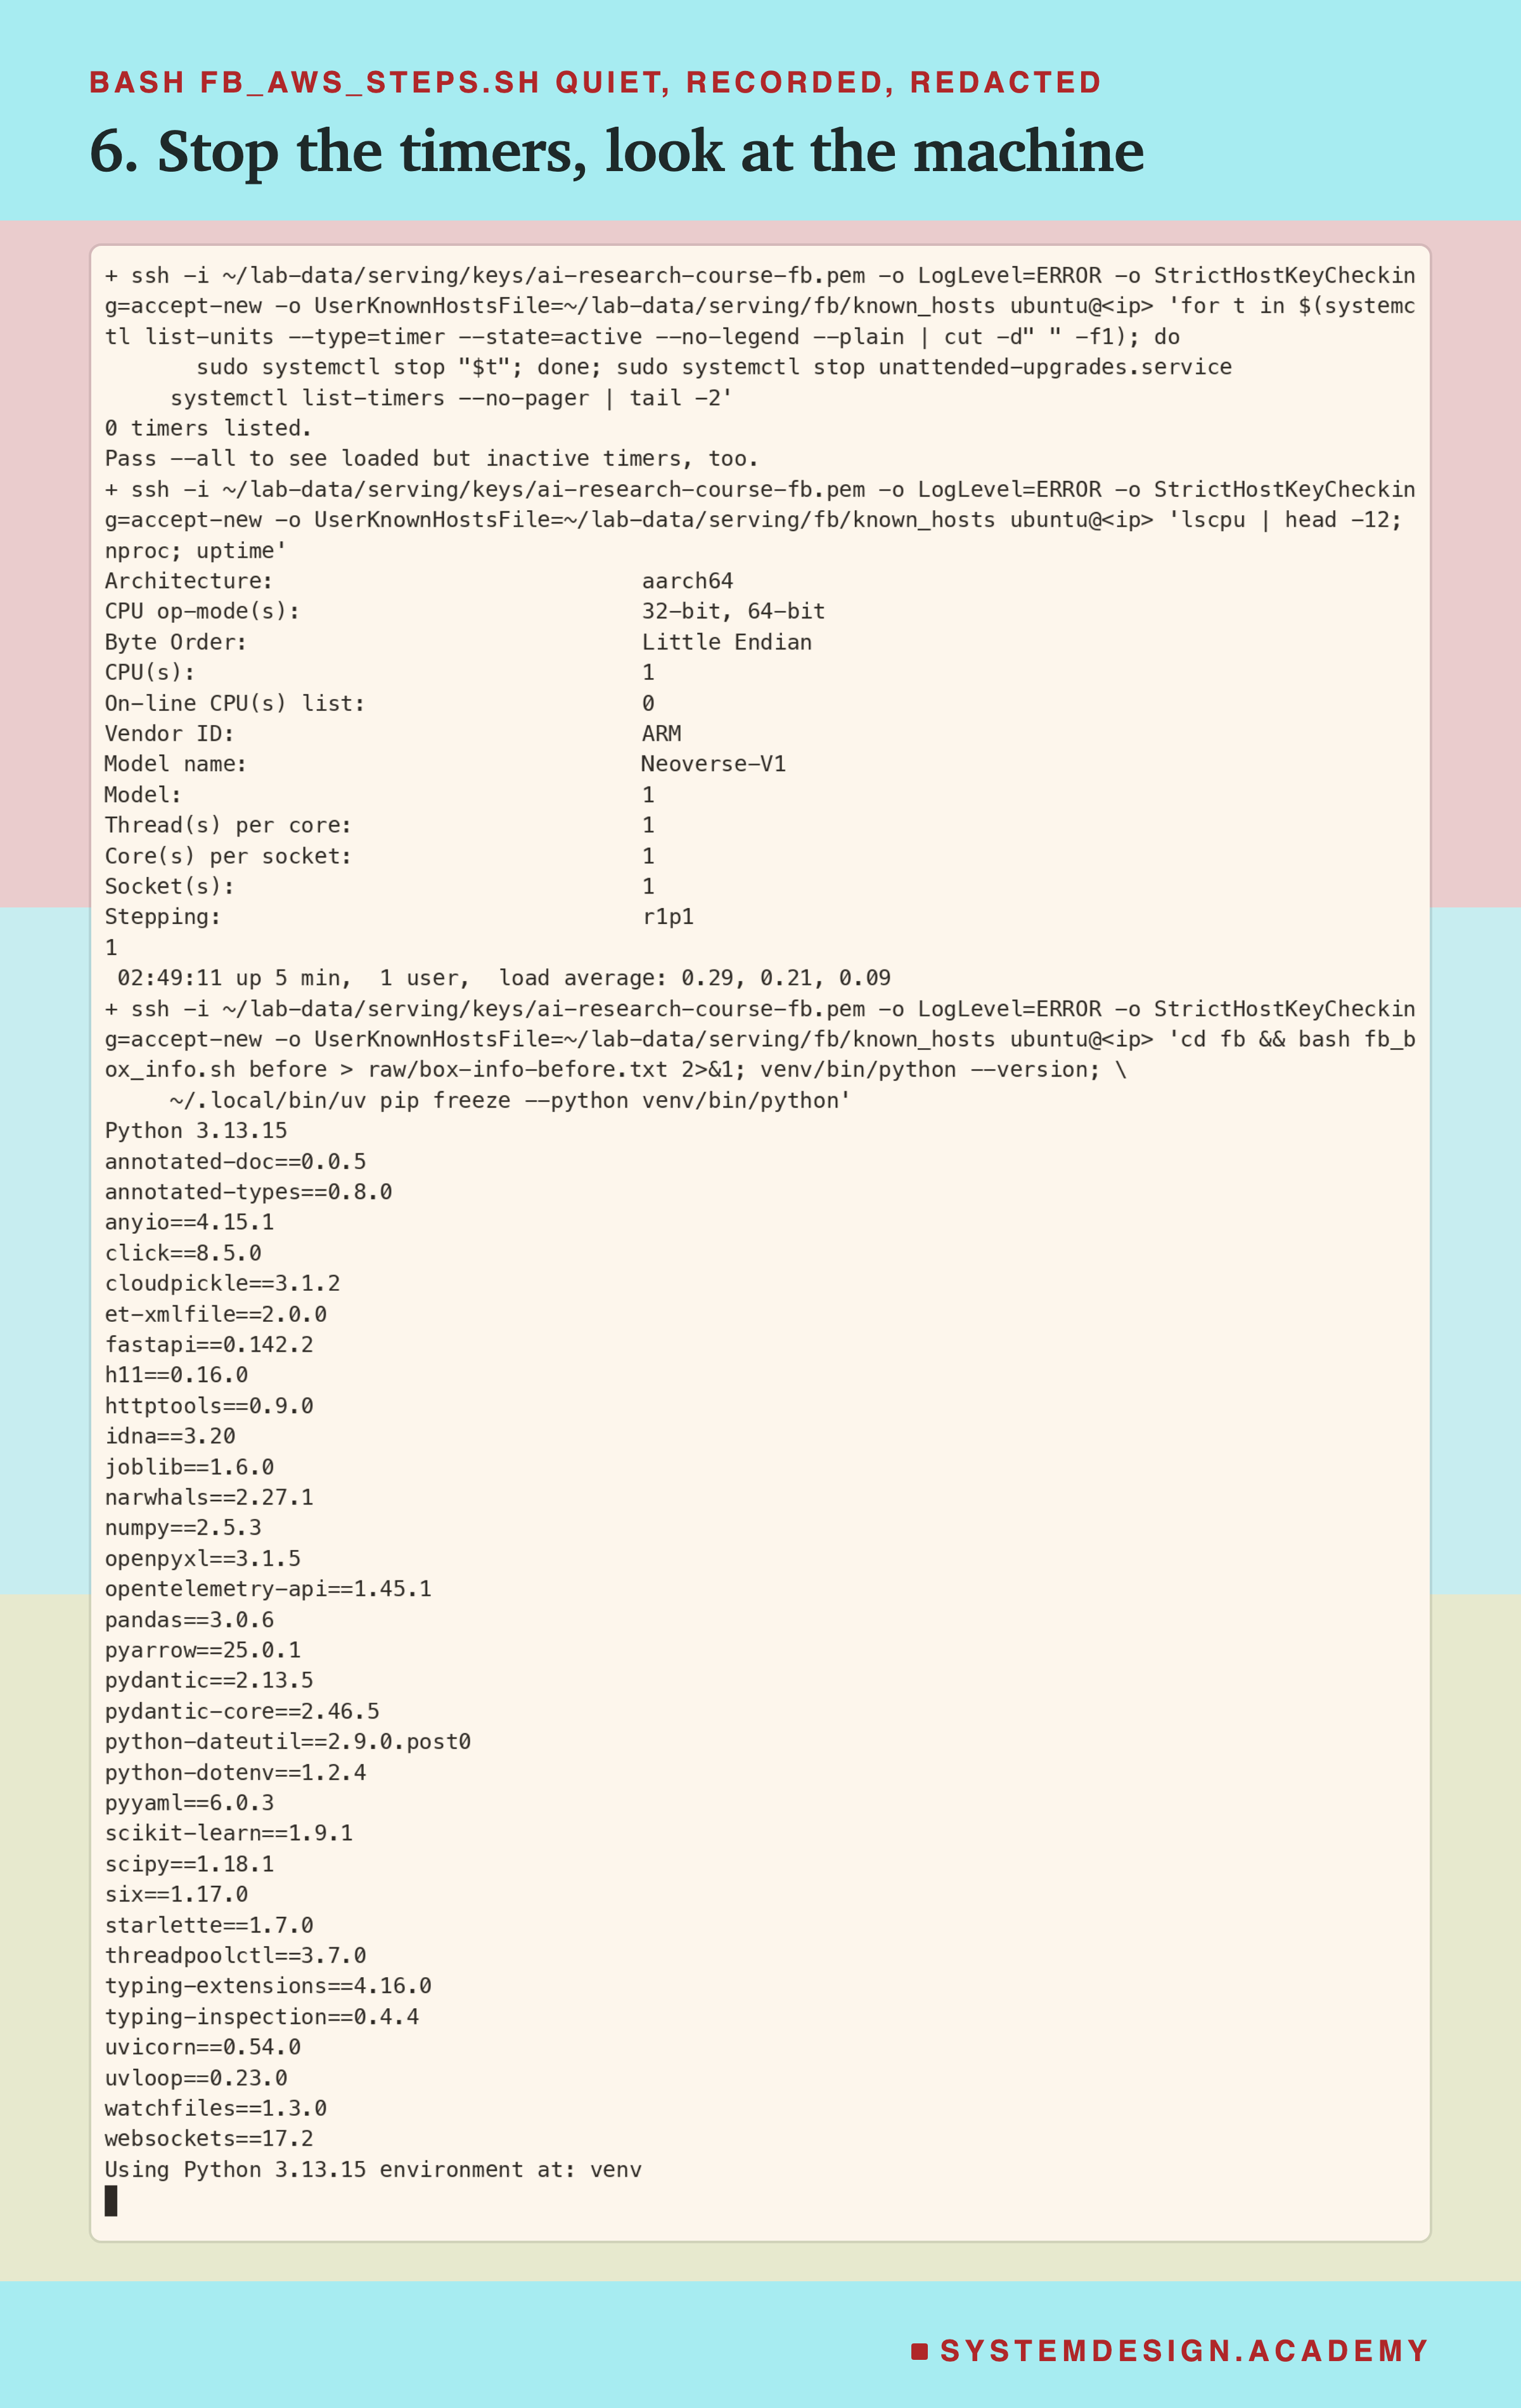
The computer is an EC2 c7g.medium. Amazon's own records list it with 1 core and 2 GB of memory, and its speed does not drop after a busy minute. The tester, the service and the store all take turns on that one core. The blocks show how much of it each one used. The service used the most: about a third of the core at 300 requests a second, and almost half at 450.
Before every run, a fresh store and a fresh service were started. Then the core had to be doing nothing else for at least 95 of every 100 moments, over two seconds, before the tester began. In all 110 runs it was idle at least 99.5 of every 100 moments. Steal, time that the big computer underneath lent to other customers' machines, was zero. Nobody was logged in at the start or end of any run.
The machine's diary, its system log, had 64 lines during the runs, in 12 of the 110 runs. Some came from its timetable program. Others came from an Amazon helper program that failed to phone home, because my machine had no permission to talk to it. The same kinds of lines appeared in lesson 7.
How busy do the two speeds make the core? I first measured the most answers a second the service could give, with the store at no wait at all: 934.1. So 300 a second used about a third of that, and 450 about half.
The Whole Lab in One Picture
Here is the whole lab as one numbered sequence. The numbers on the arrows match the numbers on the recordings that follow.
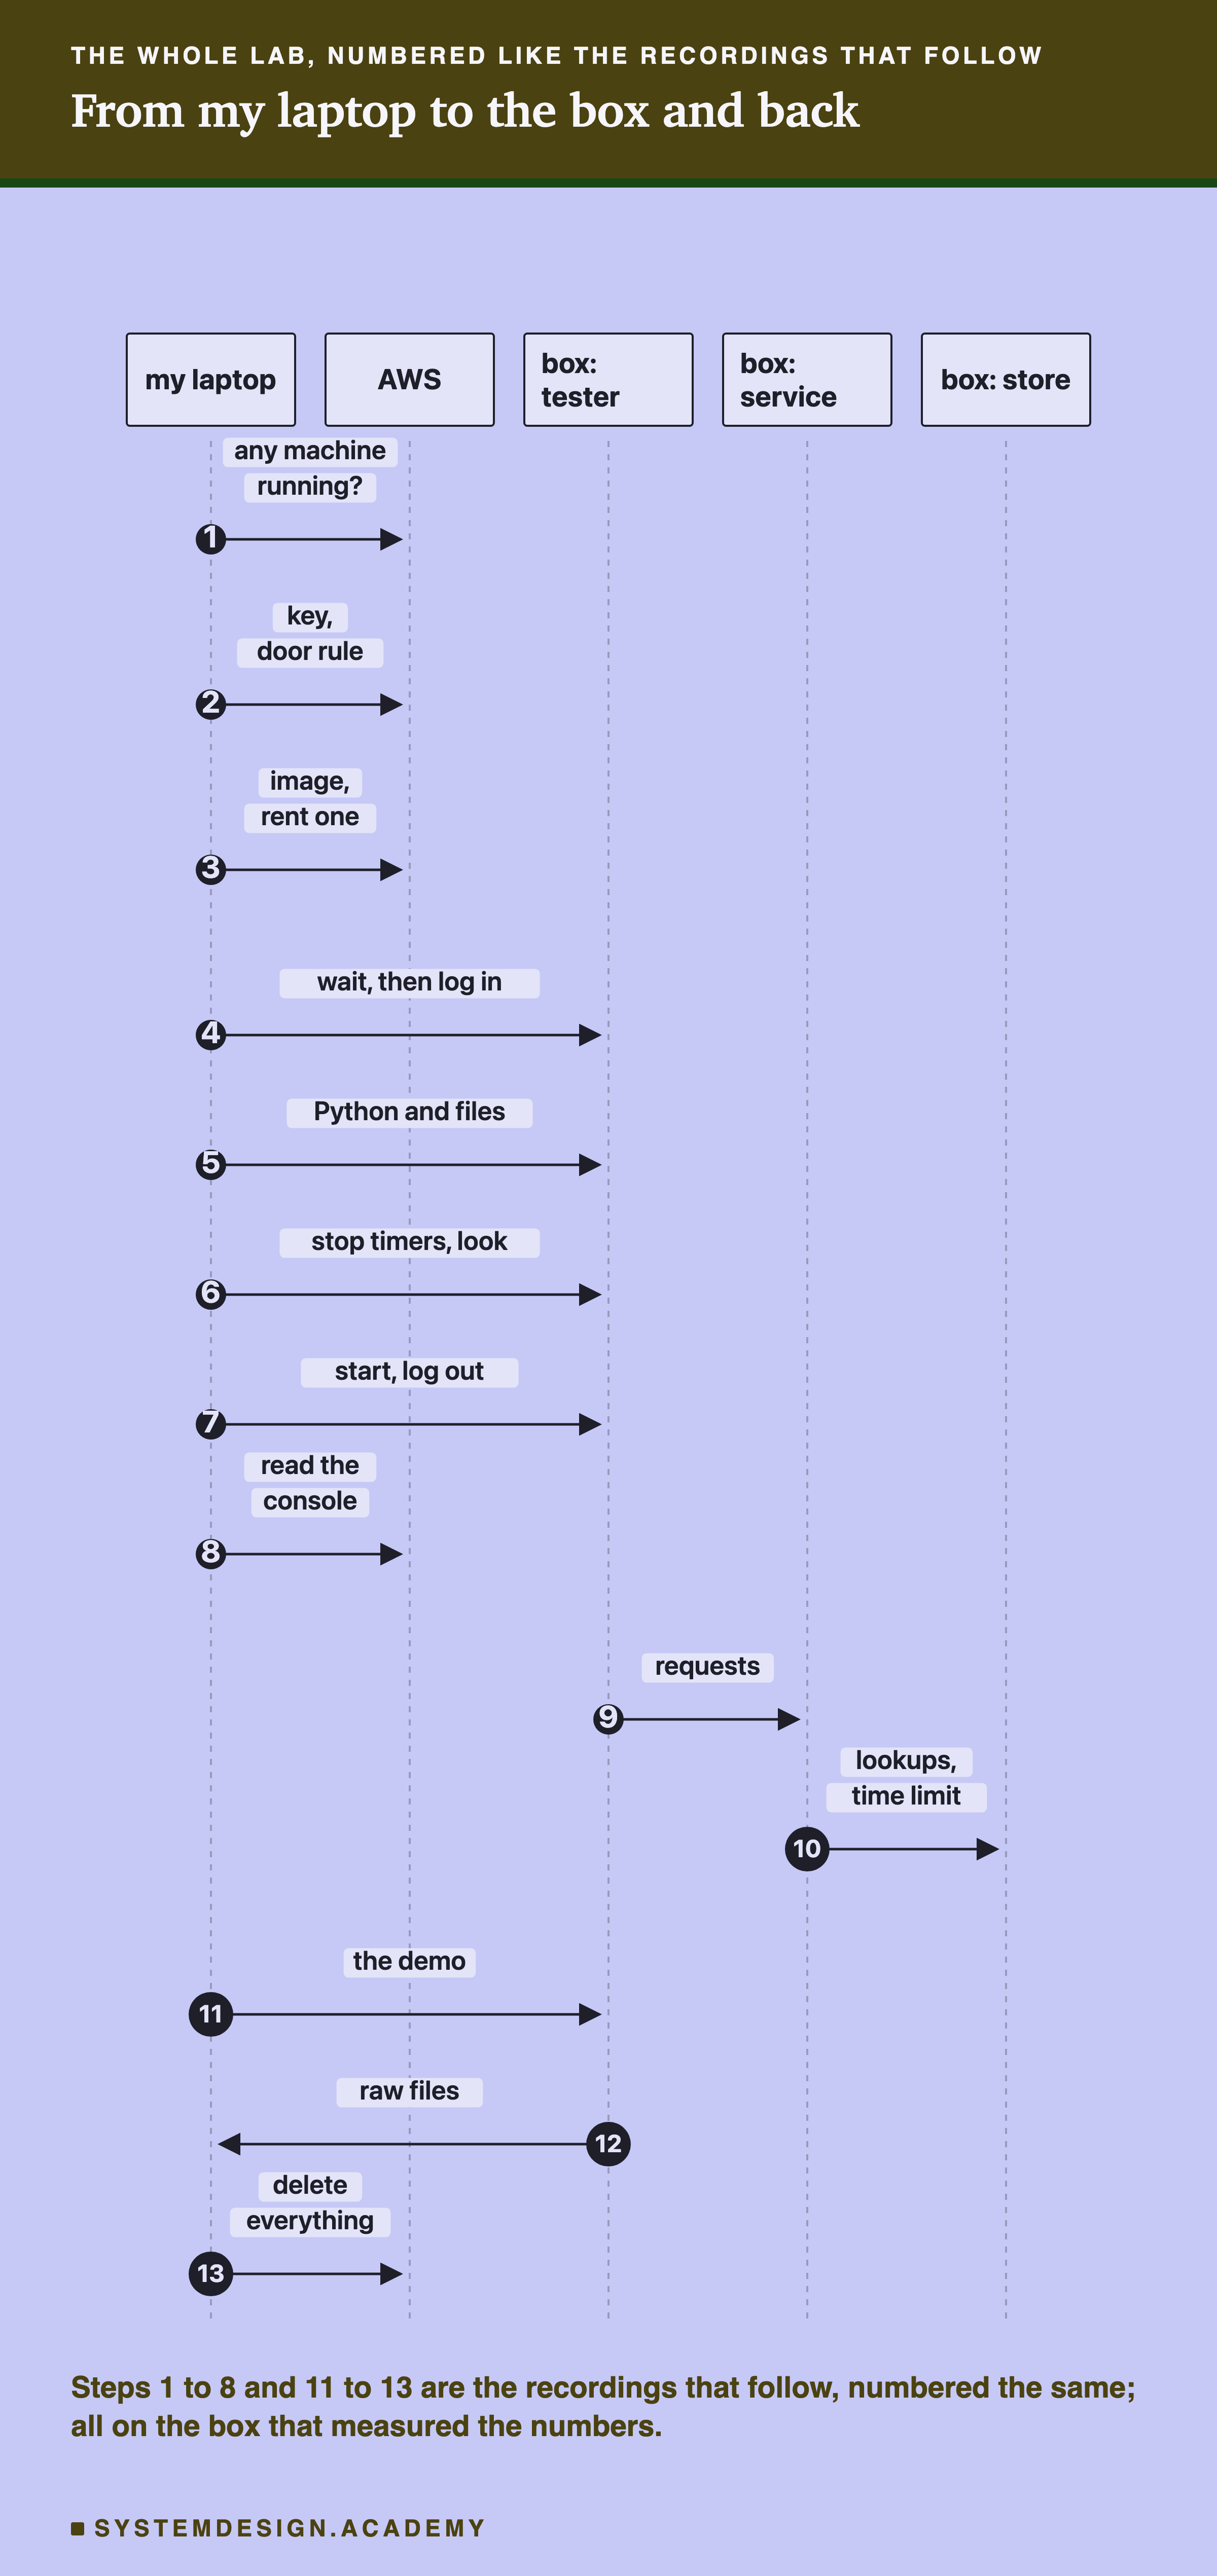
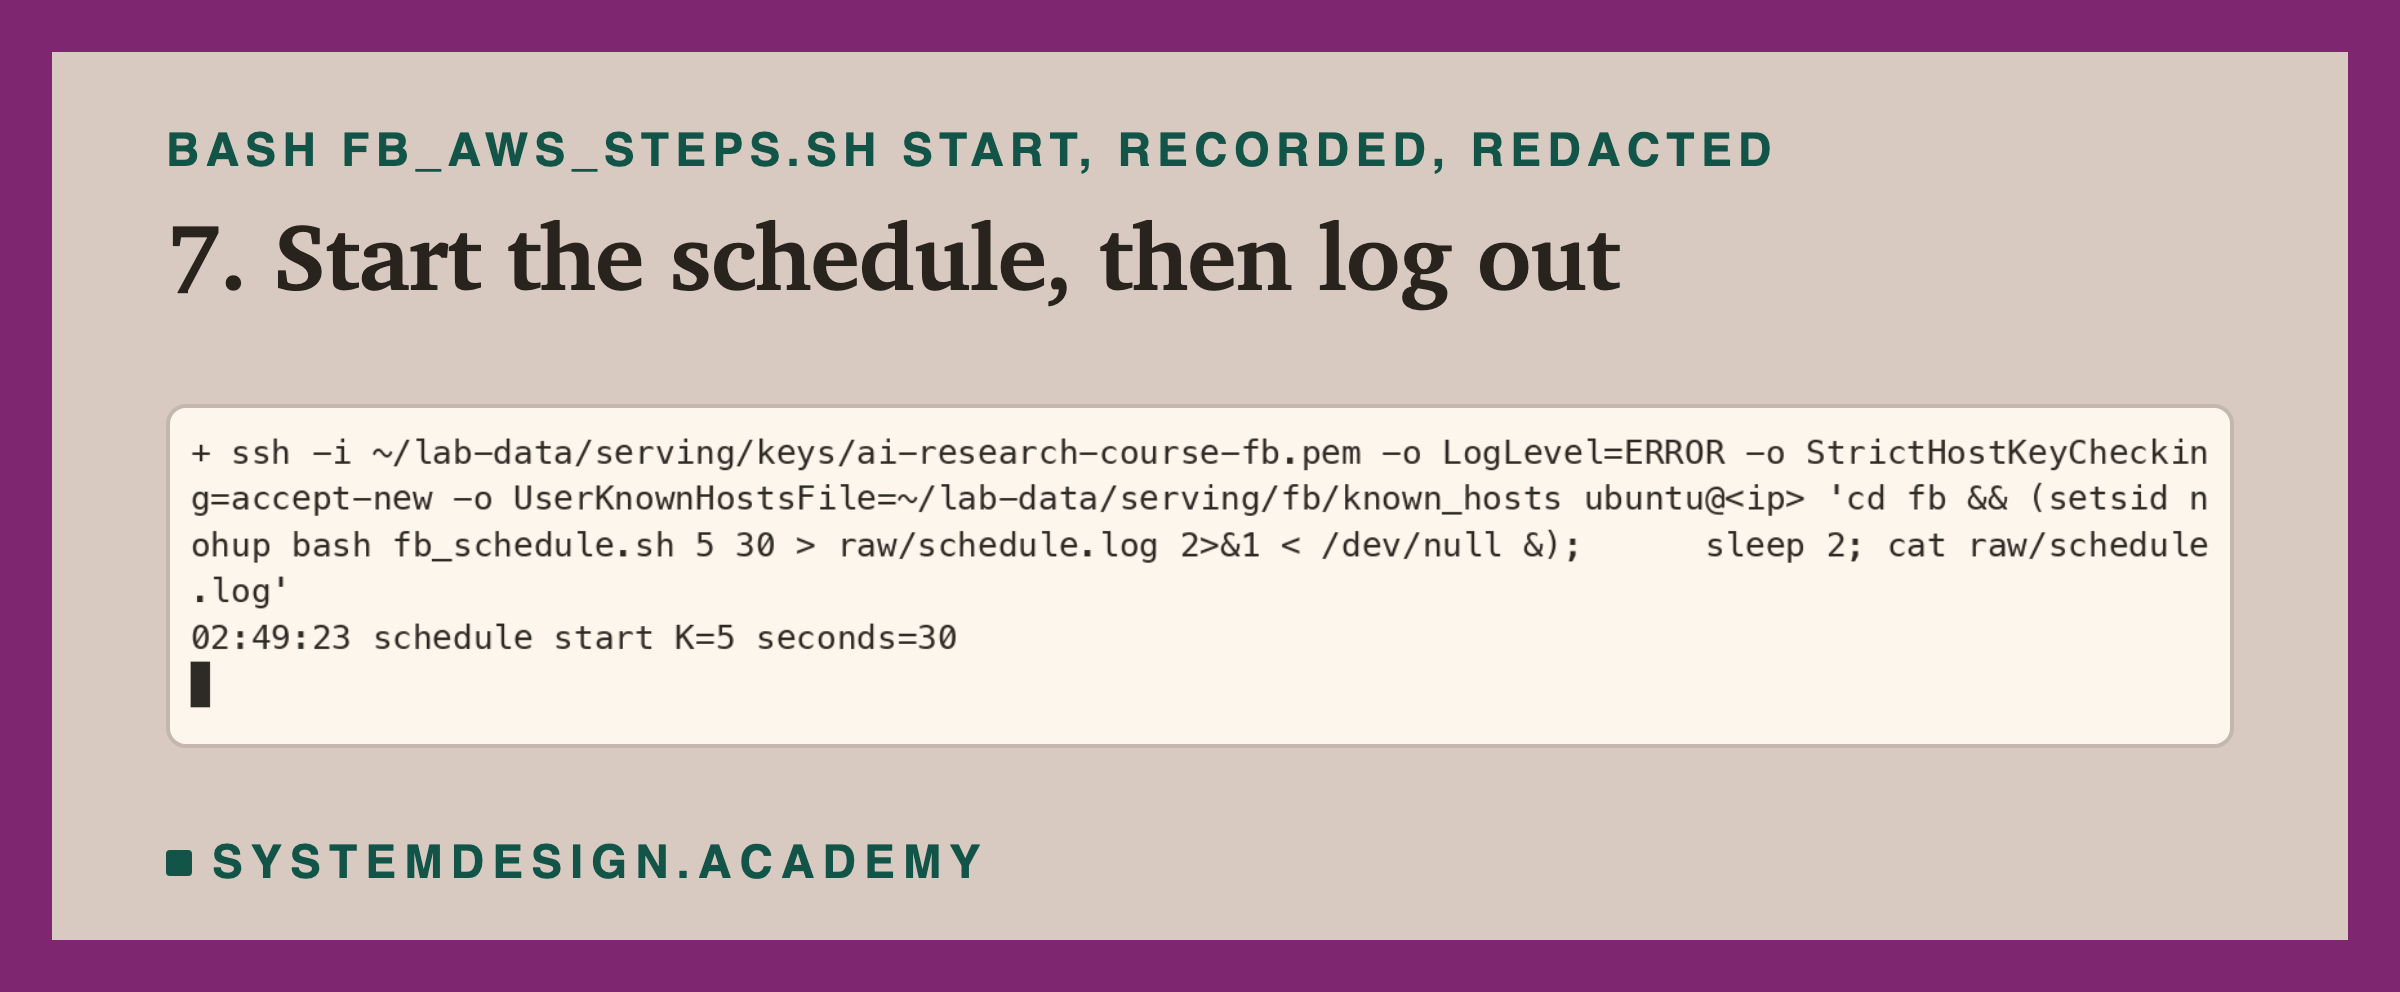
Steps 1 to 7 happen once: check, rent the computer, set it up, and start the schedule. Step 8 is how I watched the schedule without touching the computer. Arrows 9 and 10 are the timed work: requests from the tester to the service, and lookups from the service to the store. Steps 11 to 13 come after the schedule: the student demo, the copy of the results to my laptop, and the deletion of everything.
Build the Lab Computer Yourself
The rented computer is part of the lab, so I show every step of it. You can rent the same kind of computer and run the same schedule.
Which computer you see. Every recording comes from the computer that measured this lesson's numbers. No recording and no login happened during a timed run. Steps 5 and 6 were recorded twice: the first recording of each was too short for the screen, and its top lines scrolled away. Both steps are safe to repeat, so I ran each again on the same computer. Before step 7, I also ran two short test runs of three seconds, to check the run script worked. I deleted their files, and no number in this lesson comes from them.
What you need first. An AWS account, the AWS command line tool (aws) set up with your keys, and ssh, scp, rsync and curl. All the steps live in one file, scripts/labs/serving/fb_files/fb_aws_steps.sh. You run it from the scripts/labs/serving folder, one step at a time: bash fb_files/fb_aws_steps.sh check, then access, and so on. Every code block below is copied word for word from that file.
The blocks use a few names that the file sets at its top. If you paste the blocks by hand, run these lines first, from the scripts/labs/serving folder. All of them are copied from the file, except HERE=$PWD. The file works out that folder from its own location, which a pasted line cannot do.
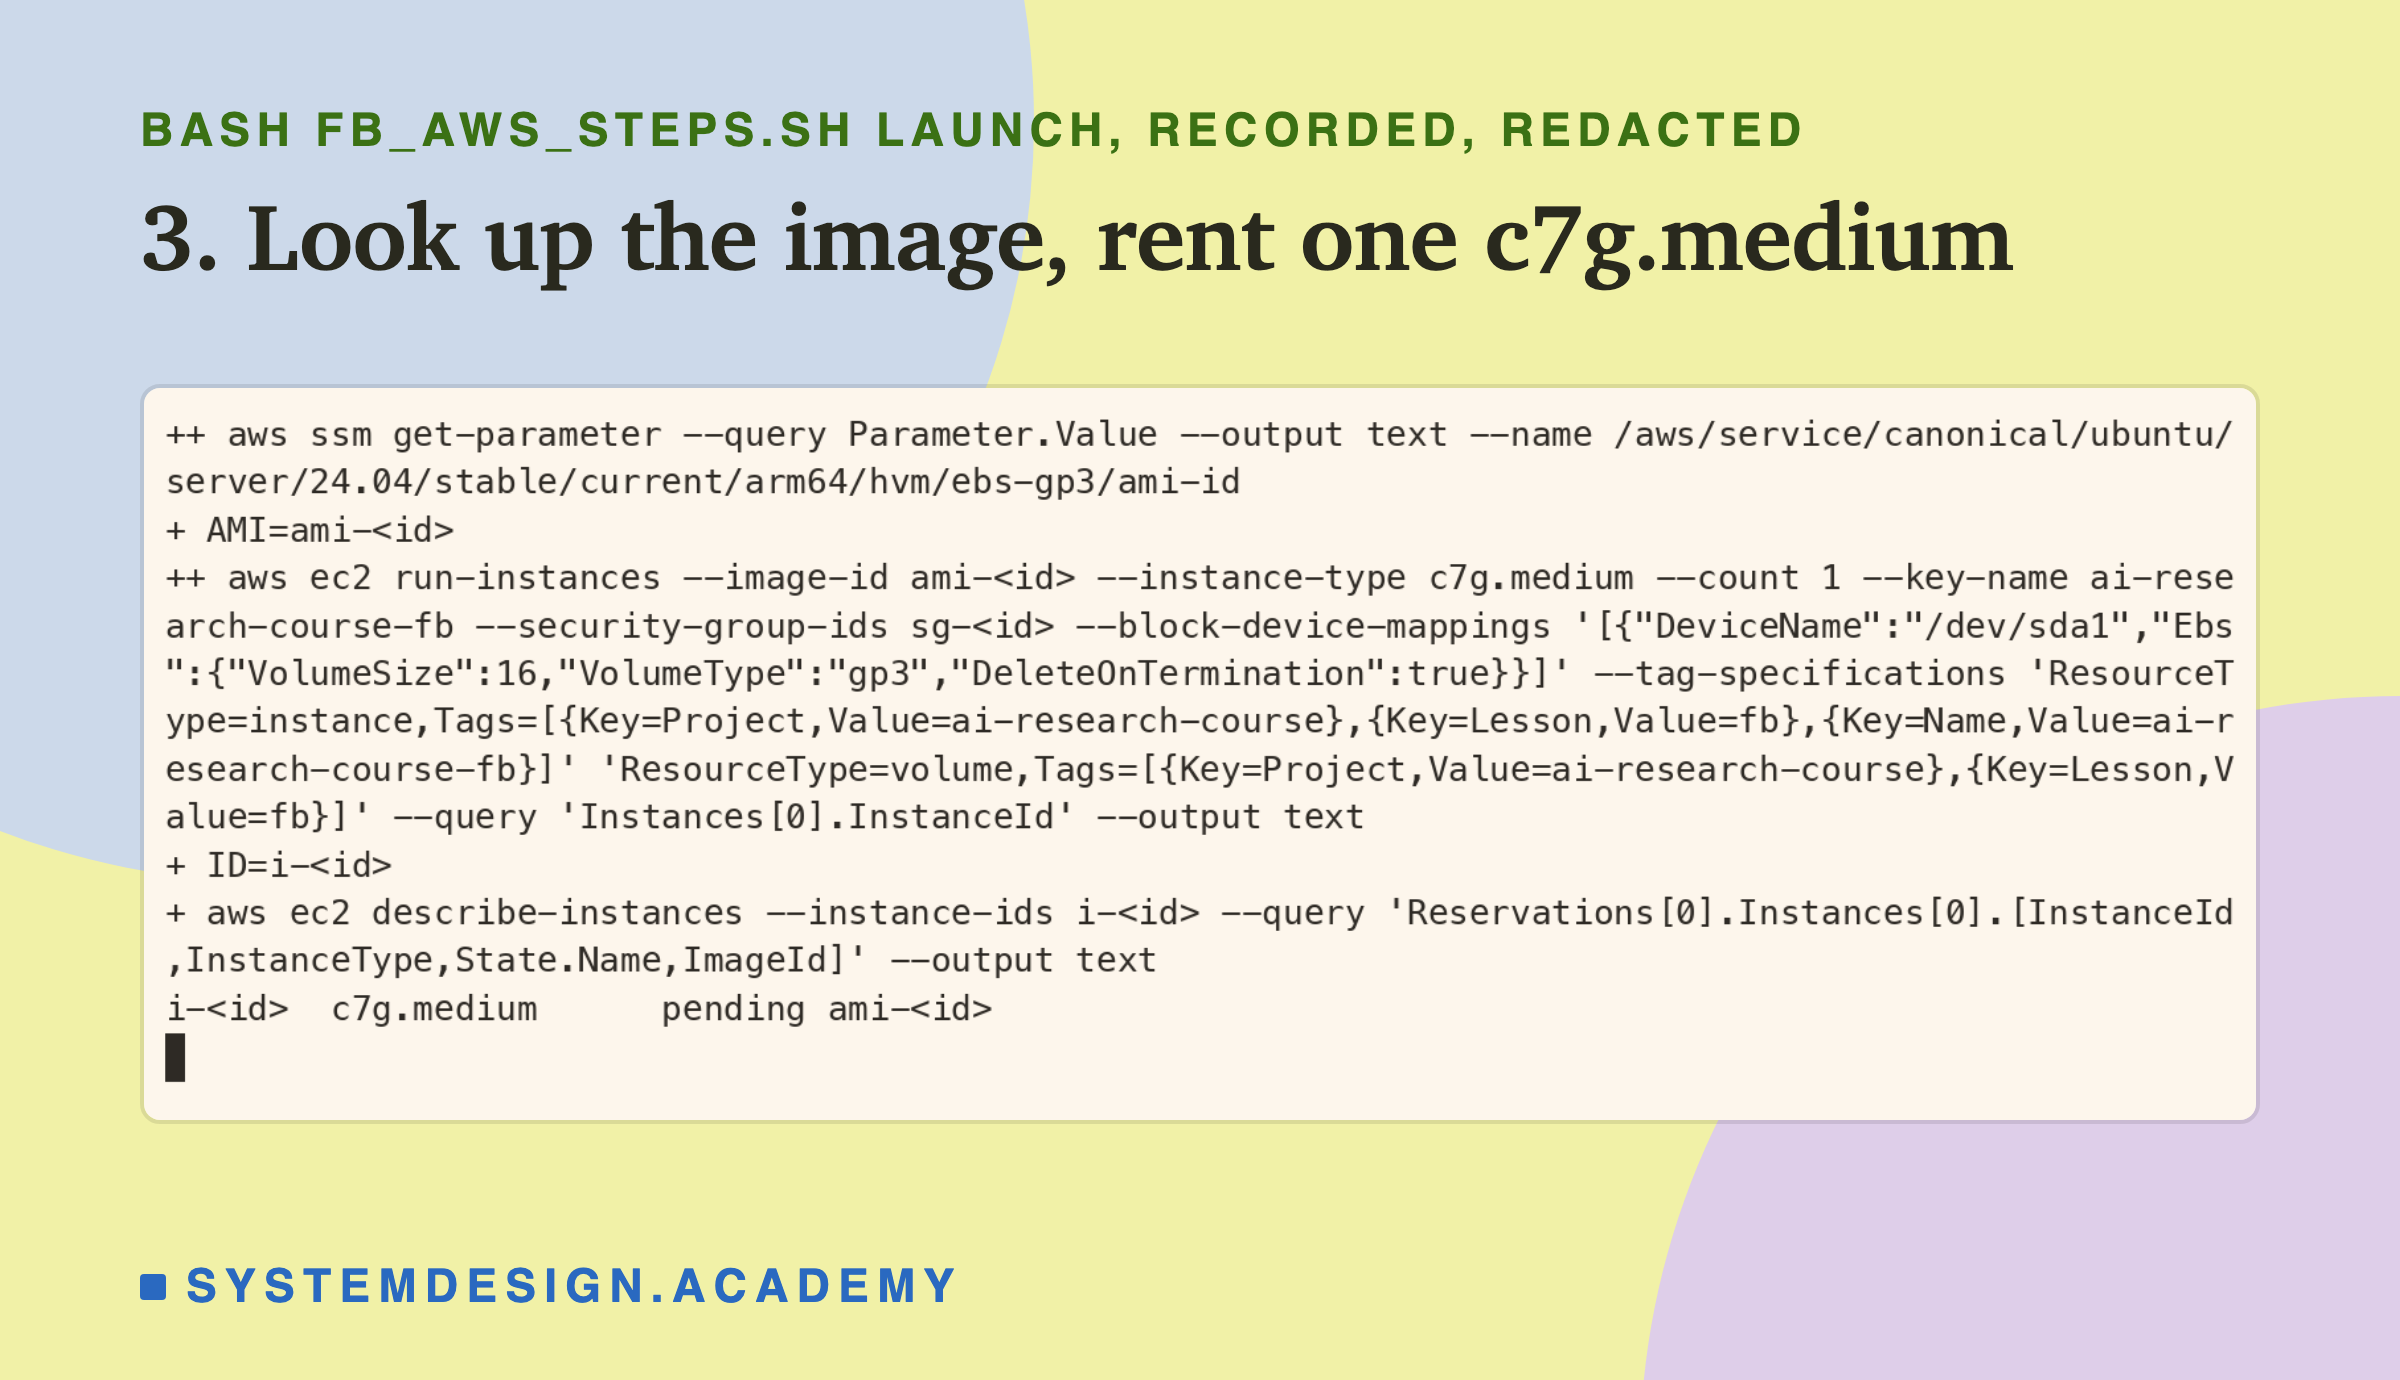
Steps 1 to 3: Check, Lock the Door, Rent the Computer
Step 1: is any other course computer running? My account allows one computer of this kind at a time, and another lesson may be using it. So the first command counts the course's computers that are not yet deleted. It must print 0.
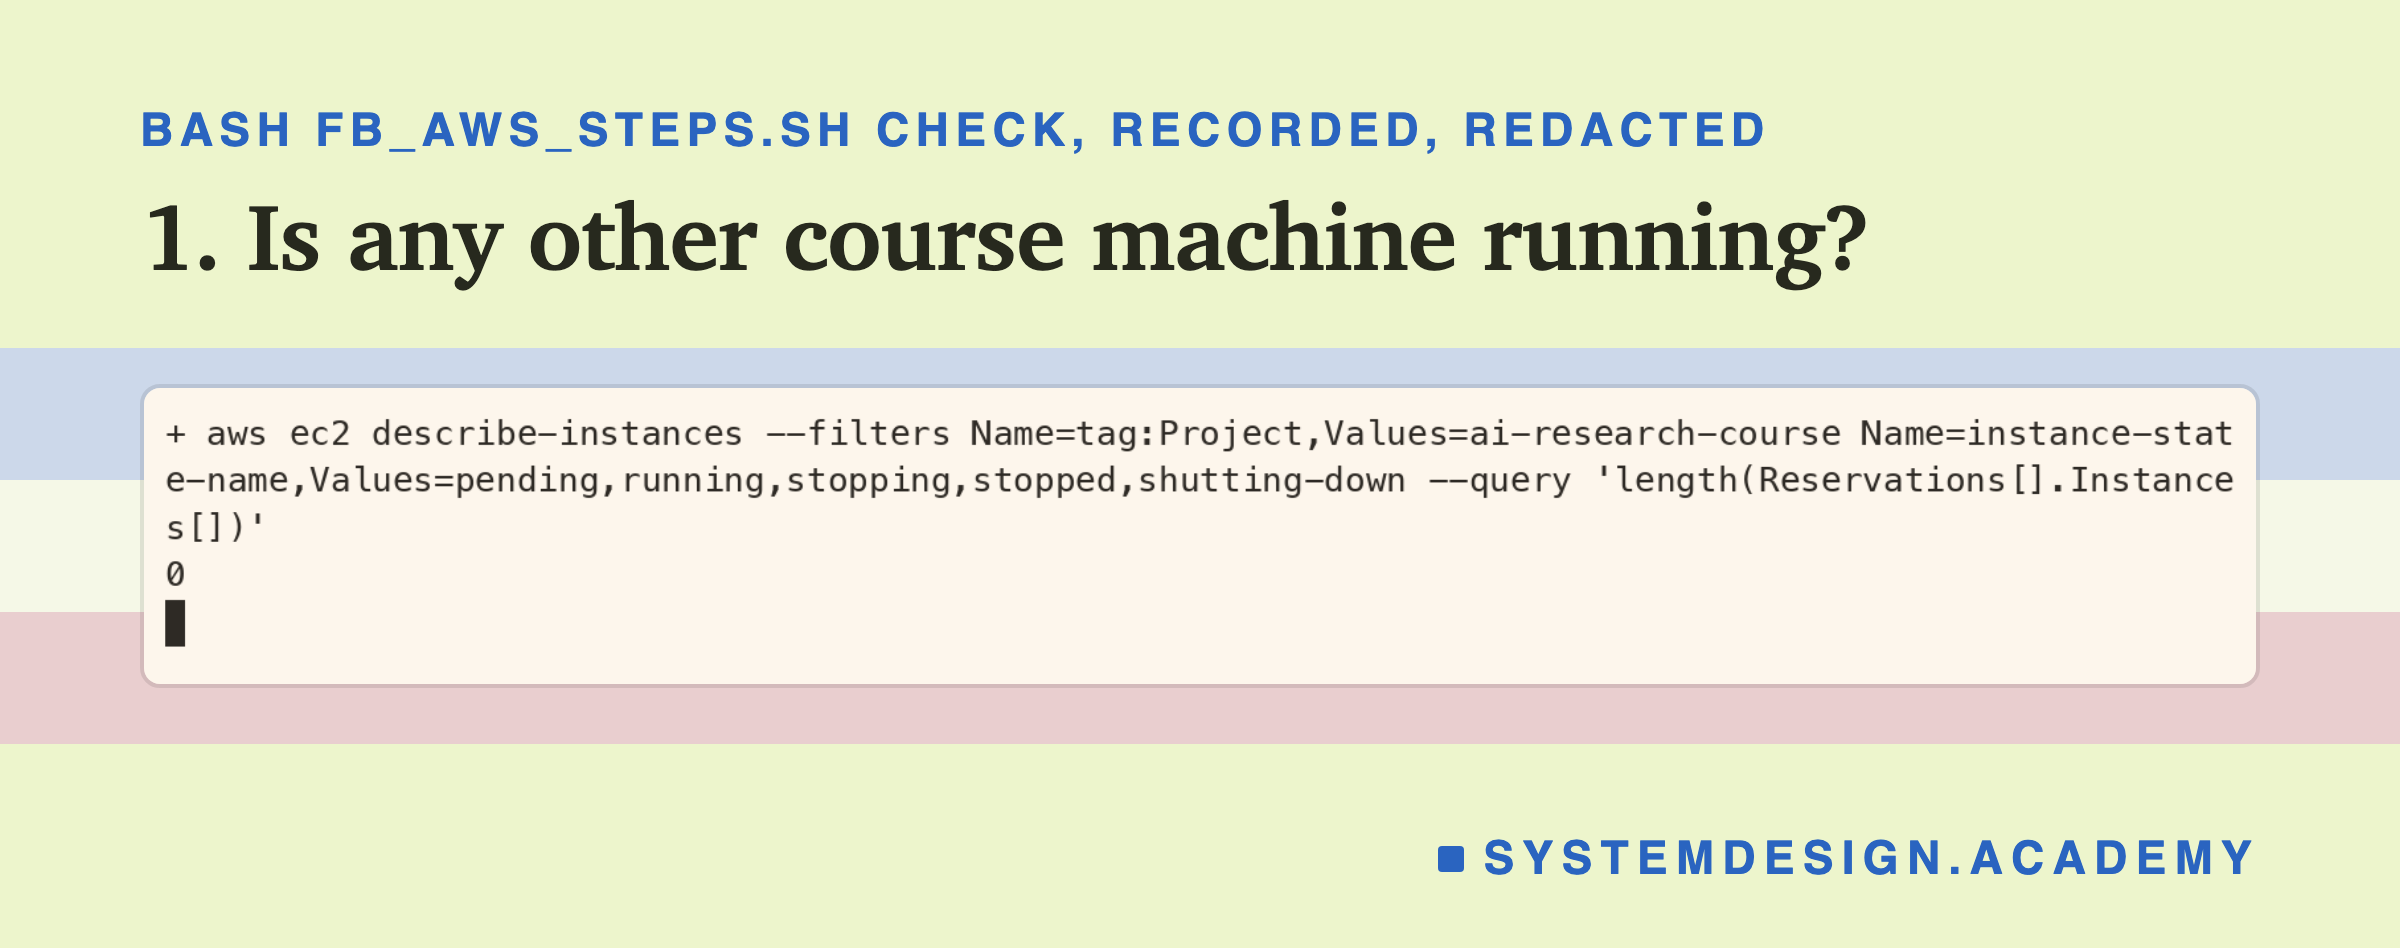
The recording shows the command and its answer, 0, so no other course computer was alive. This is the command:
  aws ec2 describe-instances --filters "Name=tag:Project,Values=ai-research-course" \
    "Name=instance-state-name,Values=pending,running,stopping,stopped,shutting-down" \
    --query "length(Reservations[].Instances[])"
Step 2: a key and a locked door. A key pair is how you prove to the computer that you are allowed in. Amazon keeps one half, and you keep the other half in a file only you can read. A security group is a door rule. Mine opens only door 22, the one that SSH (the safe remote login) uses, and only to my own address. Both get tags, small labels that say which project and lesson they belong to.
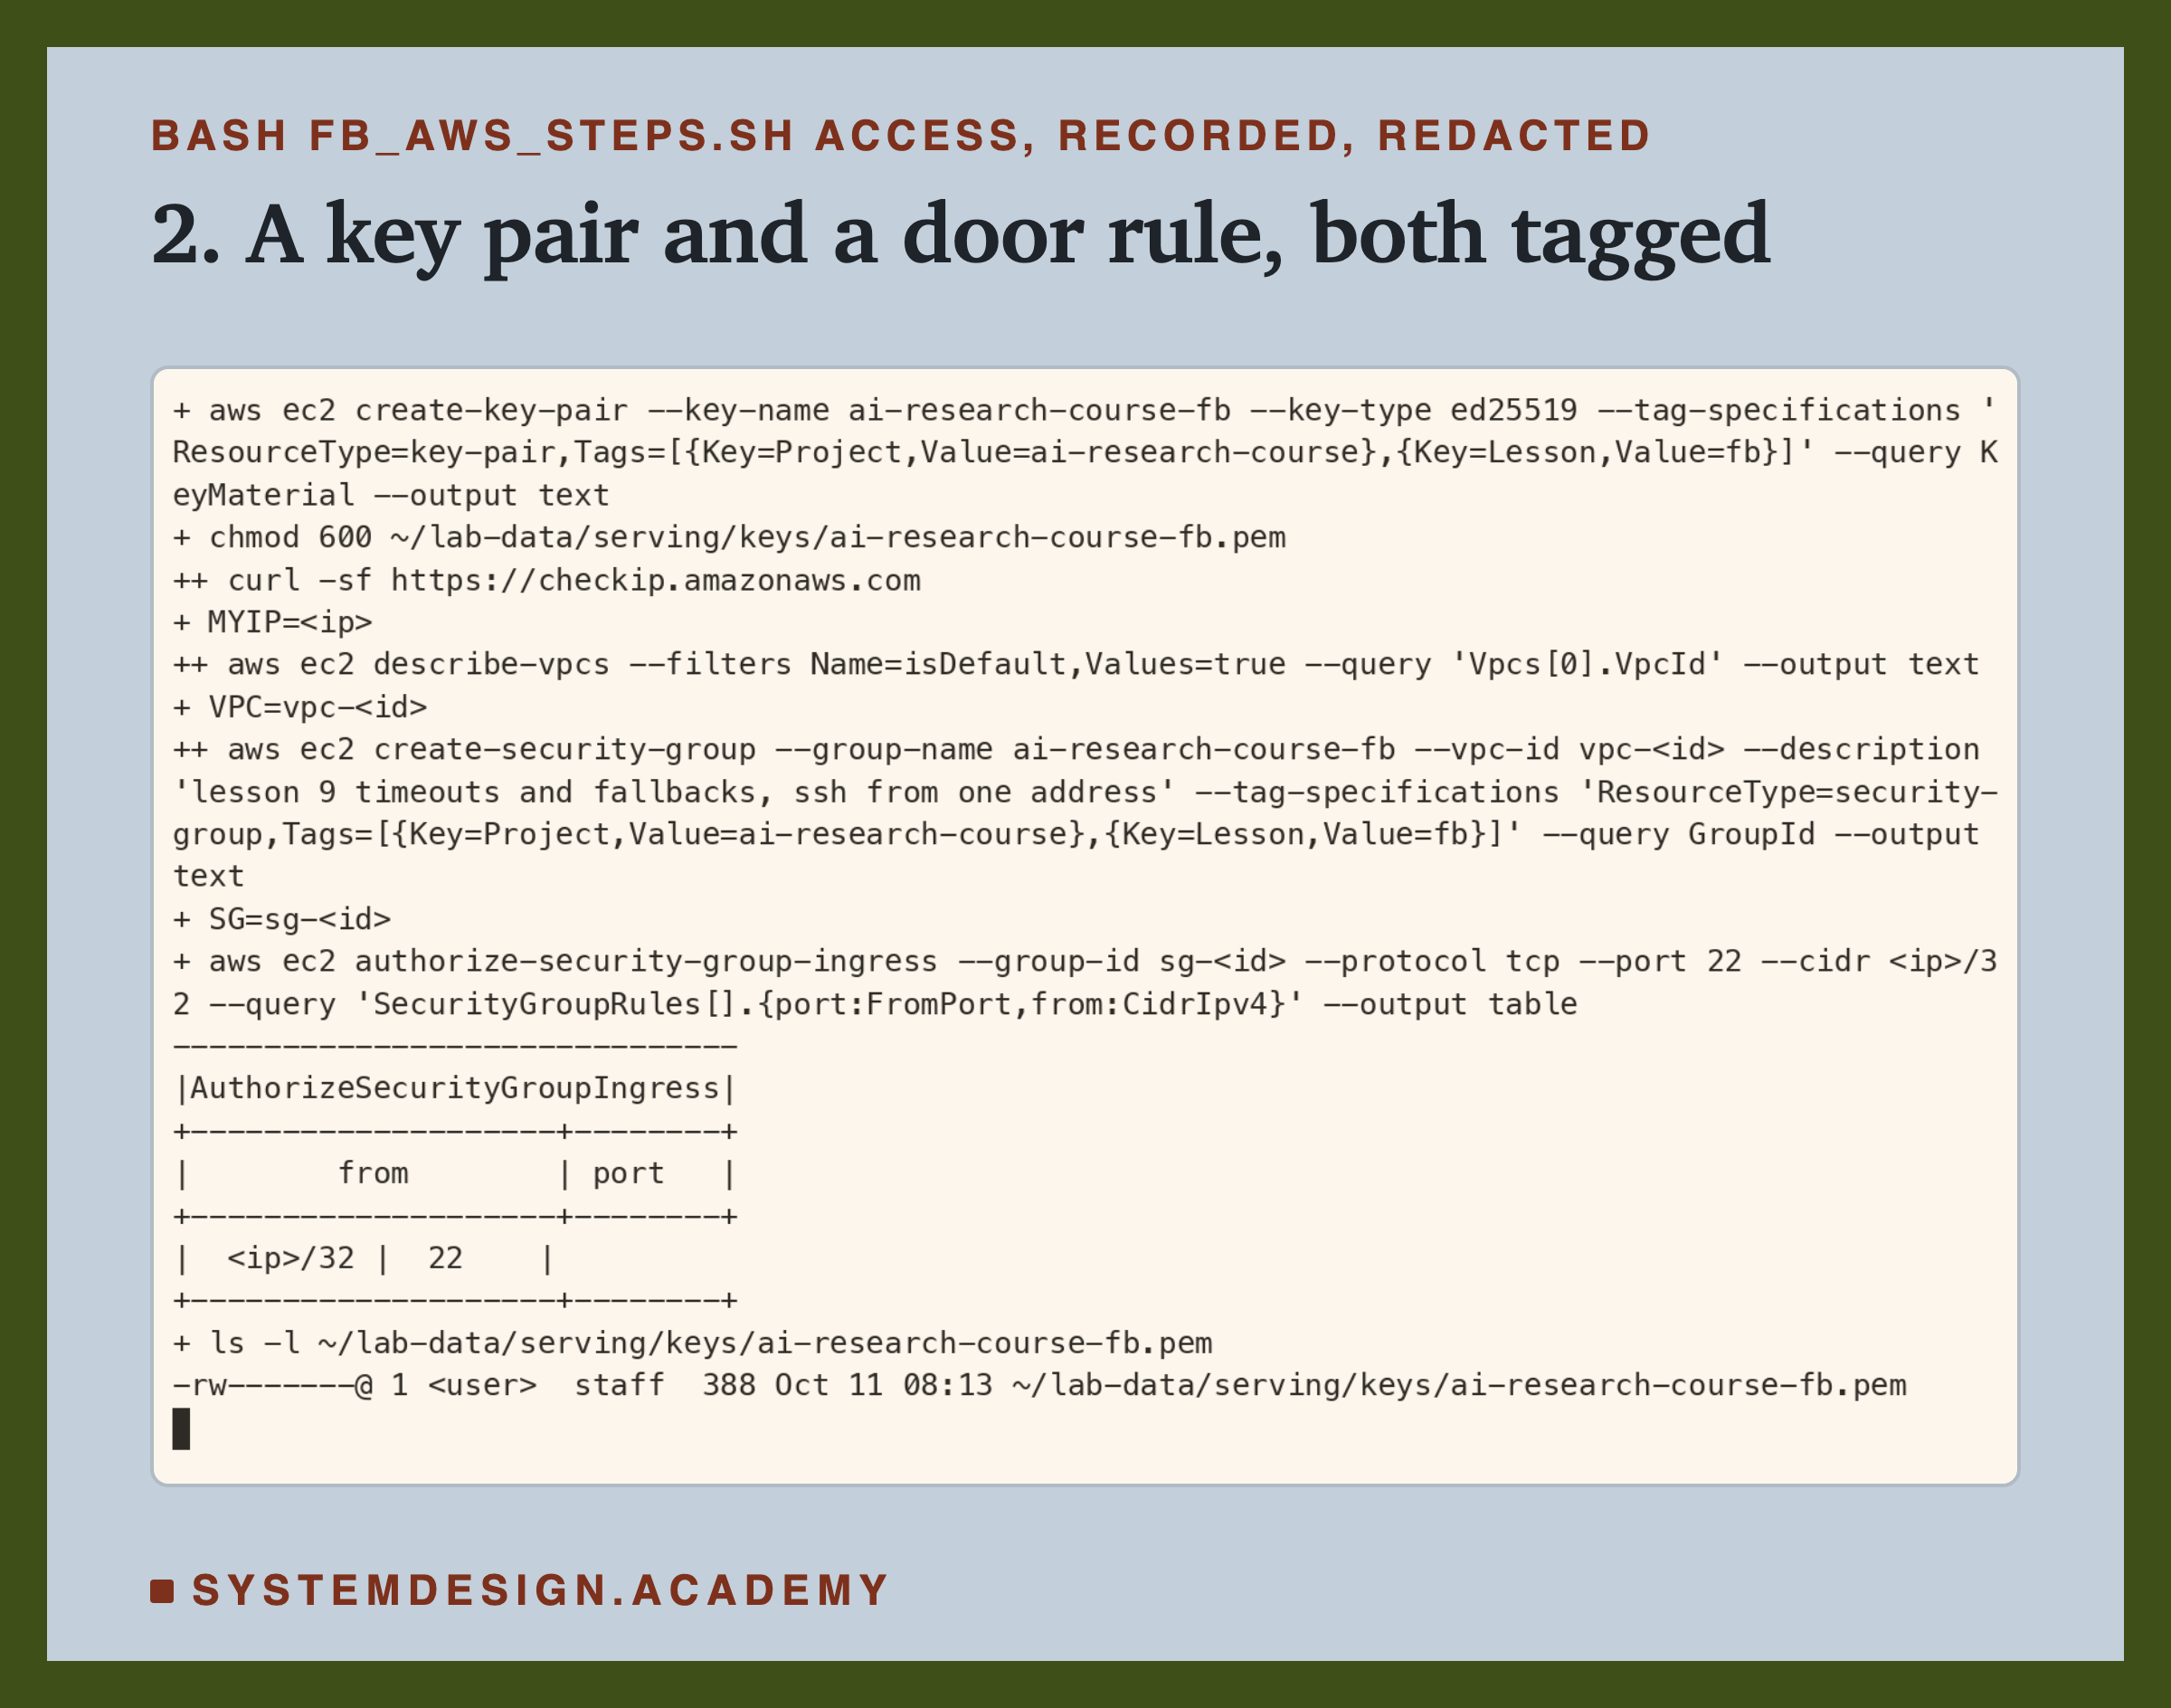
The key went straight into the file and was never printed, and the door rule names only my own address. These are the commands:
  aws ec2 create-key-pair --key-name ai-research-course-fb --key-type ed25519 \
    --tag-specifications "ResourceType=key-pair,Tags=[{Key=Project,Value=ai-research-course},{Key=Lesson,Value=fb}]" \
    --query KeyMaterial --output text > ~/lab-data/serving/keys/ai-research-course-fb.pem
  chmod 600 ~/lab-data/serving/keys/ai-research-course-fb.pem
  MYIP=$(curl -sf https://checkip.amazonaws.com)
  VPC=$(aws ec2 describe-vpcs --filters Name=isDefault,Values=true --query "Vpcs[0].VpcId" --output text)
  SG=$(aws ec2 create-security-group --group-name ai-research-course-fb --vpc-id "$VPC" \
    --description "lesson 9 timeouts and fallbacks, ssh from one address" \
    --tag-specifications "ResourceType=security-group,Tags=[{Key=Project,Value=ai-research-course},{Key=Lesson,Value=fb}]" \
    --query GroupId --output text)
  aws ec2 authorize-security-group-ingress --group-id "$SG" --protocol tcp --port 22 --cidr "$MYIP/32" \
    --query "SecurityGroupRules[].{port:FromPort,from:CidrIpv4}" --output table
  echo "$SG" > "$STATE/sg"
Steps 4 to 7: Wait, Set Up, Look, Start
Step 4: wait until it runs. The AWS tool waits until the computer is running. Then the script reads its public address into IP, and tries SSH every five seconds until the computer answers.
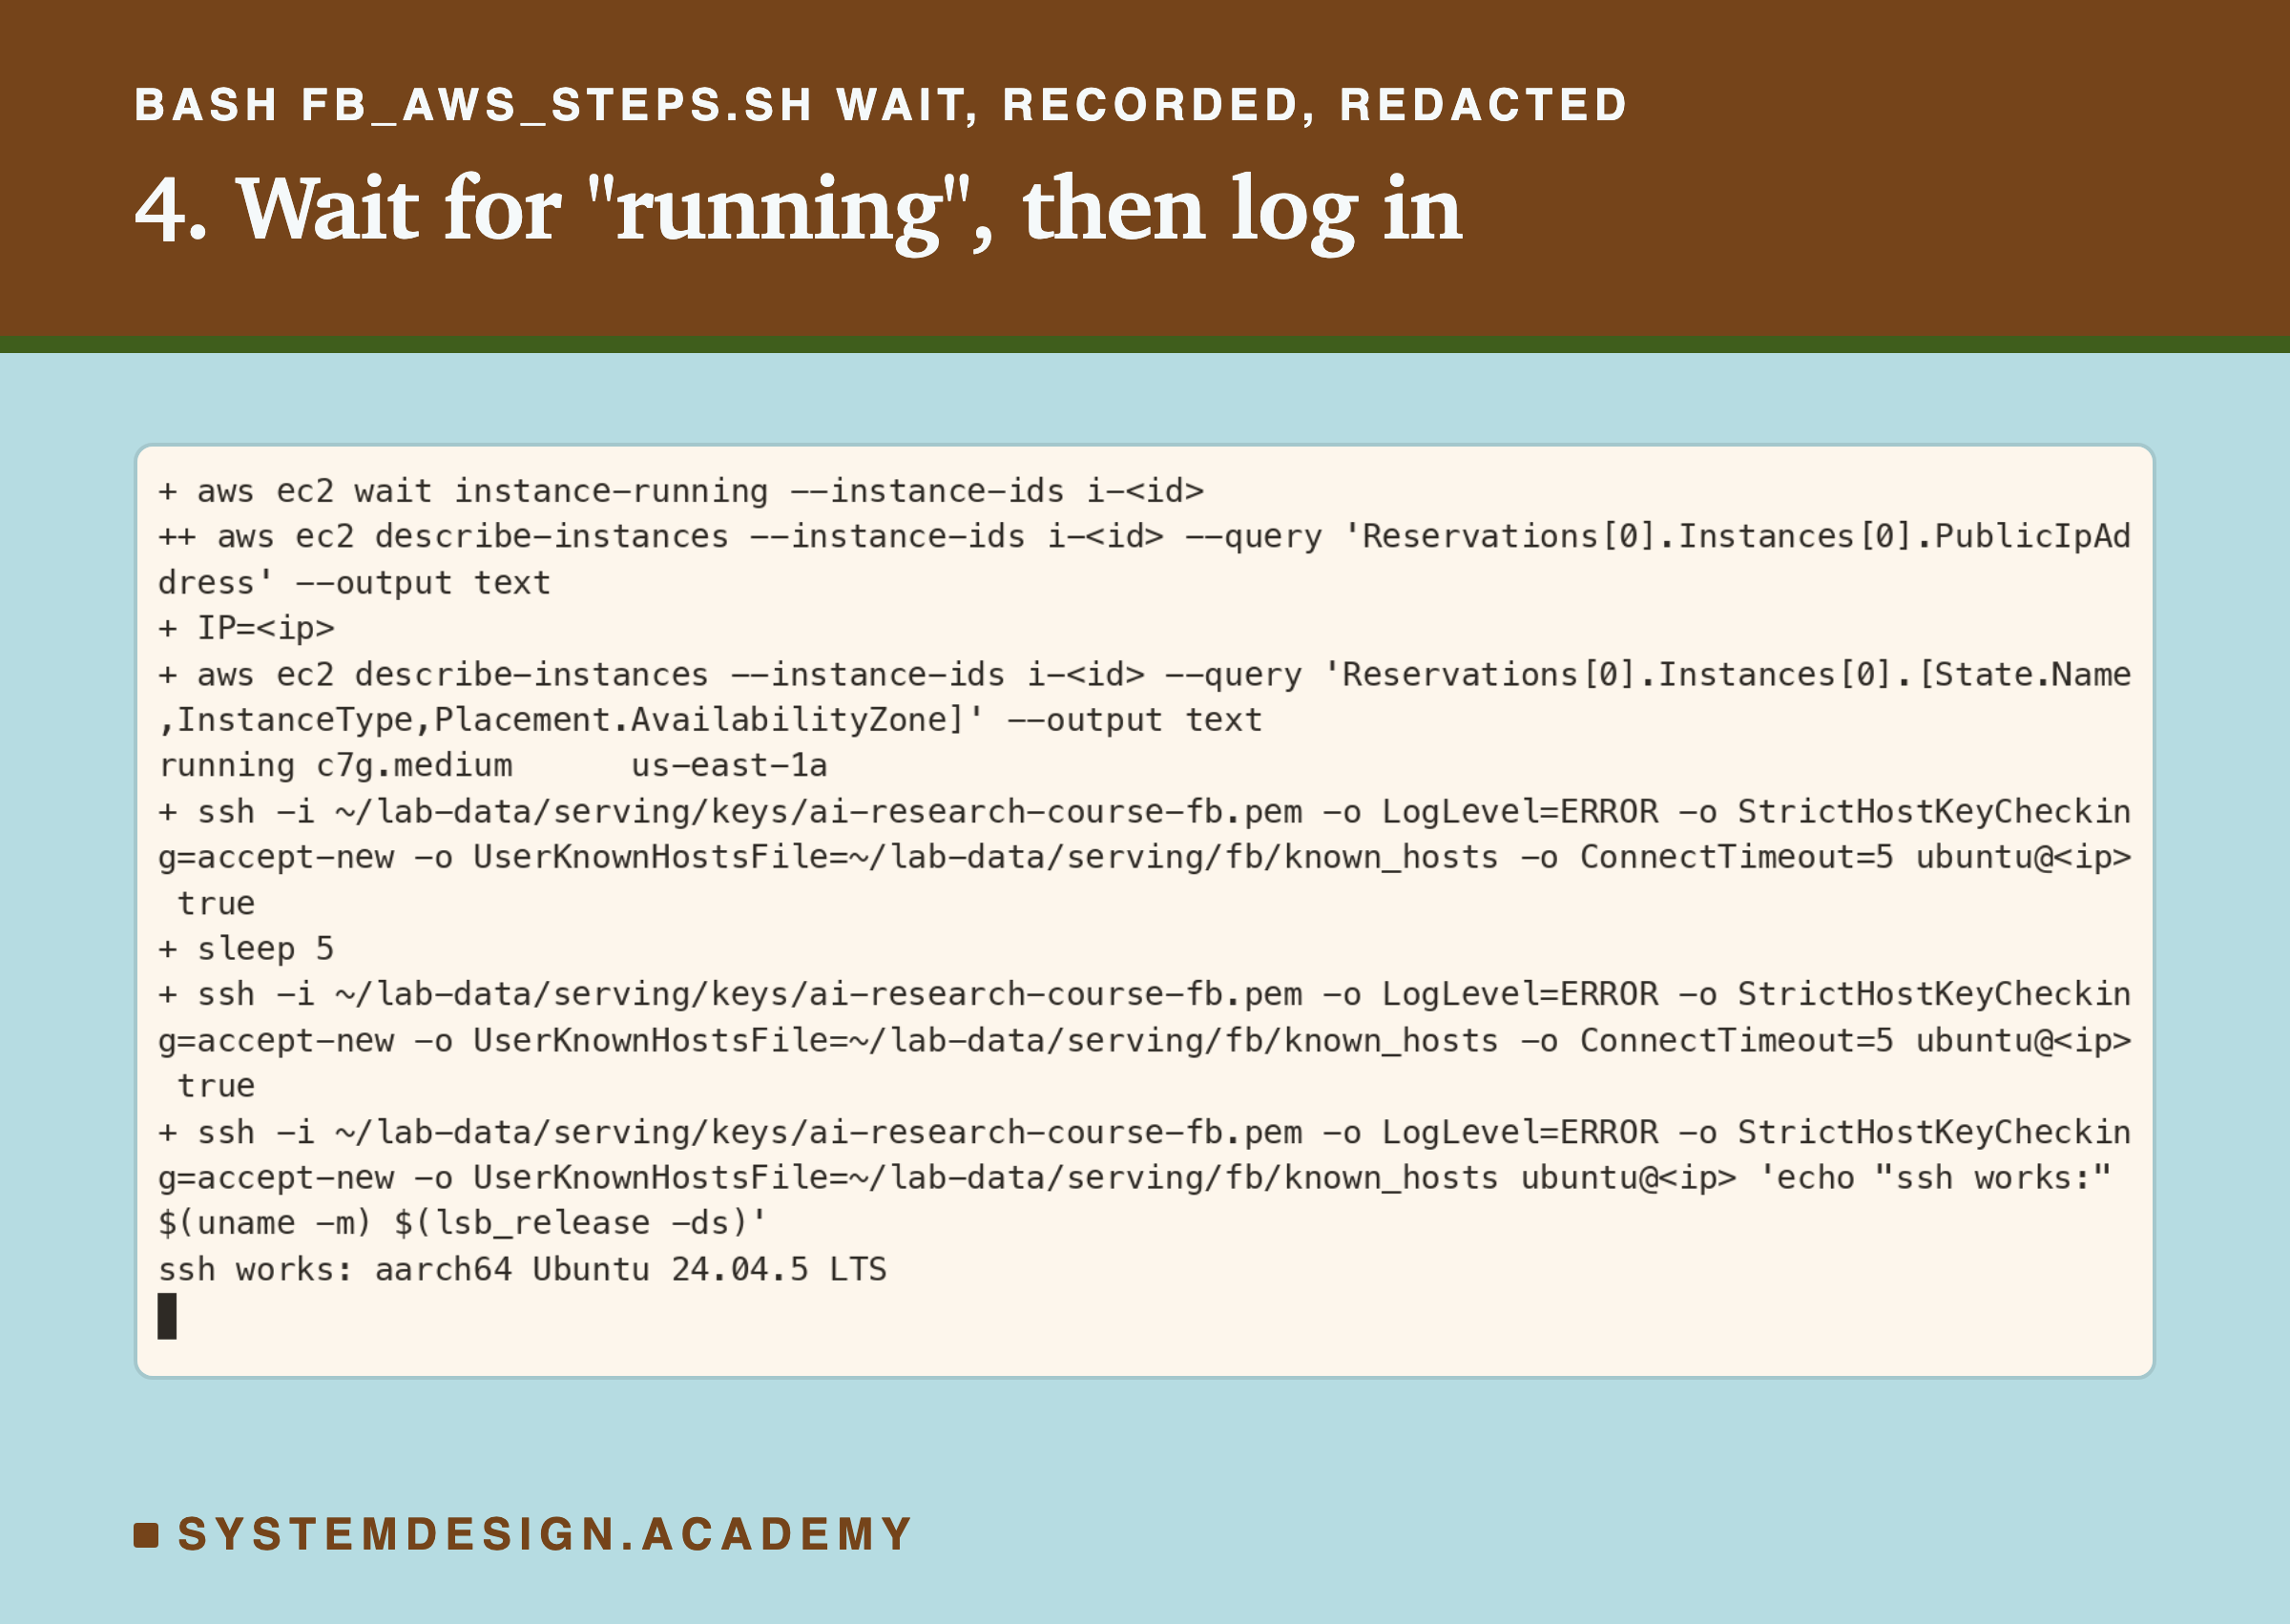
The first SSH try failed because the computer was still starting, and the second answered. These are the main commands. The last line keeps the start time, which the cost step needs:
  aws ec2 wait instance-running --instance-ids "$ID"
  IP=$(aws ec2 describe-instances --instance-ids "$ID" \
    --query "Reservations[0].Instances[0].PublicIpAddress" --output text)
  until ssh -i ~/lab-data/serving/keys/ai-research-course-fb.pem "${SSHO[@]}" -o ConnectTimeout=5 \
    ubuntu@"$IP" true 2>/dev/null; do sleep 5; done
  echo "$IP" > "$STATE/ip"
  aws ec2 describe-instances --instance-ids "$ID" --query "Reservations[0].Instances[0].LaunchTime" \
    --output text > "$STATE/launched"
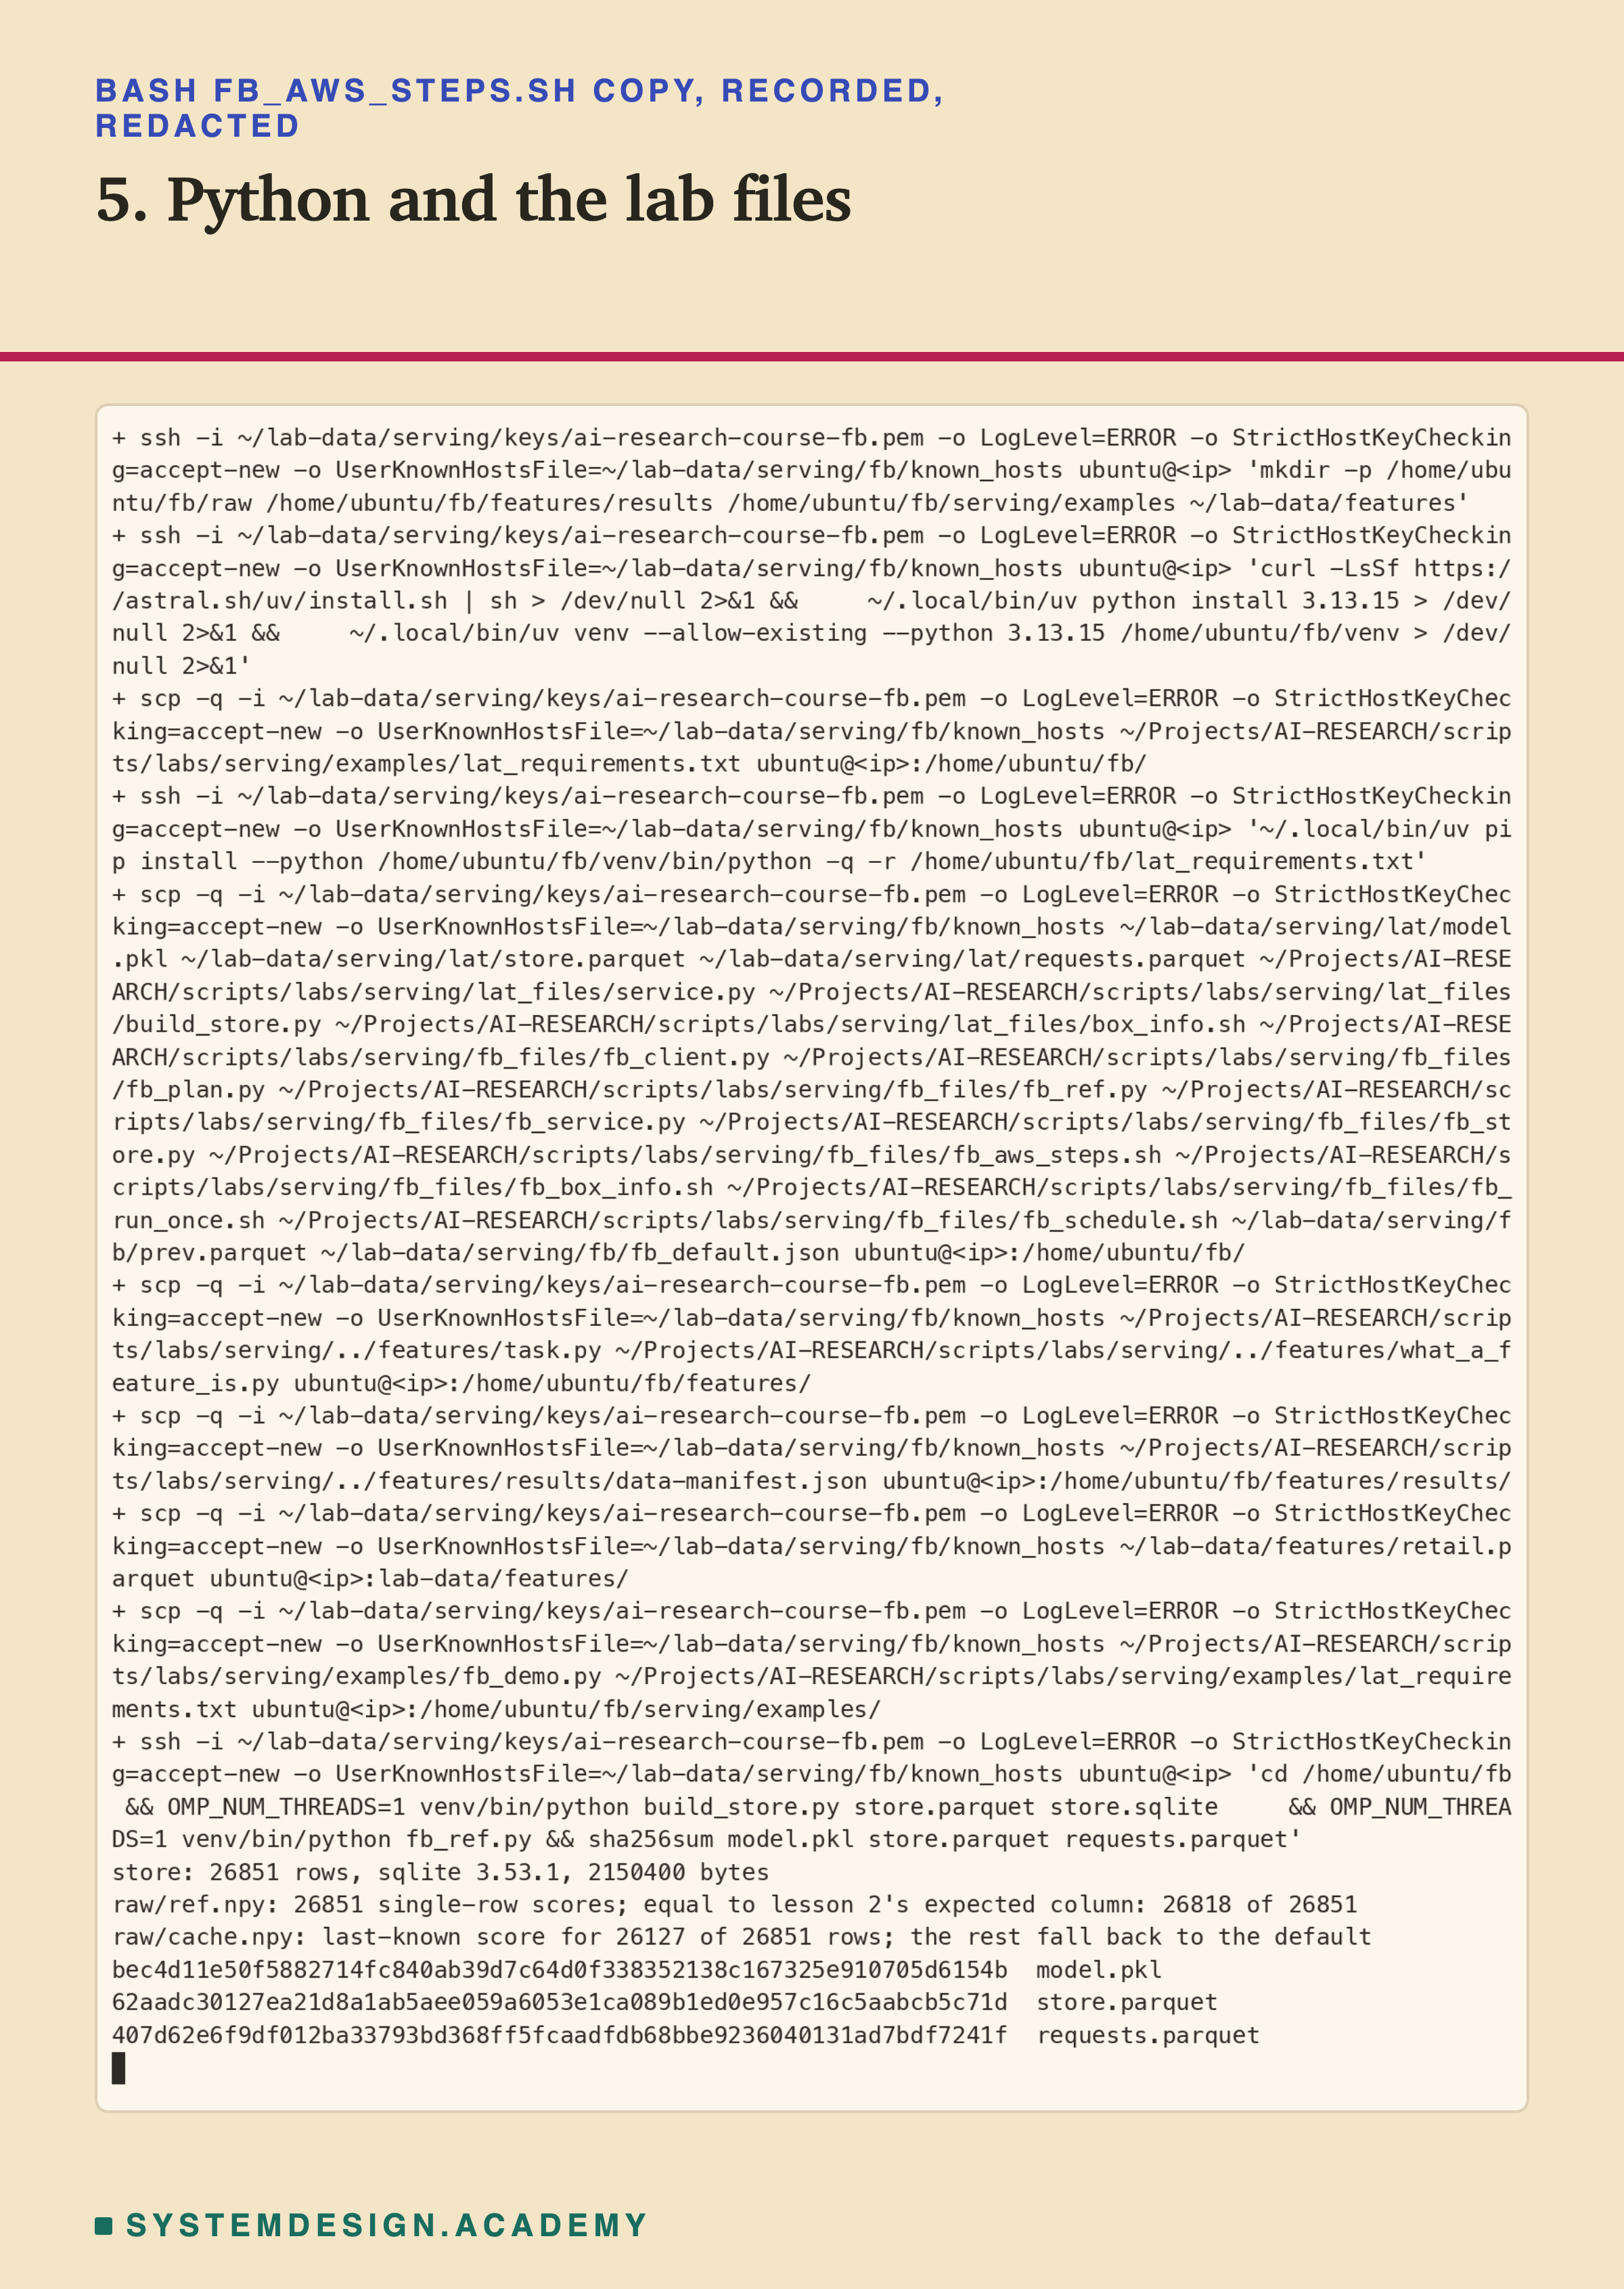
Step 5: Python and the lab files. The computer gets the same Python, 3.13.15, and the same tool versions as lessons 2 to 8. They go into a venv, a private toolbox folder for Python, with every tool's exact version written down. uv is a fast installer that fills it.
Then scp, a copy command that works through SSH, sends the files. The last command builds the database of customer numbers. It works out the reference score for every request (the score this computer gives that row, which every answer is checked against) and the last-known score. Then it prints the files' sha256 fingerprints, which change if even one byte of a file changes.
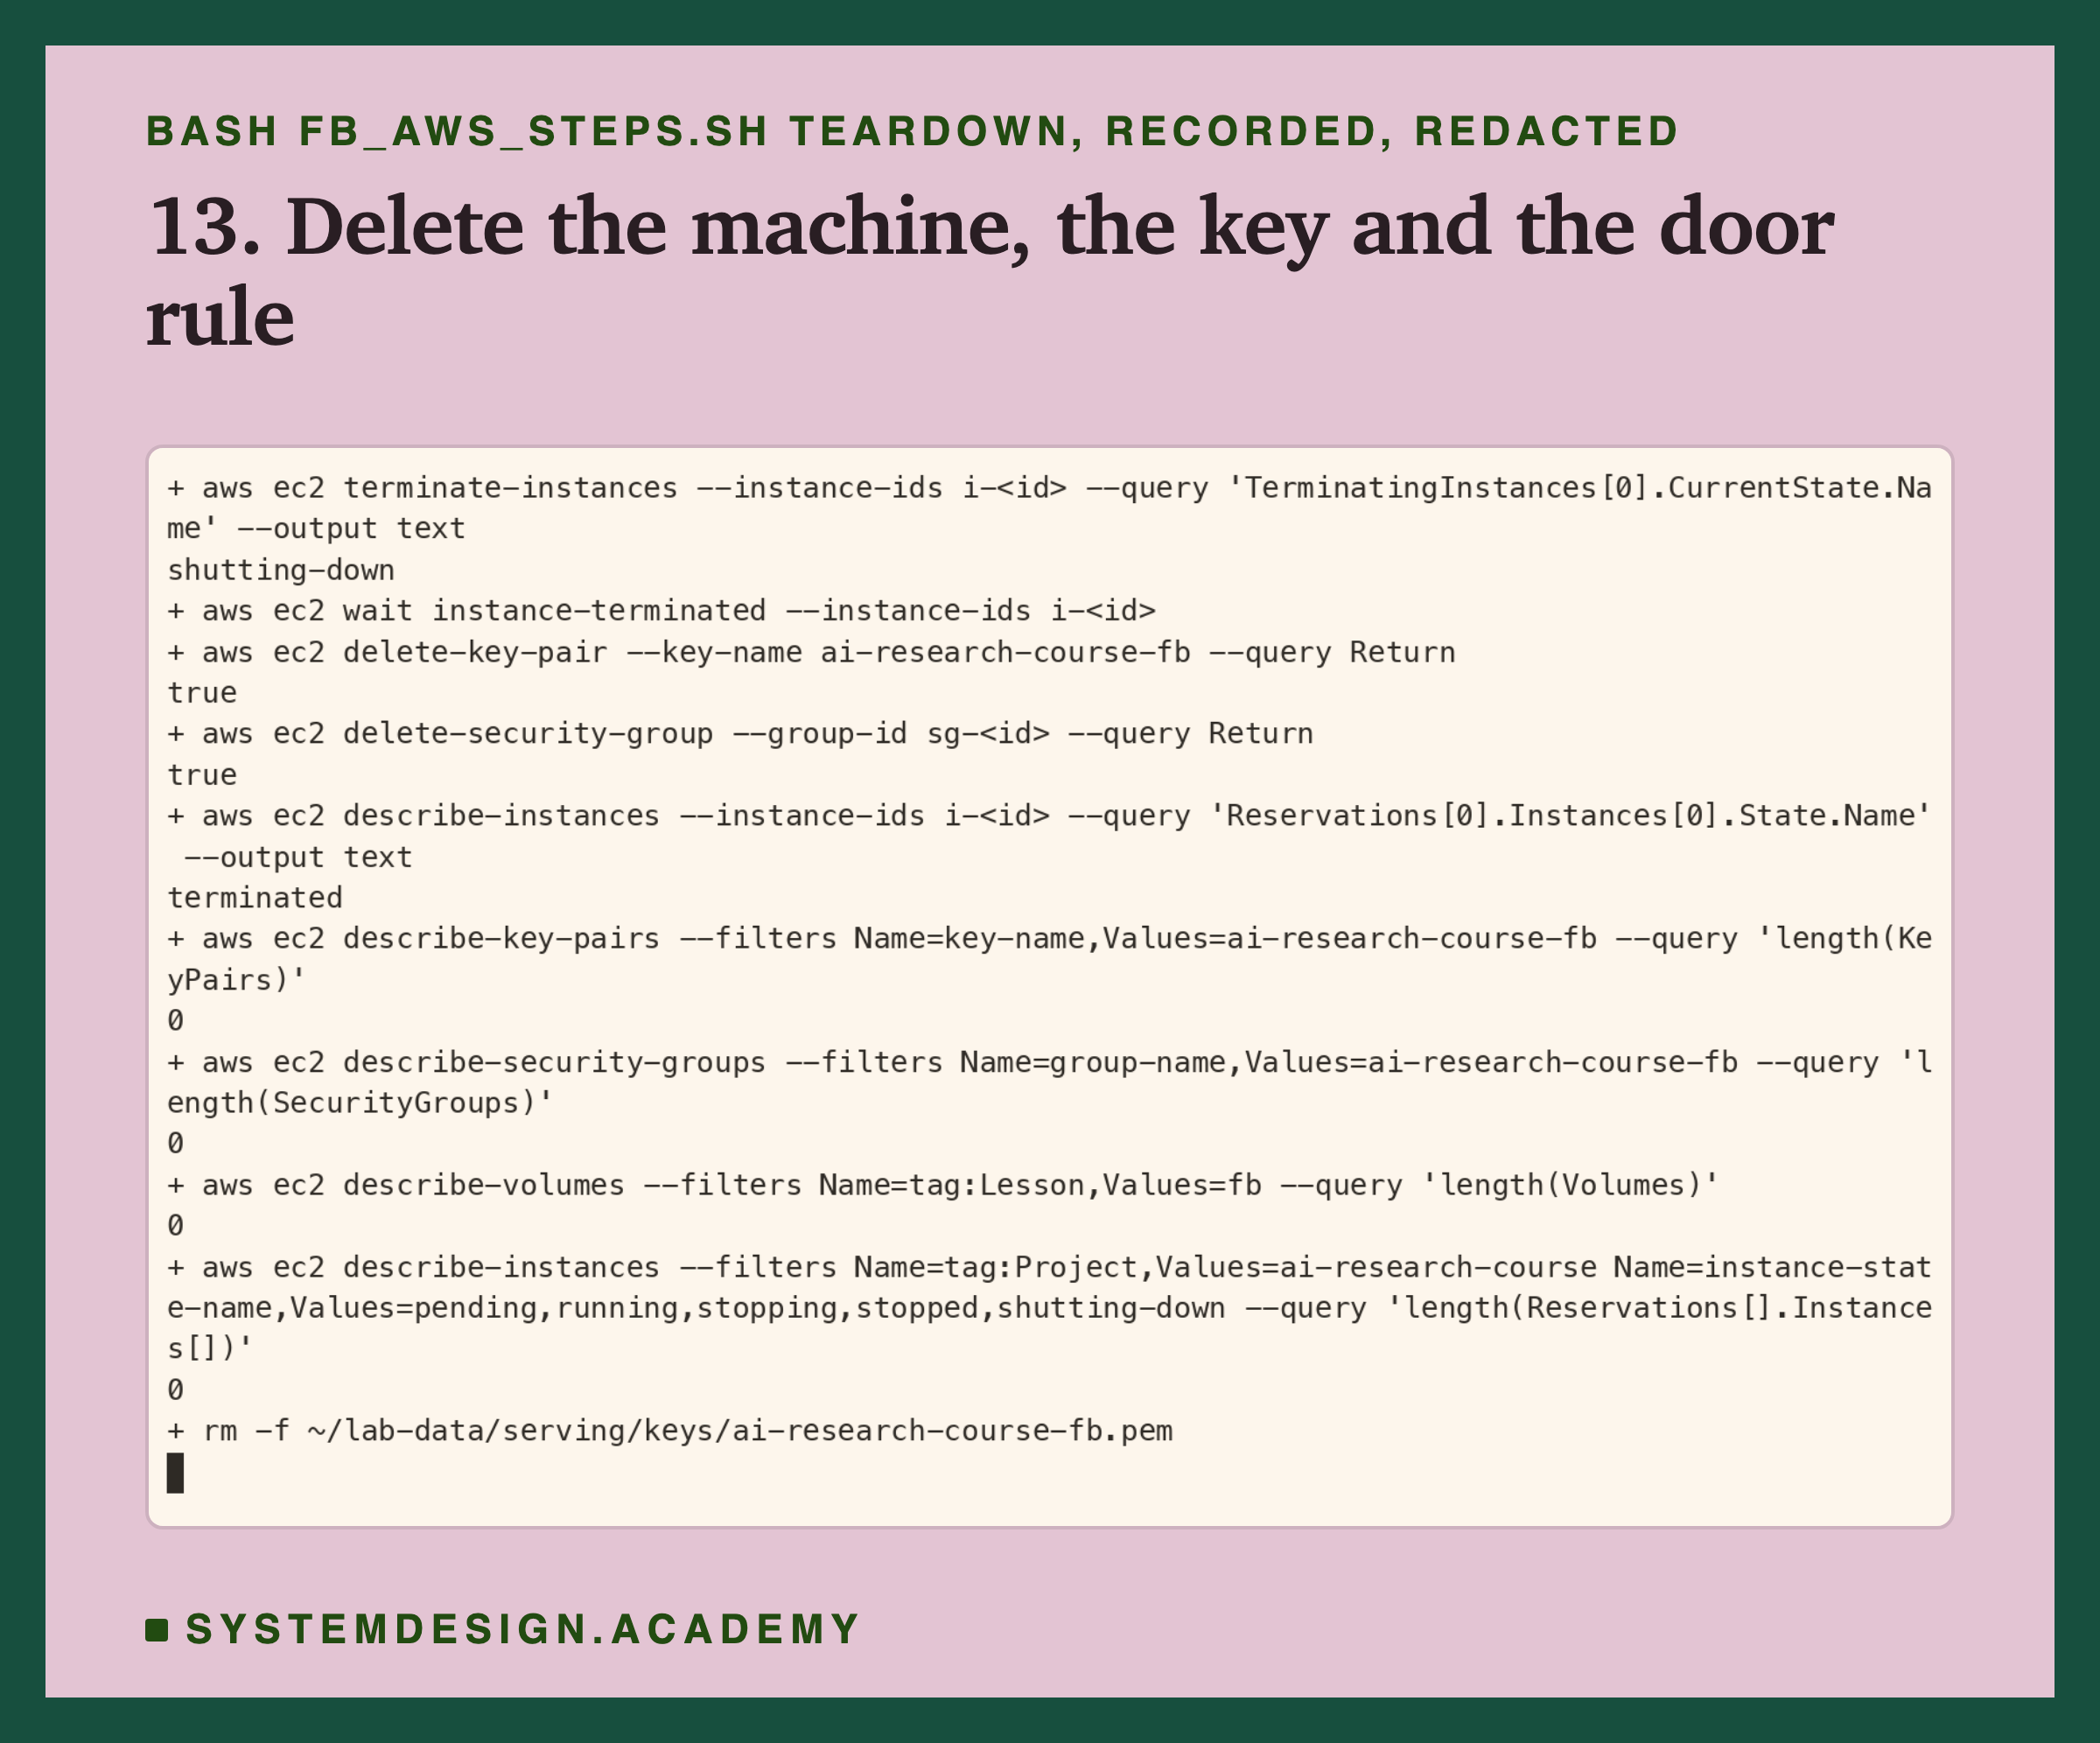
Steps 8 and 11 to 13: Watch, Demo, Bring It Home, Delete
Step 8: watch without touching. While it runs, the schedule writes one progress line to the computer's serial console after every run. The serial console is a log that Amazon keeps for the computer, and you can read it without logging in.
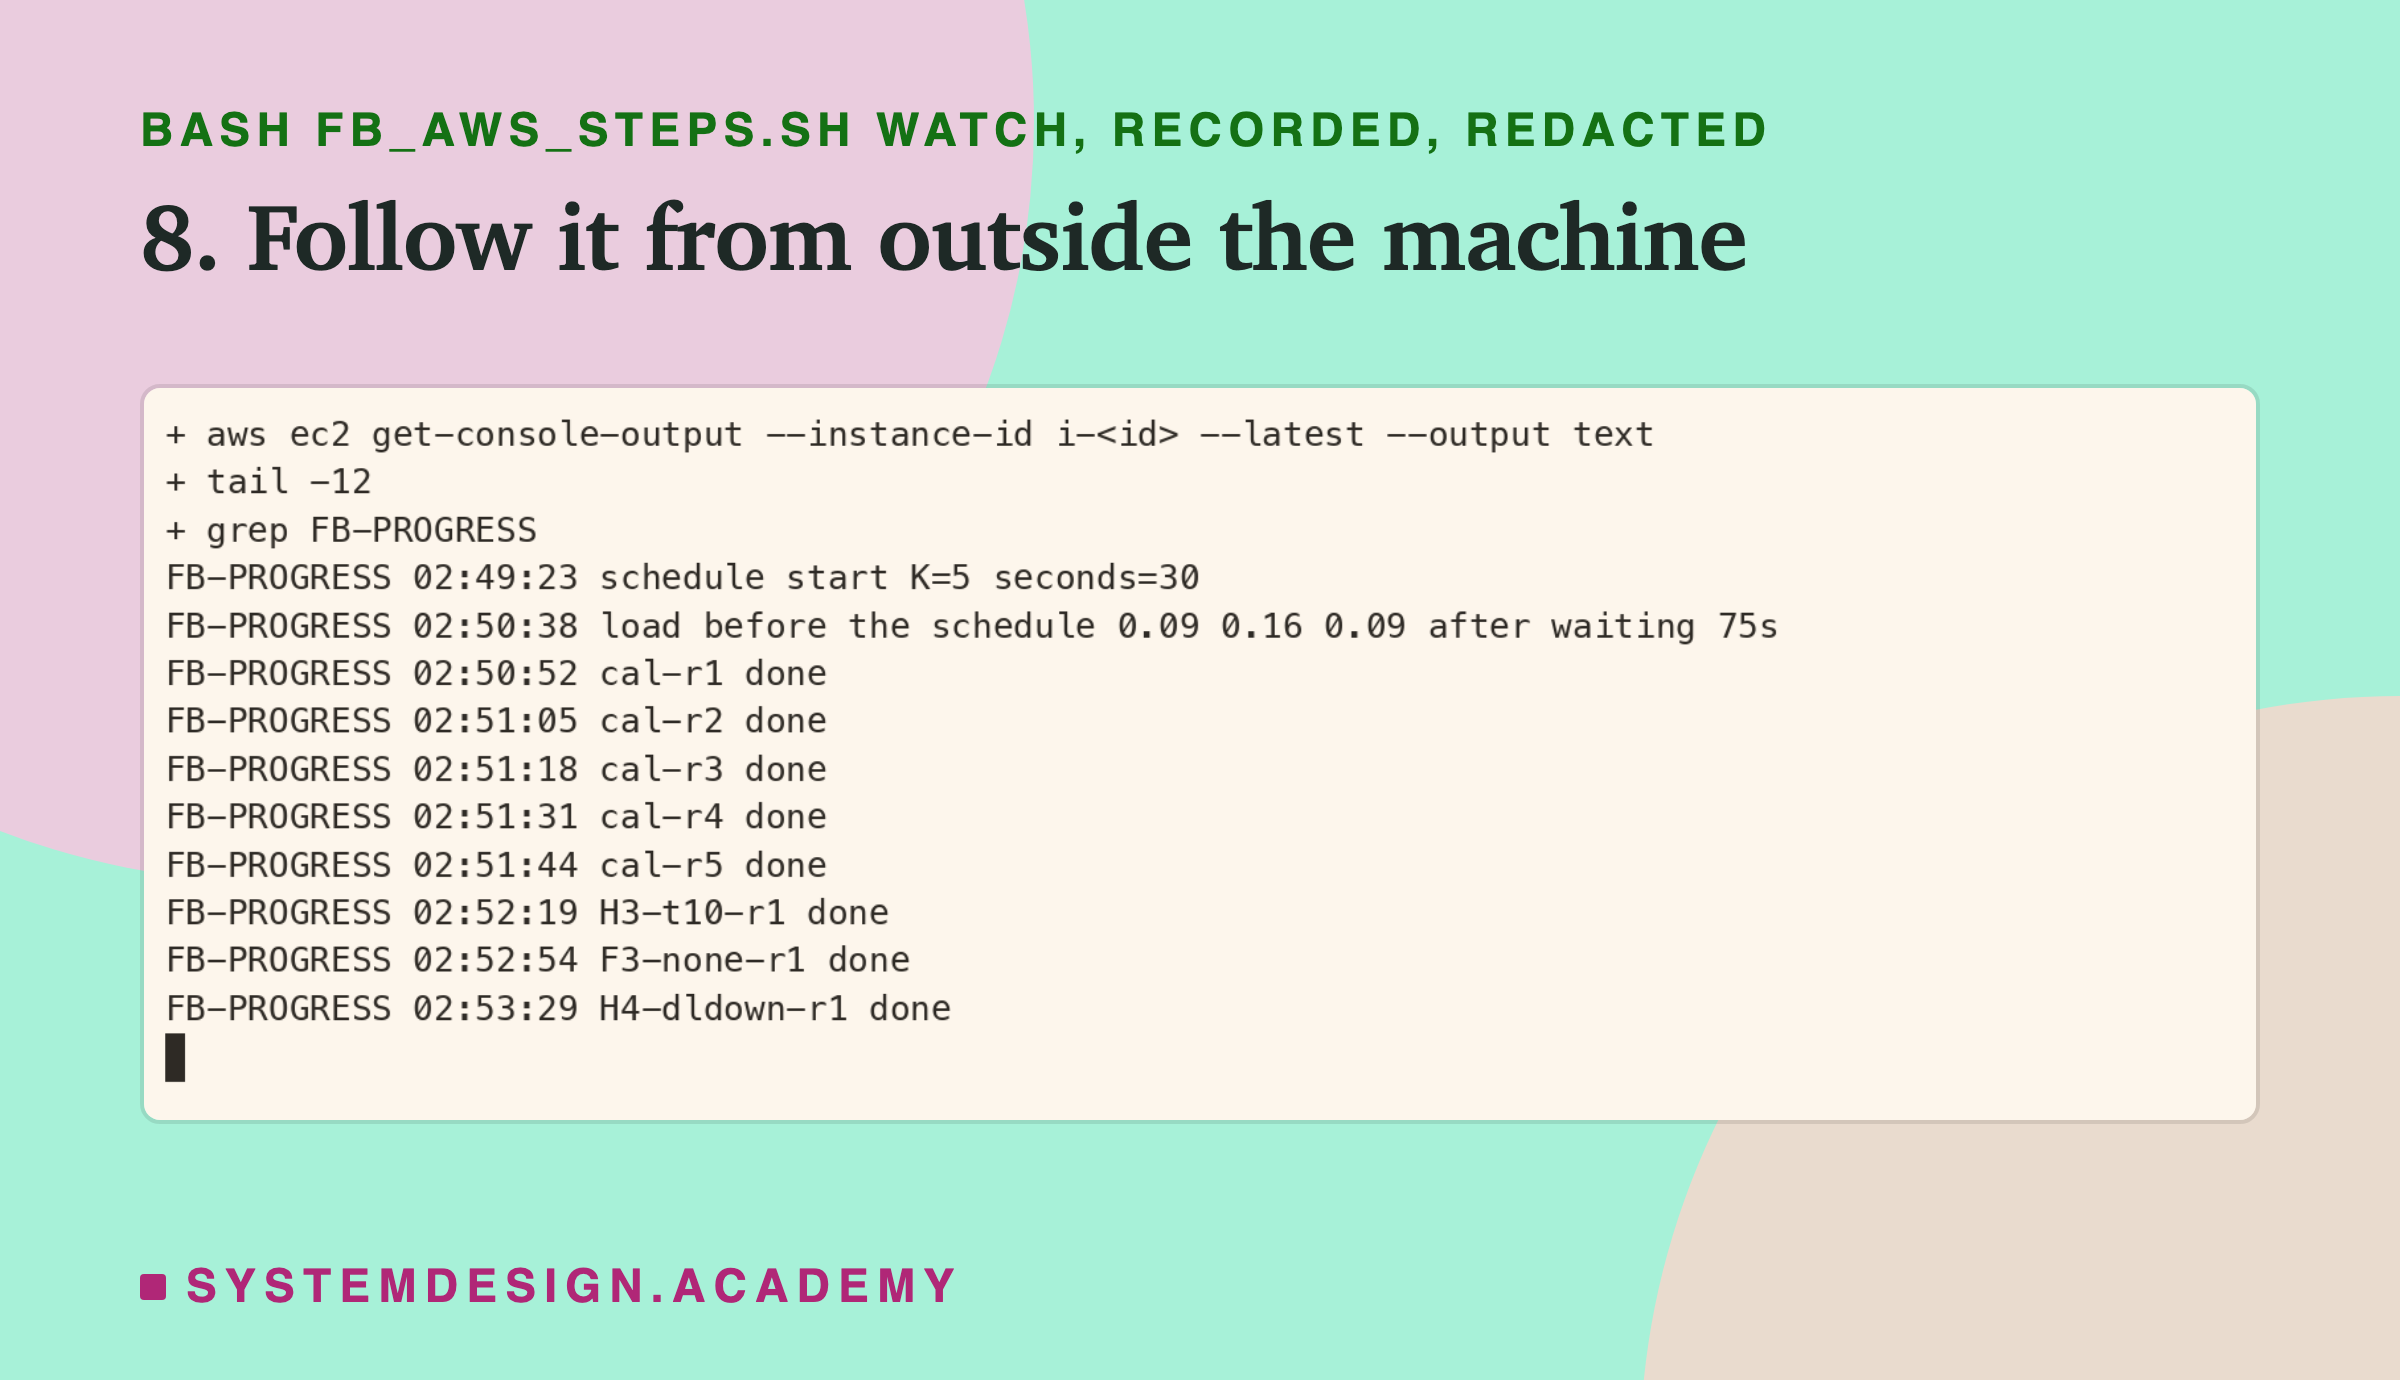
These lines came from Amazon's copy of the console while the runs went on, so the computer was never touched. This is the command:
aws ec2 get-console-output --instance-id "$ID" --latest --output text | grep FB-PROGRESS | tail -12
Step 11: the student demo, on the same computer. After the schedule, I ran the demo you will meet later, so you can see what it prints on one core.
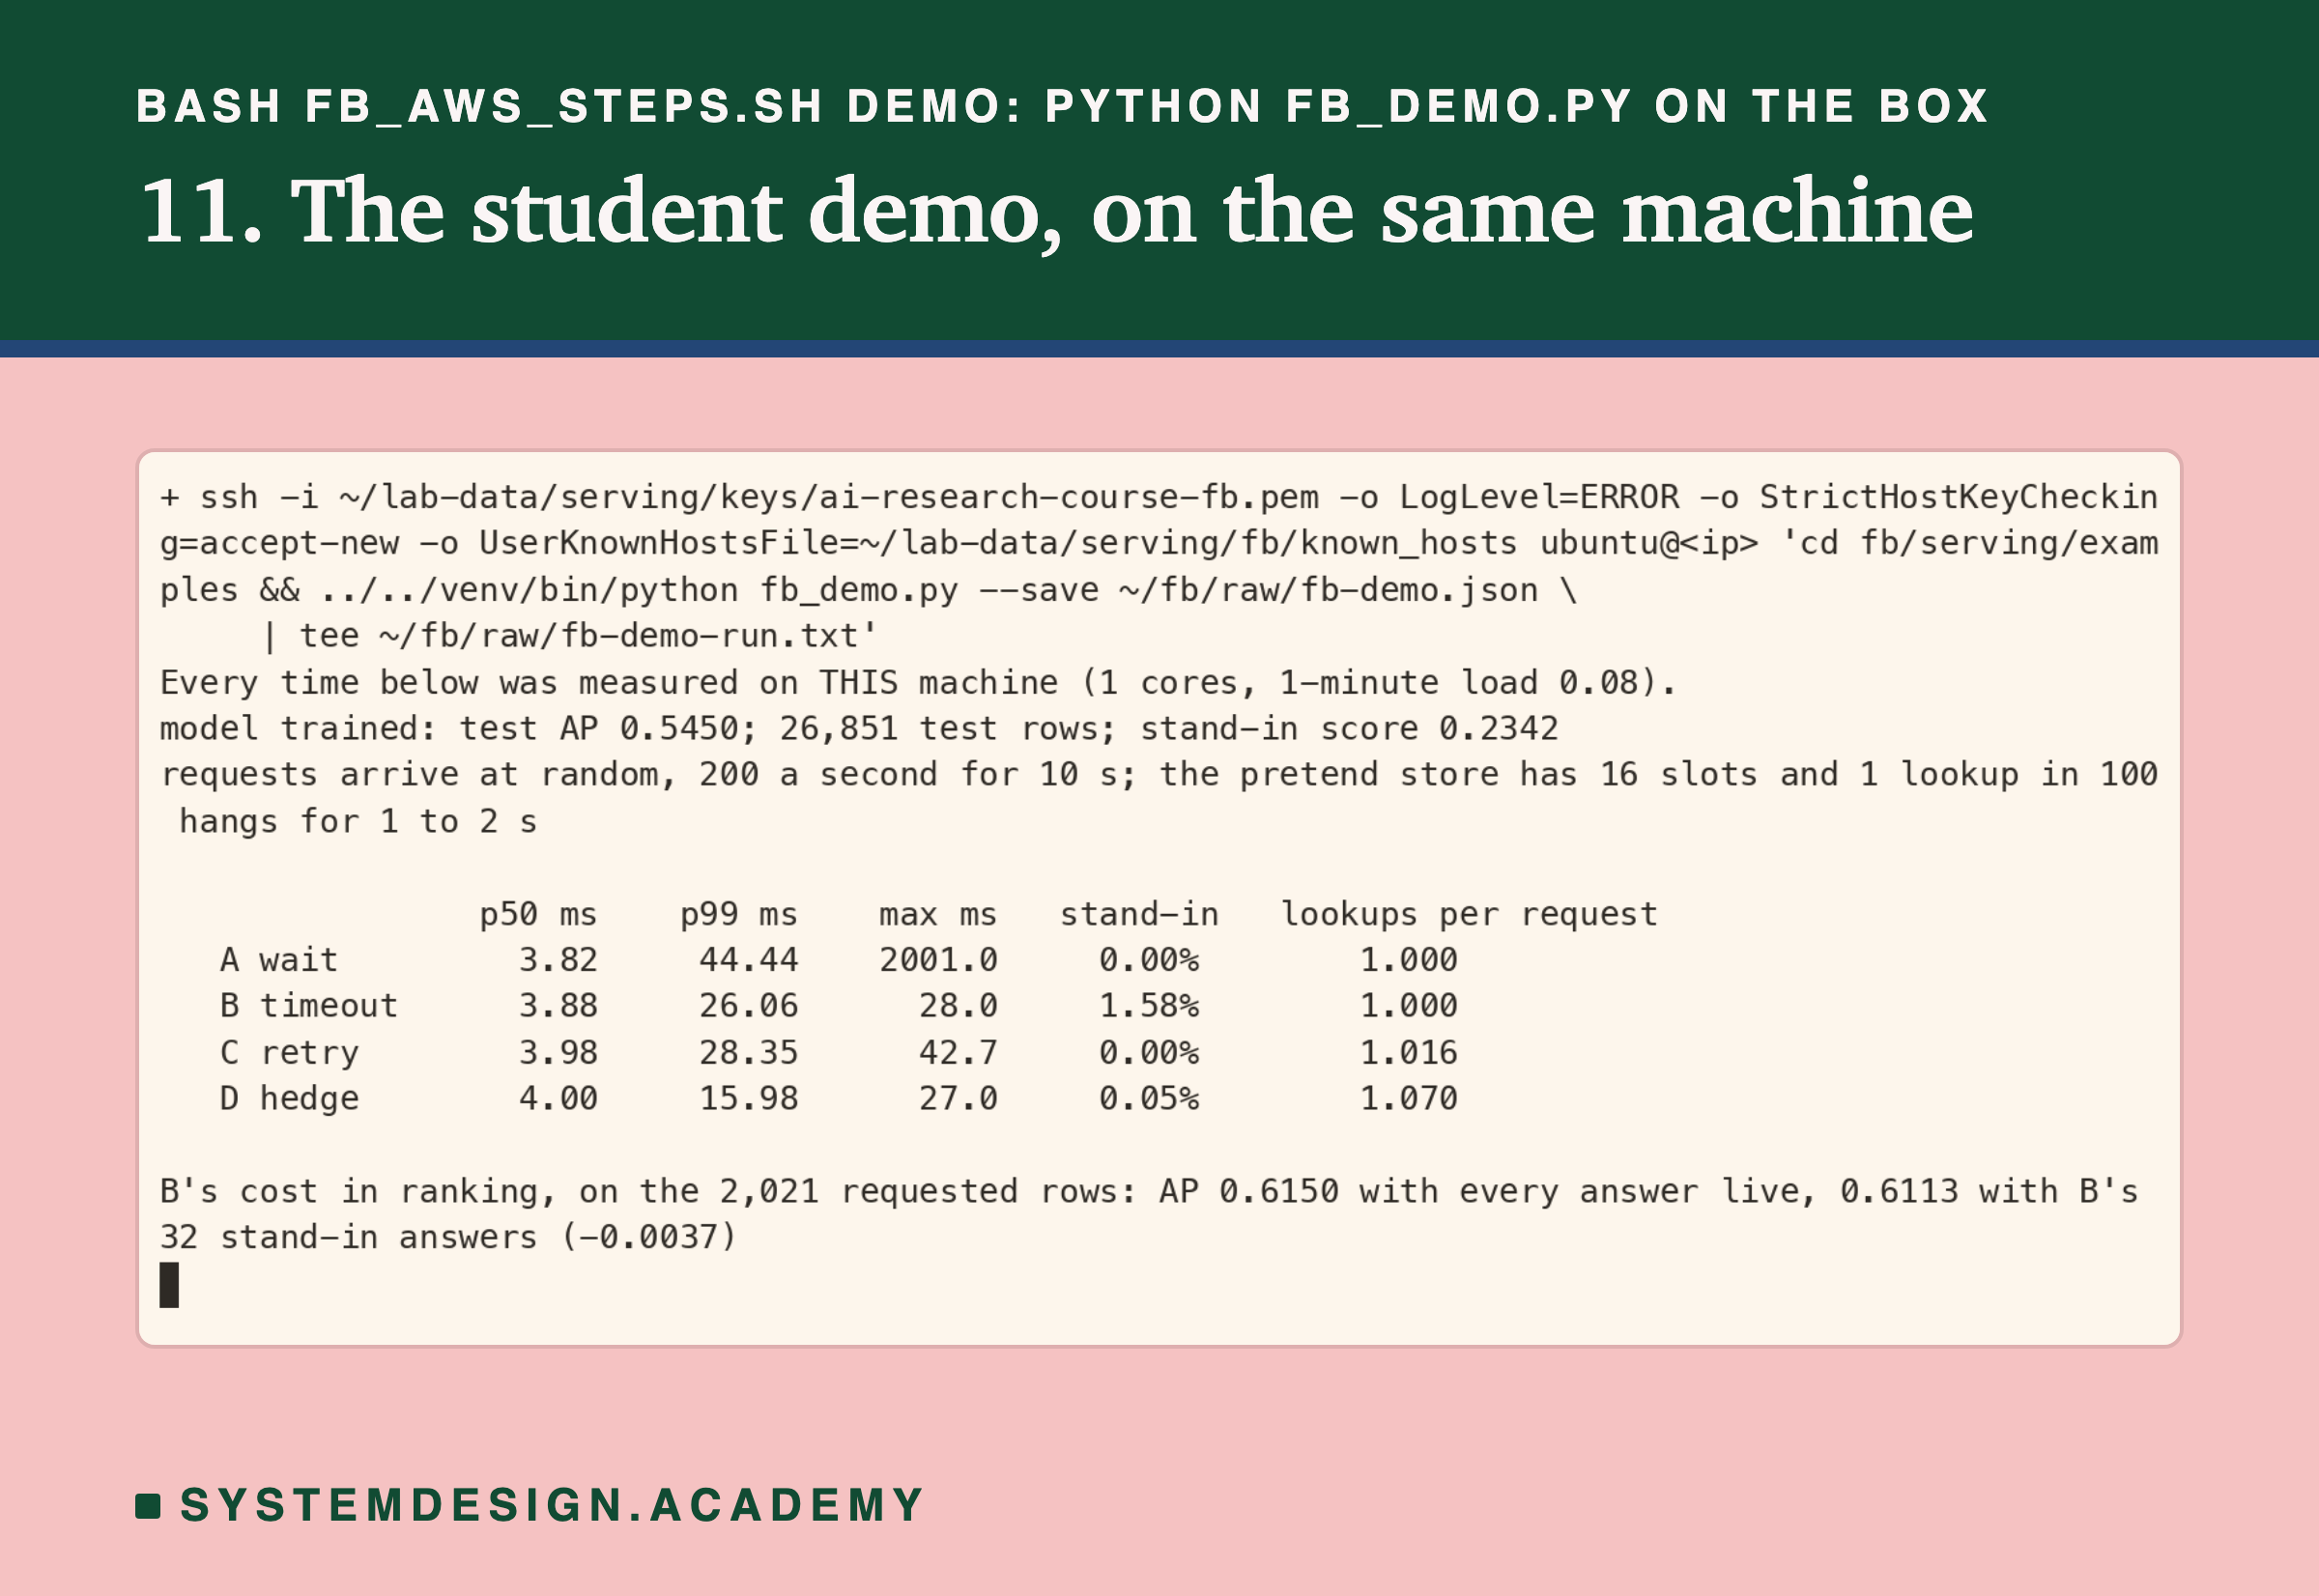
This run happened after the last timed run had finished, so it could not disturb any timing. Its first line says "1 cores", which is how my demo prints the count. This is the command:
  ssh -i ~/lab-data/serving/keys/ai-research-course-fb.pem "${SSHO[@]}" ubuntu@"$IP" \
    'cd fb/serving/examples && ../../venv/bin/python fb_demo.py --save ~/fb/raw/fb-demo.json \
     | tee ~/fb/raw/fb-demo-run.txt'
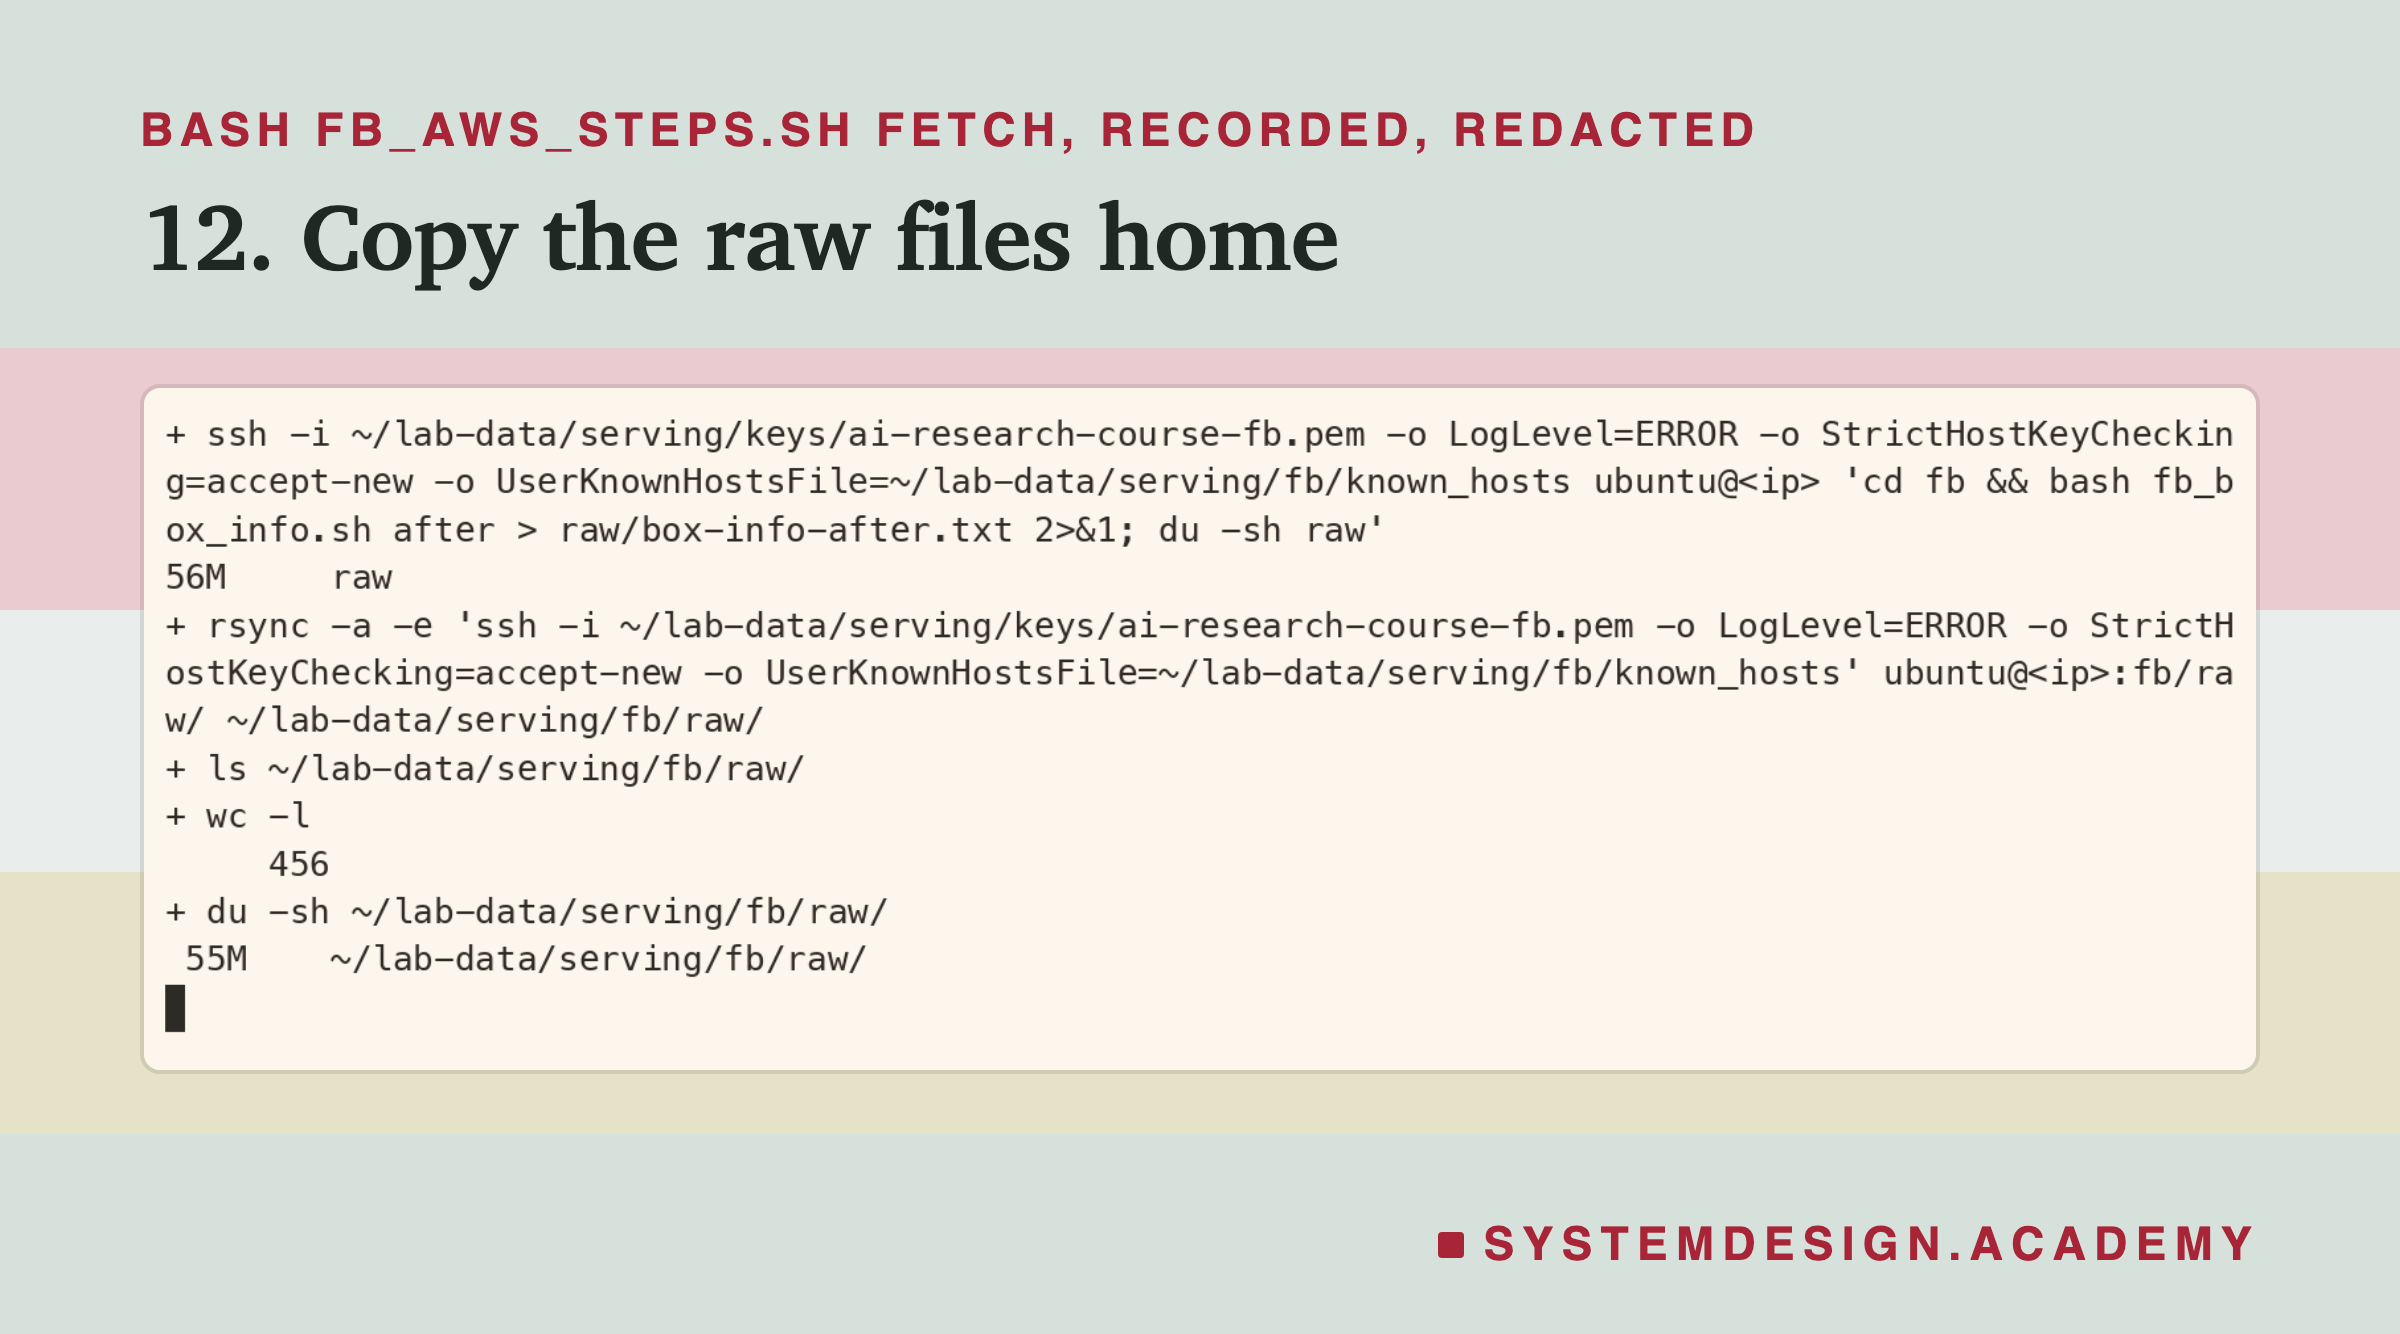
Step 12: bring the results home first. A whole box of results was lost once in this chapter, because it was deleted before anyone copied them. So the raw files come home before anything is deleted.
The Lab's Report, Running
This is a real recording of the report program, fb_report.py. It ran on my laptop, but it times nothing. It reads the raw files the rented computer measured and does all the arithmetic again with its own code.
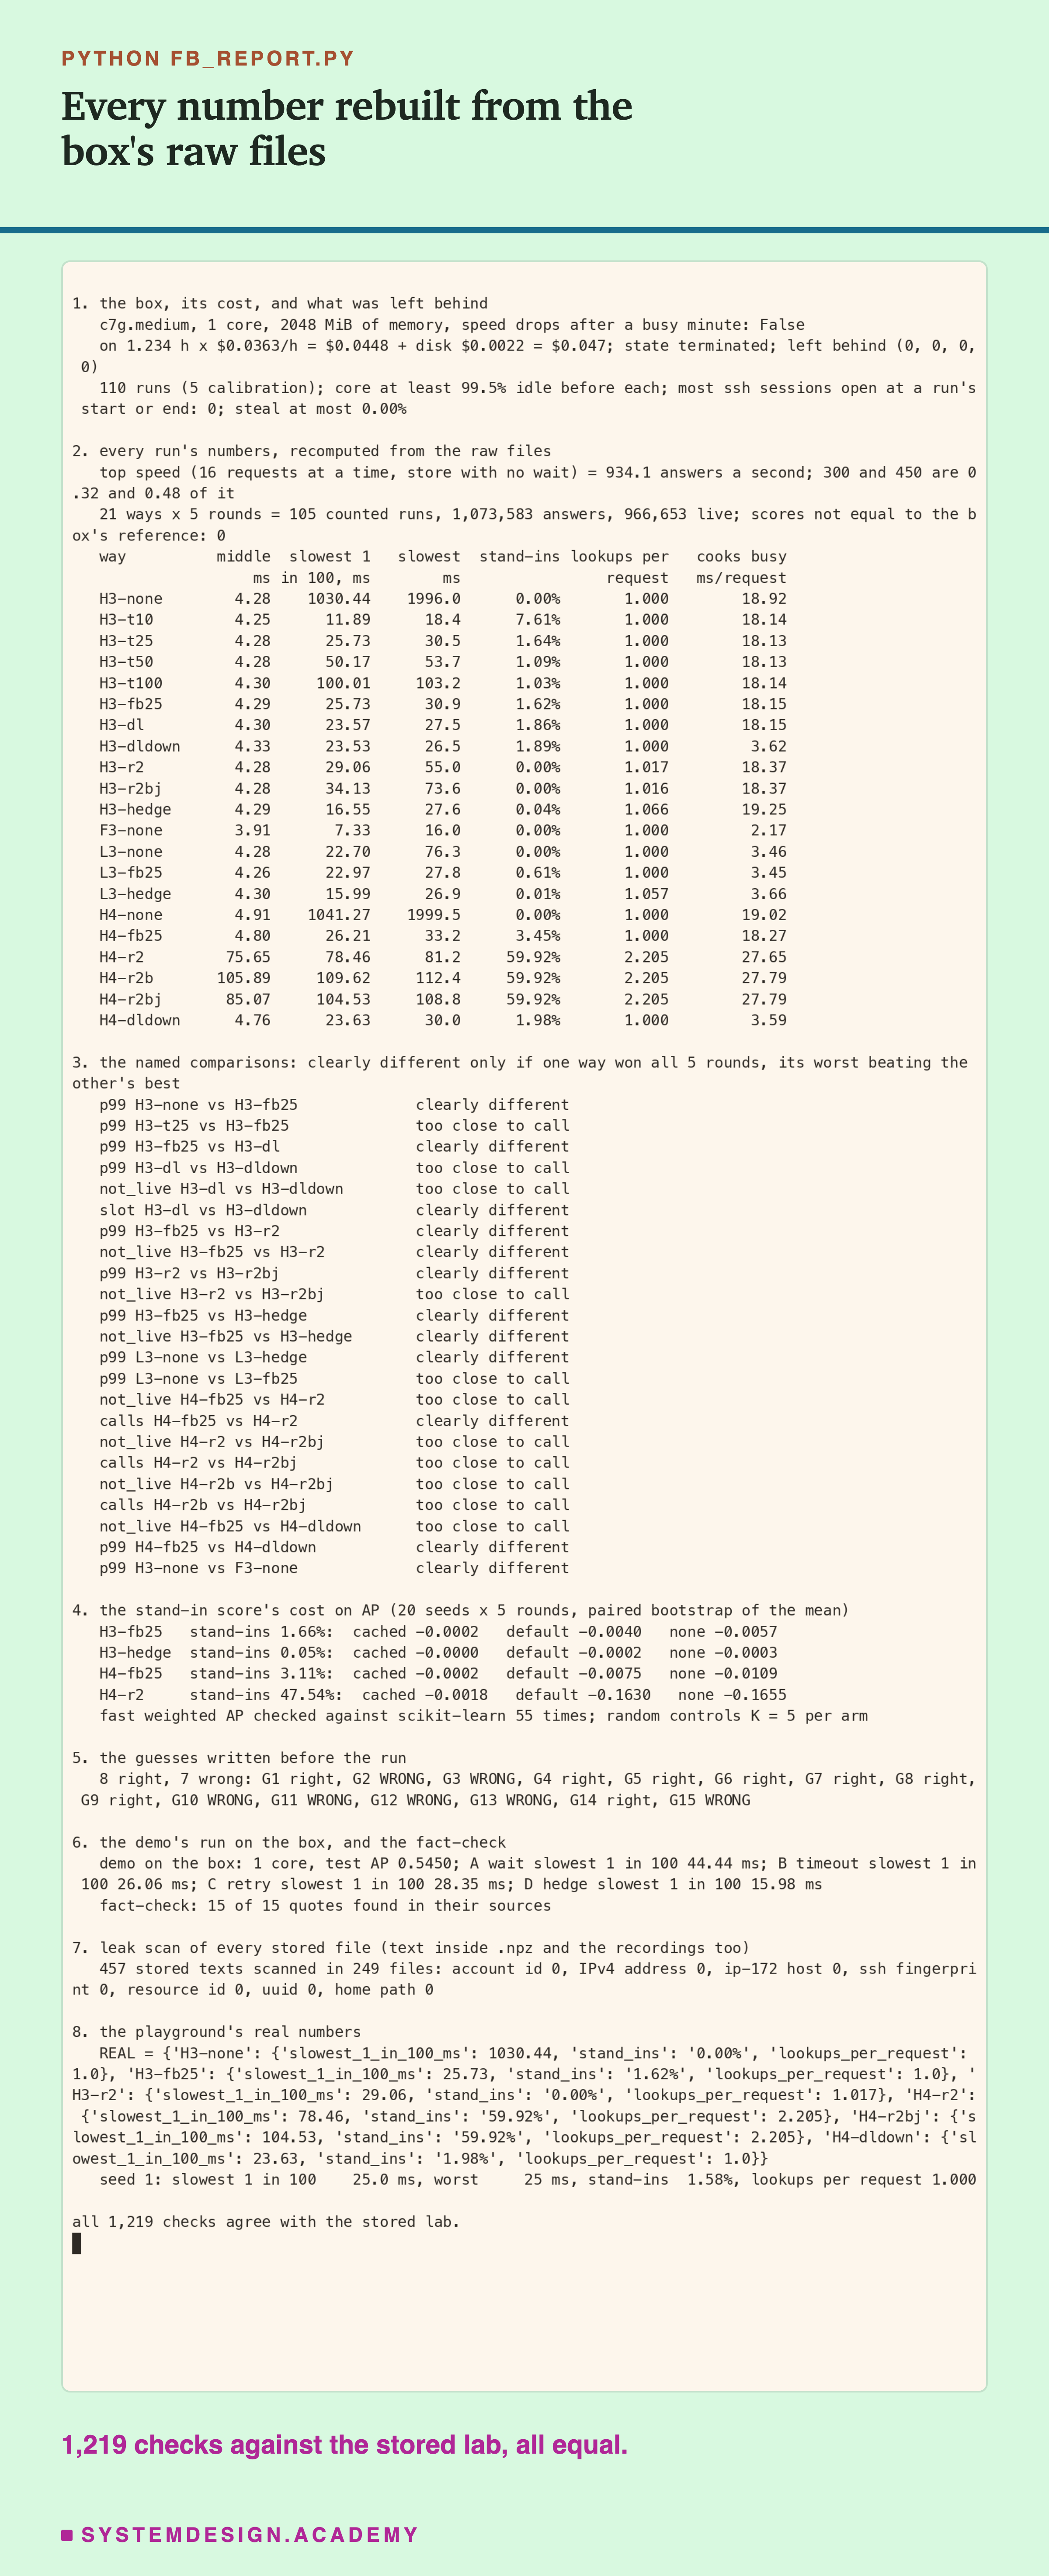
The report does not use the lab's own code. It works out every wait, share and verdict again, and compares each one with the lab's results file. If any number disagreed, it would stop with an error. I checked that too. I changed one stored wait by 1 microsecond (a millionth of a second), and the report printed "1 MISMATCHES" and stopped with an error. Then I put the file back.
Section 7 scans every stored file, even the compressed data files and the terminal recordings. It looks for my account number, addresses, Amazon's names for what I rented, and any secret-looking codes. It found none.
Waiting With No Limit
The first arm is the waiter who never comes back to say anything. The service waits for the store as long as it takes.
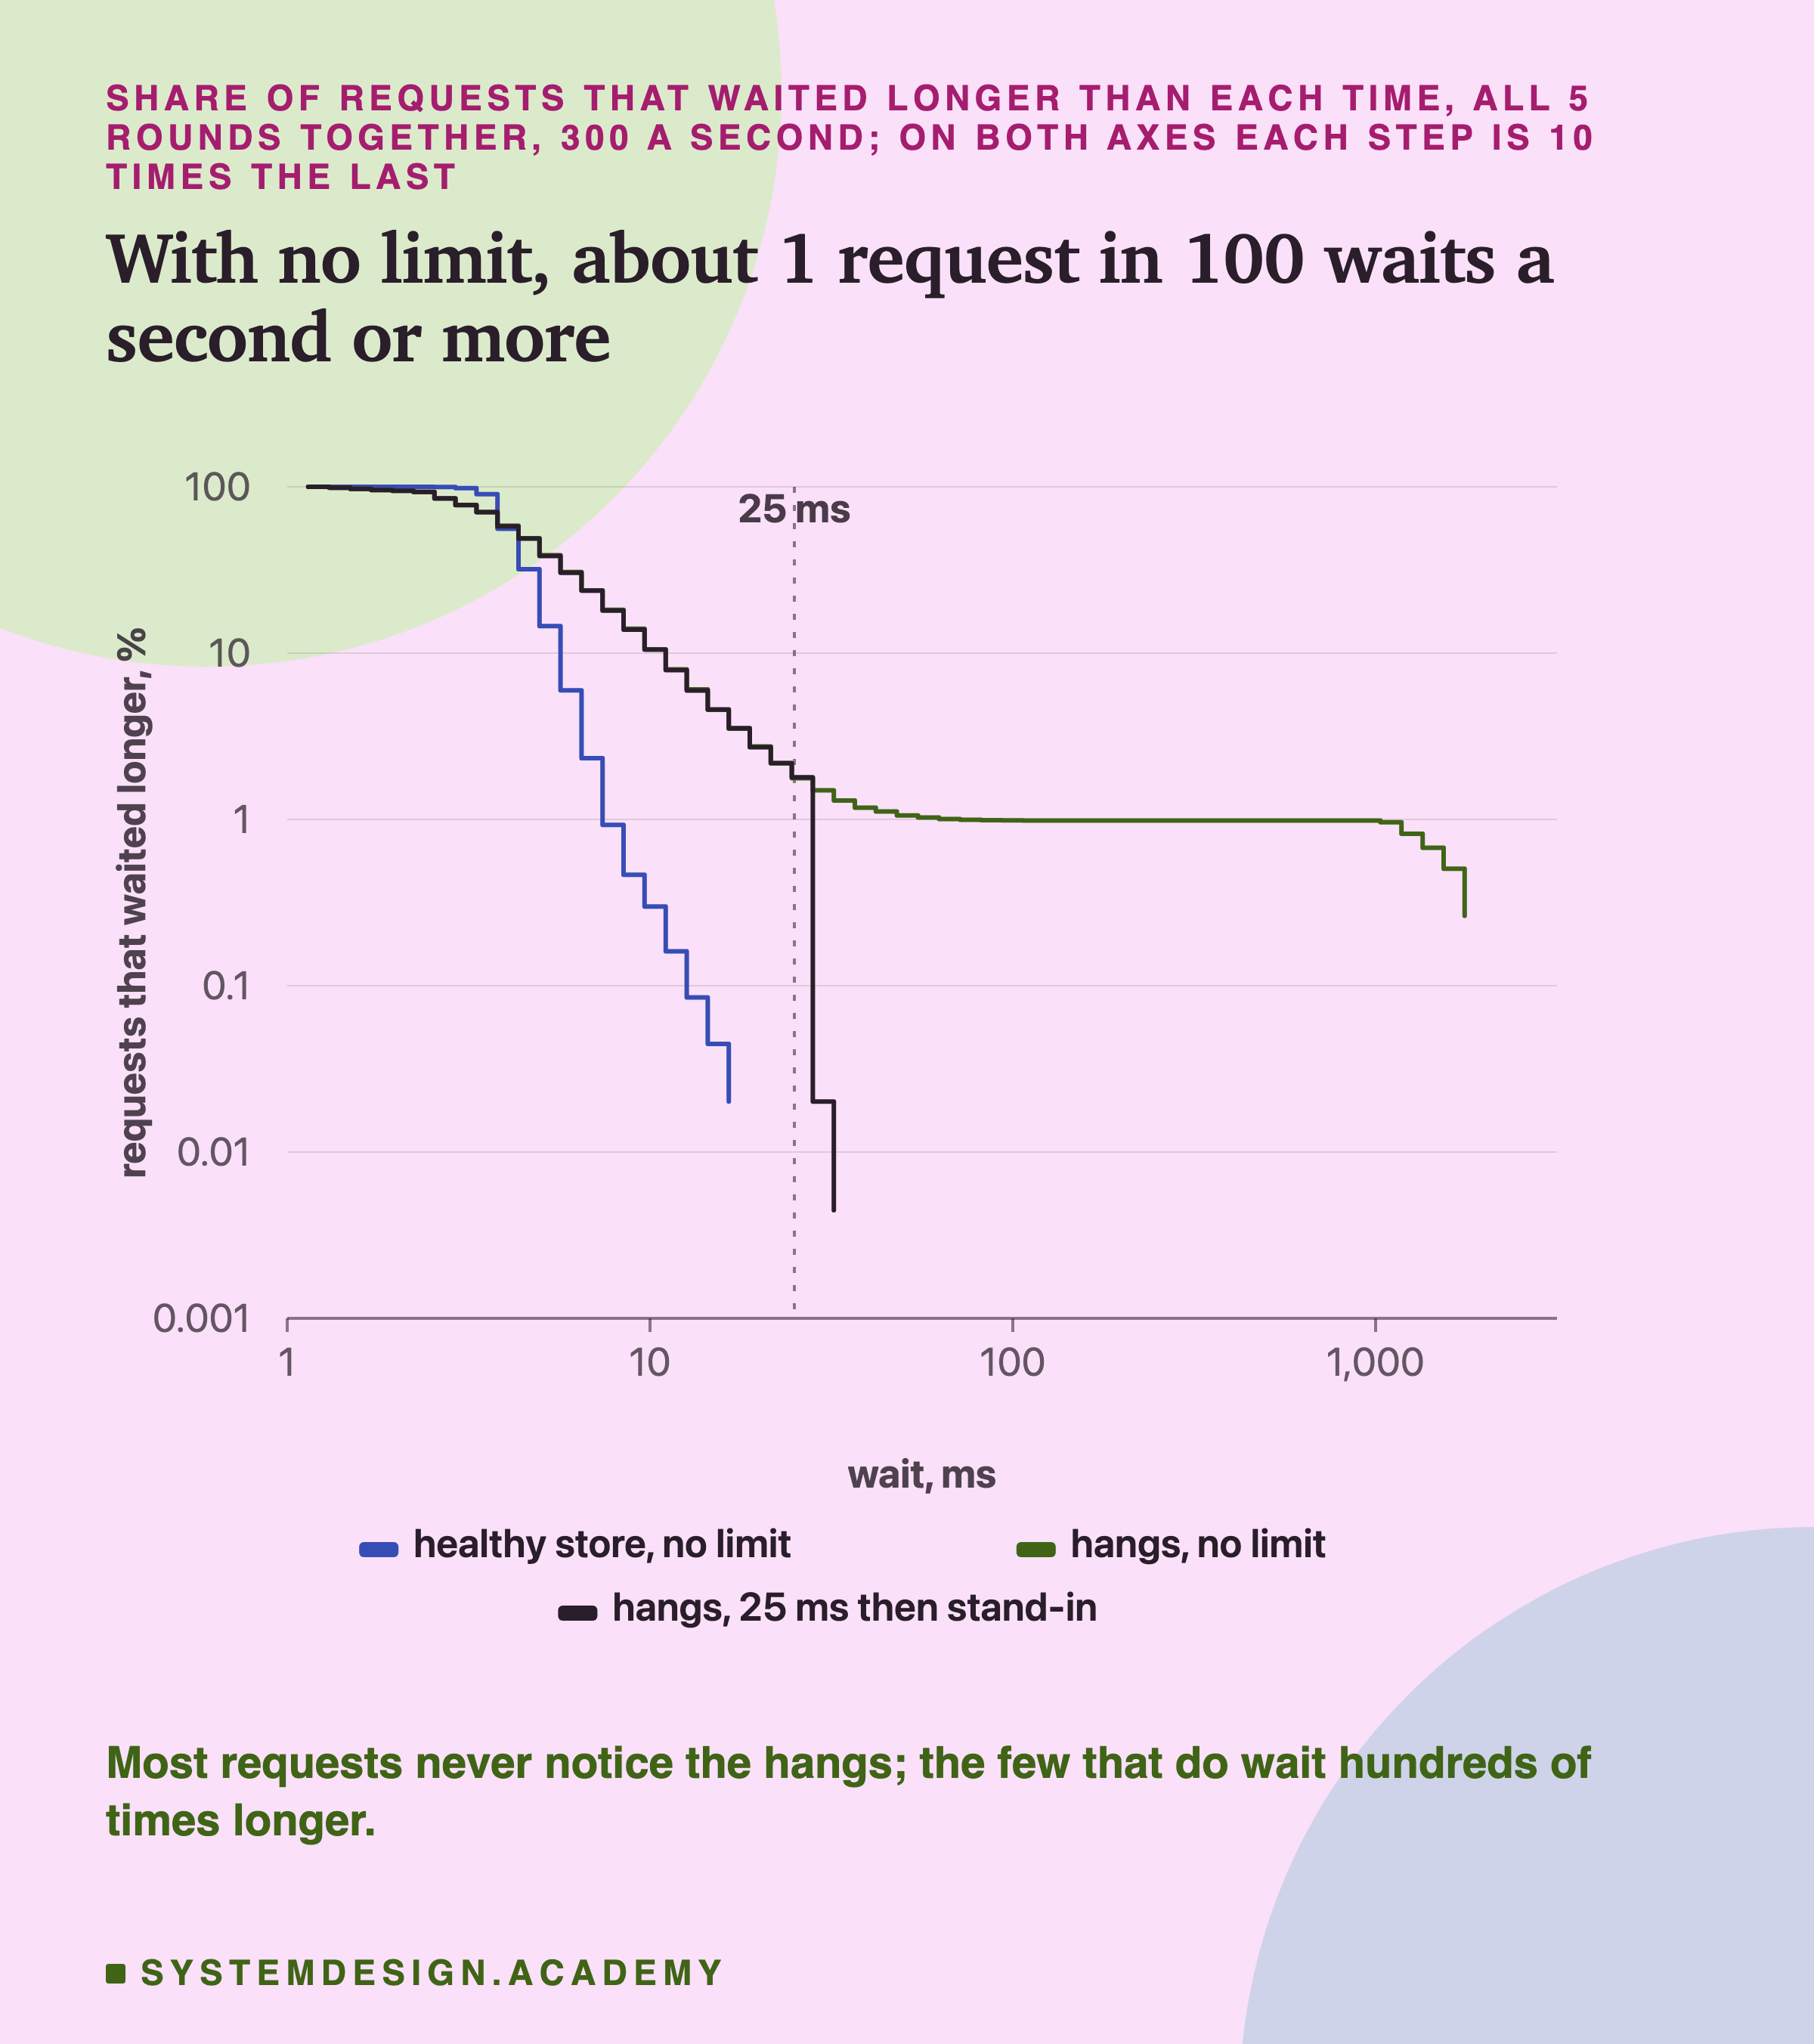
Read each line as "how many requests waited longer than this?". Both scales grow by 10 times at each mark. For the healthy store, almost no request waited longer than 10 ms. With freezes and no limit, the line goes flat at about 1 in 100 and stays there until a full second. Those are the requests that met a frozen lookup: 0.96% of them waited one second or more. The slowest 1 in 100 took 1,030 ms (the middle of 5 rounds), and the single slowest took 1,996 ms.
The middle request hardly changed. The middle wait was 4.28 ms with freezes and 3.91 ms without. The damage is all in the slowest 1 in 100. That is why an average or a middle value can look fine while real customers wait two seconds. With a 25 ms limit and a stand-in, nobody waited that long: the slowest 1 in 100 took 25.7 ms.
Round 4 is an honest warning. In four rounds the slowest 1 in 100 took over 1,000 ms. In round 4 it took only 29.6 ms, because that round happened to draw only 66 freezes in 8,922 requests, fewer than 1 in 100. When rare events happen about 1 time in 100, the slowest-1-in-100 number can jump a lot between runs. I had guessed it would be above 1,000 ms in every round, and that guess was wrong for this reason.
A Time Limit Is a Gauge
The next four arms put a time limit on the lookup: 10, 25, 50 or 100 ms. When the limit runs out, the service answers with an error message that says "took too long" ( 504), and no score.
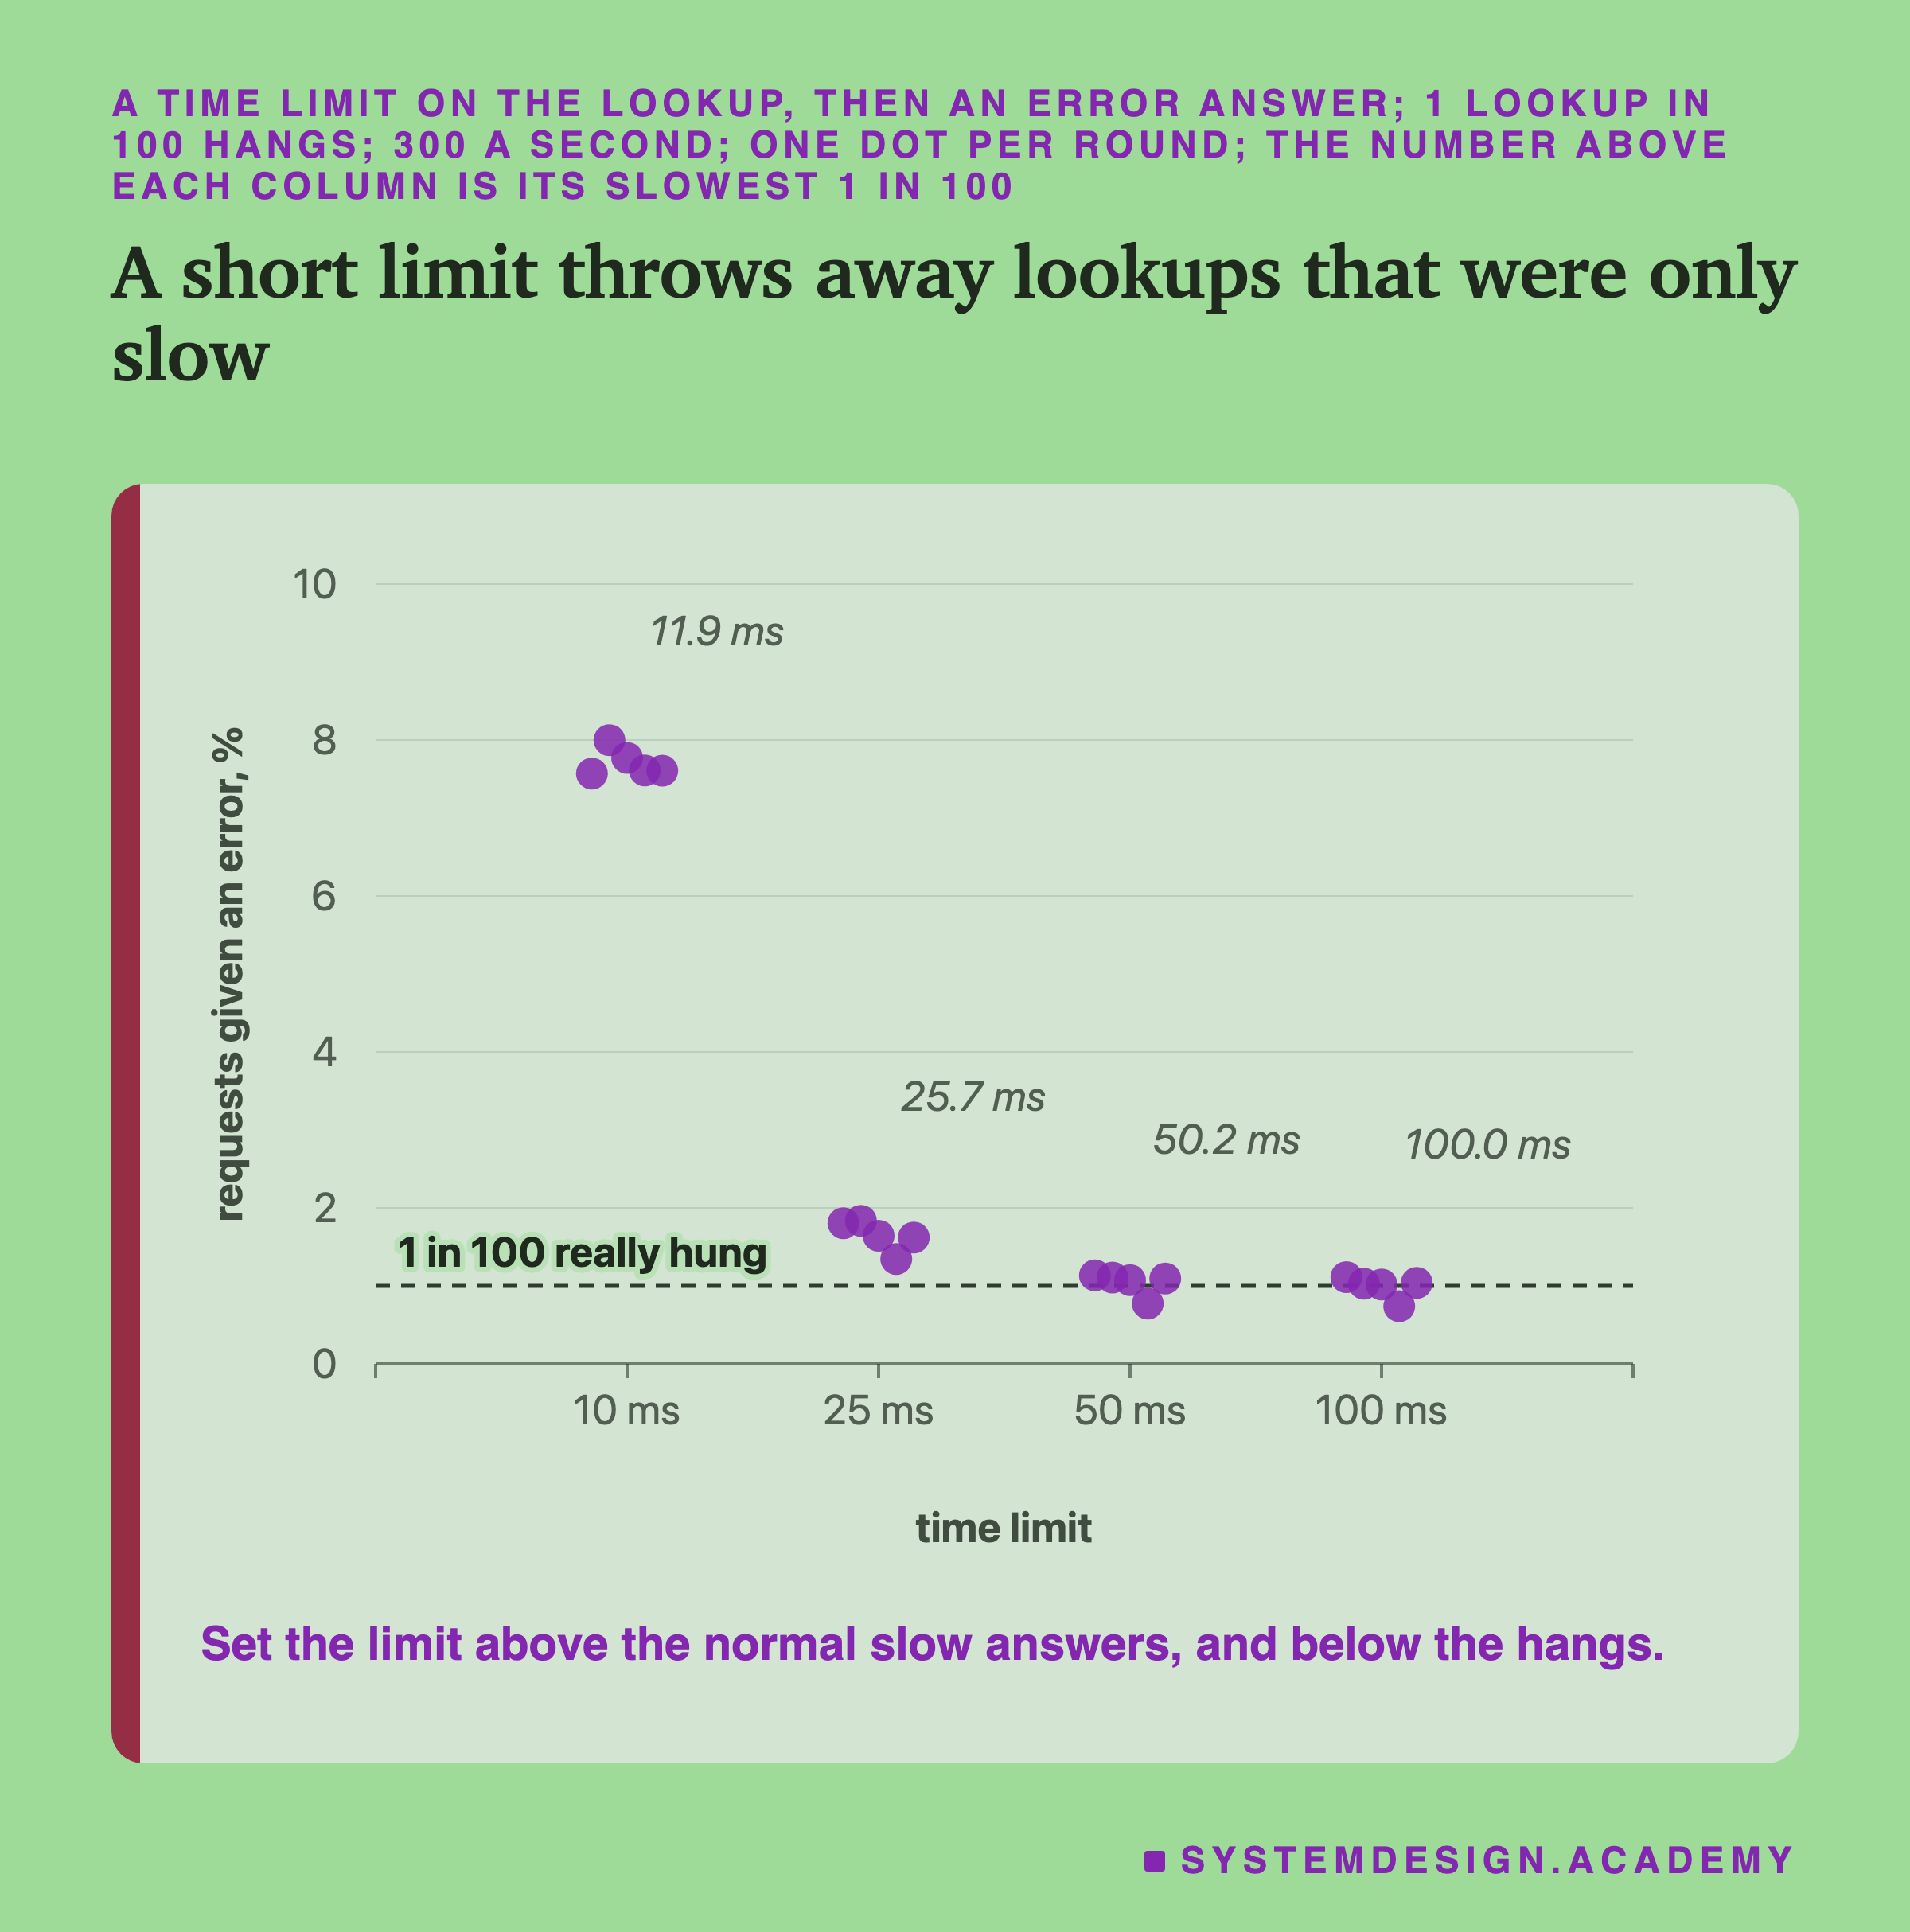
The slowest 1 in 100 sat just above whatever limit I chose. 10 ms gave 11.9 ms, 25 ms gave 25.7 ms, and so on. That is true by design: a limit of 25 ms cannot let a lookup wait 2 seconds. So the figure prints it as a small label, not as the main result.
The main result is how many errors each limit gave. A 10 ms limit cut off 7.61% of requests. Only about 1 in 100 really froze, so a 10 ms limit also threw away about 6 in 100 lookups that were merely slow. A 25 ms limit cut off 1.64%. Limits of 50 and 100 ms cut off about 1.1% and 1.0%, close to the 1 in 100 that really froze.
How do you pick the number? Amazon's engineering articles (the AWS Builders' Library) describe their method: "we choose an acceptable rate of false timeouts (such as 0.1%)". A false timeout is a timeout on a lookup that would have answered. Then they look at how long the slowest 1 in 1,000 normal lookups take, and set the limit there. Here, 25 ms sits above the slow-but-normal lookups and far below the freezes.
The Service Gave Up; the Store Did Not
A timeout protects the person waiting. But what happens to the lookup itself? Here is one real frozen lookup from round 1 of the 25 ms stand-in arm, followed through the service and the store.
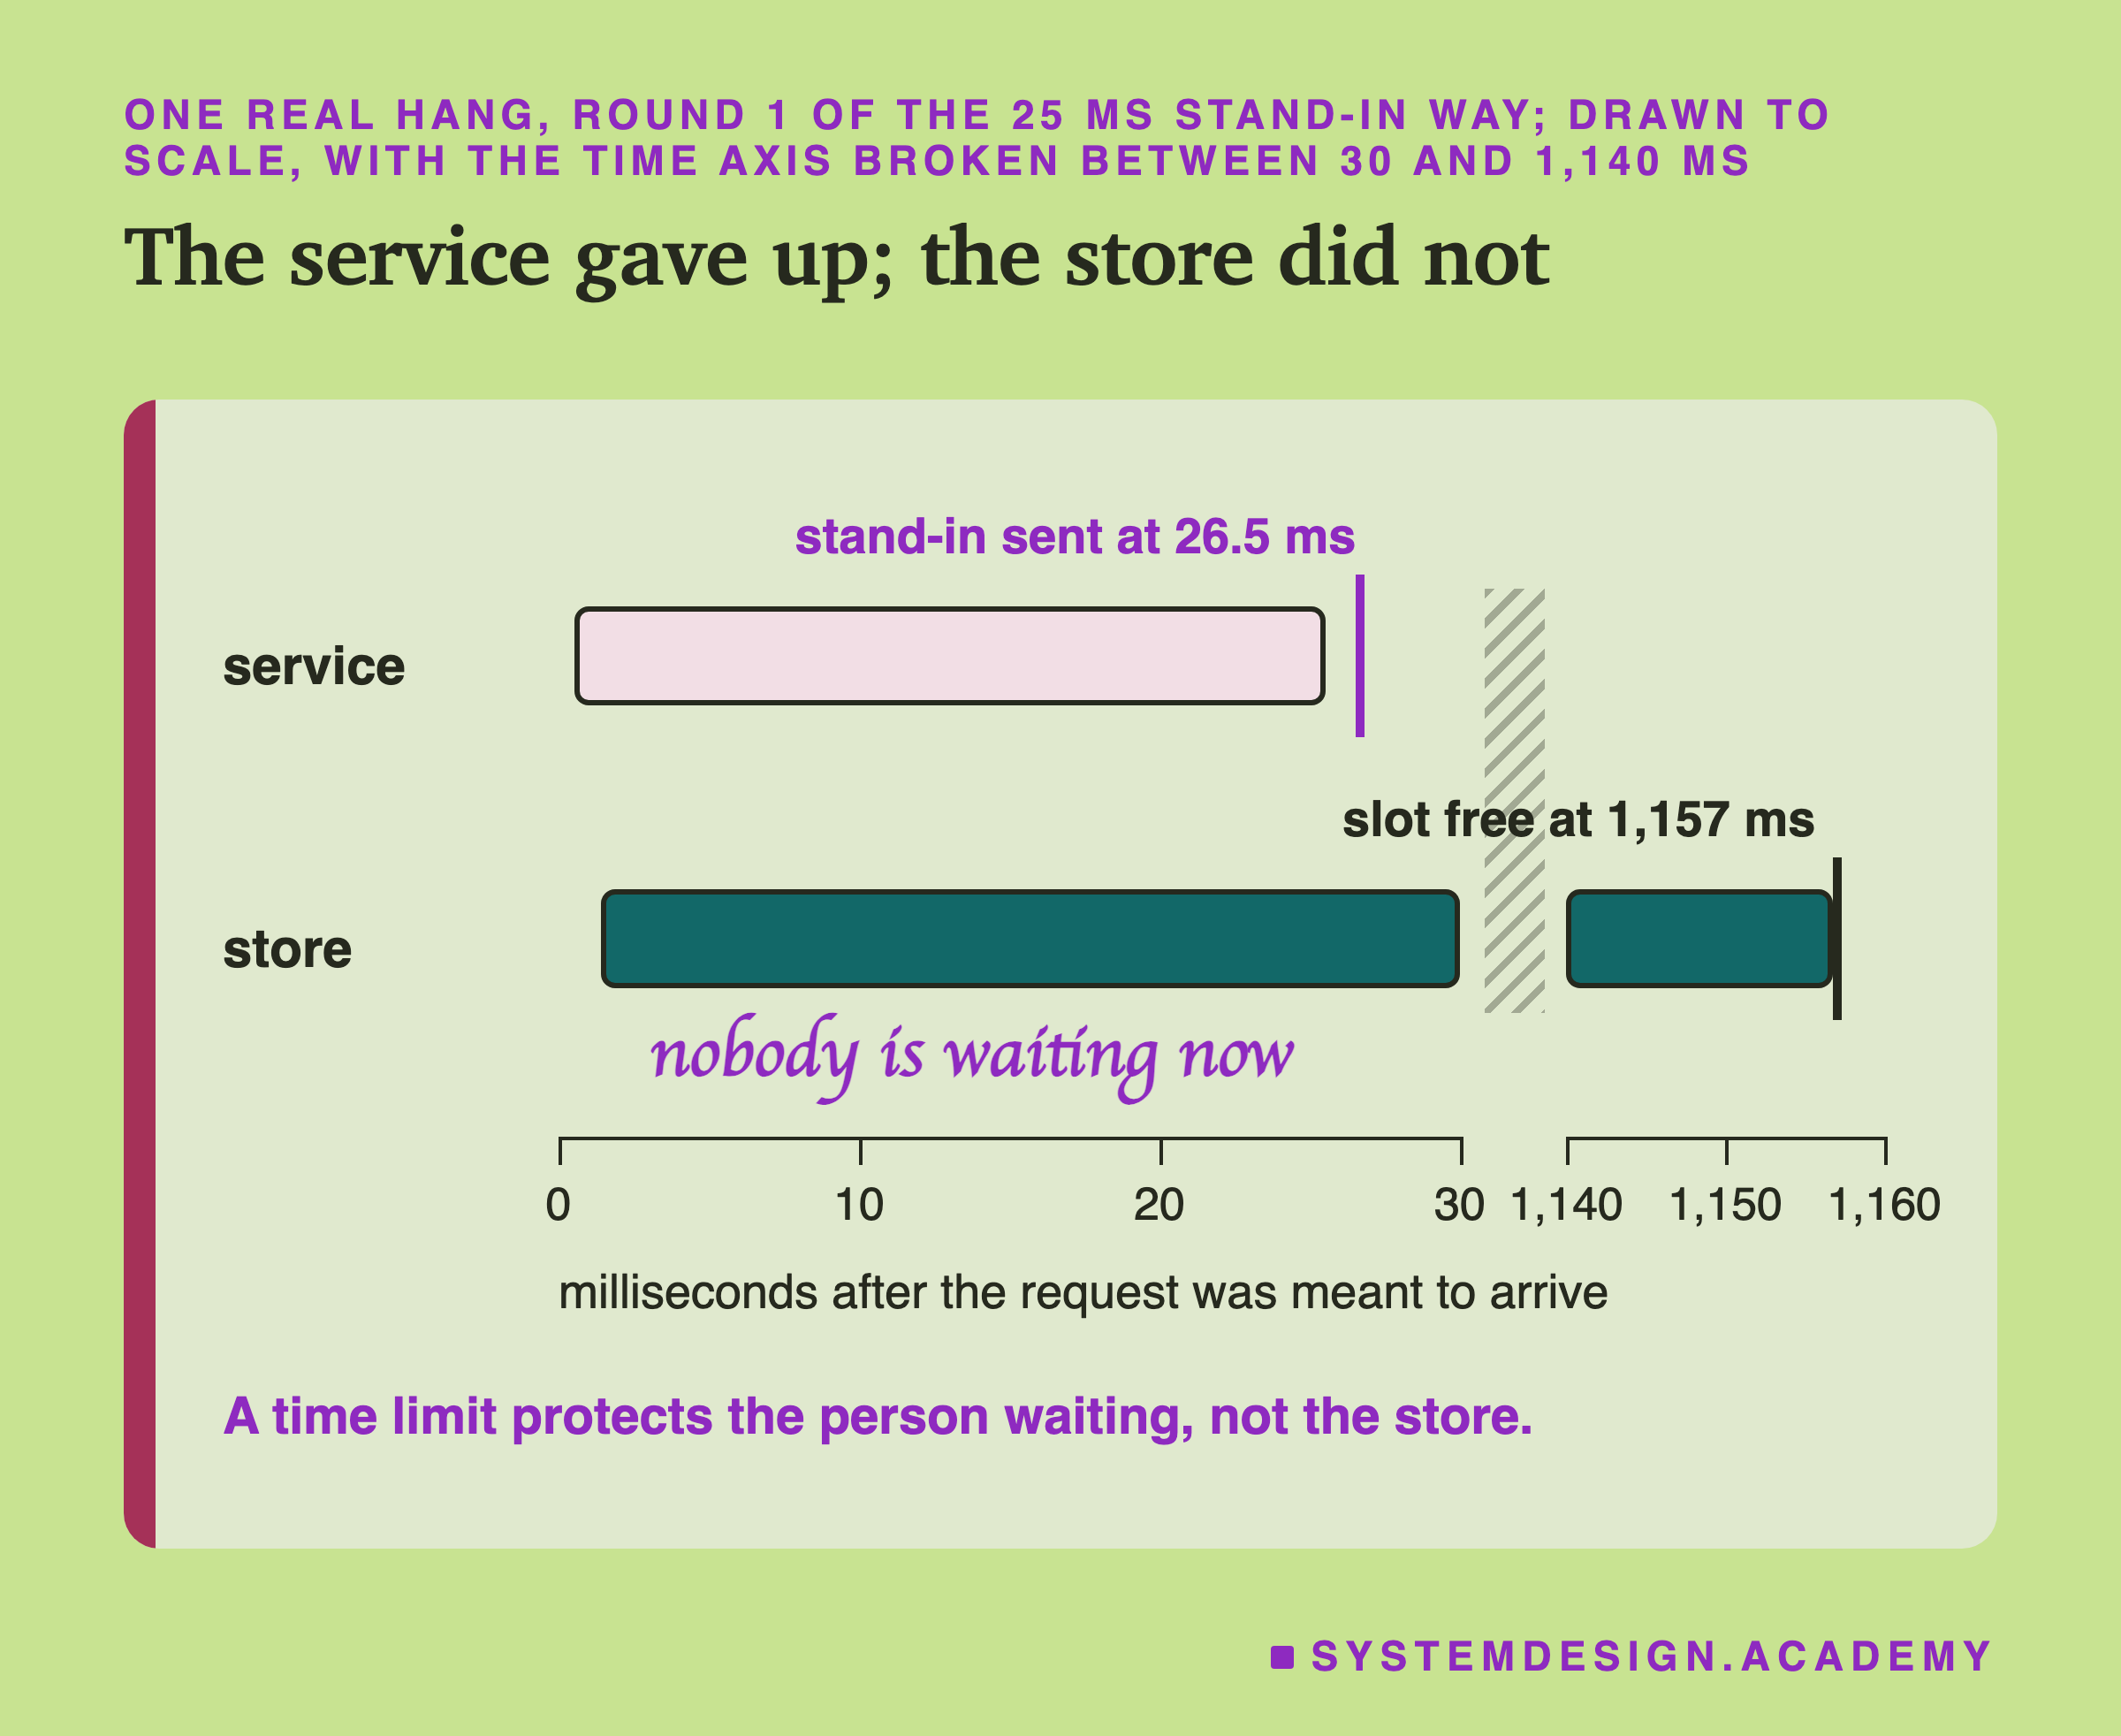
The service sent the lookup half a millisecond after the request arrived. At 25 ms it stopped waiting and answered with the customer's last-known score, 26.5 ms after arrival. But the store did not know that. It kept that lookup in a slot for 1,155 ms, then sent an answer that nobody wanted.
This is the hidden cost of a timeout. My service uses Python's stopwatch tool, asyncio.wait_for. It stops my program from waiting. Python's documentation says: "If a timeout occurs, it cancels aw and raises TimeoutError." Here aw is the thing being waited for. But it only cancels the waiting on my side. The store is a separate program, and it keeps working unless I tell it to stop. That run had 90 frozen lookups, and with a time limit alone, the store finished every one of them. The next slides are about telling it.
A Fallback Is a Fork in the Path
A timeout with an error is like the waiter saying "sorry, no food". A fallback is the sandwich from the fridge.
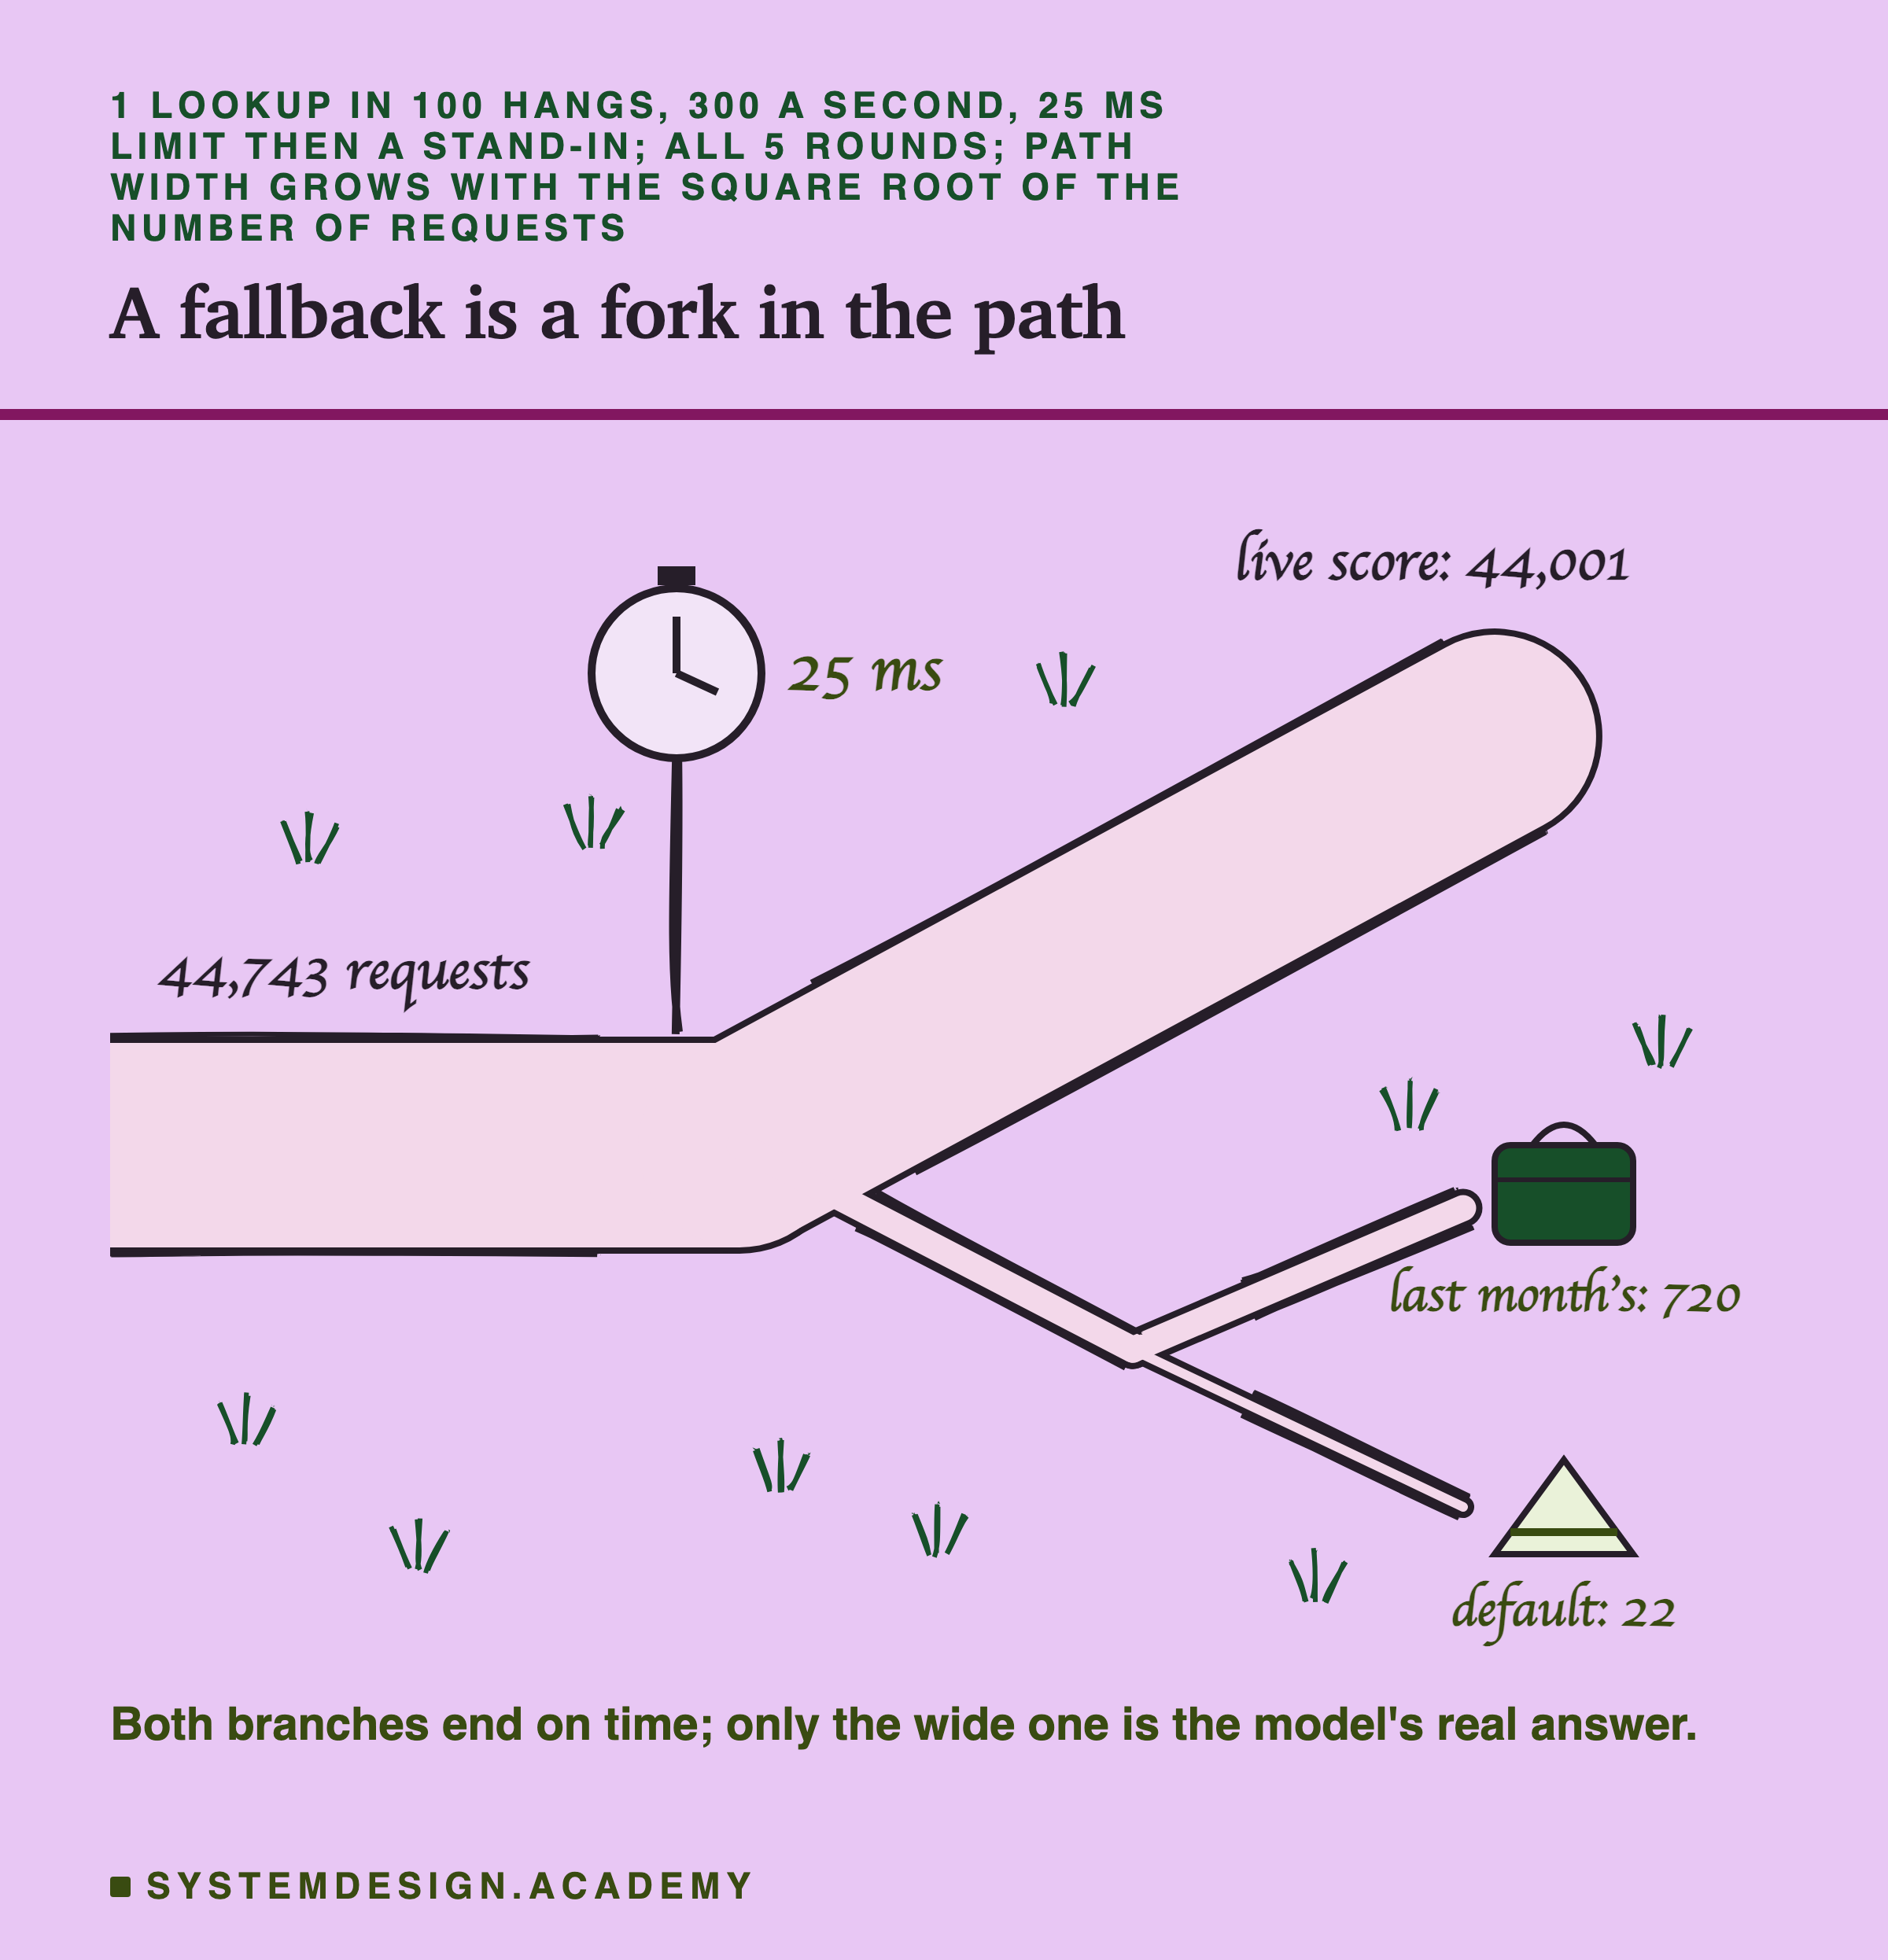
Every request reaches the stopwatch at the fork. If the lookup answered within 25 ms, the request took the wide path to the model's live score: 44,001 of 44,743 requests, all 5 rounds together. The other 742 took the thin path to a stand-in.
On the machine, the stand-in was the last-known score: the model's score on the same customer's six numbers one month earlier. If a customer was new a month earlier, it sent the default score instead. Only 22 of the 742 needed the default.
A check, not a finding. The slowest 1 in 100 was 25.7 ms with an error and 25.7 ms with a stand-in. Both arms stop at the same 25 ms, so they had to match. Reading one number from memory adds no time you can see.
Off the machine, I also scored a third choice, "no score". The next slide asks what each stand-in costs the ranking.
What a Stand-In Costs the Ranking
A stand-in answers on time, but it is not the model's fresh answer. The model's job is to rank customers, so I measured the cost as a change in AP.
This part times nothing, so it ran on my laptop. I took the requests that got a stand-in on the machine, among the first 8,922 requests of each round. I gave them each kind of stand-in in turn.
I built the model 20 times, each time with different dice, and averaged, so luck in building it evens out. Each month, the model looks at customers as they were on the 1st and guesses who buys in the next 30 days. That date is the cutoff. As in the features chapter, I worked out AP for each monthly cutoff and took the average.
How sure is each number? I redid the calculation 1,000 times. Each time I picked customers at random, some twice and some not at all, the same picks for every kind of stand-in. That shows how much the answer wobbles by luck. This is called a paired bootstrap. From it I get a range that the answer falls in 95 times out of 100. If that range includes zero, the cost might really be nothing.
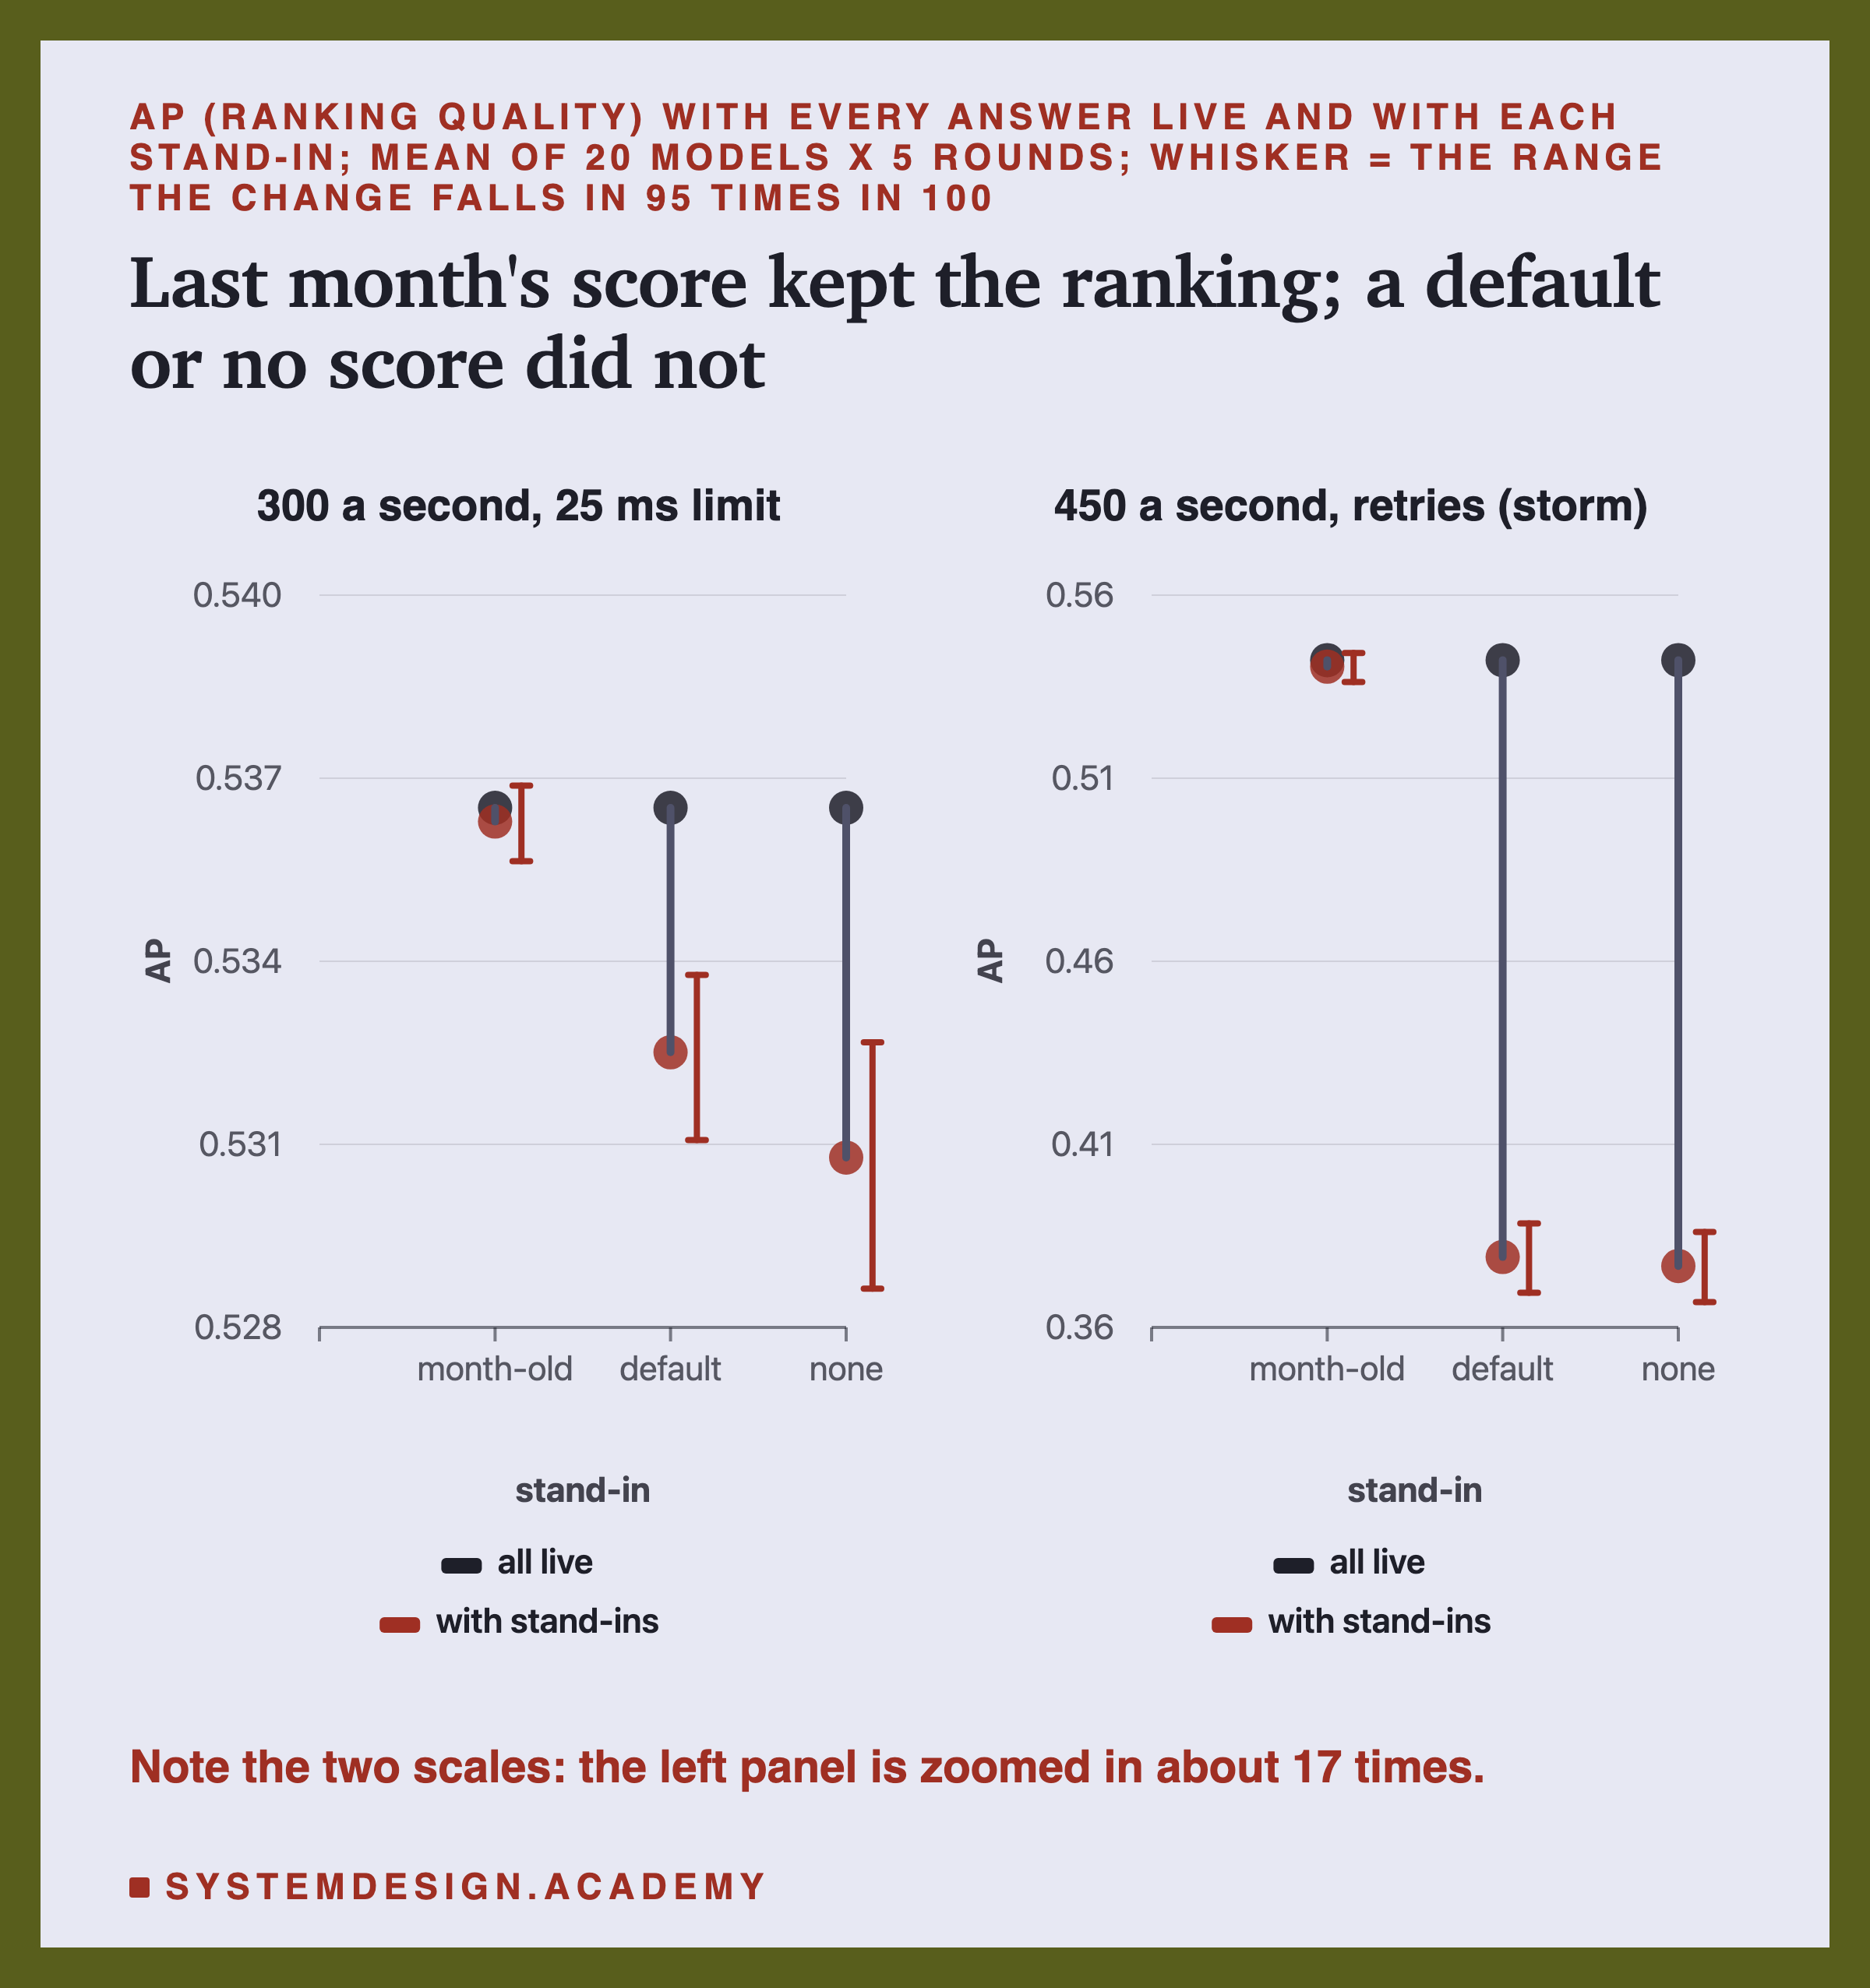
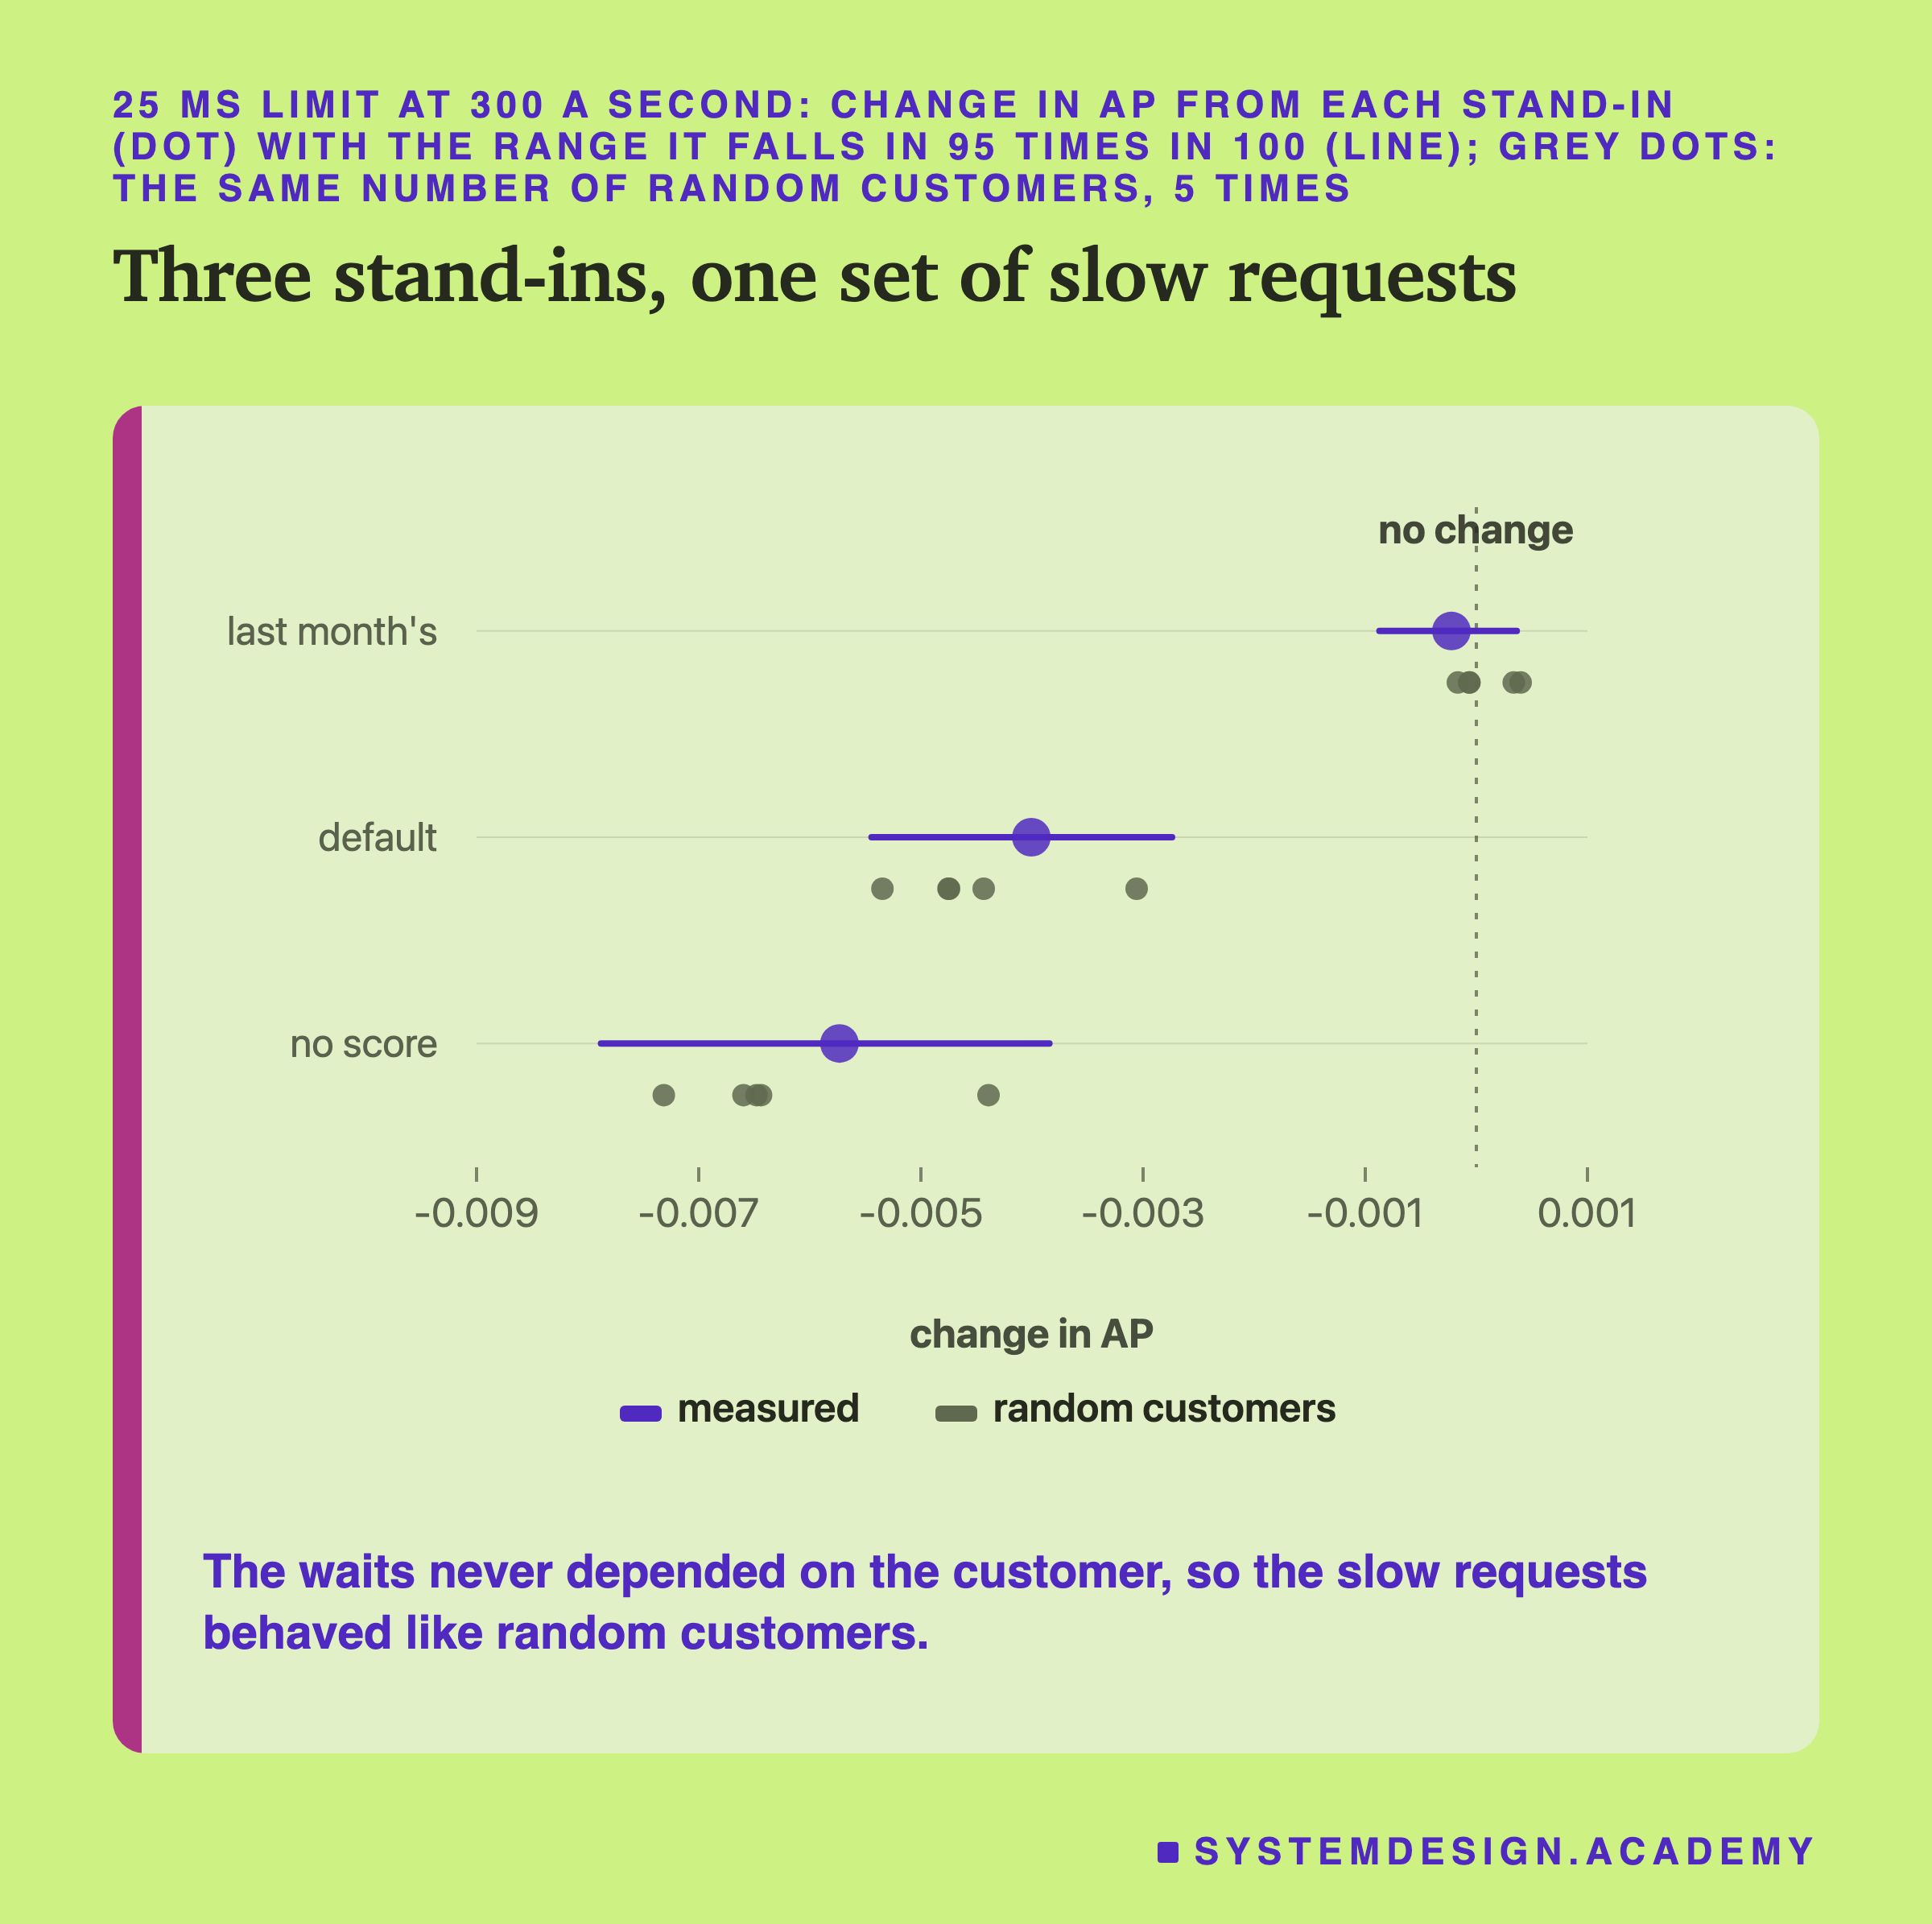
Last month's score kept the ranking. On the left, 1.66% of answers were stand-ins, and last month's score changed AP by -0.0002. Its range includes zero, so the cost is too close to zero to call. On the right, retries at 450 a second gave stand-ins to 47.5% of answers. That 47.5% is an average of 3 flooded rounds and 2 calm rounds with none. Even there, last month's score changed AP by only -0.0018. That is still too close to zero to call, but a loss as large as 0.006 cannot be ruled out.
This surprised me. One possible reason is that these six numbers change slowly for most customers in one month. The features chapter's lesson 3 on feature freshness found something similar: 30-day-old numbers could not be told from fresh ones.
One Deadline for the Whole Request
A timeout limits one step. A deadline limits the whole trip. Think of a car with a full fuel tank. Every part of the journey burns from the same tank. When it is empty, the trip is over, wherever you are.
In this lab, the tester gave each request a deadline of 25 ms from the moment it was meant to arrive. The service checked how much time was left before the lookup. It kept 2 ms back for scoring and answering, and gave the lookup only the rest.
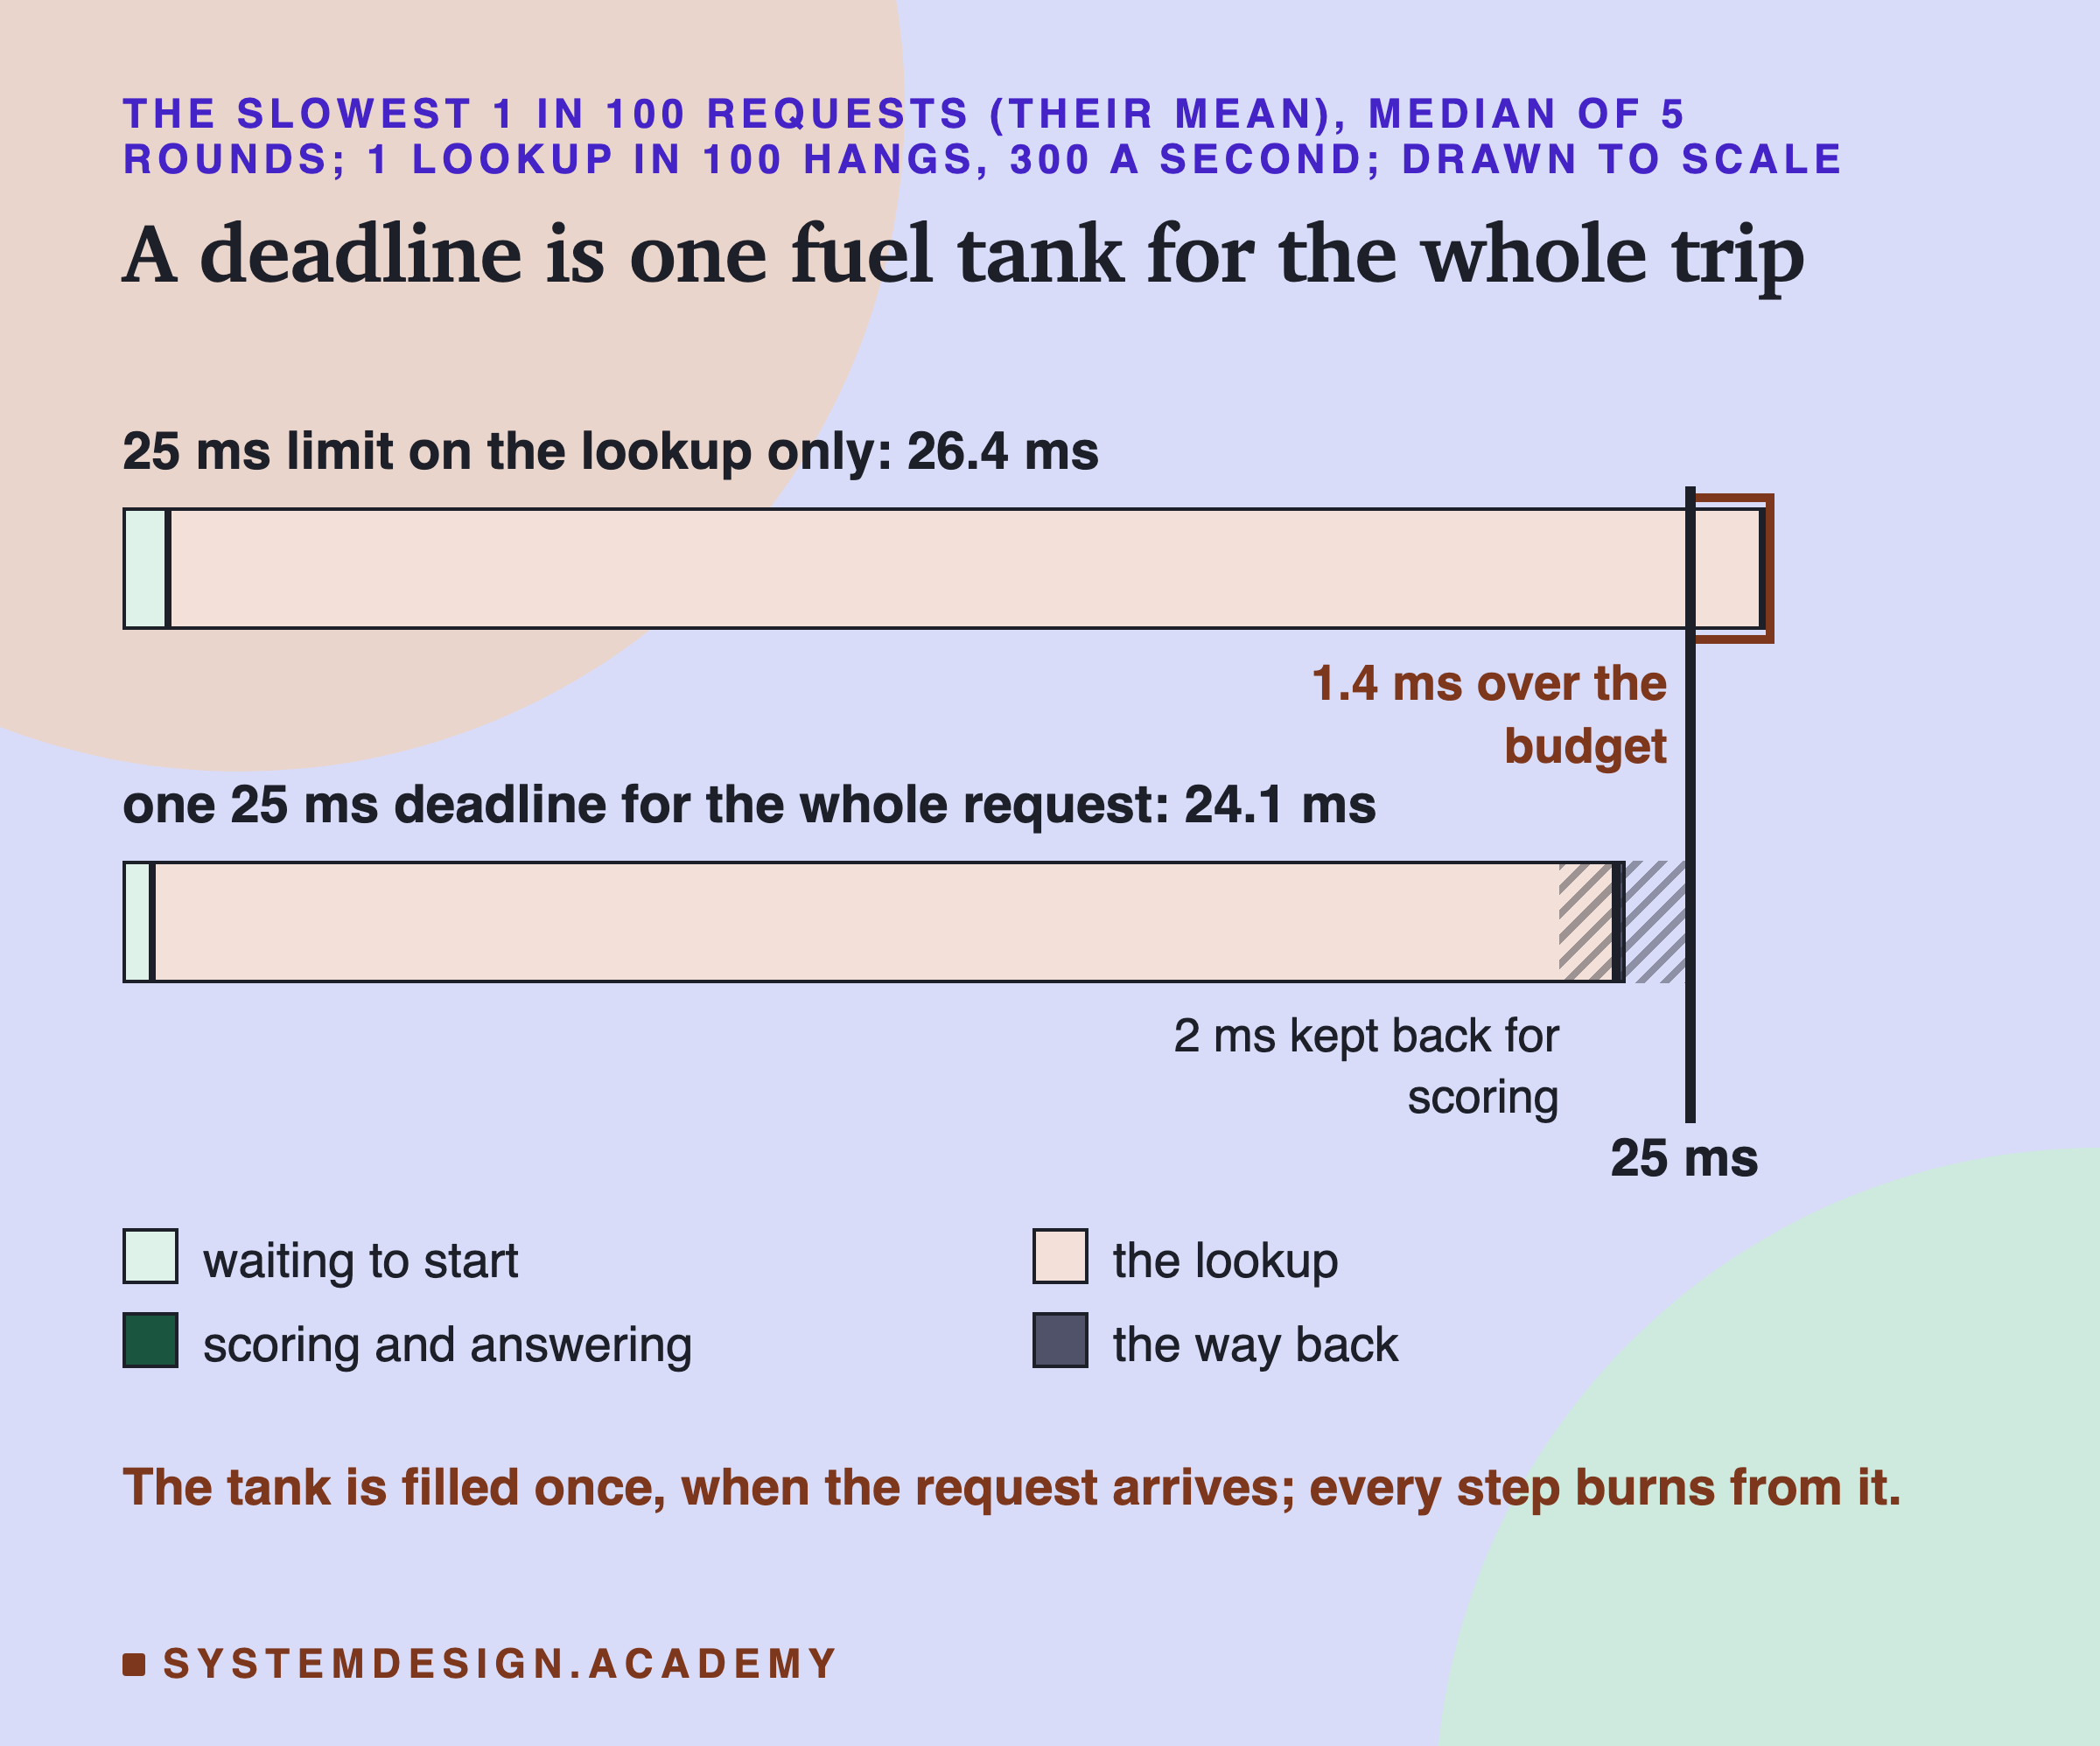
Part of this is built in. By design, the deadline arm gave the lookup at most 23 ms (25 ms, minus the time already spent, minus 2 ms kept back). So its slowest 1 in 100 had to be lower than the plain 25 ms limit's: 23.6 ms against 25.7 ms. A fair contest would need a plain 23 ms limit, which I did not run.
The check is that the budget held. For the slowest 1 in 100 requests, a limit on the lookup alone added up to 26.4 ms on average, 1.4 ms over the 25 ms budget. With one deadline, the same requests took 24.1 ms. The single slowest request still took 27.5 ms, so the budget is a target the code aims at, not a wall. I did not find out why that one ran over. One possible reason is that the service was busy with other requests when its time ran out, so it noticed a little late.
The price was a few more stand-ins: 1.86% against 1.62%, because the lookup got slightly less time. Google's book on running big websites (the SRE book) gives the rule plainly: "Rather than inventing a deadline when sending RPCs to backends, servers should employ deadline propagation." An RPC is a call from one program to another, like our lookup. Deadline propagation means passing the deadline along.
Passing the Deadline Down Unclogs the Store
In one more arm, the deadline also travelled with the lookup to the store. The store then stopped waiting the moment the deadline passed, and freed the cook for the next order.
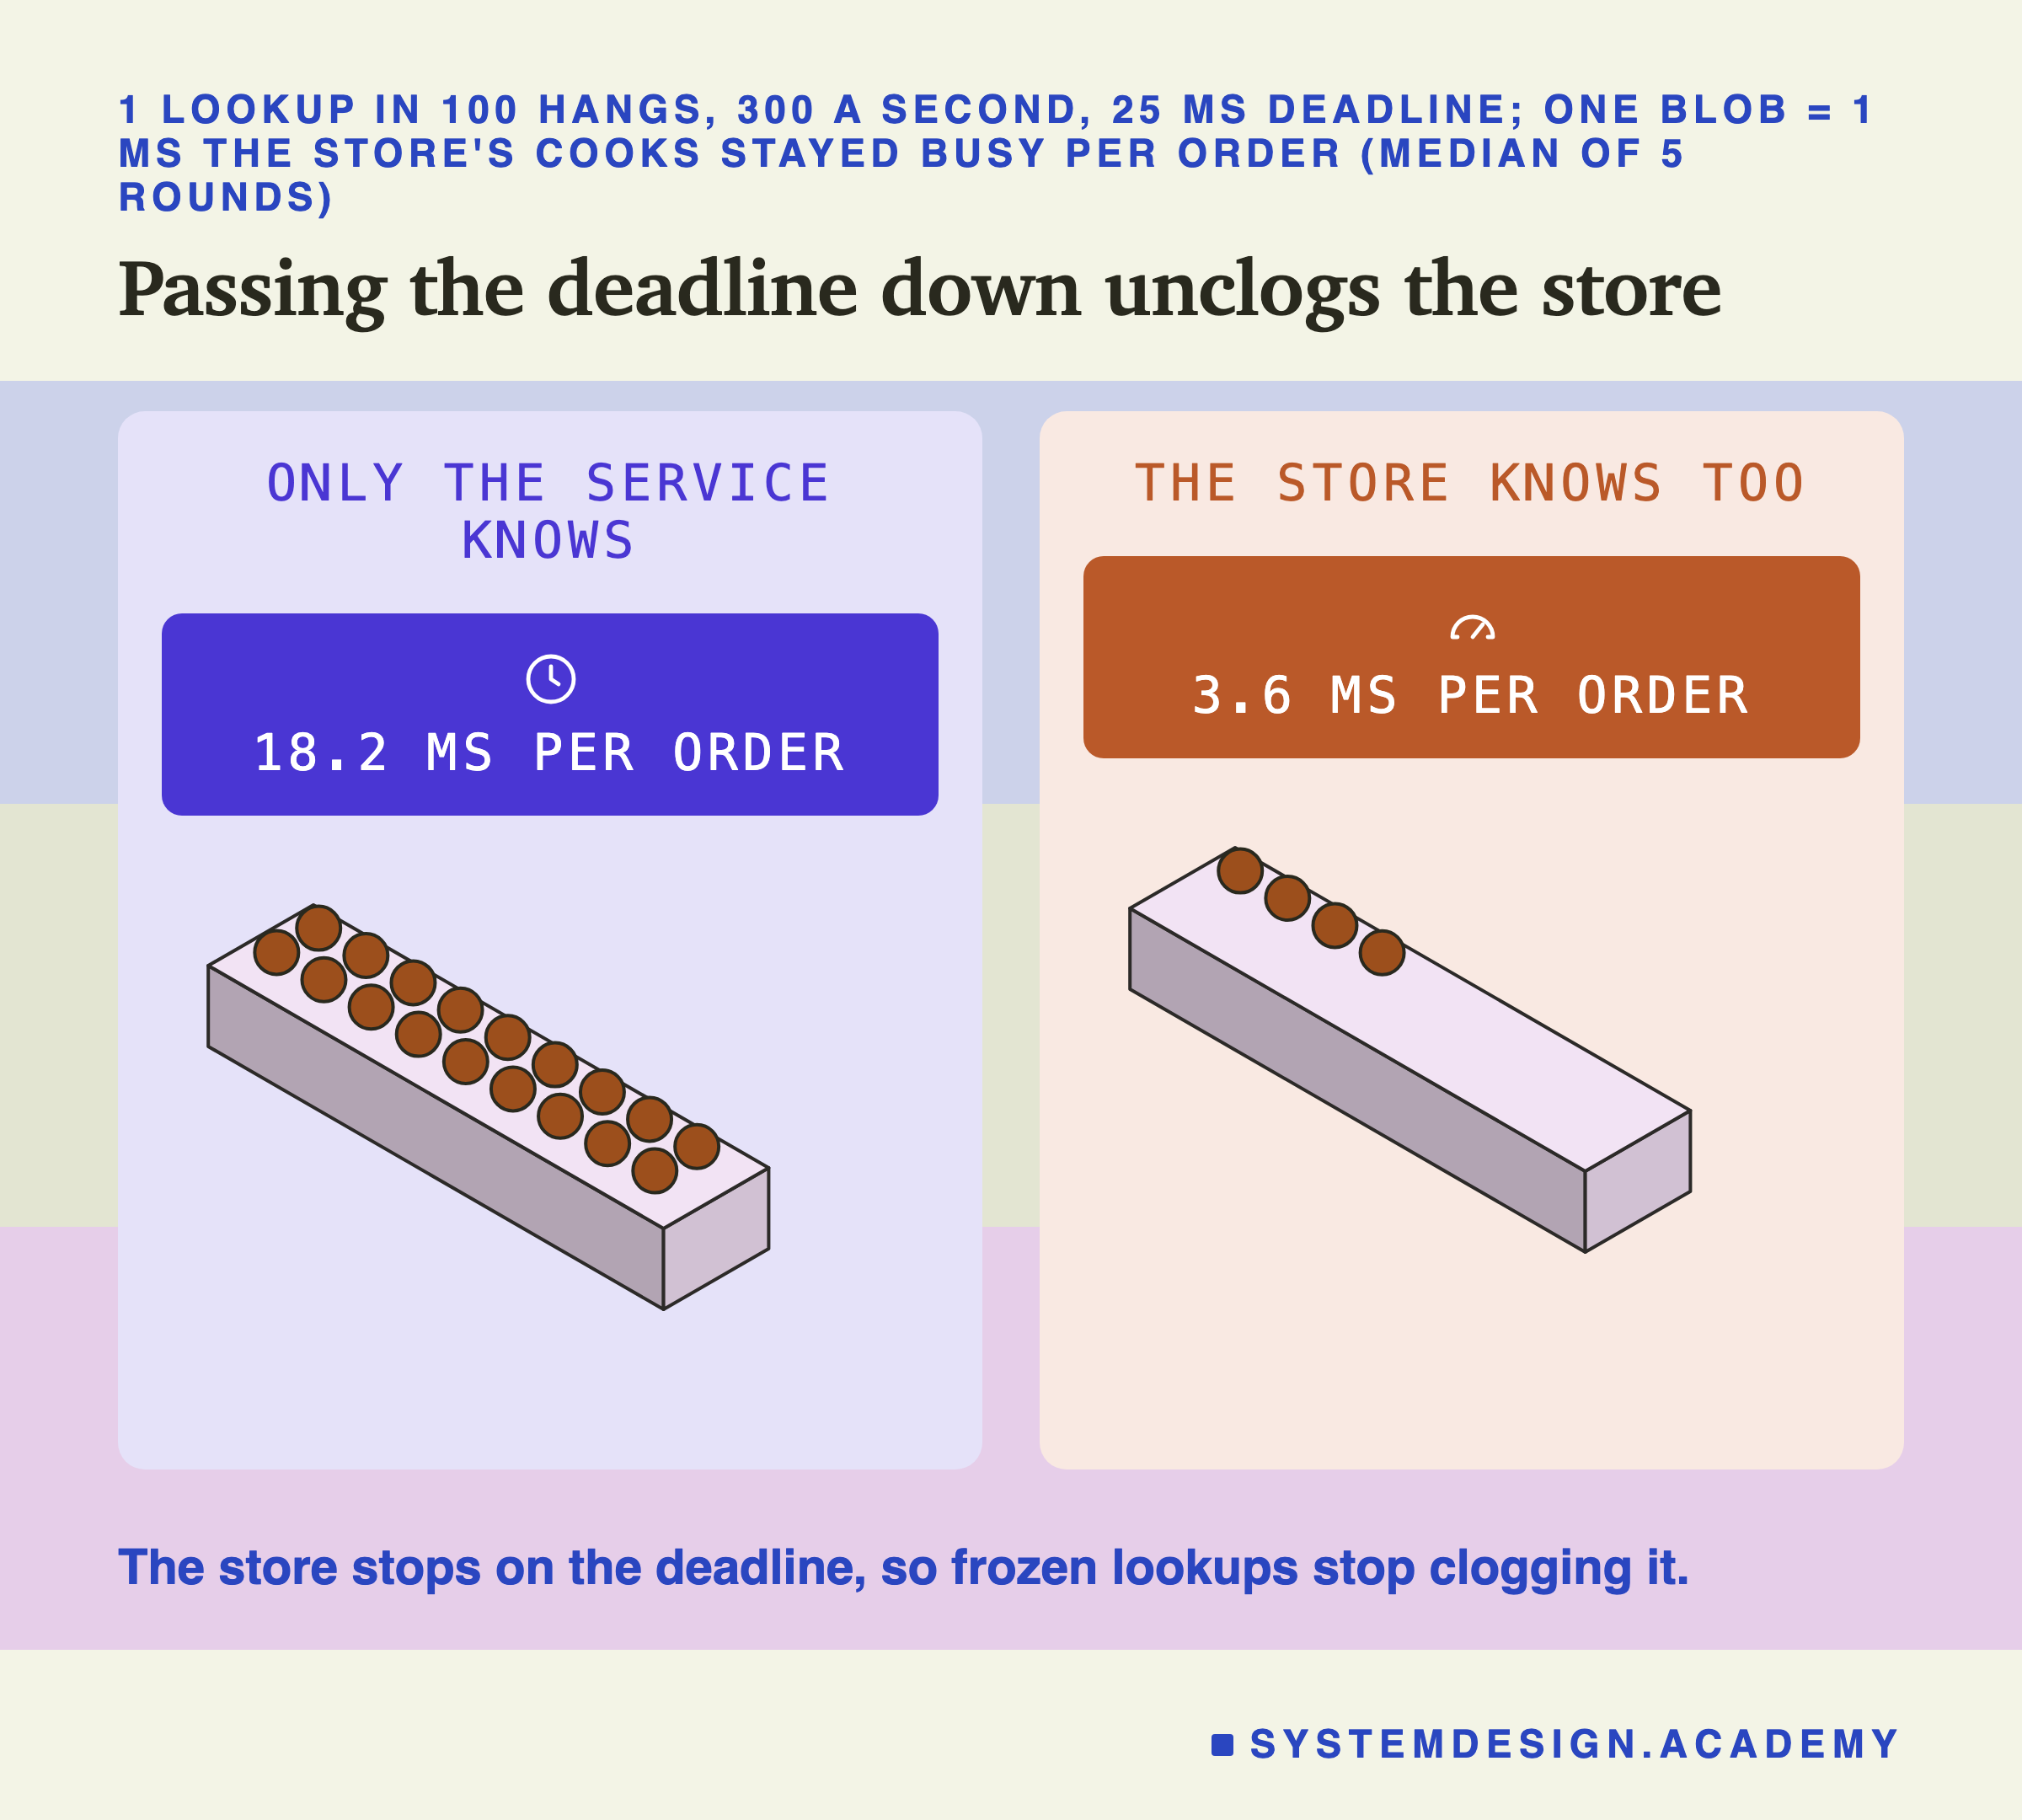
The store did five times less work. I measured how long the store's cooks stayed busy per order. It was 18.2 ms when only the service knew the deadline. It was 3.6 ms when the store knew it too. That was clearly different, in every round. Almost all of the saving is the freezes: without the deadline, the store kept each one for 1 to 2 seconds, for nobody. 727 lookups were cut short across the 5 rounds.
The user saw little difference here. At 300 a second, the slowest 1 in 100 and the share of stand-ins were too close to call. At 450 a second, the stand-ins were 1.79% to 2.24% with the deadline passed down. With a plain 25 ms limit they were 1.49% to 4.92%. That is too close to call again. With 16 slots and these speeds, the store had room even when freezes held some cooks for nobody.
I guessed that passing the deadline down would cut stand-ins at 450 a second, and that guess was wrong. Its benefit here was the store's work, and the next slides show why the store's work matters so much.
Retries: Calm at 300, a Flood at 450
A retry asks the store again after a timeout. At 300 requests a second, it worked well.
With up to two retries straight away, no request needed a stand-in in any round, and the slowest 1 in 100 took 29.1 ms. That is close to expected, because a second try draws its own wait and rarely freezes too. The measured part is the price: 1.7% more calls to the store.
Amazon and Google both recommend waiting a short random time before trying again, called backoff with jitter. Here it gave the same zero stand-ins, but a longer wait for the slowest: 34.1 ms against 29.1 ms, clearly different in all five rounds. At this calm speed, the pause only made slow requests slower.
Then I ran the same arms at 450 requests a second.
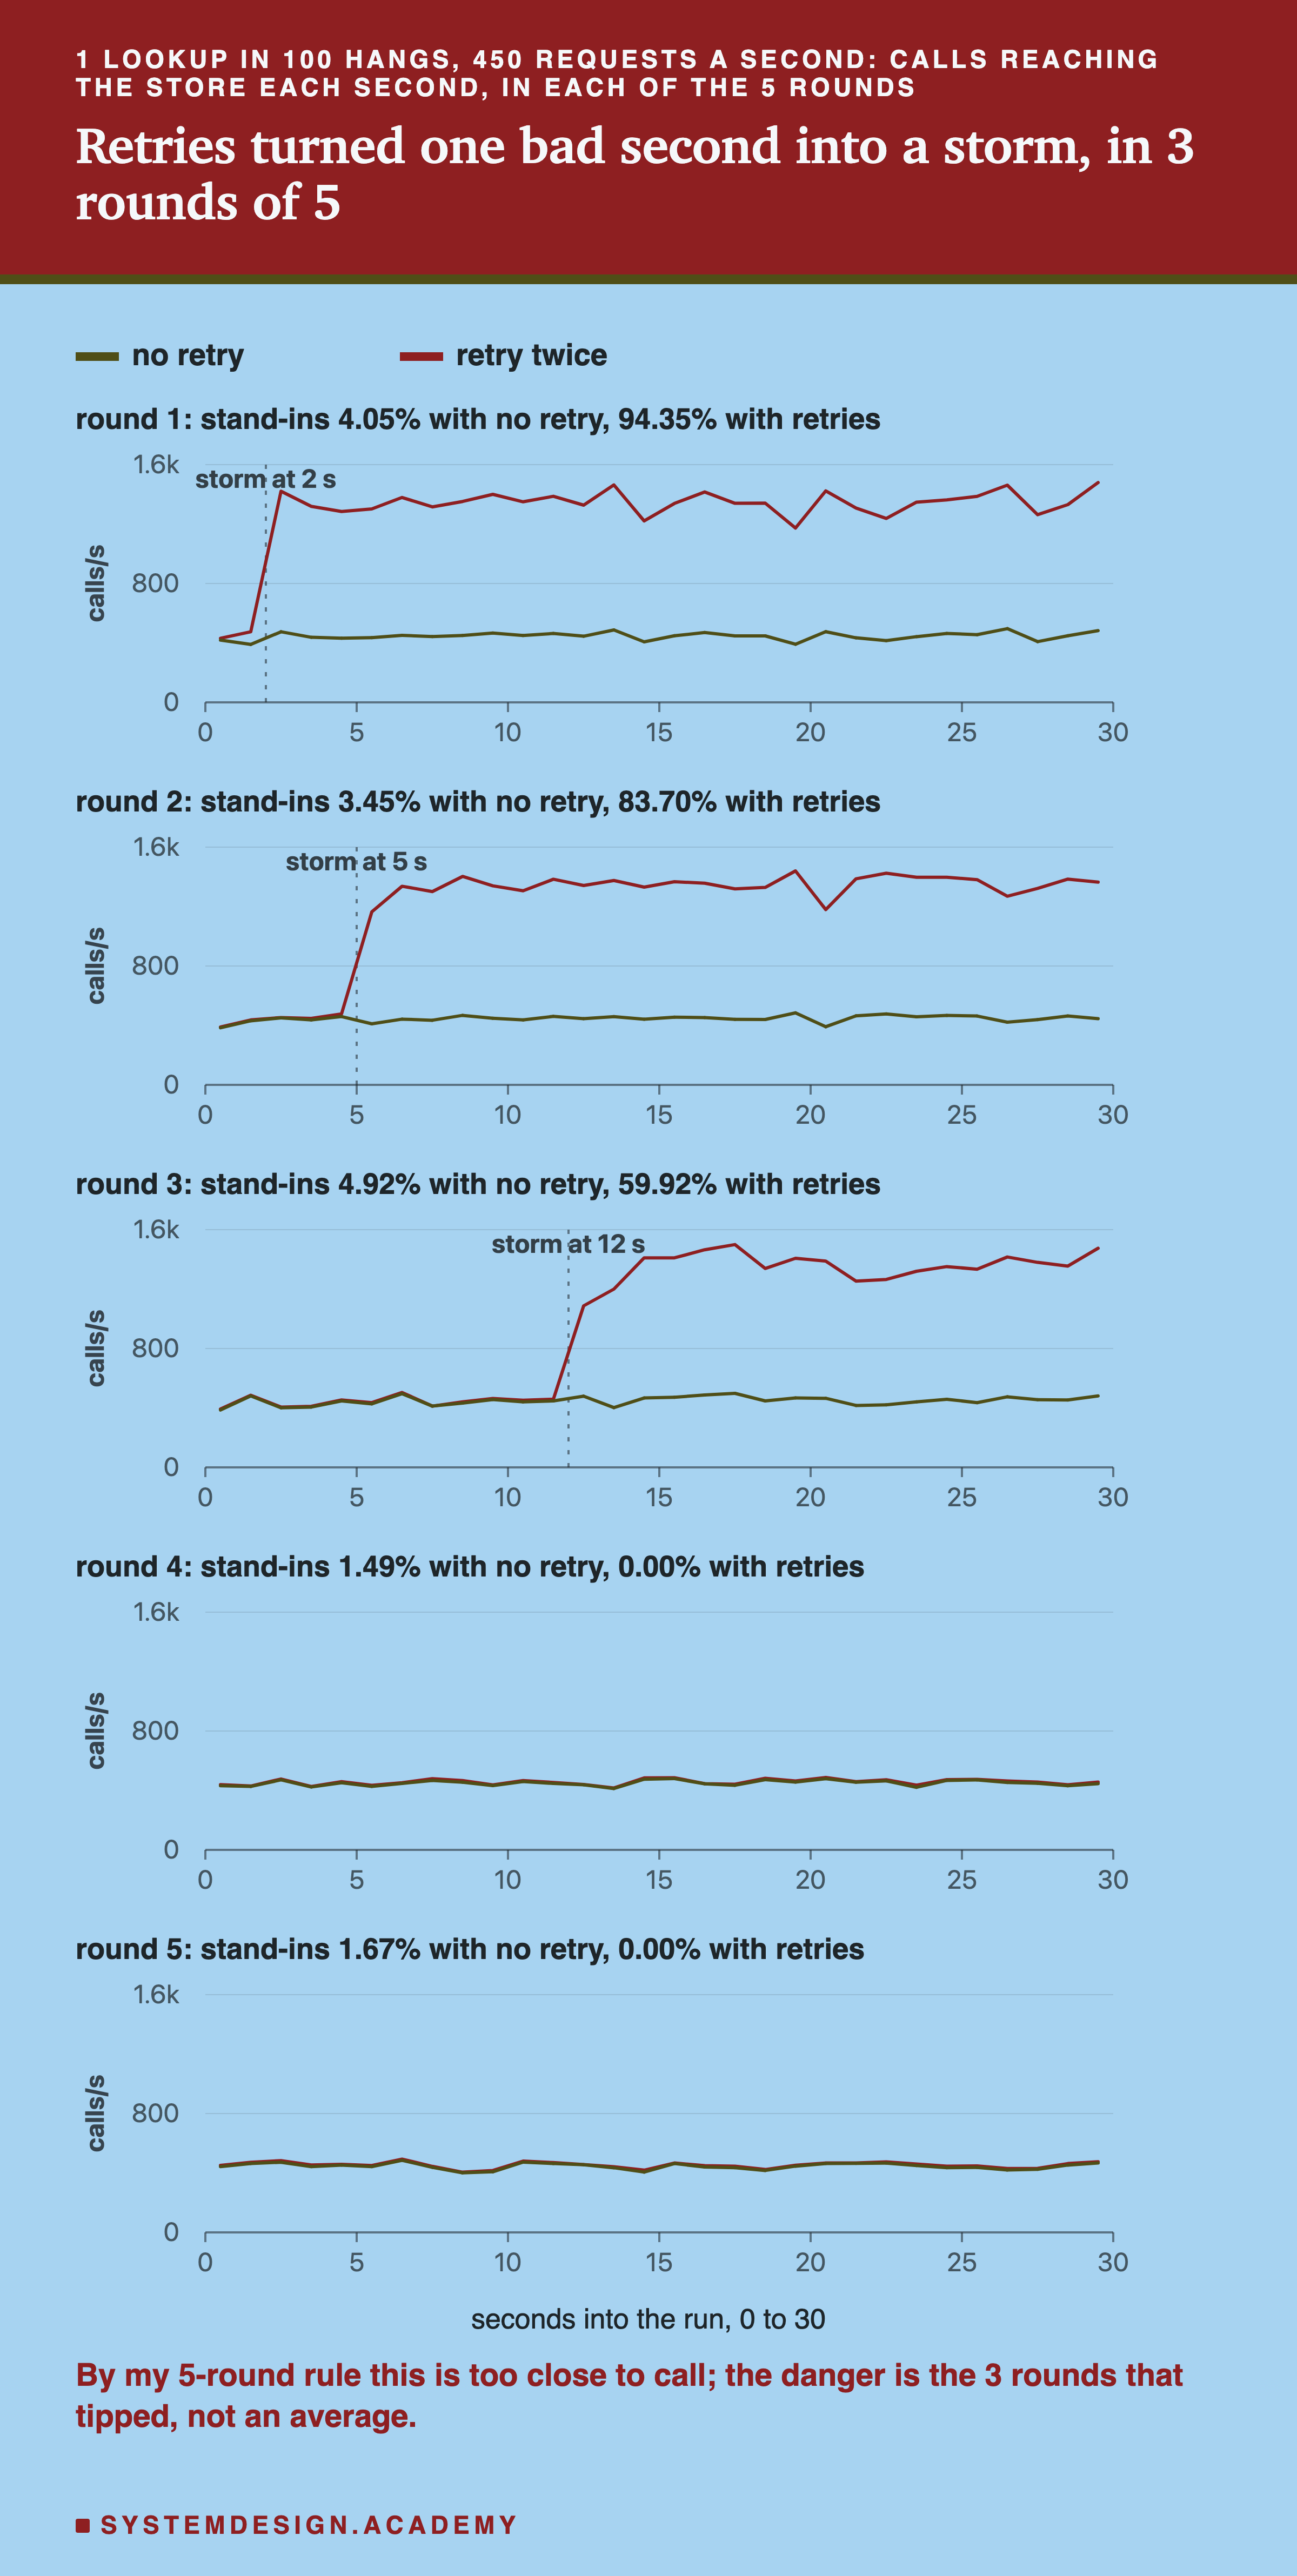
One bad second became a flood that did not end, in 3 of 5 rounds. In round 1, between 2 and 3 seconds in, several freezes arrived close together and filled the store's slots. Without retries, the store got through it in about a second: 4.05% stand-ins over the whole run. With retries, every lookup that timed out came back for a second and third try. The calls jumped from about 450 to about 1,400 a second, and stayed there. 94.3% of answers were stand-ins.
Rounds 2 and 3 tipped the same way, at 5 and 12 seconds, with 83.7% and 59.9% stand-ins. Each time, the flood began in the very second that the arm without retries had its worst moment.
By my own rule, this is too close to call. In 3 rounds retries were far worse (60% to 94% stand-ins, against 3% to 5%), and in 2 rounds slightly better (0%, against 1.5% to 1.7%). The danger is the 3 rounds that tipped, not an average.
The pause did not help. I tried immediate retries, a fixed pause and a random pause. All three tipped in the same 3 rounds, with shares of stand-ins within one request of each other. I had guessed that a random pause would stop the flood, and that guess was wrong.
Why the Flood Could Not End
The arithmetic is simple, and it explains both the flood and why the pause could not stop it.
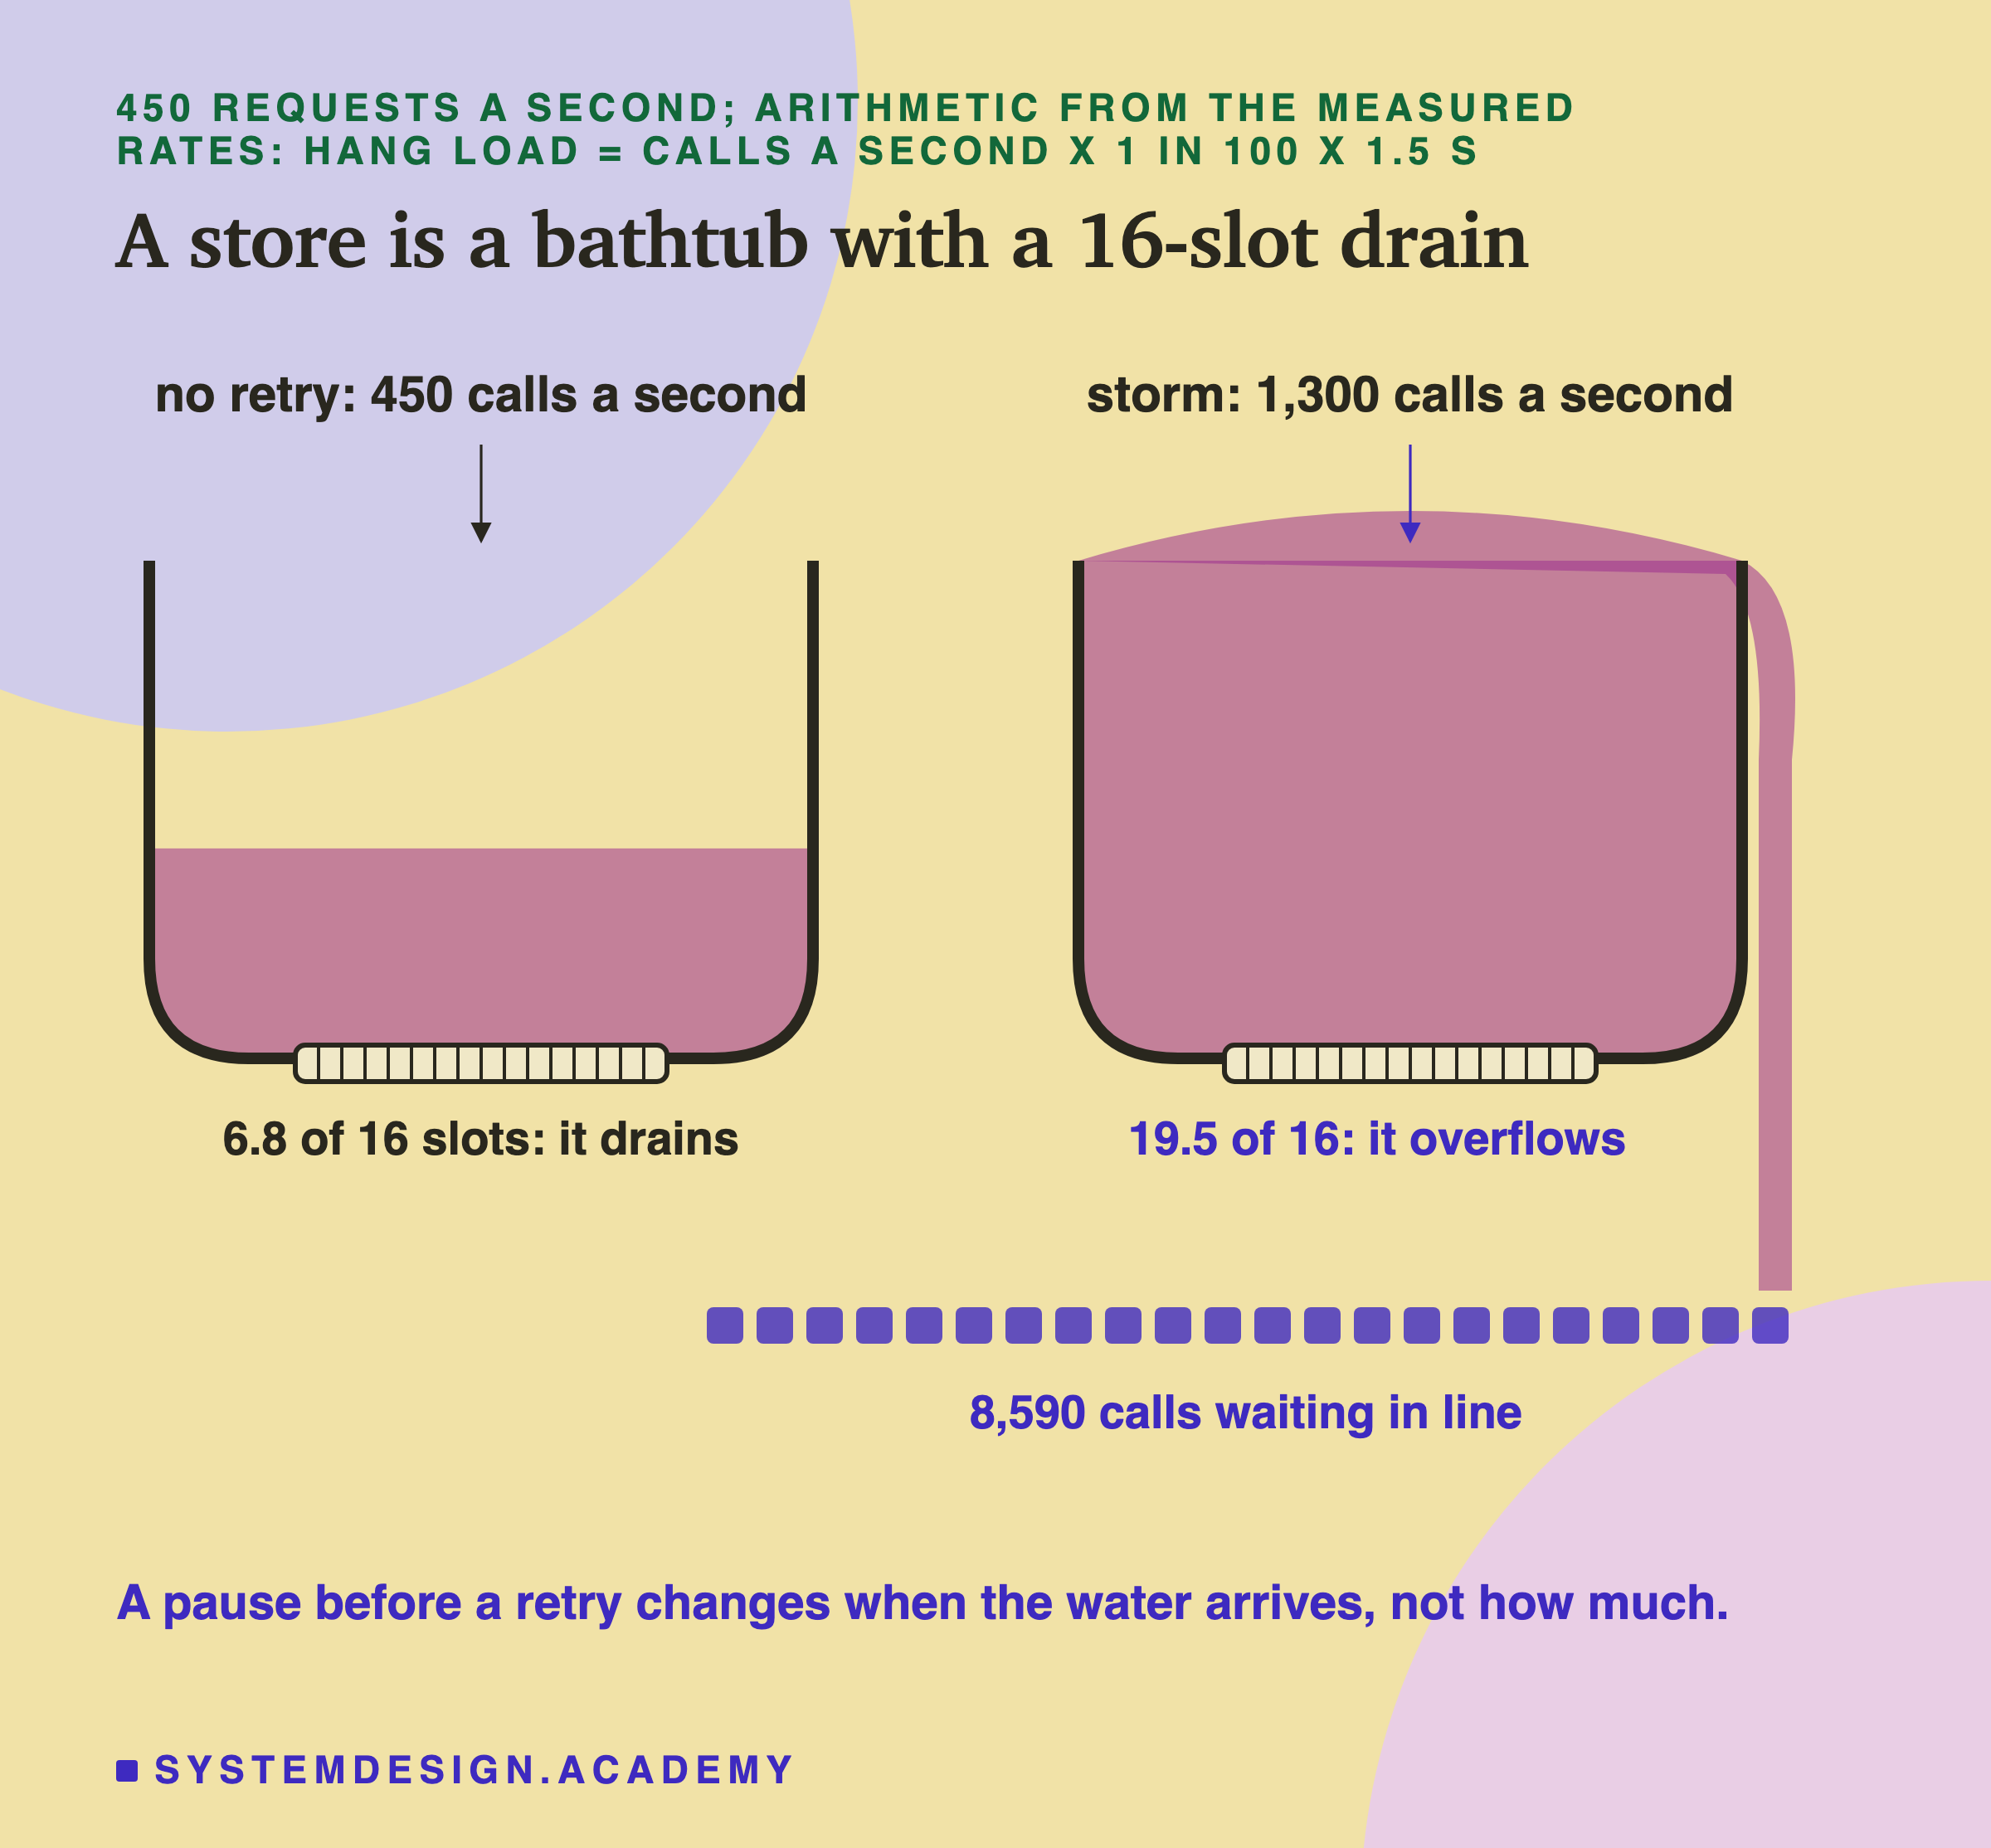
Every call has a 1 in 100 chance to freeze, and a frozen call keeps a slot busy for 1.5 seconds on average. At 450 calls a second, the freezes alone keep about 6.8 slots busy. That leaves room in a 16-slot store, so a bad second drains away.
In the flood, the calls tripled to about 1,300 a second. Now the freezes alone need about 19.5 slots, more than the store has. The line of waiting calls can only grow. The line reached 8,590 calls. The core was not the problem: during the floods, the service used only 25% to 33% of it.
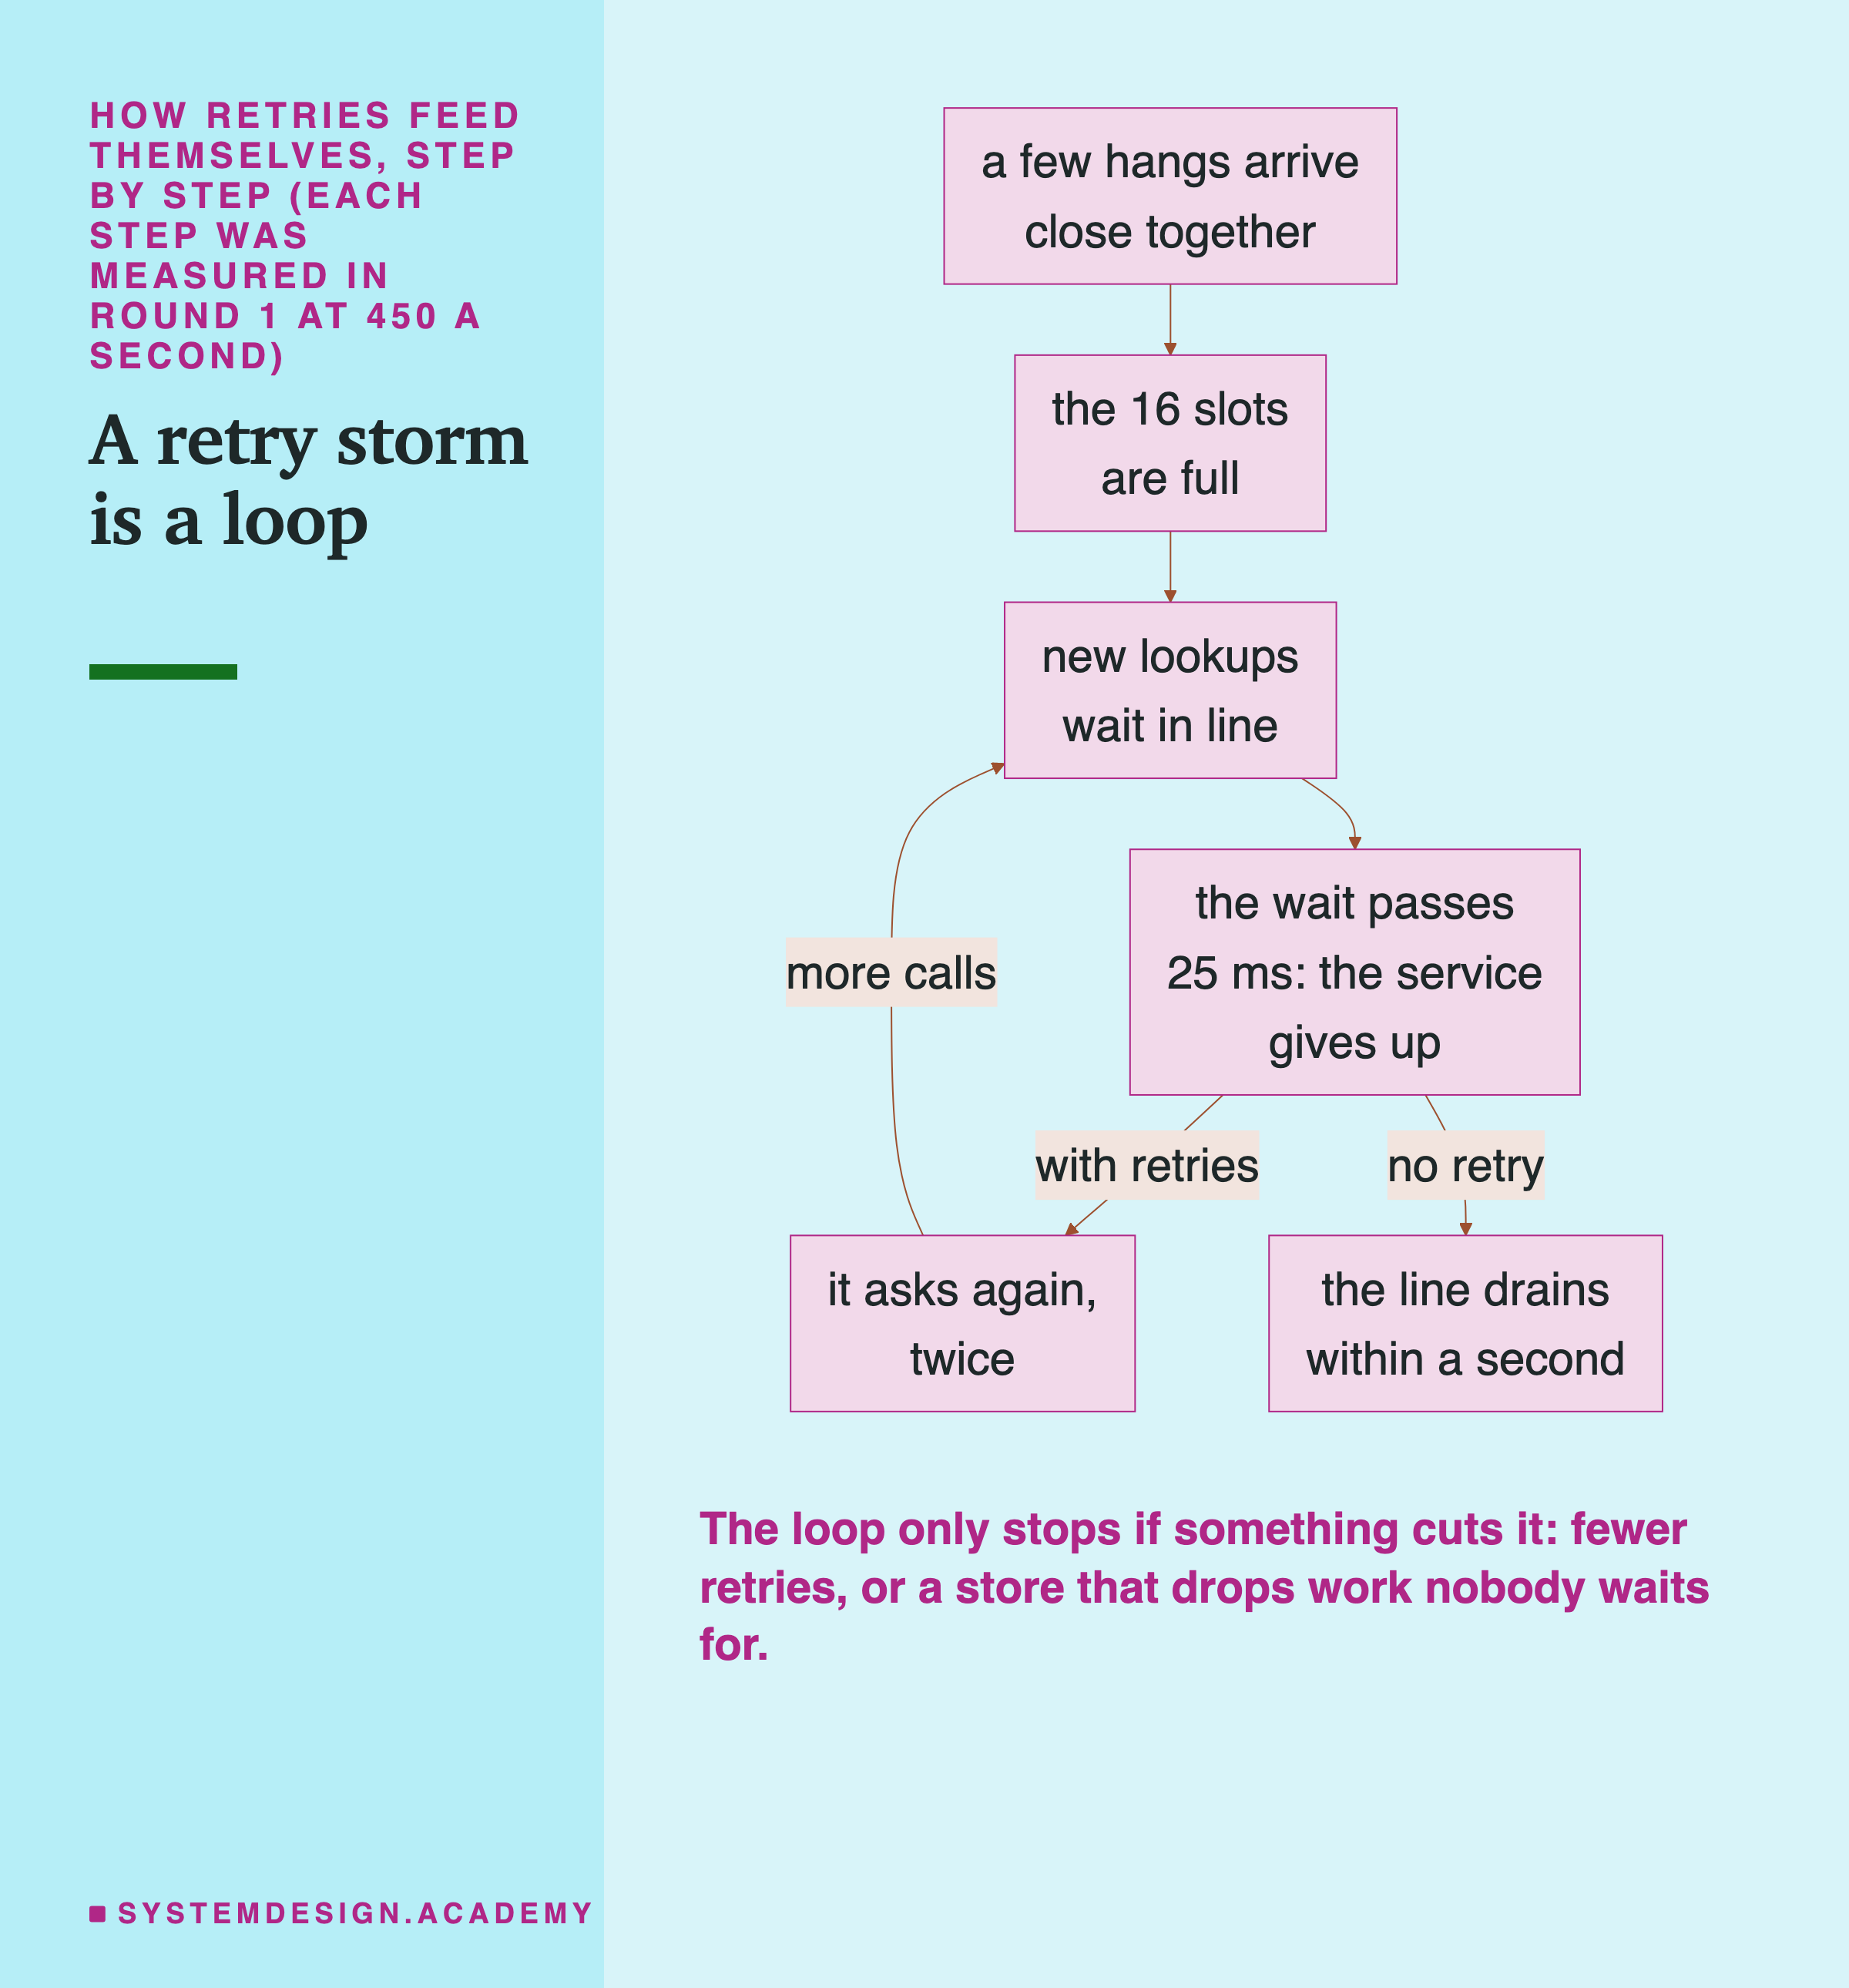
So the flood is a loop. The slots fill, new lookups wait, the wait passes 25 ms, the service asks again, and that adds more lookups to the line. A pause of up to 10 ms, then up to 20 ms, changes when a retry is sent, not how many are sent. So it cannot shrink a load that is too big.
Amazon's engineering articles warn about exactly this: "When failures are caused by overload, retries that increase load can make matters significantly worse." Google's SRE book suggests a retry budget, a cap such as "no more than 60 second tries a minute" in one program: "Consider having a server-wide retry budget". I did not test a retry budget, or retries together with a deadline passed down. Both are the obvious next arms.
Asking Twice on Purpose
A hedged request sends a second lookup if the first has not answered after a short wait, and uses whichever answer comes first. Jeff Dean and Luiz Barroso describe it in "The Tail at Scale": a client "falls back on sending a secondary request after some brief delay". They suggest waiting for "the 95th-percentile expected before issuing the hedged request", which means the wait that 95 in 100 normal lookups beat. Here that is about 10 ms.
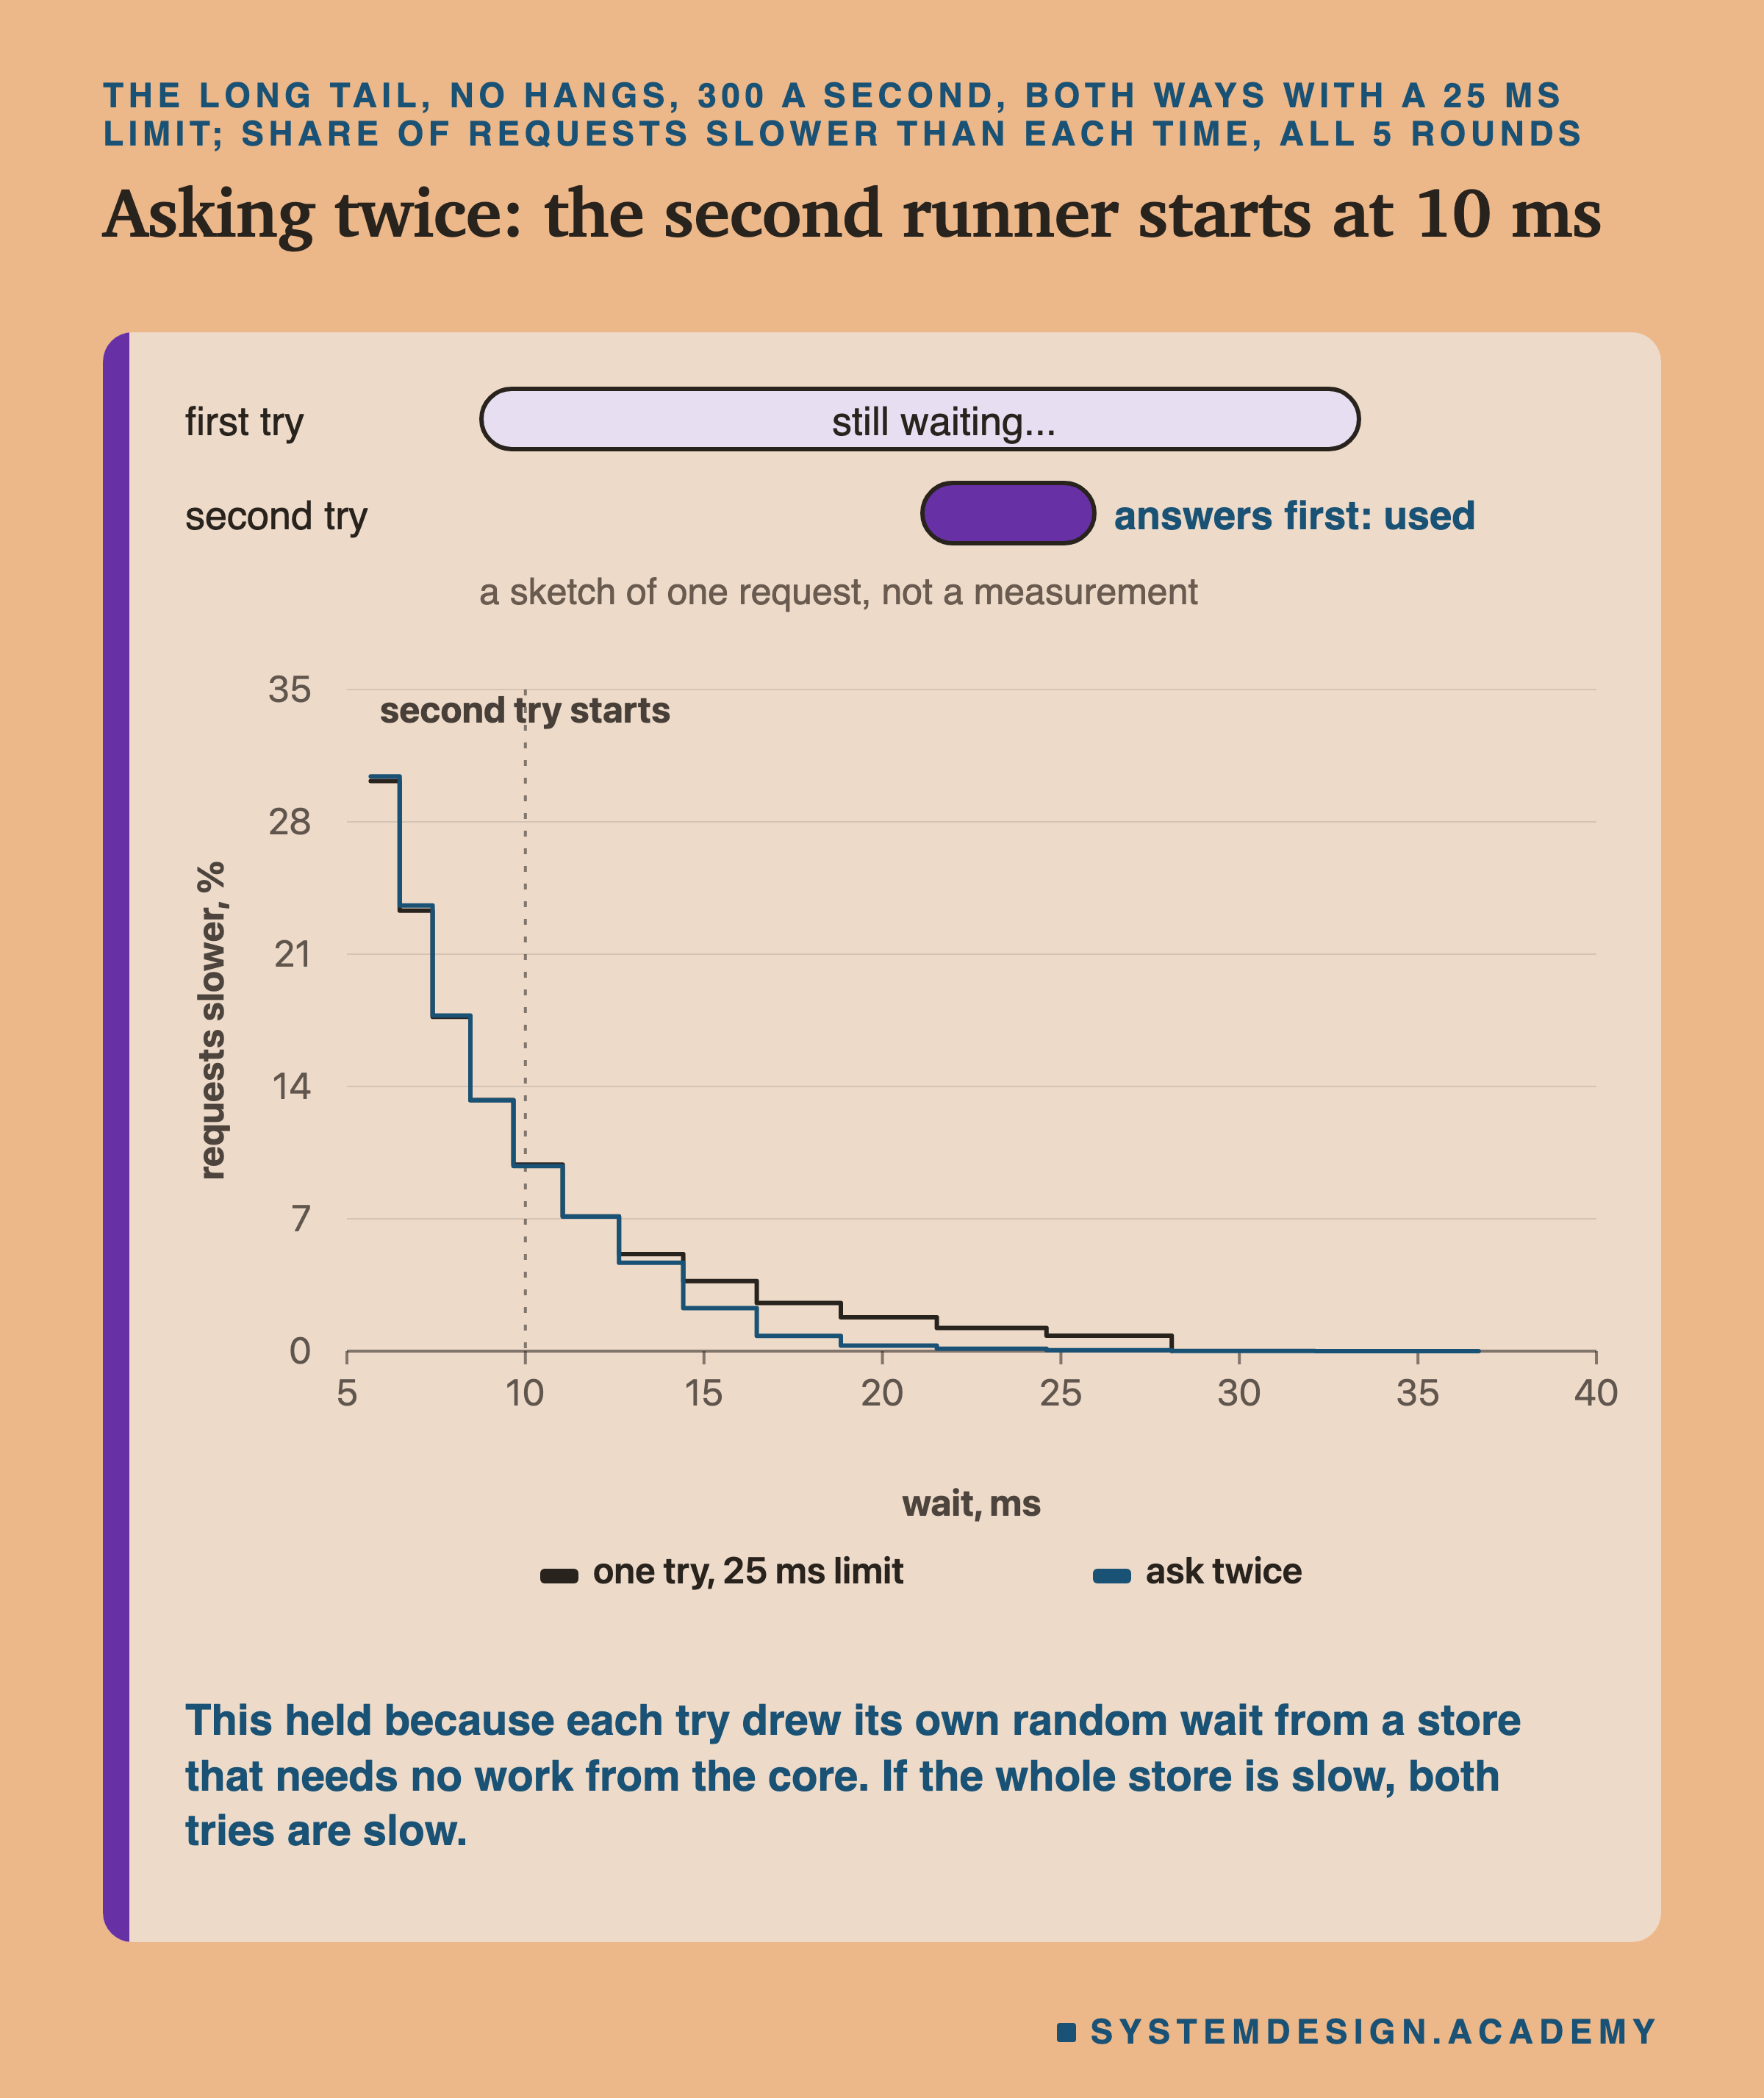
It cut the slowest waits for a small price. I compare it with the plain 25 ms limit, because the hedge also had a 25 ms limit. With the long tail and no freezes, the slowest 1 in 100 fell from 23.0 to 16.0 ms, clearly different, for 5.7% more calls. With freezes, it fell from 25.7 to 16.6 ms, and stand-ins fell from 1.62% to 0.04%. Asking twice worked on one core because waiting lookups need no work from the core.
Be careful with this result. In my store, the second lookup always drew its own, separate wait. In real life the second request goes to another copy of the store. That helps only if the two copies are not slow at the same time. If the whole store is overloaded, asking twice adds load just like a retry. I did not run hedging at 450 a second.
My Fifteen Guesses Before the Run, Checked
I wrote fifteen guesses in the note at the top of the lab's file before it ran. Each is quoted here word for word. Eight were right and seven were wrong.
The guesses use short codes for the arms. The first letter is the kind of wait: H for freezes ("hangs"), L for the long tail, F for the fixed 2 ms. The number is the speed: 3 for 300 requests a second, 4 for 450.
After the dash comes the way. none is no limit, t25 is a 25 ms limit with an error, and fb25 adds a stand-in. dl is the deadline, and dldown passes it down. r2 is two retries, r2b adds a fixed pause and r2bj a random pause. hedge is asking twice.
S is the most answers a second the service could give. Inside the quotes, p99 means the slowest 1 in 100, max means the single slowest, and "told apart" is my rule for clearly different.
-
"G1. S between 600 and 1,000 answers a second." Right: 934.1.
-
"G2. H3-none p99 above 1,000 ms and max above 1,500 ms in every round; F3-none p99 below 10 ms in every round." (Freezes and no limit, and the healthy store.) Wrong: round 4 drew only 66 freezes in 8,922 requests, and its slowest 1 in 100 took 29.6 ms.
-
"G3. H3-tT p99 between T and T + 10 ms in every round, for T = 10, 25, 50, 100." (A limit of T ms with an error.) Wrong, for the same round 4: with 50 and 100 ms limits it took 29.3 and 29.2 ms, below the limit.
-
"G4. H3-t25 and H3-fb25 p99 cannot be told apart (the fallback costs no time)." (An error against a stand-in.) Right, but true by design: both stop at the same 25 ms.
-
"G5. H3-fb25 fallback share between 1.0% and 2.5% in every round." (The stand-in arm.) Right: 1.33% to 1.91%.
-
"G6. H3-dldown holds the store's slots for at most a third of H3-dl's slot-seconds per request, in every round." (Deadline passed down against kept by the service.) Right: 3.5 to 3.6 ms against 14.3 to 18.8 ms.
Try It Yourself
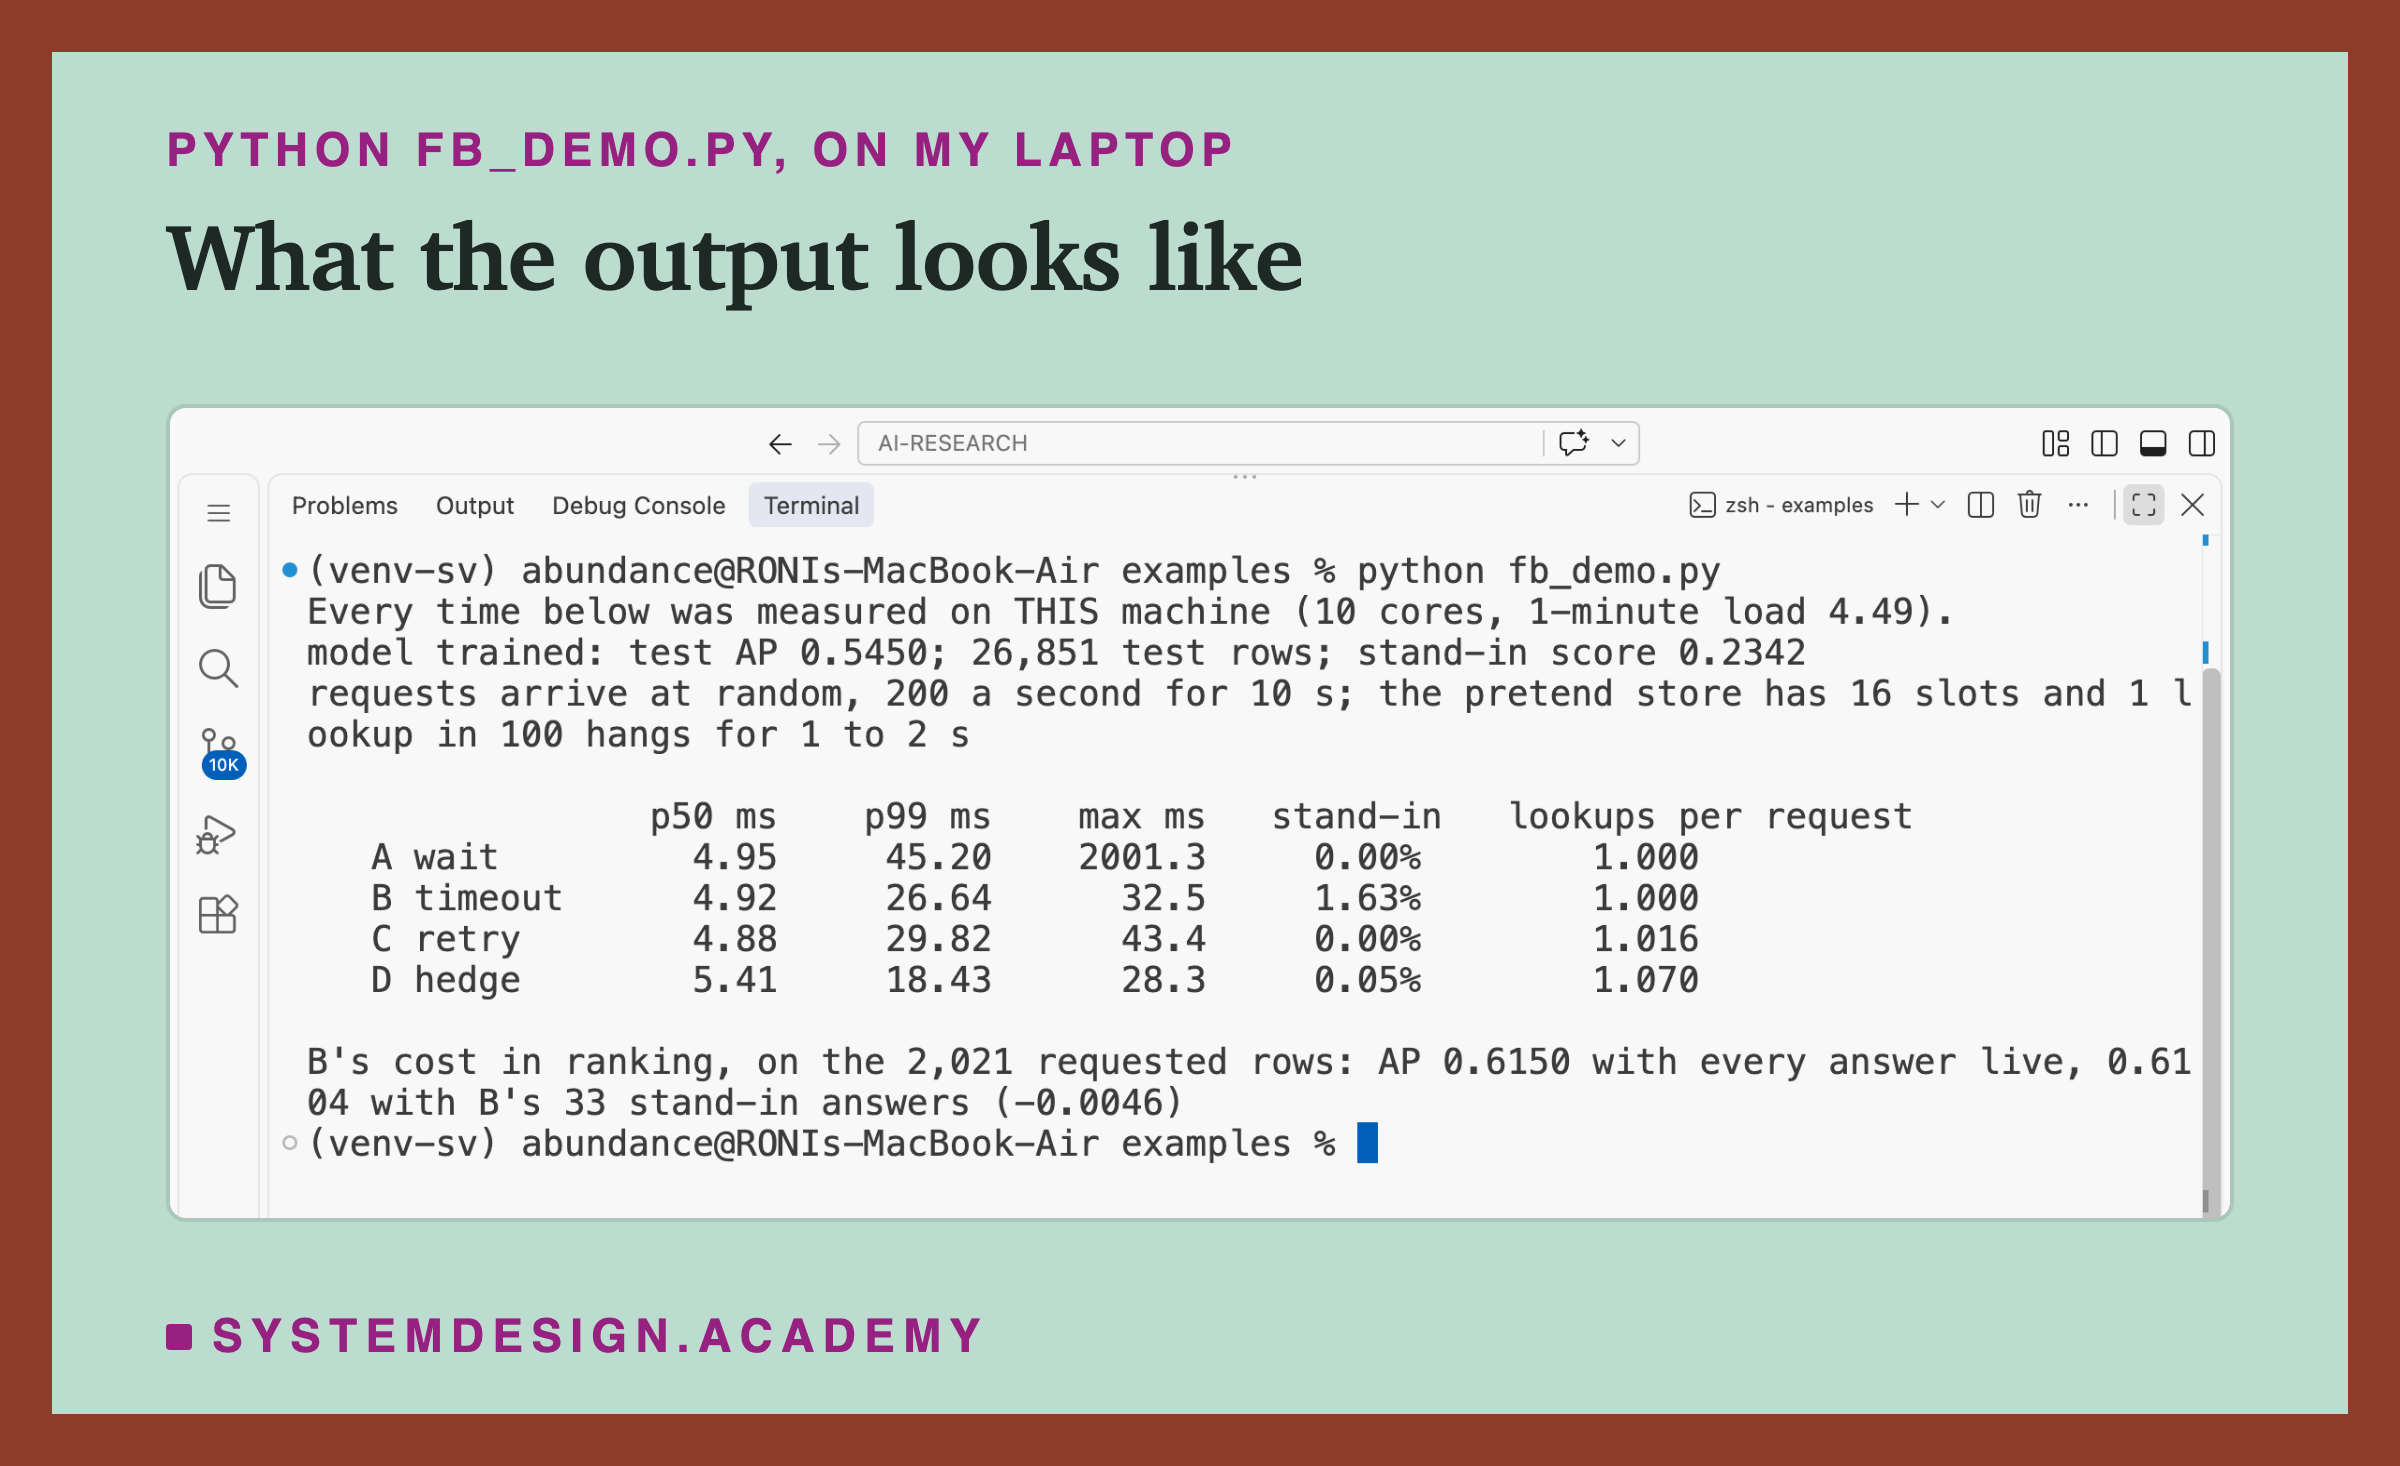
The full lab needs a rented computer and about an hour and a quarter. The demo, fb_demo.py, runs on your own computer. It starts a small service with a slow pretend store inside it. Then it tries four ways to handle the slow lookups: wait, give up at 25 ms with a stand-in, retry, and ask twice.
I wrote the demo's design in the note at the top of its file, after the lab's design and before the demo first ran.
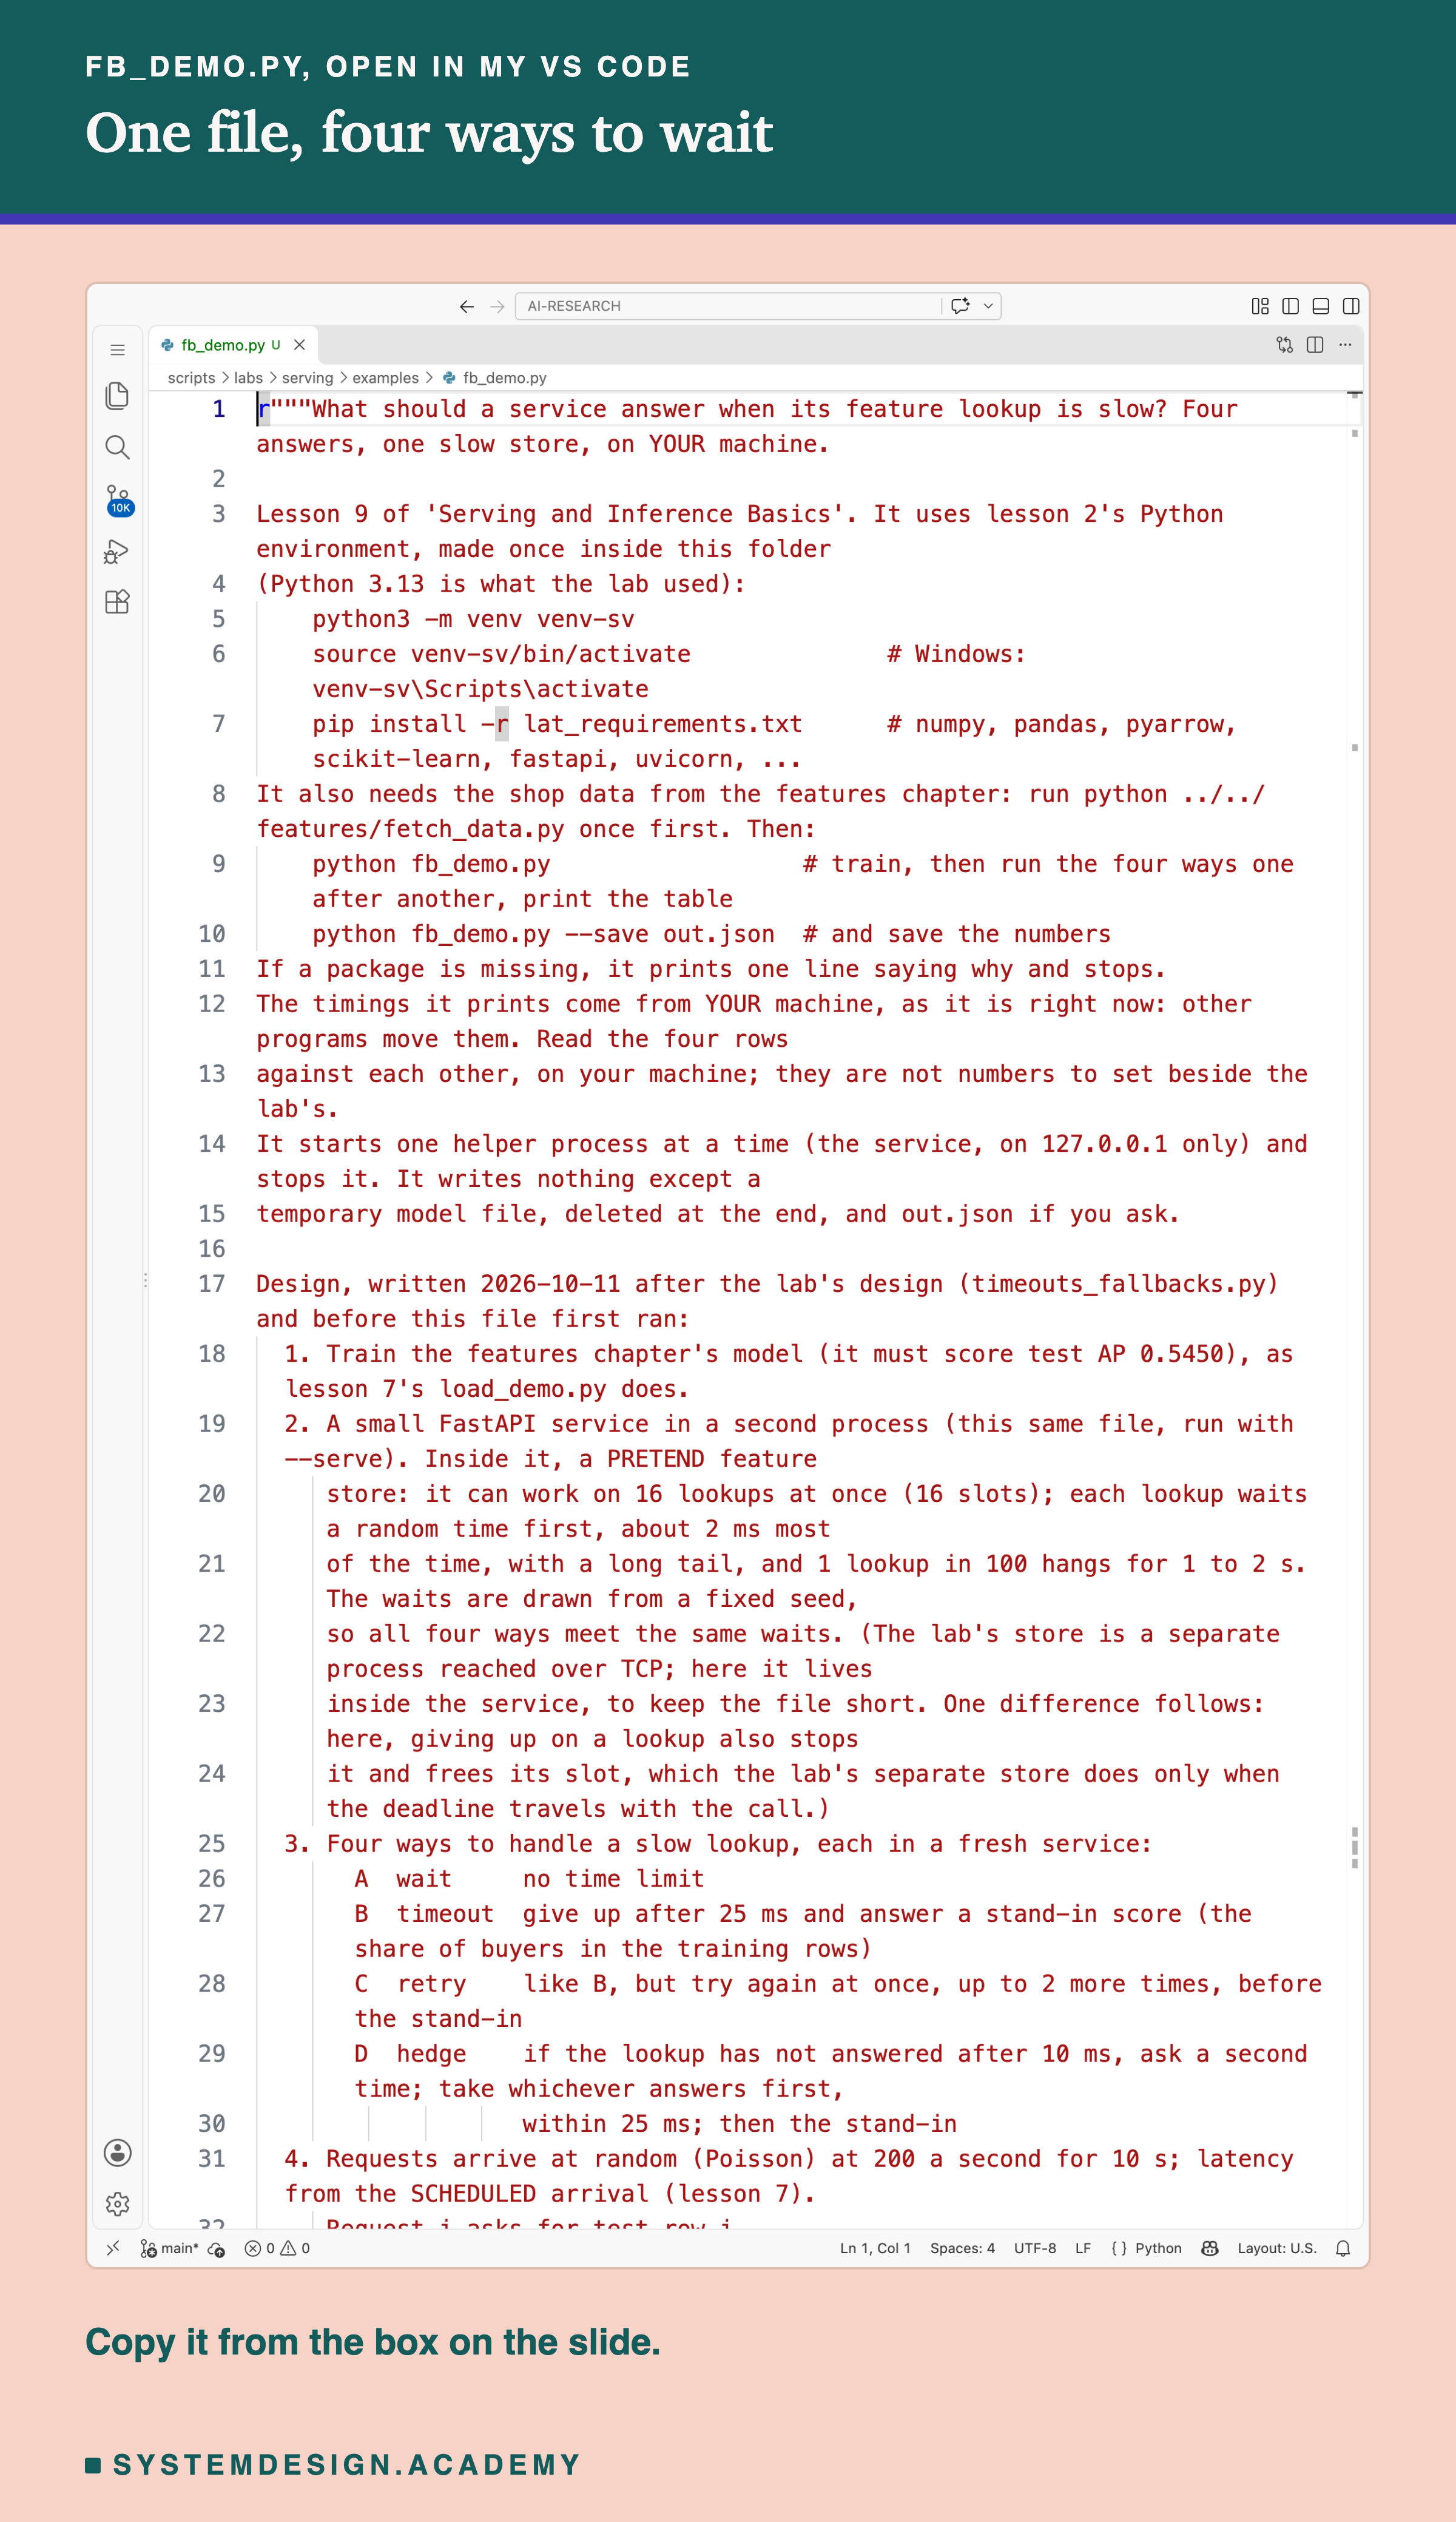
The note lists what the demo needs and the order it works in. It trains the model, starts the service with the pretend store, runs the four ways one after another, and prints a table. It also says plainly that the times it prints come from your own computer.
Before you run this lab. The demo uses lesson 2's Python toolbox folder, with the same tool versions as the lab's computer. If you made it for lessons 2 to 8, use it again. If not, make it once, inside the scripts/labs/serving/examples folder:
python3 -m venv venv-sv
source venv-sv/bin/activate        # on Windows: venv-sv\Scripts\activate
pip install -r lat_requirements.txt
I used Python 3.13. Then run python ../../features/fetch_data.py once, which downloads the shop data. Now run python fb_demo.py. It needs no graphics card and no cloud account. Its service runs only on your own computer, never on the internet, and stops at the end. If a tool is missing, it prints one line saying why and stops.
The first line it prints says the times come from your computer, with its number of cores and how busy it is at that moment. Read the four rows against each other, on your computer. Do not set them beside the lab's numbers. One difference from the lab: in the demo the store lives inside the service, so giving up on a lookup also frees its slot.
r"""What should a service answer when its feature lookup is slow? Four answers, one slow store, on YOUR machine.

Lesson 9 of 'Serving and Inference Basics'. It uses lesson 2's Python environment, made once inside this folder
(Python 3.13 is what the lab used):
    python3 -m venv venv-sv
    source venv-sv/bin/activate              # Windows: venv-sv\Scripts\activate
    pip install -r lat_requirements.txt      # numpy, pandas, pyarrow, scikit-learn, fastapi, uvicorn, ...
It also needs the shop data from the features chapter: run python ../../features/fetch_data.py once first. Then:
    python fb_demo.py                  # train, then run the four ways one after another, print the table
    python fb_demo.py --save out.json  # and save the numbers
If a package is missing, it prints one line saying why and stops.
The timings it prints come from YOUR machine, as it is right now: other programs move them. Read the four rows
against each other, on your machine; they are not numbers to set beside the lab's.
It starts one helper process at a time (the service, on 127.0.0.1 only) and stops it. It writes nothing except a
temporary model file, deleted at the end, and out.json if you ask.

Design, written 2026-10-11 after the lab's design (timeouts_fallbacks.py) and before this file first ran:
  1. Train the features chapter's model (it must score test AP 0.5450), as lesson 7's load_demo.py does.
  2. A small FastAPI service in a second process (this same file, run with --serve). Inside it, a PRETEND feature
     store: it can work on 16 lookups at once (16 slots); each lookup waits a random time first, about 2 ms most
     of the time, with a long tail, and 1 lookup in 100 hangs for 1 to 2 s. The waits are drawn from a fixed seed,
     so all four ways meet the same waits. (The lab's store is a separate process reached over TCP; here it lives
     inside the service, to keep the file short. One difference follows: here, giving up on a lookup also stops
     it and frees its slot, which the lab's separate store does only when the deadline travels with the call.)
  3. Four ways to handle a slow lookup, each in a fresh service:
       A  wait     no time limit
       B  timeout  give up after 25 ms and answer a stand-in score (the share of buyers in the training rows)
       C  retry    like B, but try again at once, up to 2 more times, before the stand-in
       D  hedge    if the lookup has not answered after 10 ms, ask a second time; take whichever answers first,
                   within 25 ms; then the stand-in
  4. Requests arrive at random (Poisson) at 200 a second for 10 s; latency from the SCHEDULED arrival (lesson 7).
     Request j asks for test row j.
  5. Print for each: p50, p99 and max; the share of stand-in answers; lookups per request. Then, for B, the ranking
     cost: the model's AP on the requested rows with every answer live, and with B's stand-in answers.

Author: Roni Das
Created: 2026-10-11
"""
import importlib.util
import json
import os
import socket
import subprocess
import sys
import tempfile
import threading
import time
from pathlib import Path
from queue import Queue
from time import perf_counter

NEEDED = ("numpy", "pandas", "pyarrow", "sklearn", "fastapi", "uvicorn")
missing = [m for m in NEEDED if importlib.util.find_spec(m) is None]
if missing:
    sys.exit(f"fb_demo.py needs {', '.join(missing)}: make the environment in its docstring "
             f"(pip install -r lat_requirements.txt), then run it with that environment's python.")

import numpy as np  # noqa: E402

RATE, SECONDS = 200, 10.0
WAYS = {"A wait": {"timeout": None, "retries": 0, "hedge": None},
        "B timeout": {"timeout": 0.025, "retries": 0, "hedge": None},
        "C retry": {"timeout": 0.025, "retries": 2, "hedge": None},
        "D hedge": {"timeout": 0.025, "retries": 0, "hedge": 0.010}}


# ───────────────────────────── the service (python fb_demo.py --serve PORT FILE WAY) ─────────────────────────────
def serve(port: int, data_path: str, way: str) -> None:
    import asyncio
    import pickle

    import uvicorn
    from fastapi import FastAPI, Request
    from starlette.responses import Response

    os.environ["OMP_NUM_THREADS"] = "1"
    d = pickle.loads(Path(data_path).read_bytes())
    model, X, stand_in = d["model"], d["X"], d["stand_in"]
    w = WAYS[way]
    rng = np.random.default_rng(0)                    # the same waits for all four ways
    wait = 0.002 * np.exp(rng.standard_normal((len(X), 3)))
    hang = rng.random((len(X), 3)) < 0.01
    wait = np.where(hang, rng.uniform(1.0, 2.0, (len(X), 3)), wait)
    calls = [0]
    app = FastAPI()
    slots: list = []

    async def store(row: int, attempt: int) -> list[float]:
        """The pretend feature store: wait for one of 16 slots, hold it for the drawn time, answer."""
        if not slots:
            slots.append(asyncio.Semaphore(16))
        calls[0] += 1
        async with slots[0]:
            await asyncio.sleep(float(wait[row, attempt]))
        return X[row].tolist()

    async def lookup(row: int):
        if w["timeout"] is None:                                      # A: no limit
            return await store(row, 0)
        if w["hedge"] is not None:                                    # D: a second ask after 10 ms
            first = asyncio.ensure_future(store(row, 0))
            done, _ = await asyncio.wait({first}, timeout=w["hedge"])
            if done:
                return first.result()
            second = asyncio.ensure_future(store(row, 1))
            done, pending = await asyncio.wait({first, second}, timeout=w["timeout"] - w["hedge"],
                                               return_when=asyncio.FIRST_COMPLETED)
            for p in pending:
                p.cancel()                         # we stop waiting; the pretend store frees its slot
            return next(iter(done)).result() if done else None
        for attempt in range(1 + w["retries"]):                       # B and C
            try:
                return await asyncio.wait_for(store(row, attempt), w["timeout"])
            except TimeoutError:
                pass
        return None

    @app.post("/score")
    async def score(request: Request) -> Response:
        q = json.loads(await request.body())
        feats = await lookup(q["row"])
        if feats is None:
            out = {"id": q["id"], "score": stand_in, "stand_in": True}
        else:
            p = float(model.predict_proba(np.array([feats], dtype=np.float64))[0, 1])
            out = {"id": q["id"], "score": p, "stand_in": False}
        return Response(content=json.dumps(out).encode(), media_type="application/json")

    @app.get("/calls")
    async def get_calls() -> Response:
        return Response(content=json.dumps({"calls": calls[0]}).encode(), media_type="application/json")

    @app.get("/health")
    async def health() -> Response:
        return Response(content=b"ok")

    uvicorn.run(app, host="127.0.0.1", port=port, log_level="warning")


# ───────────────────────────── the model ─────────────────────────────
def build():
    """The features chapter's model and its test rows (lesson 7's load_demo.py build step)."""
    from sklearn.metrics import average_precision_score
    here = Path(__file__).resolve().parent
    sys.path.insert(0, str(here.parents[1] / "features"))
    import task
    from what_a_feature_is import HAND_COLS, hgb, joined

    ev = task.load_events()
    lab_tr, _, lab_te = task.splits(ev)
    tr = joined(ev, lab_tr, task.TRAIN_CUTOFFS)
    te = joined(ev, lab_te, task.TEST_CUTOFFS)
    model = hgb(0).fit(tr[HAND_COLS].to_numpy(float), tr["label"].to_numpy())
    X = np.ascontiguousarray(te[HAND_COLS].to_numpy(np.float64))
    p = model.predict_proba(X)[:, 1]
    y, cut = te["label"].to_numpy(), te["cutoff"].to_numpy()
    ap = float(np.mean([average_precision_score(y[cut == c], p[cut == c]) for c in np.unique(cut)]))
    assert round(ap, 4) == 0.5450, ap
    return model, X, y, cut, p, ap, float(tr["label"].mean())


# ───────────────────────────── the open-loop tester (lesson 7's) ─────────────────────────────
def connect(port: int):
    import http.client
    c = http.client.HTTPConnection("127.0.0.1", port, timeout=30)
    c.connect()
    c.sock.setsockopt(socket.IPPROTO_TCP, socket.TCP_NODELAY, 1)
    return c


def ask(c, j: int, row: int) -> dict:
    c.request("POST", "/score", body=json.dumps({"id": j, "row": row}), headers={"Content-Type": "application/json"})
    d = json.loads(c.getresponse().read())
    if d["id"] != j:
        raise SystemExit(f"answer {j} carries id {d['id']}")
    return d


def calls_so_far(port: int) -> int:
    c = connect(port)
    c.request("GET", "/calls")
    n = json.loads(c.getresponse().read())["calls"]
    c.close()
    return n


def open_loop(port: int, n_rows: int) -> tuple[np.ndarray, list[dict], int]:
    rng = np.random.default_rng(1)
    at = np.cumsum(rng.exponential(1 / RATE, size=int(RATE * SECONDS * 1.5) + 50))
    at = at[at < SECONDS]
    lats = np.zeros(len(at))
    answers: list = [None] * len(at)
    q: Queue = Queue()
    start = [0.0]

    def sender() -> None:
        c = connect(port)
        ask(c, -1, n_rows - 1)                         # warm-up of this connection, not counted
        while True:
            j = q.get()
            if j is None:
                break
            answers[j] = ask(c, j, j % n_rows)
            lats[j] = perf_counter() - (start[0] + at[j])      # from the SCHEDULED arrival
        c.close()

    pool = [threading.Thread(target=sender, daemon=True) for _ in range(64)]
    for th in pool:
        th.start()
    time.sleep(0.5)
    before = calls_so_far(port)                        # the warm-up asks, not counted
    start[0] = perf_counter() + 0.05
    for j, a in enumerate(at):
        d = start[0] + a - perf_counter()
        if d > 0:
            time.sleep(d)
        q.put(j)
    for _ in pool:
        q.put(None)
    for th in pool:
        th.join()
    return lats * 1000, answers, calls_so_far(port) - before


def run_way(way: str, data_path: str, n_rows: int) -> dict:
    s = socket.socket()
    s.bind(("127.0.0.1", 0))
    port = s.getsockname()[1]
    s.close()
    svc = subprocess.Popen([sys.executable, __file__, "--serve", str(port), data_path, way],
                           env={**os.environ, "OMP_NUM_THREADS": "1"})
    try:
        for _ in range(300):
            try:
                connect(port).close()
                break
            except OSError:
                time.sleep(0.1)
        lat, answers, calls = open_loop(port, n_rows)
    finally:
        svc.terminate()
        svc.wait()
    stand = np.array([a["stand_in"] for a in answers])
    return {"n": len(lat), "p50": float(np.percentile(lat, 50)), "p99": float(np.percentile(lat, 99)),
            "max": float(lat.max()), "stand_in_share": float(stand.mean()), "calls_per_request": calls / len(lat),
            "stand_in_rows": [j for j, a in enumerate(answers) if a["stand_in"]]}


def main() -> None:
    try:
        load = f"{os.getloadavg()[0]:.2f}"
    except (AttributeError, OSError):
        load = "not available on this system"
    print(f"Every time below was measured on THIS machine ({os.cpu_count()} cores, 1-minute load {load}).")
    model, X, y, cut, p, ap, stand_in = build()
    print(f"model trained: test AP {ap:.4f}; {len(X):,} test rows; stand-in score {stand_in:.4f}")
    import pickle
    out = {"load": load, "cores": os.cpu_count(), "test_ap": ap, "ways": {}}
    print(f"requests arrive at random, {RATE} a second for {SECONDS:.0f} s; the pretend store has 16 slots and "
          f"1 lookup in 100 hangs for 1 to 2 s\n")
    print("                p50 ms    p99 ms    max ms   stand-in   lookups per request")
    with tempfile.TemporaryDirectory() as tmp:
        dp = Path(tmp) / "data.pkl"
        dp.write_bytes(pickle.dumps({"model": model, "X": X, "stand_in": stand_in}))
        for way in WAYS:
            r = run_way(way, str(dp), len(X))
            out["ways"][way] = {k: v for k, v in r.items() if k != "stand_in_rows"}
            print(f"   {way:<10}{r['p50']:9.2f} {r['p99']:9.2f} {r['max']:9.1f} {r['stand_in_share']:9.2%}"
                  f"   {r['calls_per_request']:10.3f}")
            if way == "B timeout":
                rows_b = r["stand_in_rows"]
                n_req = r["n"]
    from sklearn.metrics import average_precision_score
    req = np.arange(n_req) % len(X)
    live = p[req]
    with_b = live.copy()
    with_b[rows_b] = stand_in
    yy, cc = y[req], cut[req]

    def ap_of(s: np.ndarray) -> float:
        return float(np.mean([average_precision_score(yy[cc == c], s[cc == c]) for c in np.unique(cc)]))

    a_live, a_b = ap_of(live), ap_of(with_b)
    print(f"\nB's cost in ranking, on the {n_req:,} requested rows: AP {a_live:.4f} with every answer live, "
          f"{a_b:.4f} with B's {len(rows_b)} stand-in answers ({a_b - a_live:+.4f})")
    out["ap"] = {"rows": n_req, "live": a_live, "with_b": a_b, "stand_ins": len(rows_b)}
    if "--save" in sys.argv:
        Path(sys.argv[sys.argv.index("--save") + 1]).write_text(json.dumps(out, indent=1))


if __name__ == "__main__":
    if len(sys.argv) > 1 and sys.argv[1] == "--serve":
        serve(int(sys.argv[2]), sys.argv[3], " ".join(sys.argv[4:]))
    else:
        main()
Play With a Make-Believe Store
This box runs in your browser and needs nothing but Python. It is a simulation: a make-believe version that counts time instead of measuring it. It has a pretend store with 16 slots, pretend waits and pretend requests. It has no model, no network and no service, so it shows how things work, not the machine's numbers. The machine's real numbers are printed under it.
Each lookup's wait is decided in advance for every request and every try, like writing down the dice rolls first. So when you switch retries or the random pause on and off, the store meets exactly the same rolls. It runs 5 seeds, because one seed is one roll of luck.
Press Run. Then try TIMEOUT_MS = None and watch the slowest 1 in 100 jump to about a second. Try RETRIES = 2: at RATE = 300 the stand-ins vanish. Then try RATE = 450 with RETRIES = 2, and watch some seeds flood while others stay calm, as on the machine. Turn on JITTER = True at that speed: the flooded seeds stay flooded. Finally try PASS_DEADLINE = True with the retries still on, and compare.
The report program writes the machine's real numbers into this box from the lab's results, and runs it. In this make-believe store, passing the deadline down stopped the flood at 450 a second. On the machine I did not test that combination, so treat it as a question, not an answer.
The Lab's Code, Piece by Piece
The lab has one file that runs on my laptop, a few small files that run on the rented computer, and the step script you saw above.
timeouts_fallbacks.py, on my laptop, holds the design and my guesses in the note at its top, written before any timed run. Its commands are prepare, check, status, collect, ap, cost and factcheck. prepare makes the last-known numbers and the default score. check makes sure lesson 2's files have the same fingerprints, and status reads the computer's console. collect copies the computer's raw measurement files into results/fb-raw/, passes every log line through fb_redact.py, and does all the arithmetic, with help from fb_stats.py. ap works out the stand-ins' cost on AP.
is the pretend . It is a separate program on the same computer. It holds lesson 2's table and runs lesson 2's lookup, but first it makes each lookup wait. The wait for every lookup is decided in advance from a seed, so every arm of a round meets exactly the same waits. It has 16 slots, and the rest wait in line.
How I Would Choose
Here is the order I would follow, using only what this lab measured.
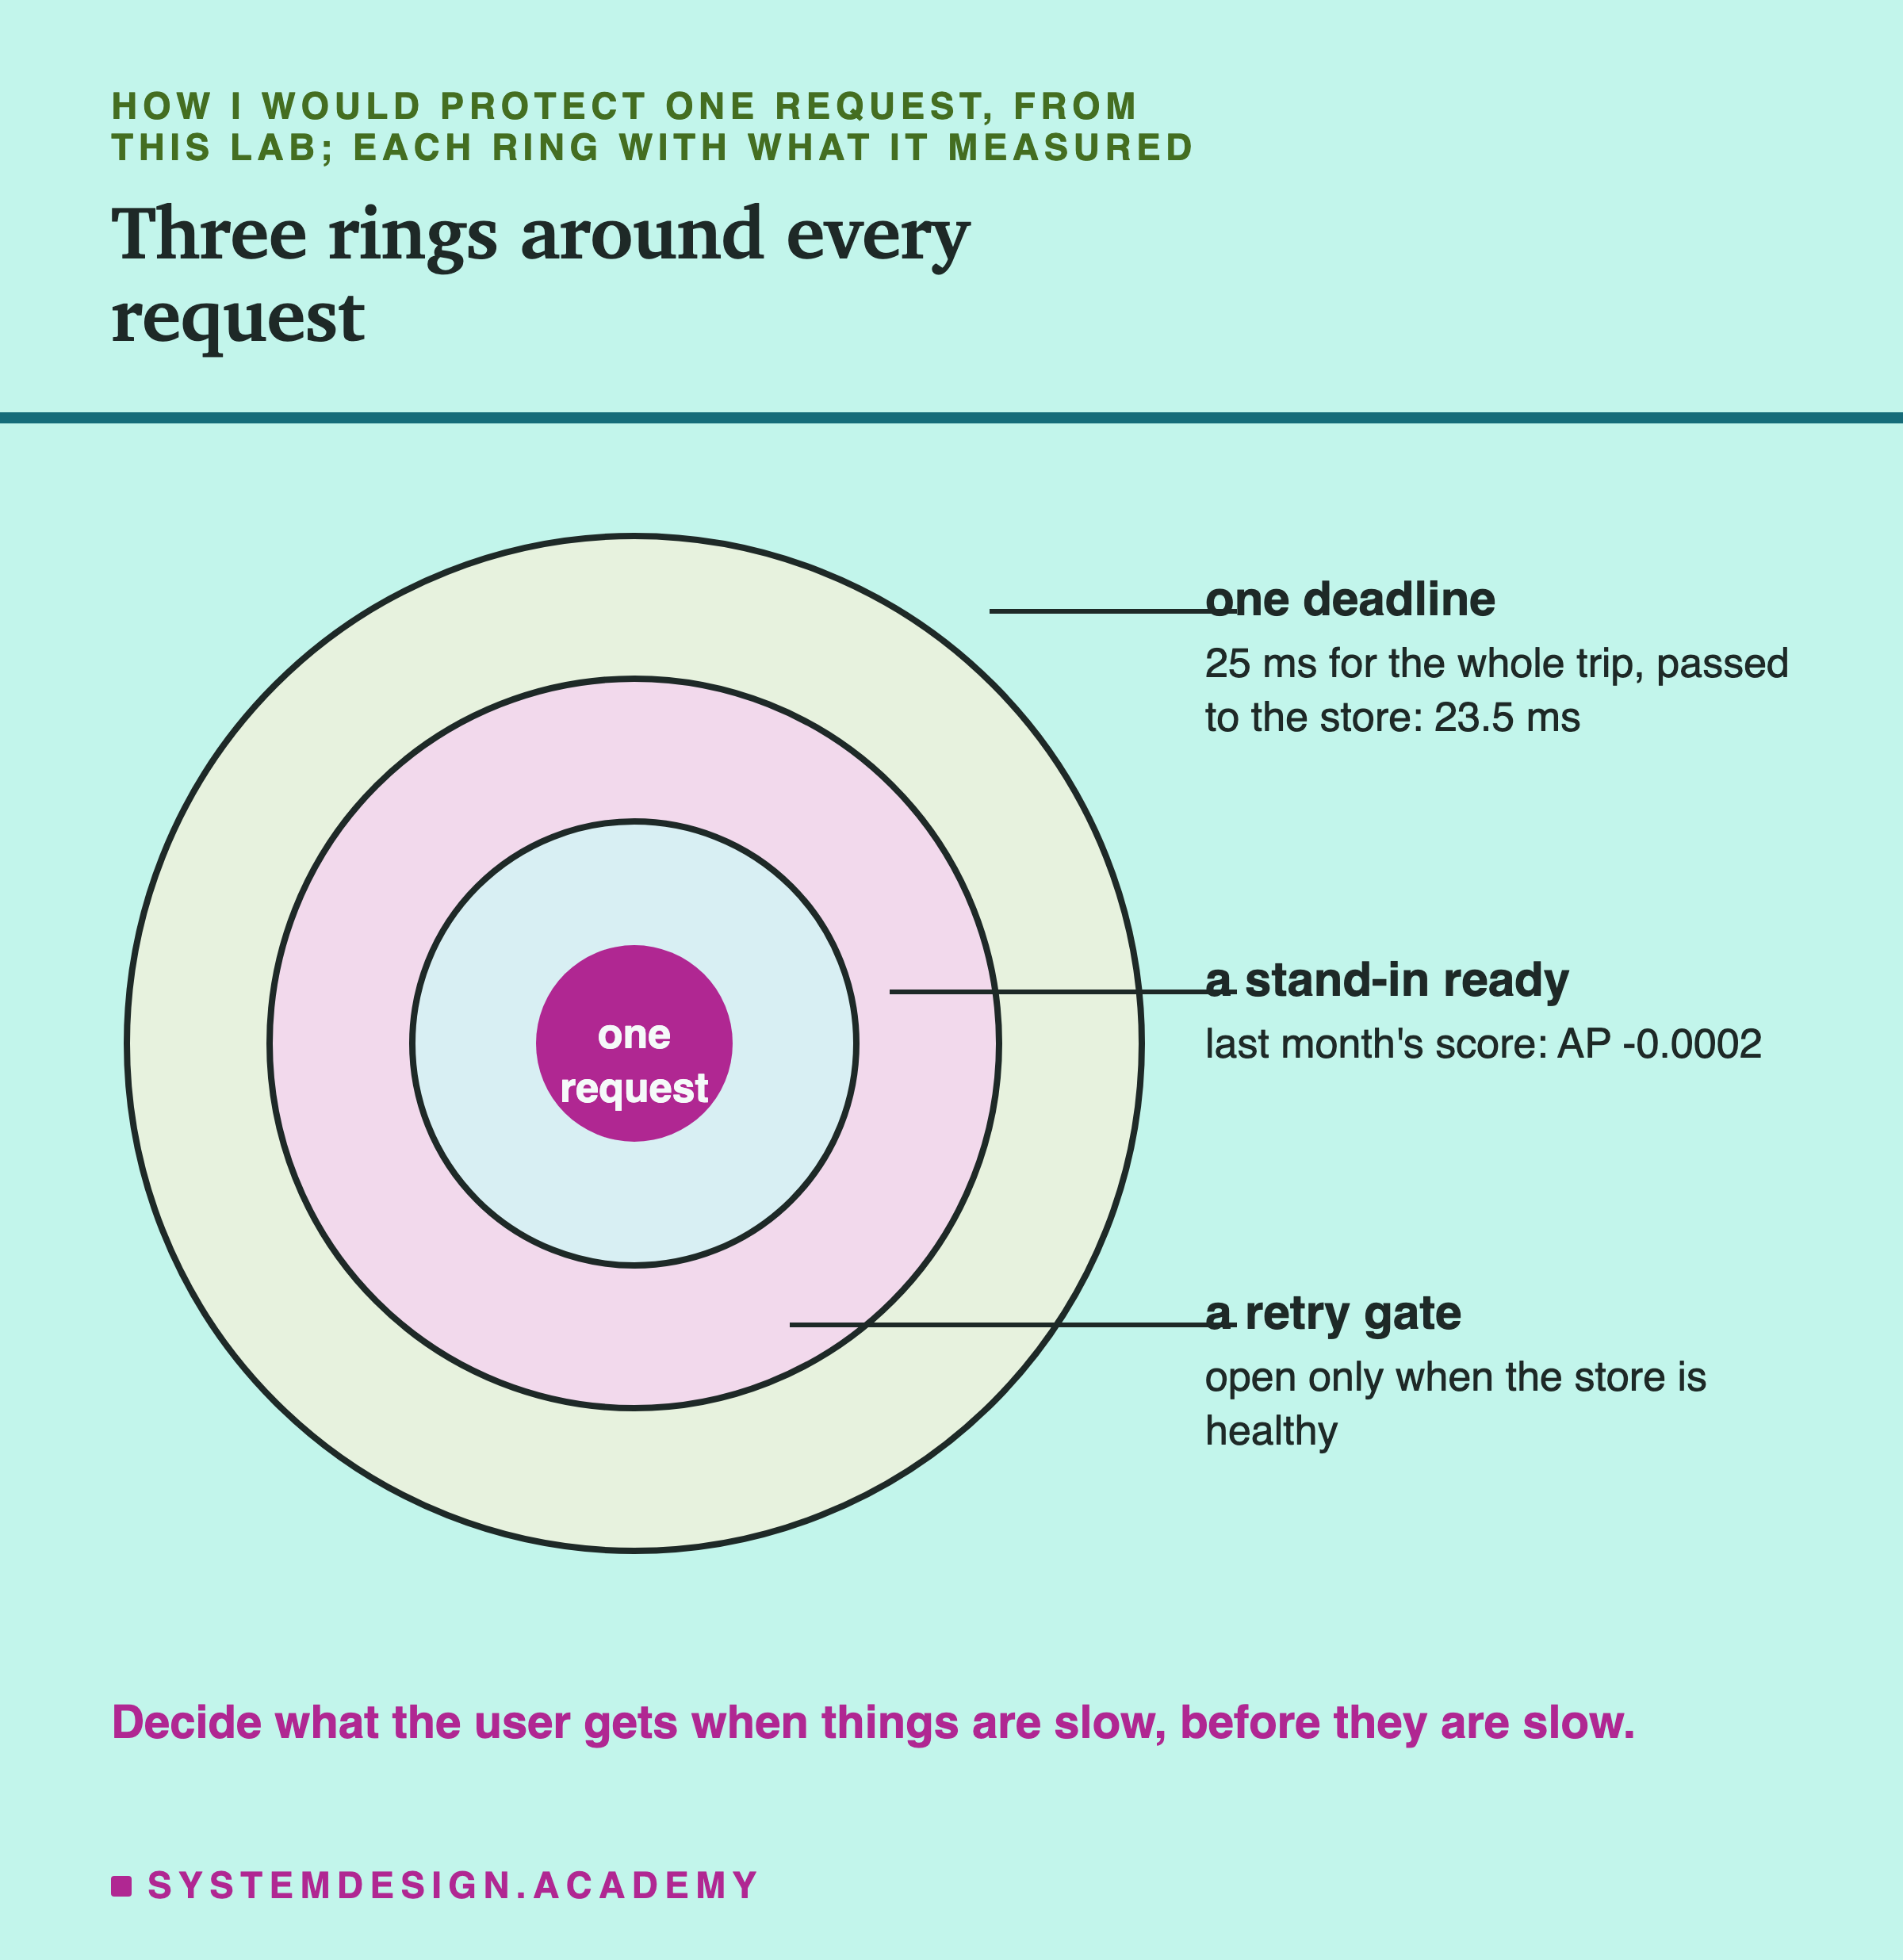
Each ring protects the request inside it. The outer ring is the time budget, the middle ring is the stand-in, and the inner ring is the gate that decides whether to try again. Here are the same steps in words, each with the number from this lab behind it.
-
Pick the longest wait a user should ever see. Here, 25 ms. Without any limit, the slowest 1 in 100 took 1,030 ms.
-
Make it one deadline for the whole request, and pass it on. The budget held for the slowest requests (24.1 ms on average), and when the store knew it too, the store did five times less work.
-
Choose the stand-in before you need it. Last month's score cost too little ranking quality to measure here. A default or "no score" cost a clear amount, and the cost grows with the share of stand-ins.
-
Retry only a healthy store, and count your calls. At 300 a second, two retries (what I tested) removed every stand-in. At 450 a second they turned one bad second into a flood in 3 of 5 rounds, and a random pause did not help. Watch calls per request: it jumped from 1.00 to about 2.9 when the flood began.
-
Ask twice when the slowness is random. Asking twice after 10 ms cut the slowest 1 in 100 by about a third, for about 6% more calls, because each try had its own luck. If the whole store is slow, both tries are slow.
When to Use Each One, and When Not To
No time limit: almost never. It is right only for work where nobody is waiting, such as a nightly batch job. For a user, one frozen lookup means a two-second wait.
A time limit with an error: right when a wrong answer is worse than no answer. A bank checking for fraud may prefer to say "try again" rather than guess. It is the wrong choice when the caller cannot cope with an error, because 1.64% of users would see one here.
A time limit with a stand-in: right when a slightly old or rough answer is still useful, like a ranking. Here last month's score kept the ranking almost intact. It is wrong when the stand-in misleads, for example a default credit limit for someone you know nothing about.
A deadline passed down: right almost always, when your code calls other code. Google's SRE book recommends it, and here it saved the store about four fifths of its work. It needs every program in the chain to read the deadline and stop on time.
Retries: right for a healthy dependency with rare random failures, at a calm speed. Wrong when the dependency is struggling: then each retry is more load. Here, retries tipped over at 450 a second in 3 of 5 rounds, with or without a pause.
Asking twice: right when slowness is random and each copy of the store is slow on its own. Wrong when the whole store is overloaded, because the second question is more load too.
What This Lab Cannot Tell You
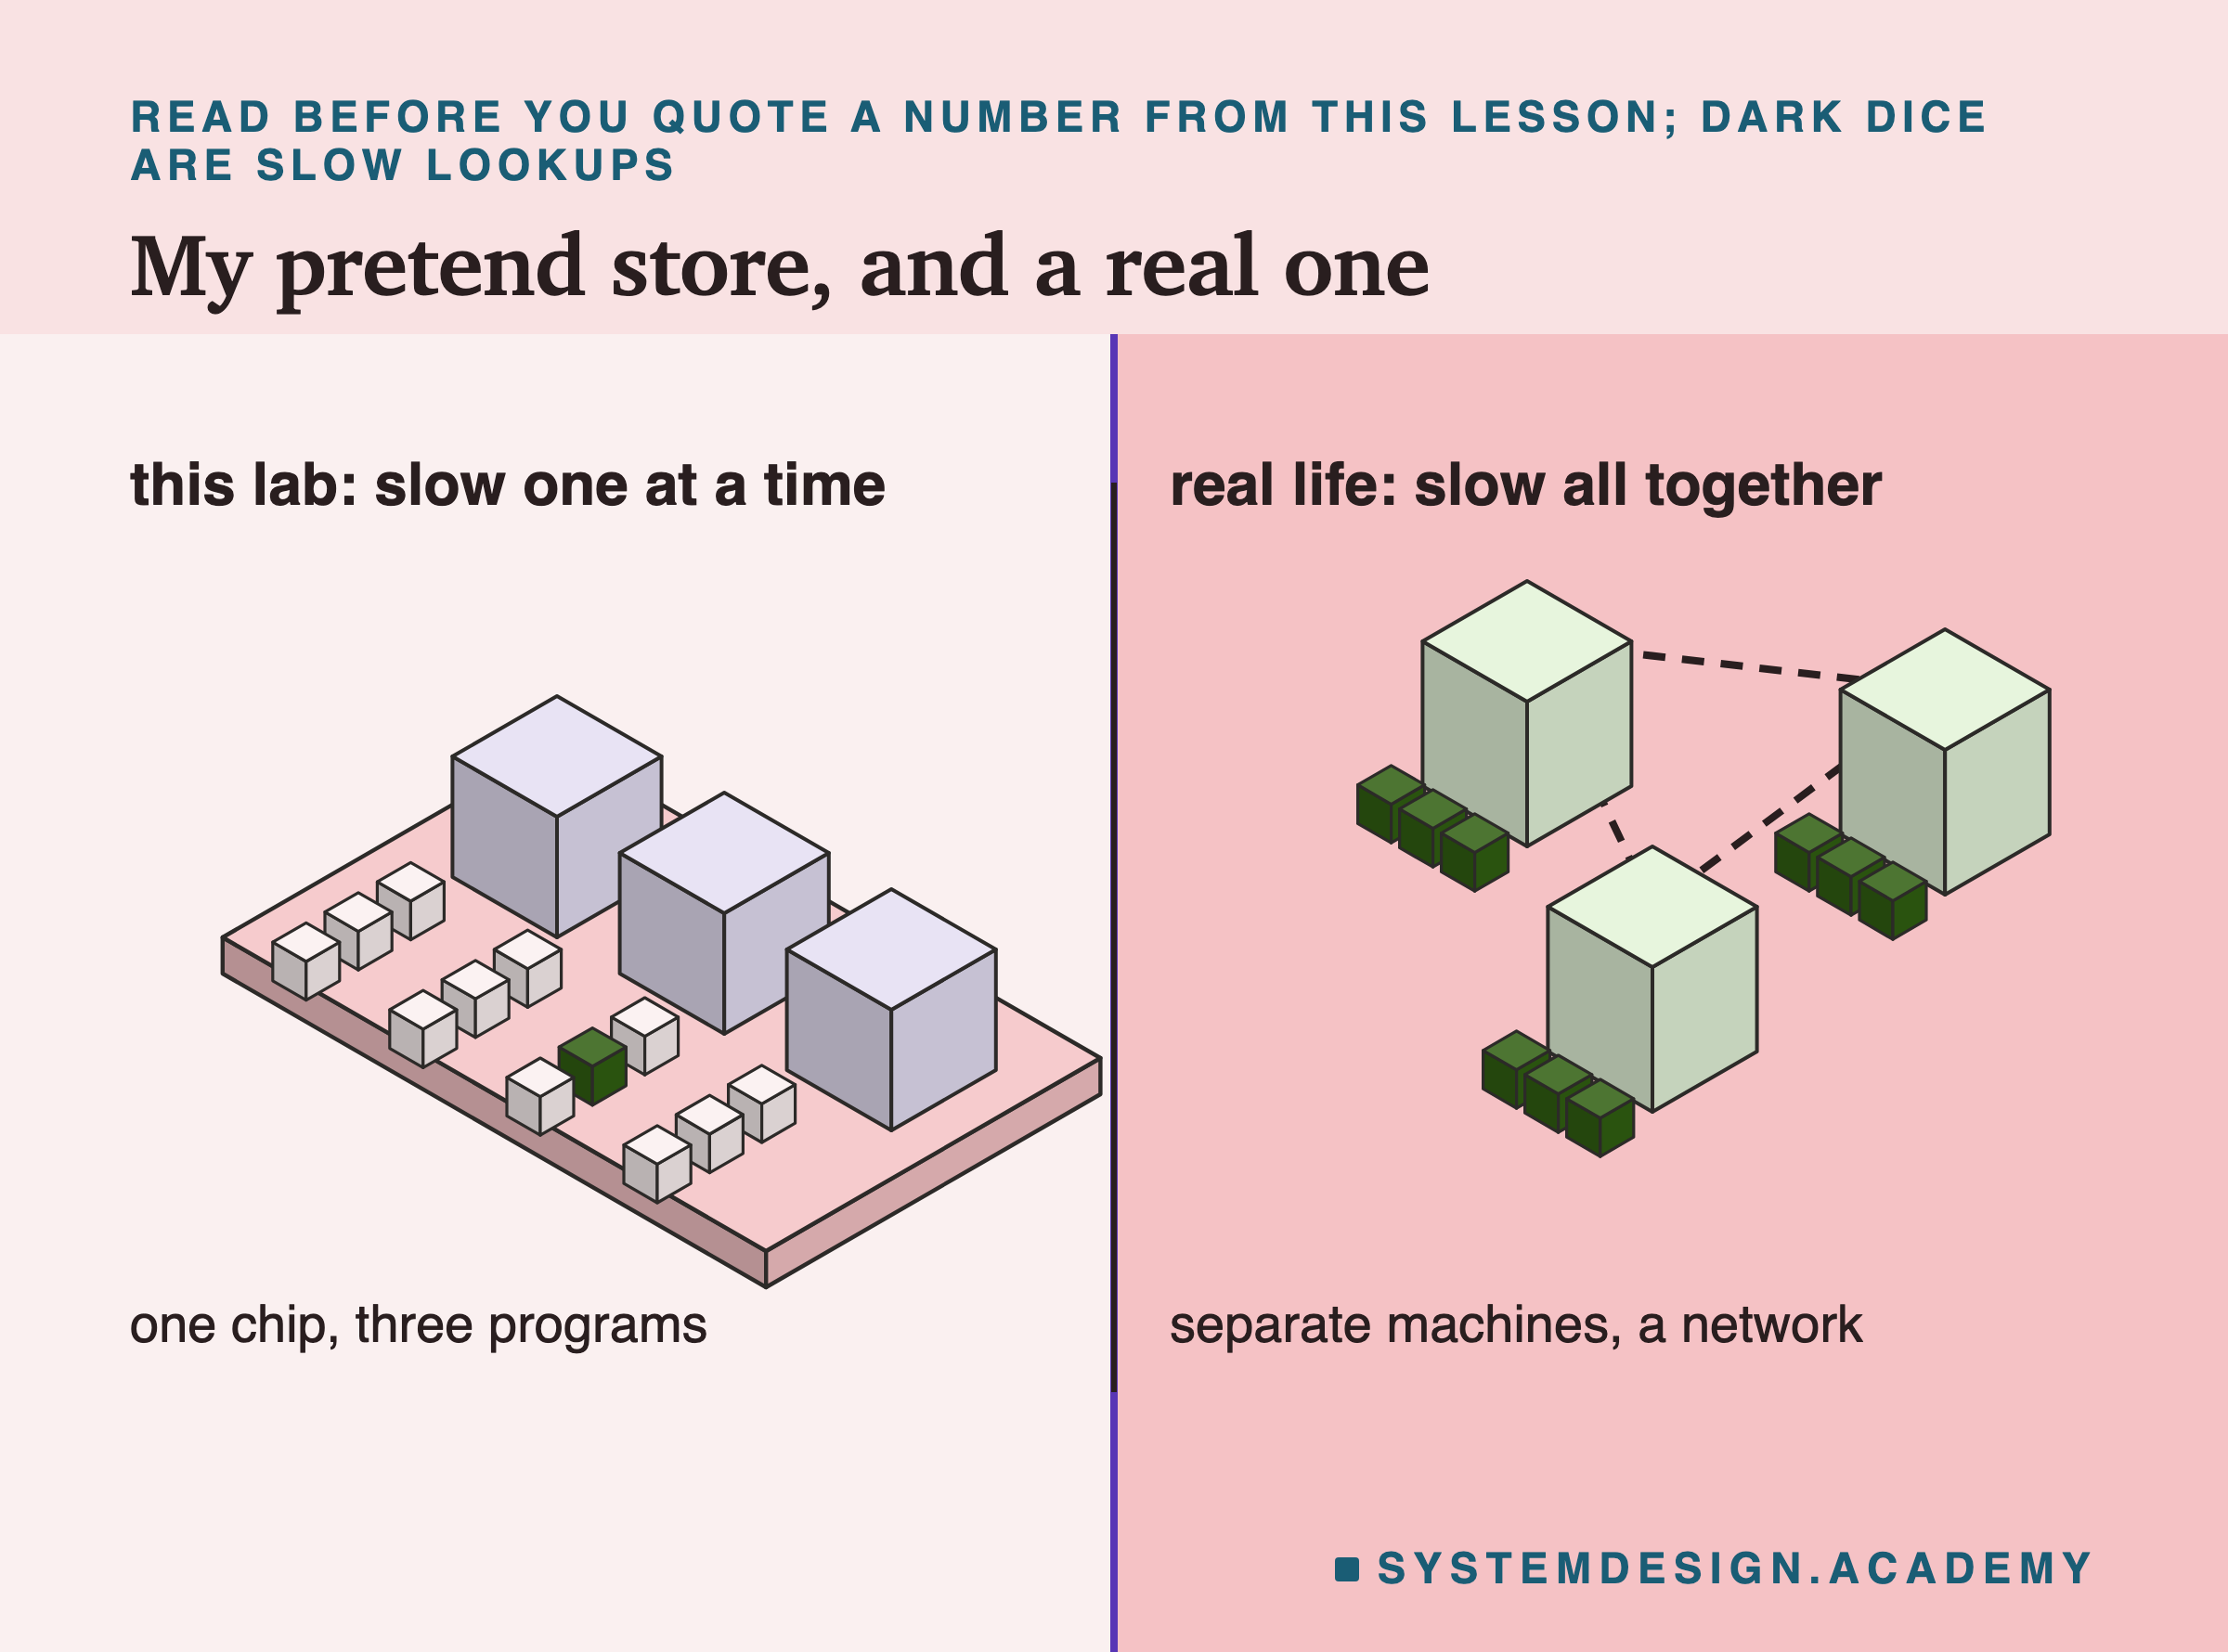
A pretend store. My store's slowness was drawn at random, one lookup at a time. A real store is often slow for a reason: a busy disk, a bad network link, one large customer. Then many lookups are slow together, and retries and asking twice help less.
One core. The tester, the service and the store shared one core. At 450 a second the service used about 45% of it. A real store on its own machines would not take time from the service.
Arms I did not run. I did not test a retry budget, or retries together with a deadline passed down. I also did not run a plain 23 ms limit to compare fairly with the deadline, or asking twice at 450 a second.
Changes after the results. After the first collection, the stored raw copy was 42.5 MB, over my limit of about 30 MB. I changed only how times are stored (as differences between neighbours), not any measurement, and the results came out the same.
After looking at the figures, I added two measurements that the design did not name. One splits each slow request's time into steps. The other follows one frozen lookup from start to end. I also counted the freezes in each round to explain round 4.
Four recordings (steps 4, 6, 12 and 13) lost their top lines, because long commands wrapped across rows. I re-drew those four from their own recording files in a taller window. The text shown is exactly what the commands printed.
After a review, I rebuilt the playground so that switching the random pause on and off meets the same dice rolls. Before that change, it wrongly showed the pause stopping the flood.
What to Do on Monday
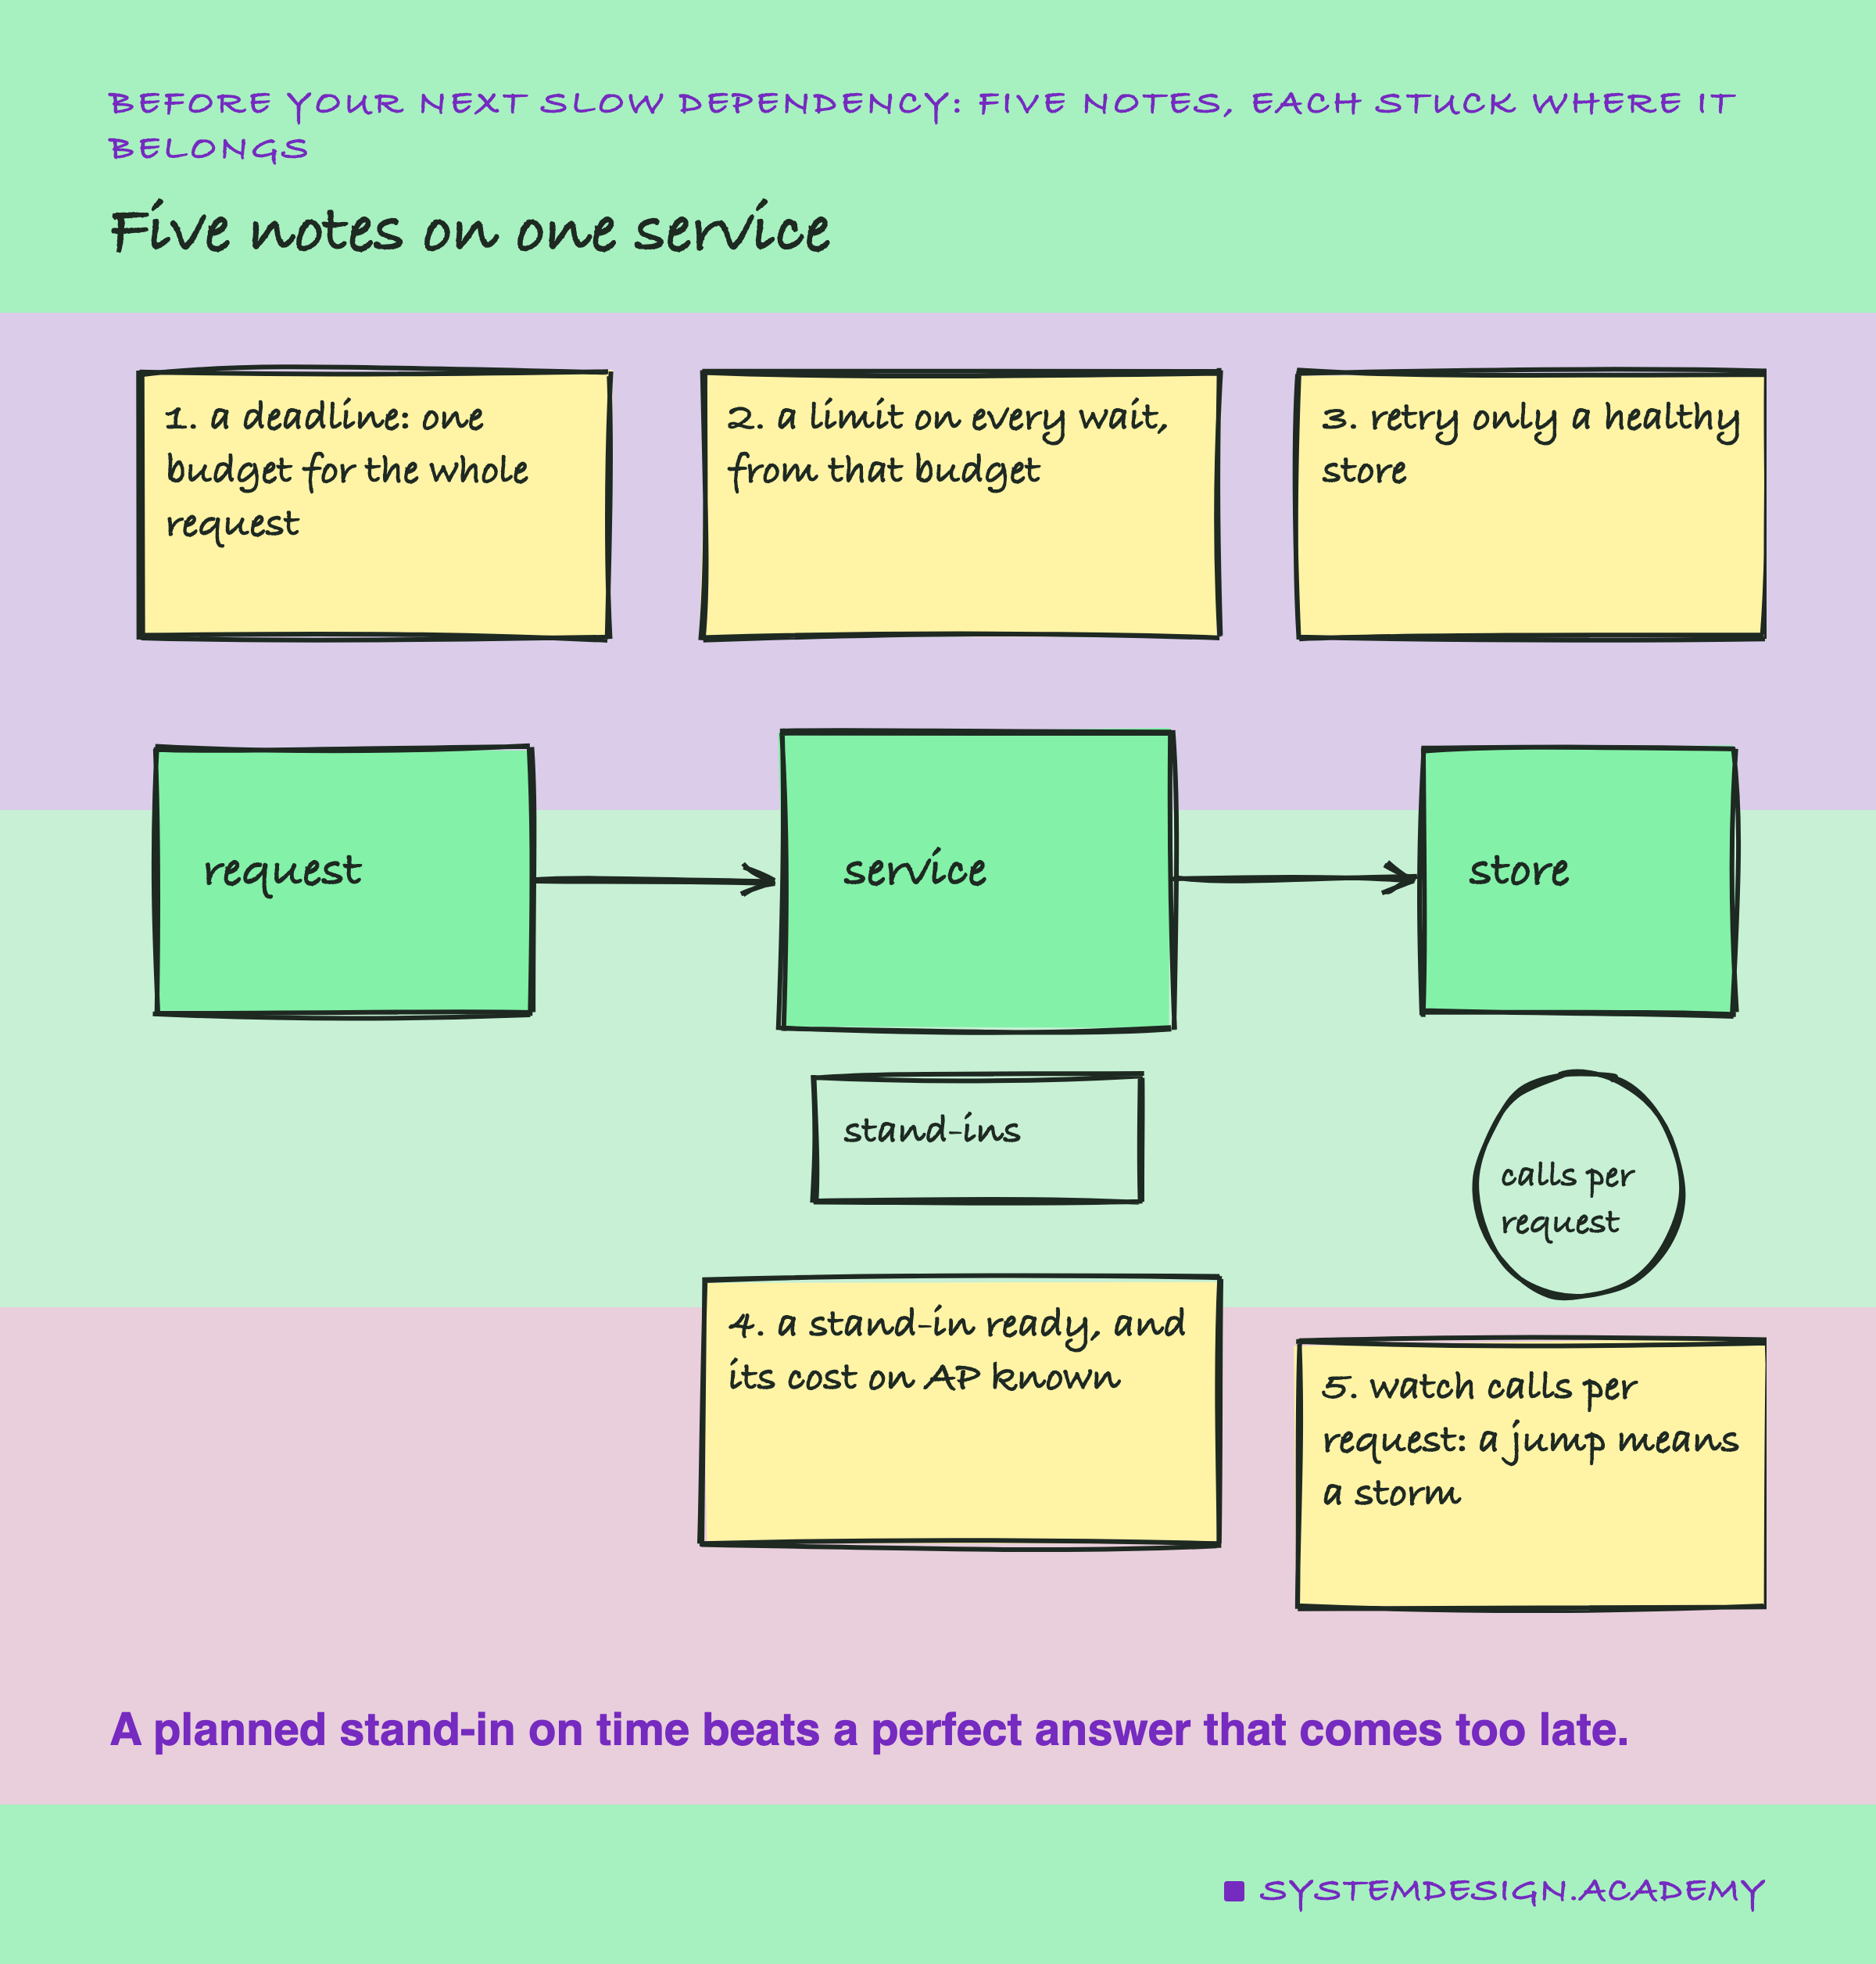
If you take one thing to work on Monday, find every place where your service waits for another system, and check that each one has a time limit. A call with no limit is a call that can make one customer wait forever.
Then look at your retries. How many tries does your code, your library and your (the program that shares requests among servers) each make? If three layers each try three times, one failure can become 27 calls. Make sure the system you call is not already struggling when you send it more.
The one idea to keep: decide what the user gets when things are slow, before things are slow. A stand-in on time is often worth more than the perfect answer two seconds late.
Knowledge Check
Knowledge Check
4 questions - Score 80% to pass
With no time limit and 1 lookup in 100 freezing, the slowest 1 in 100 took about 1,030 ms. Why did a 25 ms limit not also make the store do less work?
Which stand-in score cost the least ranking quality (AP) when the lookup was too slow?
In round 1 at 450 requests a second, retries turned one bad second into 94.3% stand-ins. What did a random pause before each retry change?
What did passing the 25 ms deadline down to the store change, at 300 requests a second?