Machine Learning Interview Questions and Answers
Here are 38 machine learning interview questions, with short answers in simple English. Many answers include a real result: we ran scikit-learn on its built-in datasets, so you can quote numbers, not only definitions.

How to answer a machine learning question
Give the definition in one sentence. Then add a concrete example or number, and one thing that can go wrong. That shows you have used the idea, not only read about it.
1. Machine learning basics
Interviews usually open here. Give a short, correct answer, then a small real example.
What is machine learning?
Machine learning means a program learns patterns from examples instead of following rules written by a person. For example, it learns what spam looks like from thousands of labelled emails.
The result, called a model, can then make predictions on new data it has not seen.
What are supervised, unsupervised and reinforcement learning?
Supervised learning learns from examples with the right answer, called labels, such as emails marked spam or not spam. Unsupervised learning finds patterns without labels, such as groups of similar customers.
Reinforcement learning learns by trial and error, getting rewards for good actions, like a program learning a game.
What is the difference between classification and regression?
Classification predicts a category, such as fraud or not fraud. Regression predicts a number, such as a house price.
Logistic regression is a classification method, despite its name. It predicts the probability of a class.
What are features and labels?
Features are the inputs the model uses, such as a house's size and location. The label is the answer it must predict, such as the price.
Good features often matter more than the choice of algorithm.
Why split data into training, validation and test sets?
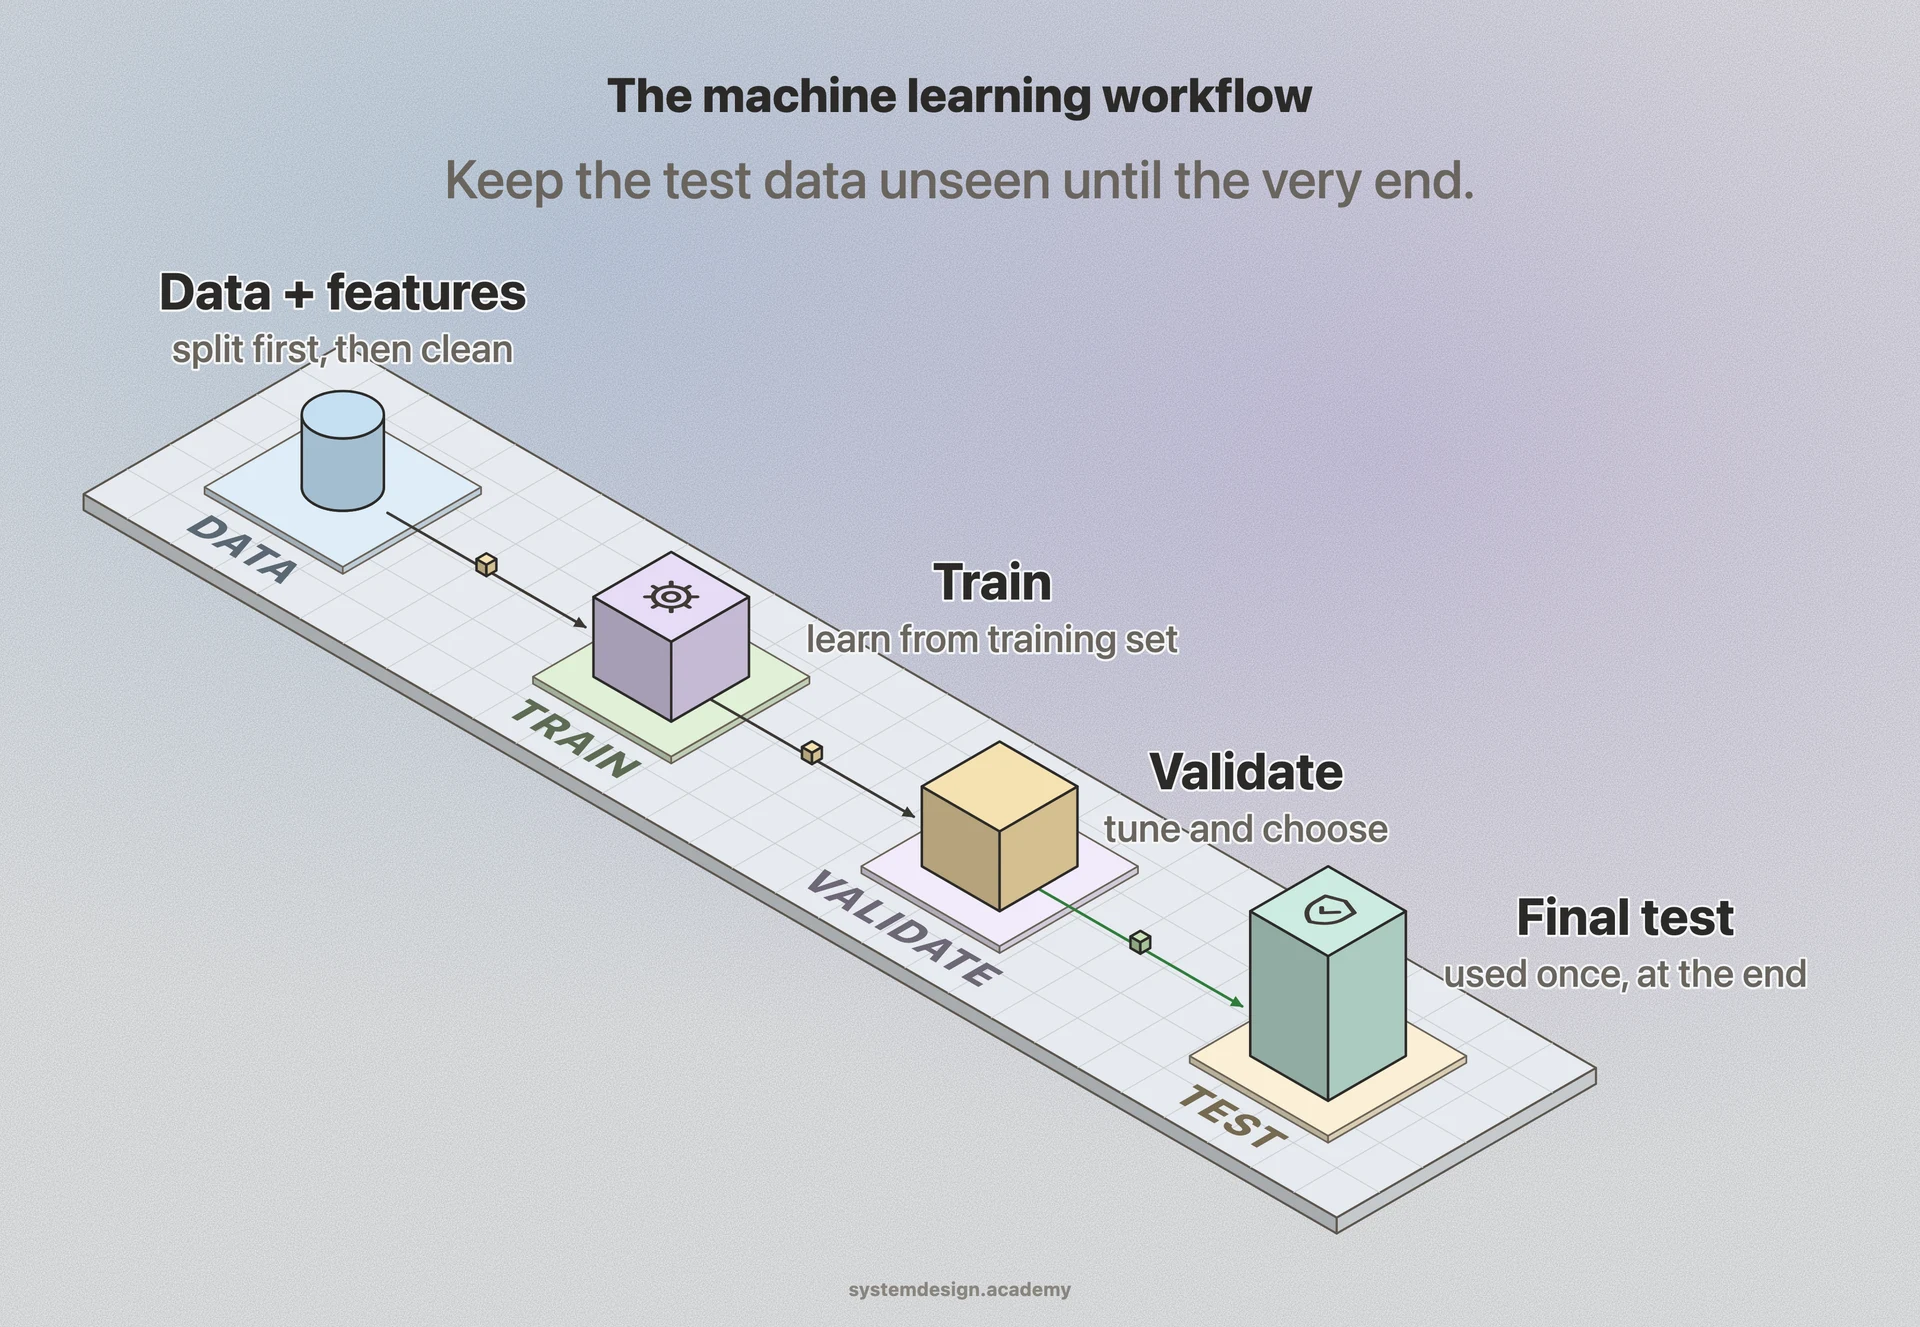
The model learns on the training set. You tune settings and choose between models using the validation set. The test set is used once, at the end, to estimate real-world performance.
If you look at the test set while choosing, it stops being a fair test.
2. Overfitting and model fit
Almost every ML interview asks about overfitting. Show that you can spot it with numbers, not only define it.
What are overfitting and underfitting?
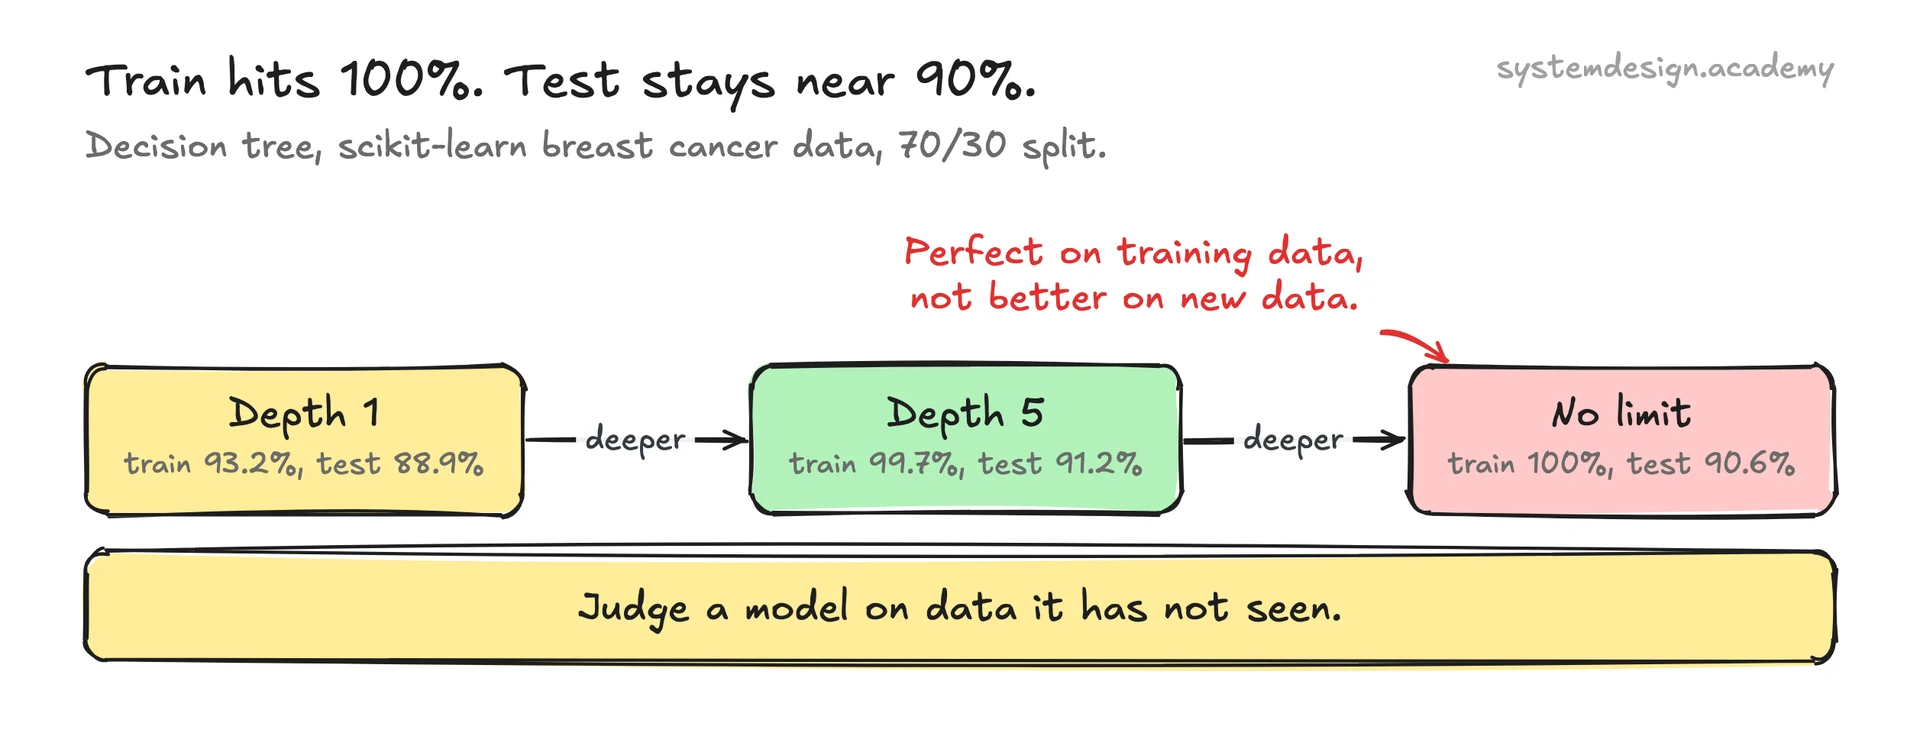
Overfitting means the model learns the training data too closely, including its noise, so it does worse on new data. Noise means random details that will not repeat in new data. Underfitting means the model is too simple to learn the real pattern at all.
You spot overfitting when training scores are much better than validation scores.
What we measured: We ran scikit-learn on its built-in breast cancer data. A tree with no depth limit scored 100% on training data, but 90.6% on test data. Depth 5 scored 91.2% on test. That is only one more correct row out of 171, so the depth hardly mattered.
What is the bias-variance trade-off?
Bias is error from a model that is too simple and misses the pattern. Variance is error from a model that is too sensitive to the exact training data. Simple models have high bias; very flexible models have high variance.
The best model balances the two, and you find that balance with validation data.
What is regularization? What is the difference between L1 and L2?
Weights are the numbers a model learns, one for each feature. Regularization adds a penalty for large weights, which keeps the model simpler and reduces overfitting. L2 (ridge) shrinks all weights towards zero.
L1 (lasso) can push some weights to exactly zero, so it also selects features.
What is cross-validation, and why use it?
In k-fold cross-validation, the data is split into k parts. The model trains on all parts but one, and is tested on the one left out. This repeats k times, so every row is tested once.
It gives a more reliable score than one split, and it shows how much the score varies.
What we measured: We ran logistic regression on scikit-learn's breast cancer data, with 10 folds. The mean was 97.7%. Single folds ranged from 94.7% to 100%.
What is early stopping?
Early stopping ends training when the validation score stops improving. It is common for neural networks and boosted trees.
It prevents the model from continuing to learn noise in the training data.
3. Common algorithms
Expect to explain a few algorithms in plain words, and to say when you would pick each.
How does linear regression work?
Linear regression fits a straight line, or a flat surface with many features, through the data. It finds the weights that make the squared errors between predictions and true values as small as possible.
It is simple and easy to explain, but it misses curved patterns unless you add features for them.
How does a decision tree work?
A decision tree asks a series of yes-or-no questions about the features, such as "is income above 50,000?". Each question splits the data at a cut-off value. The goal is groups where most rows share one label. Then the tree gives an answer.
Trees are easy to understand, but a single deep tree overfits easily.
What is a random forest, and why is it better than one tree?
A random forest trains many trees, then lets them vote. Each tree trains on a random sample of rows, which is called bagging. At each split, a tree also sees only a random subset of features.
The trees make different mistakes, so the vote cancels many of them out. It overfits much less than one deep tree.
What is gradient boosting?
Gradient boosting builds trees one after another. Each new tree learns the errors left over by the trees before it, and its predictions are added on. XGBoost, LightGBM and CatBoost are popular versions.
On tables of data, boosted trees are often among the strongest models.
How does k-nearest neighbours work?
k-nearest neighbours (k-NN) looks at the k most similar training examples. It predicts their most common label, or their average value. It does not really train; it stores the data.
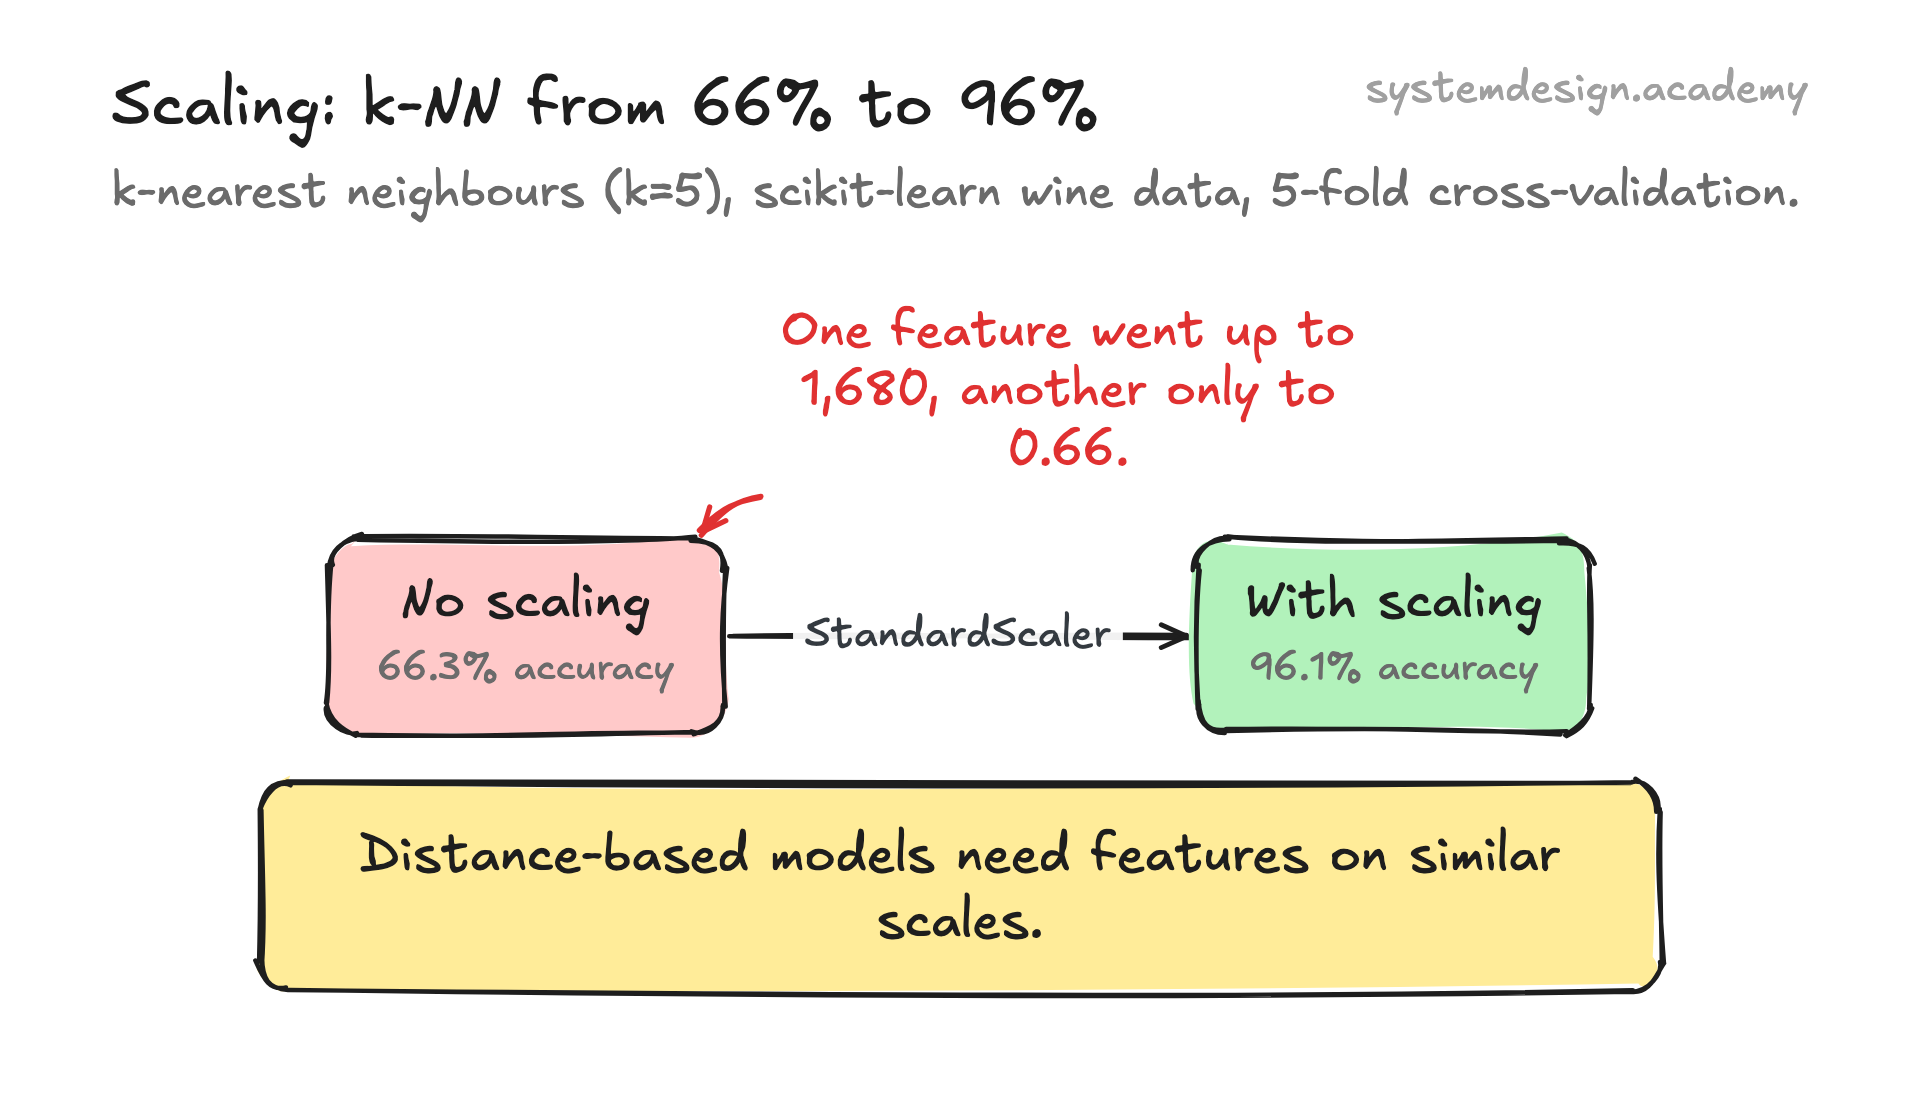
It depends on distances between rows, so features must be on similar scales.
What we measured: We ran k-NN on scikit-learn's wine data. It scored 66.3% without scaling and 96.1% with it. One feature went up to 1,680, another only to 0.66, so the big one decided almost every distance.
What is a support vector machine (SVM)?
An SVM finds the boundary that separates two classes with the widest possible gap. A kernel is a trick that lets it find curved boundaries too.
Kernel SVMs work well on small and medium data, but are slow on very large data. Linear SVMs are much faster.
How does k-means clustering work?
k-means puts each point into the nearest of k cluster centres. Then it moves each centre to the middle of its points. It repeats until the centres stop moving.
You must choose k yourself, often by trying several values and checking how tight the clusters are. This is called the elbow method.
What is PCA?
PCA (principal component analysis) turns many related features into a few new ones, called components. These keep most of the variation in the data.
It is used to reduce the number of features, to speed up training, or to plot data in two dimensions.
4. Preparing data
Most real ML work is data preparation. These questions test whether your numbers can be trusted.
When do you need feature scaling?
Scaling puts features on similar ranges, for example with standardisation: subtract the mean, divide by the standard deviation. It matters for methods based on distances or gradients, like k-NN, SVM, logistic regression and neural networks.
Tree models do not need it. Each split compares values within one feature, against a cut-off.
How do you handle missing values?
First ask why they are missing, because that can itself be useful information. Then remove rows or columns, or fill in a value such as the median. Some models can also handle missing values directly.
Learn the fill-in value from the training data only, then apply it to the test data.
How do you turn categories into numbers?
One-hot encoding makes one yes-or-no column for each category. It works well for a small number of categories.
Target encoding replaces each category with the average label for it. It is powerful, but a row's own label must not go into its own value. Compute each row's value from other rows only. scikit-learn's TargetEncoder does this for you.
What we measured: In our course lab, the label was random, so nothing could predict it. Target encoding a random ID before the split still made it look 79.2% accurate. The label had leaked into the feature. The true score was about 50%.
What is data leakage?
Data leakage is when information the model should not have gets into training. Examples are test data, or data from the future. The model looks great in testing and fails in real use.
Split first. Then fit every preparation step, like scaling or feature selection, on the training part only.
What we measured: In our course lab, choosing features before the split made pure noise look 92.7% accurate. On data put away at the start, it scored 49.8%, the same as guessing.
How do you deal with outliers?
First check whether an outlier is an error or a real rare case. Errors can be fixed or removed. Real rare cases, like large frauds, may be exactly what the model must learn.
Some methods, such as tree models or the median, are less affected by extreme values.
5. Evaluating a model
Choosing the wrong metric is one of the most common mistakes. Interviewers test this often.
Why can accuracy be misleading?
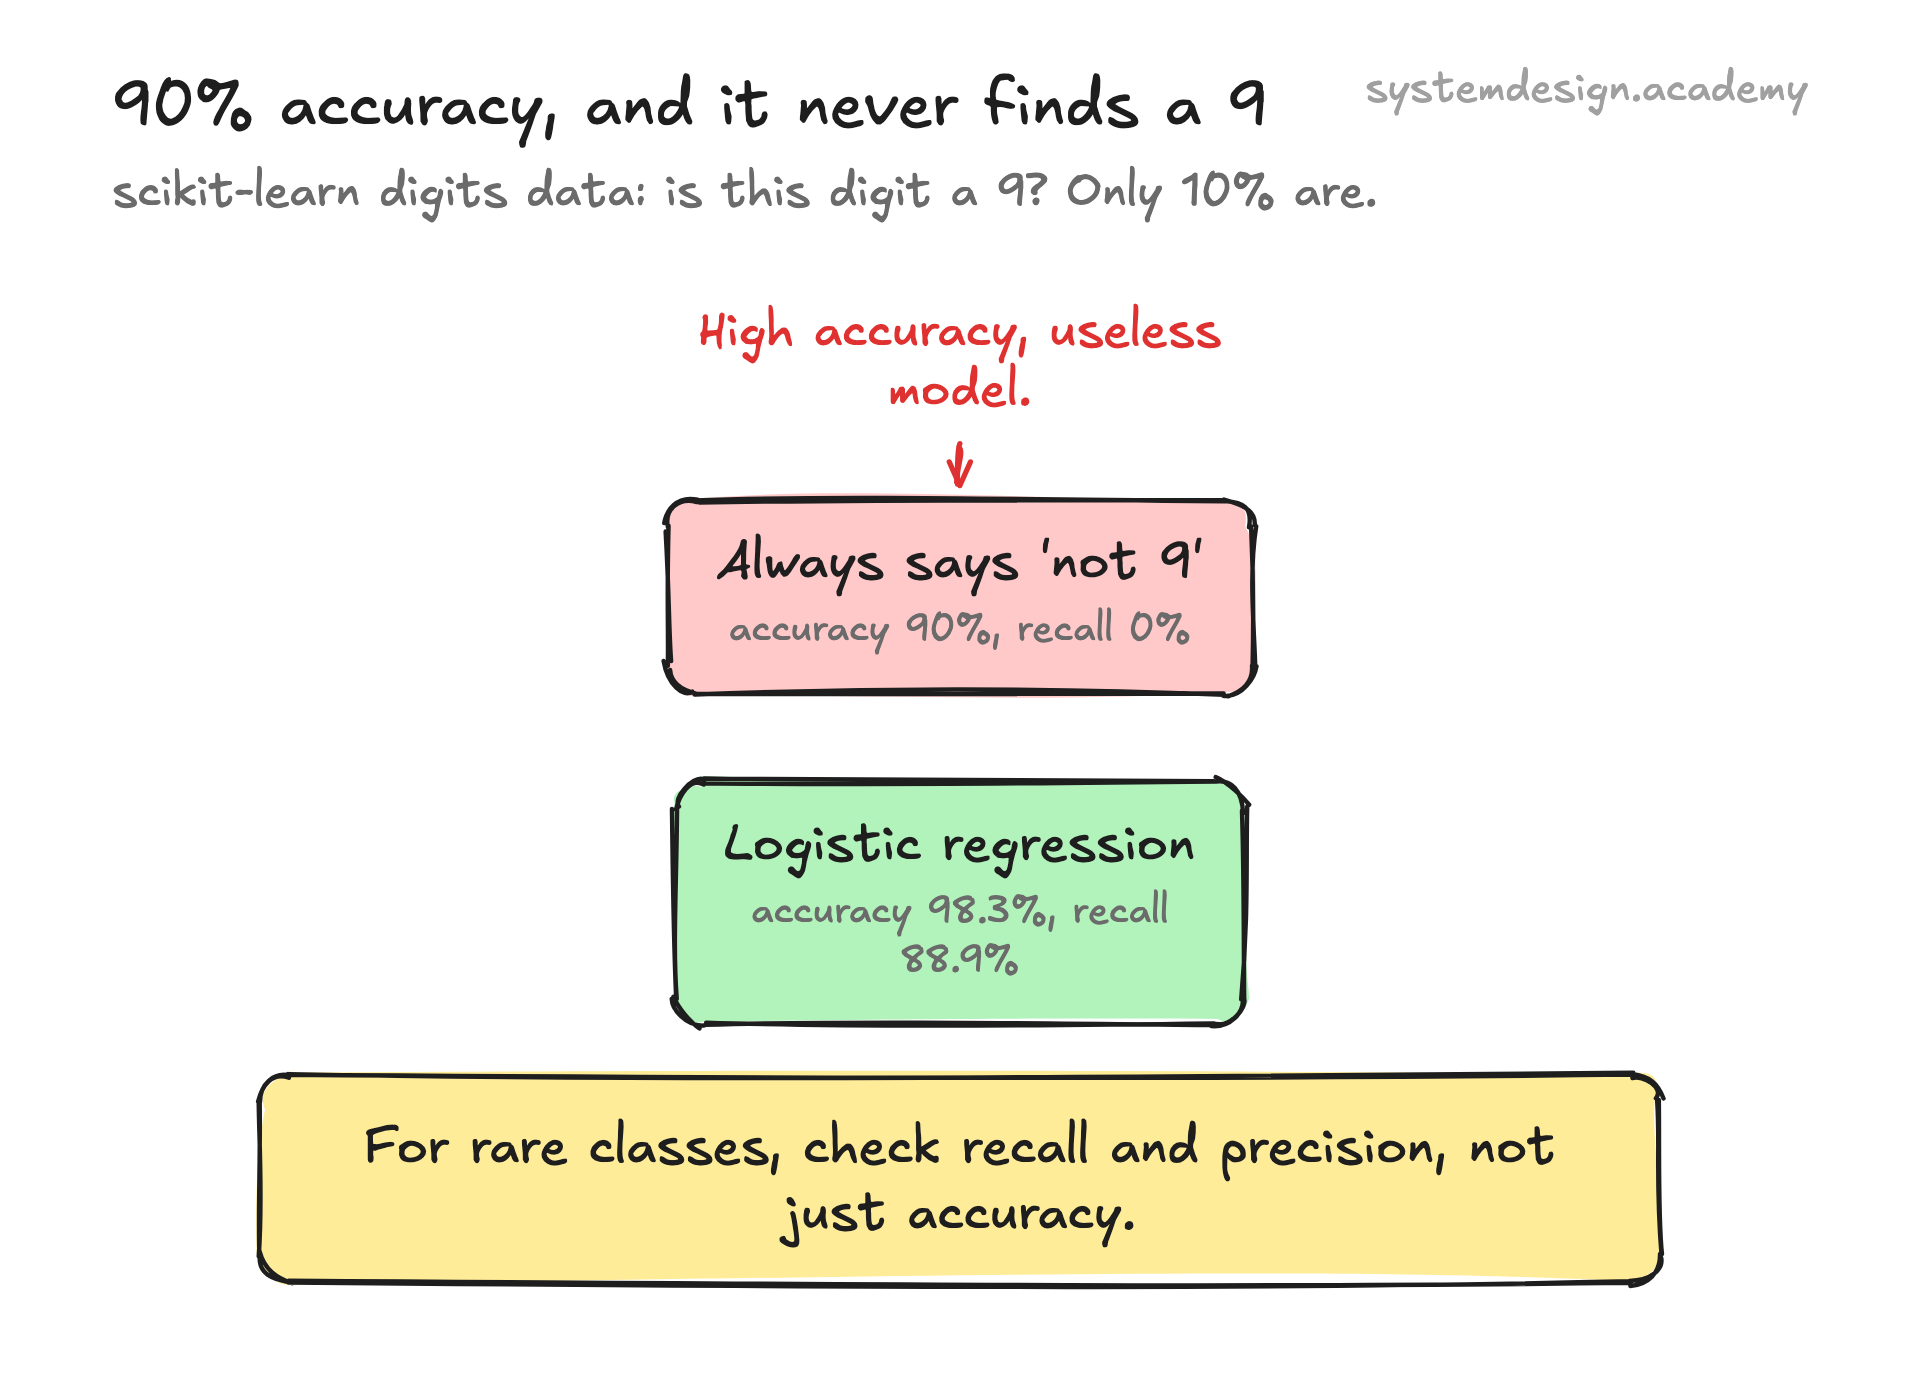
When one class is rare, a model that always predicts the common class gets high accuracy and is useless. Look at precision, recall and the confusion matrix instead.
What we measured: We used scikit-learn's digits data and asked: is it a 9? Only 10% are. Always saying no scored 90% accuracy and 0% recall.
What are precision, recall and F1?
Precision: of everything the model flagged, how much was right? Recall: of all the real cases, how many did it find? F1 combines the two into one score, using a kind of average called the harmonic mean.
Choose based on the cost of mistakes. For cancer screening, missing a case is worse, so recall matters more.
What is a confusion matrix?
A confusion matrix is a table of predictions against true labels. For two classes, it shows true positives, false positives, true negatives and false negatives.
Precision, recall and accuracy can all be read from it.
What is ROC-AUC, and when is PR-AUC better?
A threshold is the cut-off that turns a score into a yes or no. The ROC curve shows the true positive rate against the false positive rate at every threshold. ROC-AUC is the area under it. It measures how well the model ranks positives above negatives. 1.0 is perfect and 0.5 is random.
When the positive class is very rare, PR-AUC, based on precision and recall, shows problems that ROC-AUC can hide.
How do you choose the decision threshold?
Many models output a probability, and the threshold turns it into a yes or no. The default is 0.5. When classes are rare or mistakes cost different amounts, another value often works better.
Pick it on validation data, based on the cost of each kind of mistake. With few rare examples, choose it by cross-validation.
How do you evaluate a regression model?
MAE (mean absolute error) is the average size of the errors. RMSE (root mean squared error) punishes big errors more. R-squared shows how much of the variation the model explains.
Report them in the units people care about, such as "off by 20,000 rupees on average".
6. Training and neural networks
Even for classic ML roles, expect a few questions on how models learn.
What is gradient descent?
Gradient descent is how many models learn. The gradient says how the error changes when each weight changes. Then it moves every weight a small step in the direction that lowers the error. It repeats this many times.
The learning rate sets the step size. Too big and training jumps around; too small and it is very slow.
What is the difference between batch, mini-batch and stochastic gradient descent?
Batch gradient descent uses all training data for each step. Stochastic gradient descent uses one example per step. Mini-batch uses a small group, such as 32 or 256 examples.
Mini-batch is the usual choice: faster than full batch, and steadier than one example at a time.
What is a neural network, in simple words?
A neural network is layers of simple units. Each unit multiplies its inputs by weights, adds them, and applies an activation function. ReLU, a common one, keeps positive values and turns negative ones into zero. Stacking layers lets it learn complex patterns.
Backpropagation is the method that works out how to change every weight to reduce the error.
What is dropout?
Dropout switches off a random share of units during each training step. The network cannot rely on any single unit, so it overfits less.
At prediction time, all units are used.
How do you tune hyperparameters?
Hyperparameters are settings you choose before training, like tree depth or learning rate. Grid search tries every combination. Random search tries random ones and is often more efficient.
Bayesian optimisation uses past results to choose the next setting to try. Always judge settings on validation data, never the test set.
When would you use deep learning instead of classic ML?
Deep learning works best on images, audio and text, and when you have a lot of data. On ordinary tables of numbers and categories, boosted trees are often as good or better, and cheaper.
Start with a simple baseline, and move to a more complex model only if it clearly wins.
7. Machine learning in the real world
Last, what happens after the model is trained. Interviewers like candidates who think about this.
What happens if some training labels are wrong?
Some models cope well with random wrong labels, because correct examples outvote them. Mistakes that follow a pattern, like two classes often swapped, do much more damage.
What we measured: In our course lab, 30% of the 1,197 training labels on handwritten digits were made wrong. Averaged over 20 runs, a random forest scored 96.4% with random mistakes. With look-alike digits swapped, it scored 82.3%. Part of that gap is because the swaps hit only 8 digits.
Why do models get worse after deployment?
The world changes. The data the model sees drifts away from the training data. Or the link between inputs and the right answer changes, which is called concept drift. The model gets worse without any error message.
So monitor inputs, outputs and, when labels arrive, real accuracy.
How do you explain a model's predictions?
For simple models, read the weights or the tree. For complex ones, feature importance shows which inputs matter most overall. SHAP values show how much each feature pushed one single prediction up or down.
Explanations help find bugs and build trust, but they show what the model uses. They do not prove what causes what in the real world.
Learn it properly, not just the answers
Every answer on this page comes from our AI Engineering course: 112 lessons on RAG, evals, agents, serving, security and MLOps. Many of them are built around a real experiment. You learn why the answer is right, which is what an interviewer checks with the second question. 10 lessons are free to read, with no card needed.