Data Scientist Interview Questions and Answers
Here are 31 data scientist interview questions, with short answers in simple English. They cover statistics, A/B testing, SQL and product sense. The A/B testing numbers come from our own simulations, and every SQL answer was run on a real table.

How to answer a data science question
Restate the question in your own words, say what you would measure, and then answer. For statistics questions, explain the idea in plain words before any formula.
1. The data scientist role
Interviews often start by checking that you understand the job itself.
What does a data scientist do?
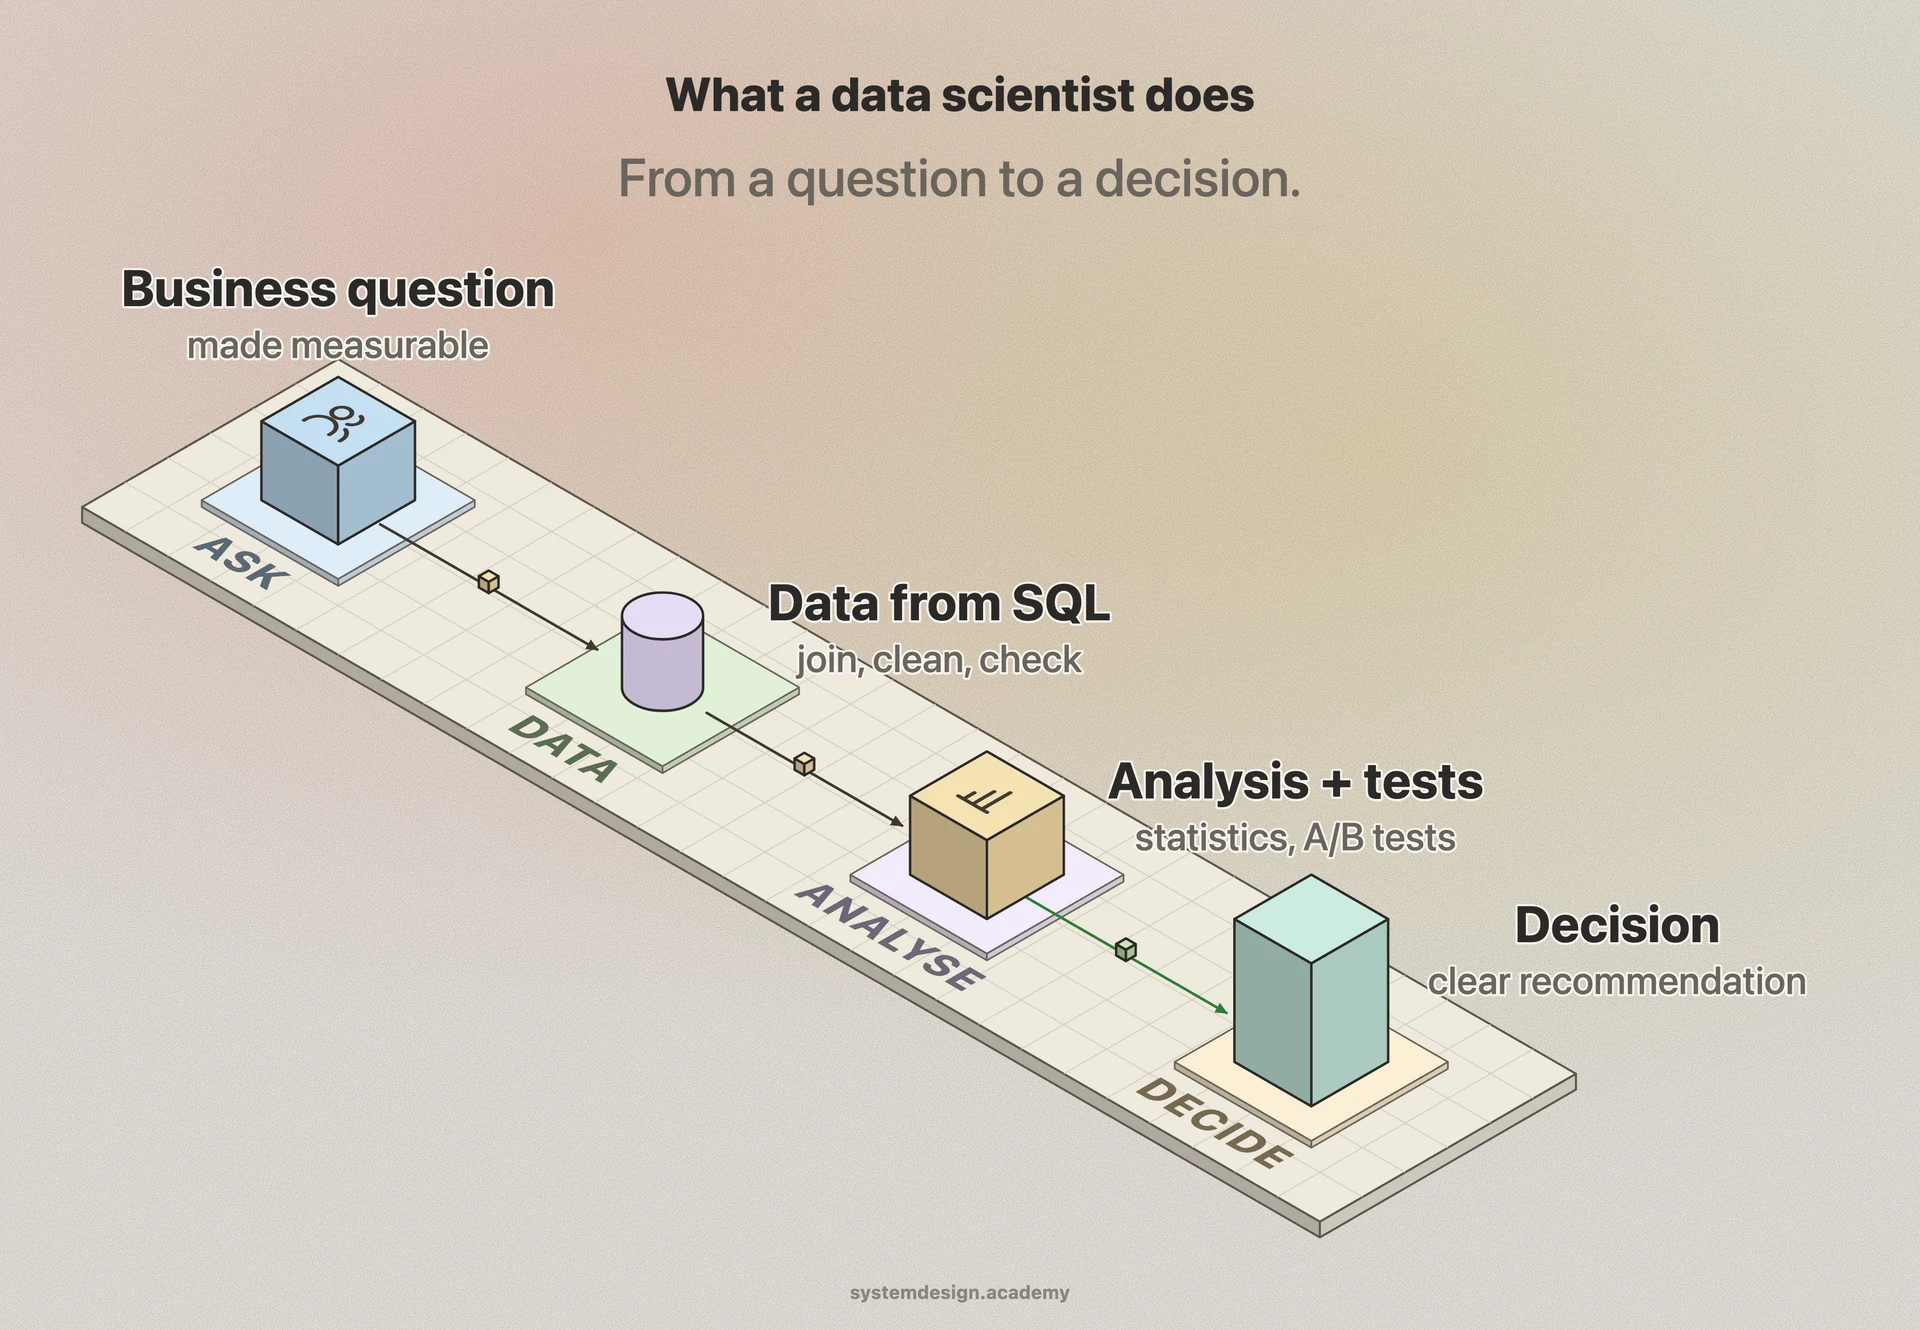
A data scientist uses data to answer business questions and help people decide. The work includes getting data with SQL, cleaning it, analysing it, running experiments, and sometimes building models.
The most important skill is turning a vague question into something you can measure.
How is a data scientist different from a data analyst or an ML engineer?
A data analyst mostly explains what happened, with reports and dashboards. A data scientist also asks why, runs experiments and builds predictive models. An ML engineer puts models into production and keeps them running.
The lines vary between companies, so read the job description.
2. Statistics
Statistics questions come up in almost every data science interview. Explain the idea in words first, then give a formula if asked.
When is the median better than the mean?
When the data is skewed, meaning it has a long tail on one side, or has extreme values. A few very high salaries pull the mean up, but barely move the median.
For typical income or house prices, the median usually describes a normal case better.
What does the standard deviation tell you?
It measures how spread out the values are around the mean. A small standard deviation means most values are close to the mean.
Normal data has the familiar bell shape. For roughly normal data, about 95% of values fall within two standard deviations of the mean.
What is the central limit theorem, and why does it matter?
It says the average of a large enough sample follows a roughly normal distribution. This holds even if the data itself is not normal.
That is why many tests on averages work with large samples. An example is an A/B test on conversion rate, the share of users who buy or sign up. Skewed metrics, like revenue per user, need much larger samples before this holds.
What is a p-value, in simple words?
Assume there is no real effect. The p-value is the chance of seeing a result at least this extreme anyway. A small p-value means the result would be surprising if nothing were going on. The usual cut-off, called the significance level, is 0.05.
It is not the chance that the result is true. It also does not tell you how big the effect is.
What is a confidence interval?
A confidence interval is a range of likely values for something you estimate, like a conversion rate. If you repeated the study many times, 95% of the intervals built this way would contain the true value.
A narrow interval means a precise estimate. Always report it next to the number.
What are type I and type II errors?
A type I error is a false alarm: you say there is an effect when there is none. A type II error is a miss: there is a real effect, but you do not detect it.
The 0.05 level limits type I errors. Enough data, which gives high power, limits type II errors.
What is statistical power?
Power is the chance that your test detects a real effect of a given size. 80% is a common target.
Small effects need large samples. A test with low power will often miss real improvements.
What we measured: In our course lab, we compared two AI models on a test set of 100 questions. A real improvement of 5 percentage points was detected only 15% of the time.
Why does correlation not mean causation?
Two things can move together because a third thing drives both. Ice cream sales and drownings both rise in summer, but one does not cause the other.
To show cause, run an experiment, like an A/B test, or use careful methods that account for other factors.
What is Simpson's paradox?
Simpson's paradox is when a trend appears in every group, but reverses when the groups are combined. It happens when the mix of segments differs between the two things you compare. A hidden factor drives both.
So check results within important segments, like device or country, not only the total.
What is Bayes' theorem, with an example?
Bayes' theorem updates a belief with new evidence. Take a rare disease that 1 in 1,000 people have. The test catches 99% of sick people, and wrongly flags 1% of healthy people.
Out of 1,000 people, about 10 healthy people test positive, but only 1 sick person. So only about 1 in 11 positives is sick.
3. A/B testing
A/B tests are central to data science at product companies. Expect detailed questions here.
How do you design an A/B test?
An A/B test shows version A to one random group of users and version B to another, then compares them. Choose one main metric and a guardrail metric that must not get worse. Decide the smallest change worth detecting, and work out the sample size. Split users randomly, and fix the test length before you start.
Then run it to the end, and only then read the result.
How many users does an A/B test need?
It depends on the starting rate, the smallest change you care about, the significance level and the power. Small changes need very large samples.
Work it out before the test, not after.
What we measured: Say you want to detect a change from 10% to 11% conversion, at the 0.05 level with 80% power. You need about 14,751 users in each group.
Why is it wrong to stop an A/B test as soon as it looks significant?
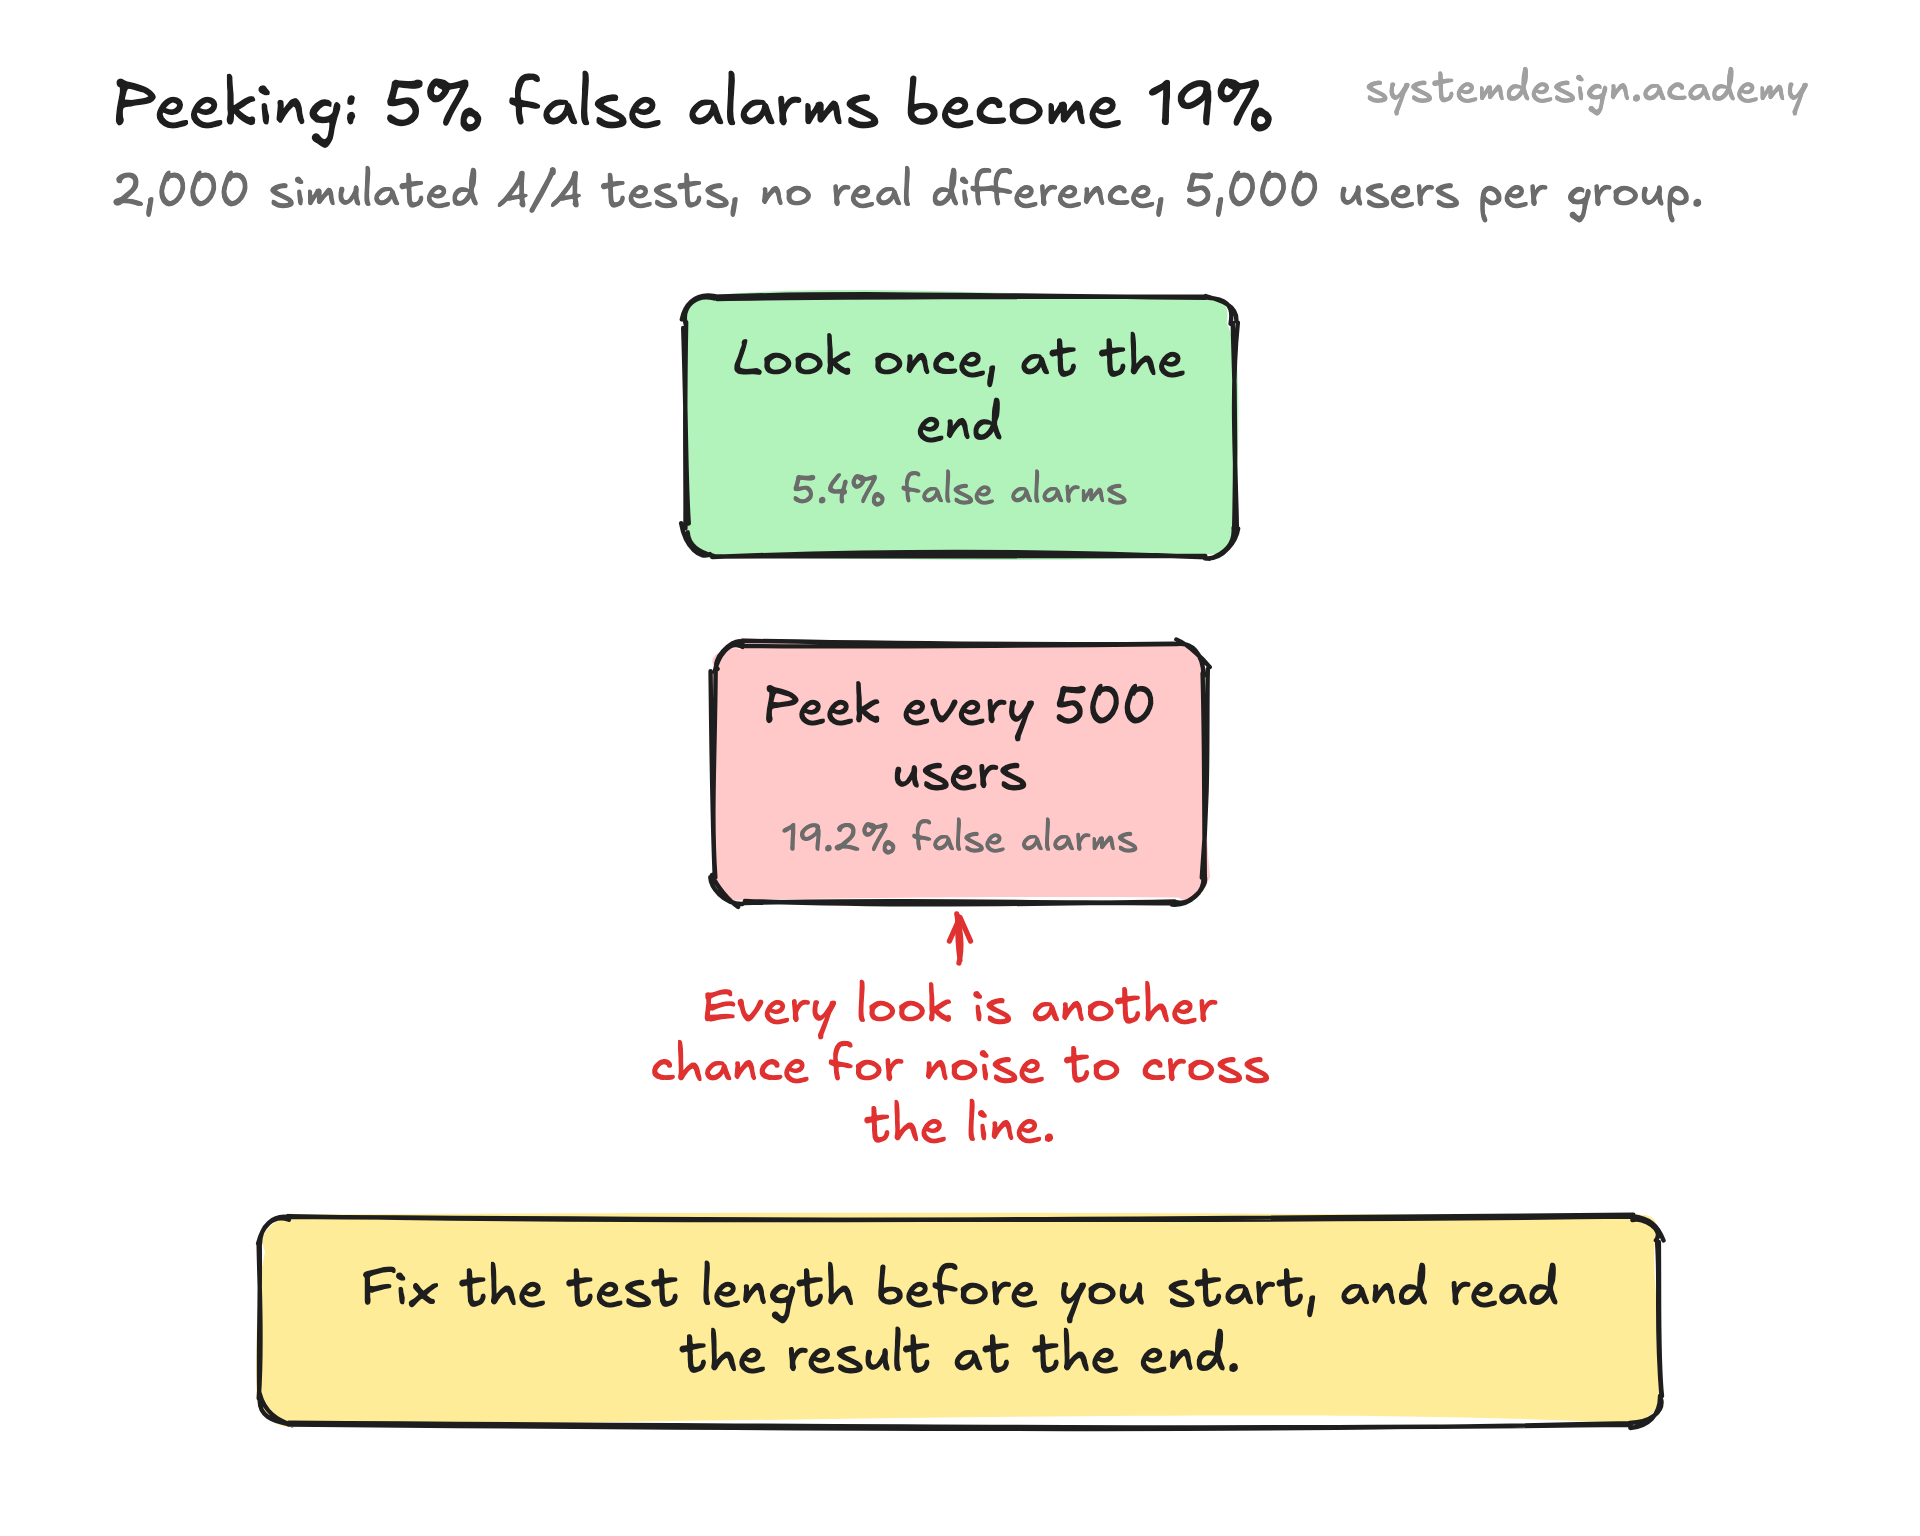
Each time you check, random noise gets another chance to look like a real difference. Stopping at the first good result inflates false alarms.
Fix the length in advance. Or use sequential testing, a method built for looking many times.
What we measured: We simulated 2,000 A/A tests, where both groups get the same thing. Looking once at the end gave 5.4% false alarms. Peeking every 500 users, 10 times, gave 19.2%.
What goes wrong when you test many metrics at once?
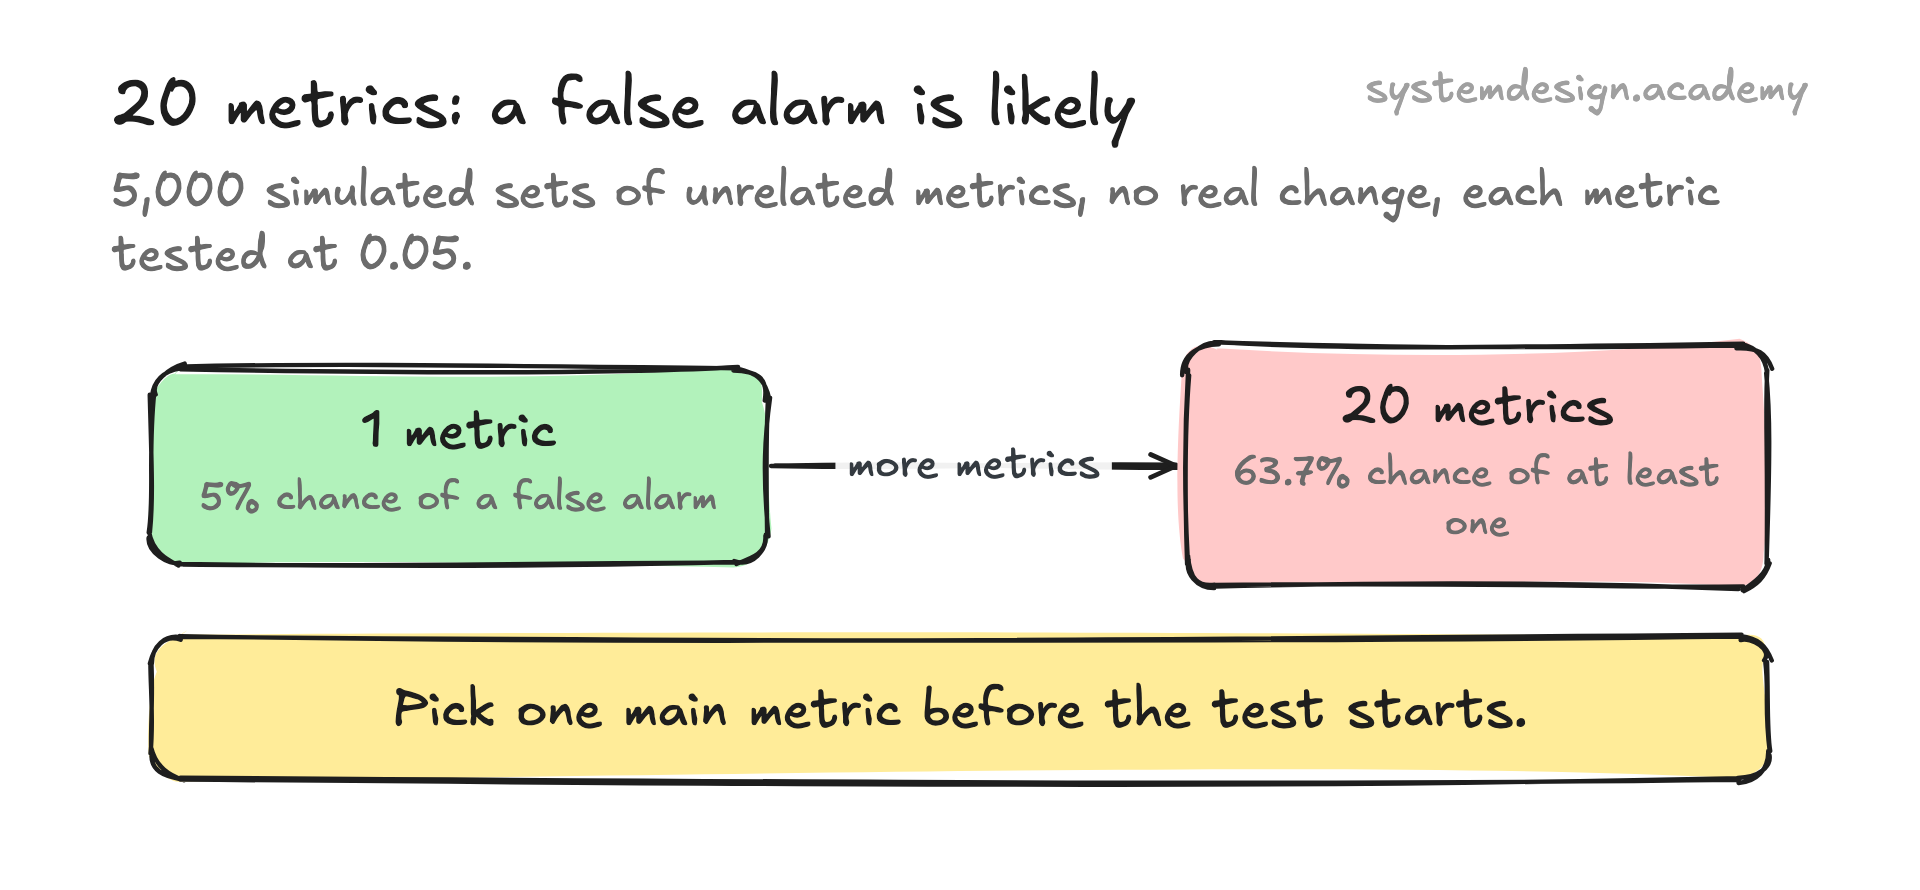
Each metric at the 0.05 level has a 5% chance of a false alarm. With many metrics, at least one false alarm becomes likely.
Choose one main metric in advance. Or correct for it: the Bonferroni method divides 0.05 by the number of metrics.
What we measured: We simulated 5,000 sets of 20 unrelated metrics with no real change. At least one false alarm happened in 63.7% of them. The formula gives 64.2%. Related metrics give a smaller number.
What is a sample ratio mismatch?
It is when the split between groups is further from plan than chance allows. A chi-square test checks this. It usually means a bug in how users were assigned or logged.
Check for it first. If it is there, do not trust the result.
What is the novelty effect?
Users sometimes click a new feature just because it is new. The effect fades after a while.
Run tests long enough, and compare new users with returning ones.
When should you use a paired test?
When the same items are measured twice, such as the same questions scored by an old and a new model. A paired test compares each item with itself. It removes a lot of noise when the two models agree on most items.
Treating paired data as two separate groups wastes that advantage.
4. SQL
Most data science interviews include SQL. These patterns come up again and again. Each query below was run on a small test table.
How do you find the second highest salary?
Find the highest salary, then the highest salary below it. If two people share the top salary, this still returns the next different salary.
SELECT MAX(salary) AS second_highest
FROM employees
WHERE salary < (SELECT MAX(salary) FROM employees);
-- result: 90000
-- (Ravi and Meera both earn 120000, so the next distinct salary is 90000)How do you find the top earner in each department?
Use a window function, which computes a value for each row from a group of rows around it. PARTITION BY dept makes each department its own group. DENSE_RANK gives each row a rank inside its department, and ties get the same rank. Then keep rank 1.
ROW_NUMBER would keep only one person when two earn the same, which may hide a tie.
SELECT dept, name, salary
FROM (
  SELECT dept, name, salary,
         DENSE_RANK() OVER (PARTITION BY dept ORDER BY salary DESC) AS rnk
  FROM employees
) AS ranked
WHERE rnk = 1
ORDER BY dept, name;
-- result:
-- Data  | Meera | 120000
-- Data  | Ravi  | 120000
-- Sales | Li | 85000How do you calculate a running total?
Use SUM as a window function, with PARTITION BY for each user and ORDER BY date. Each row then shows the total so far. The ROWS line makes rows with the same date add up one at a time.
SELECT user_id, order_date, amount,
       SUM(amount) OVER (
         PARTITION BY user_id ORDER BY order_date
         ROWS BETWEEN UNBOUNDED PRECEDING AND CURRENT ROW
       ) AS running_total
FROM orders
WHERE user_id = 10
ORDER BY order_date;
-- result:
-- 10 | 2026-01-01 | 100 | 100
-- 10 | 2026-01-03 |  50 | 150
-- 10 | 2026-01-05 | 70 | 220How do you find duplicate rows?
Group by all the columns that should be unique together, and keep groups with more than one row.
SELECT user_id, order_date, amount, COUNT(*) AS copies
FROM orders
GROUP BY user_id, order_date, amount
HAVING COUNT(*) > 1;
-- result: 12 | 2026-01-02 | 40 | 2What is the difference between WHERE and HAVING?
WHERE filters rows before grouping. HAVING filters groups after GROUP BY, so it can use totals like COUNT or SUM.
What are the main types of JOIN?
INNER JOIN keeps rows that match in both tables. LEFT JOIN keeps every row from the left table, with NULL where there is no match. FULL OUTER JOIN keeps all rows from both.
A common bug is a join that creates duplicate rows. Check row counts before and after.
5. Metrics and product sense
At product companies, you will be asked to choose metrics and explain changes in them.
How do you choose a success metric for a feature?
Start from the goal of the feature, and pick a metric that moves when users get real value. Add a guardrail metric that must not get worse, such as cancellations or page load time.
Avoid metrics that are easy to game, like raw clicks.
What is cohort retention?
A cohort is a group of users who started in the same period, such as the same week. Retention is the share of them still active later, such as after 30 days.
Comparing cohorts shows whether the product is getting better at keeping users.
A key metric dropped 10% yesterday. How do you investigate?
First check the data: logging bugs, pipeline delays and tracking changes are common causes. Then compare with the same day last week, since holidays and weekends change behaviour.
Next split by segment: platform, country, app version and traffic source. A drop in one segment points to the cause. Then look at what changed there, such as a release or a campaign.
6. Data cleaning and modelling
Data scientists also clean data and build models. For deeper model questions, see our machine learning page.
What do you look for in exploratory data analysis?
Exploratory data analysis (EDA) means getting to know the data before modelling. Check the size, missing values, ranges, odd values and how each column is spread out.
Plot the key relationships, and write down anything surprising before you build a model.
What is data leakage, and why does it fool data scientists?
Leakage is when information the model should not have gets into training. The scores look excellent, and the model fails in real use.
Split the data first, and do every preparation step using only the training part.
What we measured: In our course lab, choosing features before the split made pure noise look 92.7% accurate. On data put away at the start, it scored 49.8%.
How do you model a rare event, like fraud?
Do not judge by accuracy. Use precision and recall, and choose the decision threshold on validation data based on the cost of each mistake.
Try moving the threshold before oversampling, which means copying rare examples to balance the classes.
Learn it properly, not just the answers
Every answer on this page comes from our AI Engineering course: 112 lessons on RAG, evals, agents, serving, security and MLOps. Many of them are built around a real experiment. You learn why the answer is right, which is what an interviewer checks with the second question. 10 lessons are free to read, with no card needed.