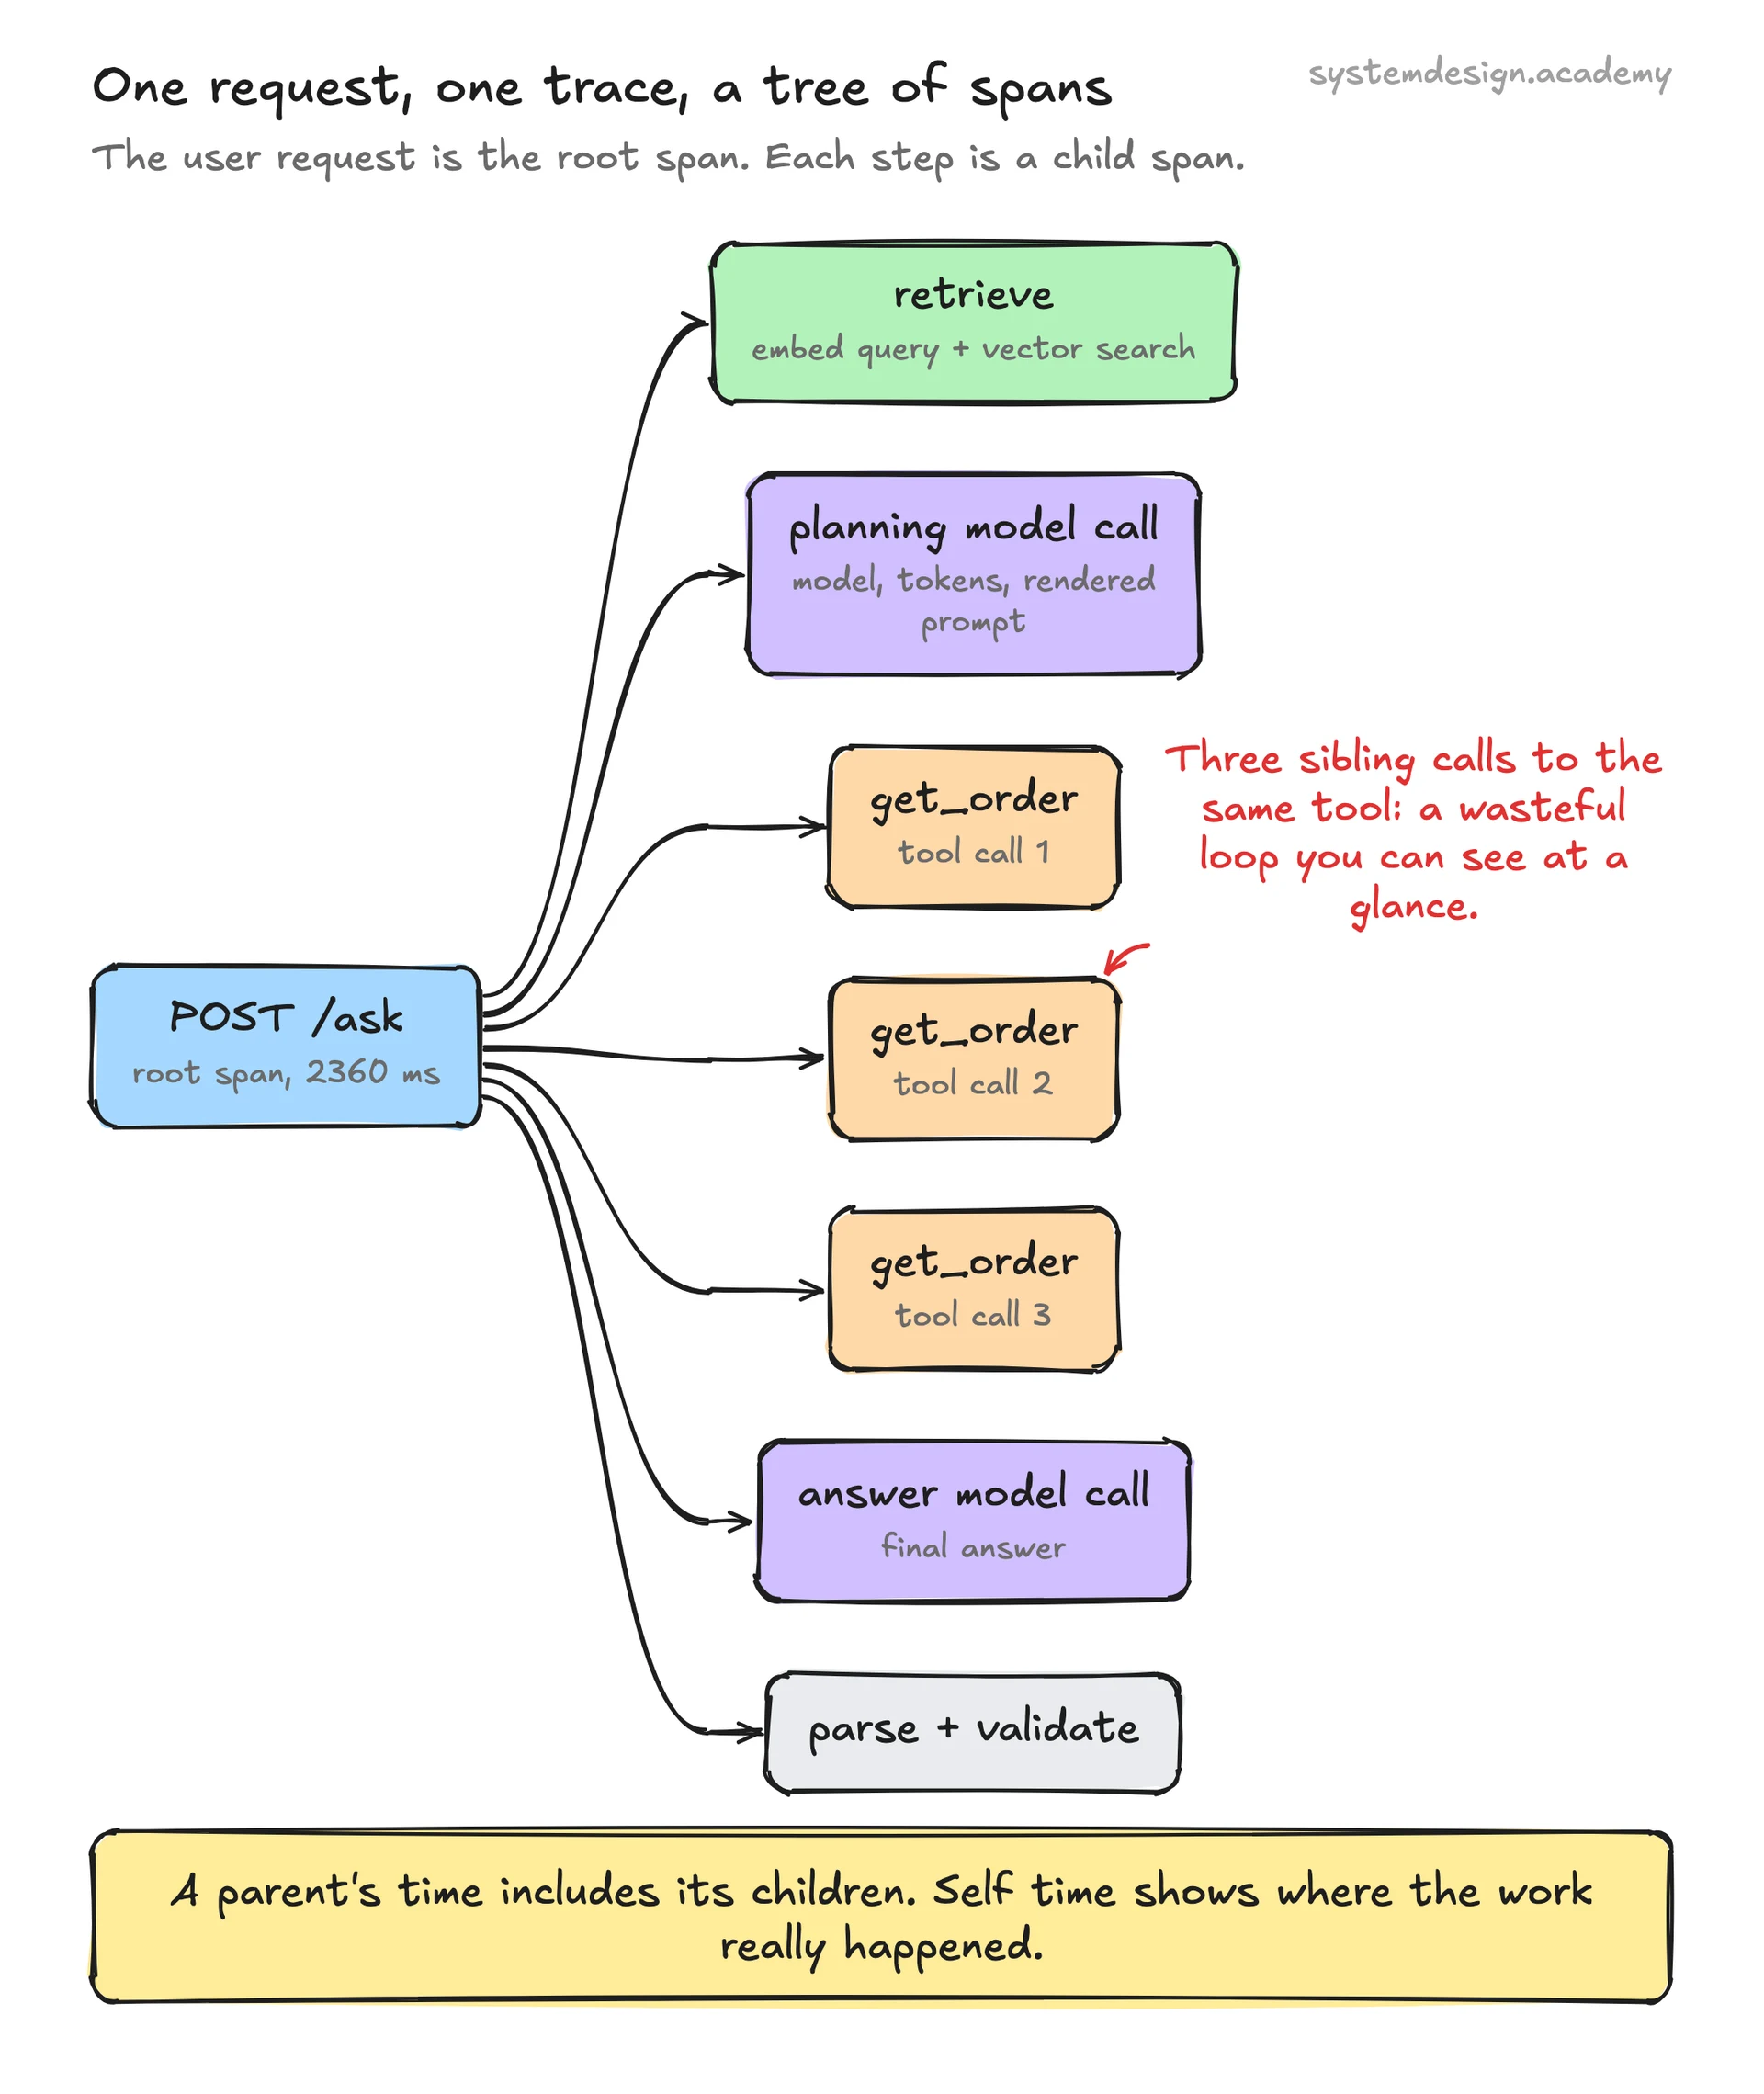
Classic observability has three pillars: traces, metrics and logs. For LLM apps, traces stay. Metrics stay with new content. Logs change.
Metrics are the summary view you alert on: latency percentiles, tokens, cost per request, error rate, and a refusal rate, the share of questions the model declined. Use percentiles, never the mean. In the lesson's 20-request example, the median latency was 1050 ms, the mean about 1508 ms and the 95th percentile 3570 ms. The two most expensive requests, 10 percent of the batch, carried about 43 percent of the cost.
Raw logs of full model outputs are unreadable at scale. The lesson replaces them with sampled outputs that carry quality scores. This is where observability meets evaluation. Observability records what happened. Evaluation judges whether it was good. A judge scores a sample of stored traces later, not inline, and writes the score back on the trace id. See the LLM evaluation lesson for how judges work.
Full traces are large and can hold private data, so you do not keep all of them. The lesson's policy decides per trace after it ends, which is called tail-based sampling. Keep errors, refusals, timeouts, slow outliers, user-flagged traces and a small random sample in full. Keep only the timing and token skeleton for the rest. Remove personal data in the collector before anything is stored.
To build the full pipeline, including the waterfall and dashboard code and the reference architecture, the next step is the LLM Observability and Tracing lesson.