A PDF you keep, downloaded from My packs. All sales are final; there are no refunds.
5 free questions from this pack
Free sample 1 · LLM application basics · junior
What do temperature and top-p control, and what values would you use for data extraction versus brainstorming?
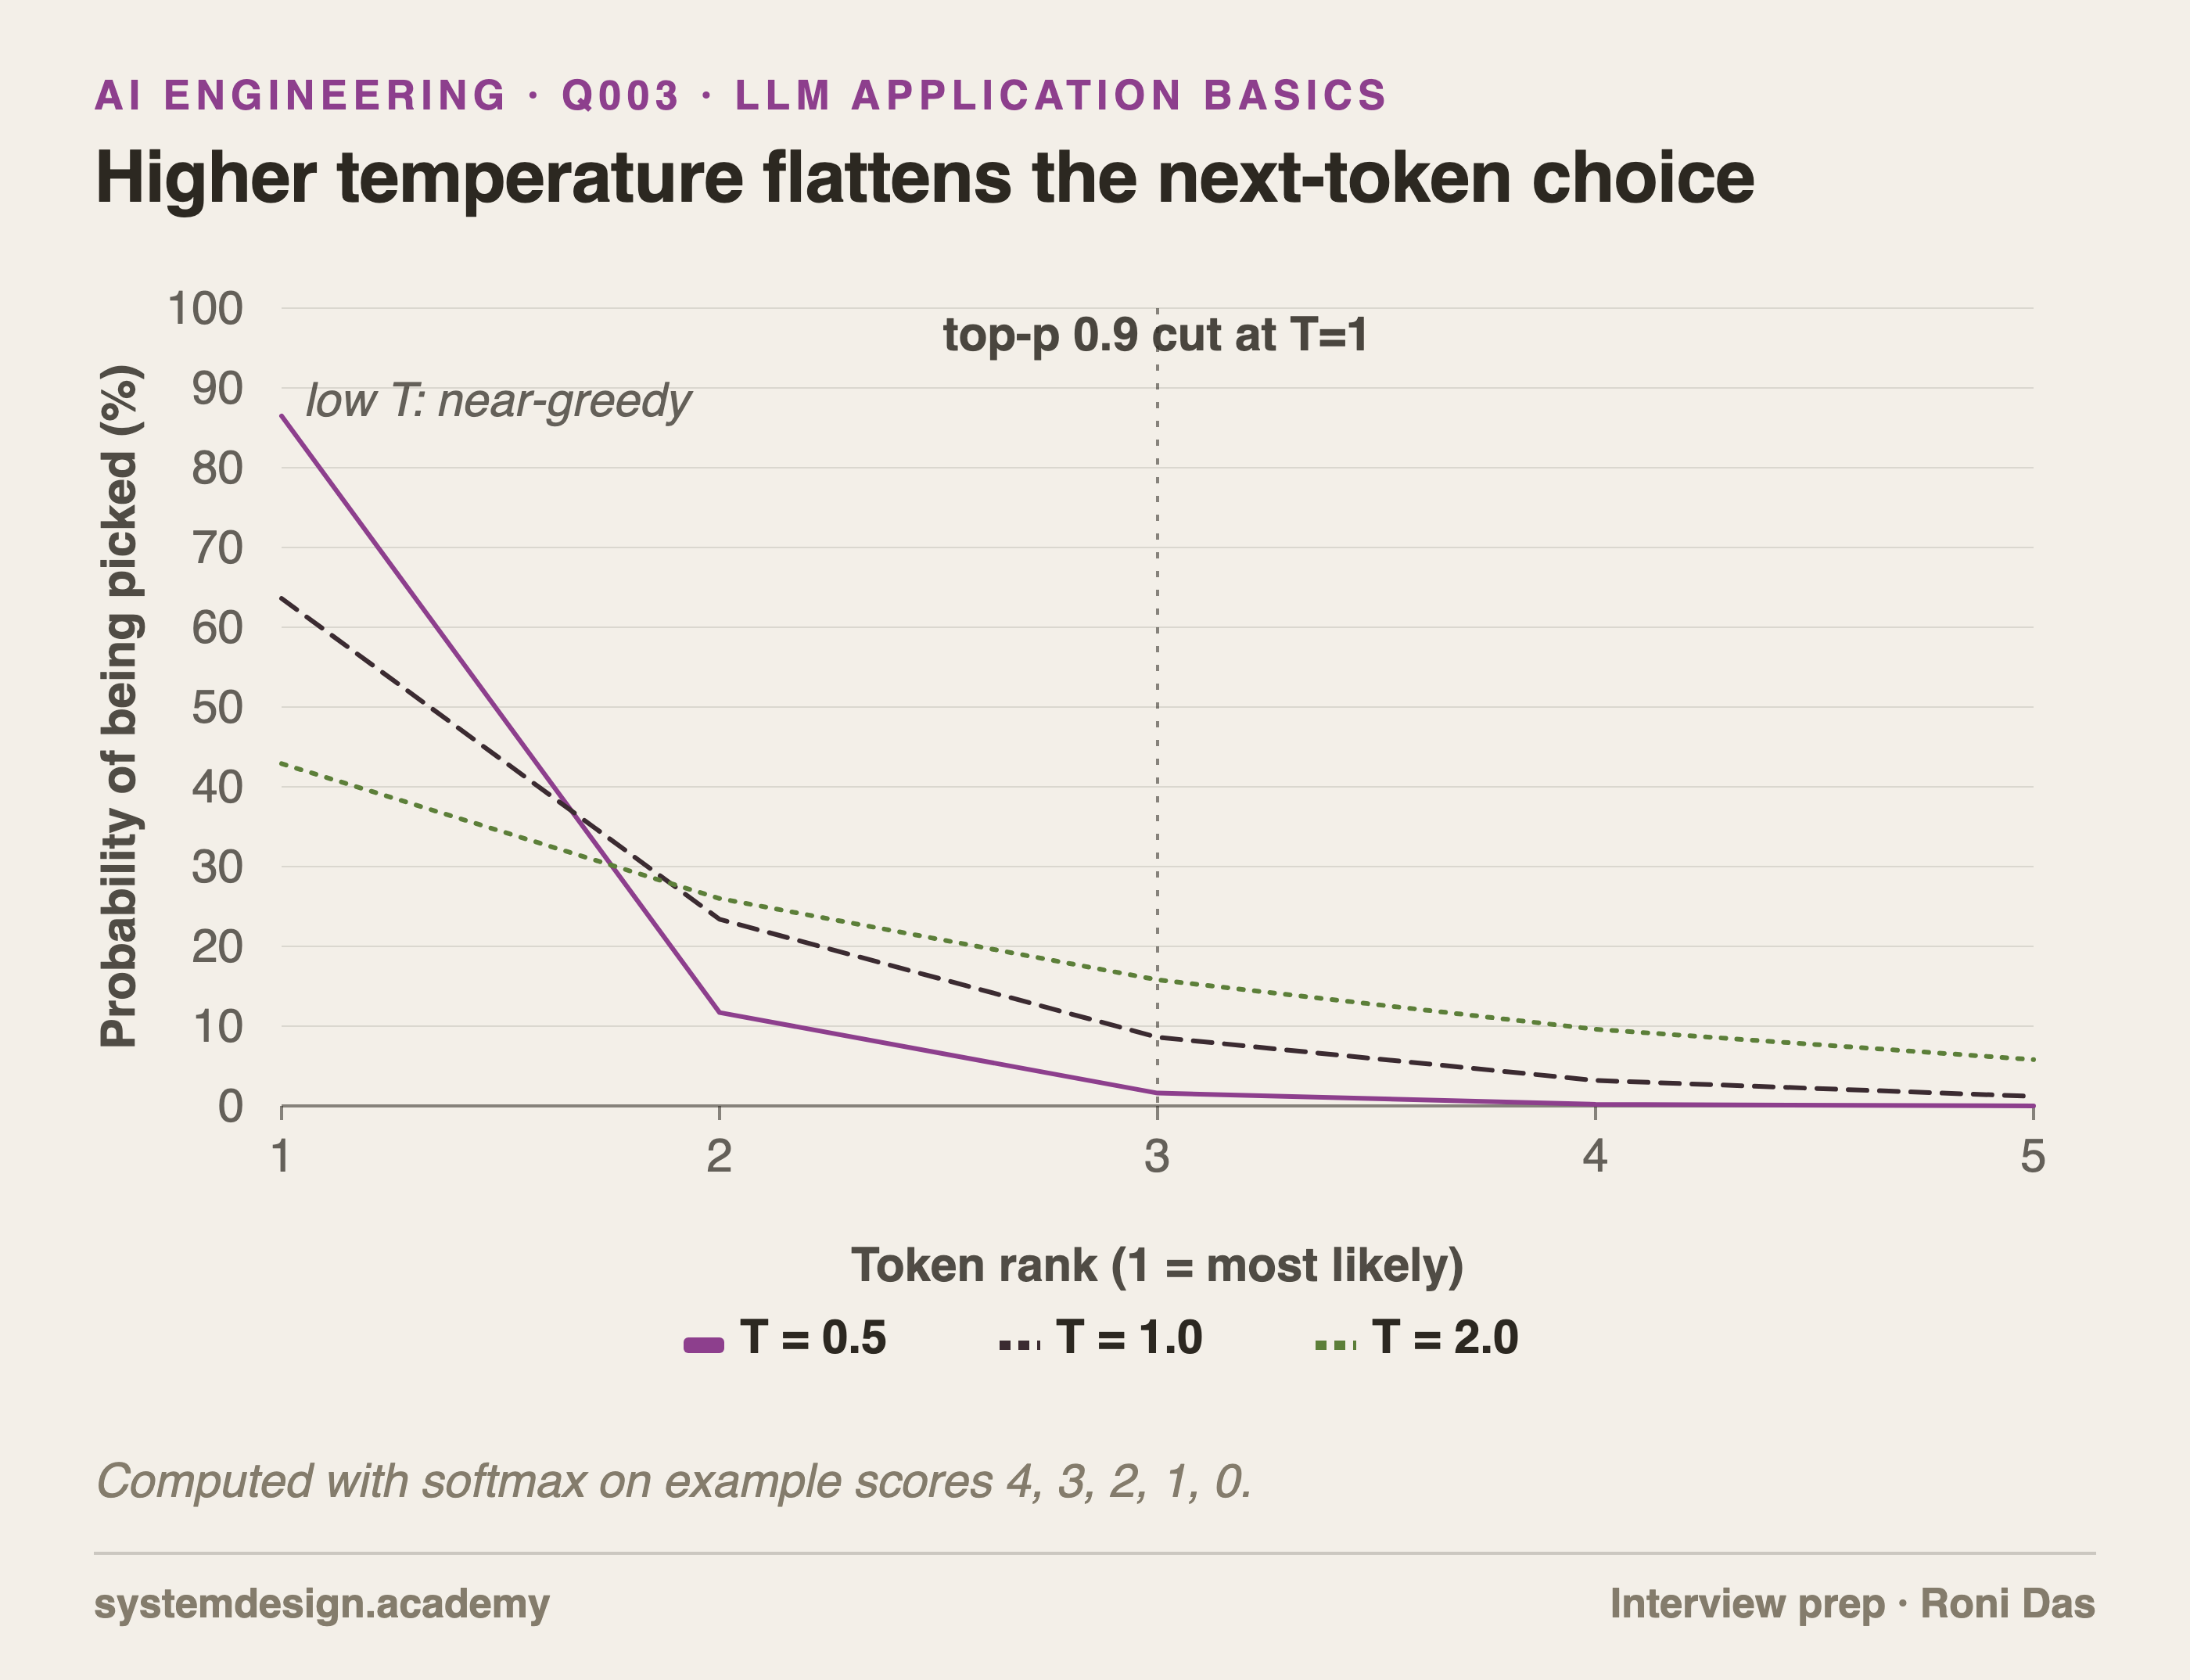
Line chart of next-token probability for five ranked tokens at temperature 0.5, 1.0 and 2.0, showing the curve flatten as temperature rises.
Why it is asked: Shows whether you know how sampling (picking the next token by its probability) works and can match the settings to the task instead of copying defaults.
Temperature controls how random the choice of the next token is, and top-p controls how many candidate tokens are allowed at all.
At each step the model gives every token a score. The scores are divided by the temperature and turned into probabilities. A low temperature makes the top token even more likely; a high temperature flattens the choices. With example scores 4, 3, 2, 1, 0, the top token gets 86.5% of the probability at temperature 0.5, 63.6% at 1.0 and 42.9% at 2.0. Temperature 0 means always pick the top token (greedy decoding).
Top-p (also called nucleus sampling) keeps only the smallest group of top tokens whose probabilities add up to at least p, then samples inside that group. At temperature 1.0 in the example, the first two tokens add up to about 87%, so top-p 0.9 keeps three tokens and drops the many unlikely tokens at the bottom of the list.
Suggested values:
- Data extraction, classification, JSON: temperature 0 or close to it, top-p left at 1. You want the same, most likely answer every time. Pair it with a schema (a fixed description of the output shape).
- Brainstorming, marketing copy, ideas: temperature around 0.8 to 1.0, top-p around 0.9 to 0.95, and ask for several candidates.
Be careful on two points. Change one setting at a time, because both change the same list of probabilities. And some reasoning models (models that think internally before answering) do not accept a temperature setting at all. A low temperature makes output more repeatable, but it does not make wrong facts right.
What the interviewer listens for
Temperature reshapes the list of probabilities; top-p cuts off the unlikely end
Temperature 0 is greedy: always the top token
Extraction: temperature near 0. Brainstorming: about 0.8 to 1.0 with top-p 0.9 to 0.95
Tune one setting at a time
Low temperature gives consistency, not correctness
Free sample 2 · Retrieval · mid
What is hybrid search, and how do you merge keyword and vector results with Reciprocal Rank Fusion?
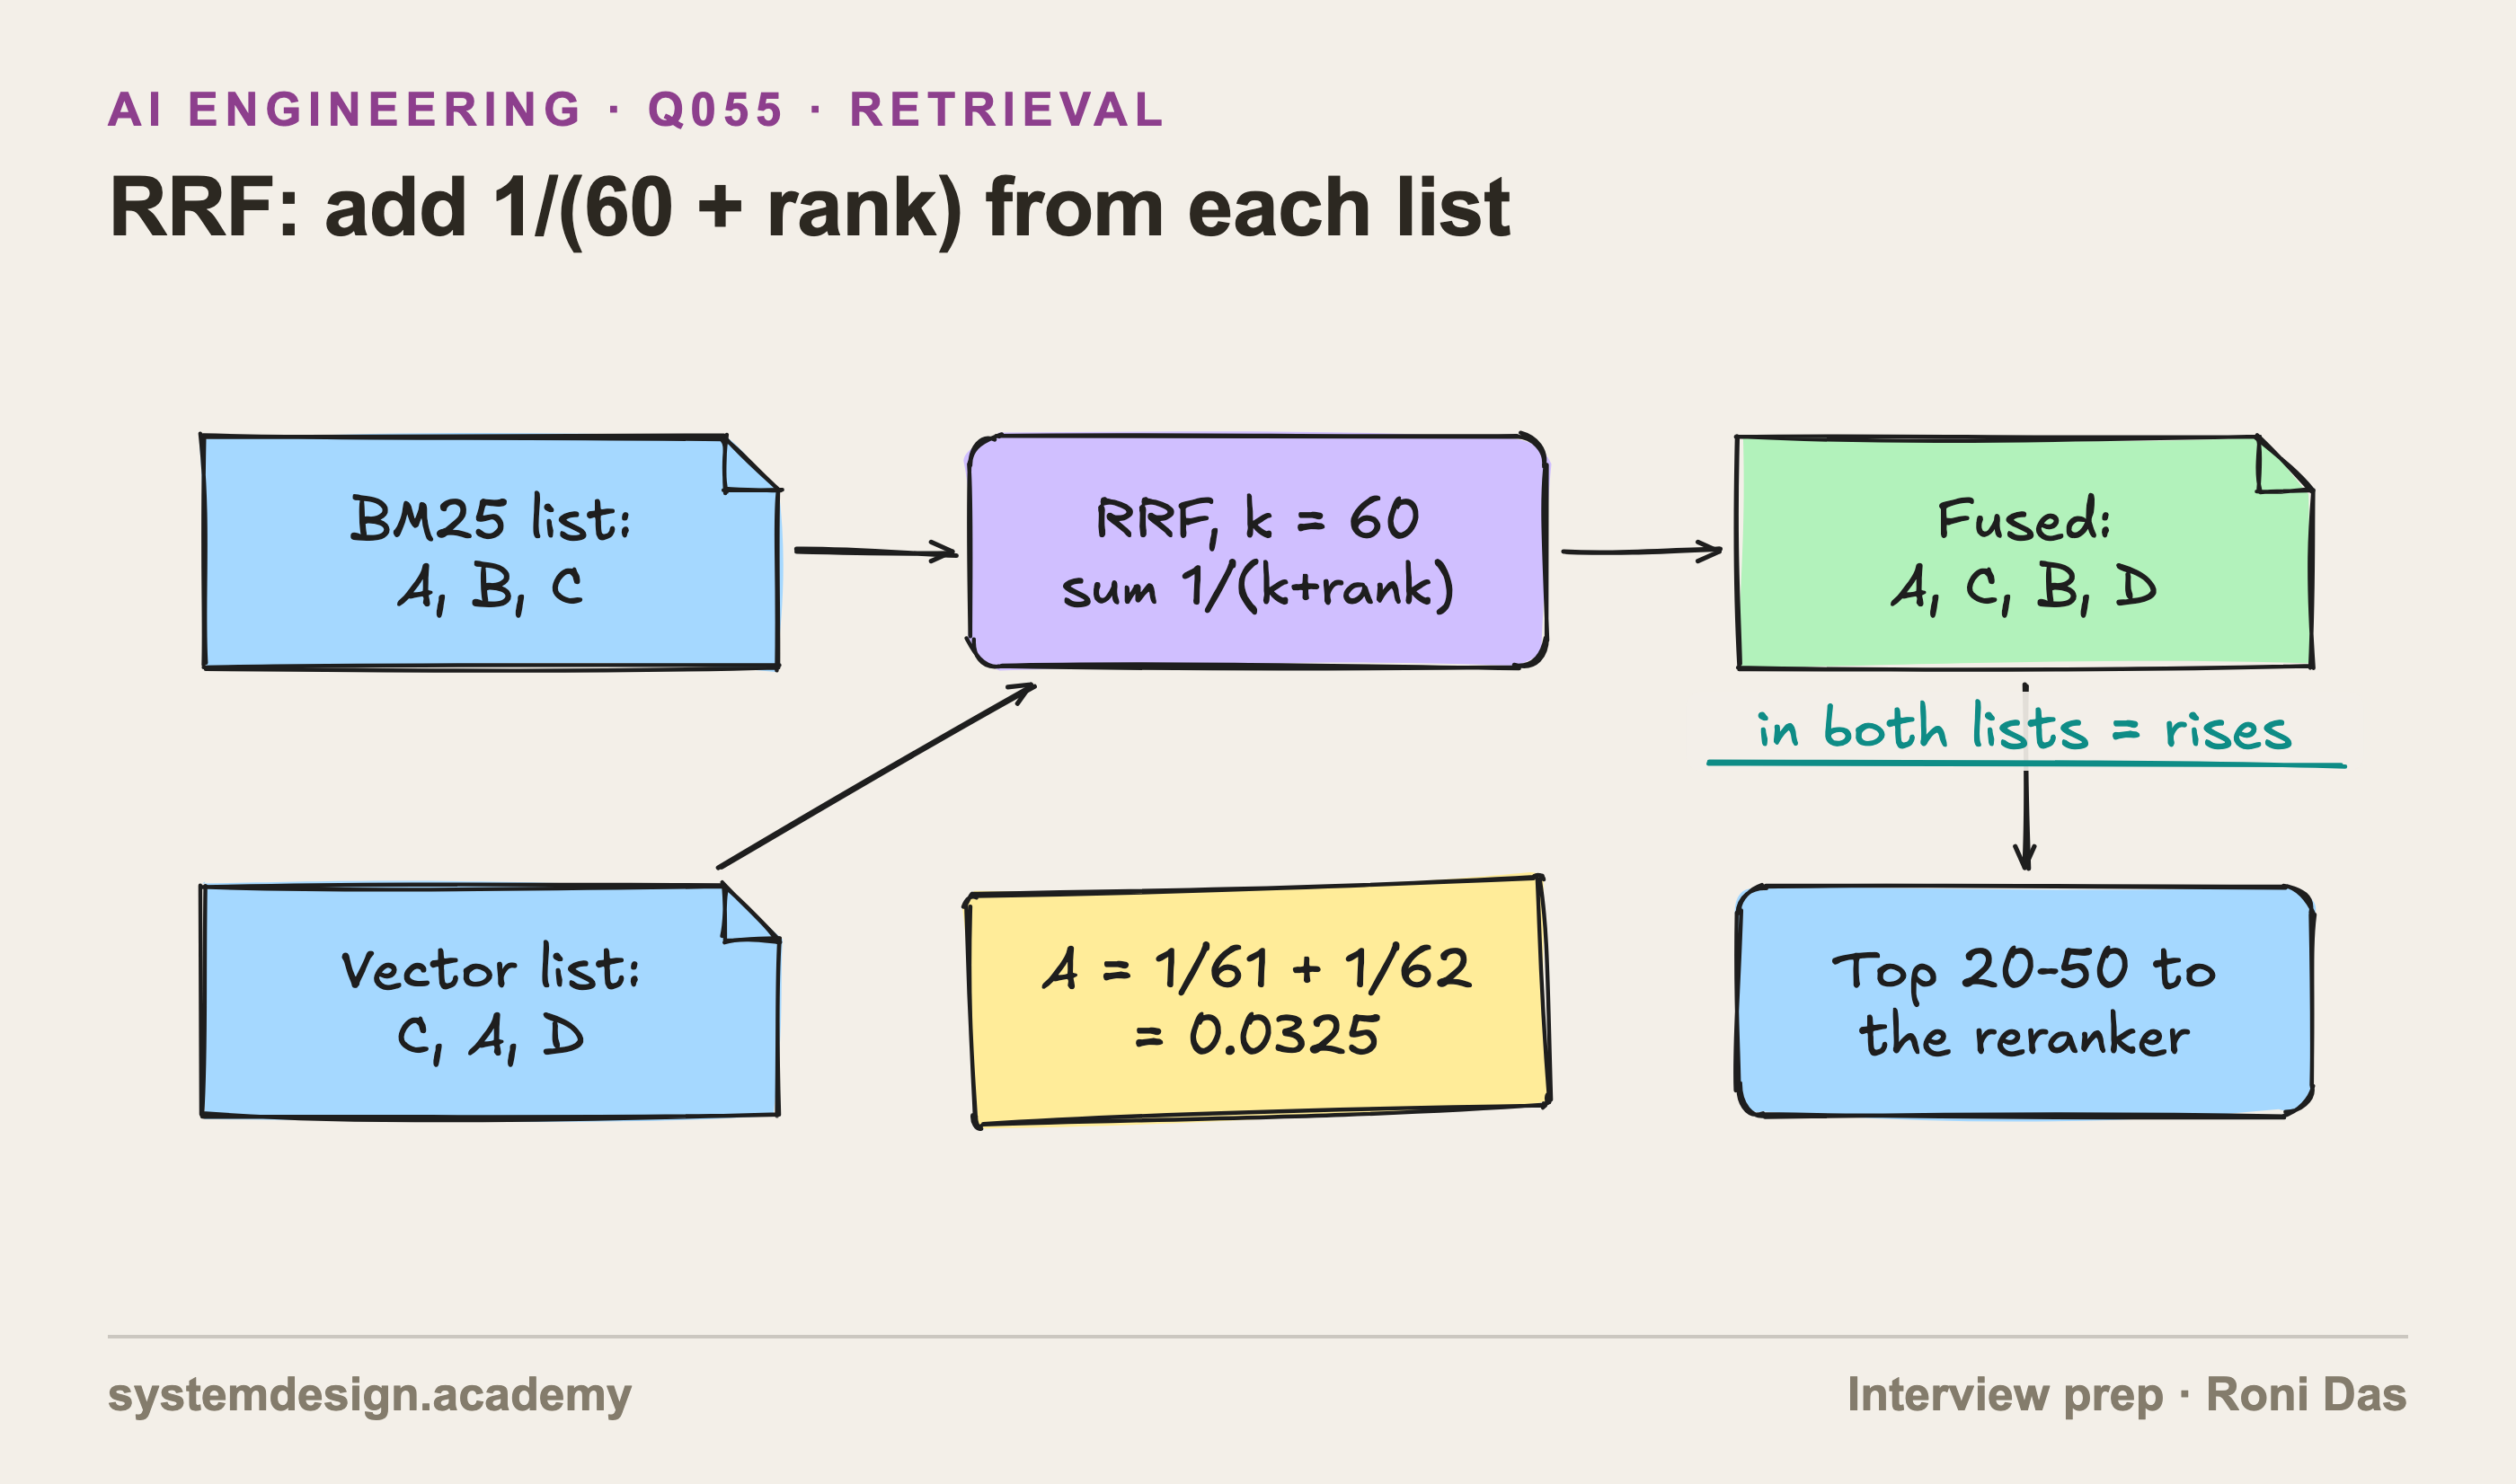
A sketch where a BM25 list A, B, C and a vector list C, A, D feed an RRF step with k equal to 60, producing the fused order A, C, B, D.
Why it is asked: Hybrid search is standard in production RAG. The interviewer wants the RRF formula and why it uses ranks.
Hybrid search runs keyword search (BM25) and vector search on the same query and merges the two ranked lists. Reciprocal Rank Fusion (RRF) merges them using only positions: each document scores the sum of 1 / (k + rank) over every list it appears in, with k usually set to 60.
Why ranks and not scores: BM25 scores have no fixed range (one query may give 12.7, another 3.1), while cosine similarity scores sit between -1 and 1. Adding them directly makes no sense. RRF ignores the raw scores, so it needs no normalization and almost no tuning.
Worked example with k = 60. BM25 returns A, B, C. Vector search returns C, A, D.
- A: 1/61 + 1/62 = 0.03252
- C: 1/63 + 1/61 = 0.03227
- B: 1/62 = 0.01613
- D: 1/63 = 0.01587
Final order: A, C, B, D. Documents found by both methods rise to the top.
What k does: a smaller k gives the first few ranks much more weight; a larger k flattens the differences. 60 comes from the original 2009 paper and works well as a default.
In practice:
- Retrieve about 50 from each method, fuse, and pass the top 20 to 50 to a reranker (a second model that re-scores results).
- If one source is more reliable for your data, multiply its terms by a weight.
- A tuned weighted sum of normalized scores can beat RRF, but it needs labeled data, and the weights drift as the data changes.
Measure hybrid against each method alone on your eval set. On a corpus with no codes or names, the gain can be small.
What the interviewer listens for
Run BM25 and vector search, then fuse
RRF score is the sum of 1 / (k + rank), k about 60
Uses ranks, so no score normalization
Documents found by both lists rise
Usually followed by a reranker
Free sample 3 · Retrieval · senior
Users ask "list all X" questions and RAG returns only five items. Why, and what do you do?
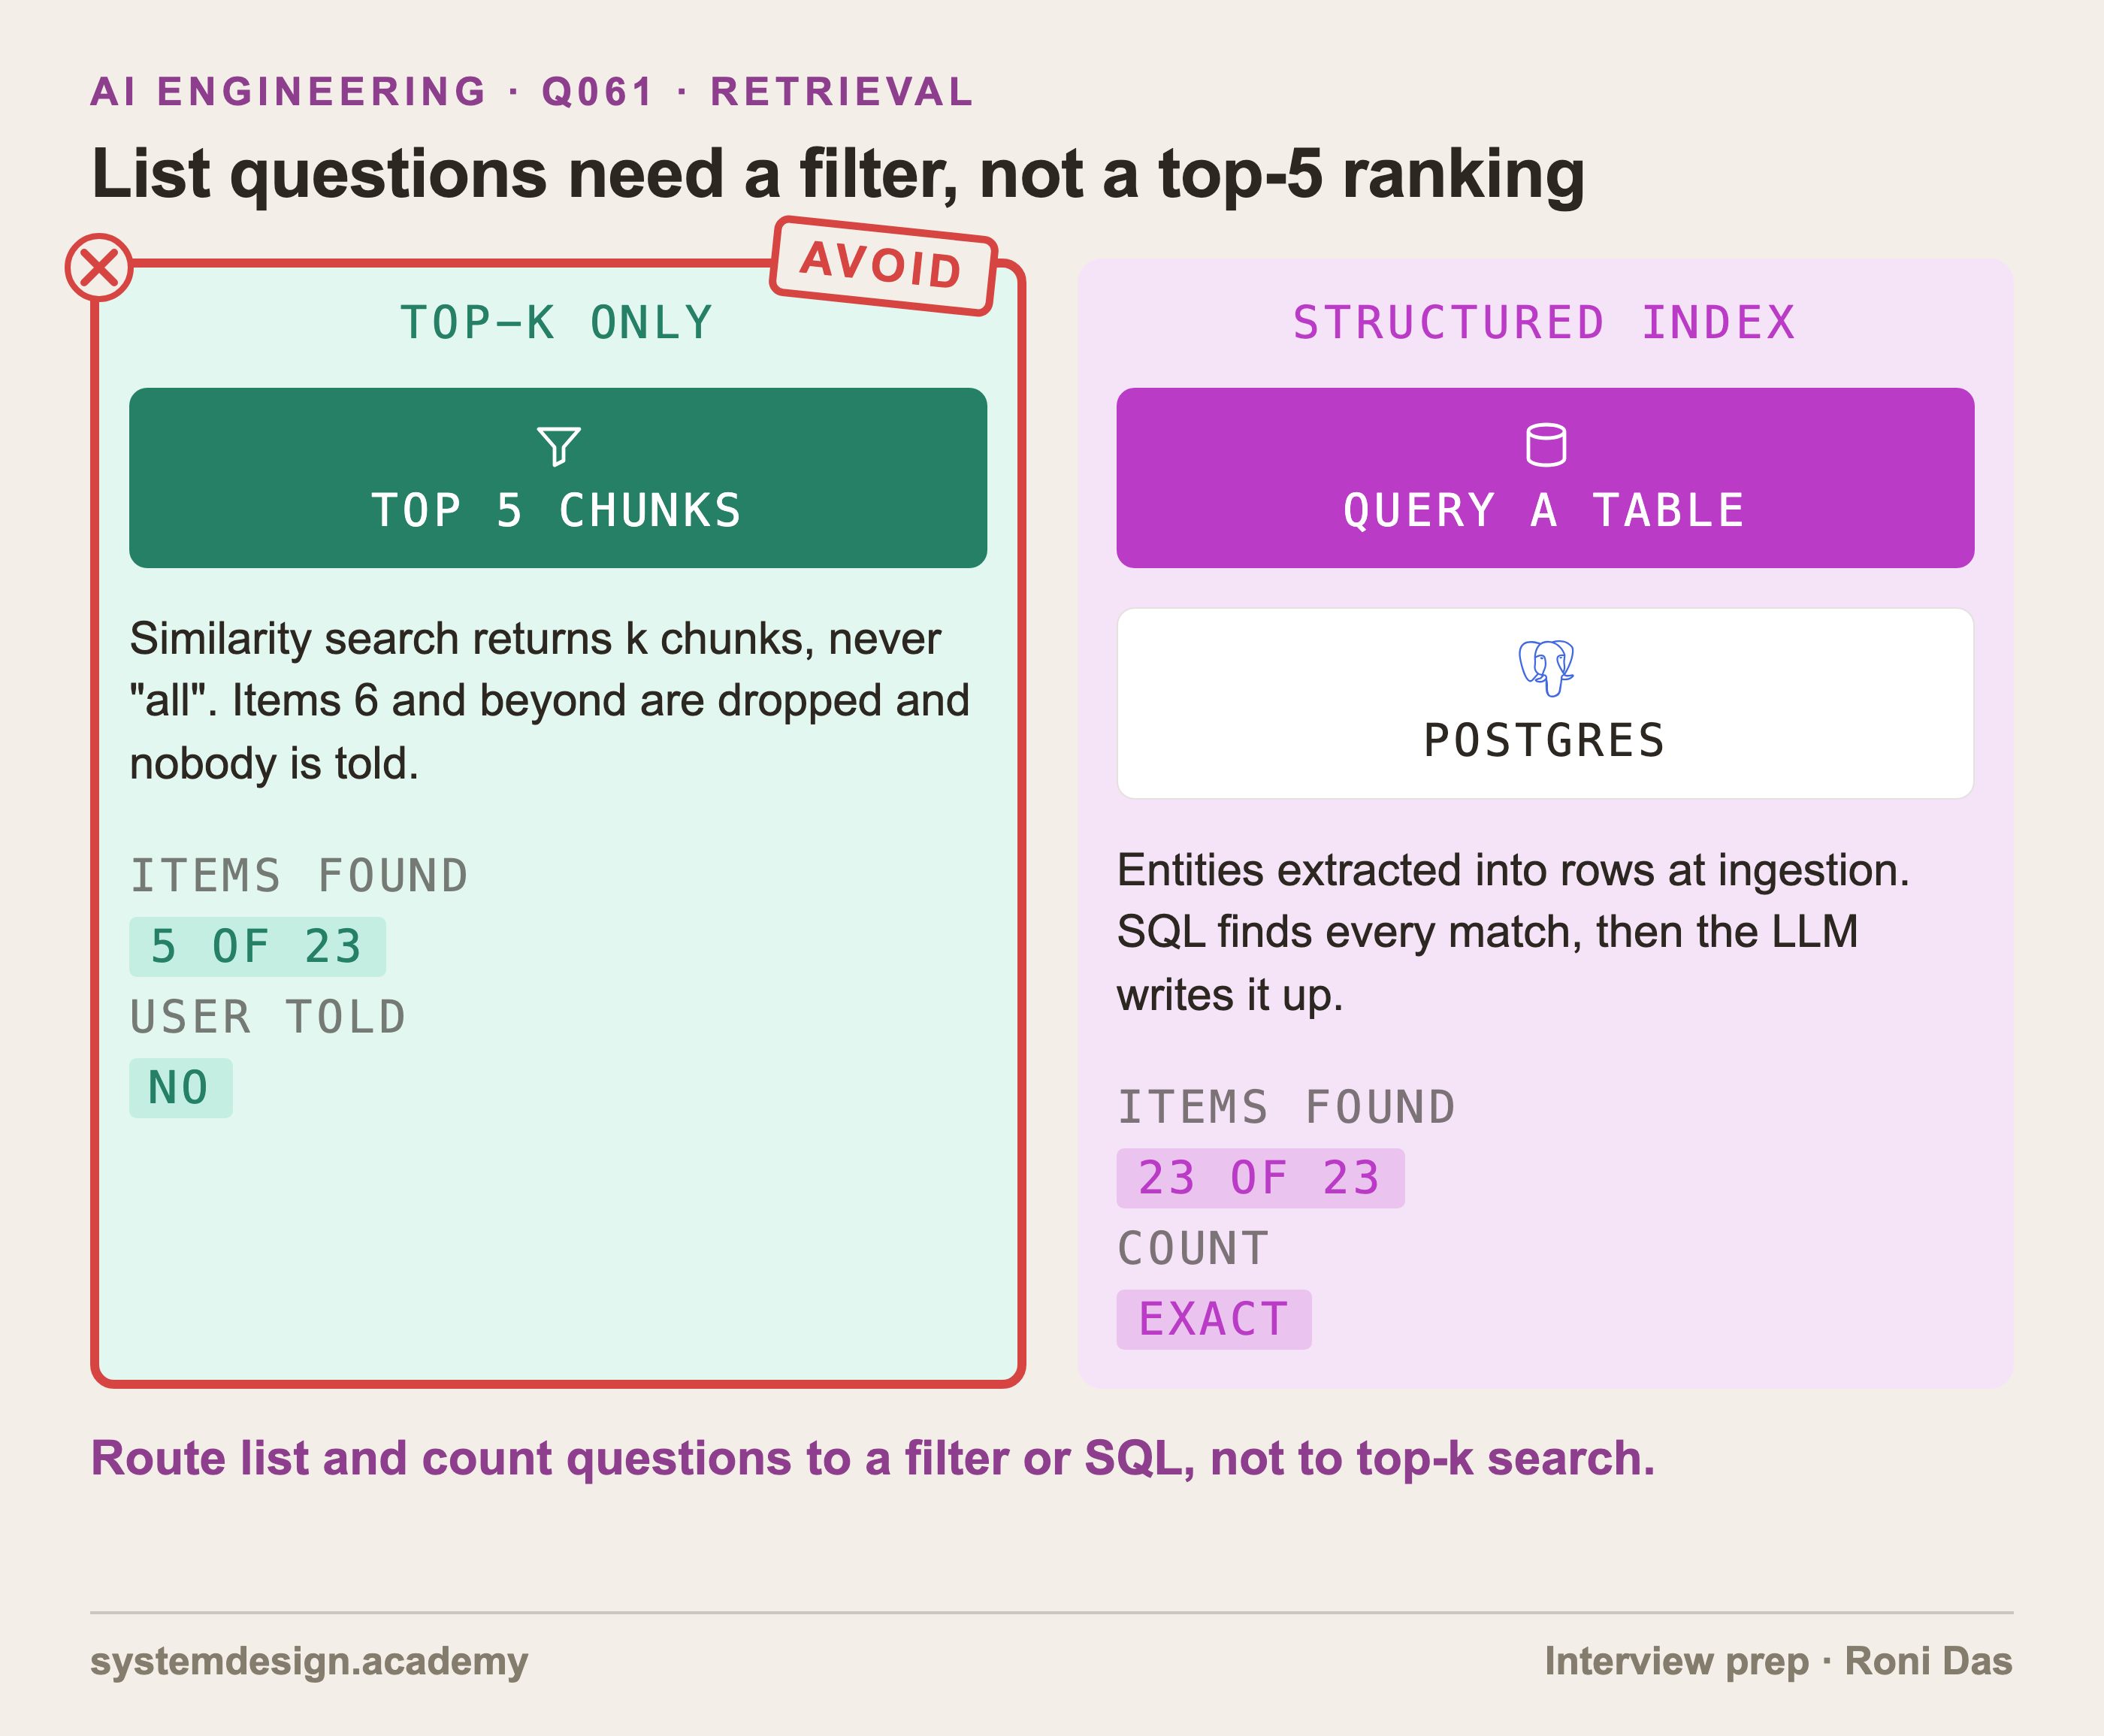
Two panels: top-k retrieval returns only 5 of 23 matching items and is crossed out, while a structured index queried with SQL returns all 23.
Why it is asked: Tests whether you understand that top-k search is a ranking tool, not a complete query, and whether you can route aggregation questions to the right kind of index.
RAG returns five items because top-k retrieval returns a fixed number of the most similar chunks, and the model can only list what it was shown. A "list all X" question needs every match, which is a filter or a count over all matches (an aggregation), not a ranking.
Three things go wrong together:
- Hard cap: with k = 5, items 6 and beyond can never reach the model, even if 23 documents match.
- Crowding: several chunks from the same document can fill the slots, so you may see only 2 or 3 distinct items.
- Silent failure: the model writes a confident list and does not know it is incomplete.
Raising k to 50 helps a little, but it raises cost and latency, still has a cap, and buries items in the middle of a long prompt.
What works:
- Detect the intent. A small classifier or router marks list, count and "which documents mention" questions.
- Answer them from a structured source. At ingestion, extract the things you care about (entities, such as products, customers, policies) into rows, and answer with SQL or a metadata filter. If the item is a plain name, an exact text search often finds every match with no model at all.
- For fuzzy criteria, filter first, then run the model once on each matching document (a map step) and merge the results.
- Be honest in the answer: "23 items found, showing all 23", or show the results page by page.
Measure it with a set of list questions whose full answers you know, and score item recall: items returned divided by items that exist.
What the interviewer listens for
Top-k is a ranking with a fixed cap, so it cannot answer "all" questions
Detect list and count intent and route it differently
Extract entities into a structured store at ingestion and query with SQL or filters
Score item recall on a list-question eval set
Tell the user how many items exist
Free sample 4 · LLM-as-judge and online evals · mid
How do you check that an LLM judge agrees with human reviewers?
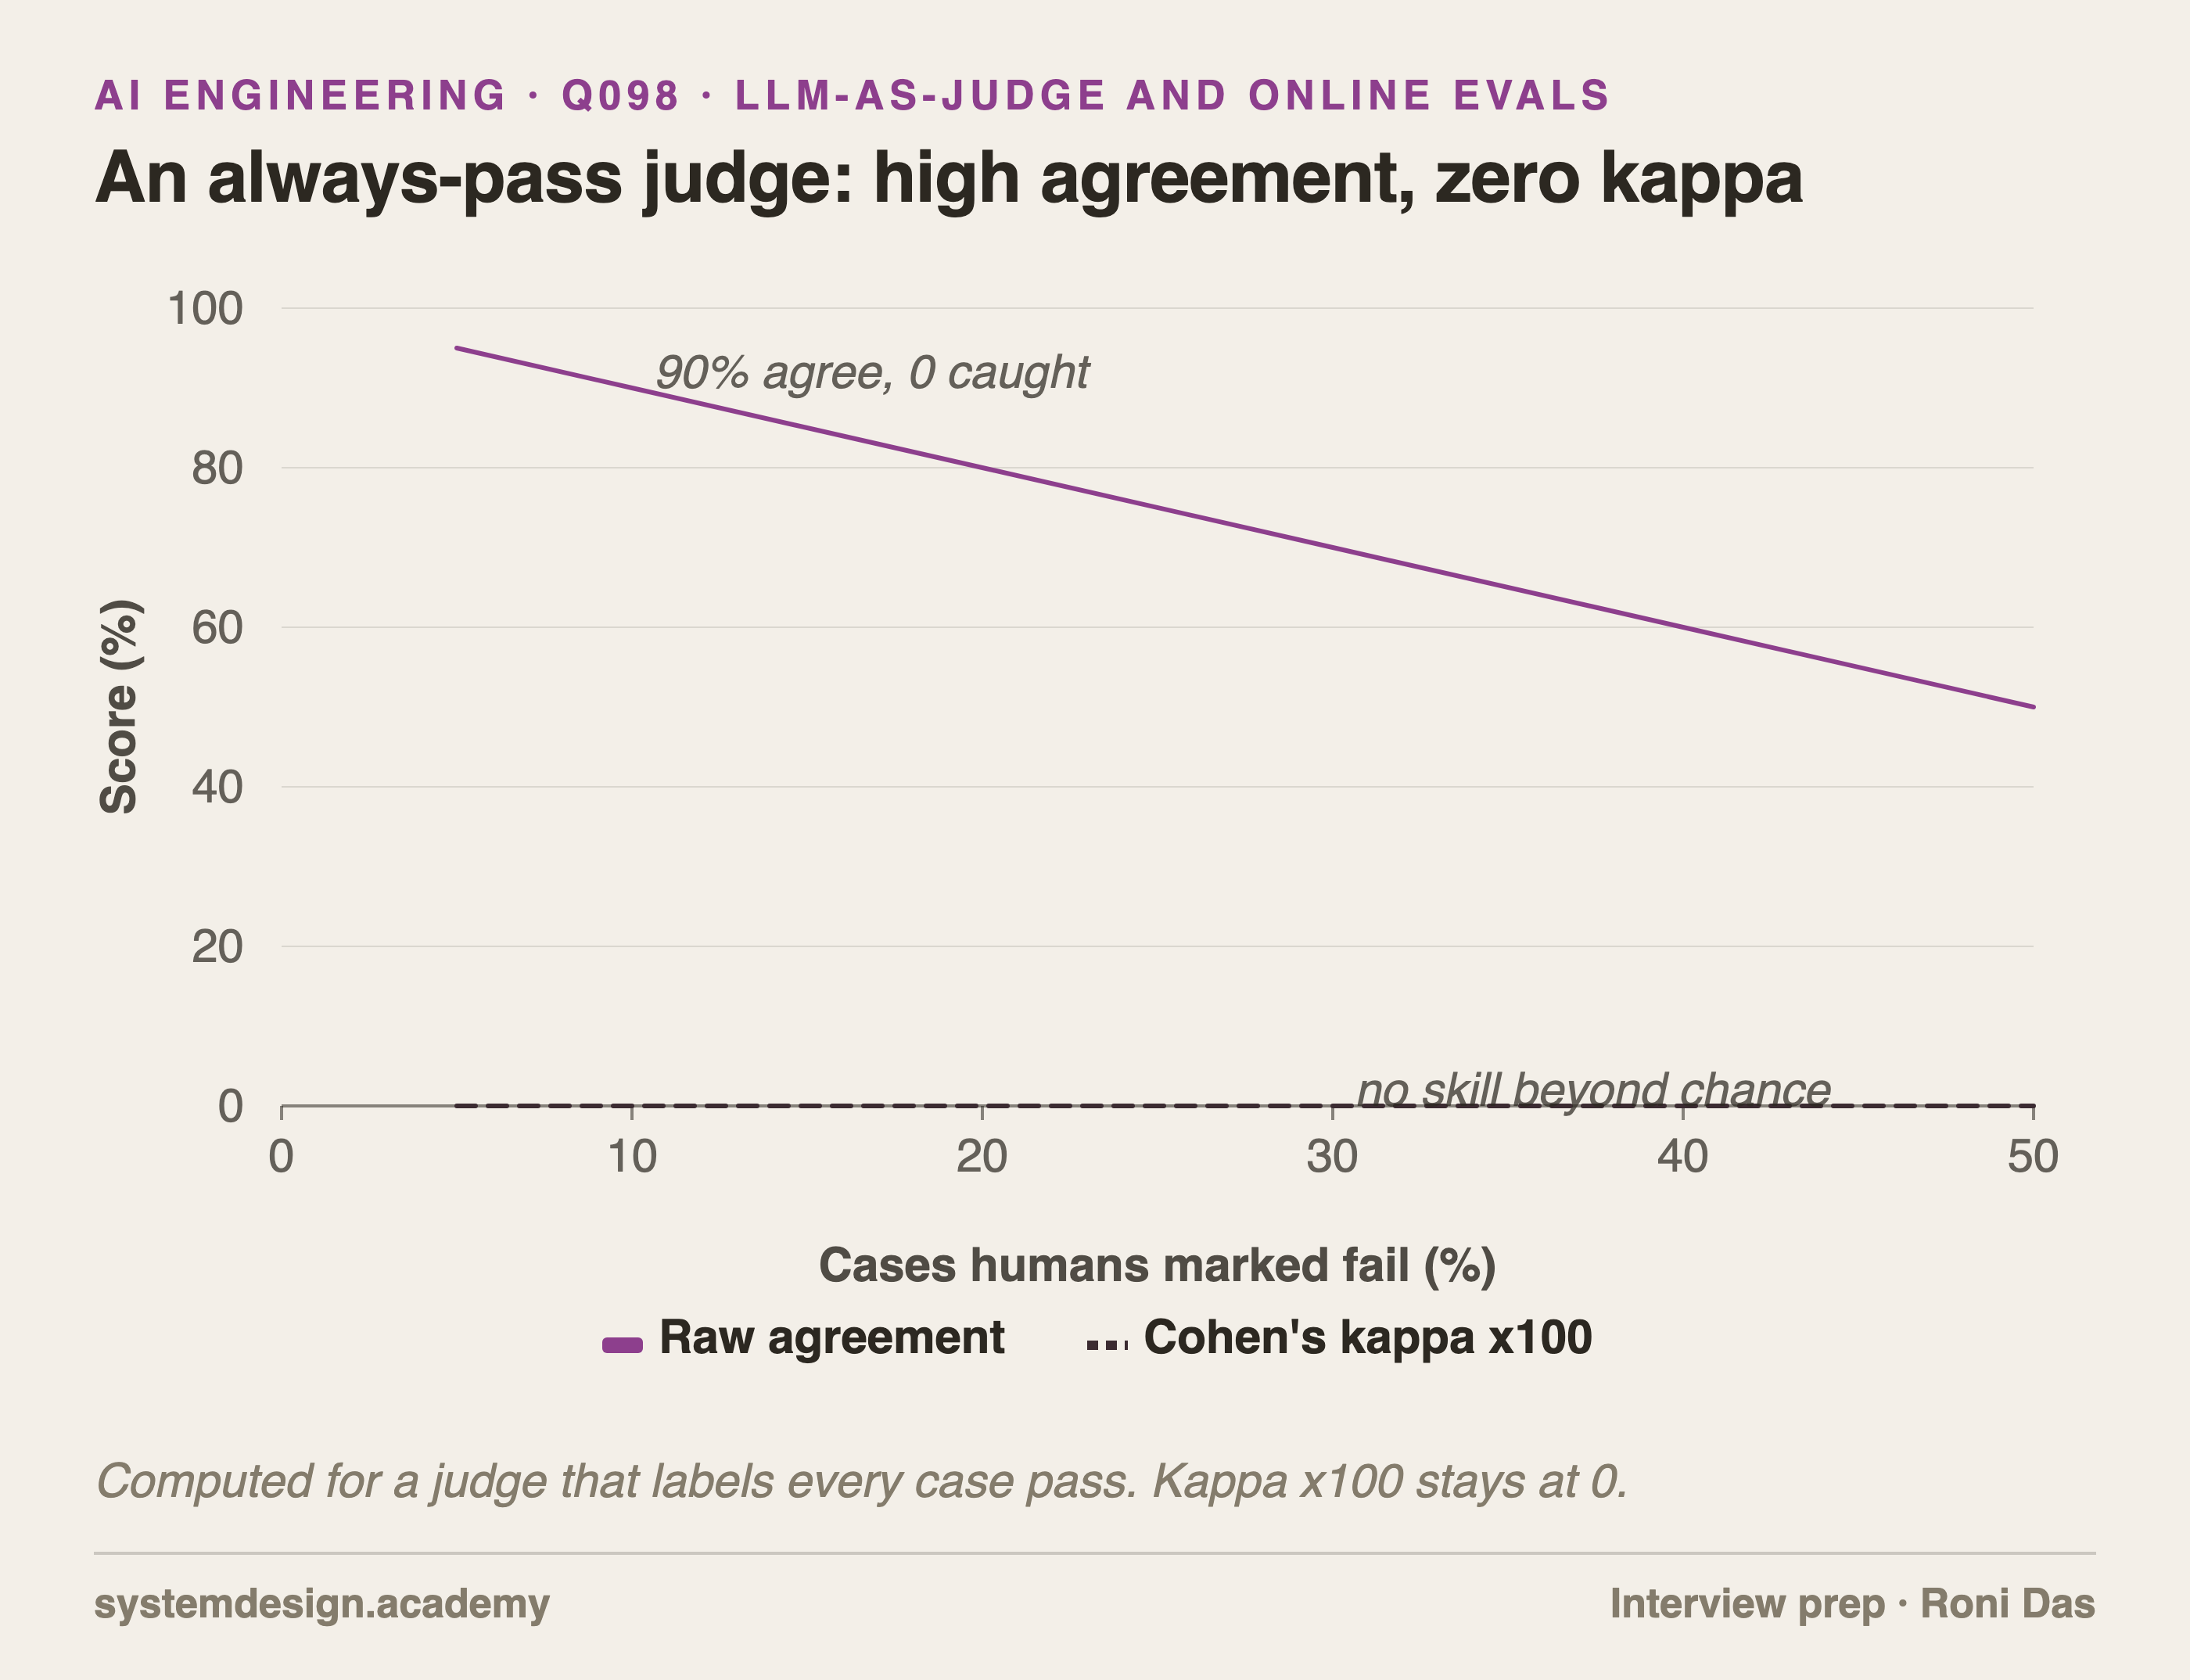
A line chart showing that a judge which always says pass gets raw agreement equal to the pass rate, from 95% down to 50%, while its Cohen's kappa stays at zero.
Why it is asked: The interviewer wants to know if you treat the judge as a model that must itself be tested, and whether you know why raw agreement is a misleading number.
You test the judge like any other classifier: humans label a set of real outputs, the judge labels the same set, and you compare the two case by case before you trust a single judge score.
How to do it:
- Take 100 to 200 real traces, with plenty of failures in them. A domain expert labels each one pass or fail, using the same written rubric the judge will get.
- Split the labeled set into a development part, where you tune the judge prompt, and a test part that you open only at the end. Otherwise you tune the prompt to the test cases and the result looks better than it is.
- Run the judge on the test part and count four cells: both pass, both fail, judge pass but human fail, judge fail but human pass.
Do not report raw agreement alone. If 90% of cases pass, a judge that always says "pass" agrees 90% of the time and catches nothing. Report two rates instead: the true positive rate (of the cases humans passed, the share the judge passed) and the true negative rate (of the cases humans failed, the share the judge failed). Cohen's kappa, a score that removes the agreement you would get by pure chance, is a useful single number.
Example with 200 cases: both pass 120, both fail 50, judge pass but human fail 20, judge fail but human pass 10. Raw agreement is 85%, but the judge catches only 50 of 70 real failures (71%), and kappa is 0.66.
Repeat the check whenever the judge model or prompt changes, and on a fresh sample every few weeks.
What the interviewer listens for
Human labels on real traces, same rubric as the judge
Separate dev and test splits so the judge prompt is not overfit
True positive and true negative rates, not raw agreement
Cohen's kappa corrects for chance agreement
Re-validate after any judge model or prompt change
Free sample 5 · Cost and latency · staff
Cut the cost of an LLM feature serving 10 million requests a day by 60% without hurting quality. Walk through your plan.
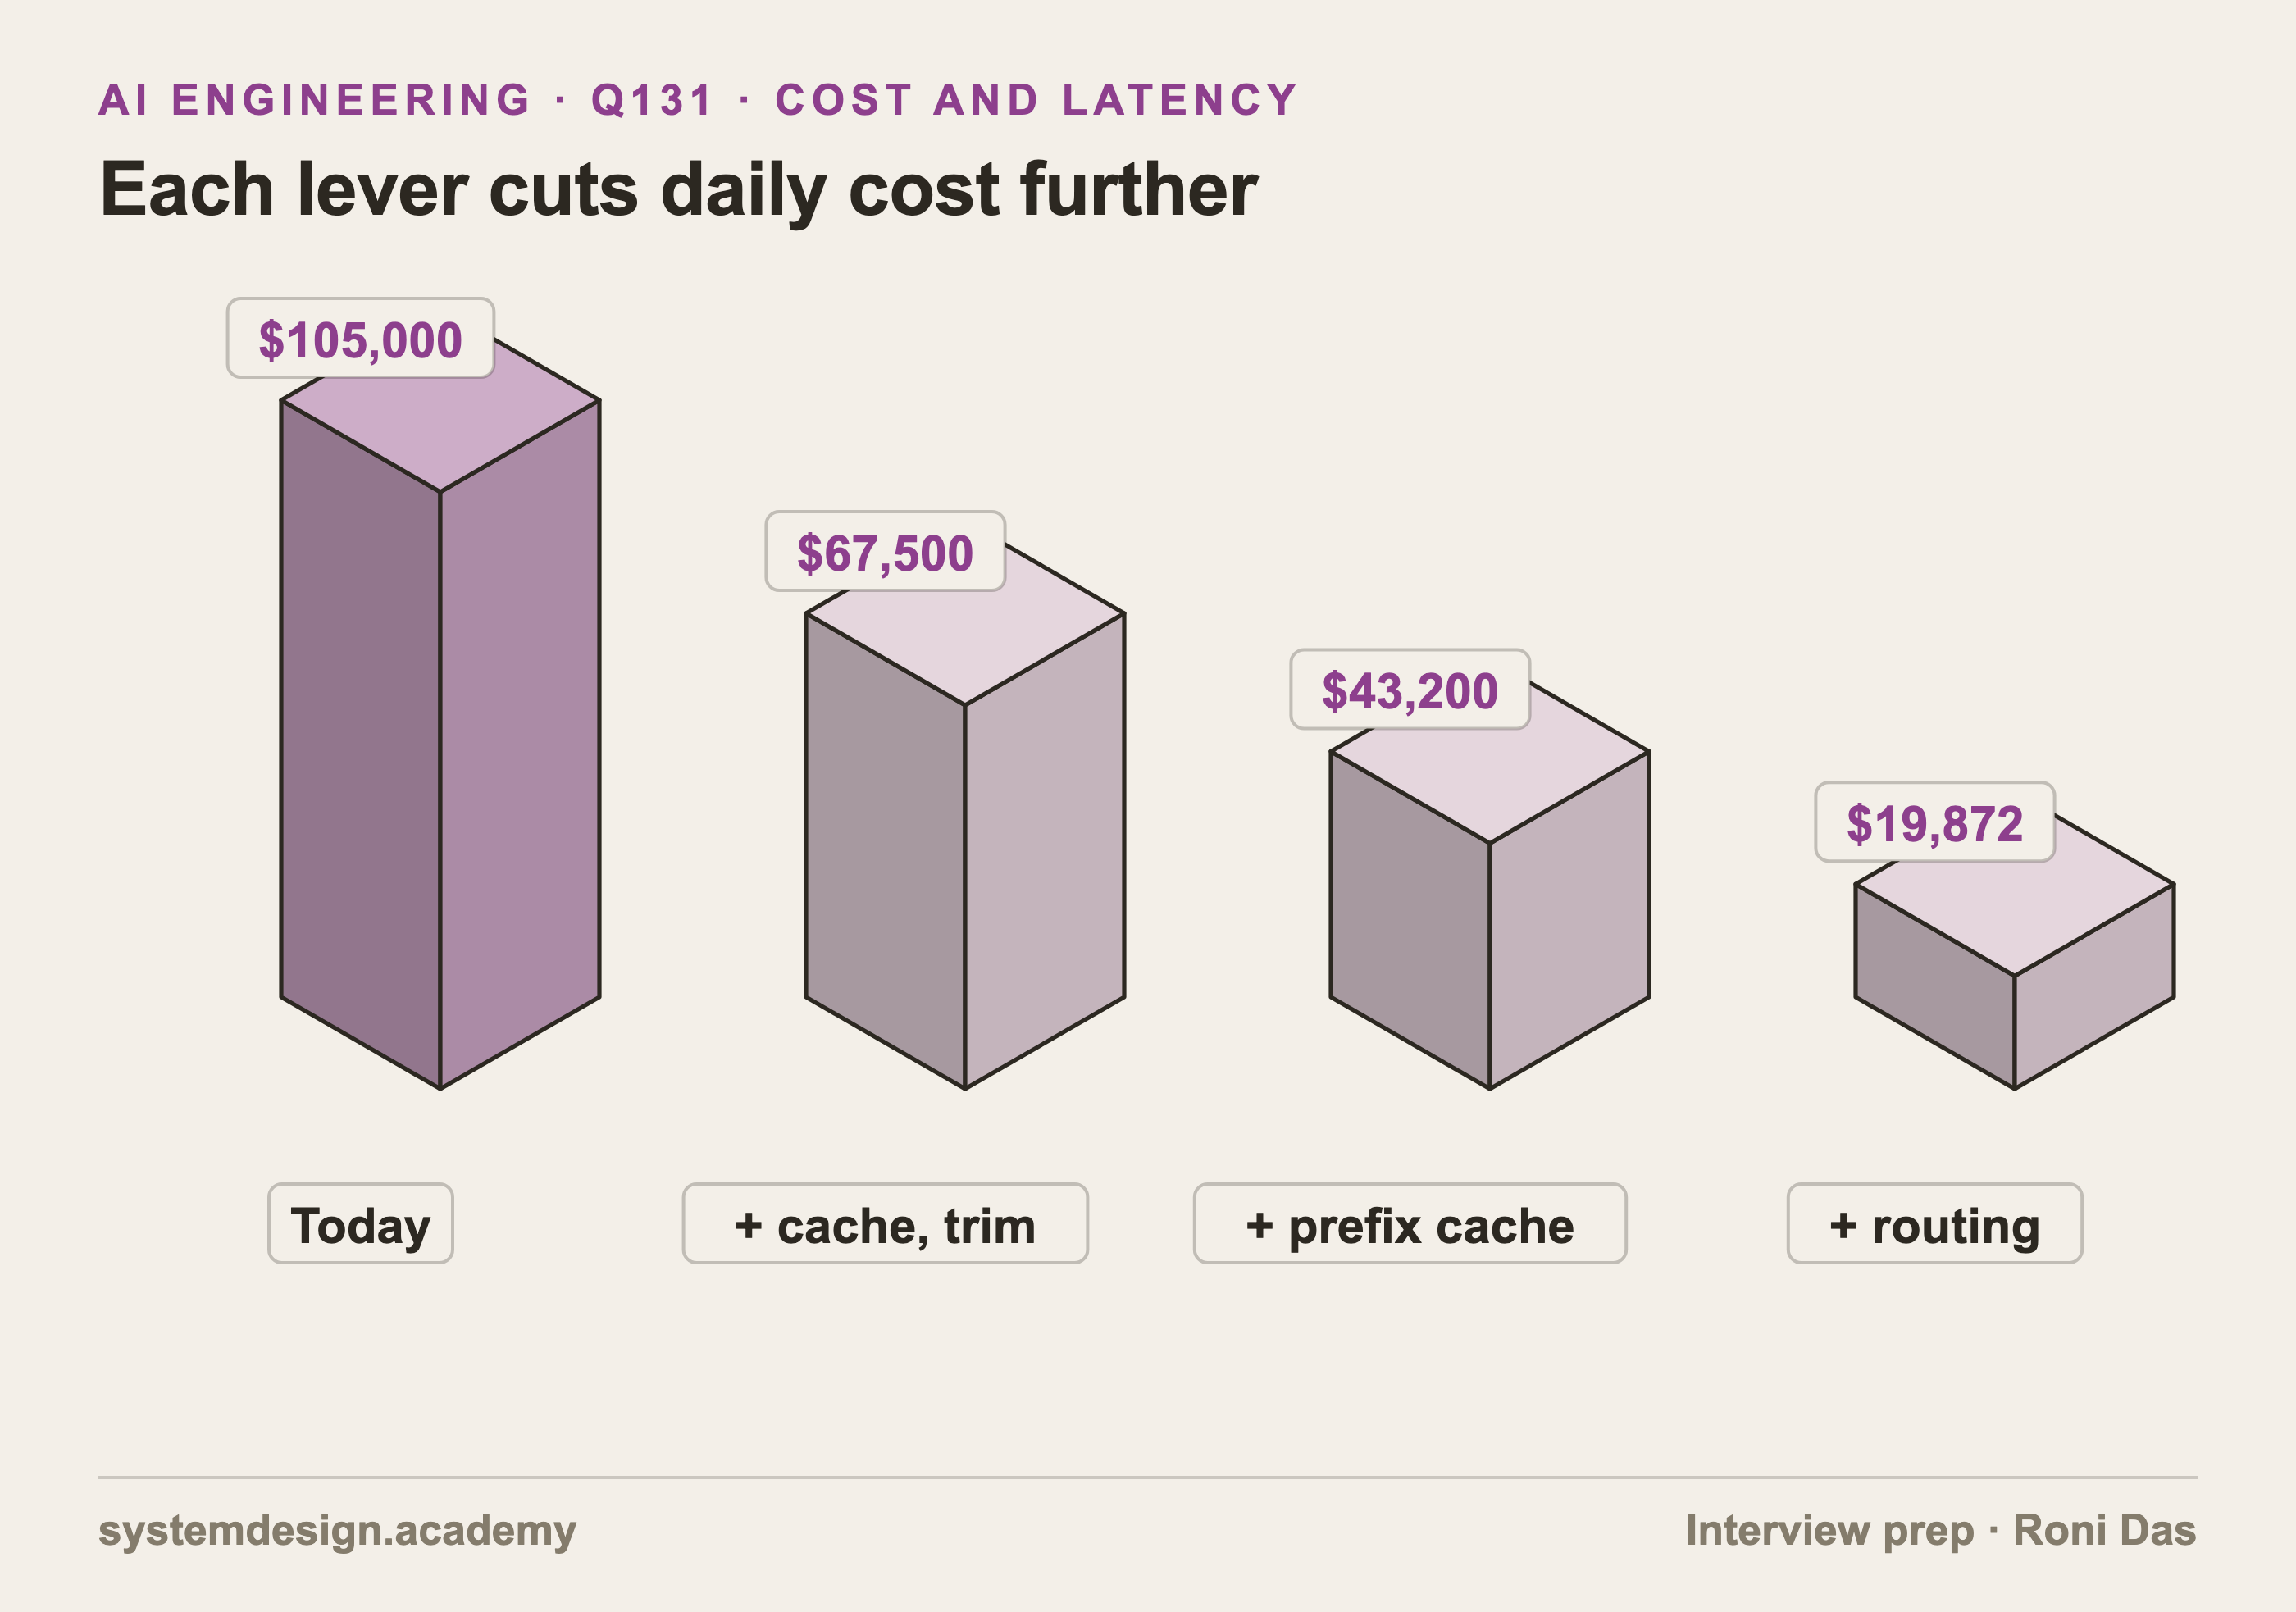
Four isometric bars showing daily cost falling from 105,000 dollars to 67,500 dollars with exact caching and trimming, 43,200 dollars with prefix caching and 19,872 dollars with routing.
Why it is asked: A staff-level cost question: can you find where the money goes, order the levers by risk, and protect quality with evals while you cut?
I would measure where the tokens go, then apply the safest savings steps first, each one gated by the eval set, and only then move traffic to cheaper models.
Assume (hypothetical numbers) 2,000 input and 300 output tokens per request, priced at $3 and $15 per million. That is $60,000 a day for input plus $45,000 for output: $105,000 a day.
1. Exact-match cache. If 10% of requests repeat, serving them from cache saves 10%: $94,500.
2. Trim the prompt and the output. Remove unused instructions and old history (2,000 to 1,400 tokens) and ask for a shorter answer format (300 to 220 tokens): $67,500, a 36% total cut so far.
3. Prefix caching. Put the 1,000 static tokens (system rules, examples) first so the provider can reuse them; if cached tokens cost 10% of normal: $43,200, about 59%. Some providers charge extra to write the cache, so the real saving depends on the hit rate; check it in usage data.
4. Routing. Send easy requests to a model ten times cheaper. If 60% qualify: $19,872, about 81% saved.
If part of the traffic is not interactive, a batch API at about half price is another low-risk step.
The target is 60%, so the plan has margin if routing qualifies fewer requests than hoped. Quality is protected because every step runs the golden set, and routing is rolled out as an A/B test with a quality metric and a guardrail on complaints. I would also report savings from real usage logs, not from this spreadsheet.
What the interviewer listens for
Measure input and output token spend before choosing levers
Order savings steps by risk: caching and trimming before model changes
Show the arithmetic and leave margin above the target
Gate each step with evals and roll routing out as an experiment