The Pilot's Walk Around the Plane
Before a small plane takes off, the pilot walks around it with a list on a clipboard. She looks at the propeller, the fuel, the tyres and the flaps on the wings, one line at a time. She has done this hundreds of times, and she still reads the list.

She does not read the list because she forgets things. She reads it because each line was written after something went wrong once. Reading it takes two minutes; skipping a line can cost the whole flight.
This chapter has built a long list of that kind. Each lesson took one question about running a model for real users, and measured the answer on a rented computer. In this last lesson I put the answers together into one service and race it against a plain service that ignores them. Both run on one computer, under one stream of traffic, with one slow helper behind them.
Where This Lesson Starts
This is lesson 12, the last lesson of the chapter on serving a model. Serving a model means running it as a small program that answers questions while people wait. That program is called a service.
The model is the one from the features chapter. It reads six numbers about one customer of a real online shop, such as how many days have passed since their last order. It gives back a score between 0 and 1: how likely that customer is to buy again in the next 30 days.
Lessons 1 to 11 each changed one thing and measured what happened. None of them changed everything at once. That leaves a fair question, one a real team asks on its first day. If I build the service with every one of these choices, what do I get? And is it better than the simple version?
So the question of this lesson is this: what does a service built with the chapter's measured choices look like? And how does it compare with a plain one, measured in one way, on one machine?
The Words You Need First
Please read this slide slowly if a word is new. Each word comes with an everyday picture.
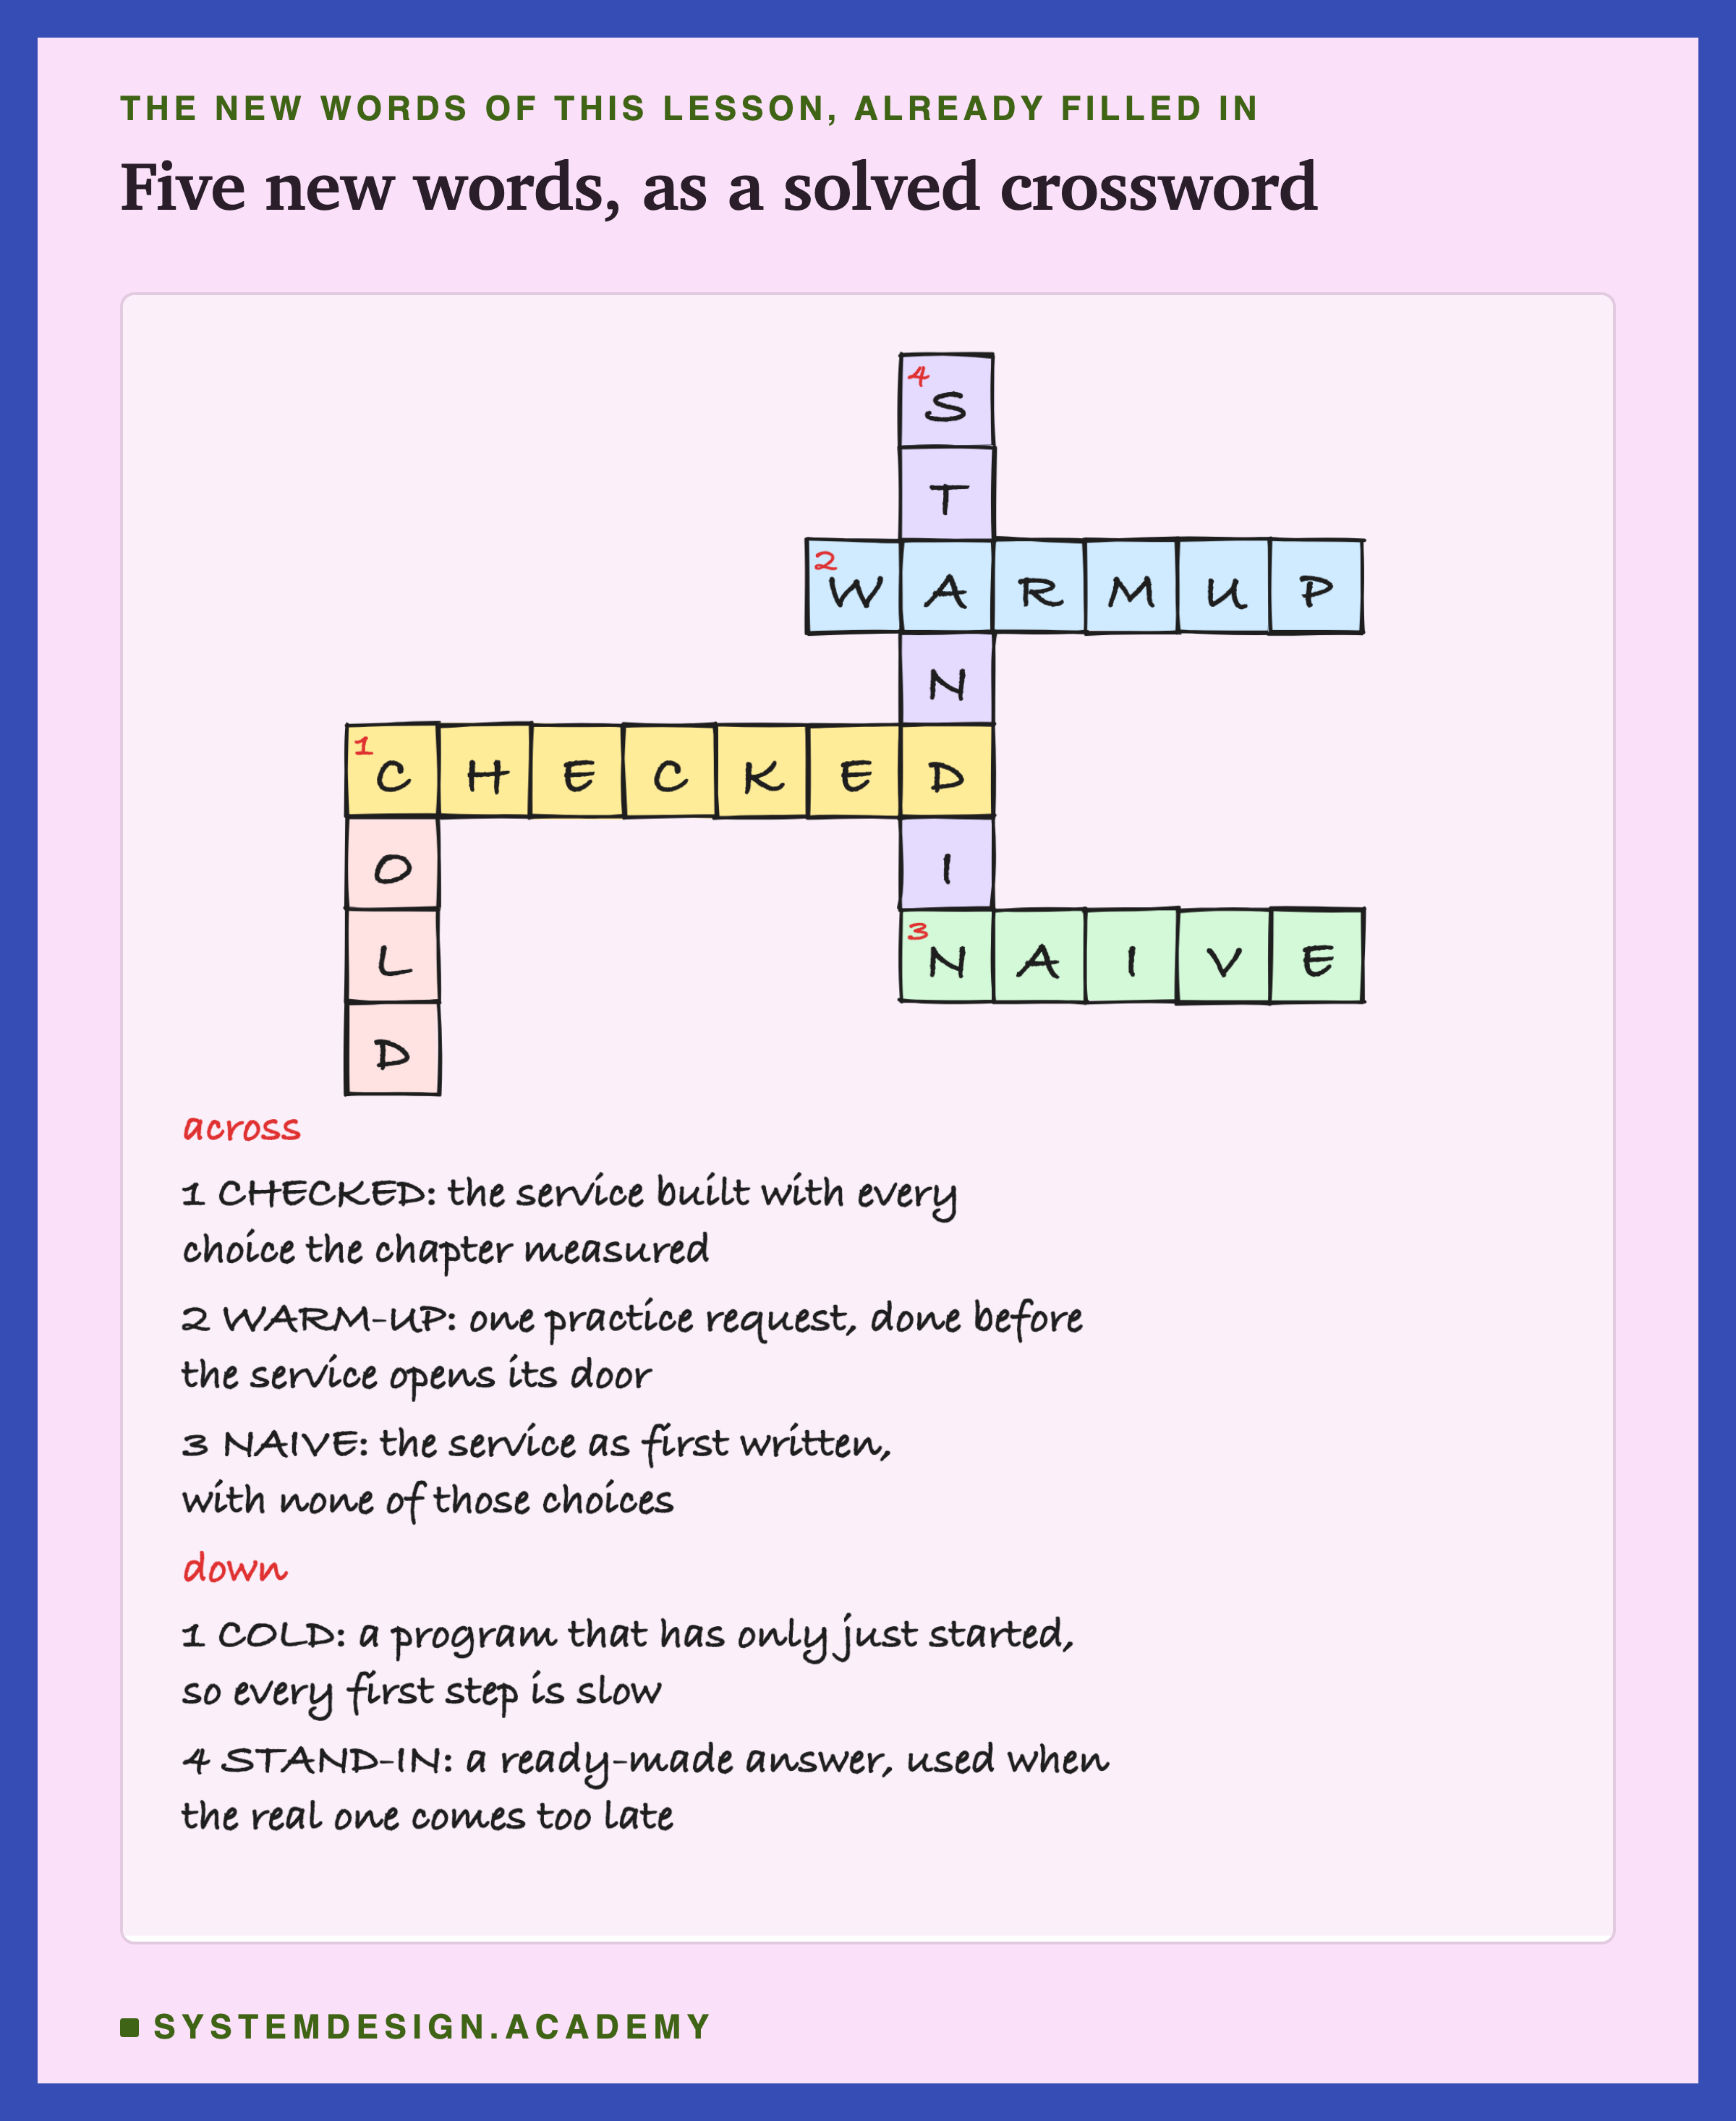
I call the service as it was first written in lesson 2 the naive service. Naive does not mean stupid. It is the version most people write first, because it works on a laptop. I call the same program with the chapter's useful choices added the checked service.
A worker is one copy of the service program. A busy shop can run several copies side by side, like several cashiers. A thread is one line of work inside a program. With one thread, the model does its sums one after another, like one cook in a kitchen. Both services here ran one worker with one thread.
A program is cold when it has only just started. Its first steps are slow, because Python is still loading its tools. A warm-up is one practice request the service sends to itself before it lets real users in. Then the first real user does not pay for those slow first steps.
A live score is one the model works out now, for this request. A stand-in is a ready-made answer the service gives when the live one would come too late. Here it is the customer's score from one month earlier, as in lesson 9. It is like a waiter who brings the soup of the day when the kitchen is too slow for what you ordered.
A model call is one time the program asks the model for scores. A batch is several rows of numbers sent in one call.
The time a request waits for its answer is called its . Waiting times are in milliseconds (ms): a millisecond is a thousandth of a second, so 25 ms is about a quarter of a blink. Users notice the slowest answers most, so I line up every request's wait from shortest to longest. The p99 is the time that 99 of every 100 requests beat. I will mostly call it "the slowest 1 in 100". The max is the single slowest answer of all.
My target is lesson 11's: the slowest 1 in 100 answers within 25 ms. I add one more condition, explained on the next slides: at least 95 of every 100 answers must be live scores.
The Headline: What Was Built In, and What Was Measured
Here is the main result first, as two departure boards at an airport. Each row is one rate, the number of requests sent each second. A row is on time if the slowest 1 in 100 came within 25 ms and at least 95 in 100 answers were live.
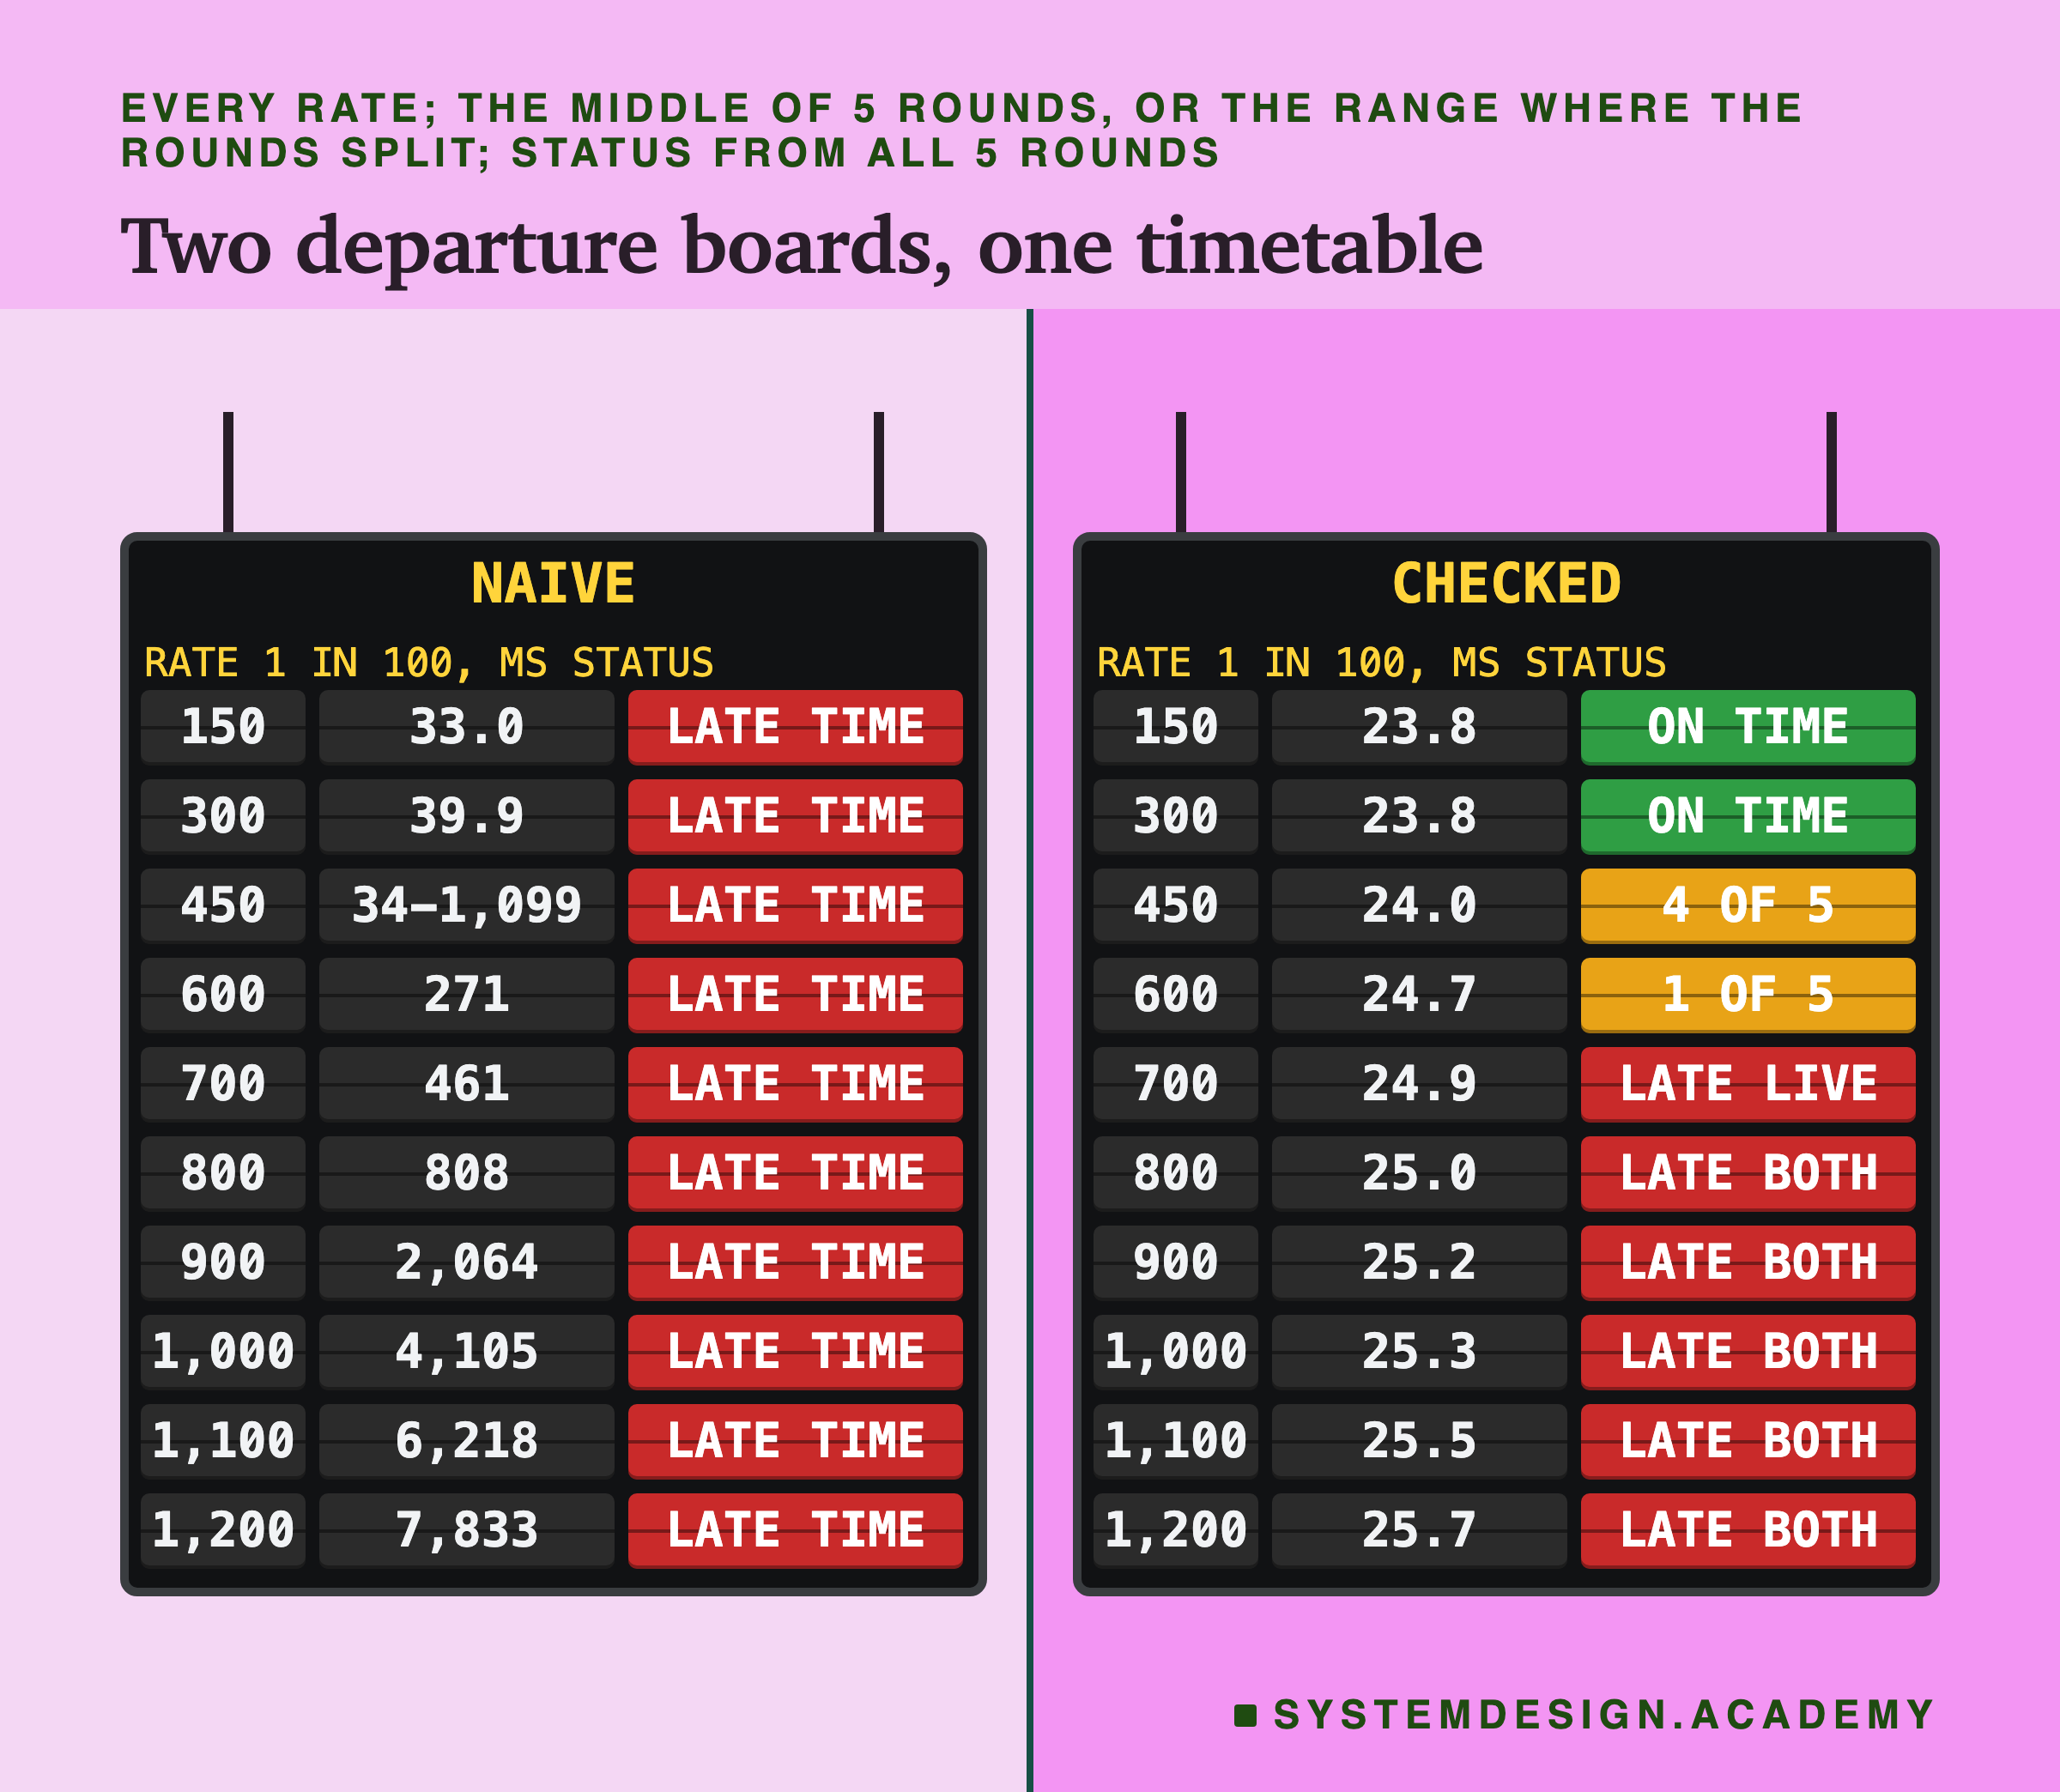
The naive service was never on time, and that was built into the test. With this helper, about 1.6 lookups in 100 take longer than 25 ms by themselves: about 1 that hangs, and about 0.6 that are only slow. On the naive service's own clock, 1.2% to 1.9% of lookups took over 23 ms even at the gentlest rate, 150 a second, in every round. A service that waits for every lookup cannot keep its slowest 1 in 100 under 25 ms with a helper like this. So its failure is not a discovery. It is what the helper was made to do.
The checked service met the target up to 450 requests a second in the middle round. Its highest passing rate was 450, 600, 300, 450 and 450 a second in the five rounds, which is about $0.0224 per million answers at lesson 11's price. Its time limit makes its fast answers partly built in too: it stops waiting at 23 ms, so its slowest answers had to sit near 25 ms.
What set the checked service's limit was the helper, not the processor. The helper can work on 16 lookups at once, and above about 600 a second it filled up. More and more answers became stand-ins: 11.1% at 600 a second and 90.2% at 1,200, in the middle rounds. From 800 a second the slowest 1 in 100 also crept just past 25 ms, so those runs failed on both counts.
The checks cost almost nothing. Memory and processor use were nearly equal at 450 a second, and both services gave their first answer about 1.7 seconds after starting, too close to call.
Every live score matched, to the last digit. On 228,096 rows that both services answered with a live score, not one score differed.
Where Each Difference Lives
A request walks through five stops. It leaves the tester, reaches the service, waits for a lookup of the customer's six numbers, gets scored by the model, and its answer travels back. The tester is the program that plays the users: it sends requests and times every answer.
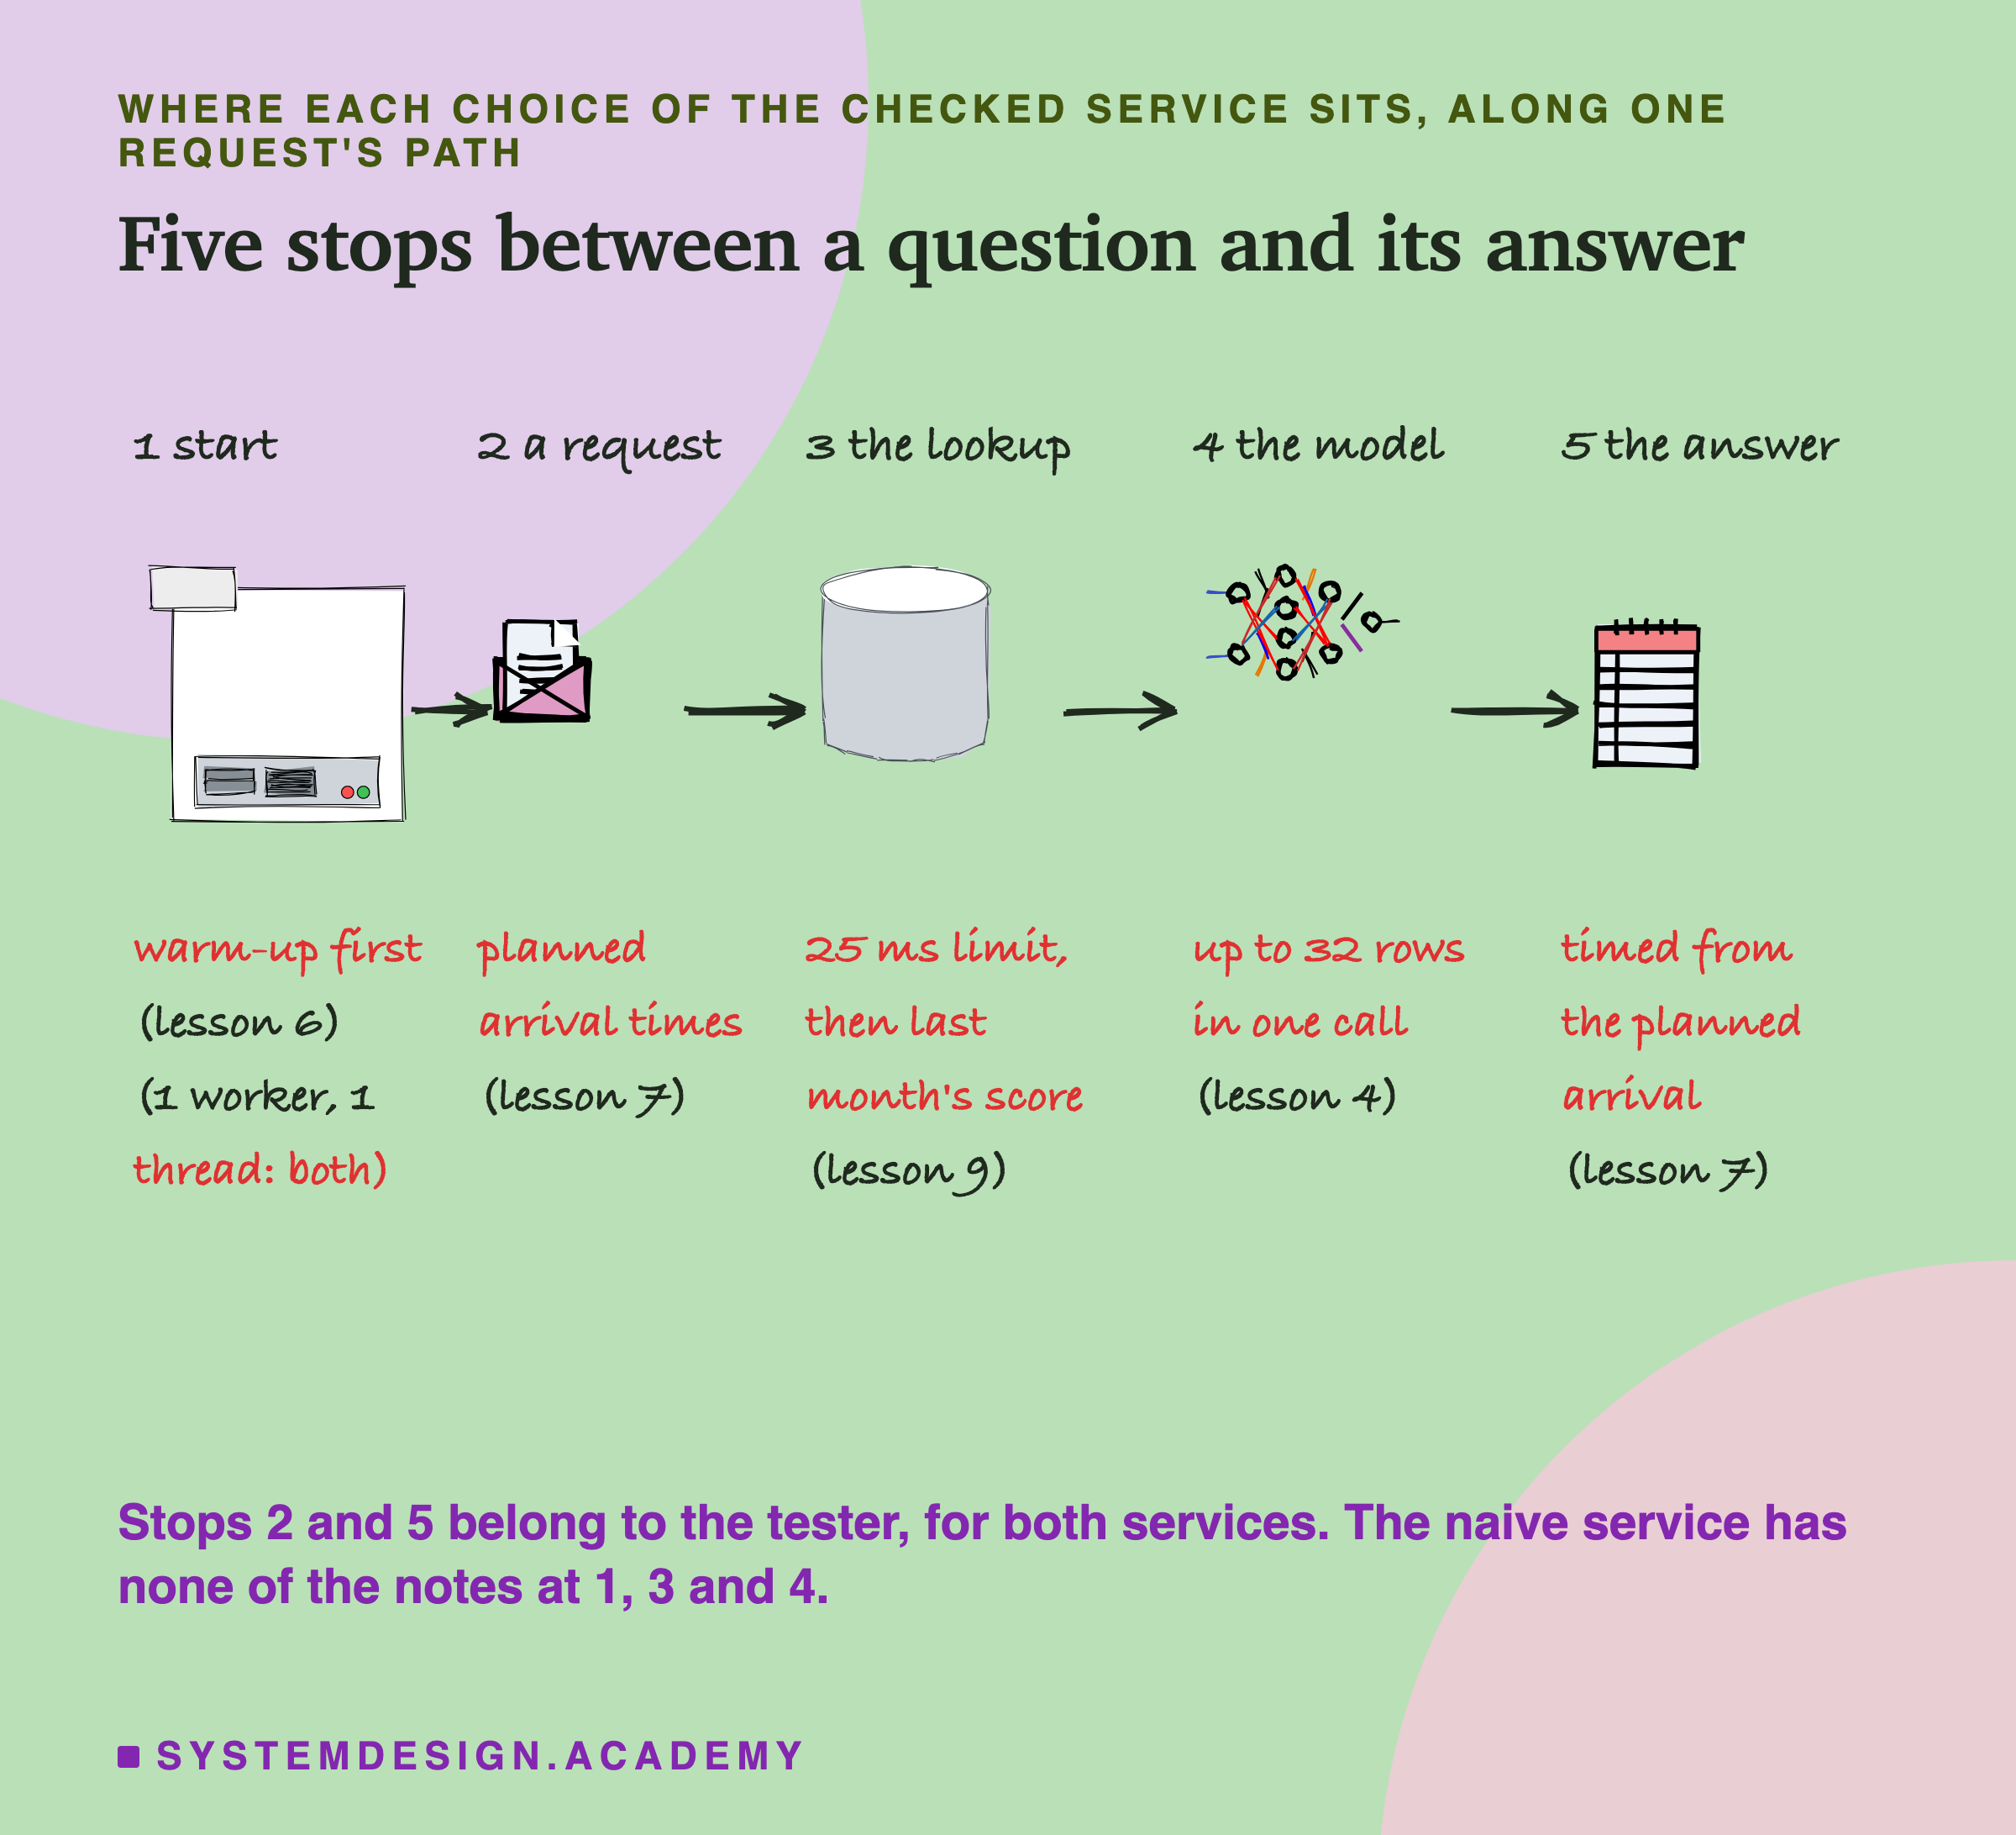
Stops 2 and 5 belong to the tester, and they work alike for both services. The tester plans every request's arrival time before the run starts, at random, like customers walking into a shop. It sends each request at its planned time, even if earlier answers are late, and it times each answer from the planned moment. Lesson 7 showed why: a tester that waits politely for each answer before sending the next one hides the slow moments.
On the box, the two services differed at three stops only. At the start, the checked service warms up. At the lookup, it gives up after its time limit and answers a stand-in. At the model, it scores every waiting row in one call. One worker and one thread were true of both services, on this box.
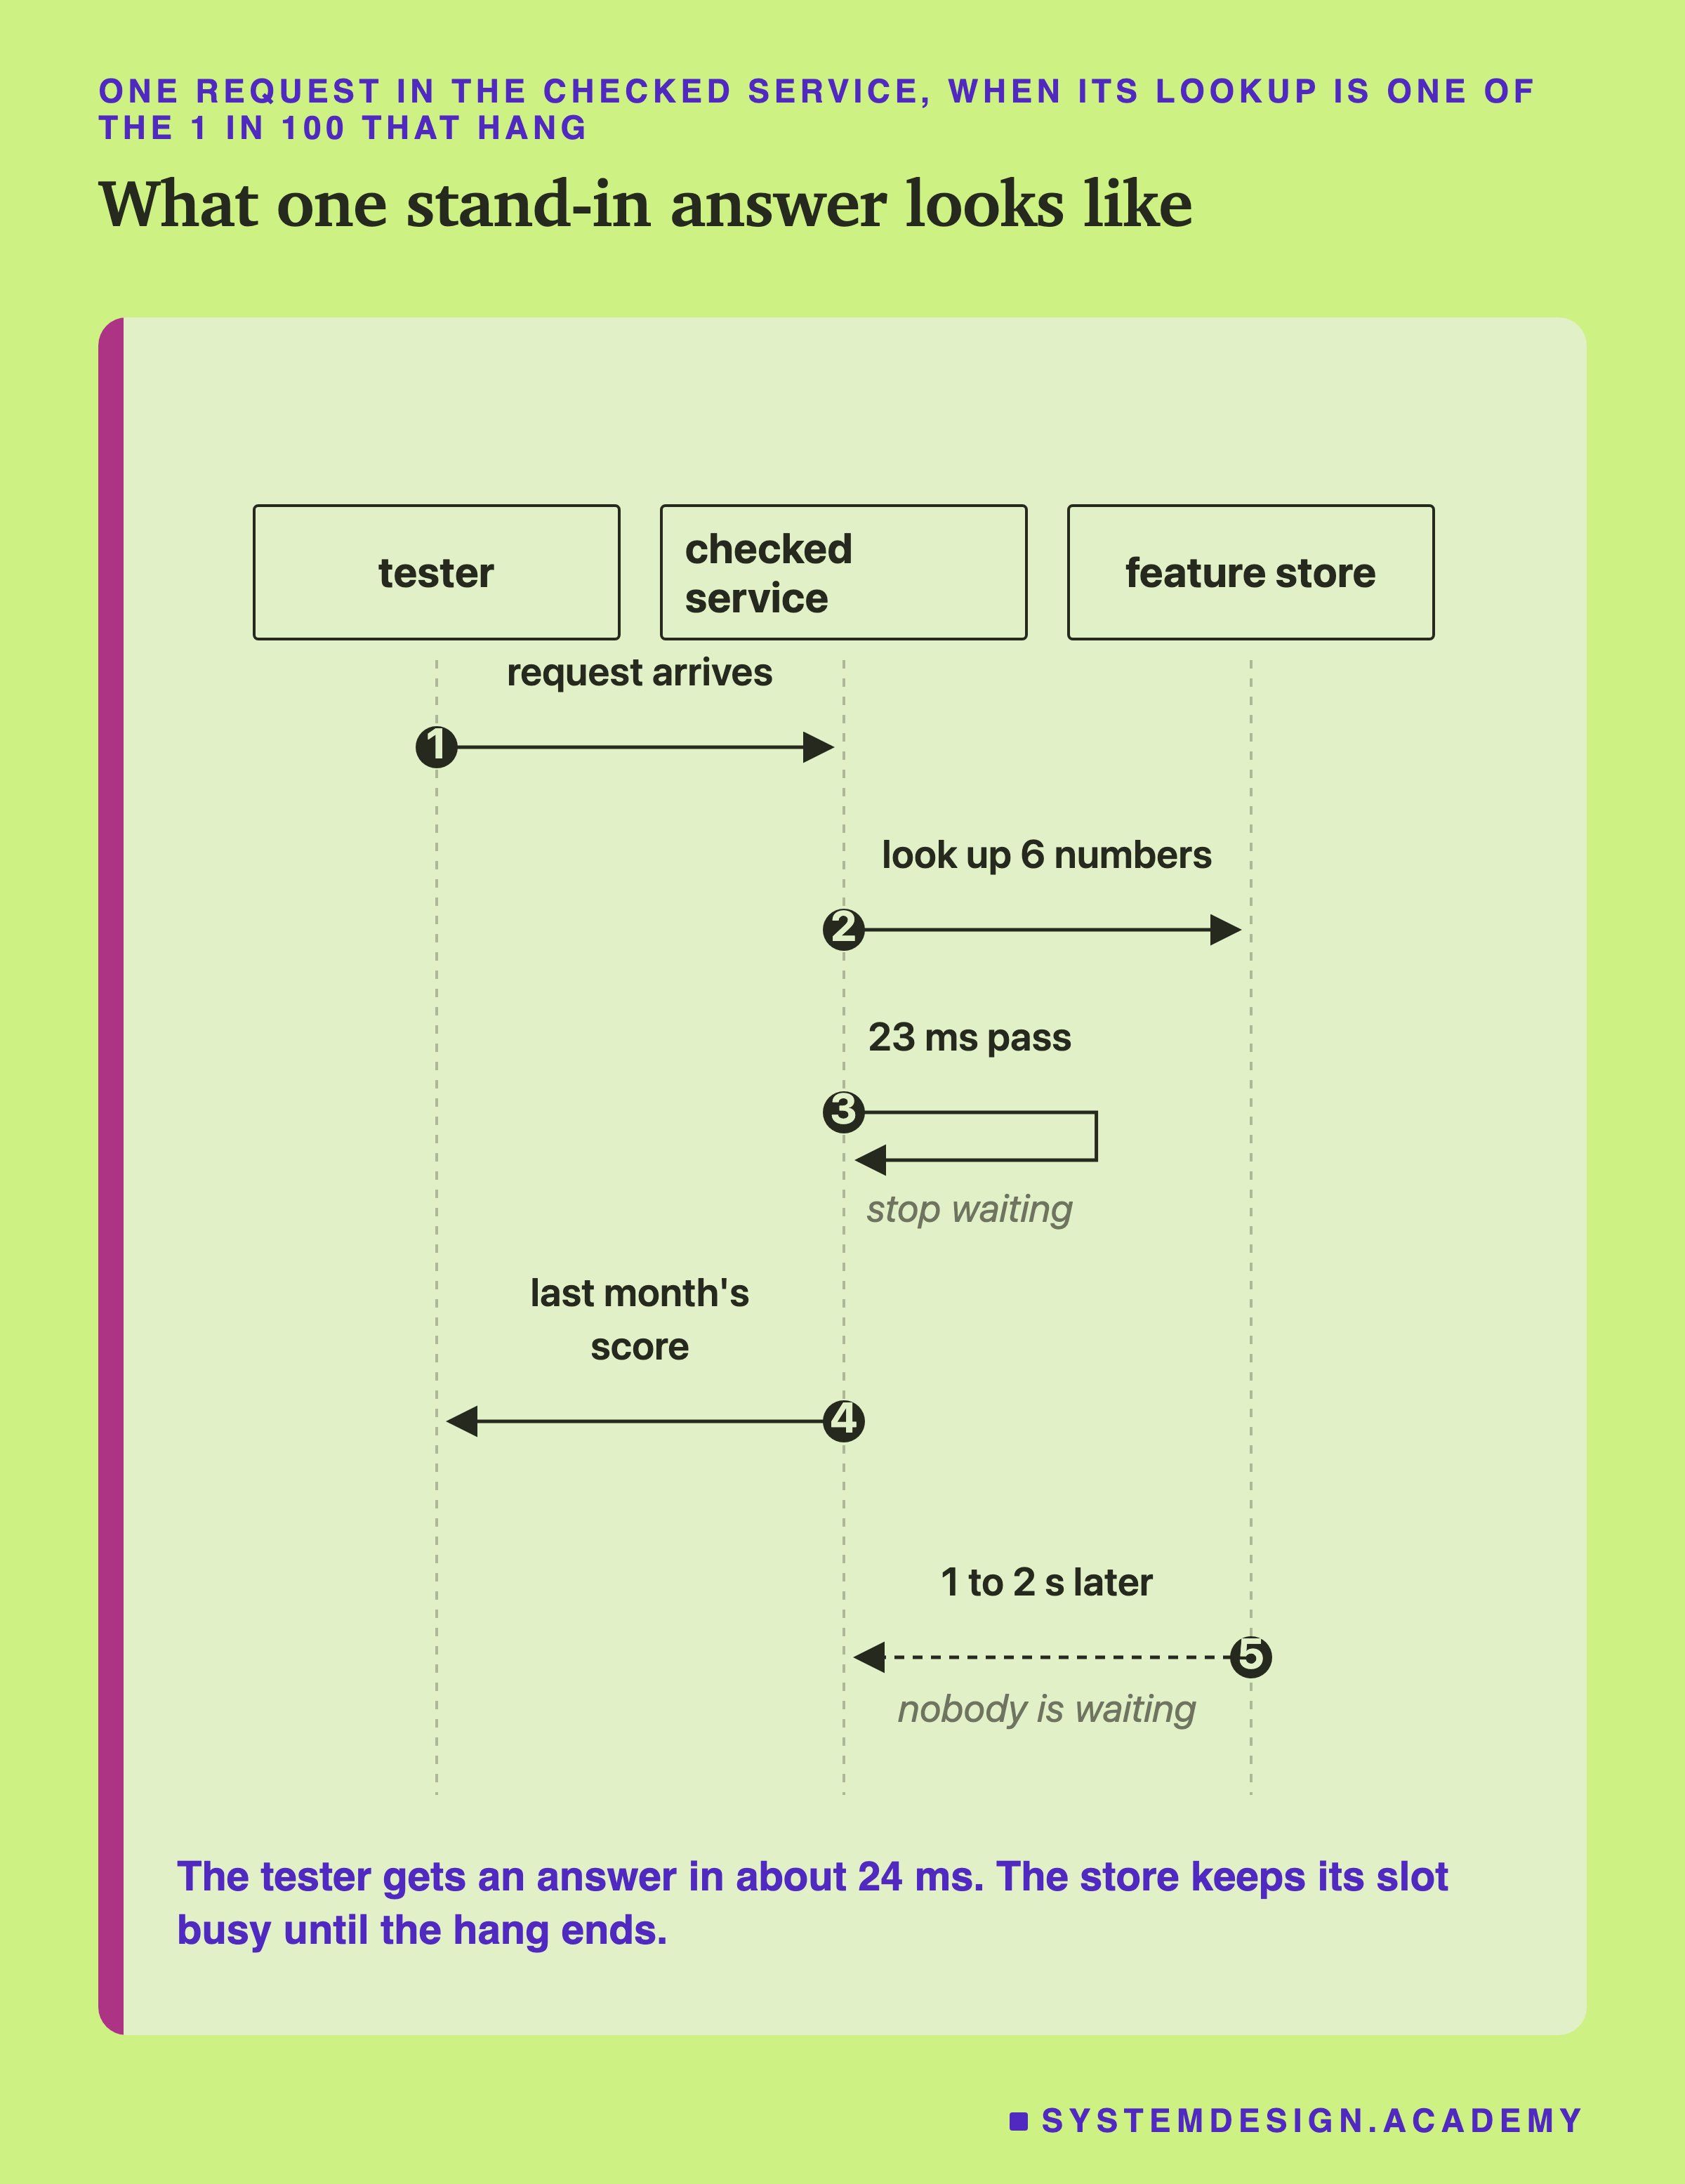
This little sequence shows one stand-in answer from start to finish. The lookup is one of the 1 in 100 that hang. After 23 ms the checked service stops waiting and sends last month's score, so the tester has an answer in about 24 ms. The helper does not know that nobody is waiting. It keeps working on the lookup for 1 to 2 seconds and only then frees its slot.
How the Lab Was Built
Before any run, I wrote the lab's plan at the top of its program file, scripts/labs/serving/serving_checklist.py. That note at the top of a Python file is called a docstring. It names every setting, the lesson each one comes from, and the rule for "clearly different". It also lists twelve guesses, written down first so they could be checked later, and so they could be wrong.
Everything ran on one rented c7g.medium from Amazon Web Services (AWS), the kind of machine lessons 2 to 11 used. It has one core: one worker inside the chip that runs one step of a program at a time. The tester, the service and the slow helper all shared that one core, as in every lesson of this chapter.
The slow helper is lesson 9's pretend : a separate small program that holds the customers' numbers. It can work on 16 lookups at once, like a kitchen with 16 cooks. Most lookups take about 2 ms. But 1 lookup in 100 hangs: it freezes for a time between 1 and 2 seconds, like a cook who disappears into the back room. Lesson 9 chose the 16 slots so that the store would be busy at 300 requests a second and near its limit at 450.
Each service is one arm of the test, like one recipe in a cooking contest. The naive arm is lesson 2's service as first written. It needed one change so that it could talk to the slow store: it asks the store over the network, instead of reading a small database inside itself.
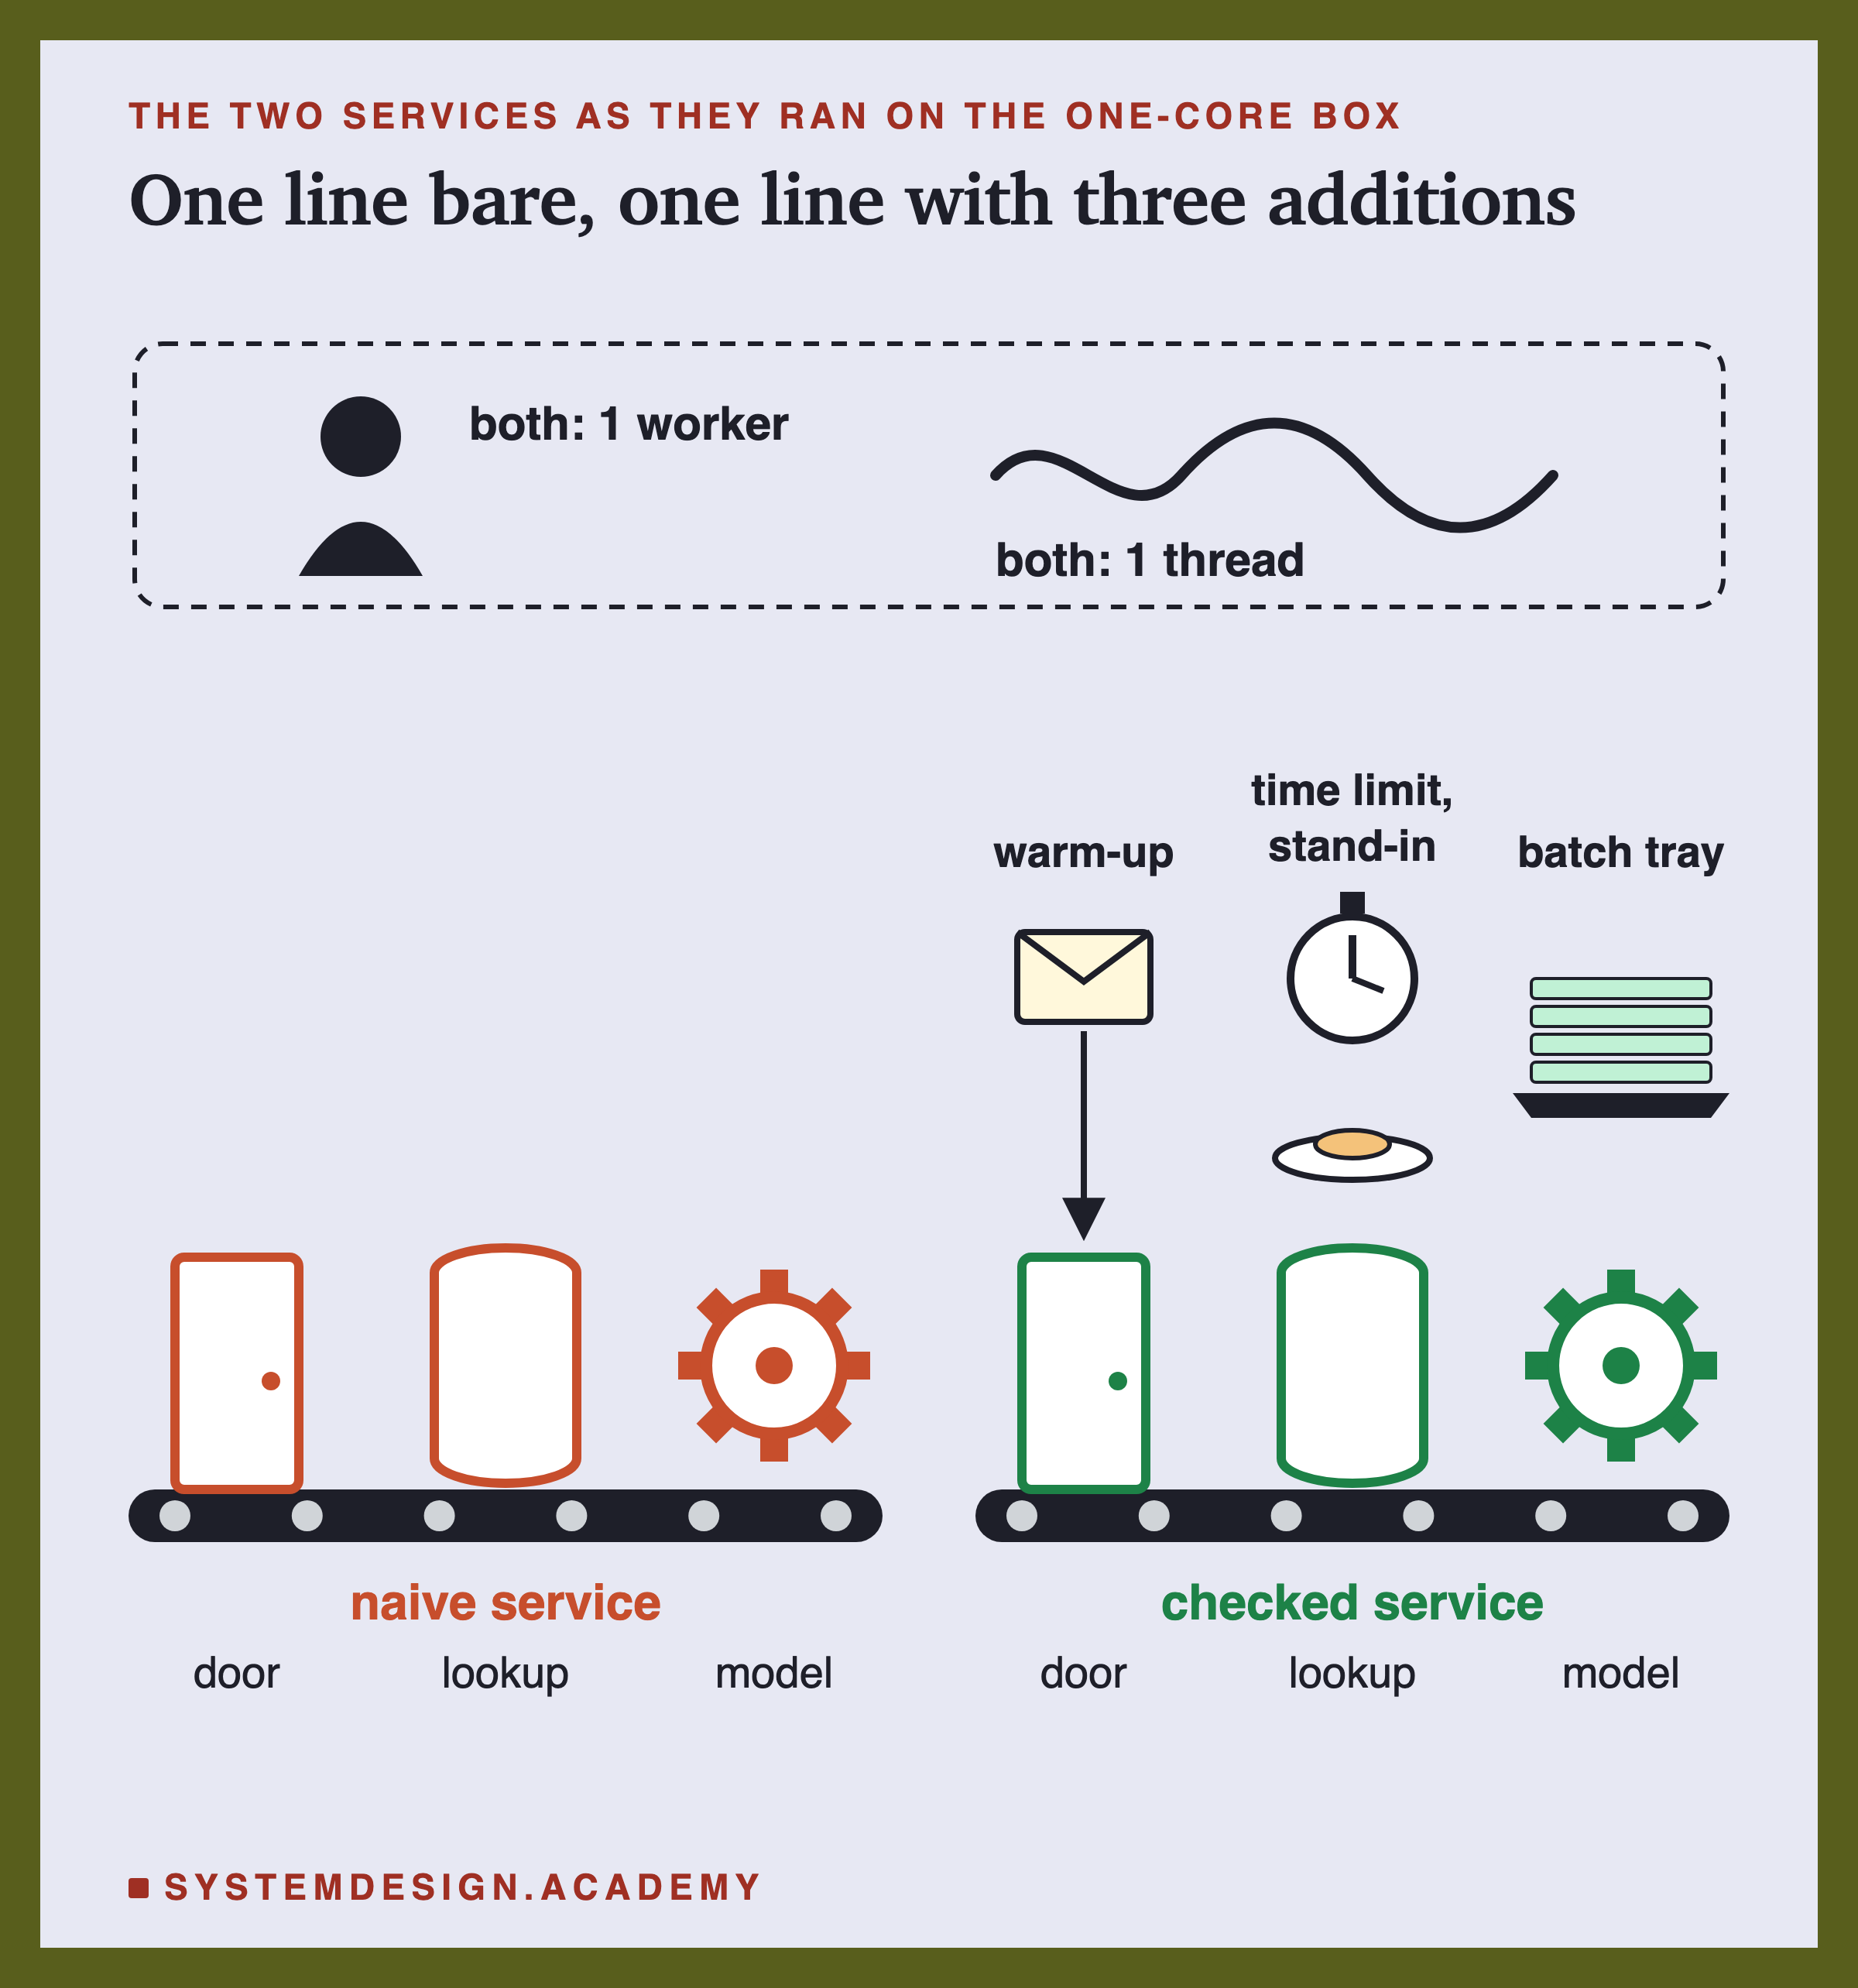
The two shared parts sit once, across both lines: one worker and one thread were true of both services on this box. The naive line has nothing else. The checked line carries three extra objects. A practice request drops in at the door: that is the warm-up. A stopwatch with a stand-in plate sits at the lookup: that is the time limit. A tray of rows waits at the model: that is the batcher.
The Traffic, the Rounds and the Rule
Every run began cold. The tester itself started the service as a fresh program and wrote down that moment. Then it knocked on the service's door, the port, every thousandth of a second until the door opened. Next it opened 512 connections, which are like 512 phone lines kept open to the service, and started the traffic 2 ms later. The tester sent no warm-up of its own, so the first requests met the service as it woke up. A run's first answer time runs from the moment the program started to the moment its first answer came back.
Each run sent requests for 15 seconds at one rate: 150, 300, 450, 600, 700, 800, 900, 1,000, 1,100 or 1,200 a second. Both arms ran every rate.
The runs were paired. In each round, both arms at one rate got identical planned arrival times. They got the customers in one order, and the store gave them identical slow lookups. It is like two runners on one track in one wind. So when the two arms differ, the difference comes from the service, not from luck in the traffic.
A round is one pass through all 20 runs (2 arms times 10 rates). Each round used a new random order, so the time of day could not favour one arm. I ran 5 rounds: 100 counted runs.
A run passes if three things hold. The slowest 1 in 100 took at most 25 ms. Every request got an answer. And at least 95 of every 100 answers were live scores. I added that last condition before the runs, for a simple reason: a stand-in comes back quickly by design. Without the condition, a service that answered everyone with a stand-in would pass while telling nobody anything new.
In each round, an arm's max rate is the highest rate that passed while every lower rate also passed, as in lesson 11.
For two arms, I call a difference clearly different only if one arm beat the other in all 5 rounds. Even its worst round must also beat the other's best. Otherwise it is too close to call.
The Machine, and Proof It Was Quiet
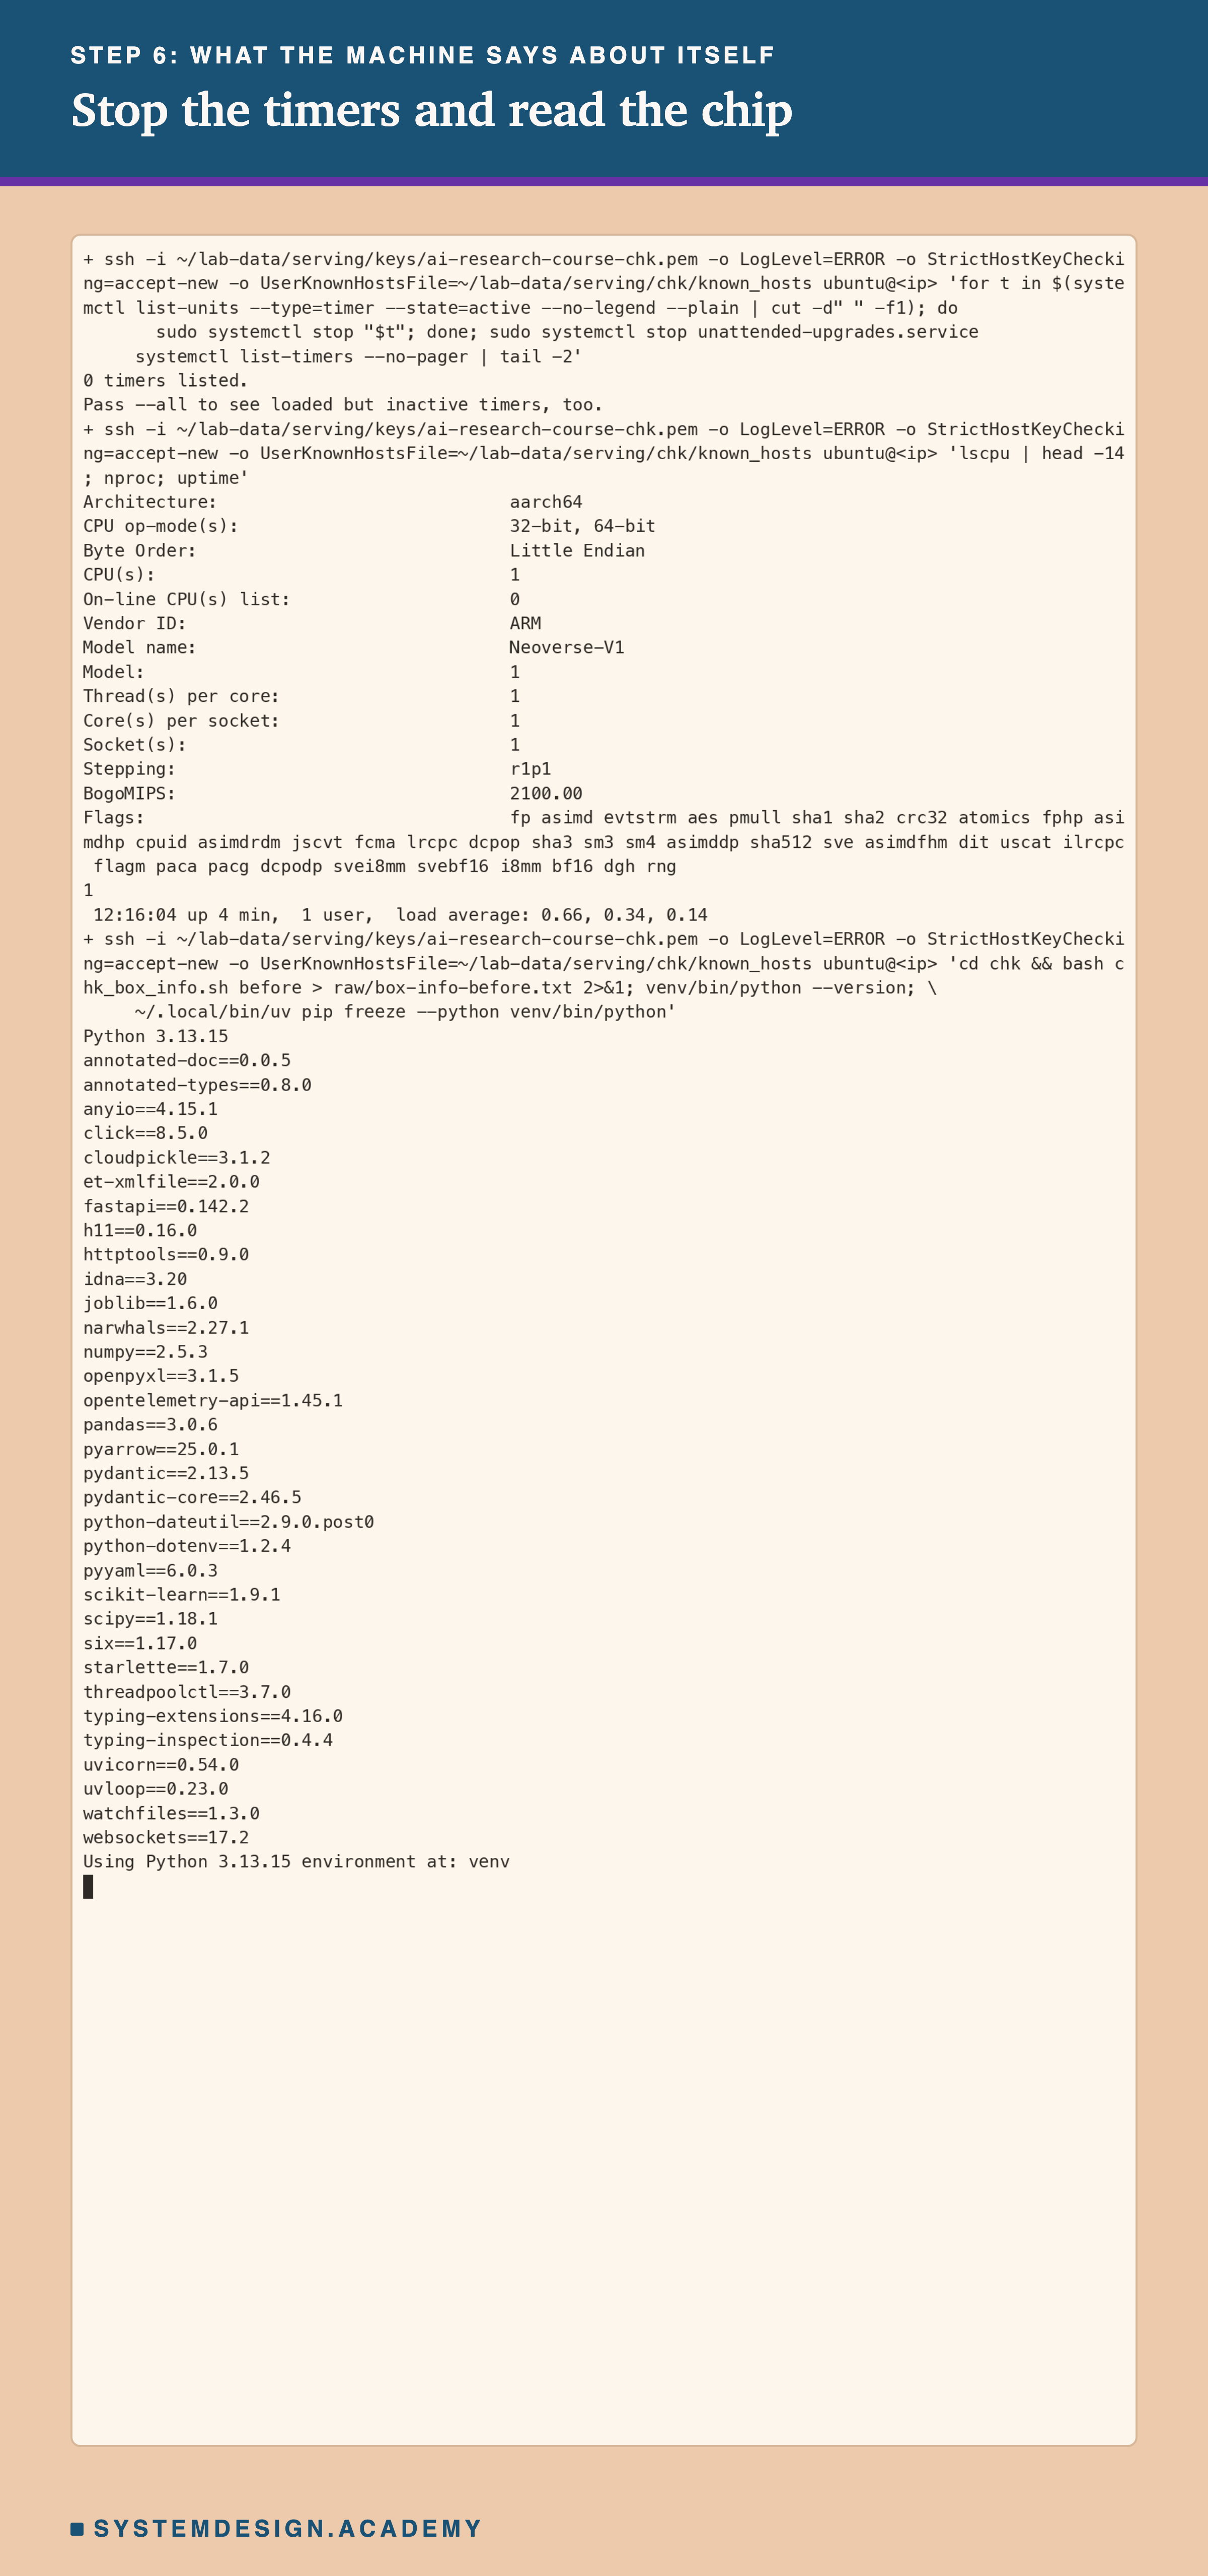
The lab ran on one c7g.medium in AWS's us-east-1 region. It has one core on a Graviton3, a chip AWS designs itself, and 2 GiB of memory, about 2.1 billion bytes. Its own report of the chip, from the command lscpu, said Neoverse-V1: the name of the design Arm made, which Graviton3 is built from. Python was 3.13.15, with the library versions of lessons 2 to 11.
Before every timed run, the core had to sit at least 95% idle for two seconds. All 100 counted runs met that, and the lowest reading was 99.01% idle. Steal, the time the bigger real computer underneath lends to other customers' rented machines, was 0.00% in every run. Nobody was logged in during any counted run. Before and after each run, the list of installed packages was turned into a short code. This fingerprint changes if anything in the list changes, like a seal on a jar. All 200 fingerprints matched.
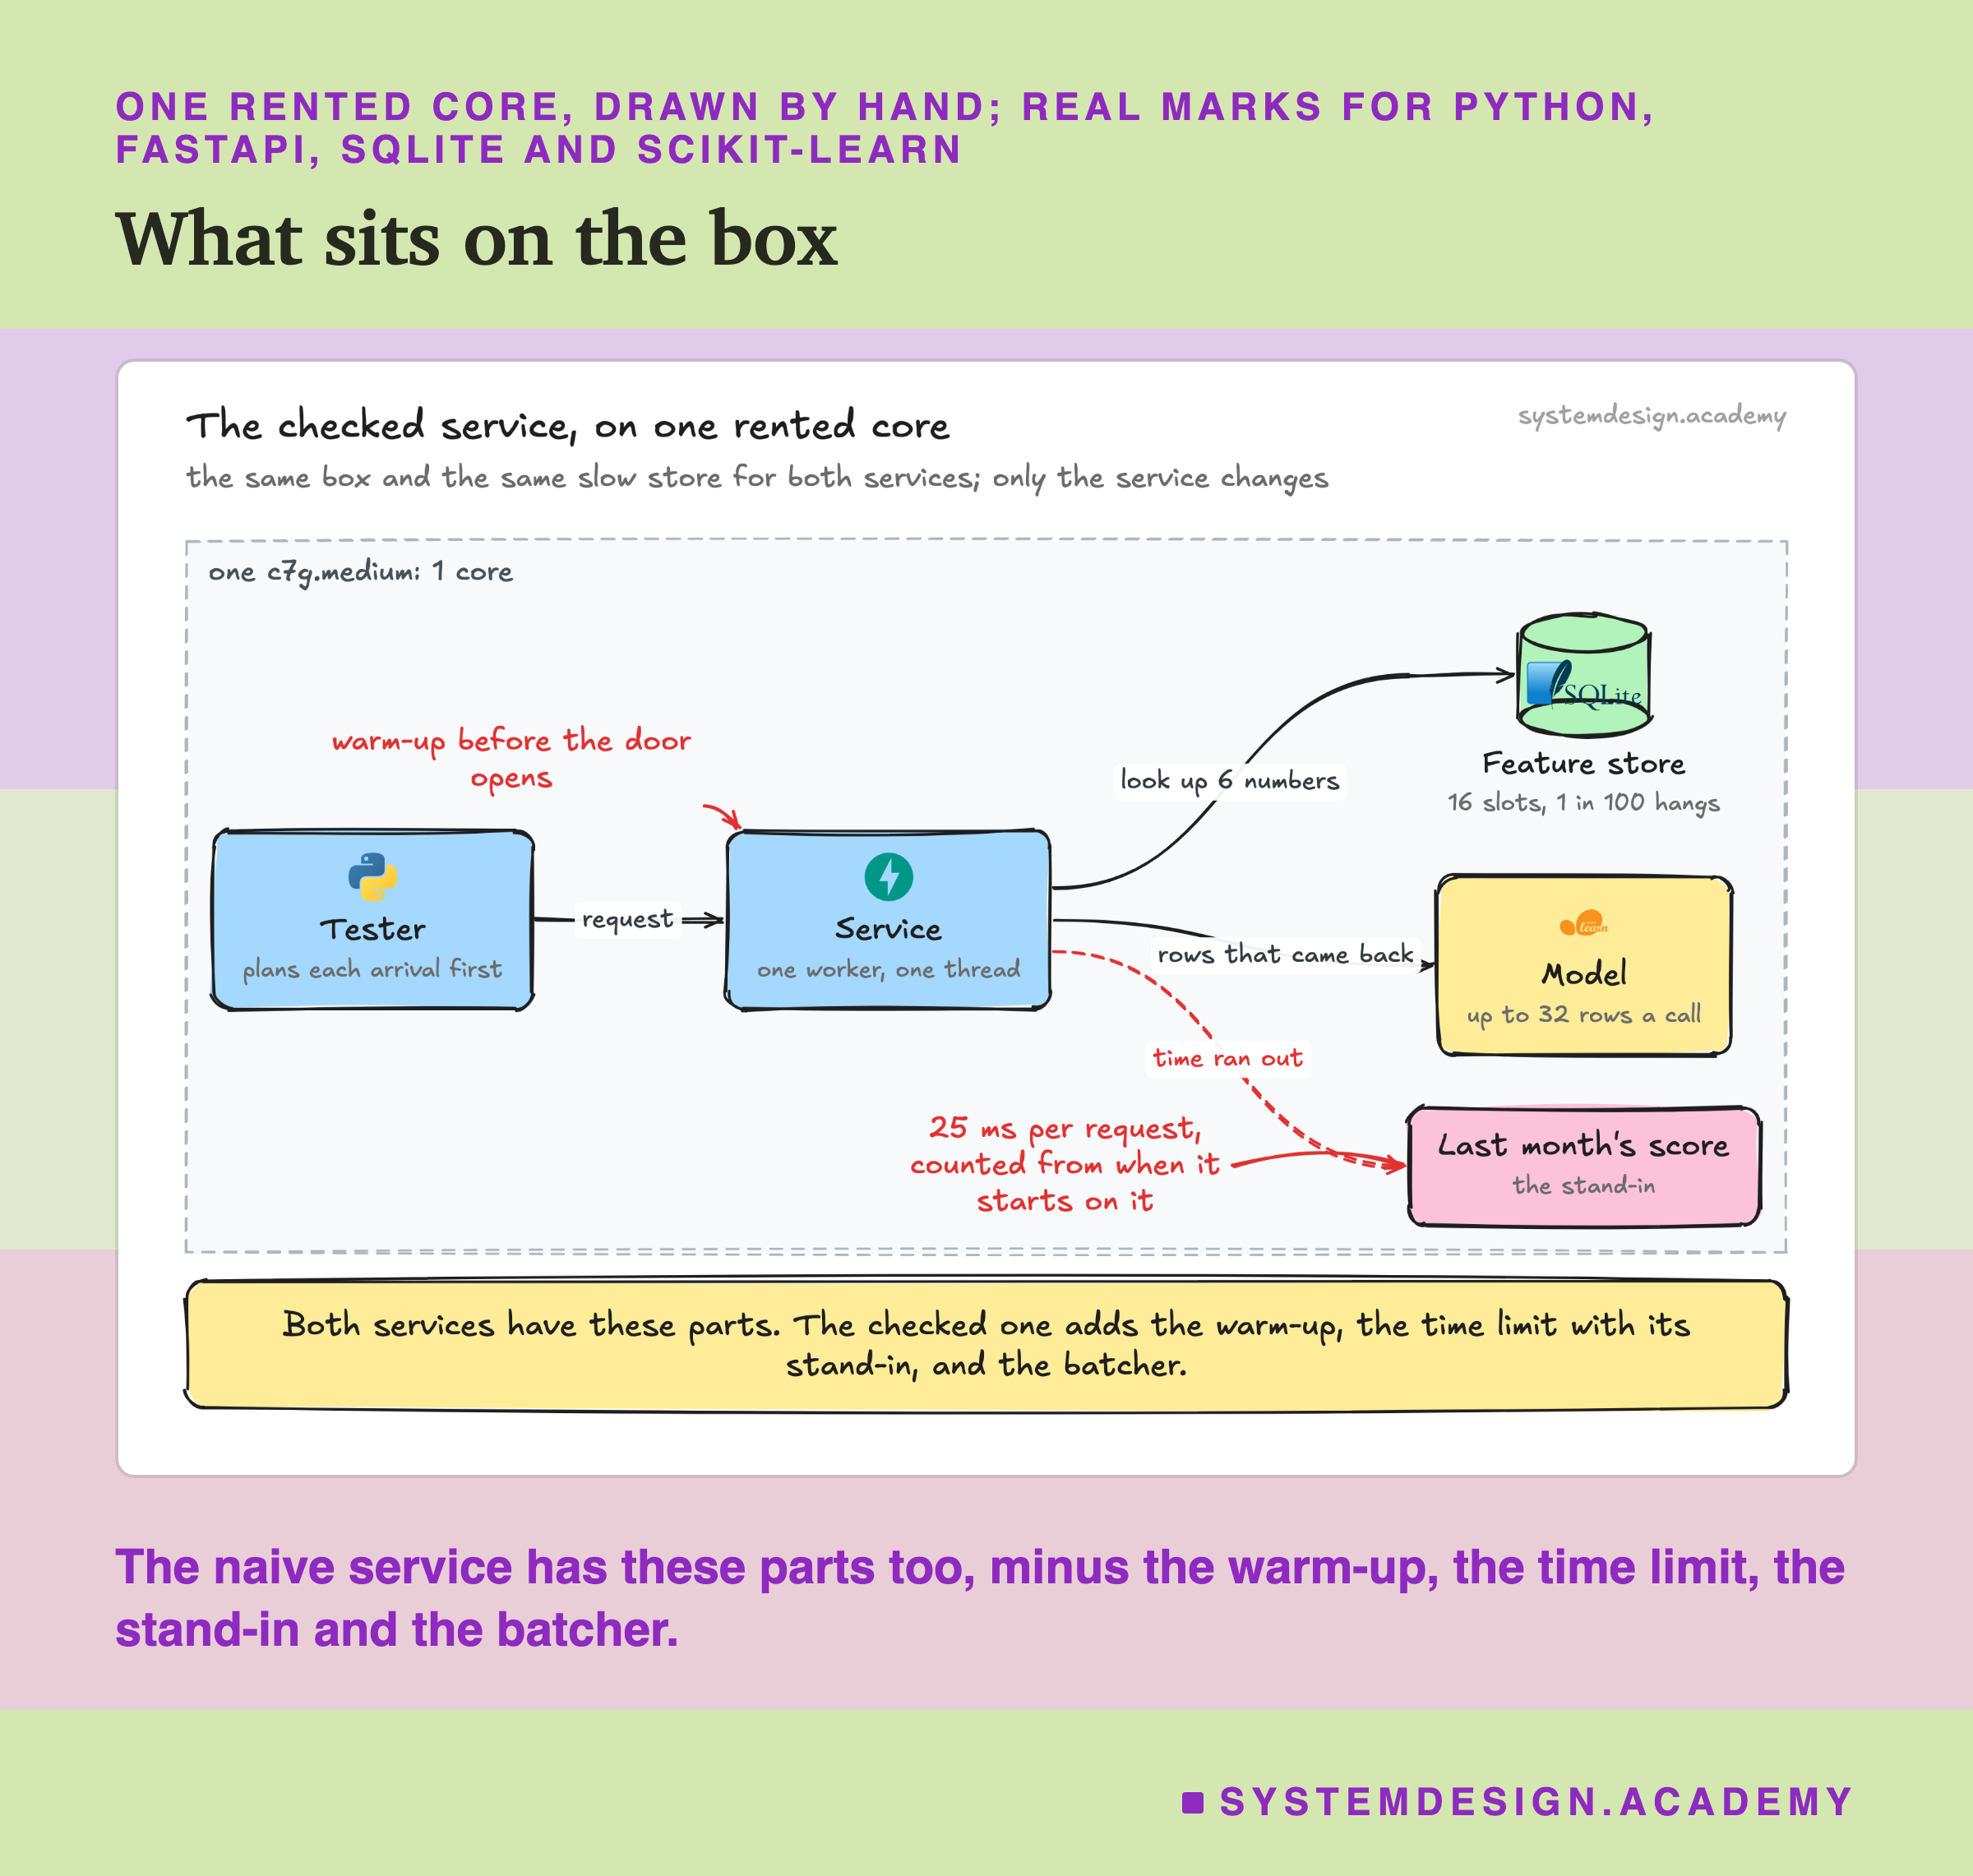
This hand-drawn sketch shows what sat on the box. The tester plays the users. The service asks the store for six numbers. If they come back in time, the model scores them, up to 32 rows in one call. If time runs out, the answer is last month's score. All of it shares one core, so a busy tester or a busy store slows the service down too.
One Box's Life on One Line
The whole life of the rented machine fits on one time line. The top bar is drawn to scale; the flags below show every step in order, each with its real start time.
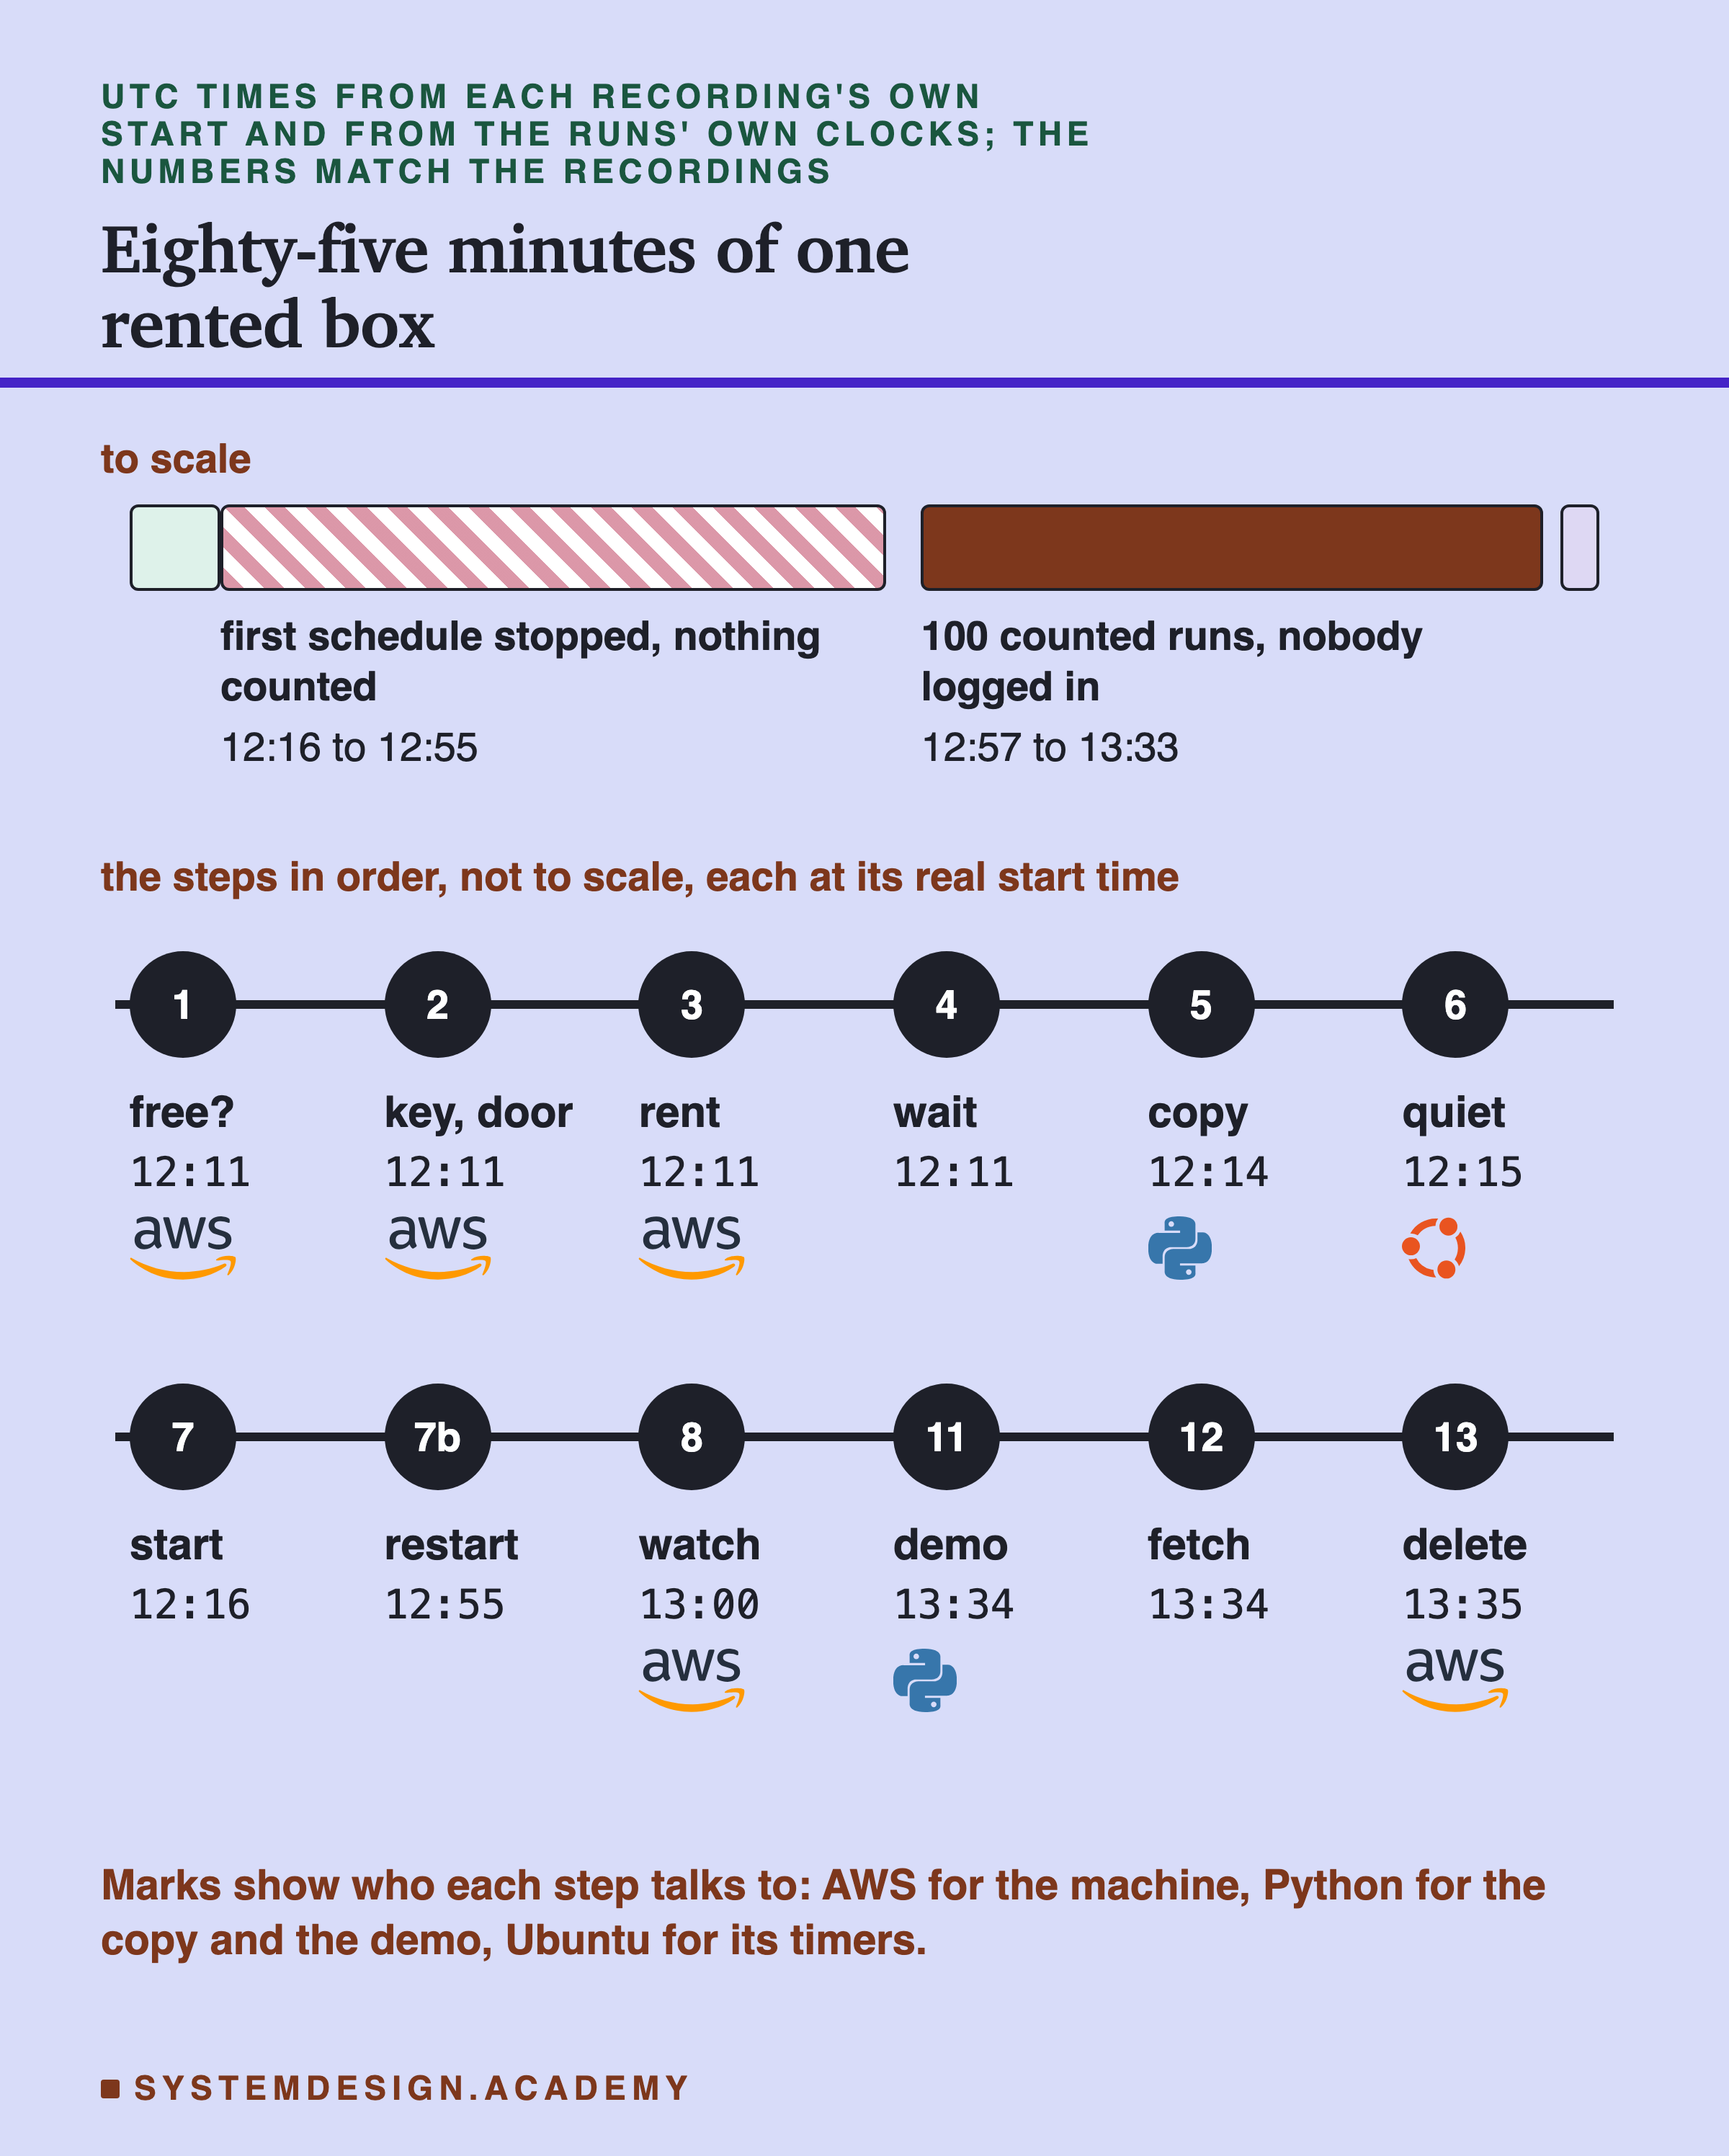
Steps 1 to 7 rent the machine, set it up and start the schedule. The hatched stretch is the first schedule, which stopped on its very first counted run: 39 minutes in which nothing was counted. Step 7b is the restart, and the next slides explain the fault and the fix. Step 8 is how I watched without logging in. The long dark bar holds the 100 counted runs, steps 9 and 10.
In those runs the schedule started a fresh store and a fresh service each time, and the tester sent its timetable of requests. Steps 11 to 13 come after: the student demo, the copy of the results to my laptop, and the deletion of everything.
Build the Lab Machine Yourself
The rented machine is part of the lab, so I show every step. You can rent this kind of machine and run this schedule yourself.
You need an AWS account, and the AWS command line tool (aws) set up with your keys. You also need ssh, which logs in to another computer, scp and rsync, which copy files to and from it, and curl, which downloads a web page.
Lesson 2's model and data files must sit in ~/lab-data/serving/lat, which lesson 2's lab makes. Lesson 9's two stand-in files must be in place too, and python serving_checklist.py prepare copies them. All the steps live in one file, scripts/labs/serving/chk_files/chk_aws_steps.sh. You run it from the scripts/labs/serving folder, one step at a time, such as bash chk_files/chk_aws_steps.sh check, then access, and so on. Every code block below is copied word for word from that file.
The blocks use a few names that the file sets at its top. If you paste the blocks by hand, run these lines first, from the scripts/labs/serving folder. All of them come from the file, except HERE=$PWD. The file works out that folder from its own location, which a pasted line cannot do.
Steps 1 to 3: Is the Account Free? Lock the Door, Rent the Machine
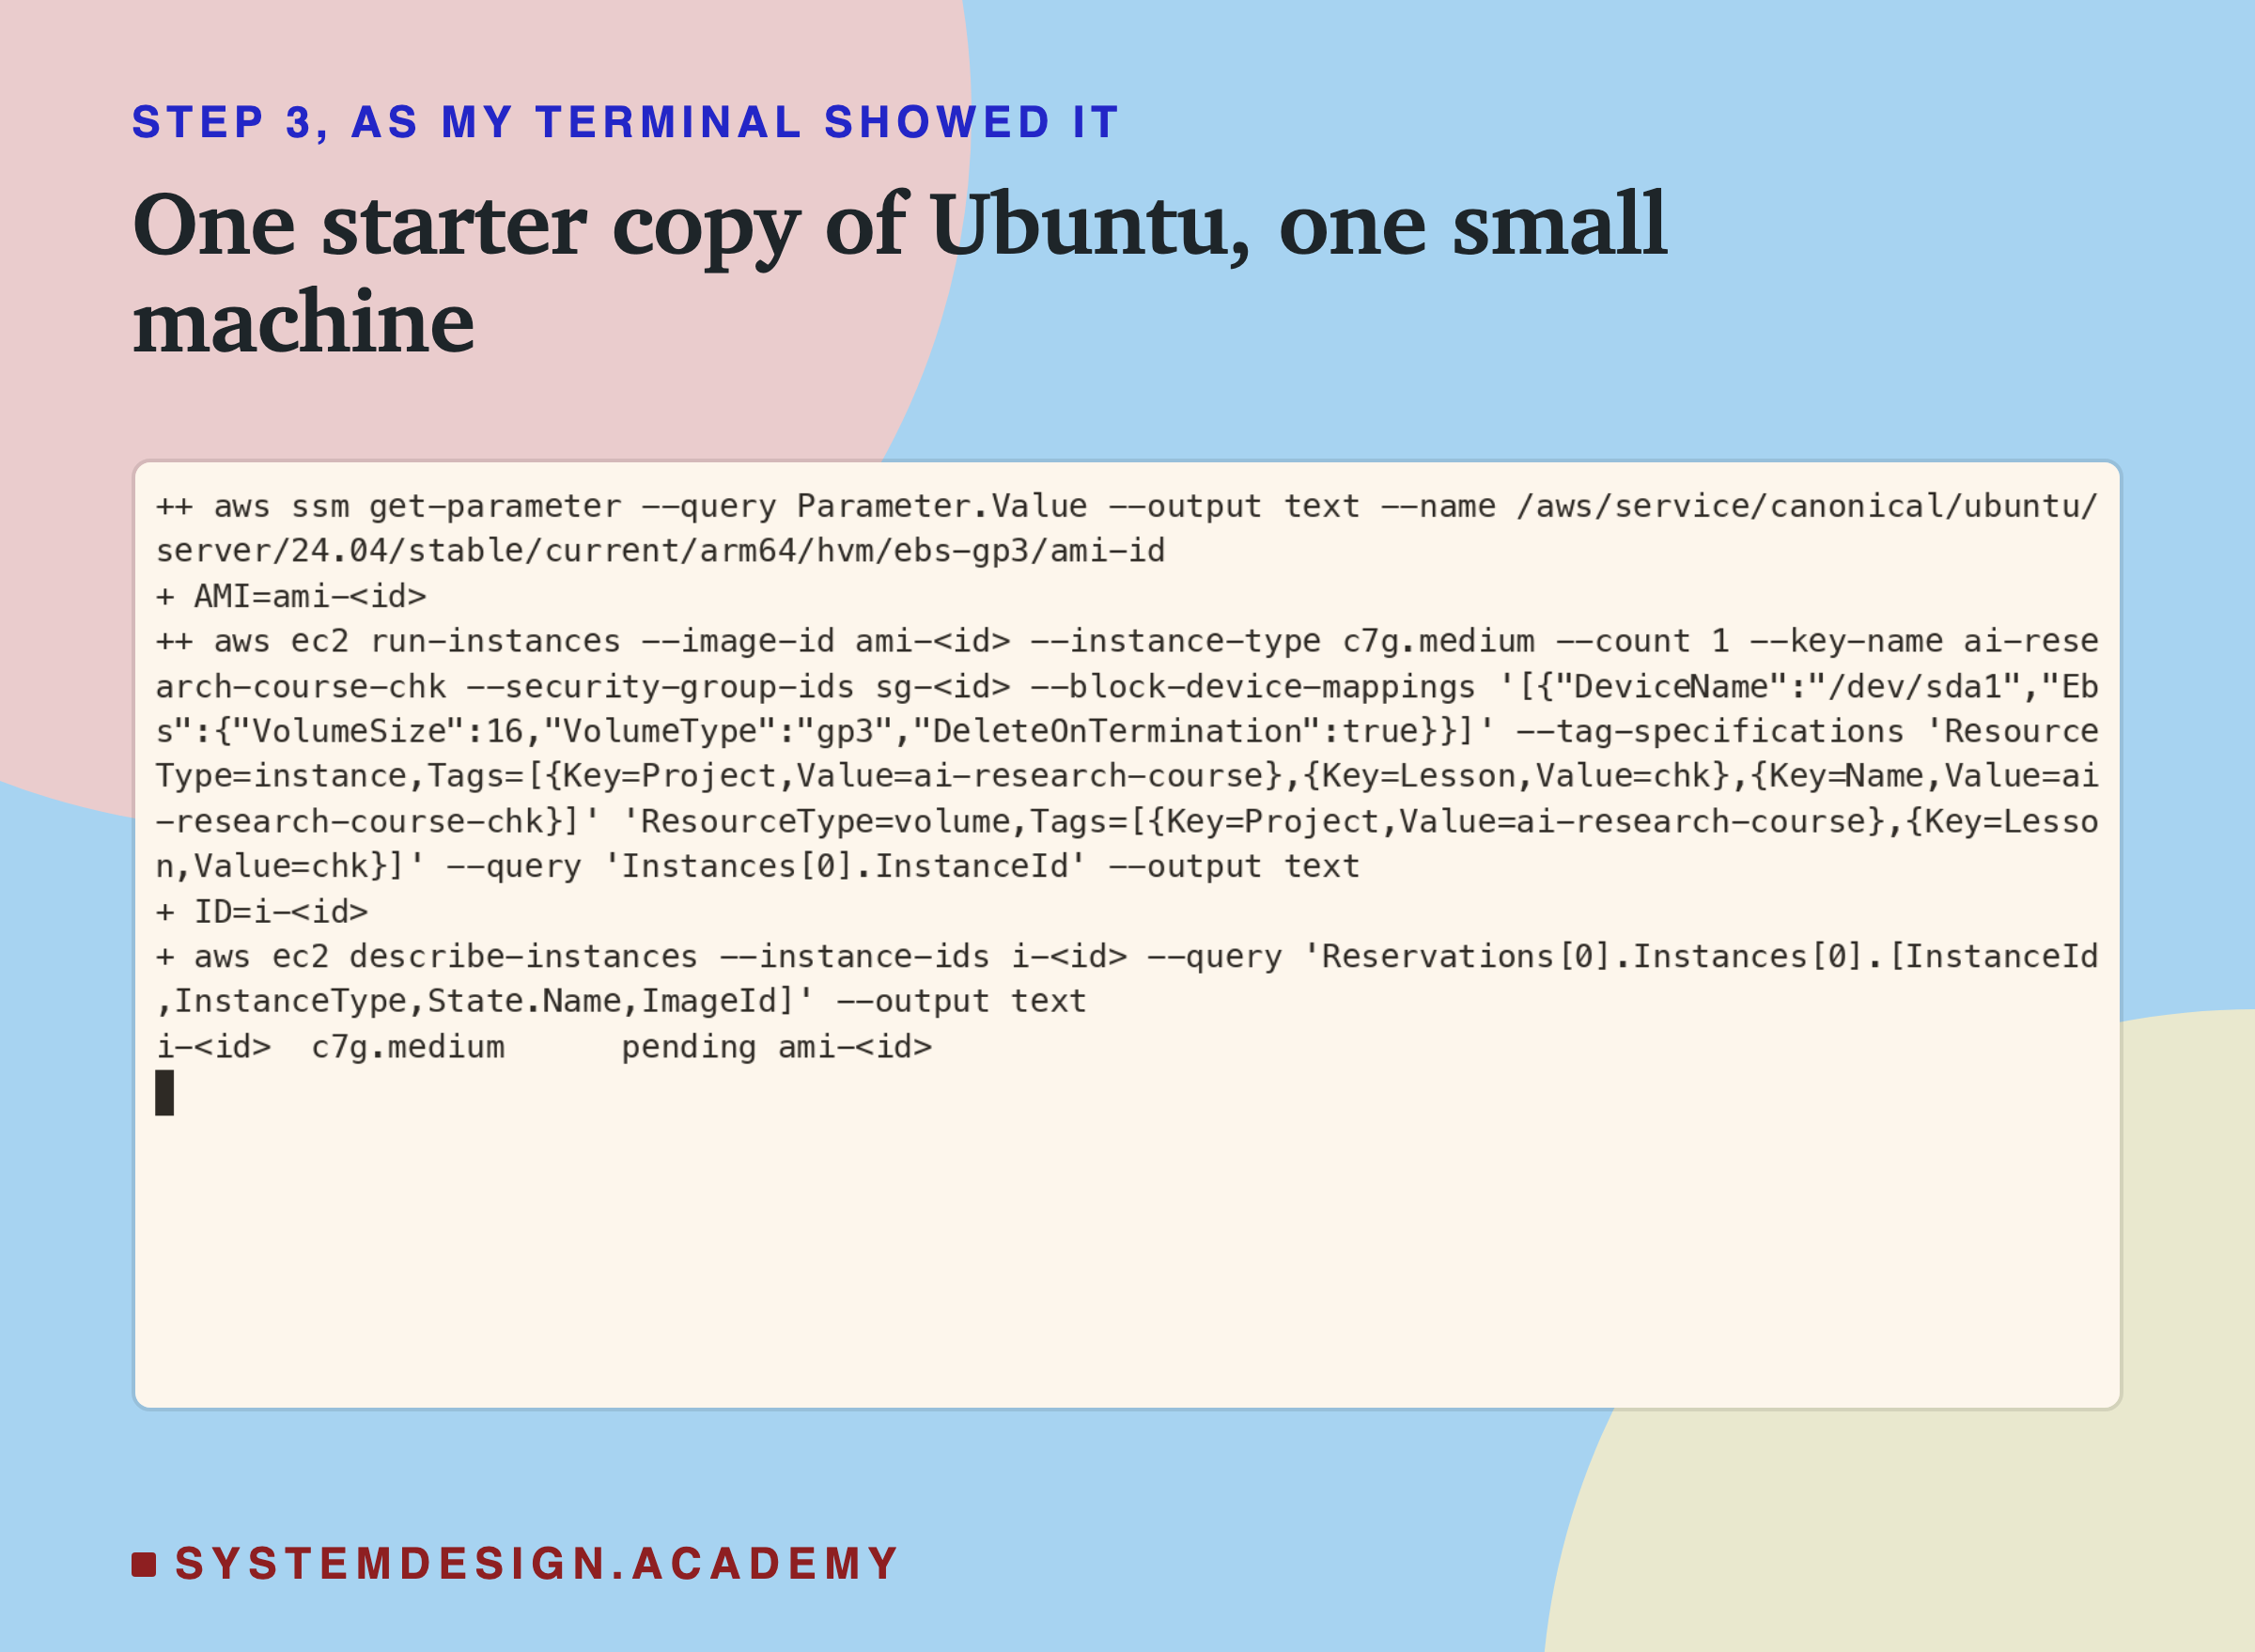
My account allows one core at a time, and other projects share that limit. So step 1 counts every machine in the account that is starting, running or stopping, and it must print 0.
Step 2 makes a key and a locked door. A key pair is how you prove to the machine that you may come in. AWS keeps one half, and you keep the other half in a file only you can read. A security group is a door rule. Mine opens only port 22, the door that SSH (the secure remote login) uses, and only to my own address. Both get tags, small labels that say which project and lesson they belong to.
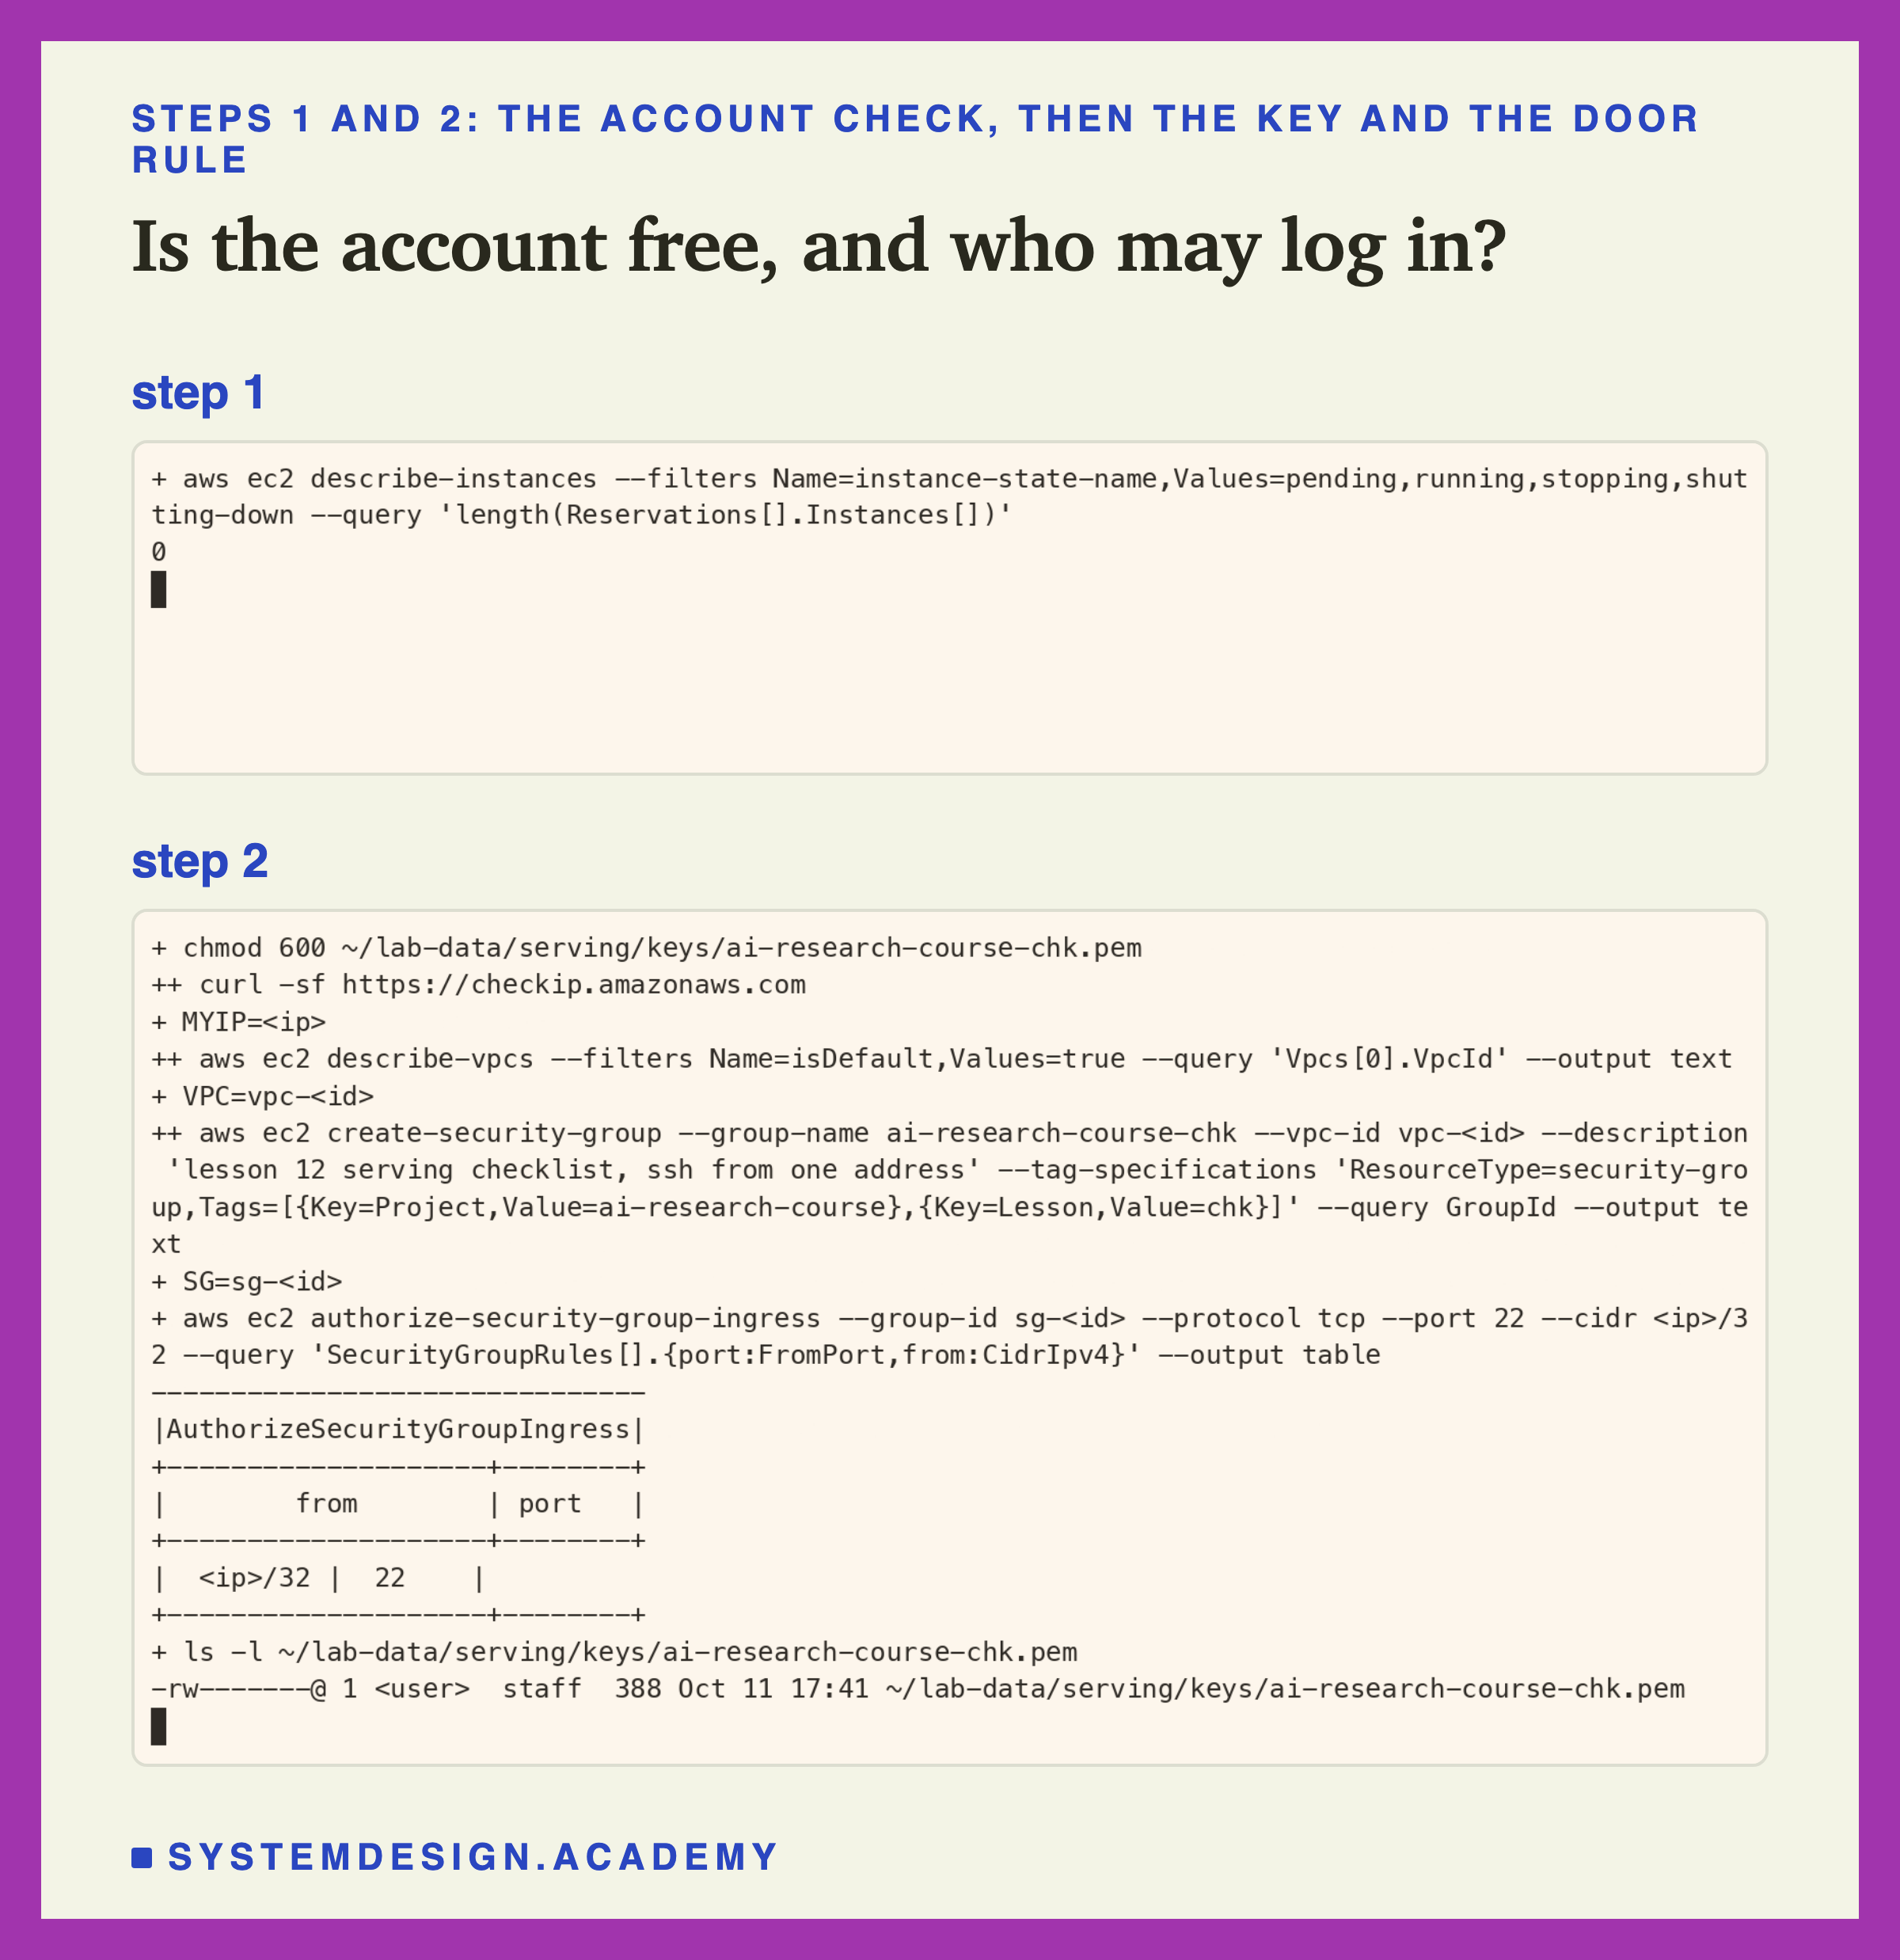
Step 1 printed 0, so the account was free. In step 2 the key went straight into its file and was never printed, and the door rule names only my own address, written with /32 after it. Step 1 is a single command:
  aws ec2 describe-instances \
    --filters "Name=instance-state-name,Values=pending,running,stopping,shutting-down" \
    --query "length(Reservations[].Instances[])"
Step 2 runs these:
  aws ec2 create-key-pair --key-name ai-research-course-chk --key-type ed25519 \
    --tag-specifications "ResourceType=key-pair,Tags=[{Key=Project,Value=ai-research-course},{Key=Lesson,Value=chk}]" \
    --query KeyMaterial --output text > ~/lab-data/serving/keys/ai-research-course-chk.pem
  chmod 600 ~/lab-data/serving/keys/ai-research-course-chk.pem
  MYIP=$(curl -sf https://checkip.amazonaws.com)
  VPC=$(aws ec2 describe-vpcs --filters Name=isDefault,Values=true --query "Vpcs[0].VpcId" --output text)
  SG=$(aws ec2 create-security-group --group-name ai-research-course-chk --vpc-id "$VPC" \
    --description "lesson 12 serving checklist, ssh from one address" \
    --tag-specifications "ResourceType=security-group,Tags=[{Key=Project,Value=ai-research-course},{Key=Lesson,Value=chk}]" \
    --query GroupId --output text)
  aws ec2 authorize-security-group-ingress --group-id "$SG" --protocol tcp --port 22 --cidr "$MYIP/32" \
    --query "SecurityGroupRules[].{port:FromPort,from:CidrIpv4}" --output table
  ls -l ~/lab-data/serving/keys/ai-research-course-chk.pem
  echo "$SG" > "$STATE/sg"
Steps 4 to 6: Wait, Set Up, Look
In step 4 the AWS tool waits until the machine is running. Then the script reads its public address and tries SSH every five seconds until the machine answers.
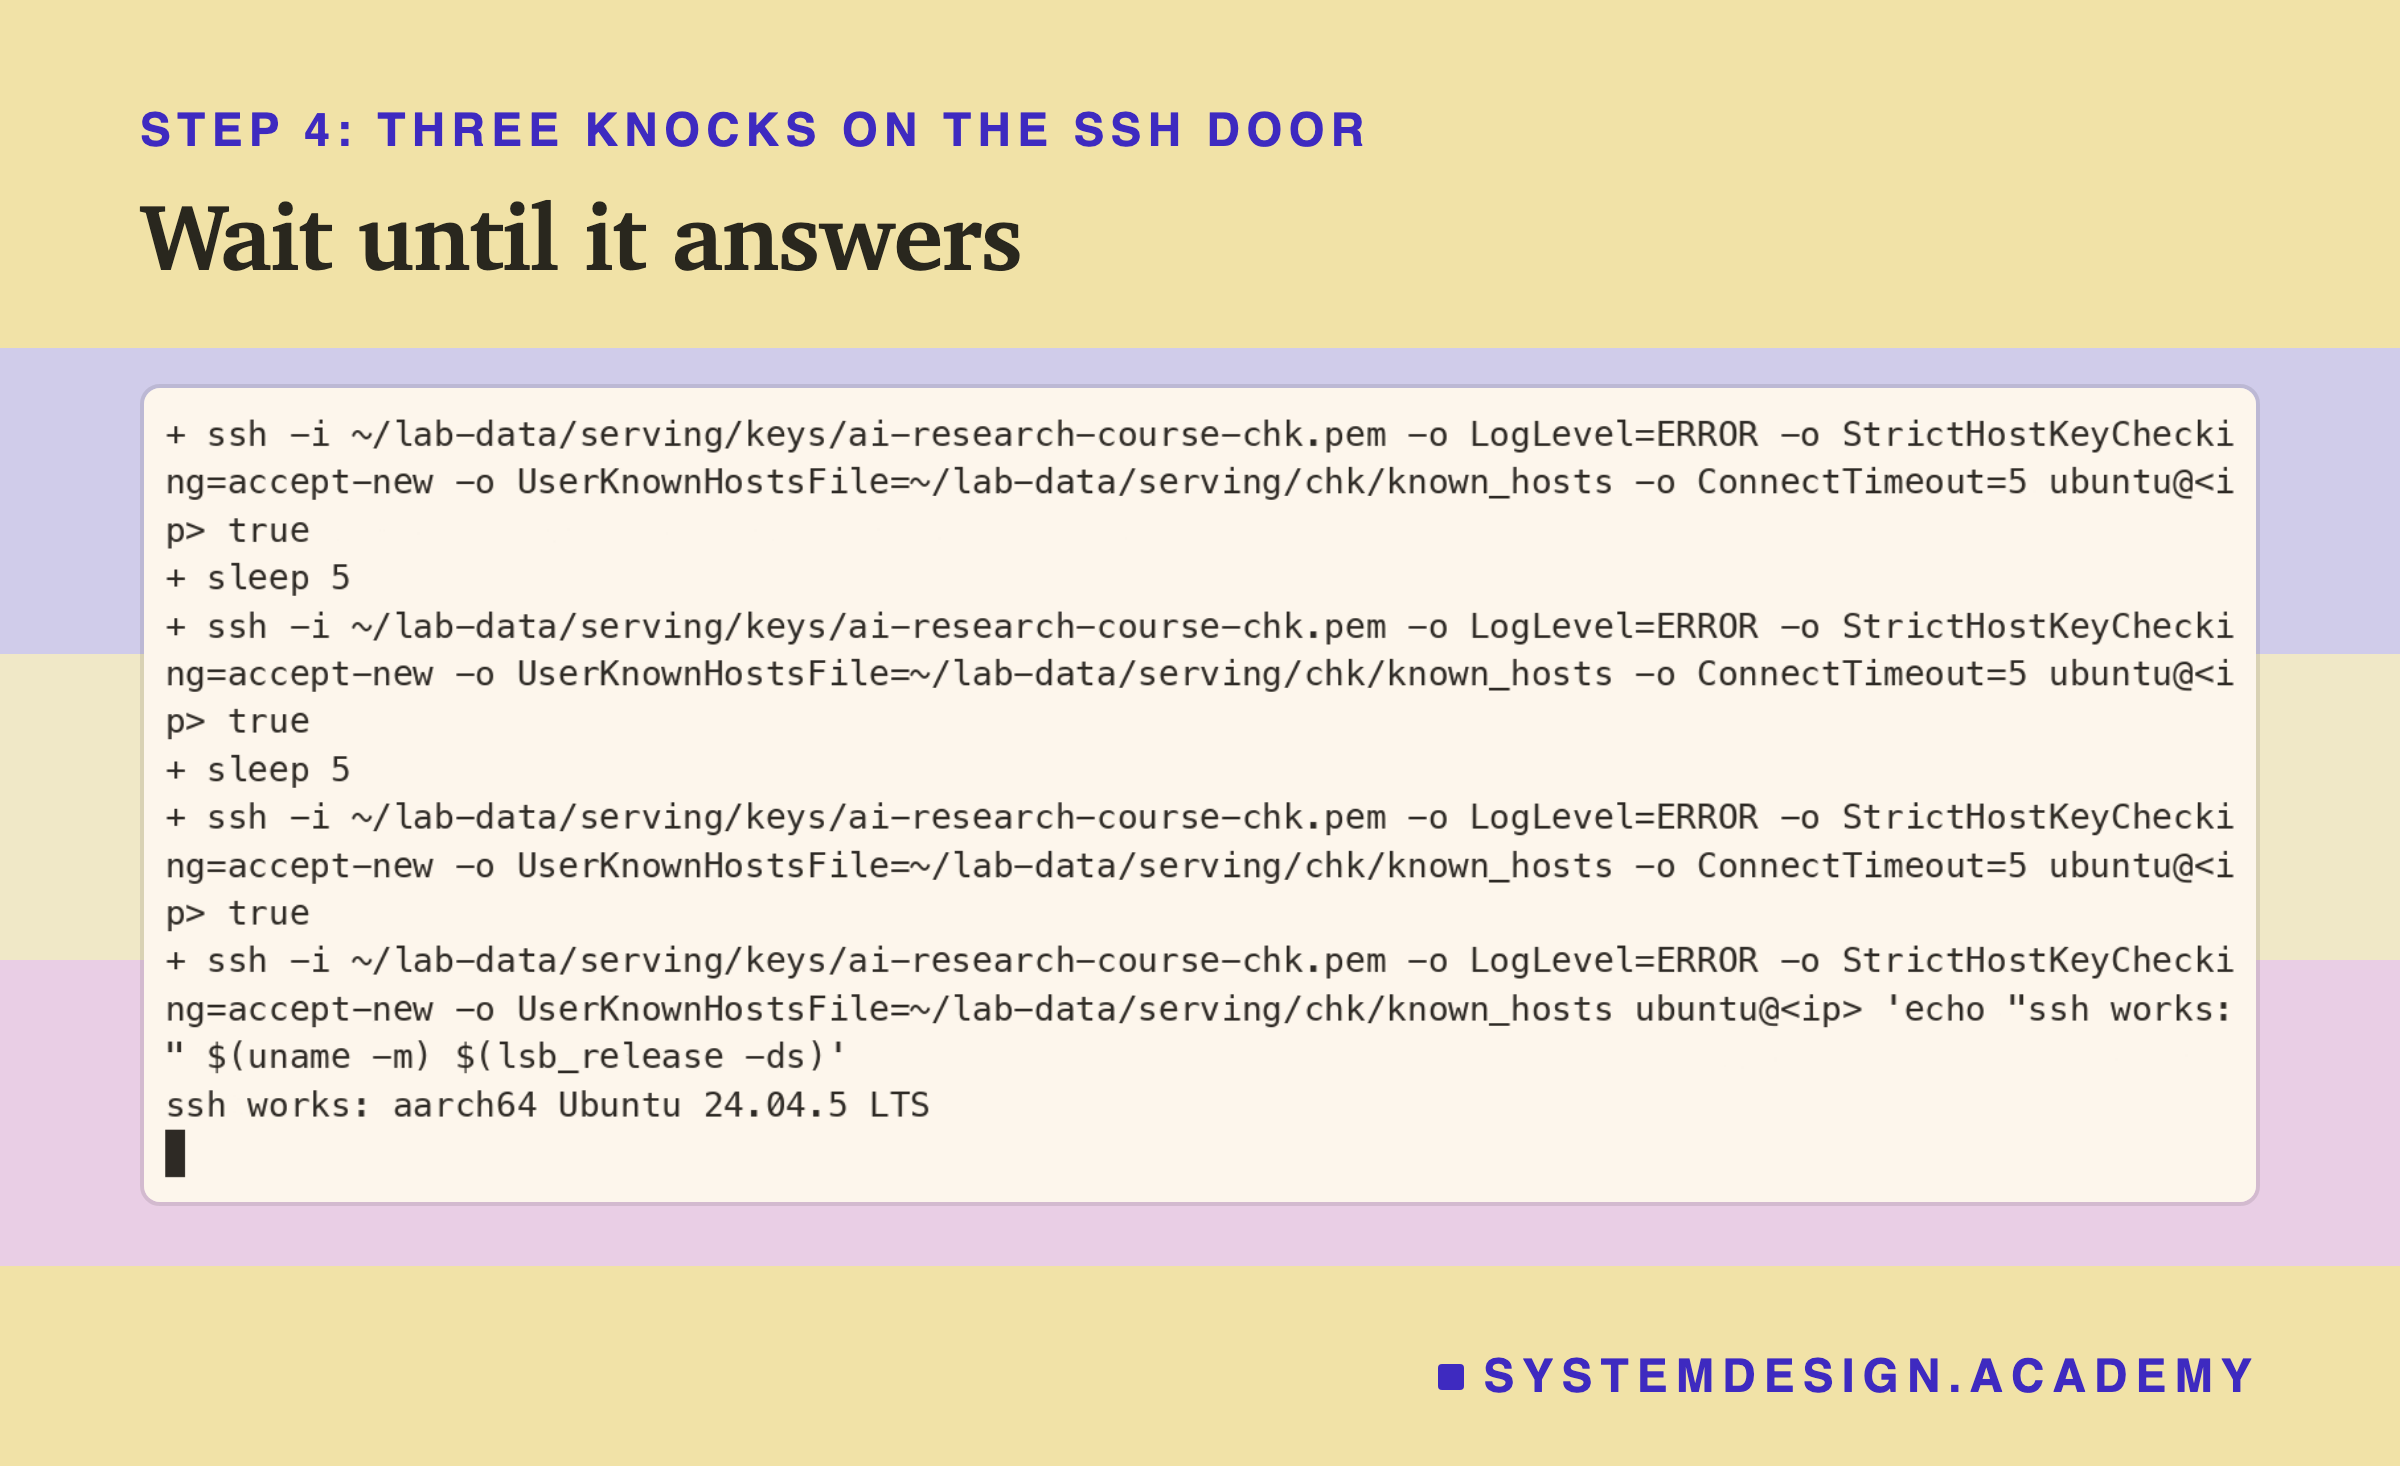
SSH failed twice while the machine was still waking up, and worked on the third try, 32 seconds after launch:
  aws ec2 wait instance-running --instance-ids "$ID"
  IP=$(aws ec2 describe-instances --instance-ids "$ID" \
    --query "Reservations[0].Instances[0].PublicIpAddress" --output text)
  aws ec2 describe-instances --instance-ids "$ID" \
    --query "Reservations[0].Instances[0].[State.Name,InstanceType,Placement.AvailabilityZone]" --output text
  until ssh -i ~/lab-data/serving/keys/ai-research-course-chk.pem "${SSHO[@]}" -o ConnectTimeout=5 \
    ubuntu@"$IP" true 2>/dev/null; do sleep 5; done
  ssh -i ~/lab-data/serving/keys/ai-research-course-chk.pem "${SSHO[@]}" ubuntu@"$IP" \
    'echo "ssh works:" $(uname -m) $(lsb_release -ds)'
  date -u +%Y-%m-%dT%H:%M:%S+00:00 > "$STATE/ssh_ready"
  echo "$IP" > "$STATE/ip"
  aws ec2 describe-instances --instance-ids "$ID" --query "Reservations[0].Instances[0].LaunchTime" \
    --output text > "$STATE/launched"
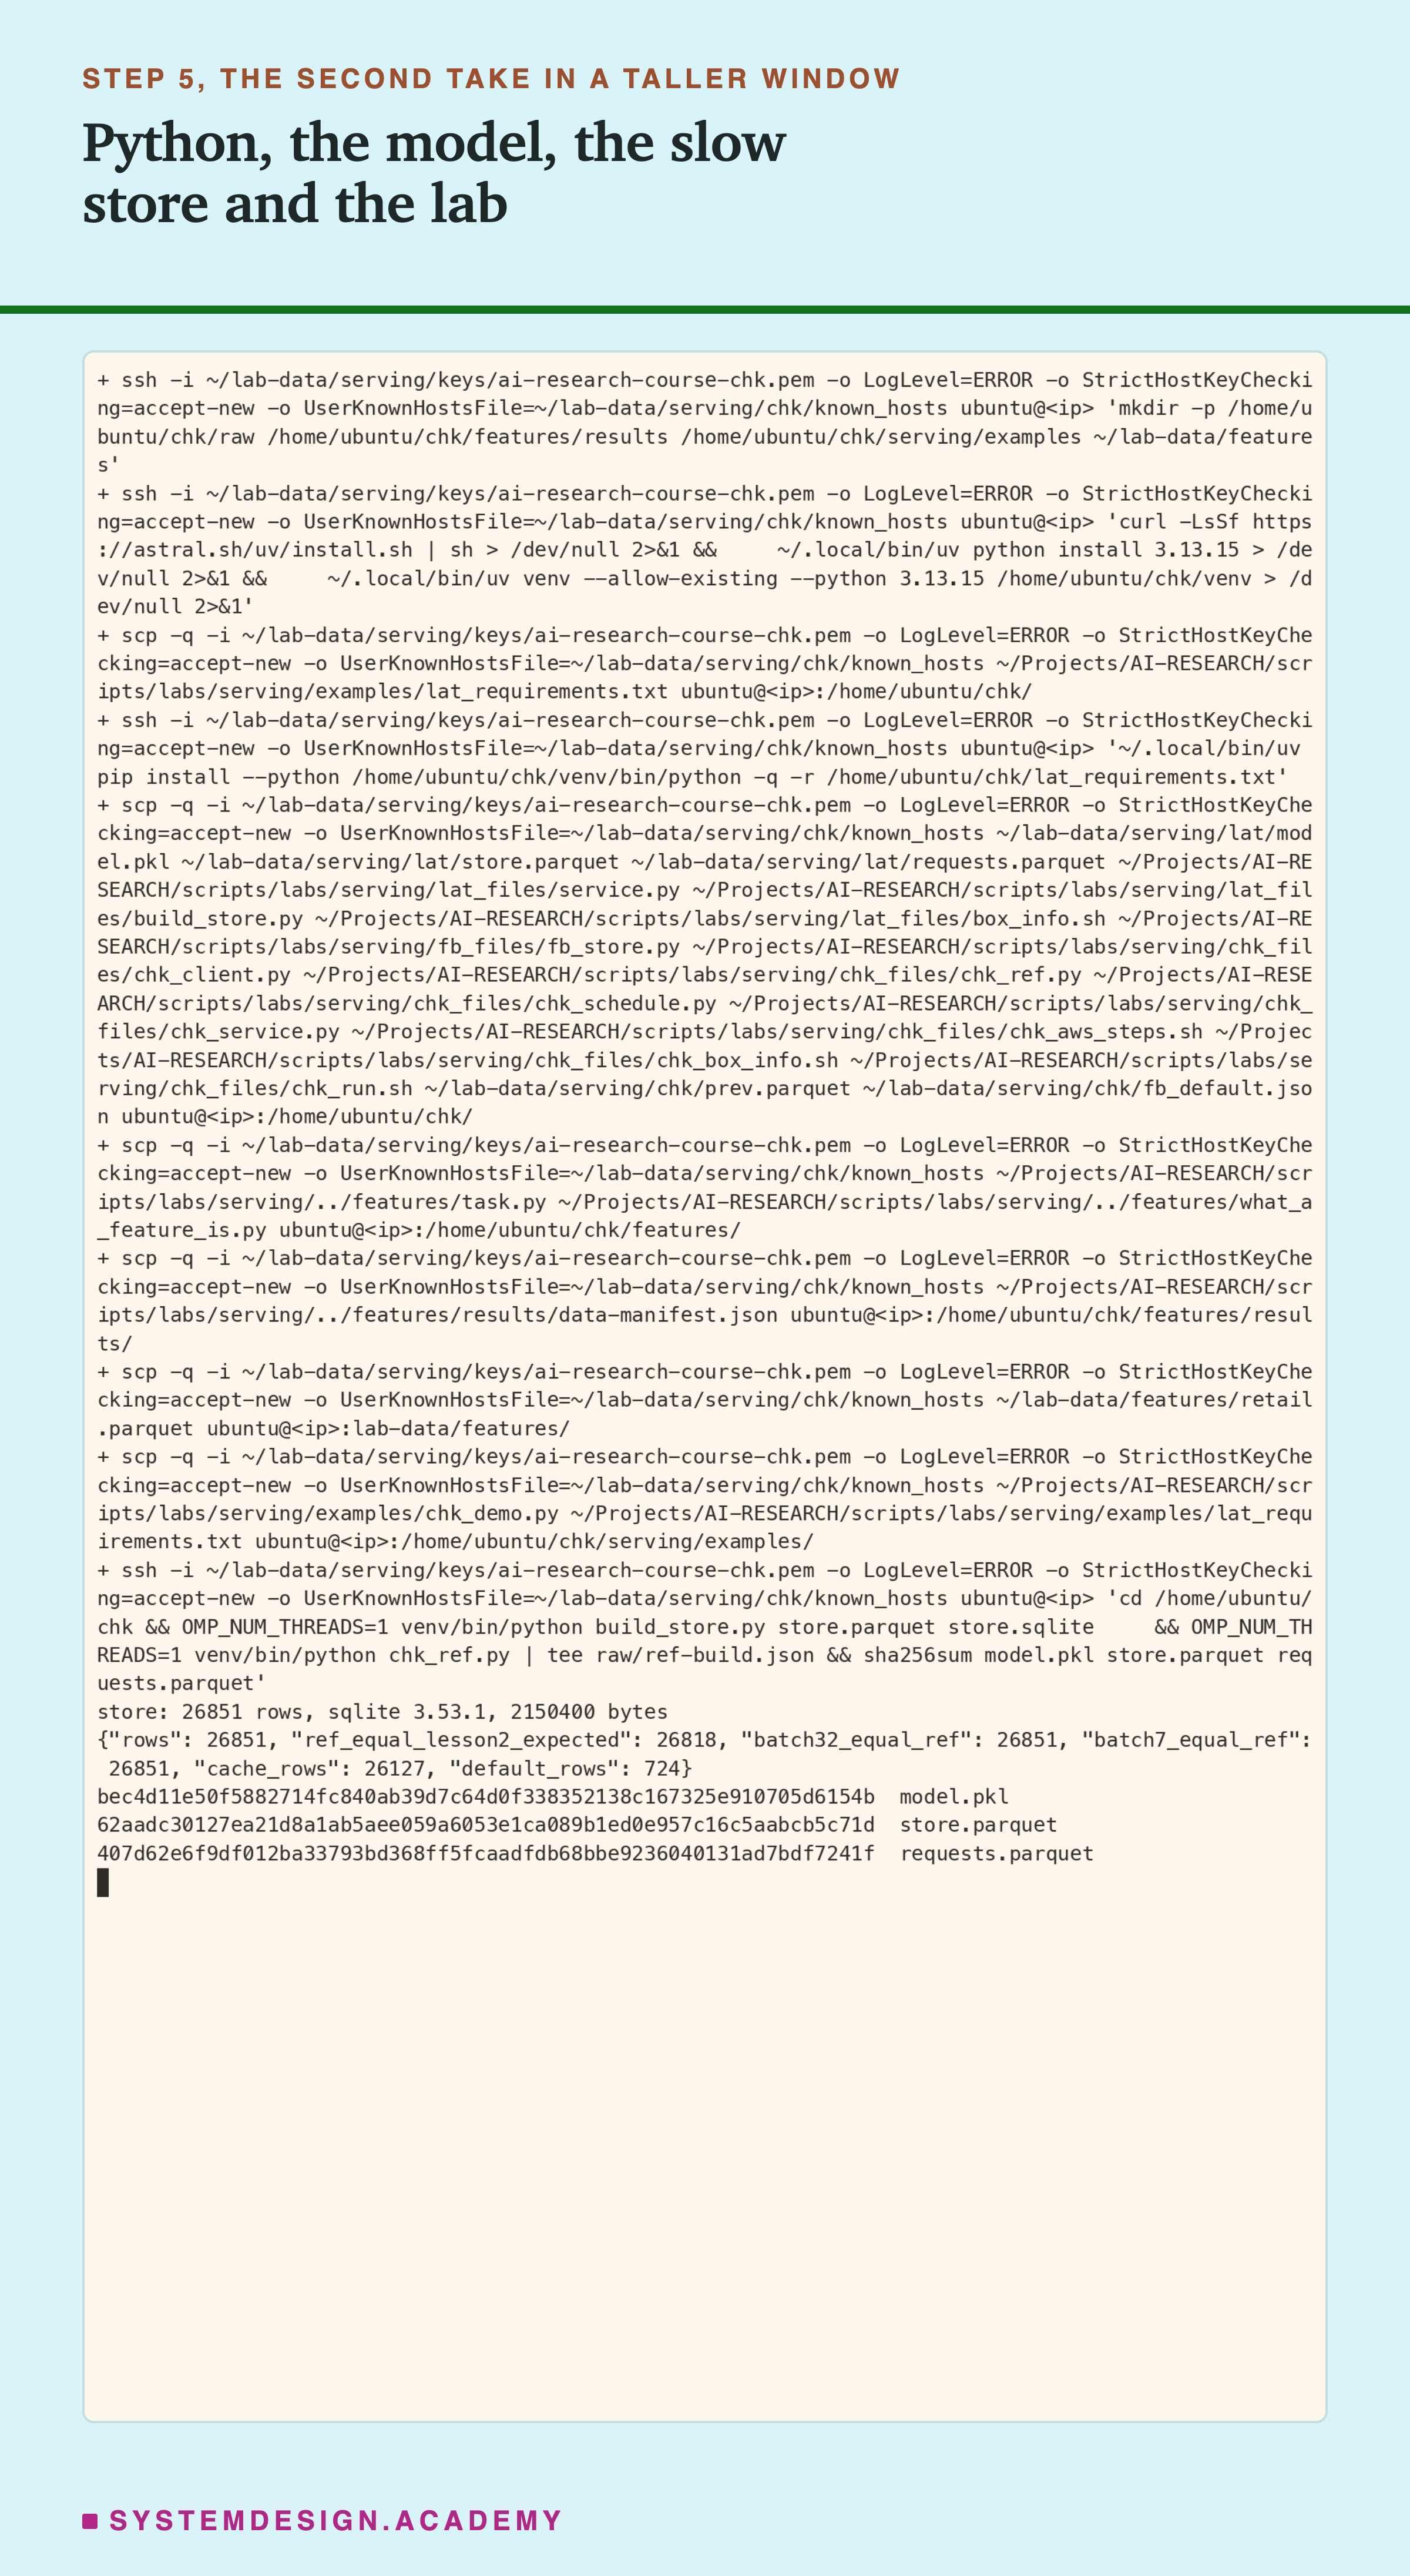
Step 5 installs Python 3.13.15 and the library versions of lessons 2 to 11, through uv, a fast installer for Python. A venv is a private toolbox folder for one project's Python, with the exact tool versions written down. Then scp sends lesson 2's model and data, lesson 2's service, lesson 9's store, lesson 9's two stand-in files and this lesson's files. Last, the machine builds its small database and works out its own reference score for every request row. That is a score worked out once, one row at a time, to check every later answer against.
Steps 7, 7b and 8: Start, Fix, Watch From Outside
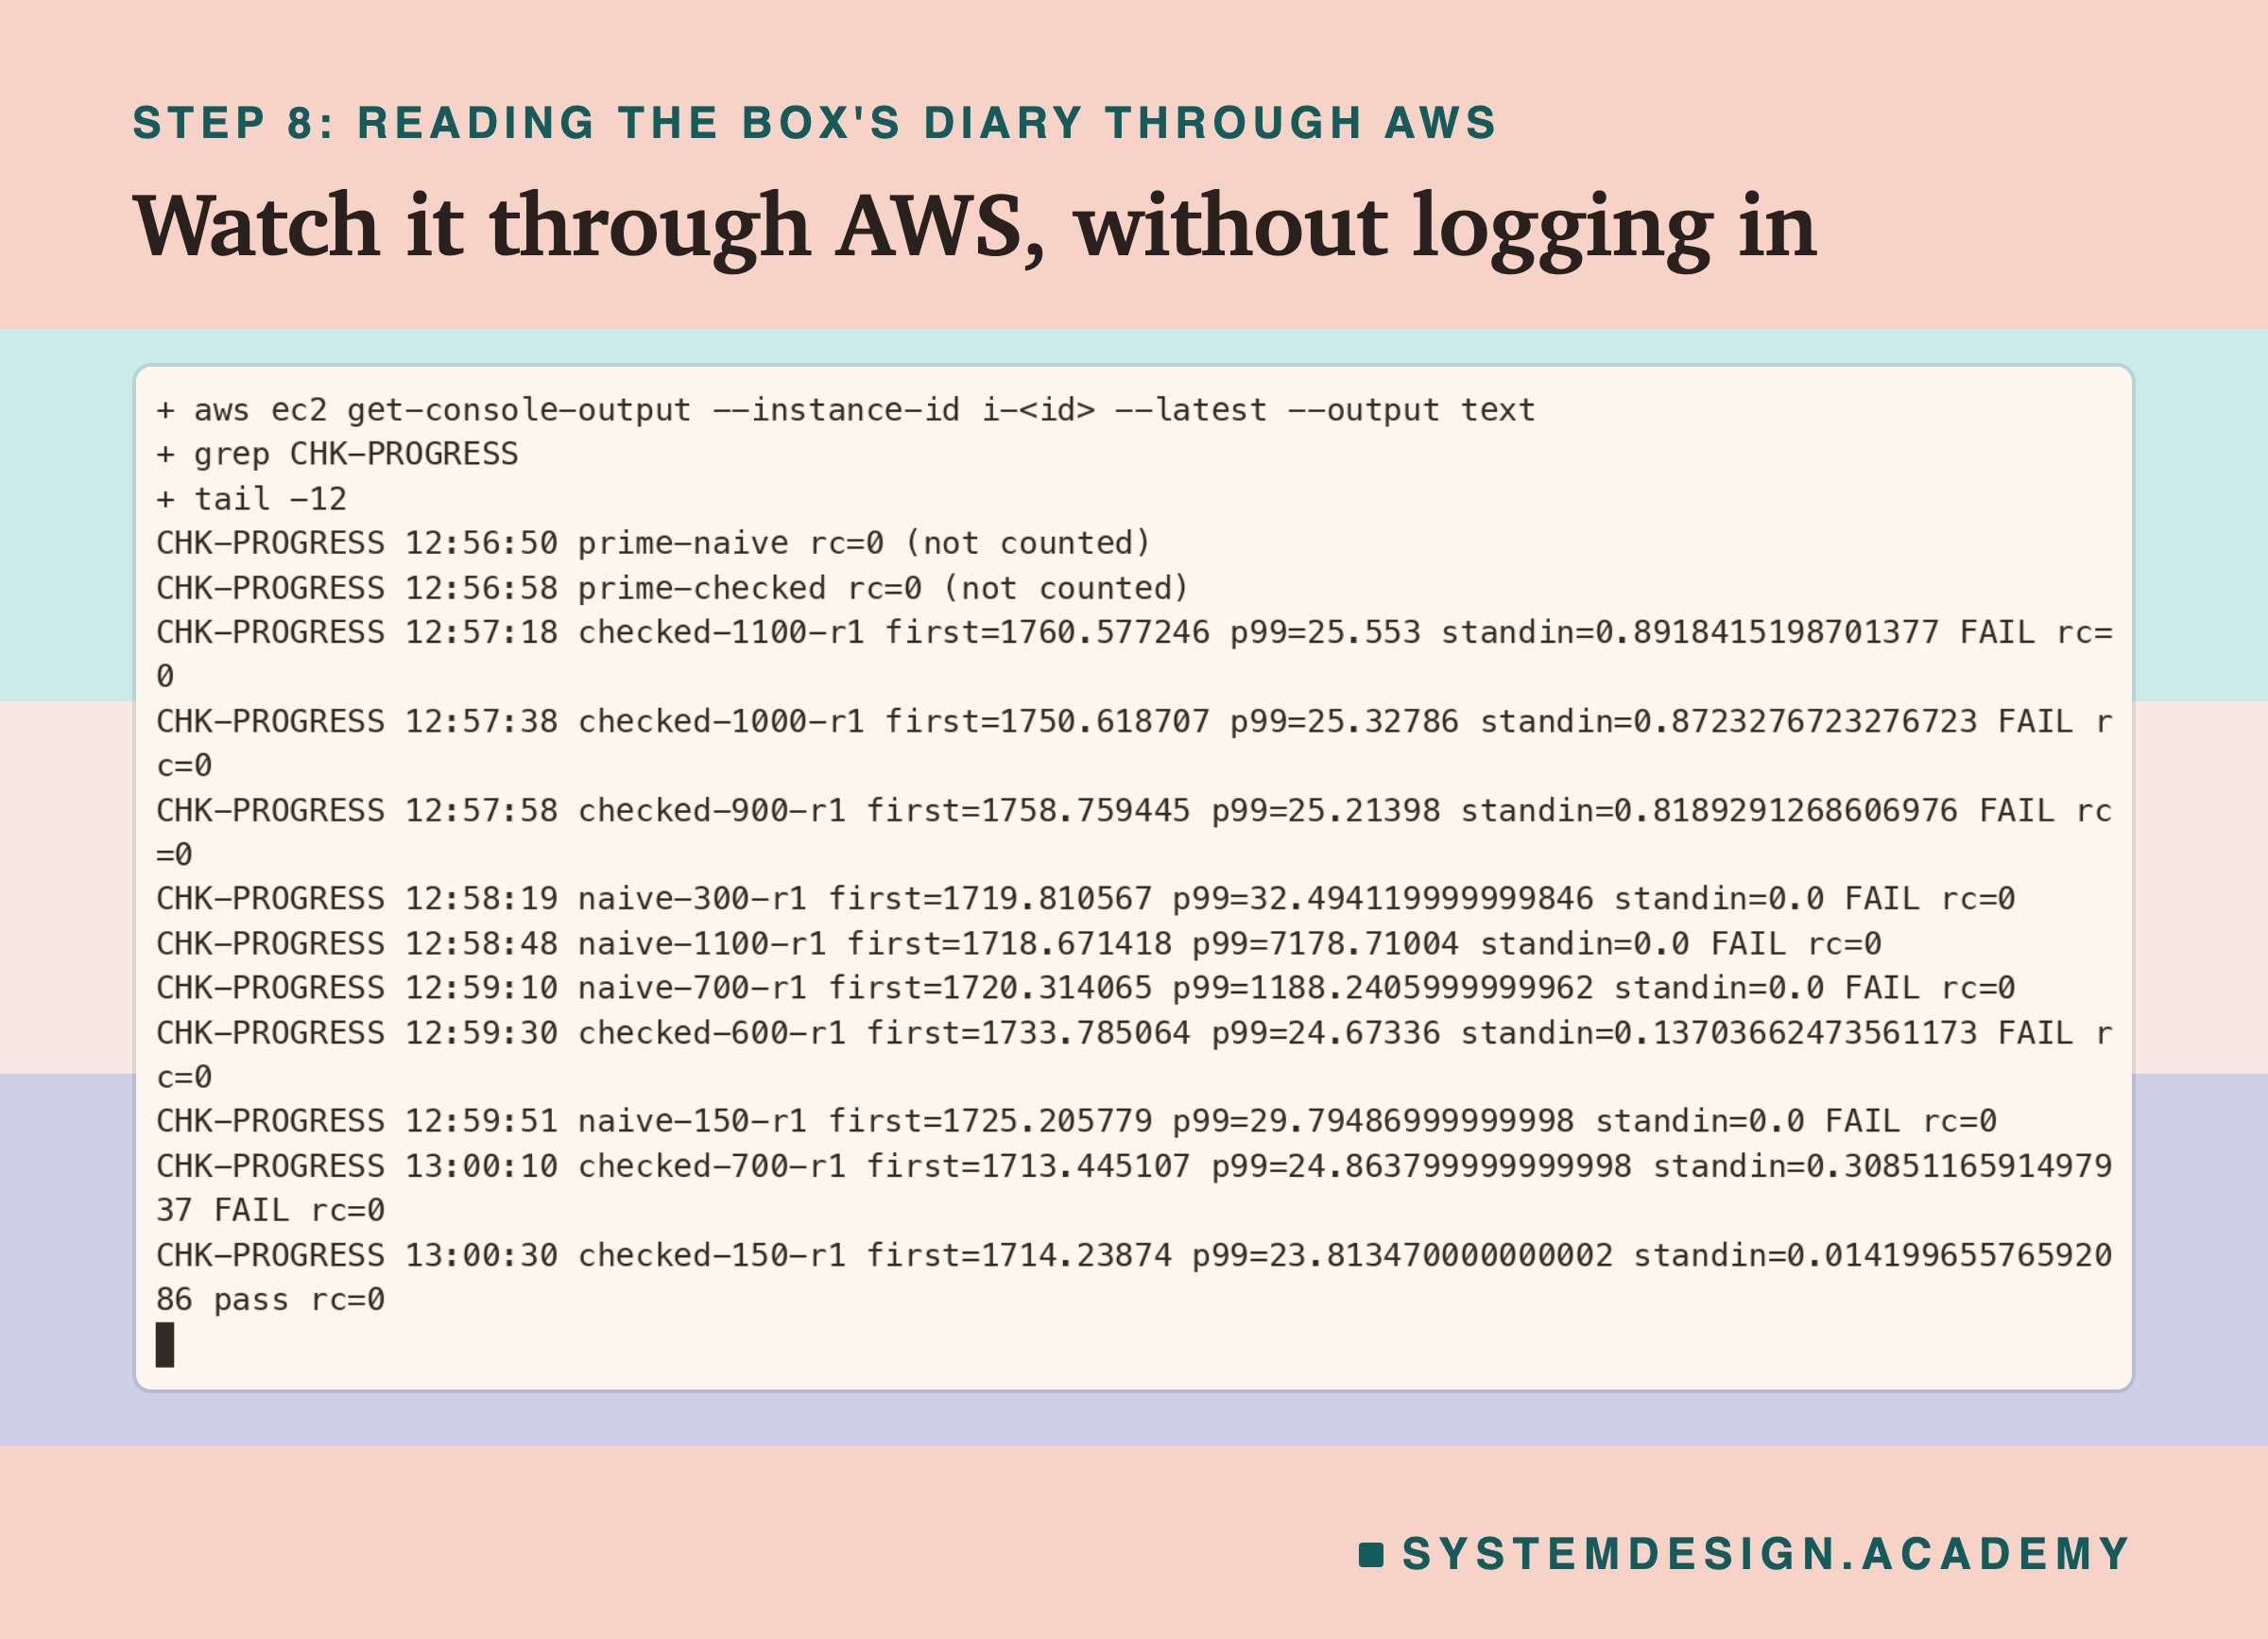
Step 7 starts the schedule in the background with setsid nohup, a command that keeps a program running after I log out. Nobody logs in again until it ends.
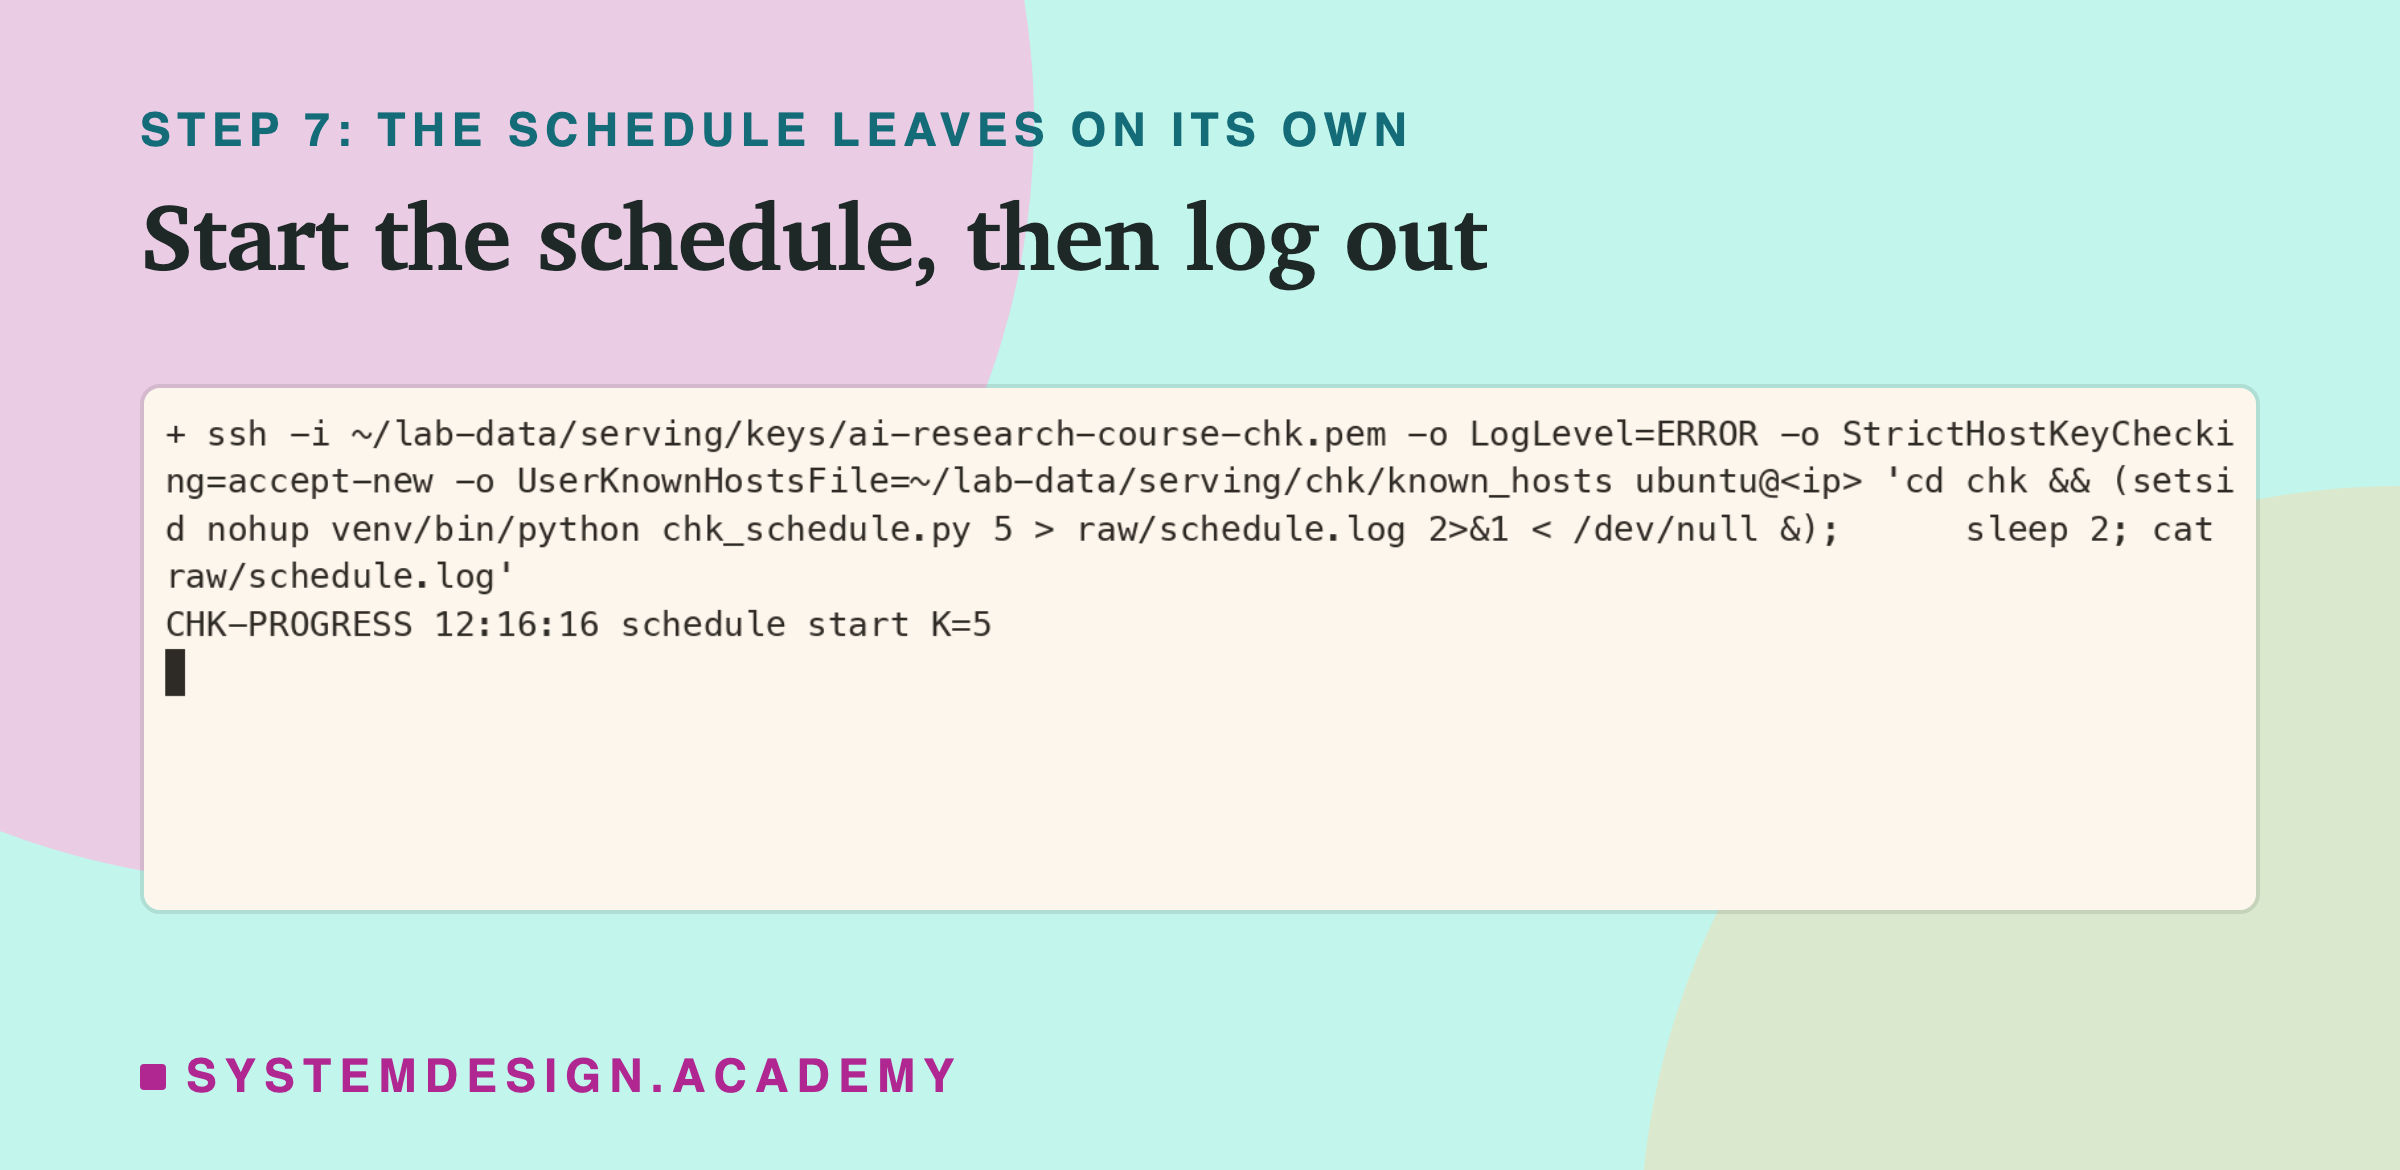
The number 5 is the count of rounds:
  ssh -i ~/lab-data/serving/keys/ai-research-course-chk.pem "${SSHO[@]}" ubuntu@"$IP" \
    "cd chk && (setsid nohup venv/bin/python chk_schedule.py $K > raw/schedule.log 2>&1 < /dev/null &); \
     sleep 2; cat raw/schedule.log"
Step 7b was not in the plan. The two priming runs worked, and so did the first counted run, but the script around it could not write its record. After each run, the store keeps working on lookups that nobody waits for any more. When the service stops, each of those answers fails to send and leaves an error line in the store's log. That log was thousands of lines long. The script handed the whole log to Python inside the command itself. But Linux allows only so much text in one piece of a command: 32 pages of memory, about 128 KiB. The schedule then stopped.
I saw no progress for 35 minutes, so I logged in to look, while nothing was running. I found the cause and fixed the script: now the log travels in a file, and only its first and last 20 lines are kept. The restart copies the two fixed files and moves the first try's files aside. It checks the fixed script with one short run that is not counted. Then it starts the schedule again. Every counted result in this lesson comes from the restarted schedule.
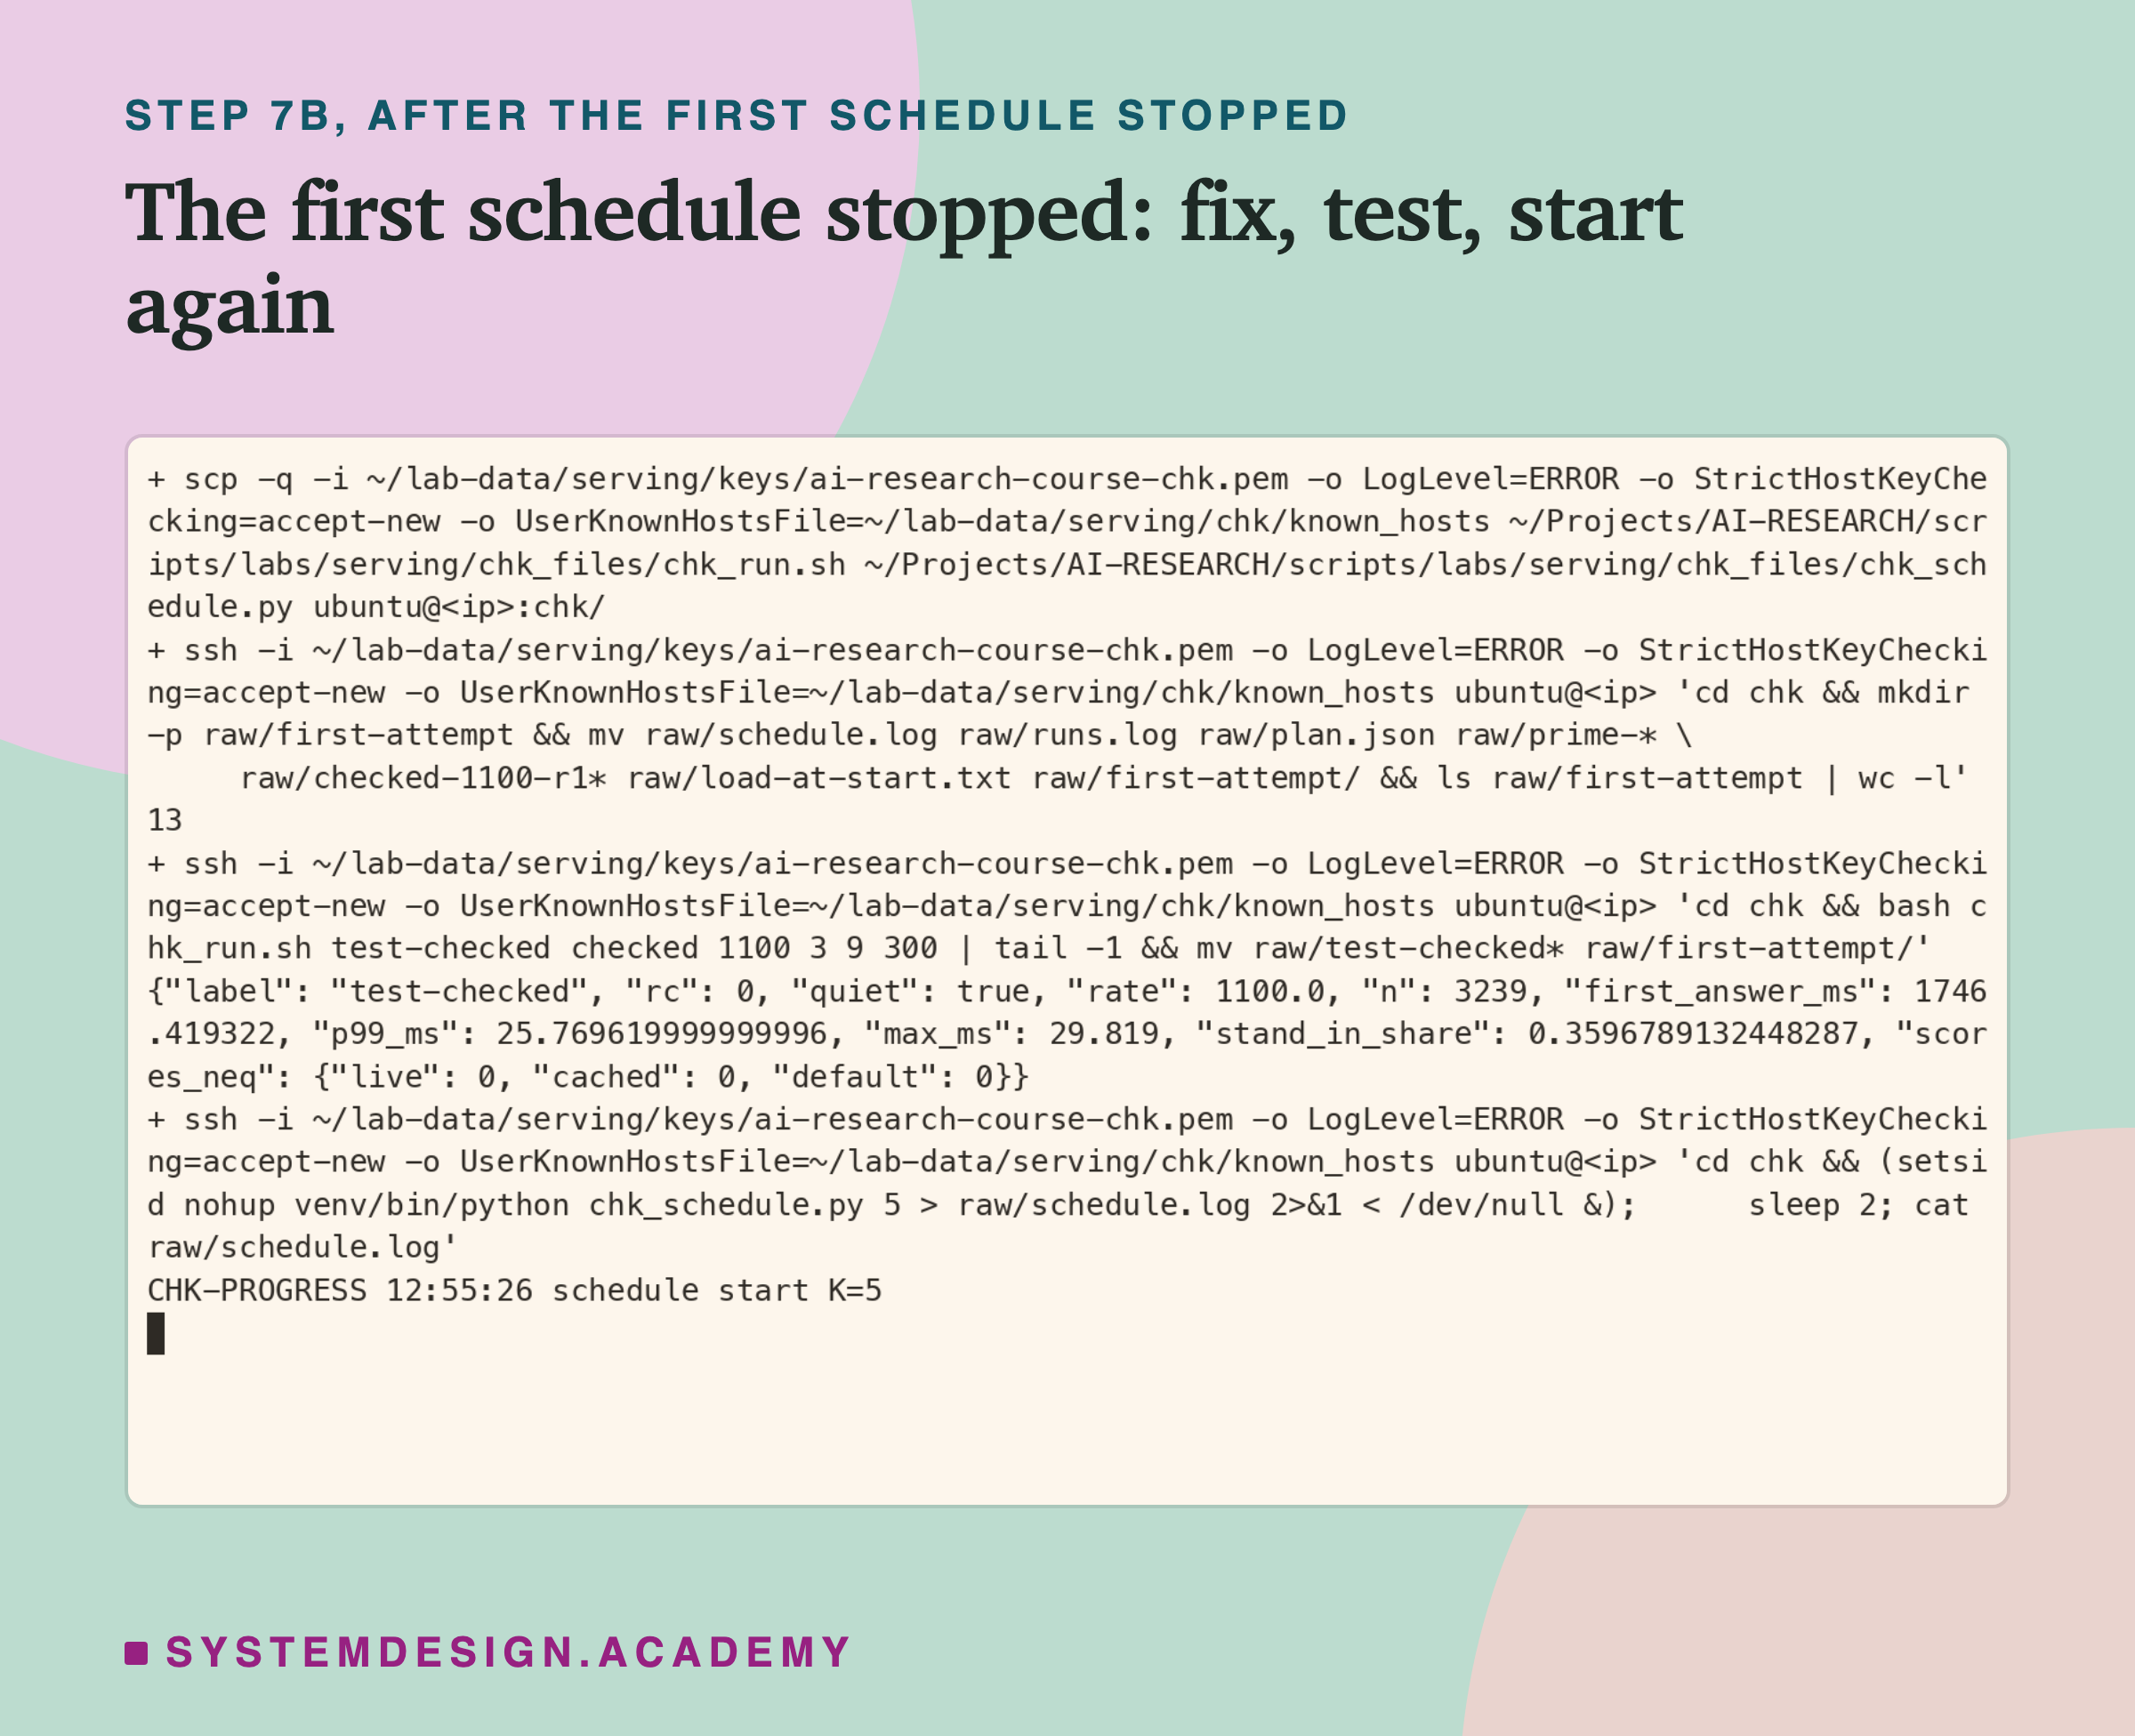
The short check run printed one line with a return code of 0, and the new schedule started at 12:55:26:
  # Added 2026-10-11 after the first schedule stopped on its first counted run (chk_run.sh passed the store's log as
  # one command-line argument, and it went over Linux's limit). Copy the two fixed files, move the first attempt's
  # files aside, check the fixed run script with one short uncounted run, then start the schedule again.
  scp -q -i ~/lab-data/serving/keys/ai-research-course-chk.pem "${SSHO[@]}" \
    "$HERE/chk_files/chk_run.sh" "$HERE/chk_files/chk_schedule.py" ubuntu@"$IP":chk/
  ssh -i ~/lab-data/serving/keys/ai-research-course-chk.pem "${SSHO[@]}" ubuntu@"$IP" \
    'cd chk && mkdir -p raw/first-attempt && mv raw/schedule.log raw/runs.log raw/plan.json raw/prime-* \
     raw/checked-1100-r1* raw/load-at-start.txt raw/first-attempt/ && ls raw/first-attempt | wc -l'
  ssh -i ~/lab-data/serving/keys/ai-research-course-chk.pem "${SSHO[@]}" ubuntu@"$IP" \
    'cd chk && bash chk_run.sh test-checked checked 1100 3 9 300 | tail -1 && mv raw/test-checked* raw/first-attempt/'
  ssh -i ~/lab-data/serving/keys/ai-research-course-chk.pem "${SSHO[@]}" ubuntu@"$IP" \
    "cd chk && (setsid nohup venv/bin/python chk_schedule.py $K > raw/schedule.log 2>&1 < /dev/null &); \
     sleep 2; cat raw/schedule.log"
Steps 11 to 13: The Demo, Bring It Home, Delete
After the schedule, step 11 ran the demo you will meet later, so you can see what it prints on one core.
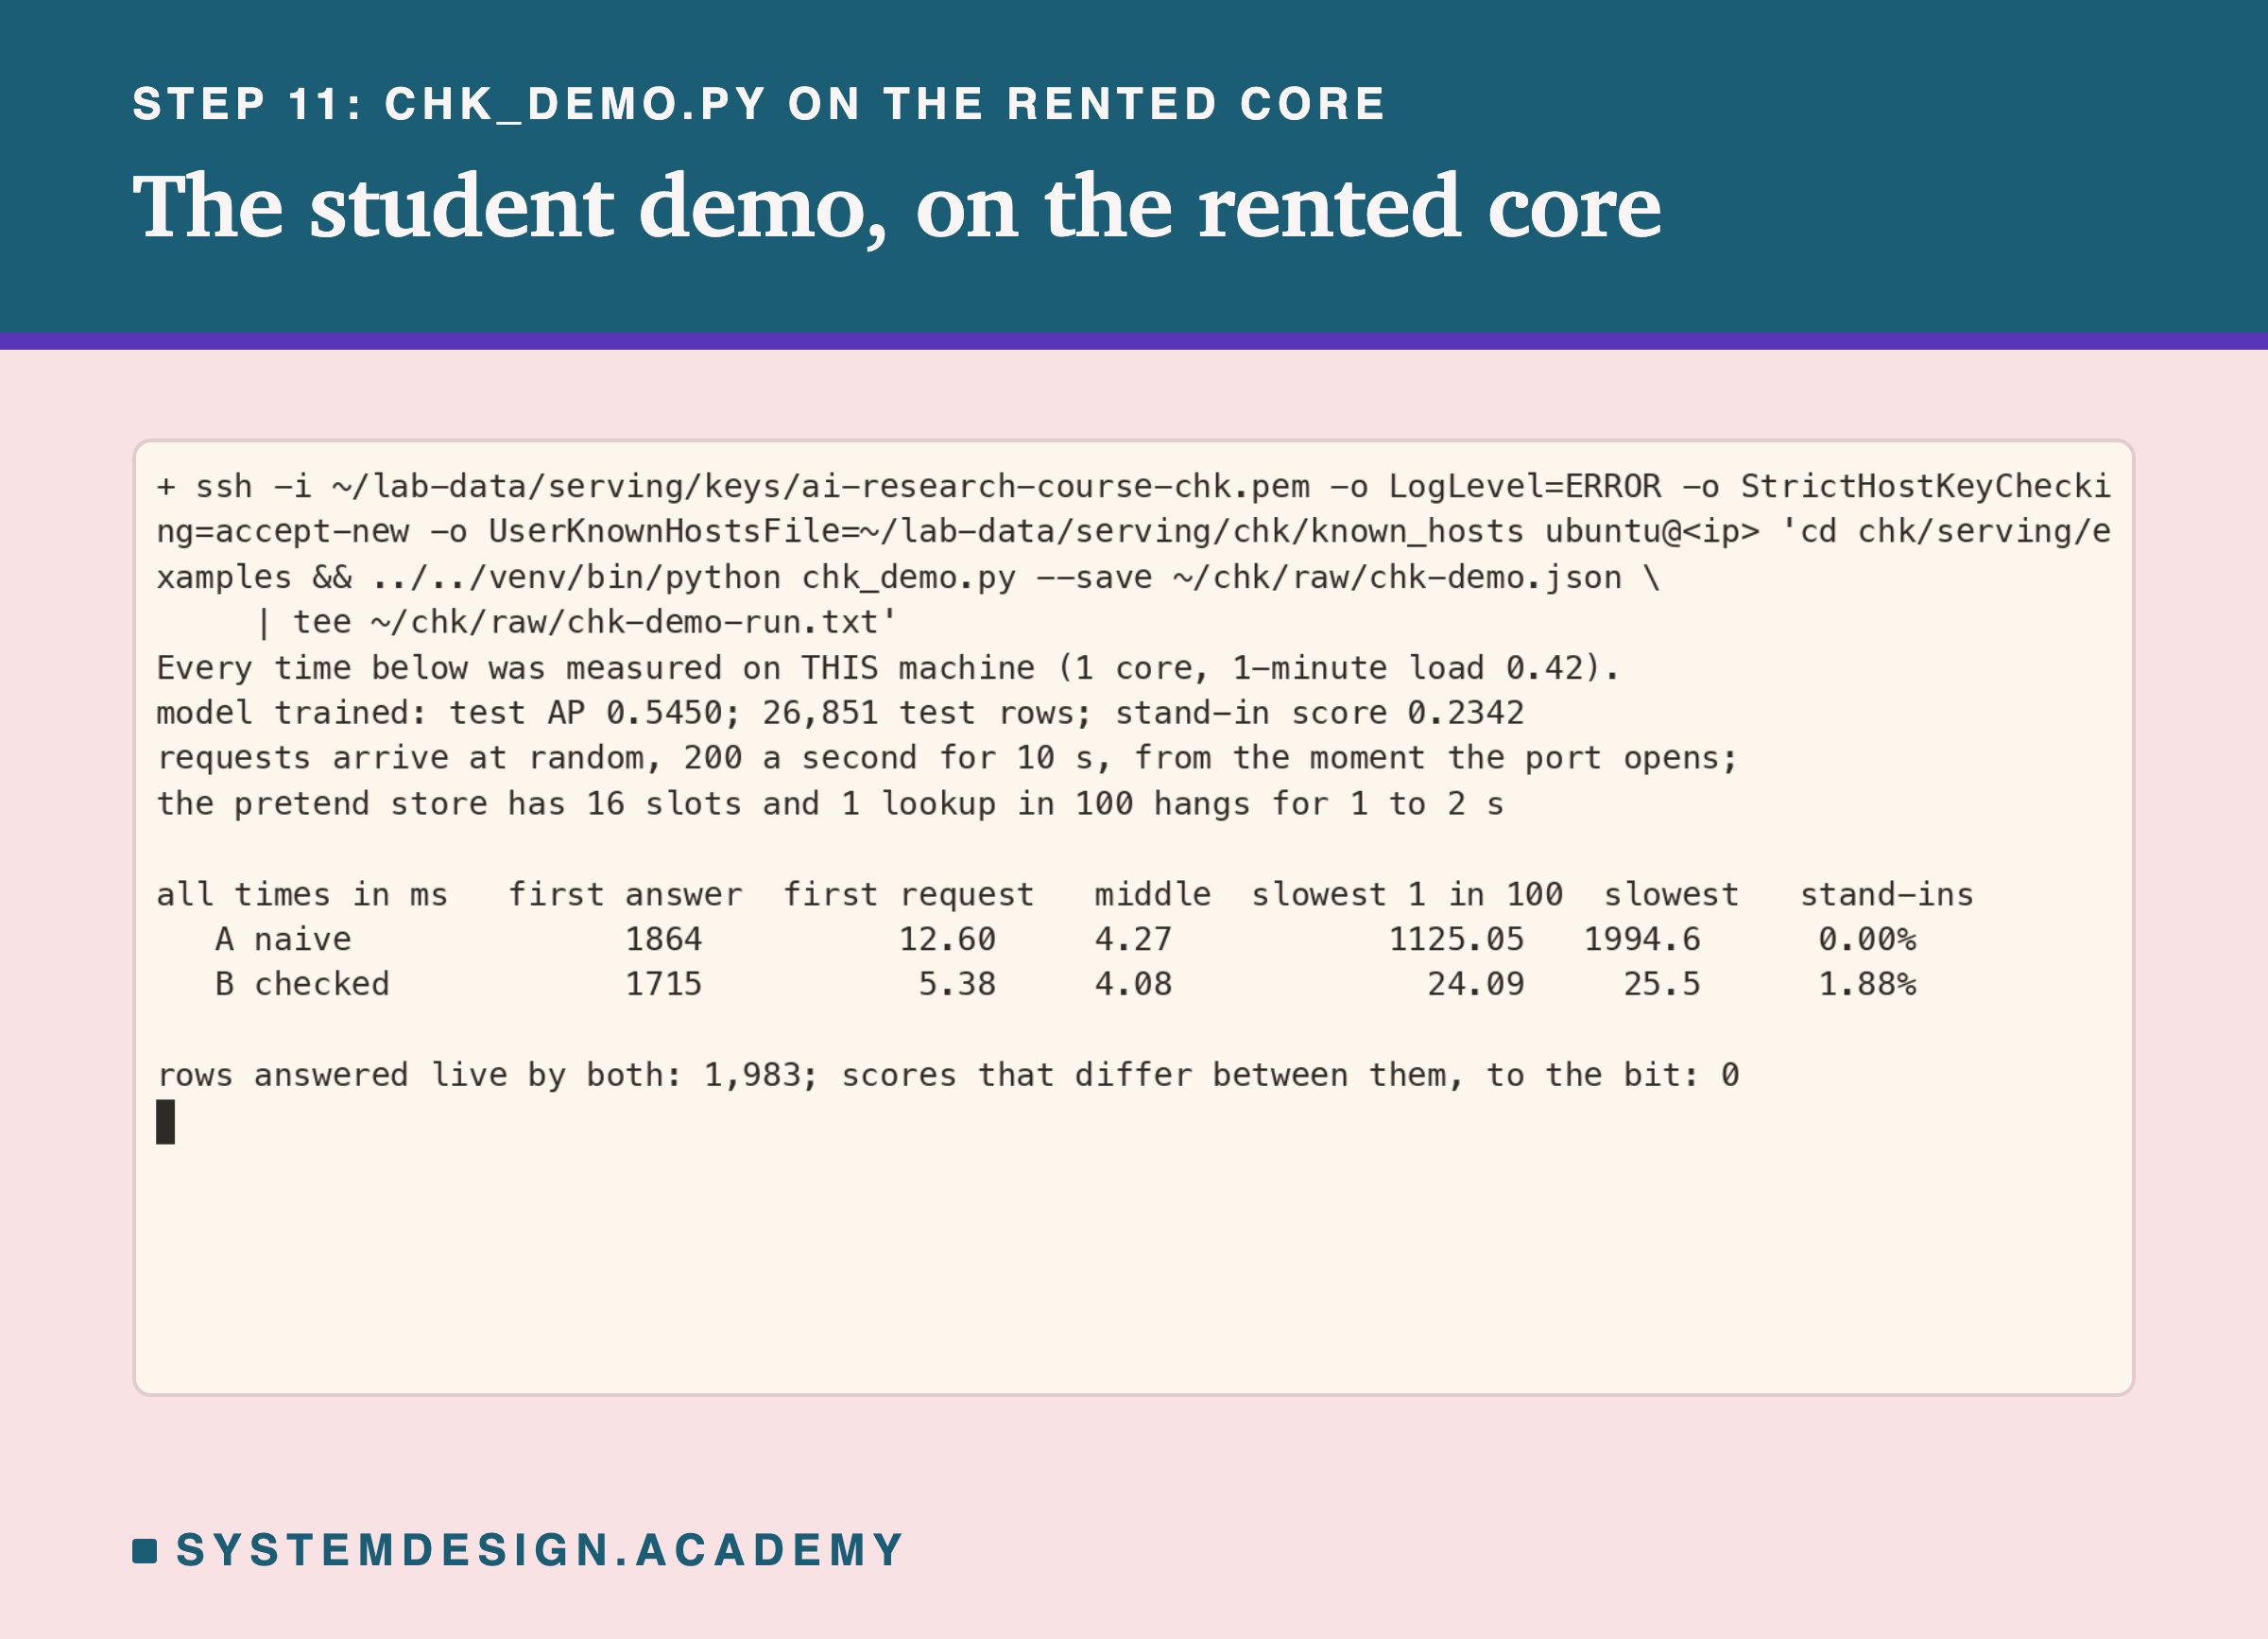
This exact run is stored in results/chk-demo-run.txt:
  ssh -i ~/lab-data/serving/keys/ai-research-course-chk.pem "${SSHO[@]}" ubuntu@"$IP" \
    'cd chk/serving/examples && ../../venv/bin/python chk_demo.py --save ~/chk/raw/chk-demo.json \
     | tee ~/chk/raw/chk-demo-run.txt'
Step 12 brings the results home before anything is deleted. A whole box of results was lost once in this chapter, because it was deleted before anyone copied them.
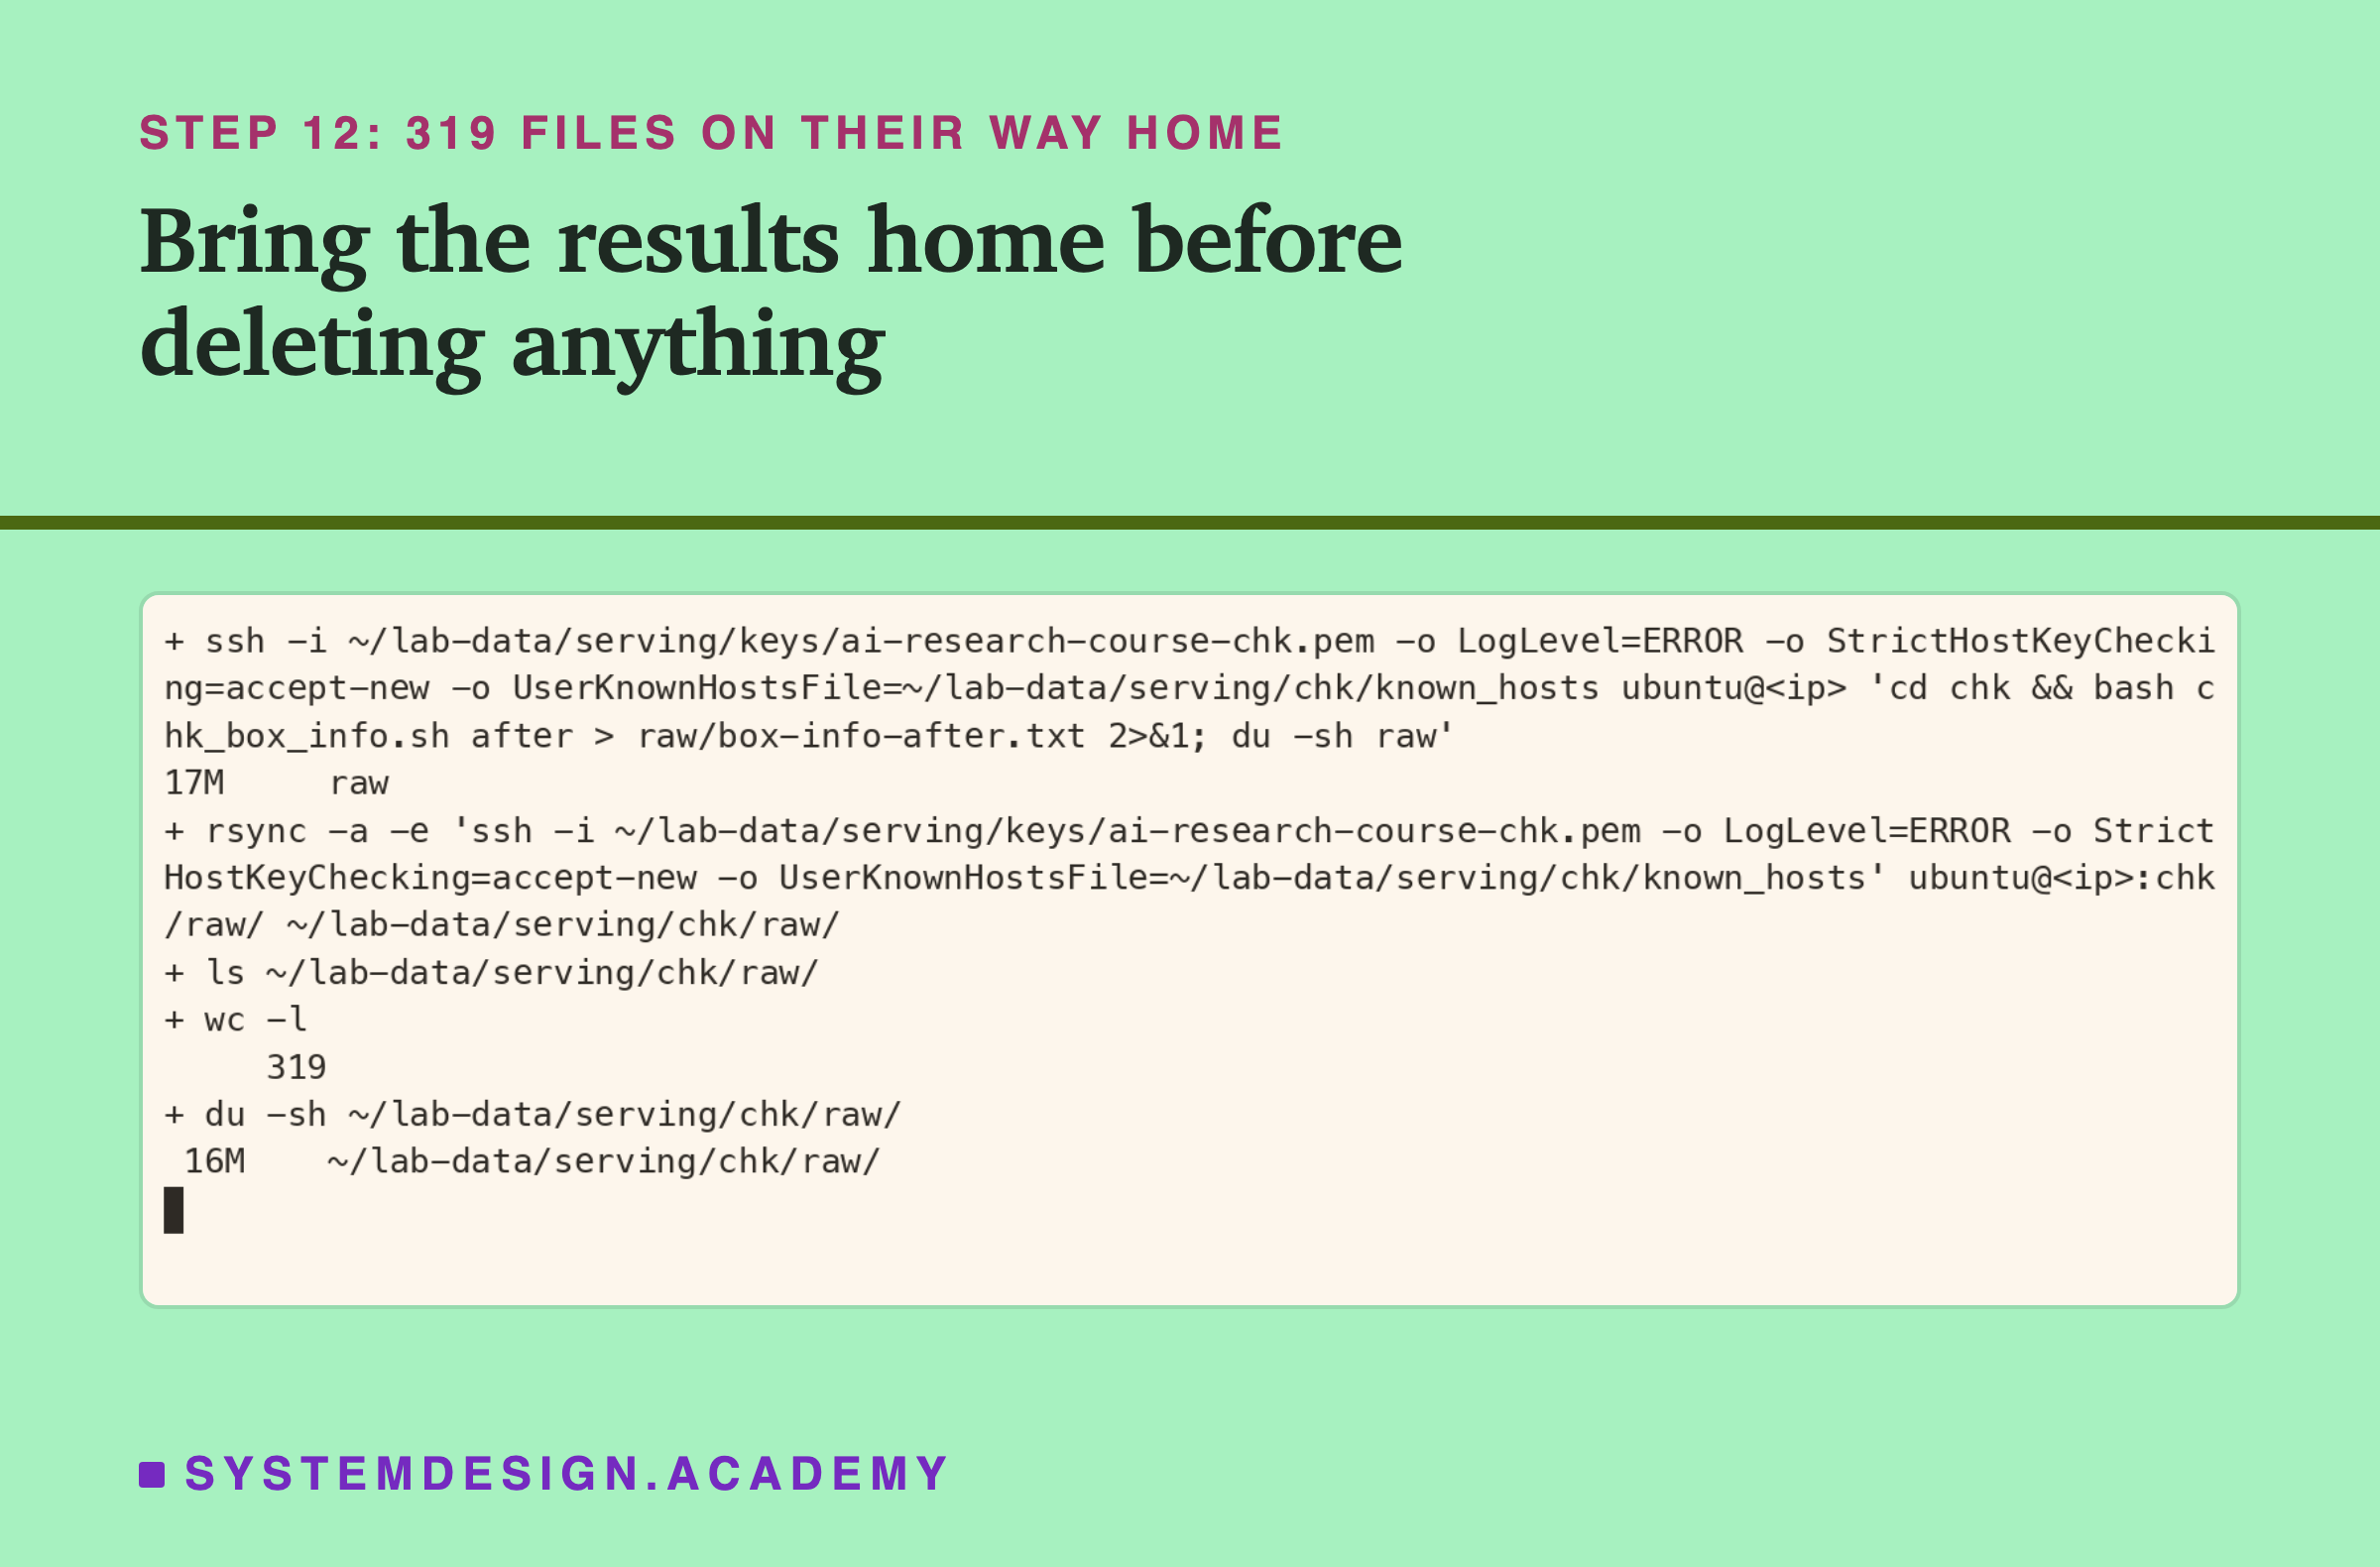
The box's raw folder held 17 MB, and 319 files arrived:
  ssh -i ~/lab-data/serving/keys/ai-research-course-chk.pem "${SSHO[@]}" ubuntu@"$IP" \
    'cd chk && bash chk_box_info.sh after > raw/box-info-after.txt 2>&1; du -sh raw'
  rsync -a -e "ssh -i $KEY ${SSHO[*]}" ubuntu@"$IP":chk/raw/ "$STATE/raw/"
  ls "$STATE/raw/" | wc -l
  du -sh "$STATE/raw/"
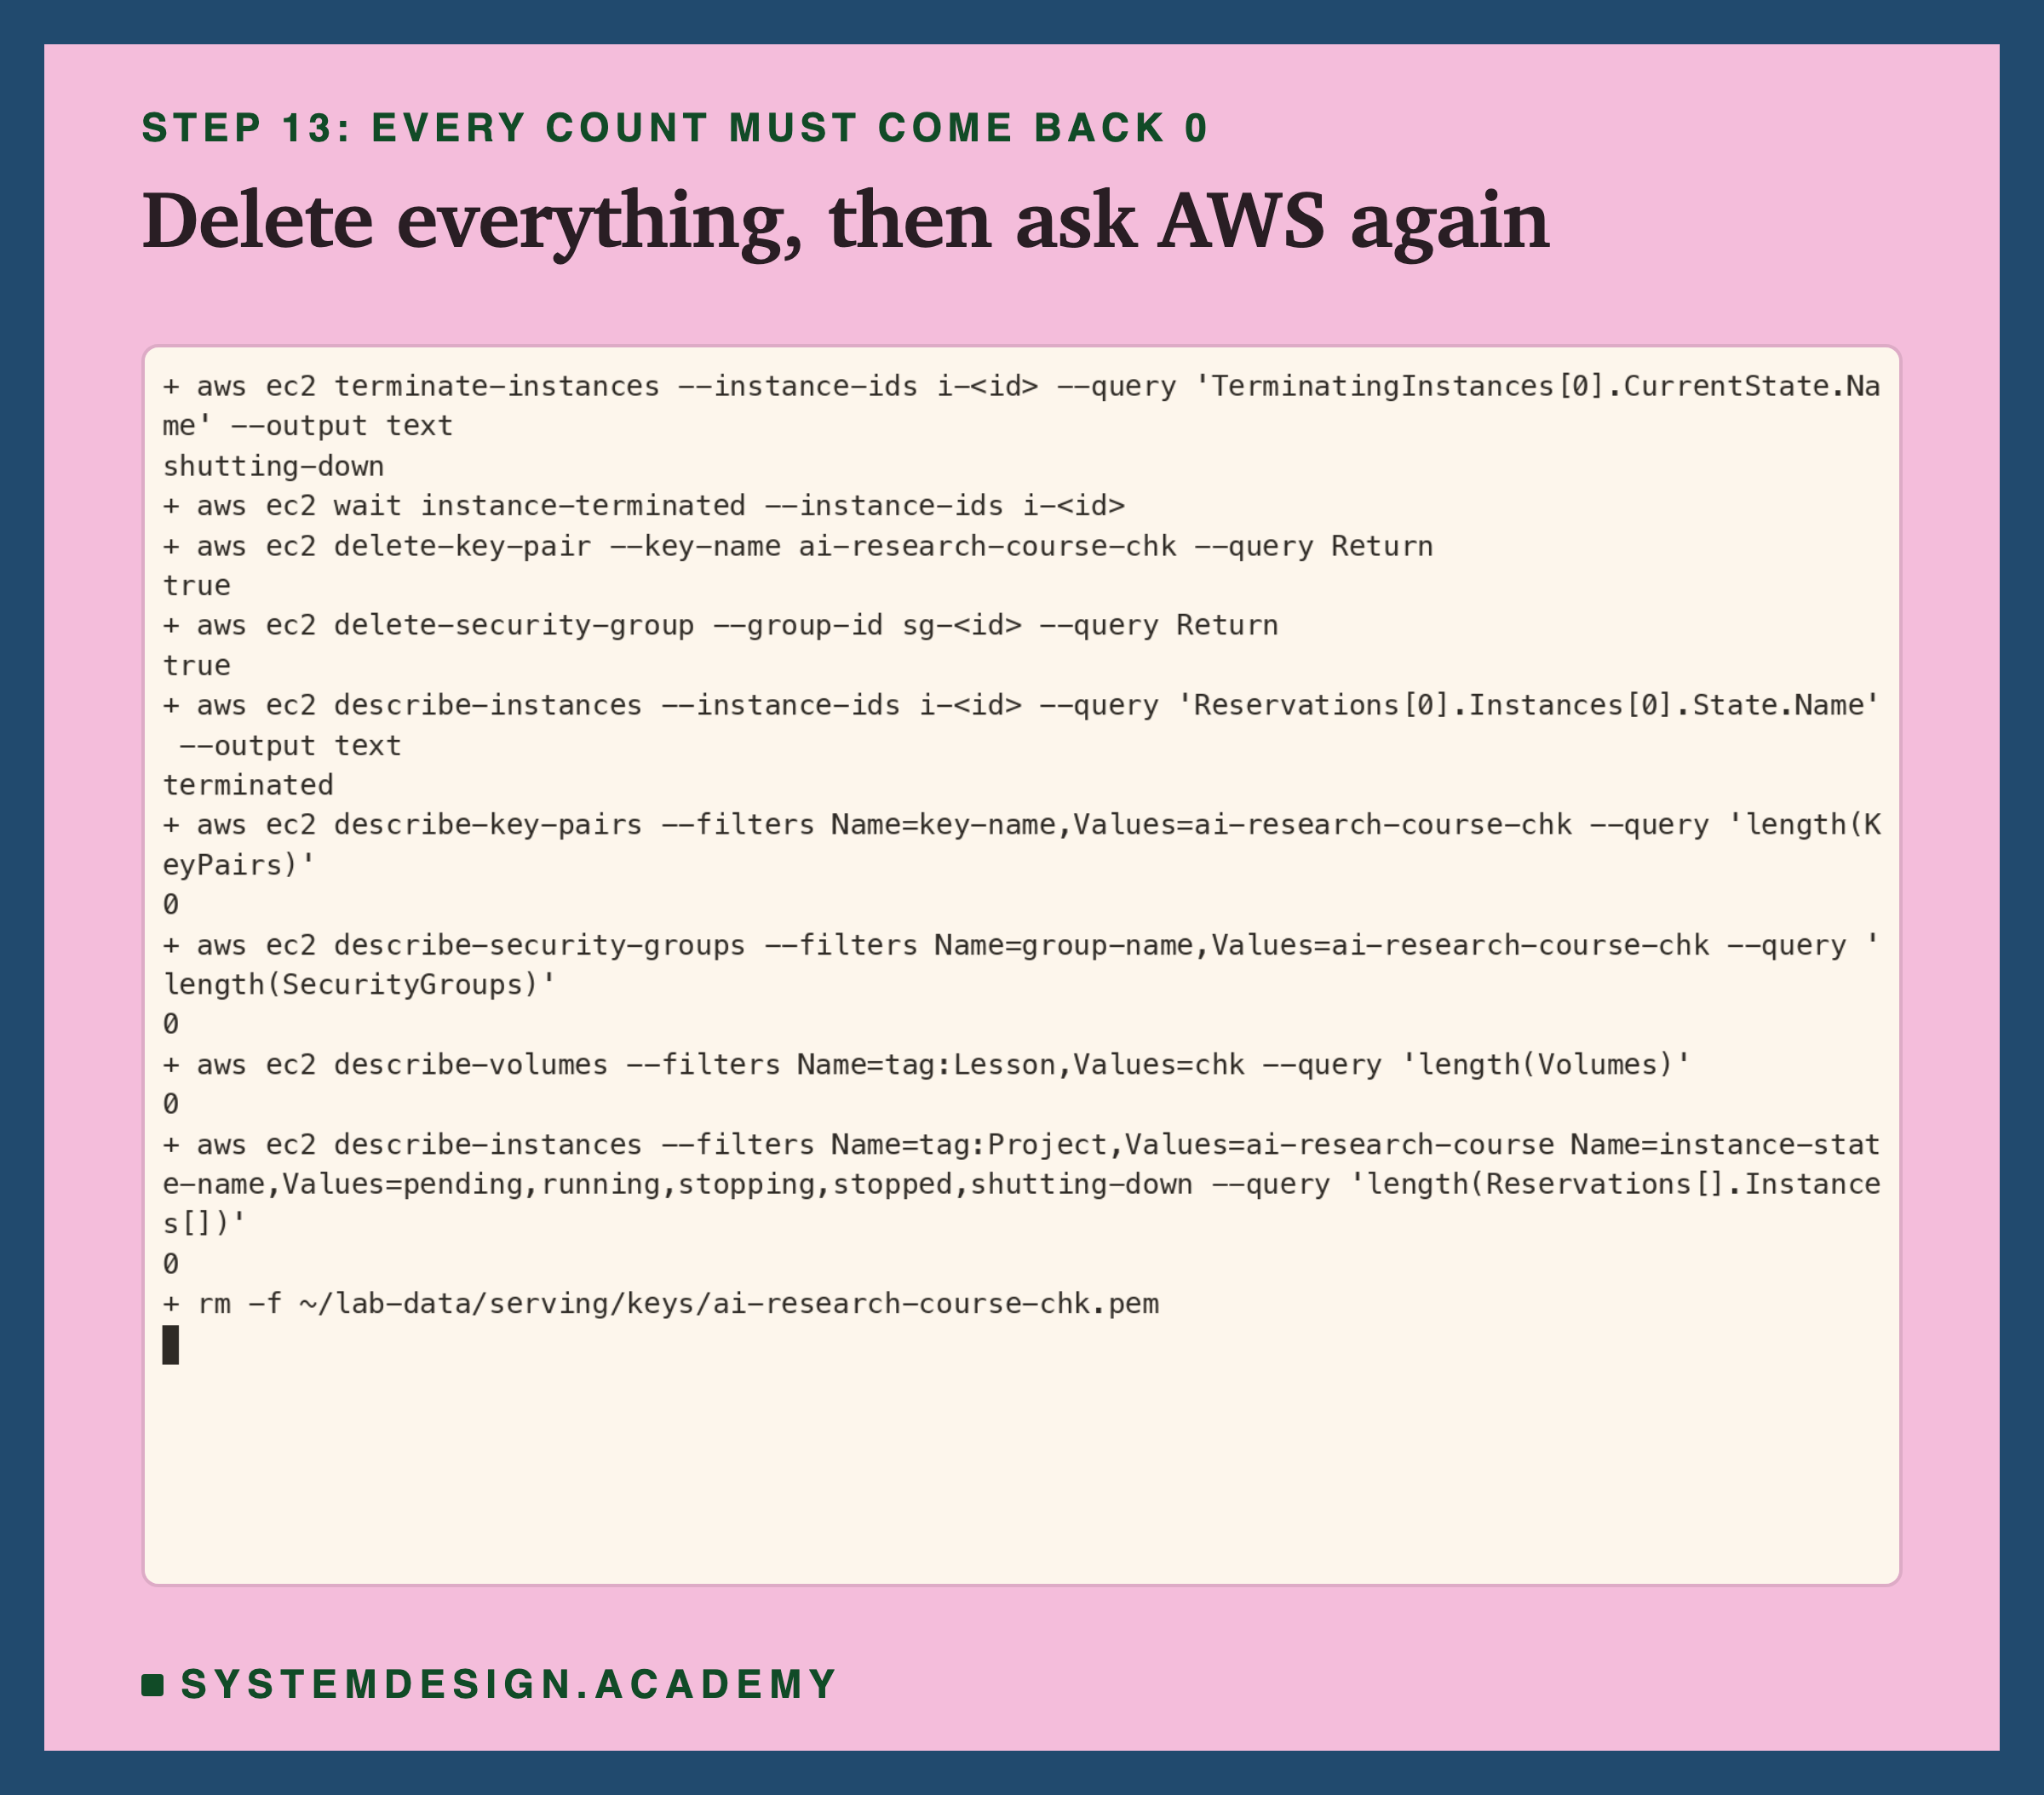
Step 13 deletes the machine, the key and the door rule, and checks. A machine you forget keeps costing money. The script deletes the machine, waits until AWS says "terminated", then deletes the key pair and the security group, and asks AWS again.
The Lab's Report, Running
The report script, chk_report.py, ran on my laptop, but it measures nothing. It reads the raw files the box wrote and does all the arithmetic again with its own code.
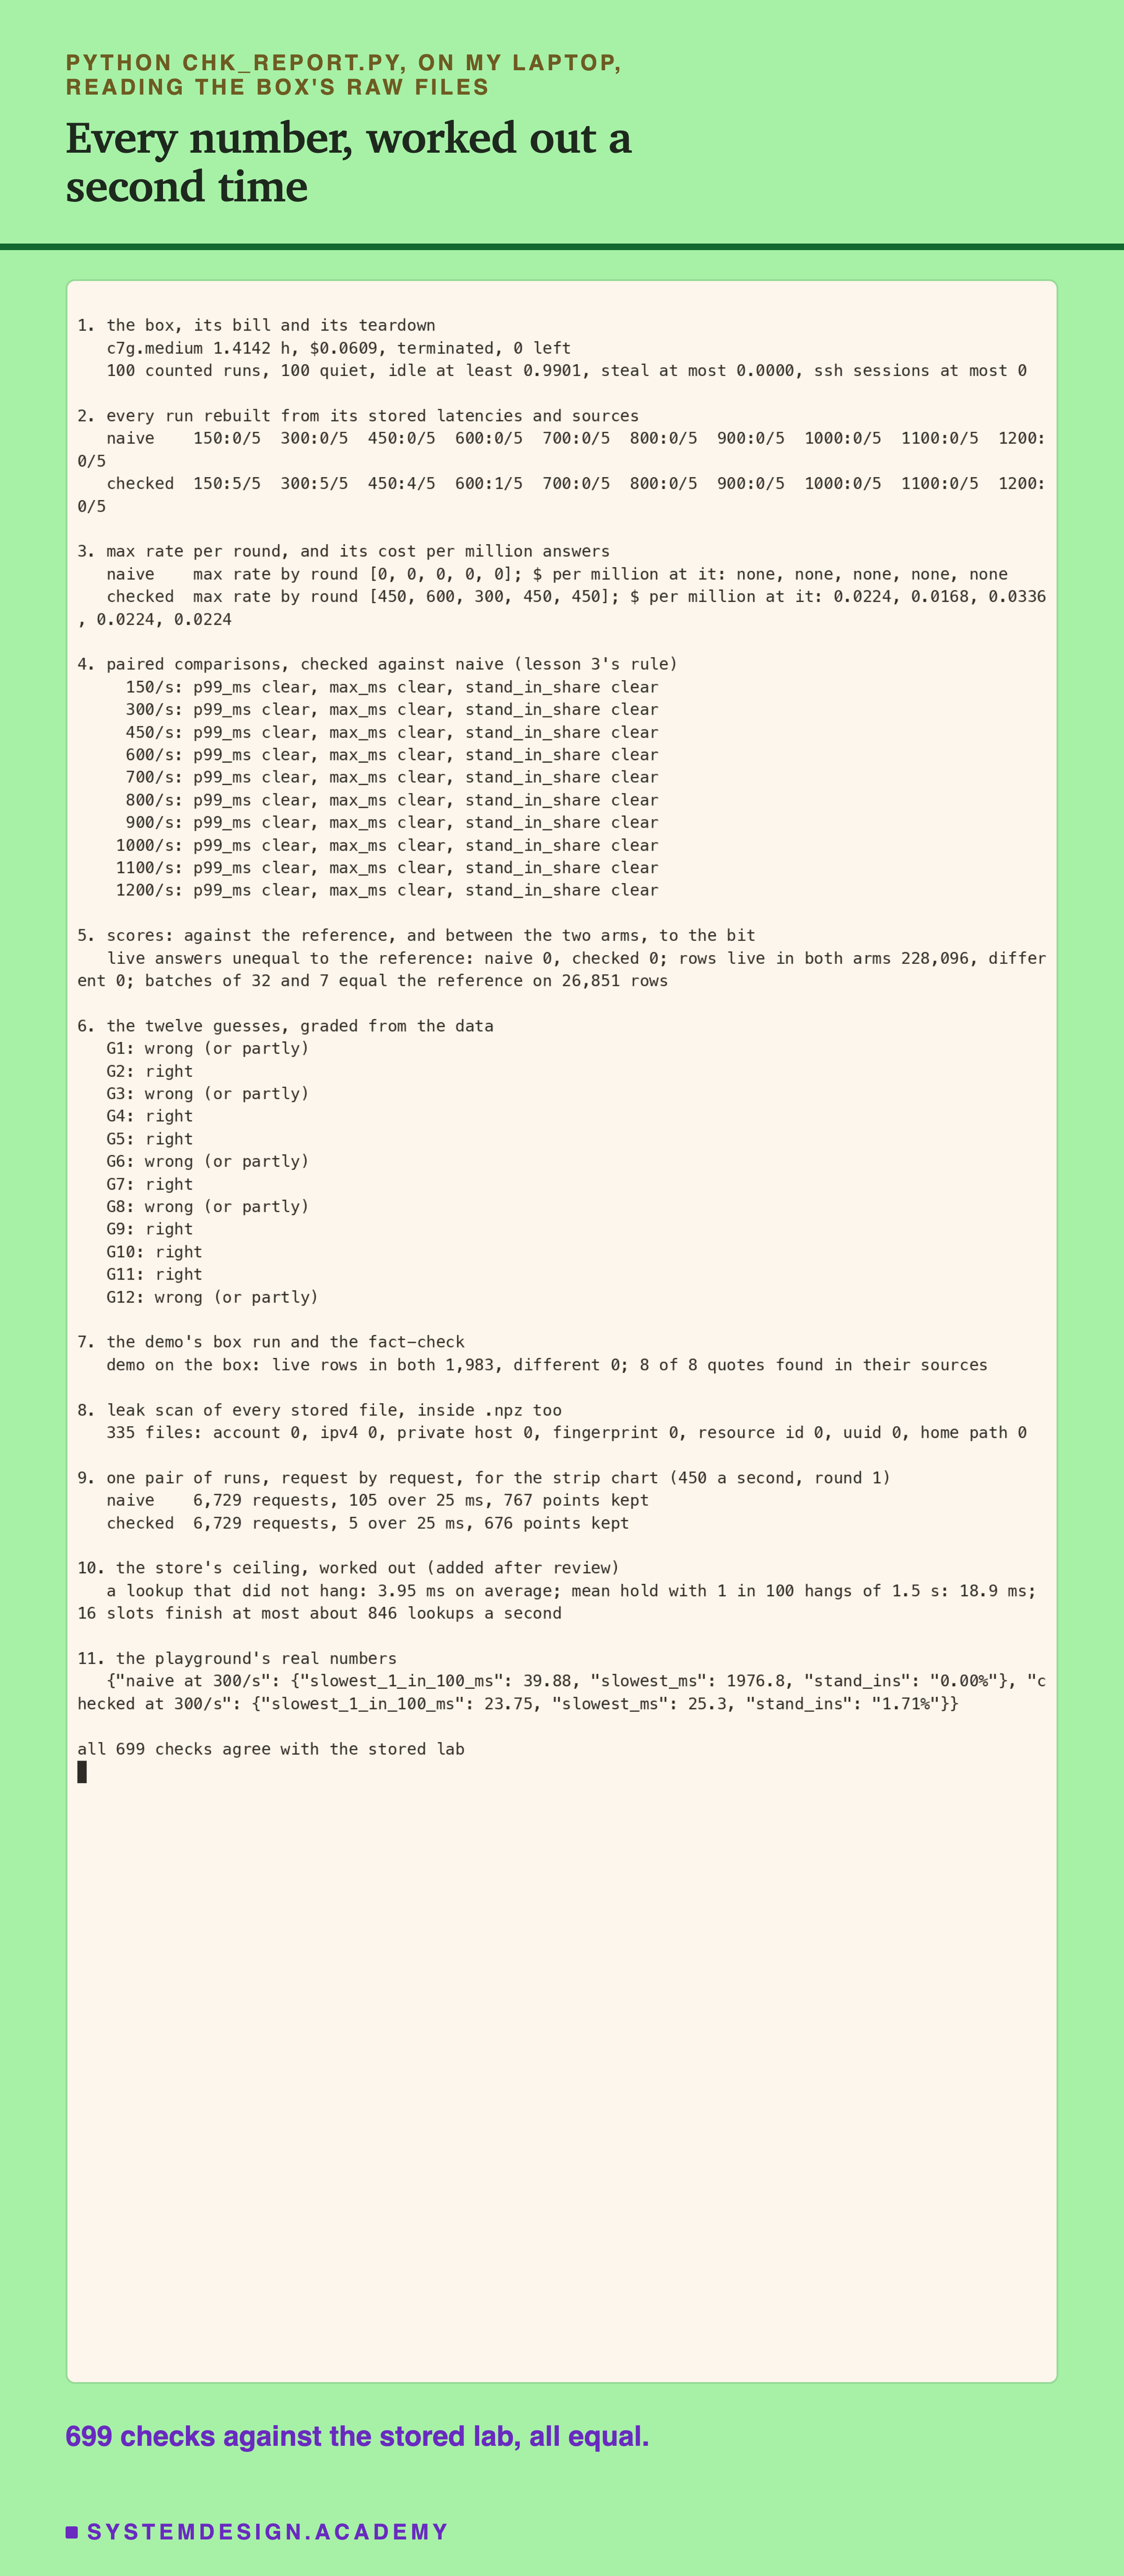
It does not import the lab. For every run it works out the slowest 1 in 100 again from the stored waiting time of every request. It redoes each pass or fail, each max rate, each cost per million, each "clearly different" verdict and each guess. Then it compares every one with the lab's results file. If any number disagreed, it would stop with an error. I tried that: I changed one stored wait by a thousandth of a millisecond, the report printed "1 MISMATCHES" and stopped, and I put the file back.
Section 8 scans every stored file, even the text inside the compressed .npz data files and the terminal recordings. It looks for my account number, IP addresses, the machine's network name, AWS ids, key fingerprints (the short codes that identify keys), request ids and my home folder. It found 0 of each. Section 10 works out the store's ceiling, which a later slide uses.
The Slowest 1 in 100, Rate by Rate
This chart puts every rate side by side. Each step up the side is ten times the last: 1, 10, 100, 1,000 ms.
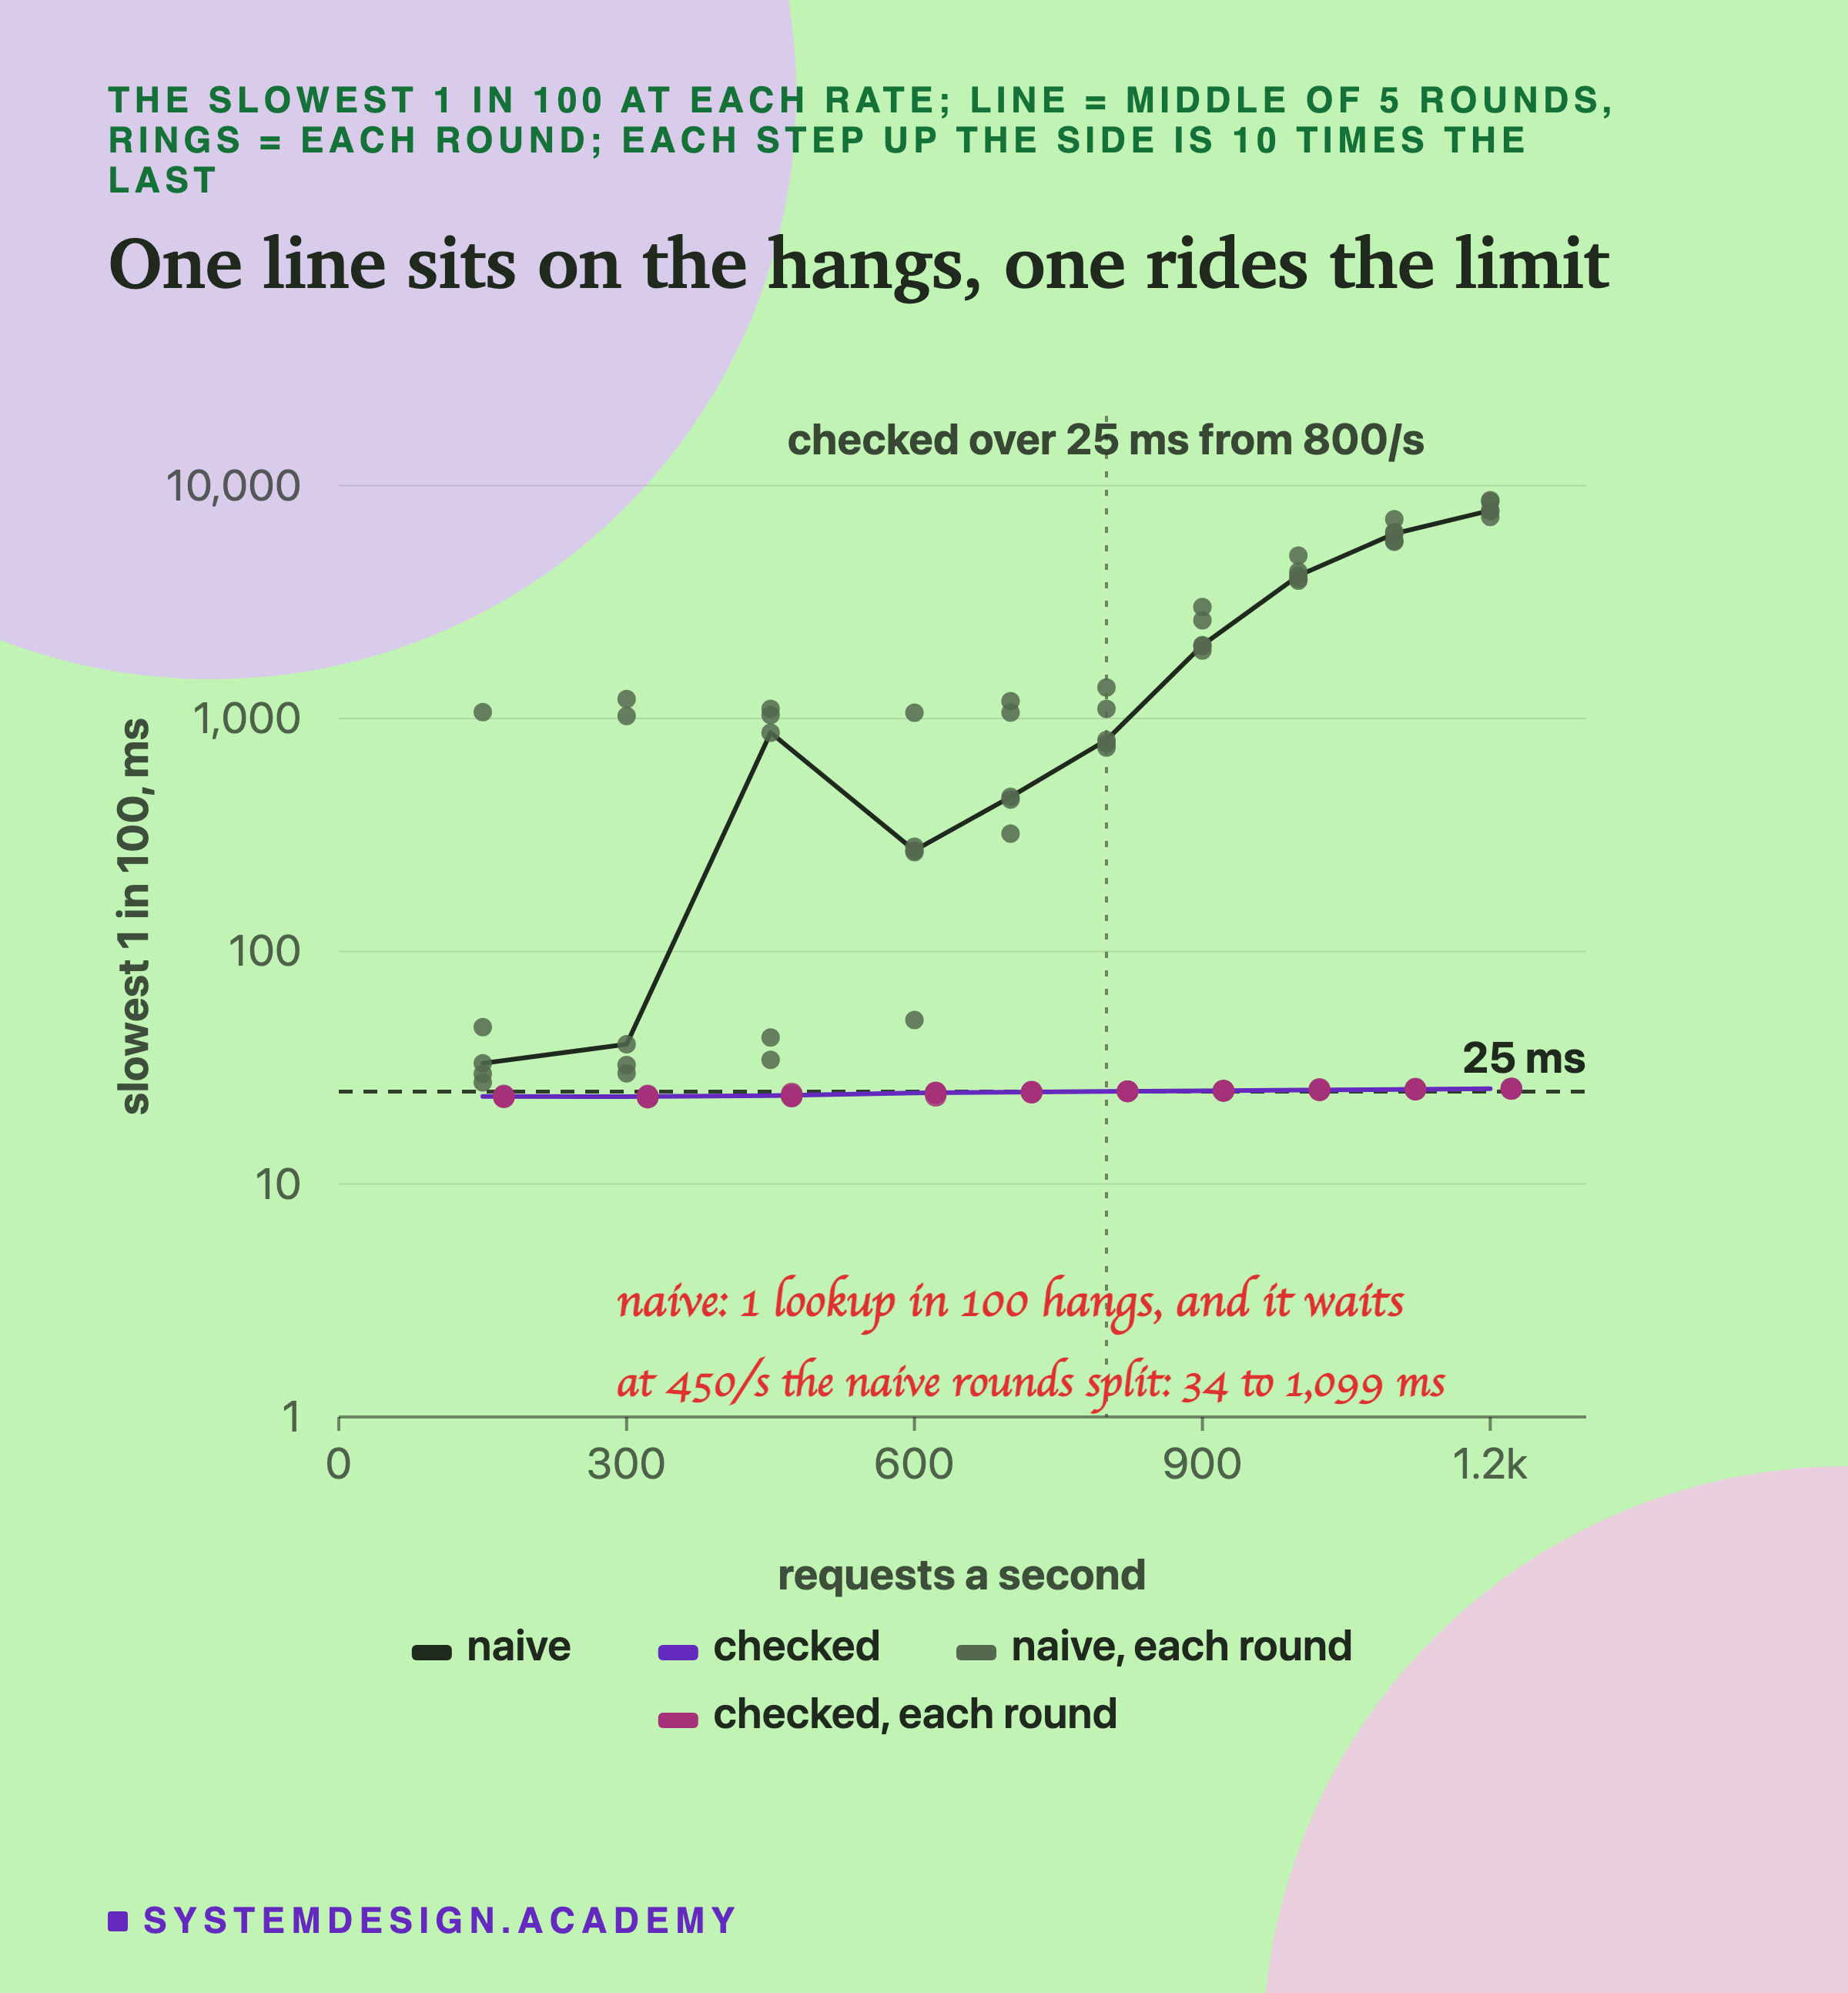
The checked service's line lies almost flat near 25 ms. In the middle rounds it went from 23.8 ms at 150 requests a second to 24.9 ms at 700. Most of that flatness is built in. The service gives up on a lookup when its 25 ms, minus 2 ms for scoring, runs out. So its slowest answers had to sit just under 25 ms.
From 800 a second, though, it crept just over the line: 25.05 ms at 800 and 25.7 ms at 1,200. That part was not fixed by the design. The limit starts when the service starts on a request, and at high rates requests waited a little before the service got to them. Python's own manual also warns that a timed wait can run a little past its limit.
The naive service's line jumps around, and then climbs. At 150 and 300 a second its slowest 1 in 100 was mostly between 27 and 47 ms, but in some rounds it passed 1 second. The reason is the helper. About 1 lookup in 100 hangs, and about 0.6 more in 100 are only slow, so about 1.6 answers in 100 are slow by design. The slowest 1 in 100 sits right on the edge of that group, and in some runs it landed inside the hangs.
At 450 a second the middle round's 869 ms is not a real wait. In that round the slowest 1 in 100 fell between a 67 ms request and a 1,011 ms one, and the arithmetic drew a straight line between them. Two rounds at 450 gave 34 and 43 ms, and three gave 869 to 1,099 ms.
At 600 a second the middle dips to 271 ms, and this time the wait is real. The store's line had begun to form: in 4 of 5 rounds, between 10.6% and 16.9% of naive lookups took over 23 ms. Above that the naive line climbs because the one core filled up. It was about 90% busy, with the service alone using about 73%. At 1,200 a second the slowest 1 in 100 took 7,833 ms, nearly 8 seconds.
Every paired comparison here was clearly different. But below 600 a second that is mostly built in: the checked service stops waiting at 23 ms, and the naive one cannot stop.
Fifteen Seconds, Request by Request
The chart above shows one number per run. This one shows every request of one pair of runs, at 450 requests a second, in round 1. Both services met identical planned arrivals and identical slow lookups.
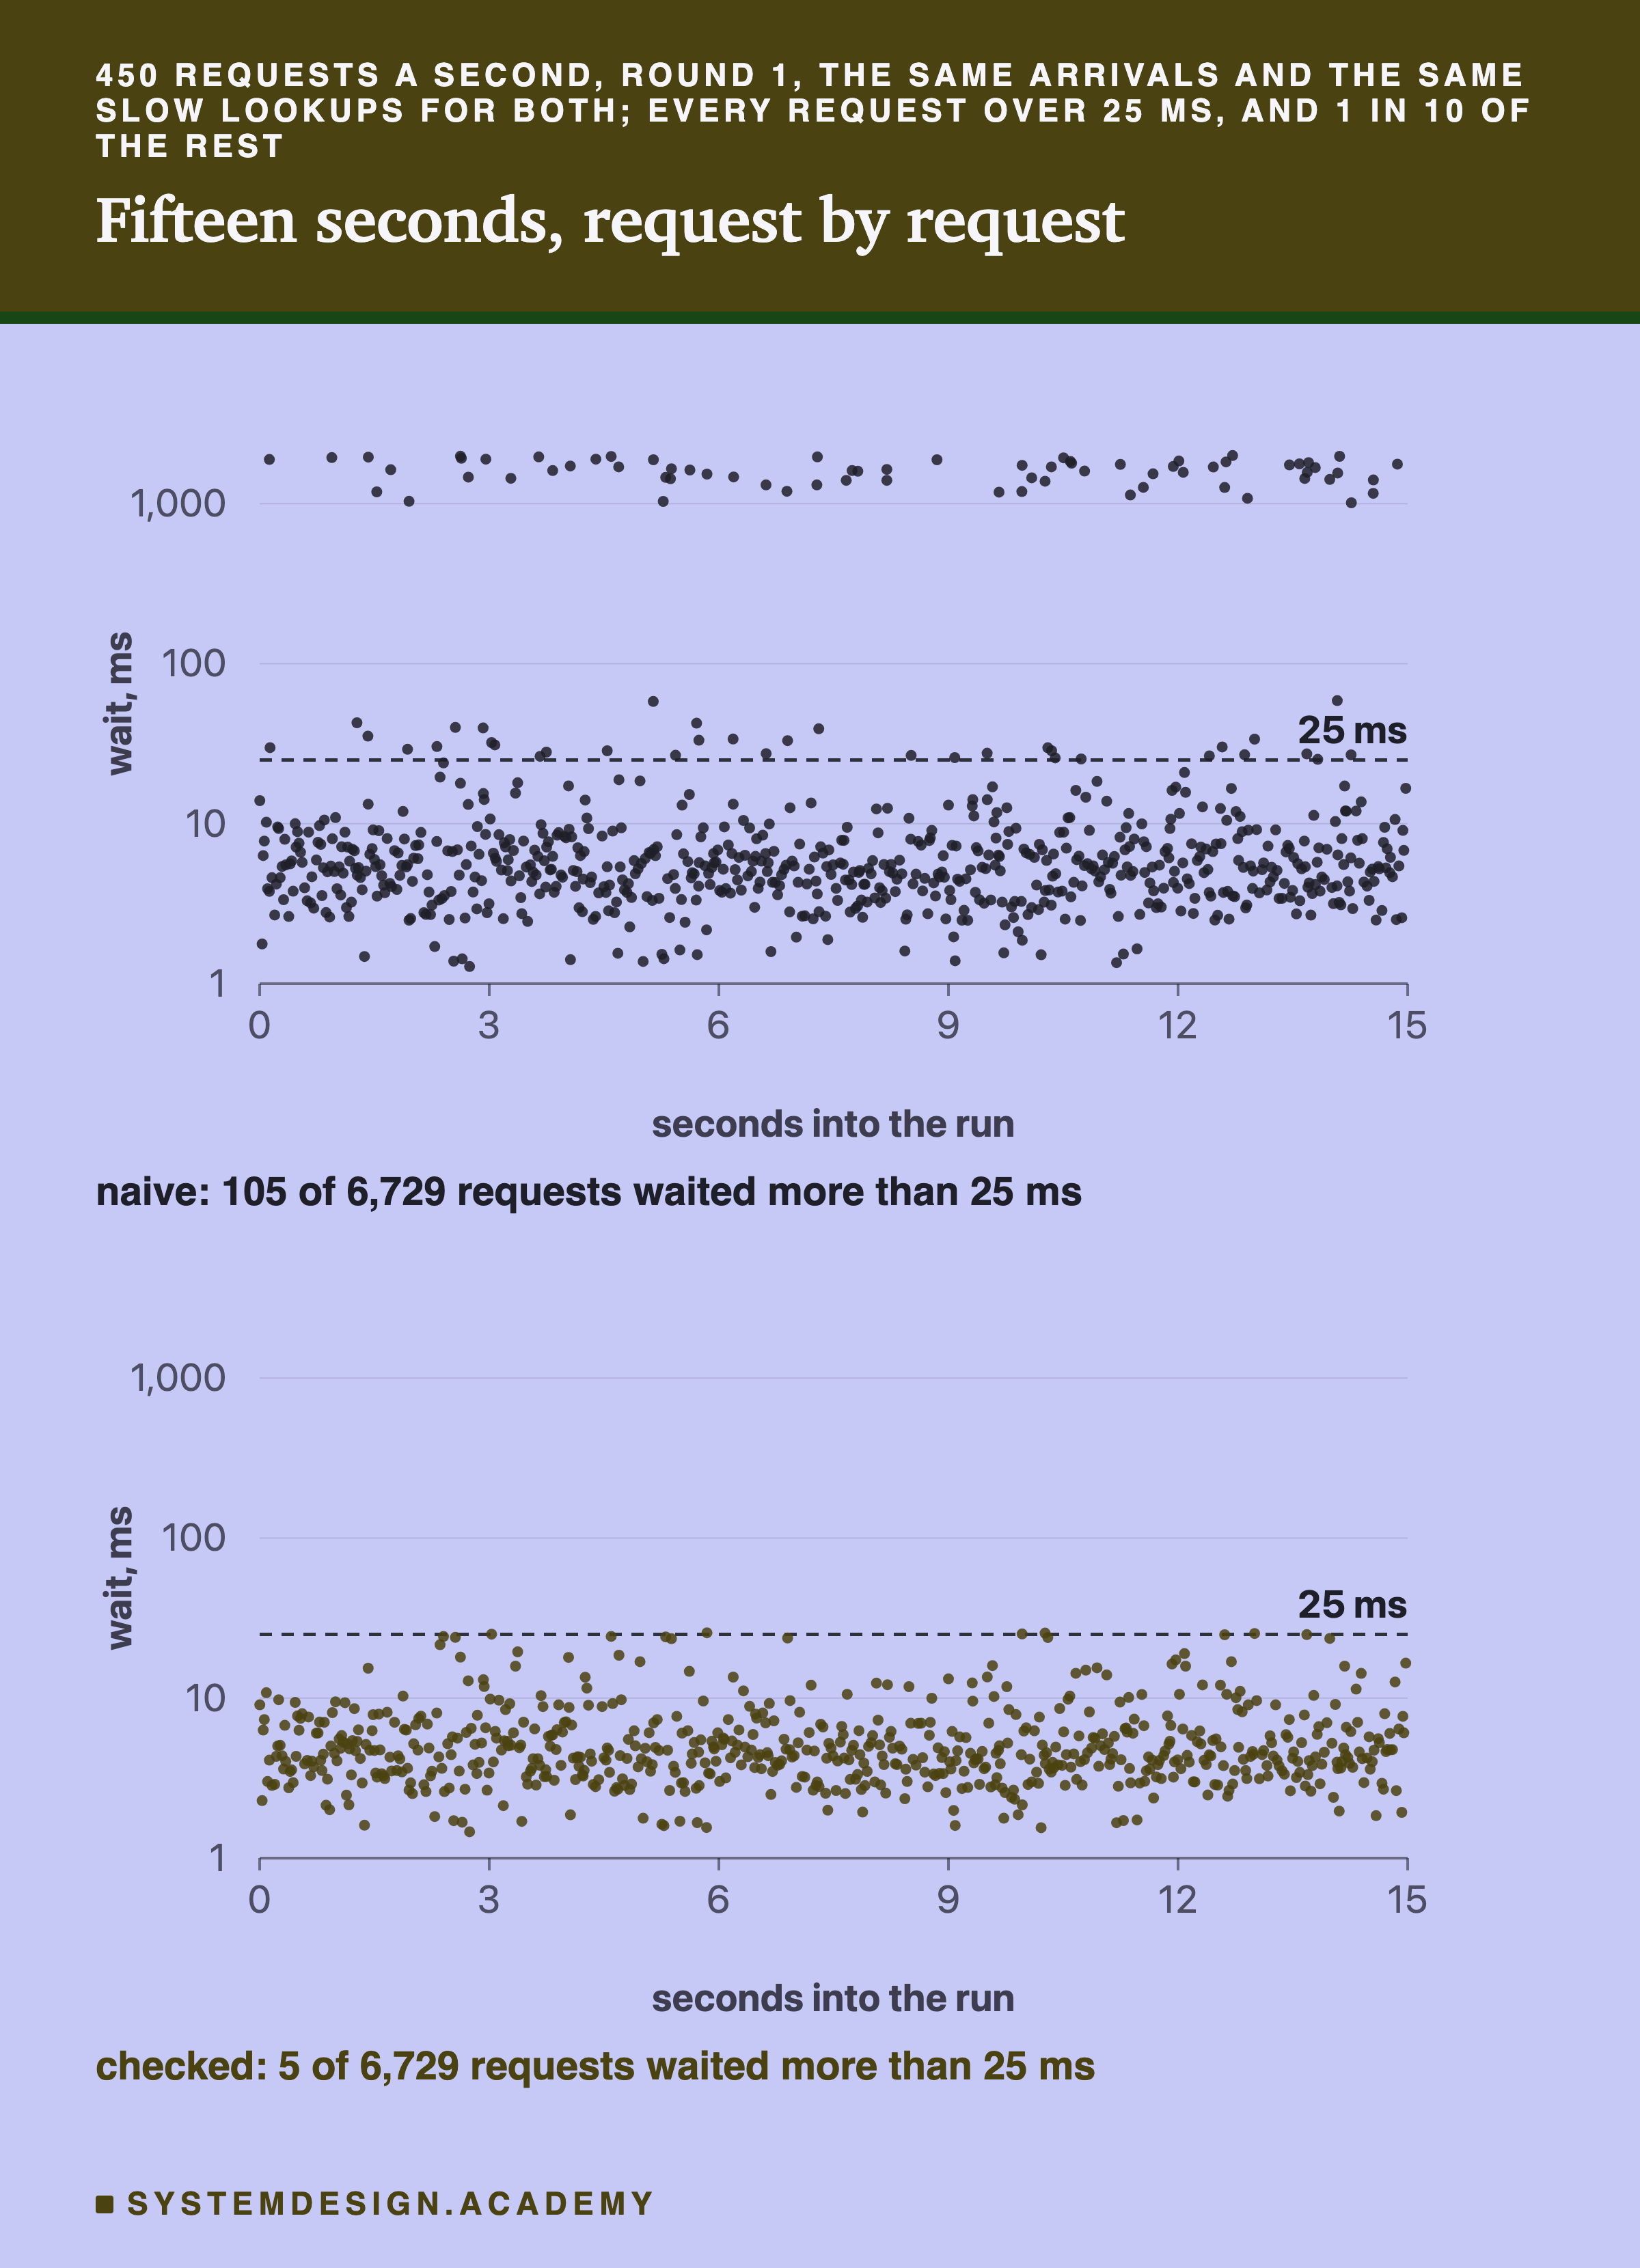
Each dot is one request, placed at the moment it was planned, at the height of its wait. I kept every request that waited more than 25 ms and 1 in 10 of the rest, so the picture is not a solid smear.
The top picture has a ceiling of dots between 1,000 and 2,000 ms. Those are the hung lookups, spread across the whole run. Below them sits a scatter between 25 and about 60 ms; the slowest of those took 58.8 ms. Most of these are lookups that were slow but did not hang: the store takes longer than usual now and then. In that run 110 naive lookups took over 23 ms by themselves, 70 of them hangs. The naive service had 105 of its 6,729 requests over 25 ms.
The bottom picture has no ceiling. The checked service never waited for a hung lookup; it gave up at its limit and answered last month's score. Only 5 of its 6,729 requests went over 25 ms, all of them just over the line.
Where the Checked Service Ran Out
If the checked service answers quickly, why did it stop passing above 450 a second? Because more and more of its answers were not live.
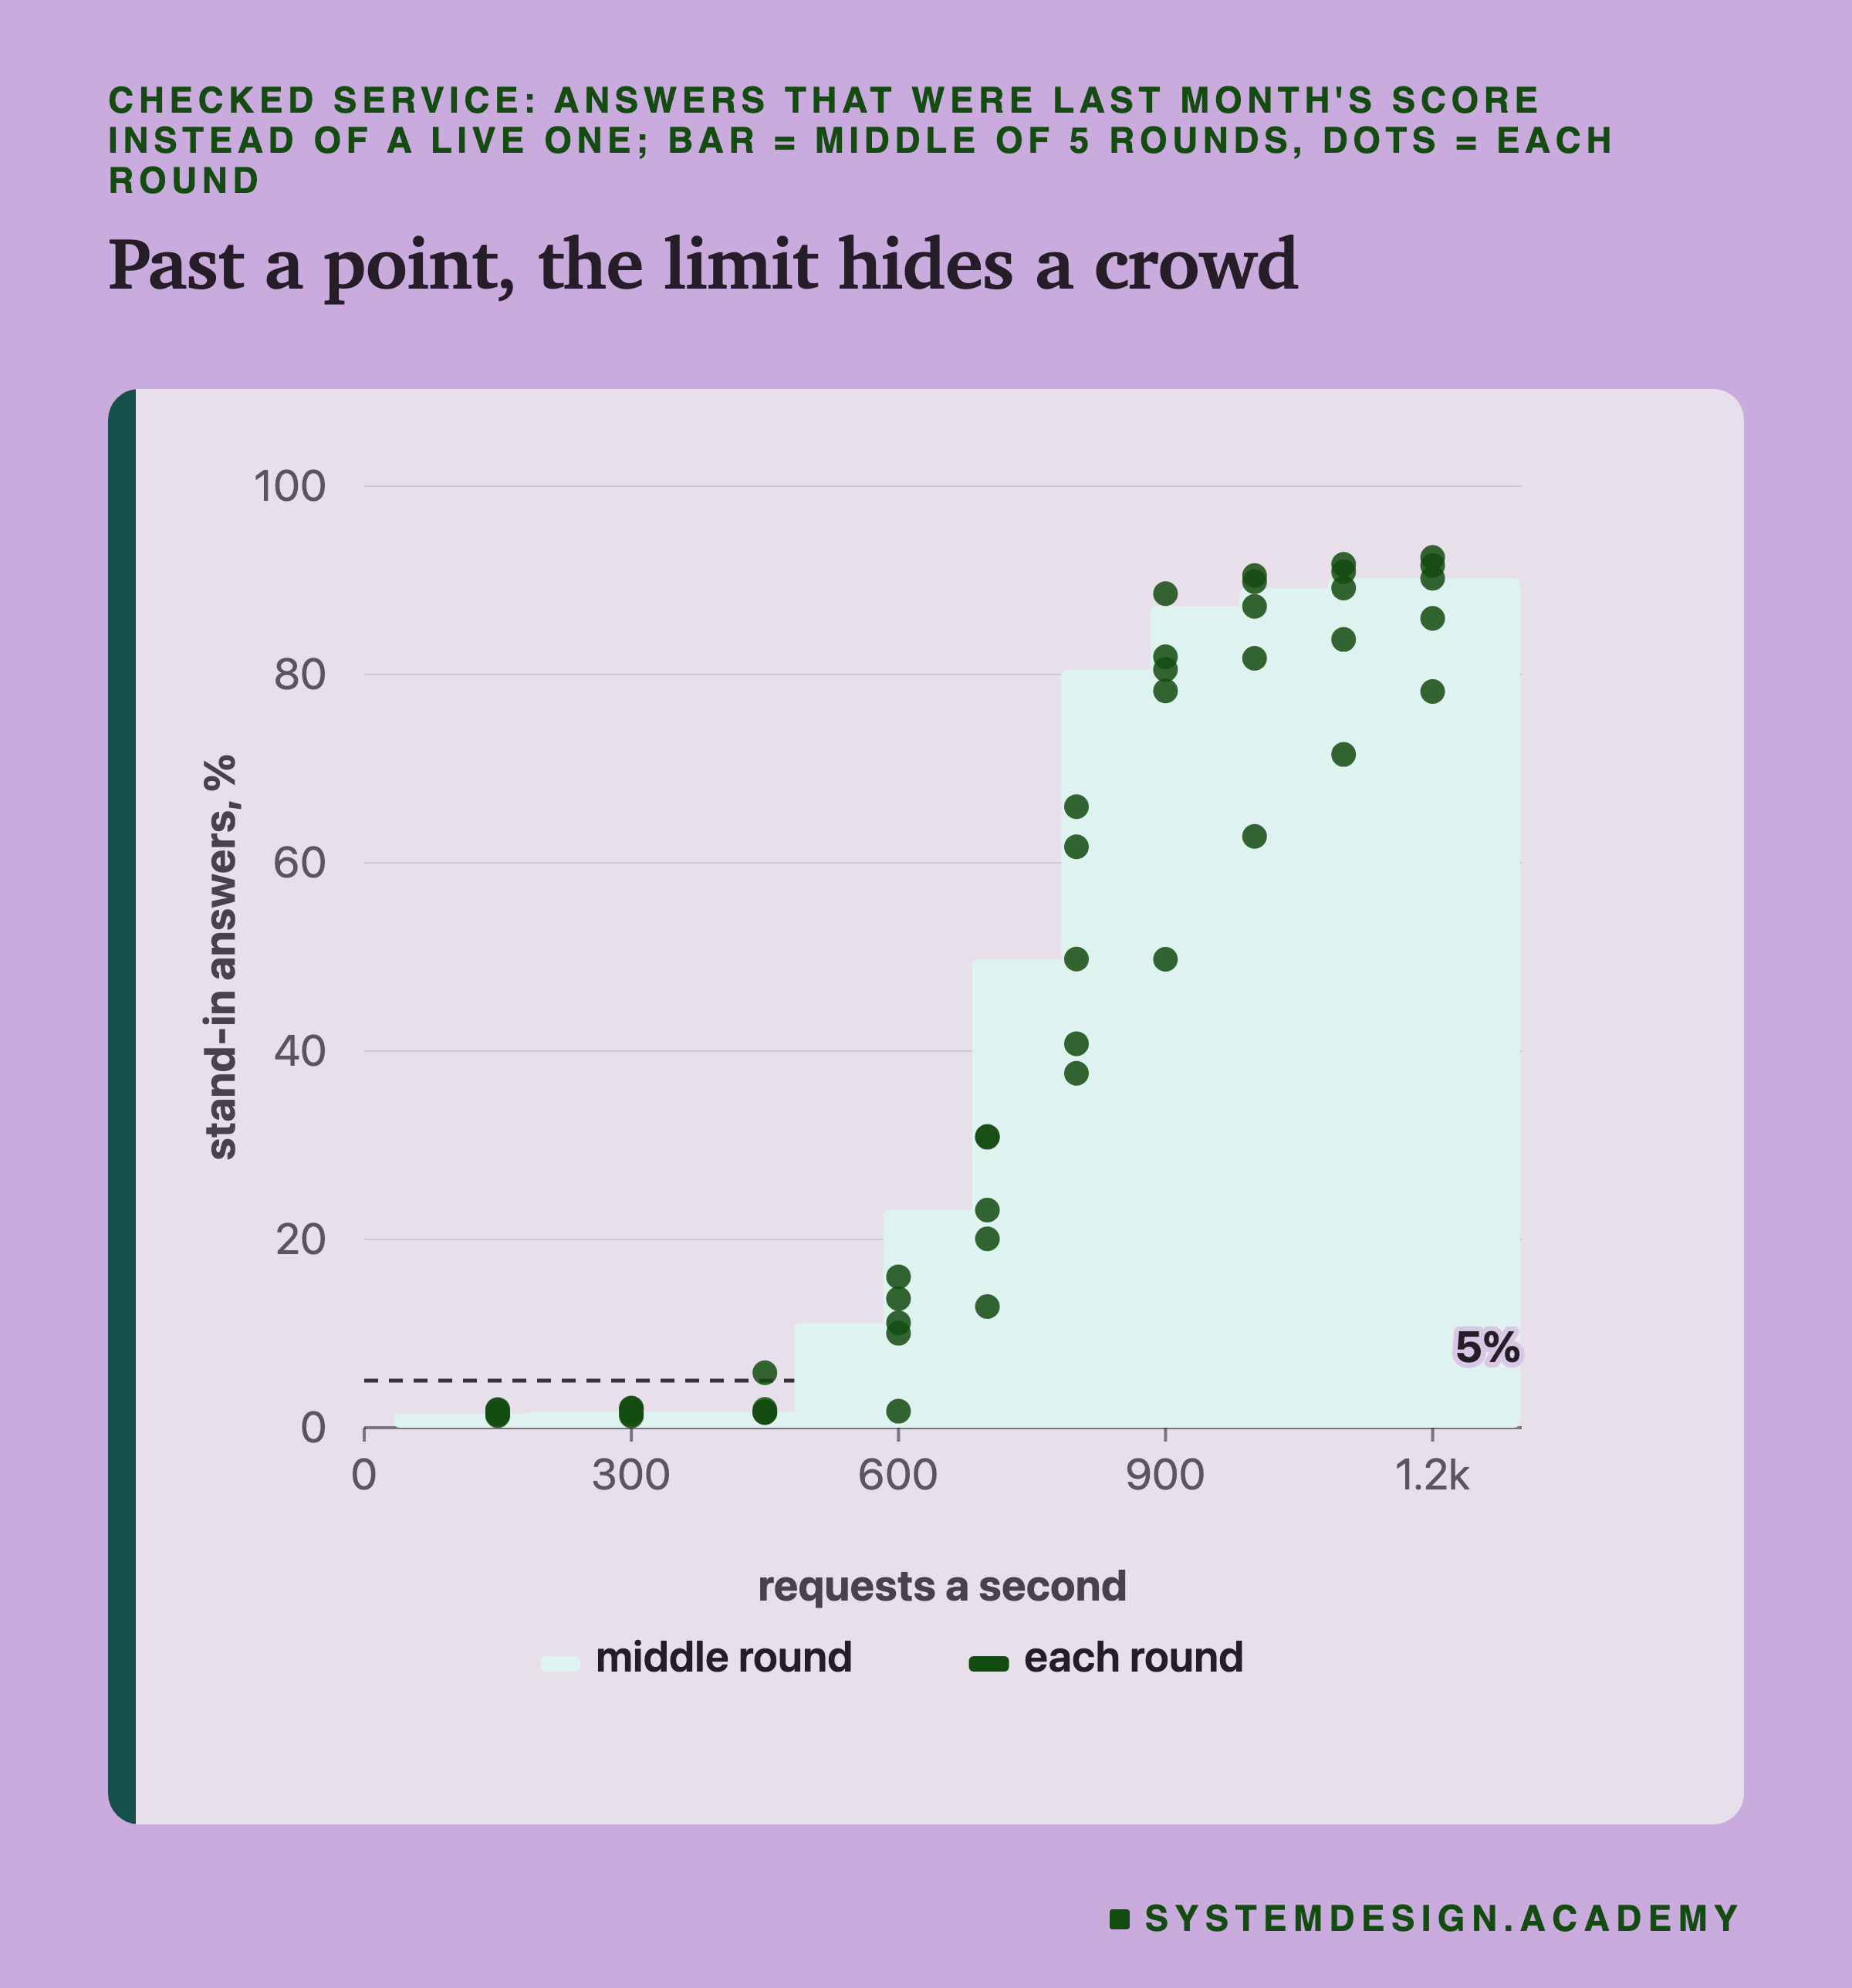
At 150 to 450 requests a second, about 1.5% to 1.7% of answers were stand-ins (middle rounds). That matches the naive service's own count of lookups over 23 ms, almost run for run. At 150 a second it was 33 stand-ins against 32 slow lookups, 29 against 27, 42 against 41, and so on. Below the store's limit, then, the stand-in share is simply the share of lookups the store makes slow. Lesson 9 measured 1.62% at 300 a second, and here it was 1.71%.
At 600 a second the stand-ins jumped to 11.1%, at 800 to 49.8%, and at 1,200 to 90.2%. One round at 450 a second also tipped: round 3 reached 5.84%, just over my 5% line, which is why that round's max rate was 300.
The store has a ceiling you can work out. A lookup that did not hang took 3.95 ms on average, measured on the naive service's clock at 150 a second. With 1 lookup in 100 holding its slot for about 1.5 seconds, the average lookup holds a slot about 18.9 ms. Sixteen slots divided by 18.9 ms is about 850 lookups a second. With random bunching, the slots start to fill well before that, and here the stand-ins took off between 600 and 800 a second.
Lesson 9 tested one more choice for exactly this case: passing the deadline down to the store, so the store drops work nobody waits for. That arm was not in this lesson's list, so I did not test it here. It is the first thing I would try next.
How High the Checked Service Climbed
Put the pass or fail results together and you get each service's max rate: the highest rate that passed, with every lower rate passing too.
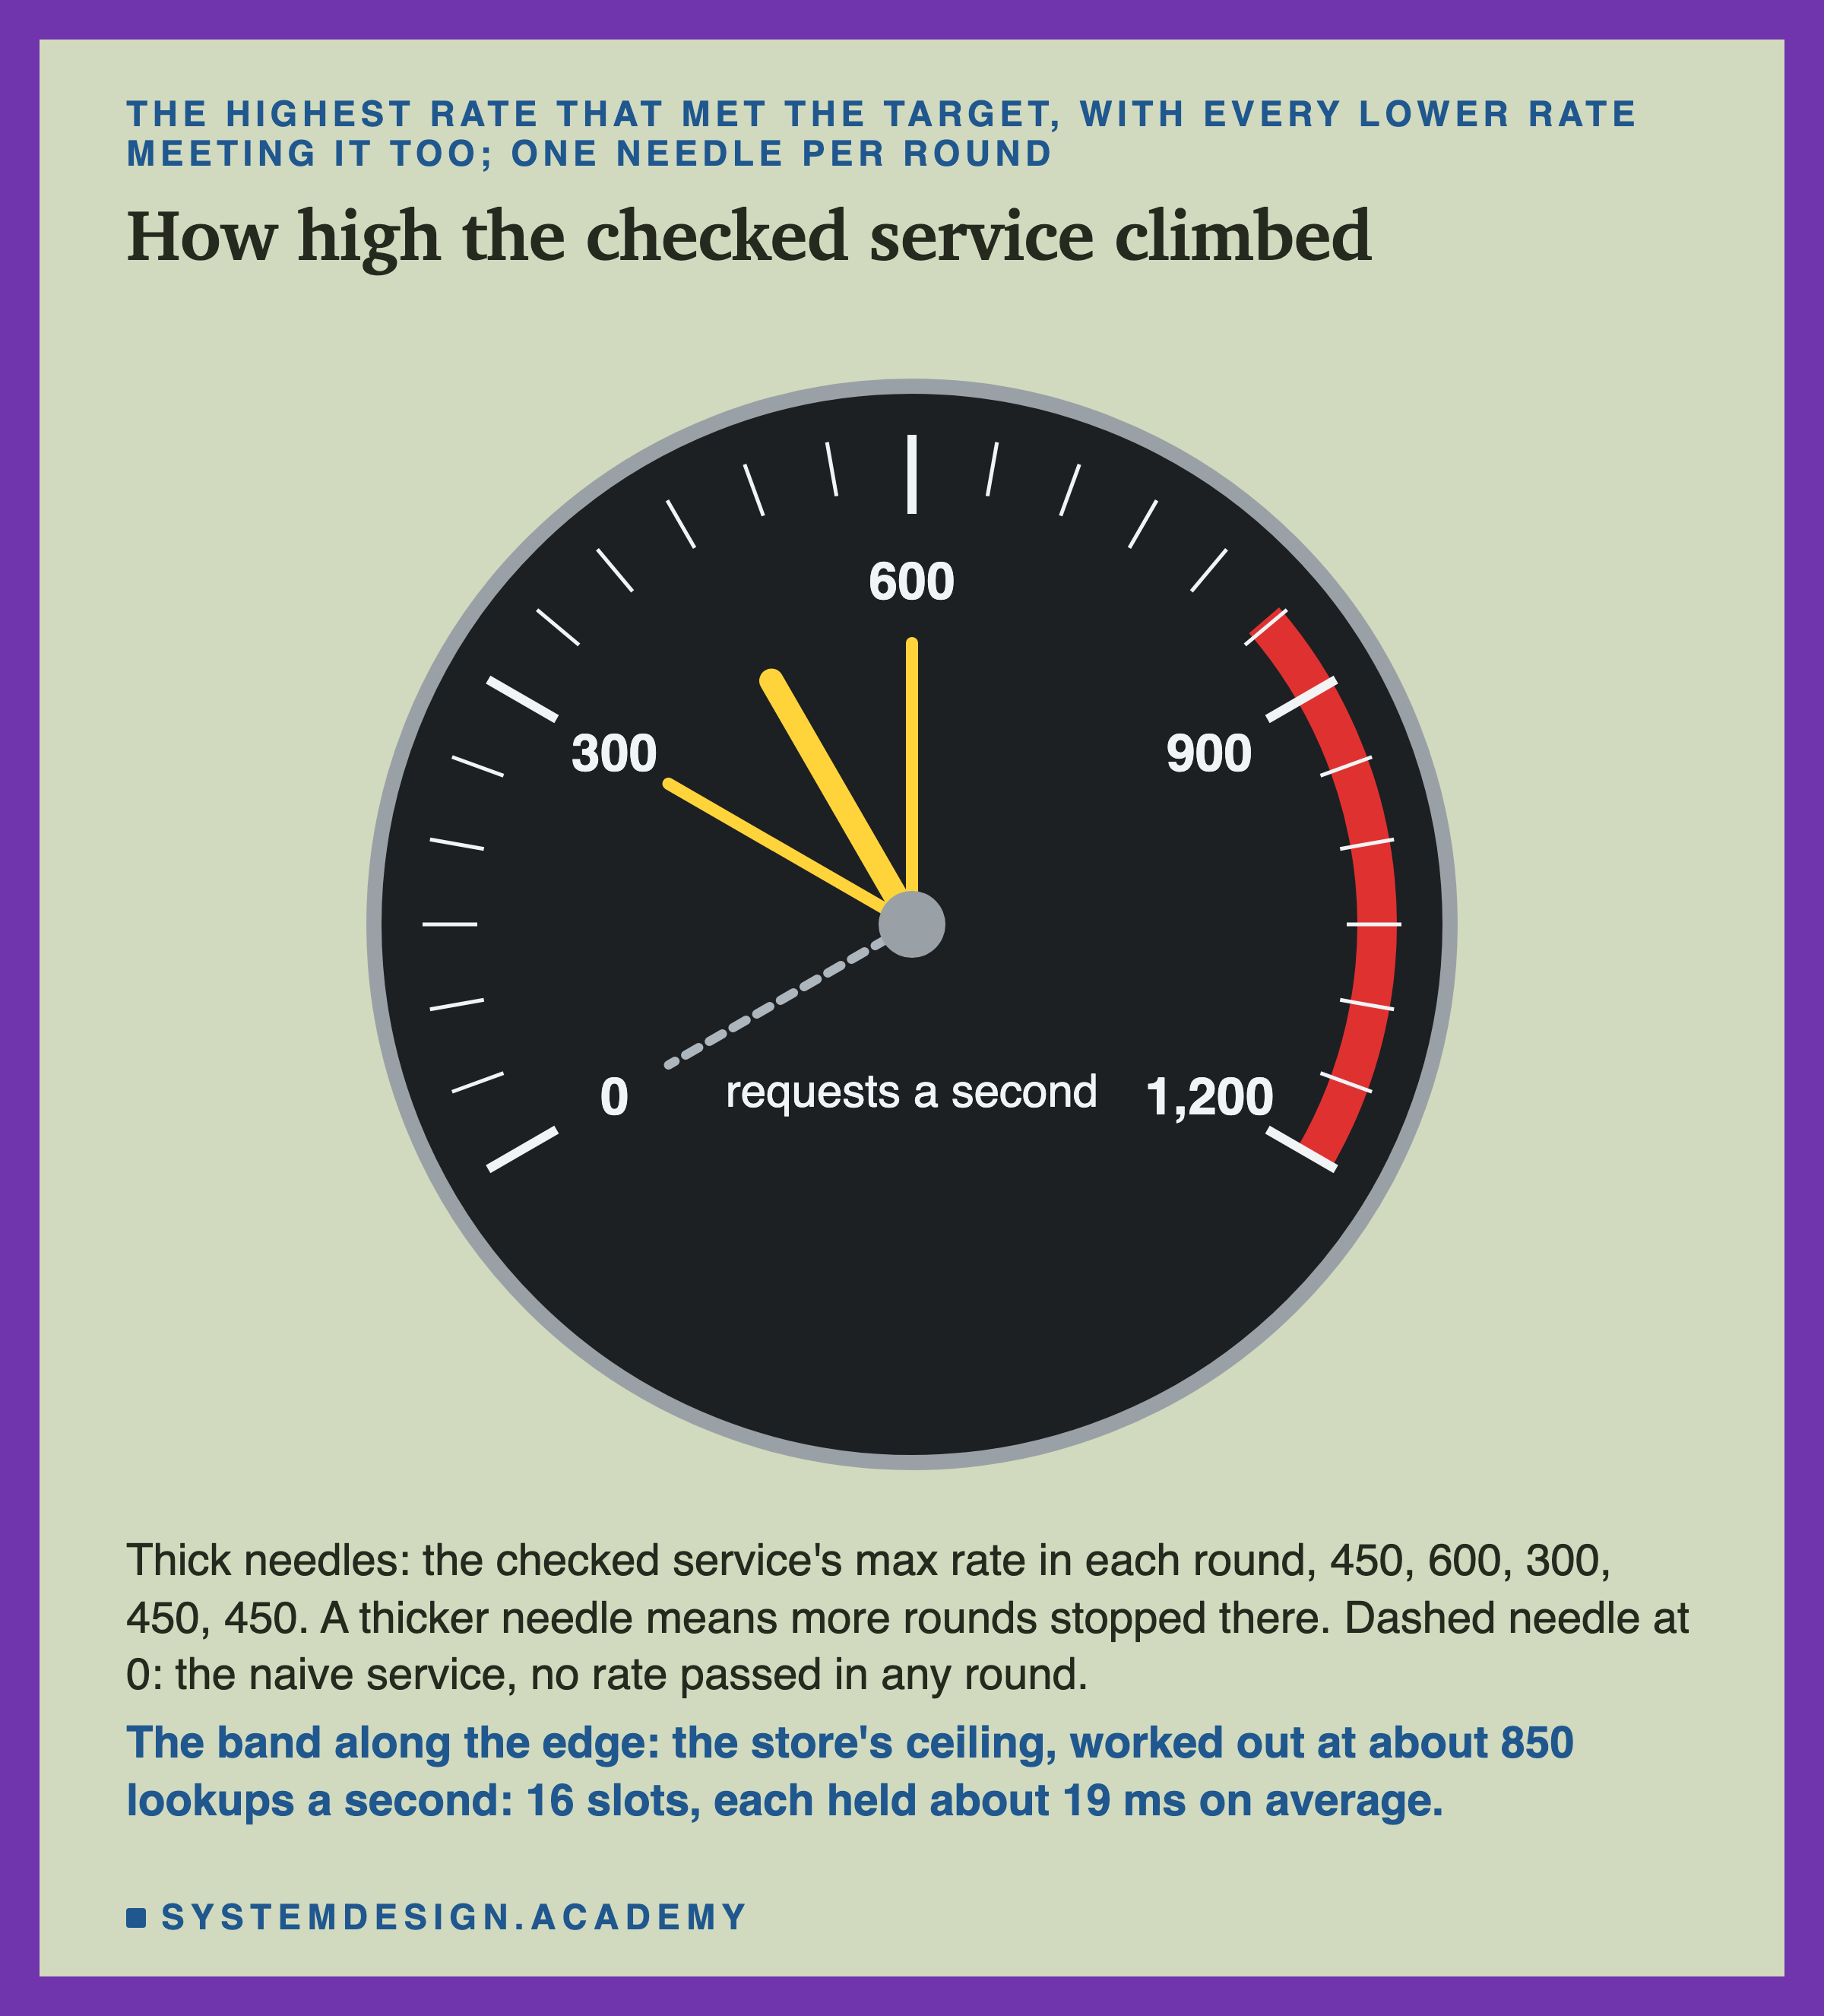
The checked service reached 450, 600, 300, 450 and 450 requests a second in rounds 1 to 5. The naive service reached none: no rate passed in any round, not even 150 a second. By my rule that counts as clearly different, but it is built in: with this store the naive service could not pass at any rate. The finding is the checked service's own number, 300 to 600 a second.
That number belongs to this pretend store, not to the service. The core was still 28% to 36% idle at every rate from 600 up, so the processor was not the limit. The store was. Lesson 9 chose the store's 16 slots so that it would be near its limit at 450 a second. And 450 is where the checked service stopped in the middle round. With a different helper, the number would be different.
Here is a rough comparison across two lessons, not a paired one. Lesson 11 measured 914 a second on this kind of machine, with no slow store, no live condition and no batcher. The slow store roughly halved what one core could carry.
The First Answer Waits for Python
Every run began cold. How long did each service take to give its first answer?
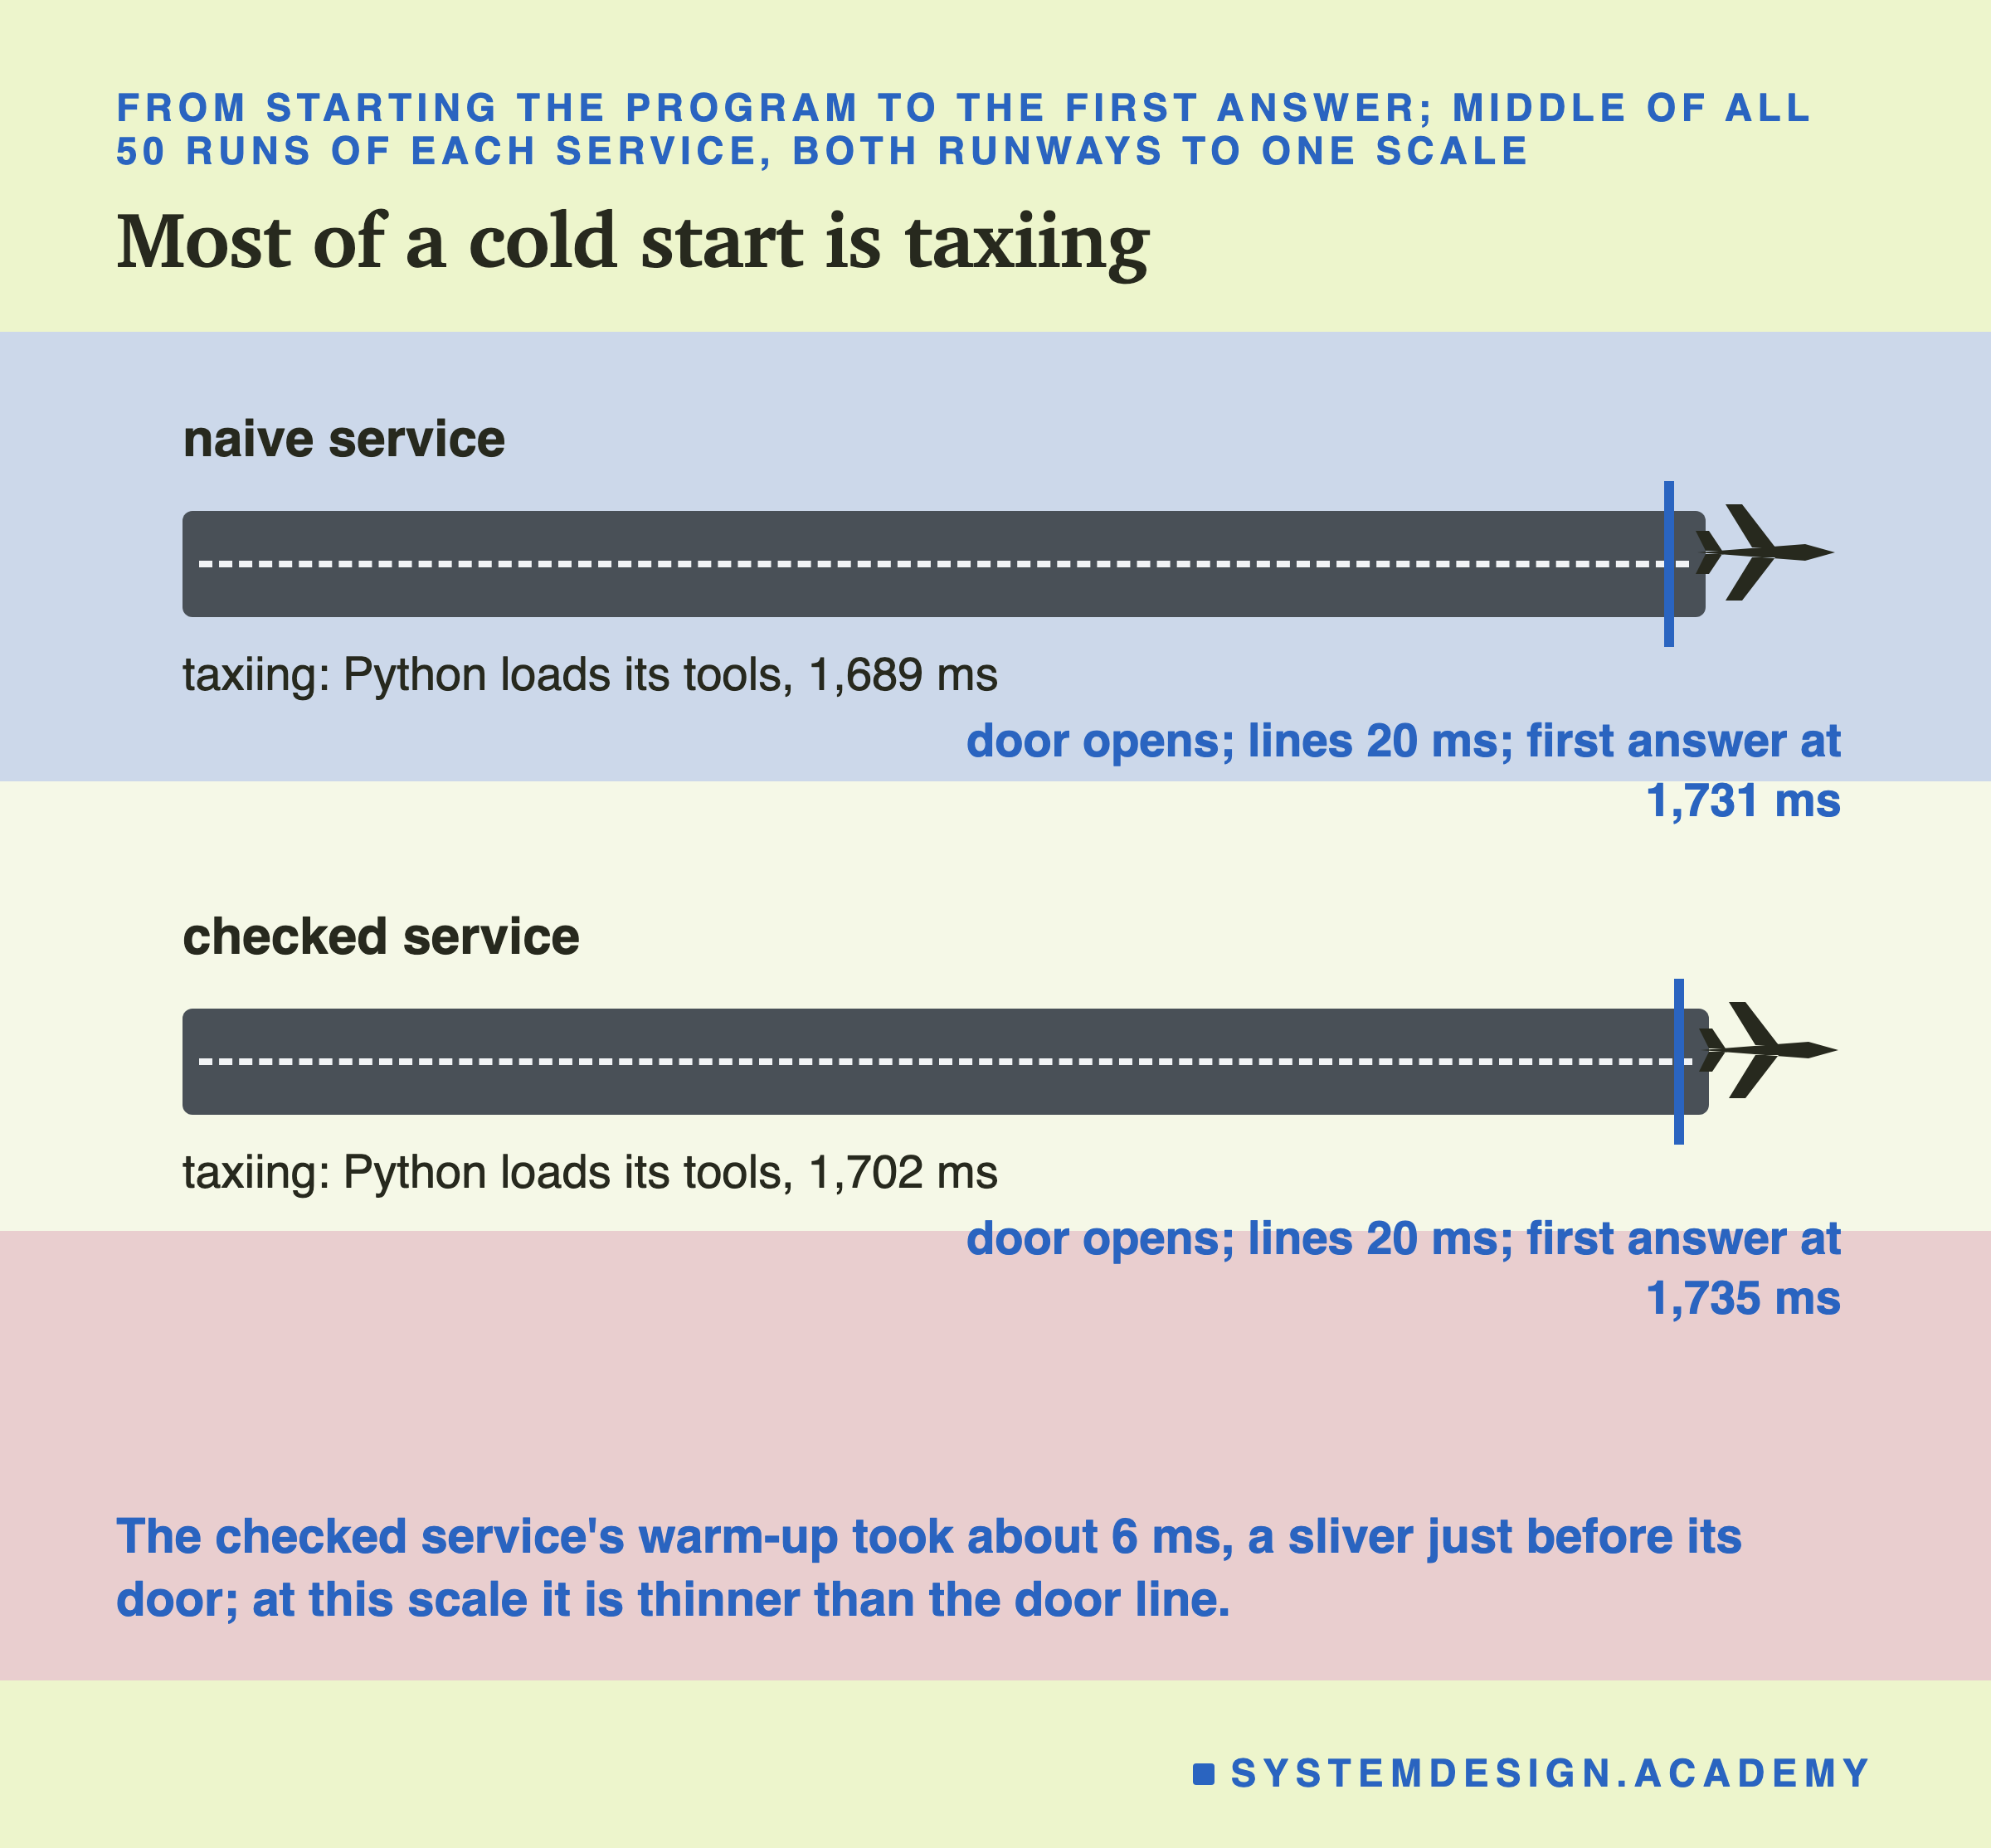
Both took about 1.73 seconds. Across all 50 runs of each service, the middle first answer was 1,735 ms for the checked service and 1,731 ms for the naive one. Starting up, until the port opened, was about 1,700 ms of that. At every rate the five rounds went both ways, so by my rule the two were never clearly different.
That matches lesson 6: almost all of a cold start is Python loading its tools. The checked service's warm-up ran before its port opened and took about 6 ms. So the warm-up did not make the first answer earlier. It moved a few milliseconds of work to before the door opened, so that the first real request would not pay for them.
Did the first real request gain? In the middle rounds it waited less with the checked service, at every rate. It was 10.9 ms against 22.6 ms at 300 a second, and 6.2 against 11.7 ms at 150. By my rule, though, the gap was clearly different at only one rate of ten, 1,100 a second. A single request is noisy: on one core it can land behind the tester or the store. So I can say the first request usually waited less, and not more than that.
With the naive service, the slowest of the first 100 requests took 47 to 182 ms in the middle rounds. That is slow lookups and the cold start, with no limit. With the checked service it was 24 to 27 ms, which its 23 ms budget makes nearly certain. A budget here is the 25 ms the service allows itself for one request.
What the Checks Cost the Core
Did the checks make the service work harder? This picture shows who had the one core at 450 requests a second.
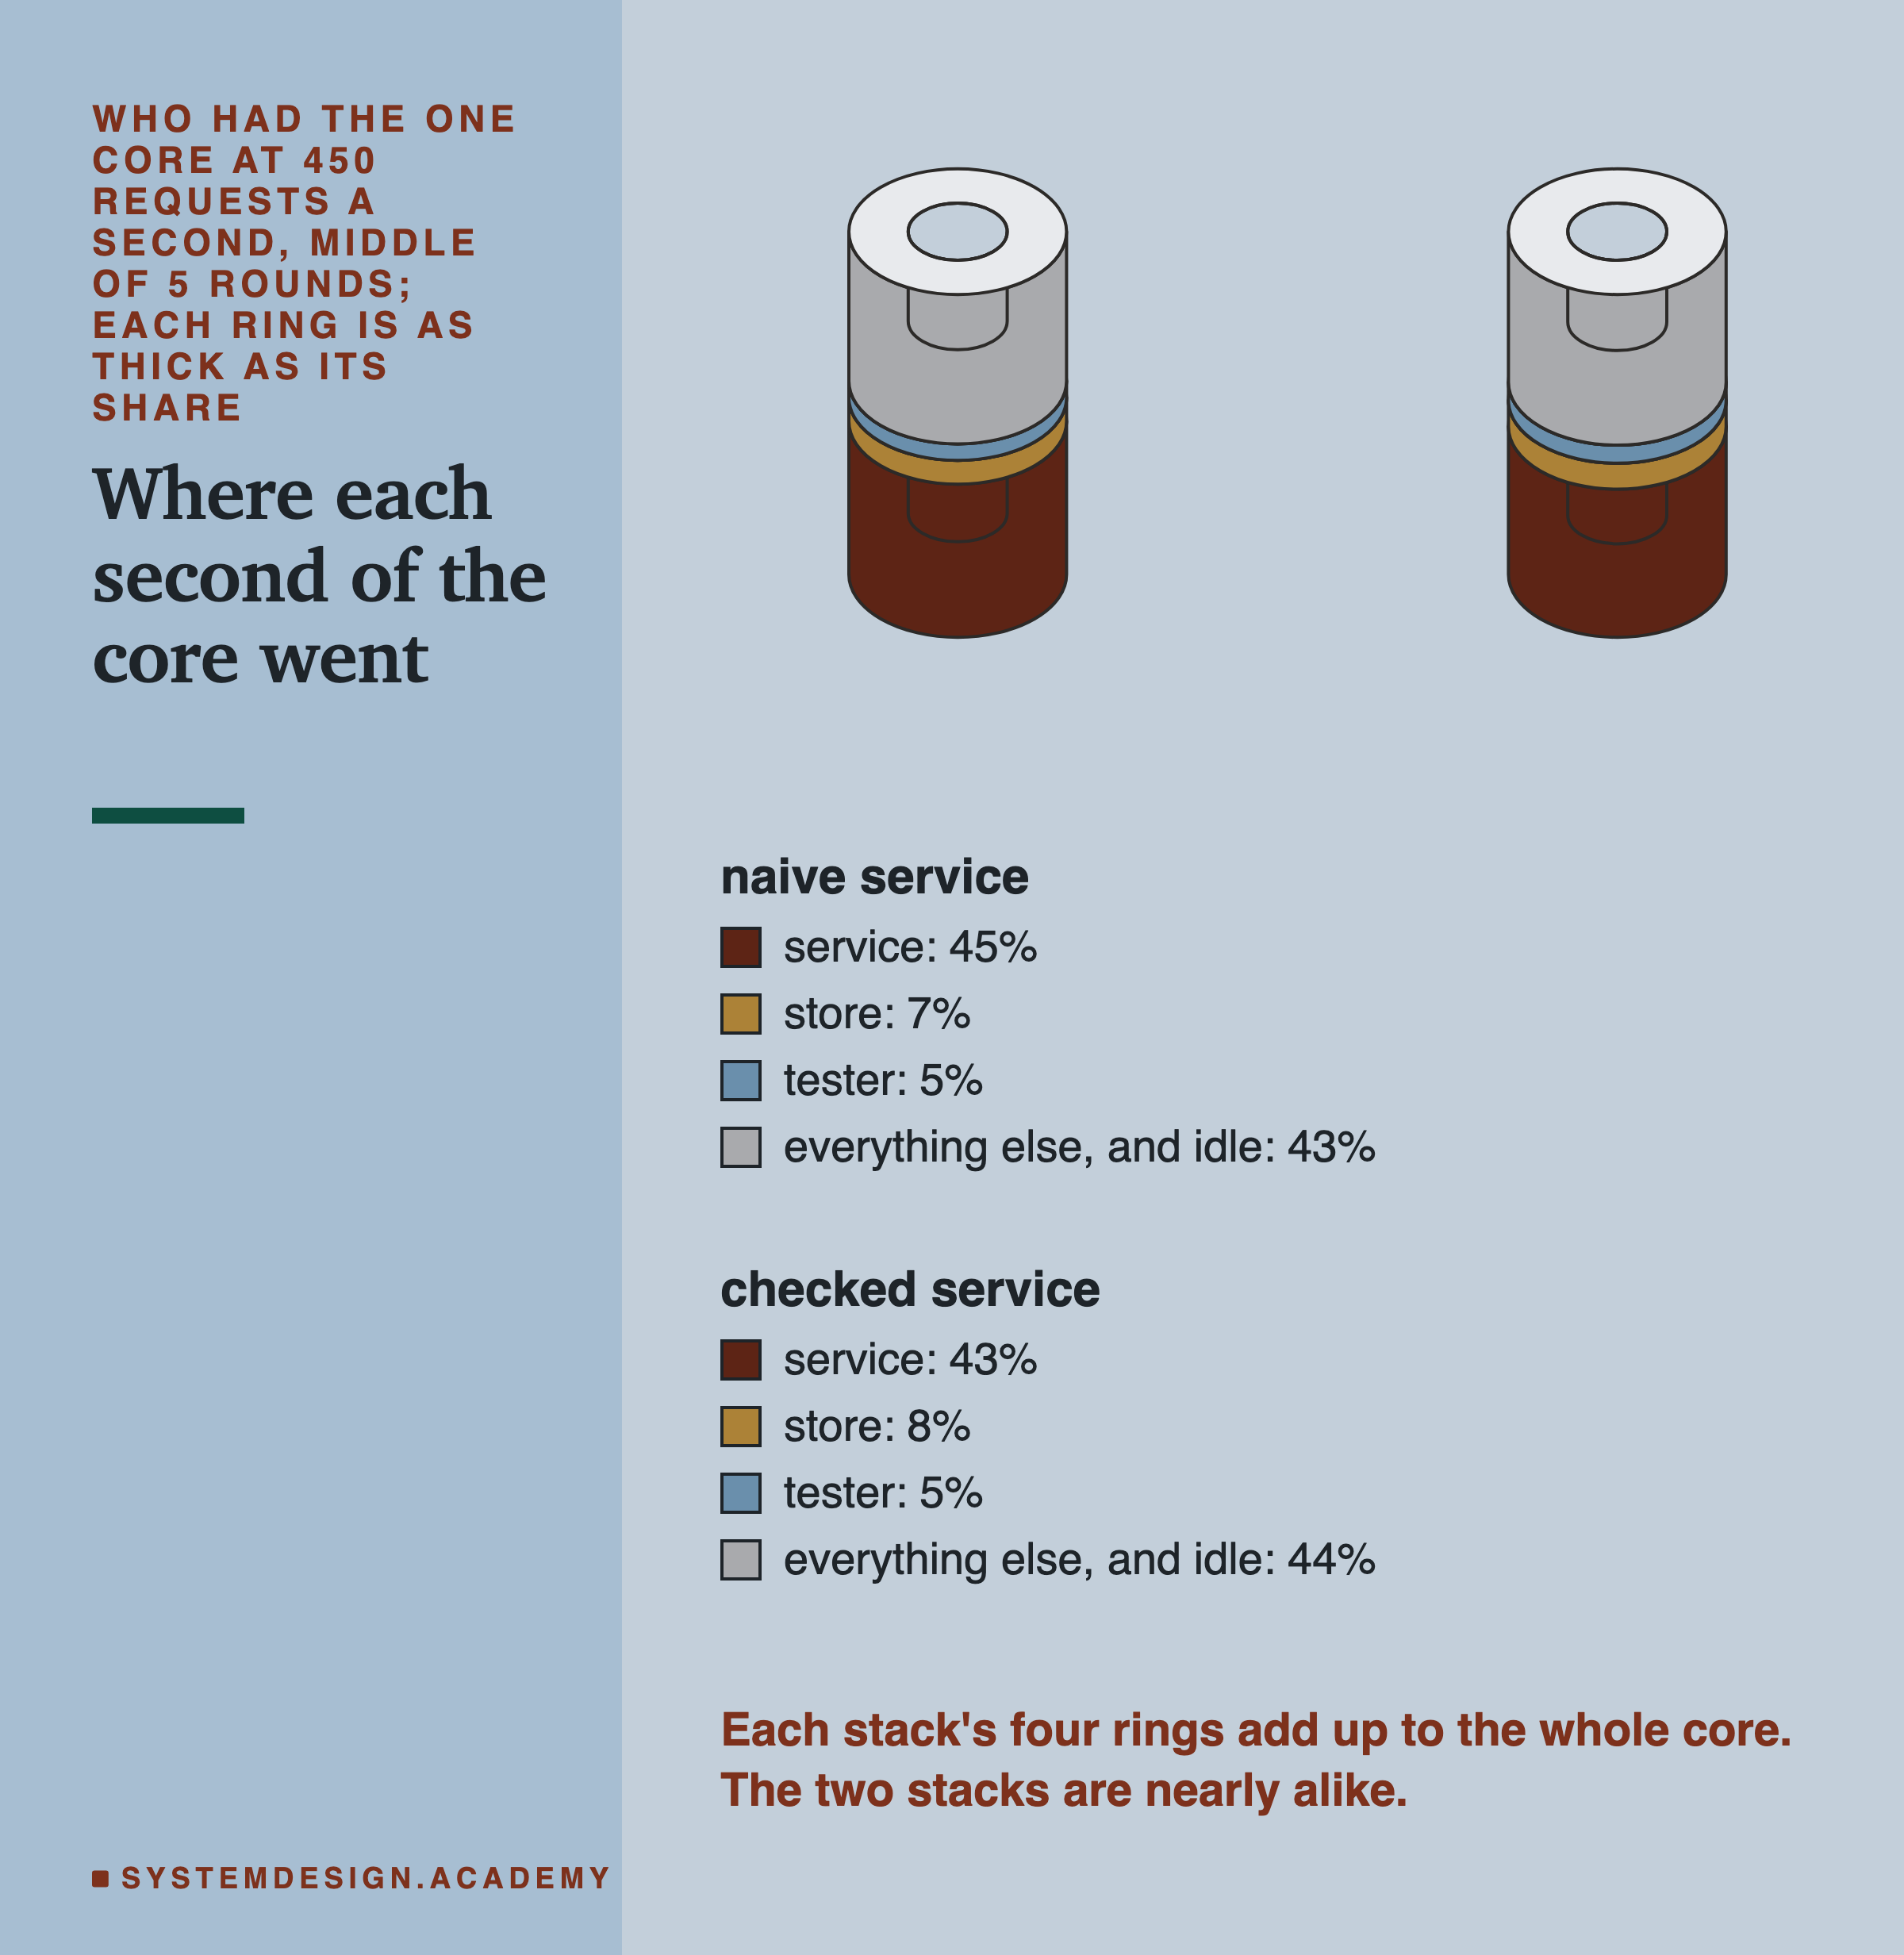
Each stack is one core, and each ring is as thick as one program's share of its time. The stacks are nearly alike. The naive service used 45% of the core and the checked service 43%. The store used 7% and 8%, and the tester 5% in both. The rest, about 44%, was the system and idle time.
At higher rates the checked service used less of the core per request than the naive one. More of its answers were stand-ins, which need no model call, and its batches grew. Those two effects are mixed together, so I give no number for batching alone.
Did the Batcher Do Anything?
The checked service scores every waiting row together, up to 32 in one model call. How many rows rode together?
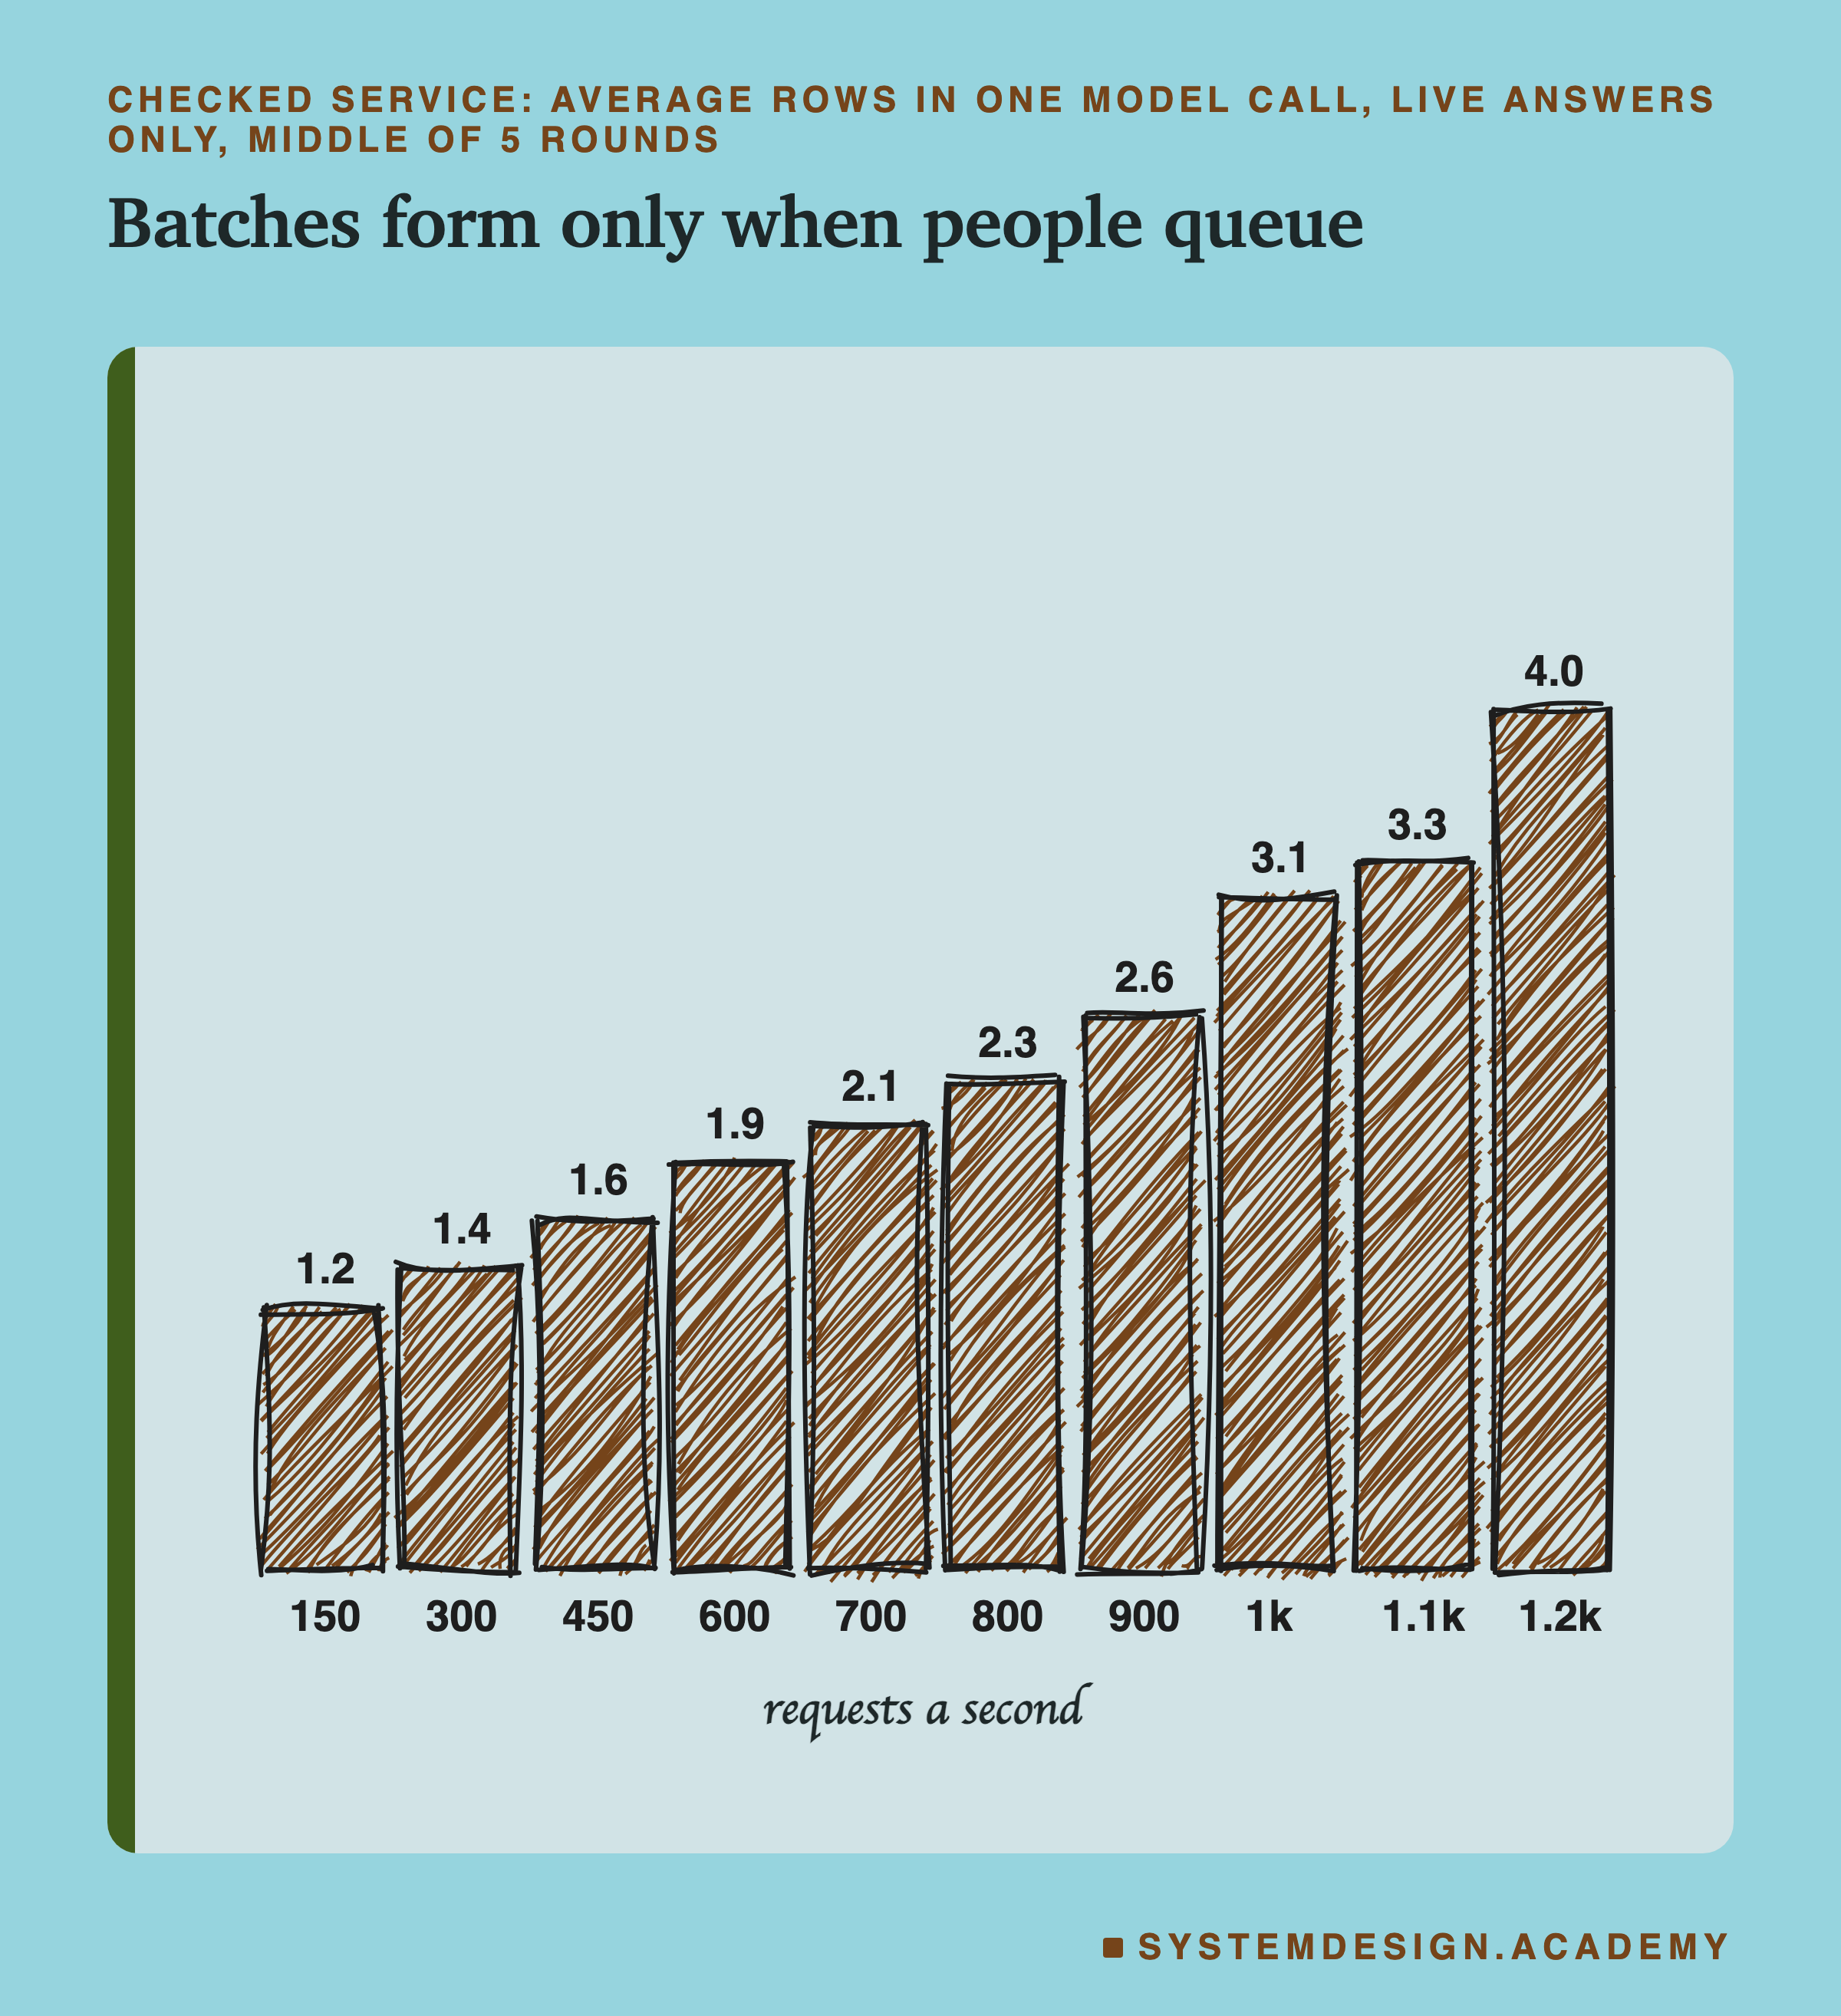
Not many. At 150 requests a second a call carried 1.22 rows on average (live answers, middle rounds). At 450 it carried 1.63, and at 1,200 it carried 4.0. A batch forms only when several requests are ready at the same moment, and at low rates that is rare. Lesson 11 measured 12.7 rows a call, but at 2,737 requests a second, a rate this lab never reached.
So at the rates where the checked service passed, the batcher was mostly scoring one row at a time. Lesson 4 warned that a batcher which never groups anything is pure cost. This lab changed three settings at once, so it cannot say what the batcher cost on its own here.
What the Checks Cost in Memory
The last cost to check is memory. At the end of each run the tester read how much memory the service was holding.
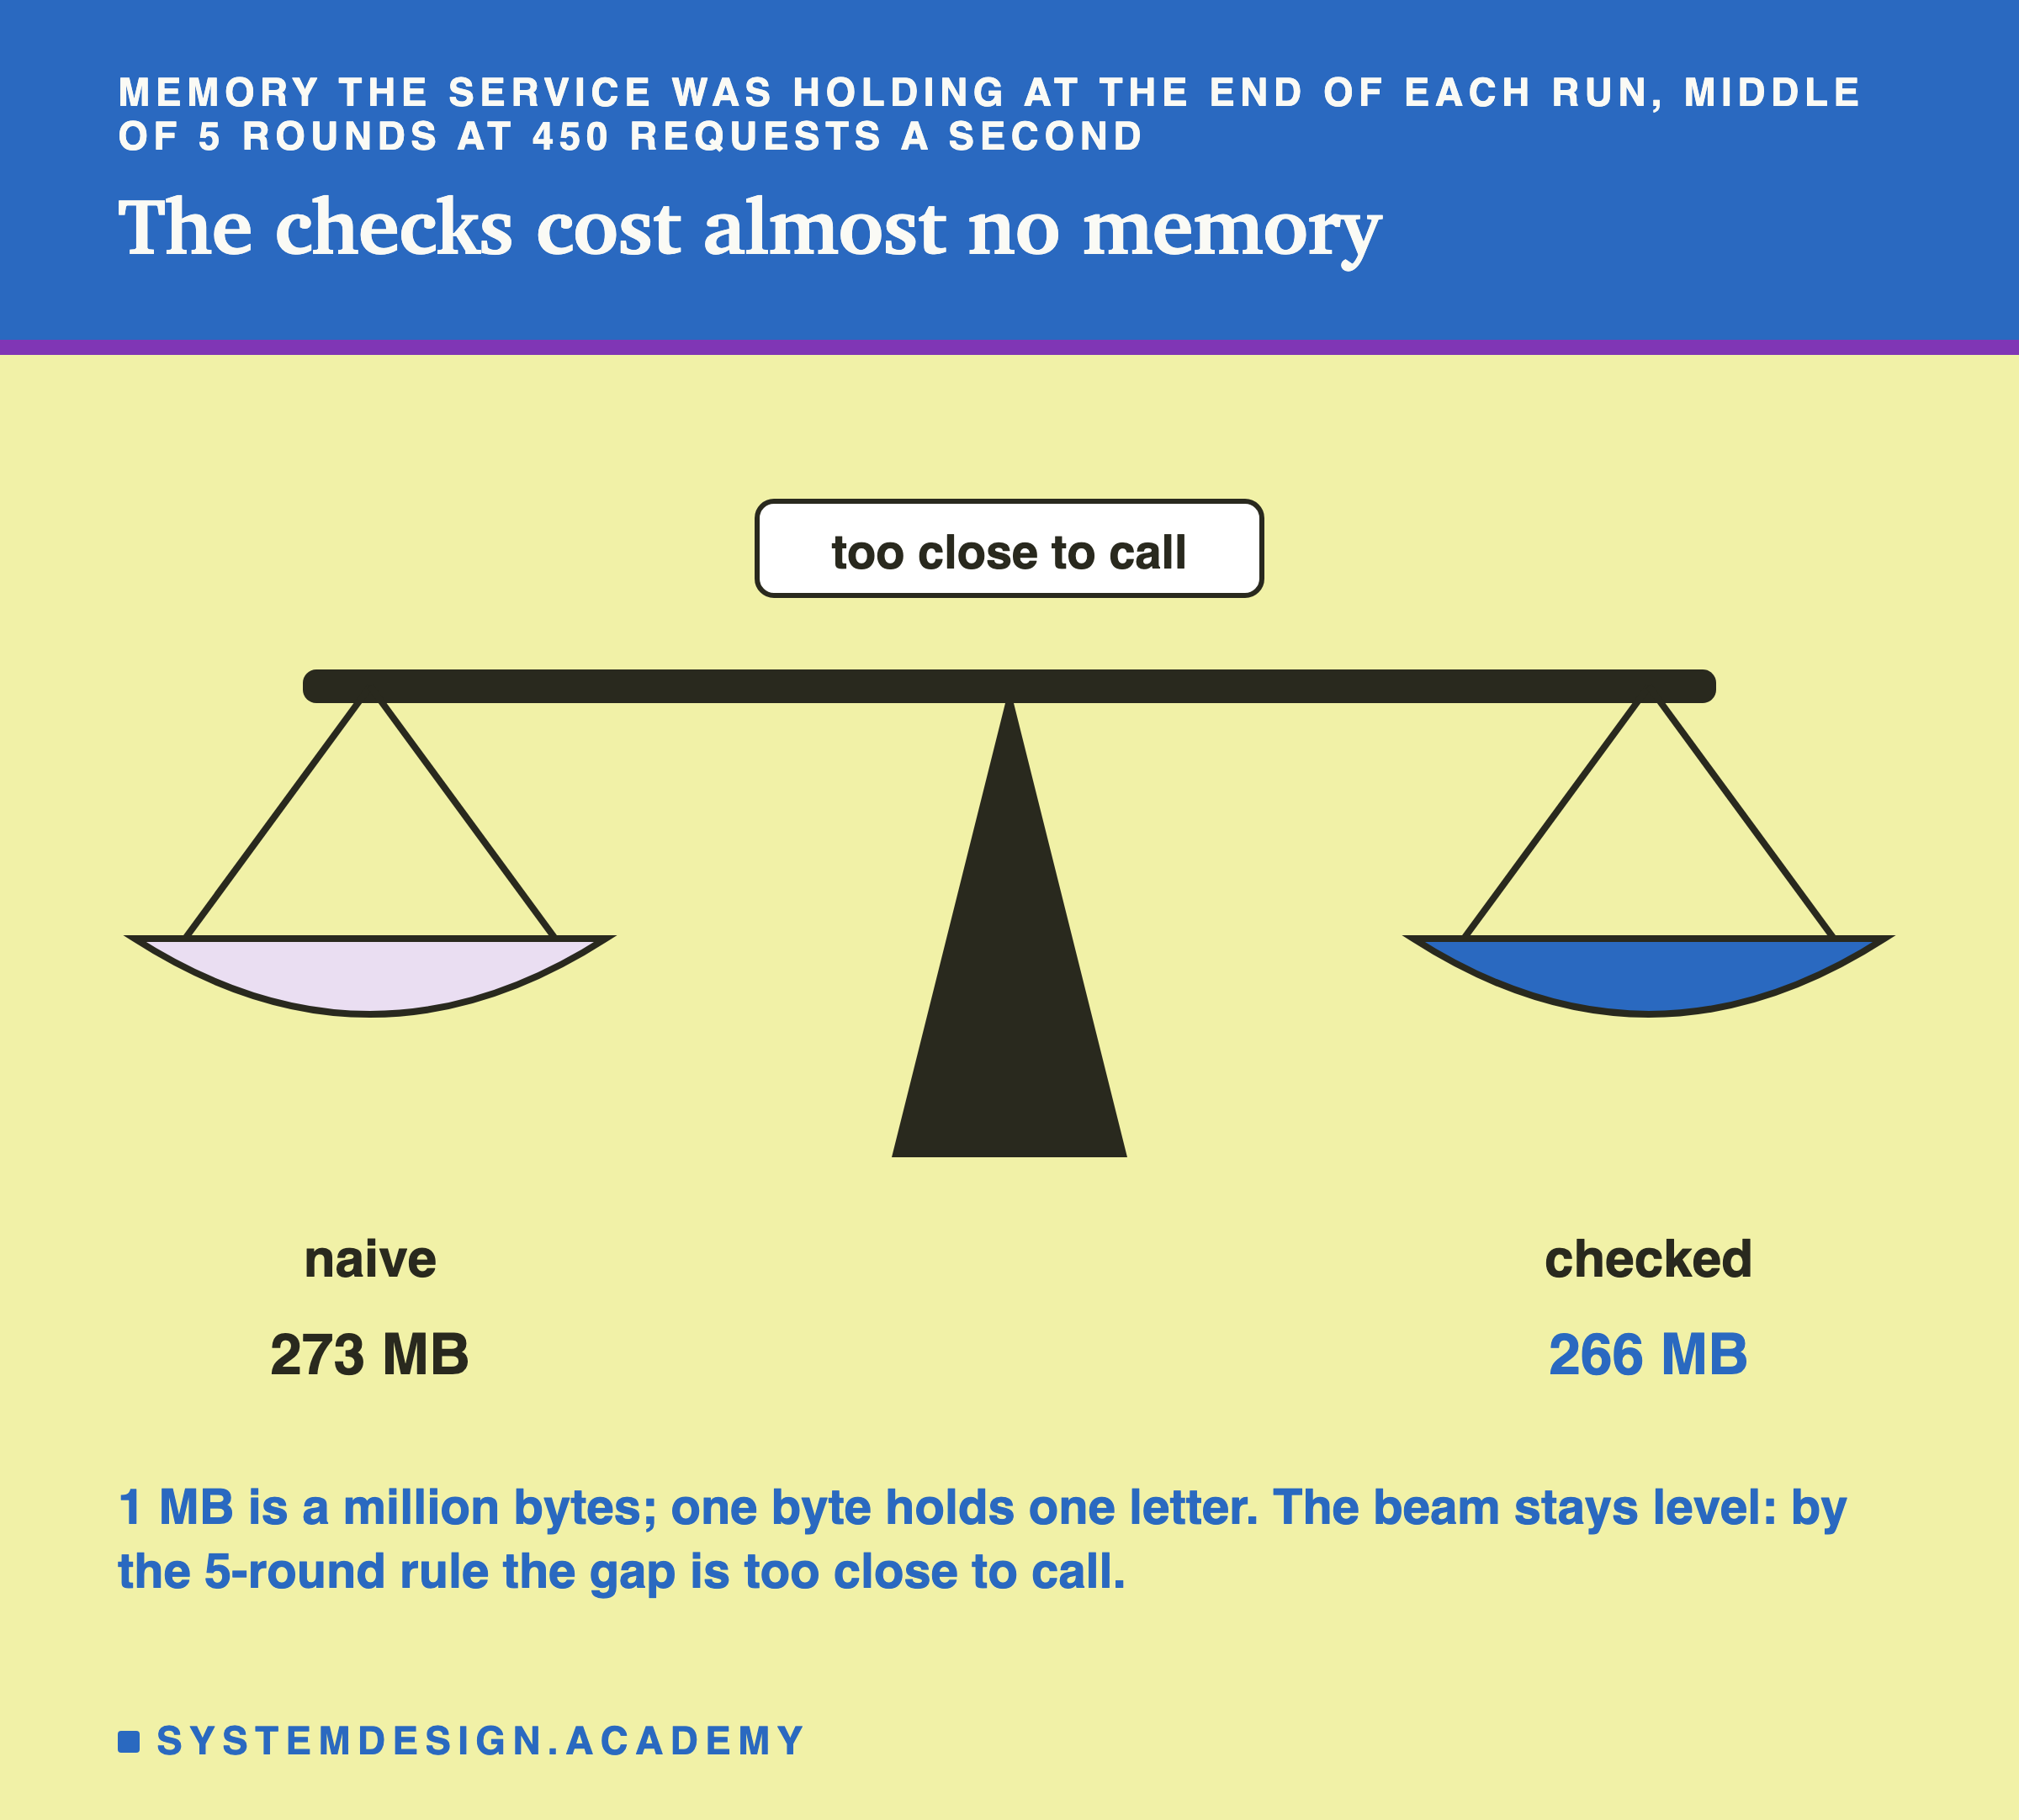
At 450 requests a second, the naive service held 273 MB and the checked service 266 MB (middle rounds). By my rule those are too close to call, so the beam is drawn level. Both services load one Python, one set of libraries and one model, and the batcher's queue and the stand-in table are small. From 800 a second up the checked service held less in all 5 rounds, by 7 to 13 MB in the middle rounds. My guess, which I did not test, is that the naive service had thousands of requests waiting inside it at those rates.
Two Services, One Set of Answers
A faster service is worthless if it gives different answers, so I checked every live score.
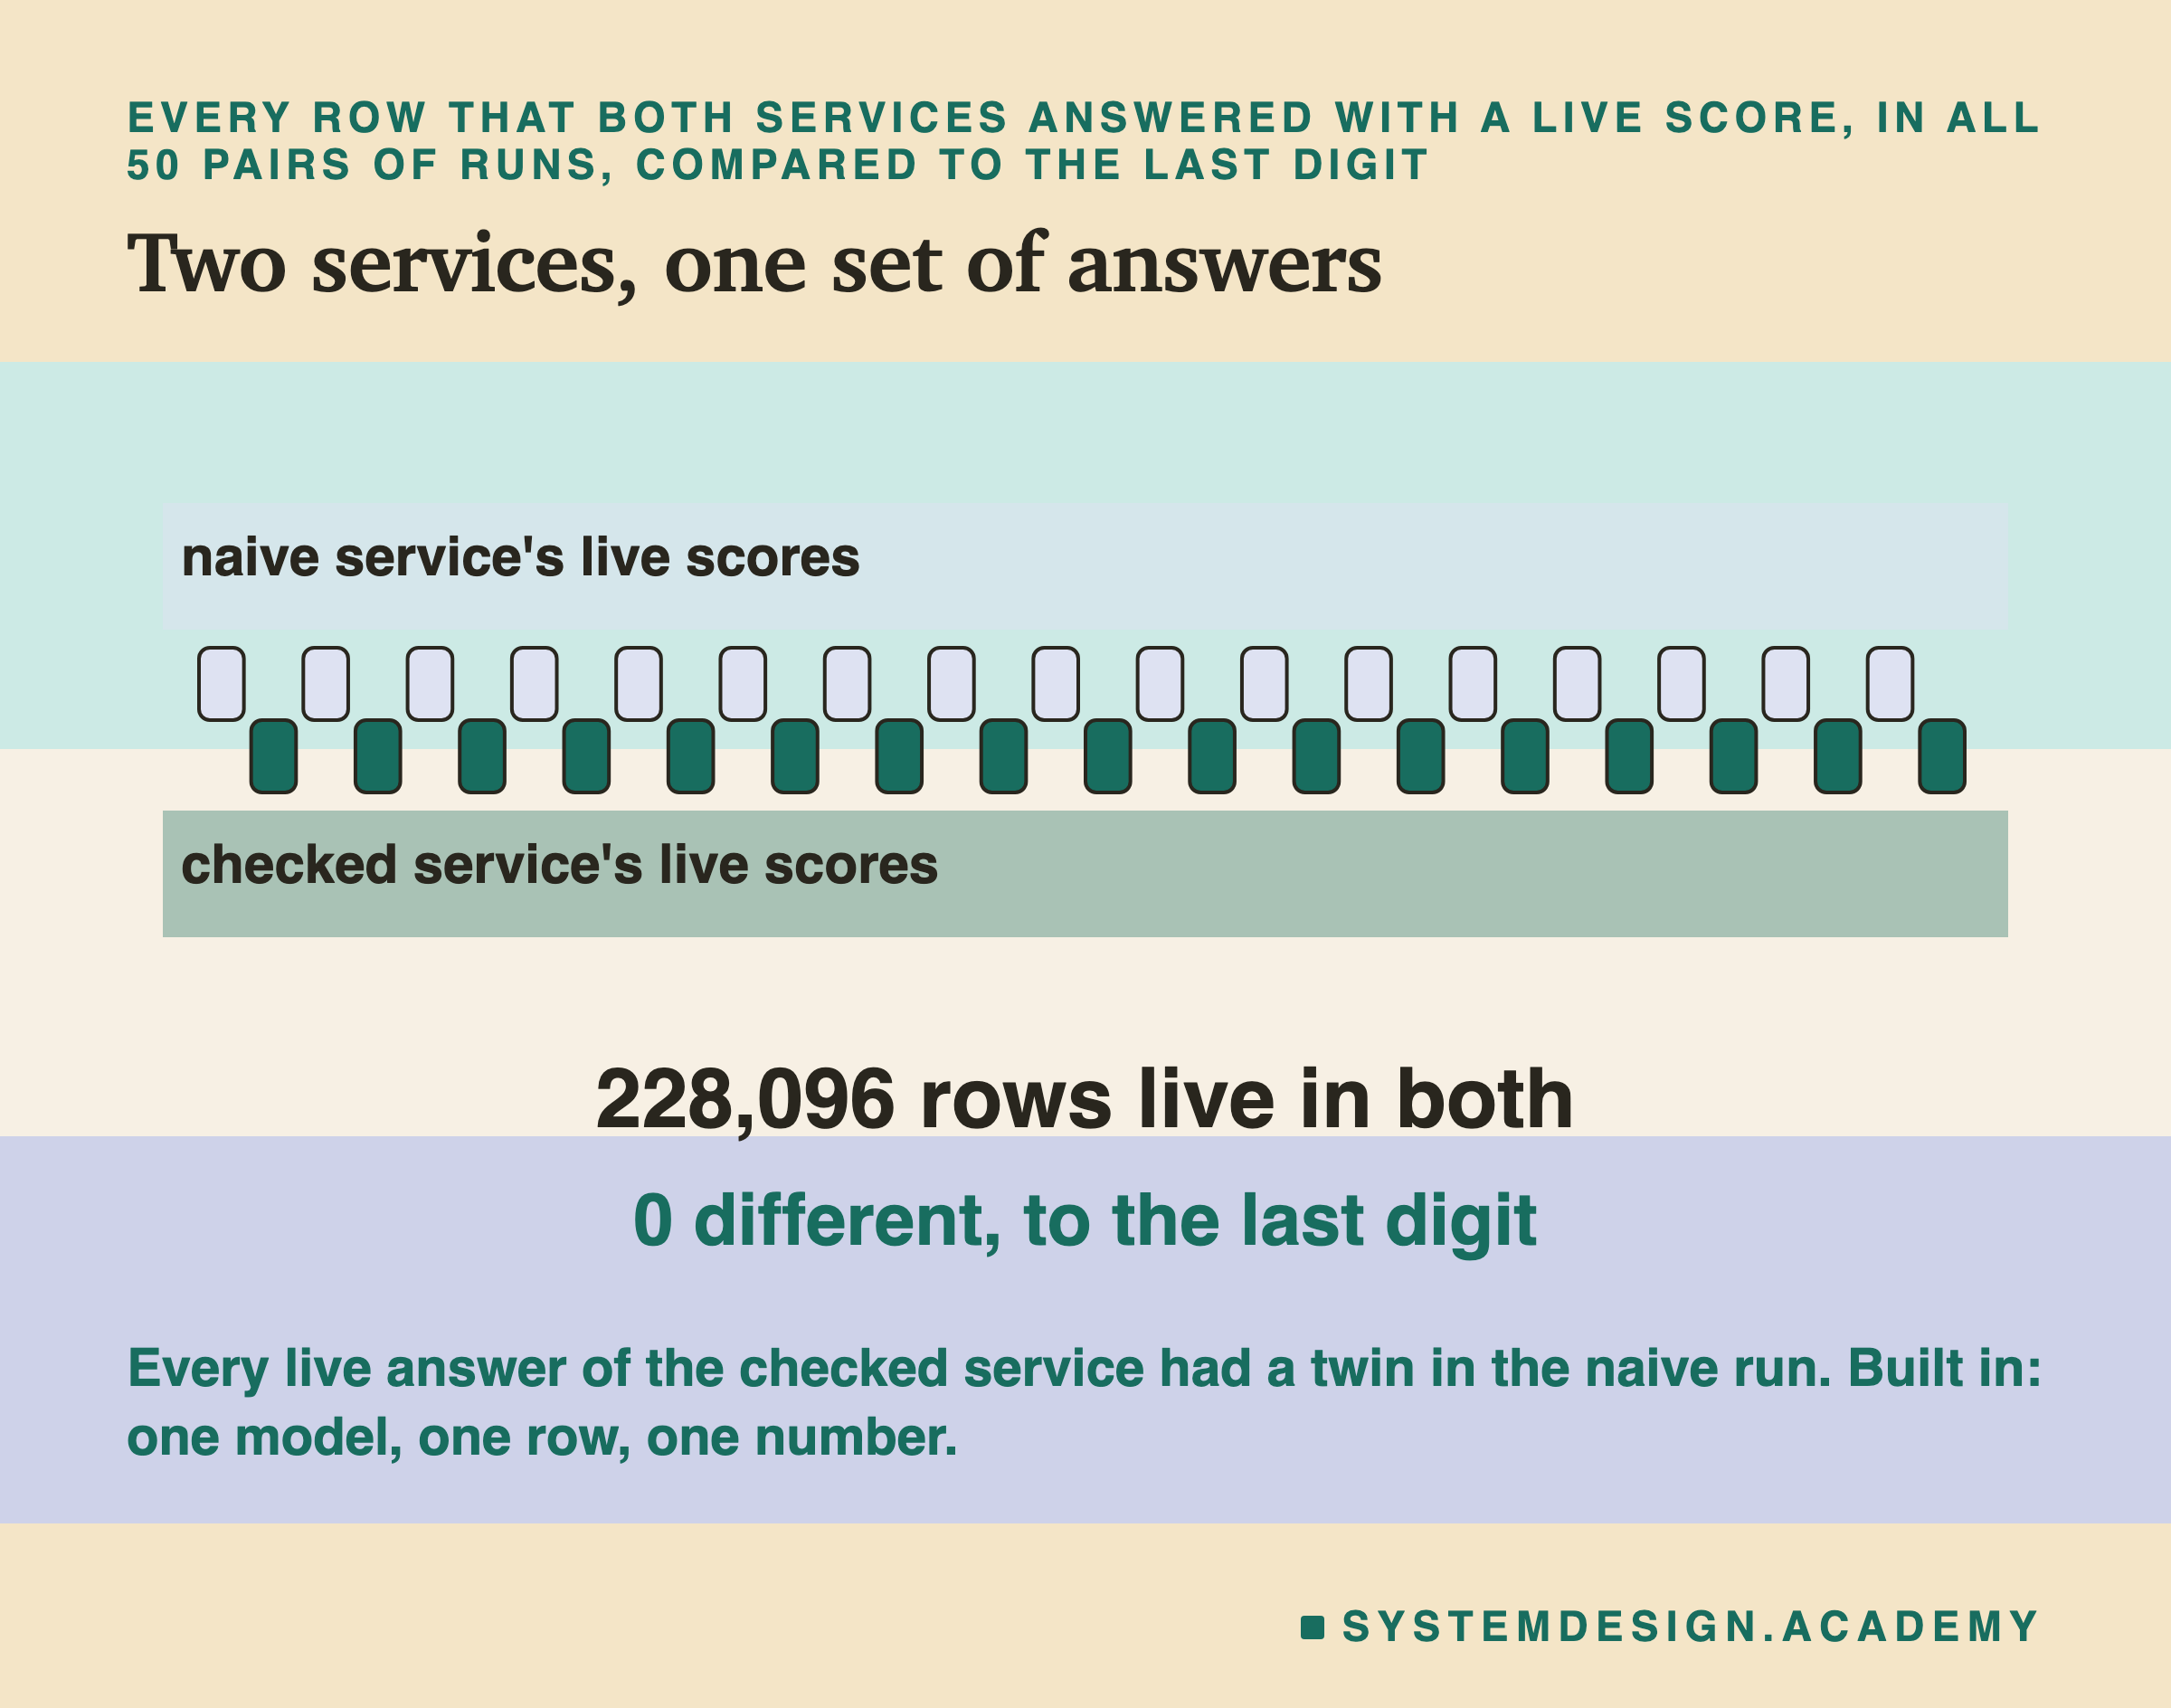
Every live answer in every run was compared with the machine's own reference score, to the last digit. That was 540,003 answers from the naive service and 228,096 from the checked one. Not one differed. The naive service never gives a stand-in, so every row the checked service answered live was answered live by both: 228,096 rows, 0 different.
That much is built in. One model scoring six numbers gives one score, whether it scores one row or a batch of 32, which chk_ref.py also checked on all 26,851 rows. The check still matters, because a bug in a batcher, such as a row matched to the wrong answer, would show up here.
The Price of a Million Answers
Lesson 11 turned a max rate into a cost: the price of one hour, divided by the answers in that hour.
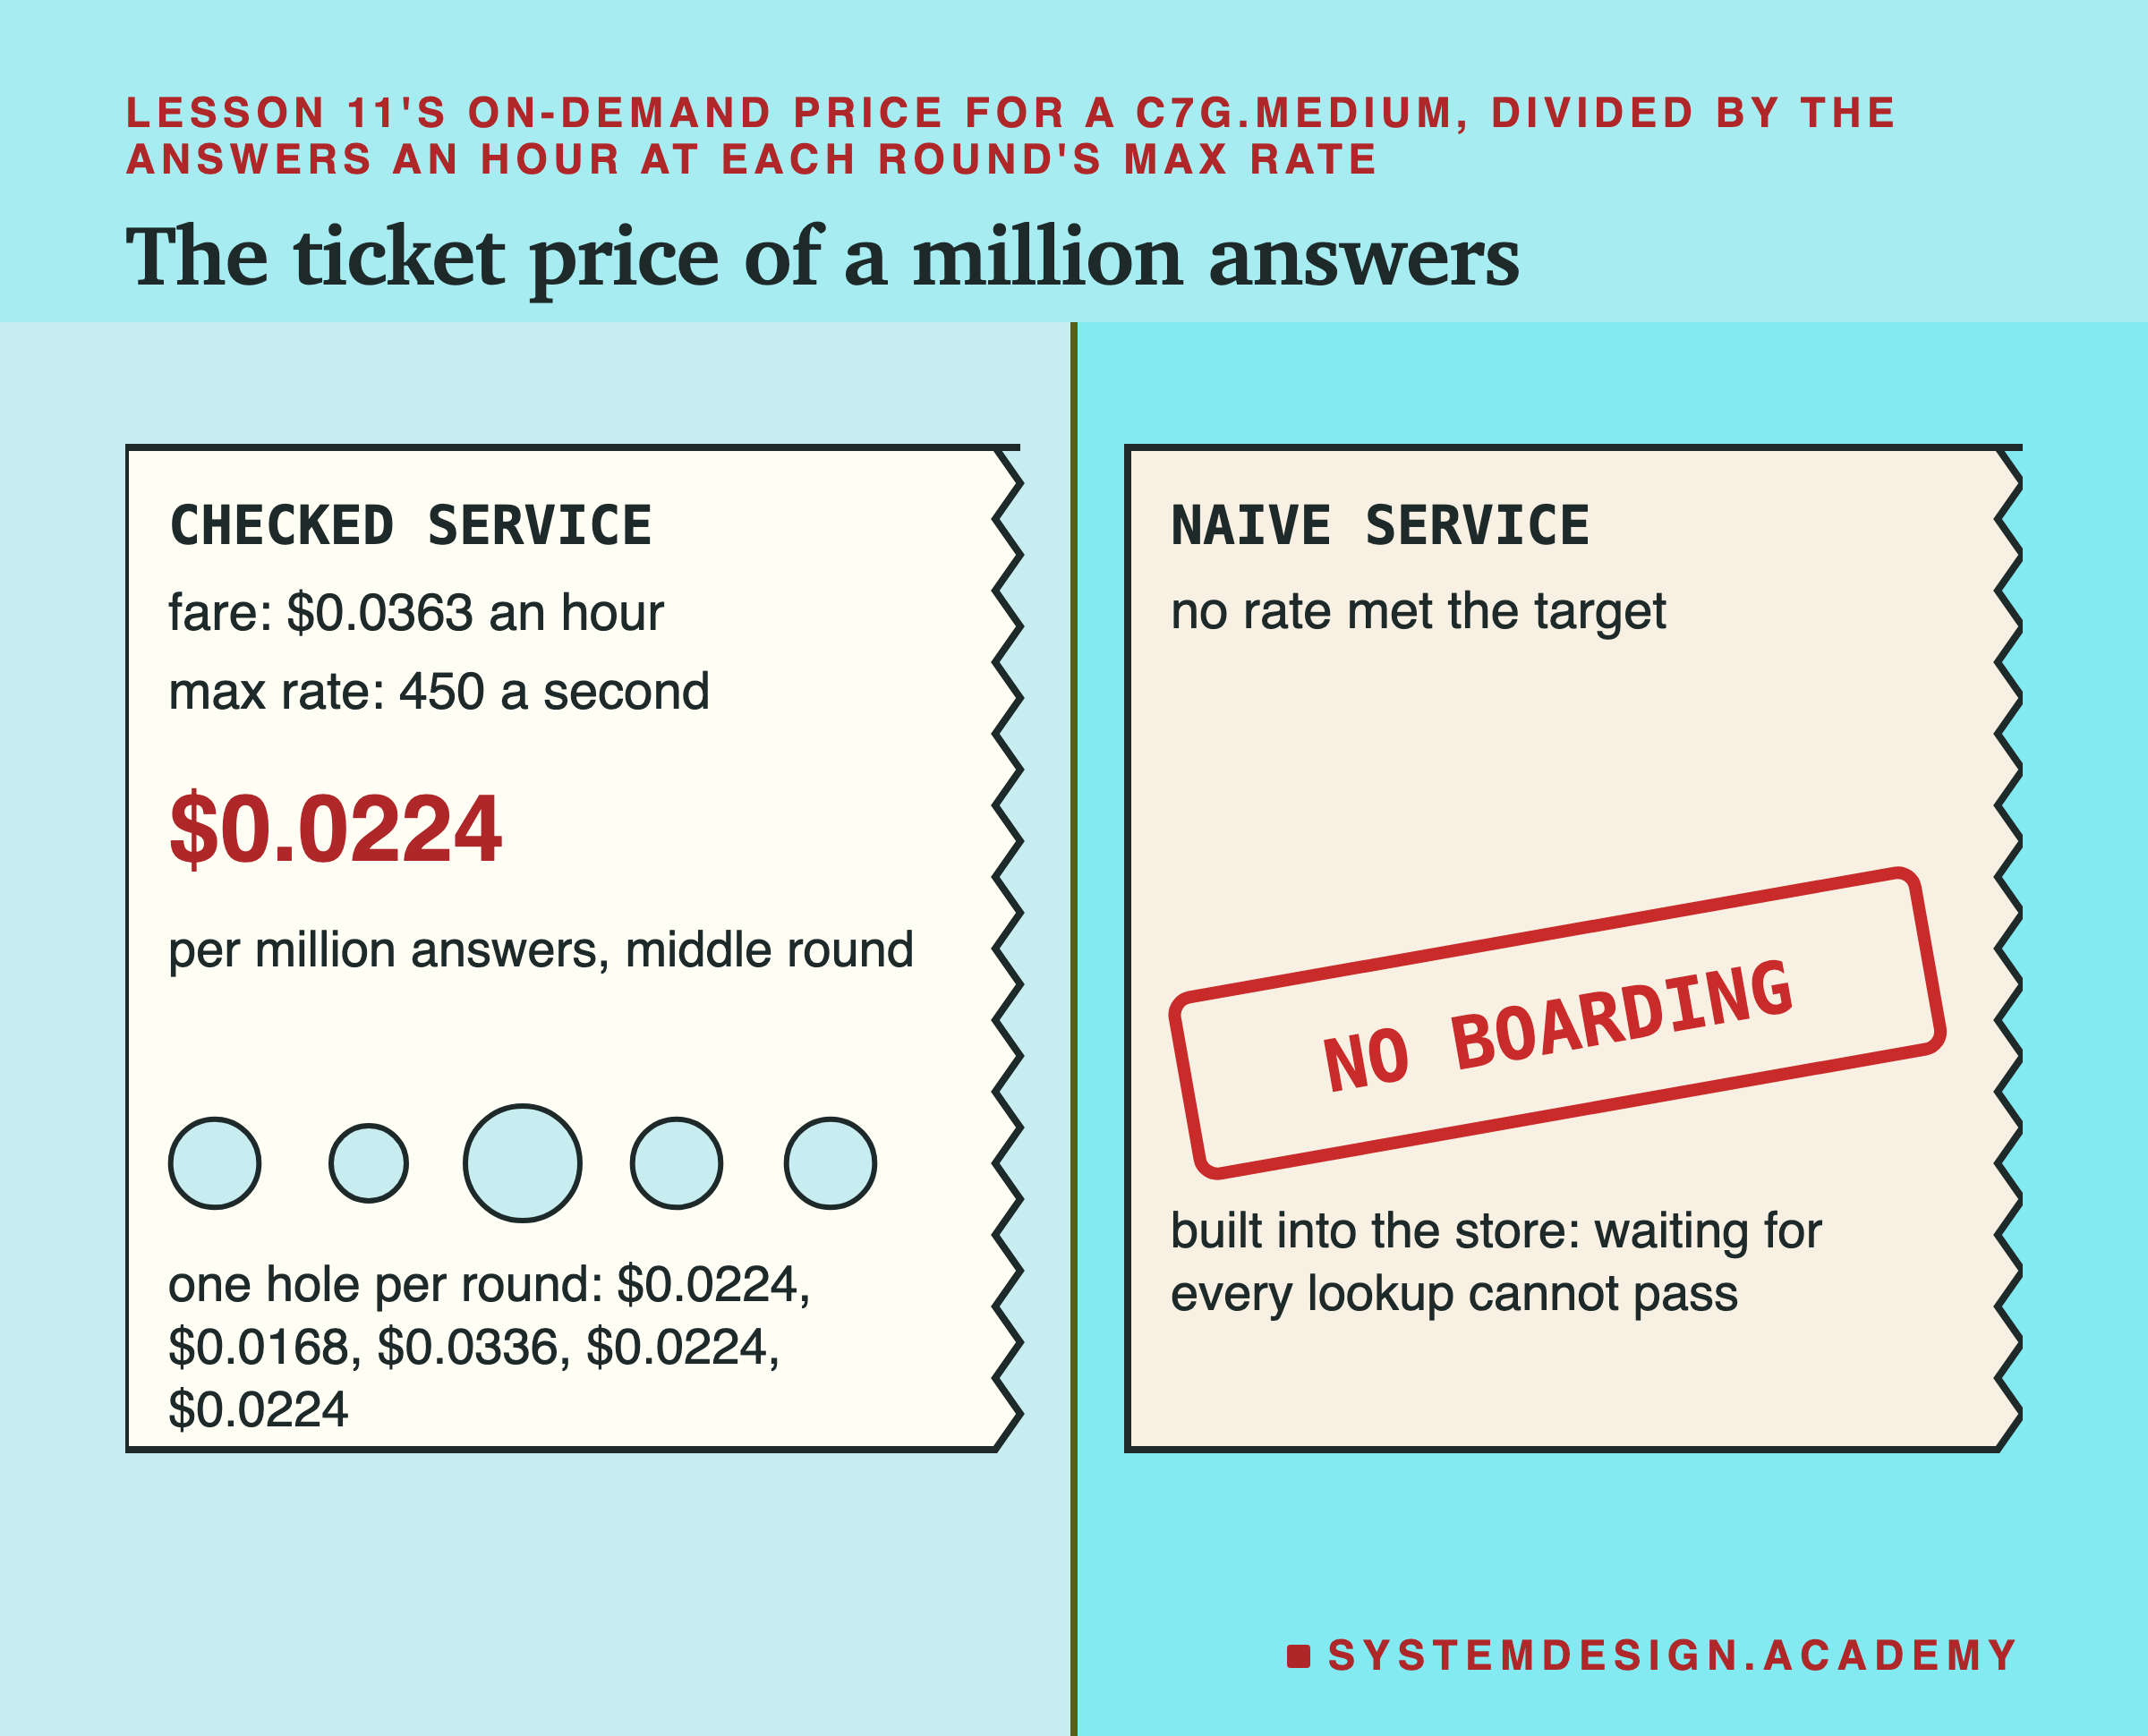
The c7g.medium costs $0.0363 an hour. At the checked service's max rate, a million answers cost $0.0224 in the middle round, and between $0.0168 and $0.0336 across the rounds. The naive service has no price at the target, because no rate met it, and that, again, is built into the store.
At one fixed rate, the two services cost exactly alike per answer: one machine, one price, one number of answers. The real difference is how much traffic one machine can carry while keeping the promise.
The Chapter in Twelve Stops
Before the checklist, here is the whole chapter in one picture. Each station is one lesson, with the one number it measured. Every number on it is read from that lesson's own results file.
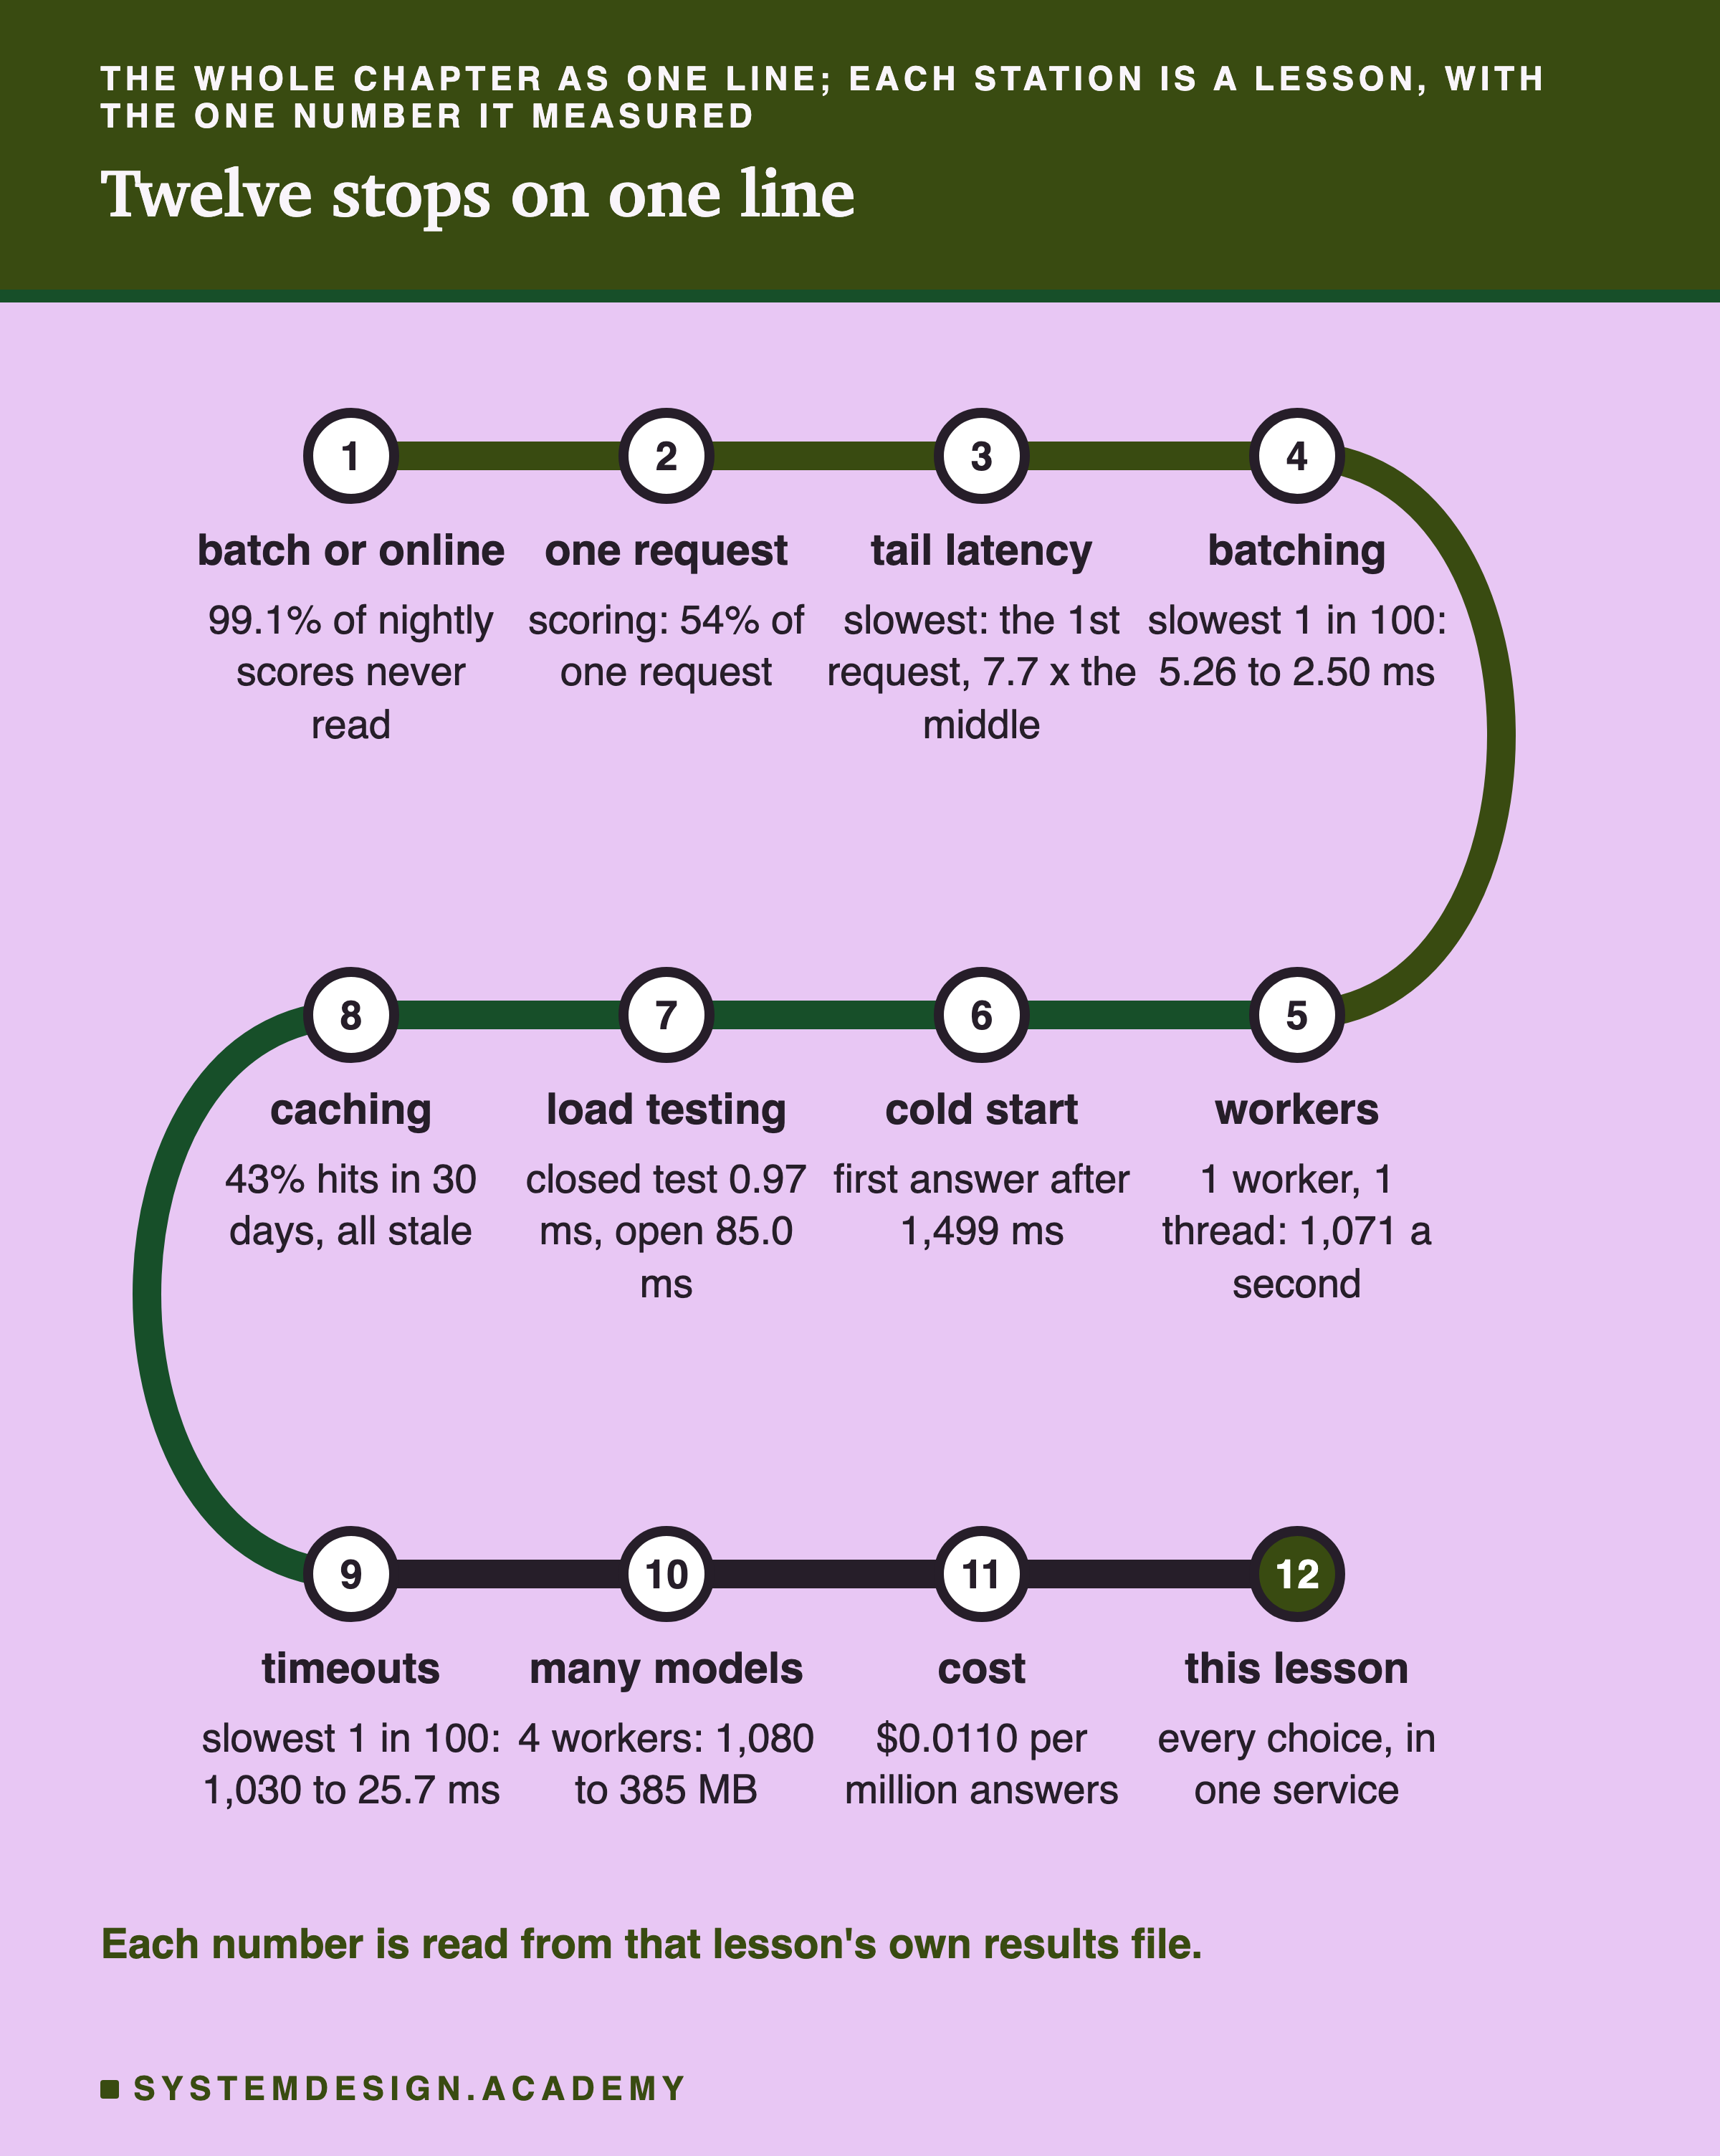
And here is the journey in words, one finding per lesson, with a link back to each.
-
Batch or online. Scoring every customer once a night could not be told apart from scoring each visit live, in ranking. But 99.1% of the nightly scores were never read.
-
Latency anatomy. A typical request took 1,075.9 microseconds (millionths of a second), and the model's own scoring was the biggest step: 54% of it.
-
Tail latency. On a quiet machine the slowest 1 in 100 was only 1.08 times the middle request. The single slowest was 7.7 times the middle, and it was always the first request of the run.
-
Batching requests. Scoring up to 32 waiting requests in one call, with no waiting on purpose, helped. At about 550 requests a second, the slowest 1 in 100 fell from 5.26 ms to 2.50 ms.
The Checklist: Take This Page to Work
This is the page I would pin above my desk. Each line is one decision, the lesson that measured it, that lesson's number, and when the line does not apply. Skipping a line that does not fit your service is part of using the list well.
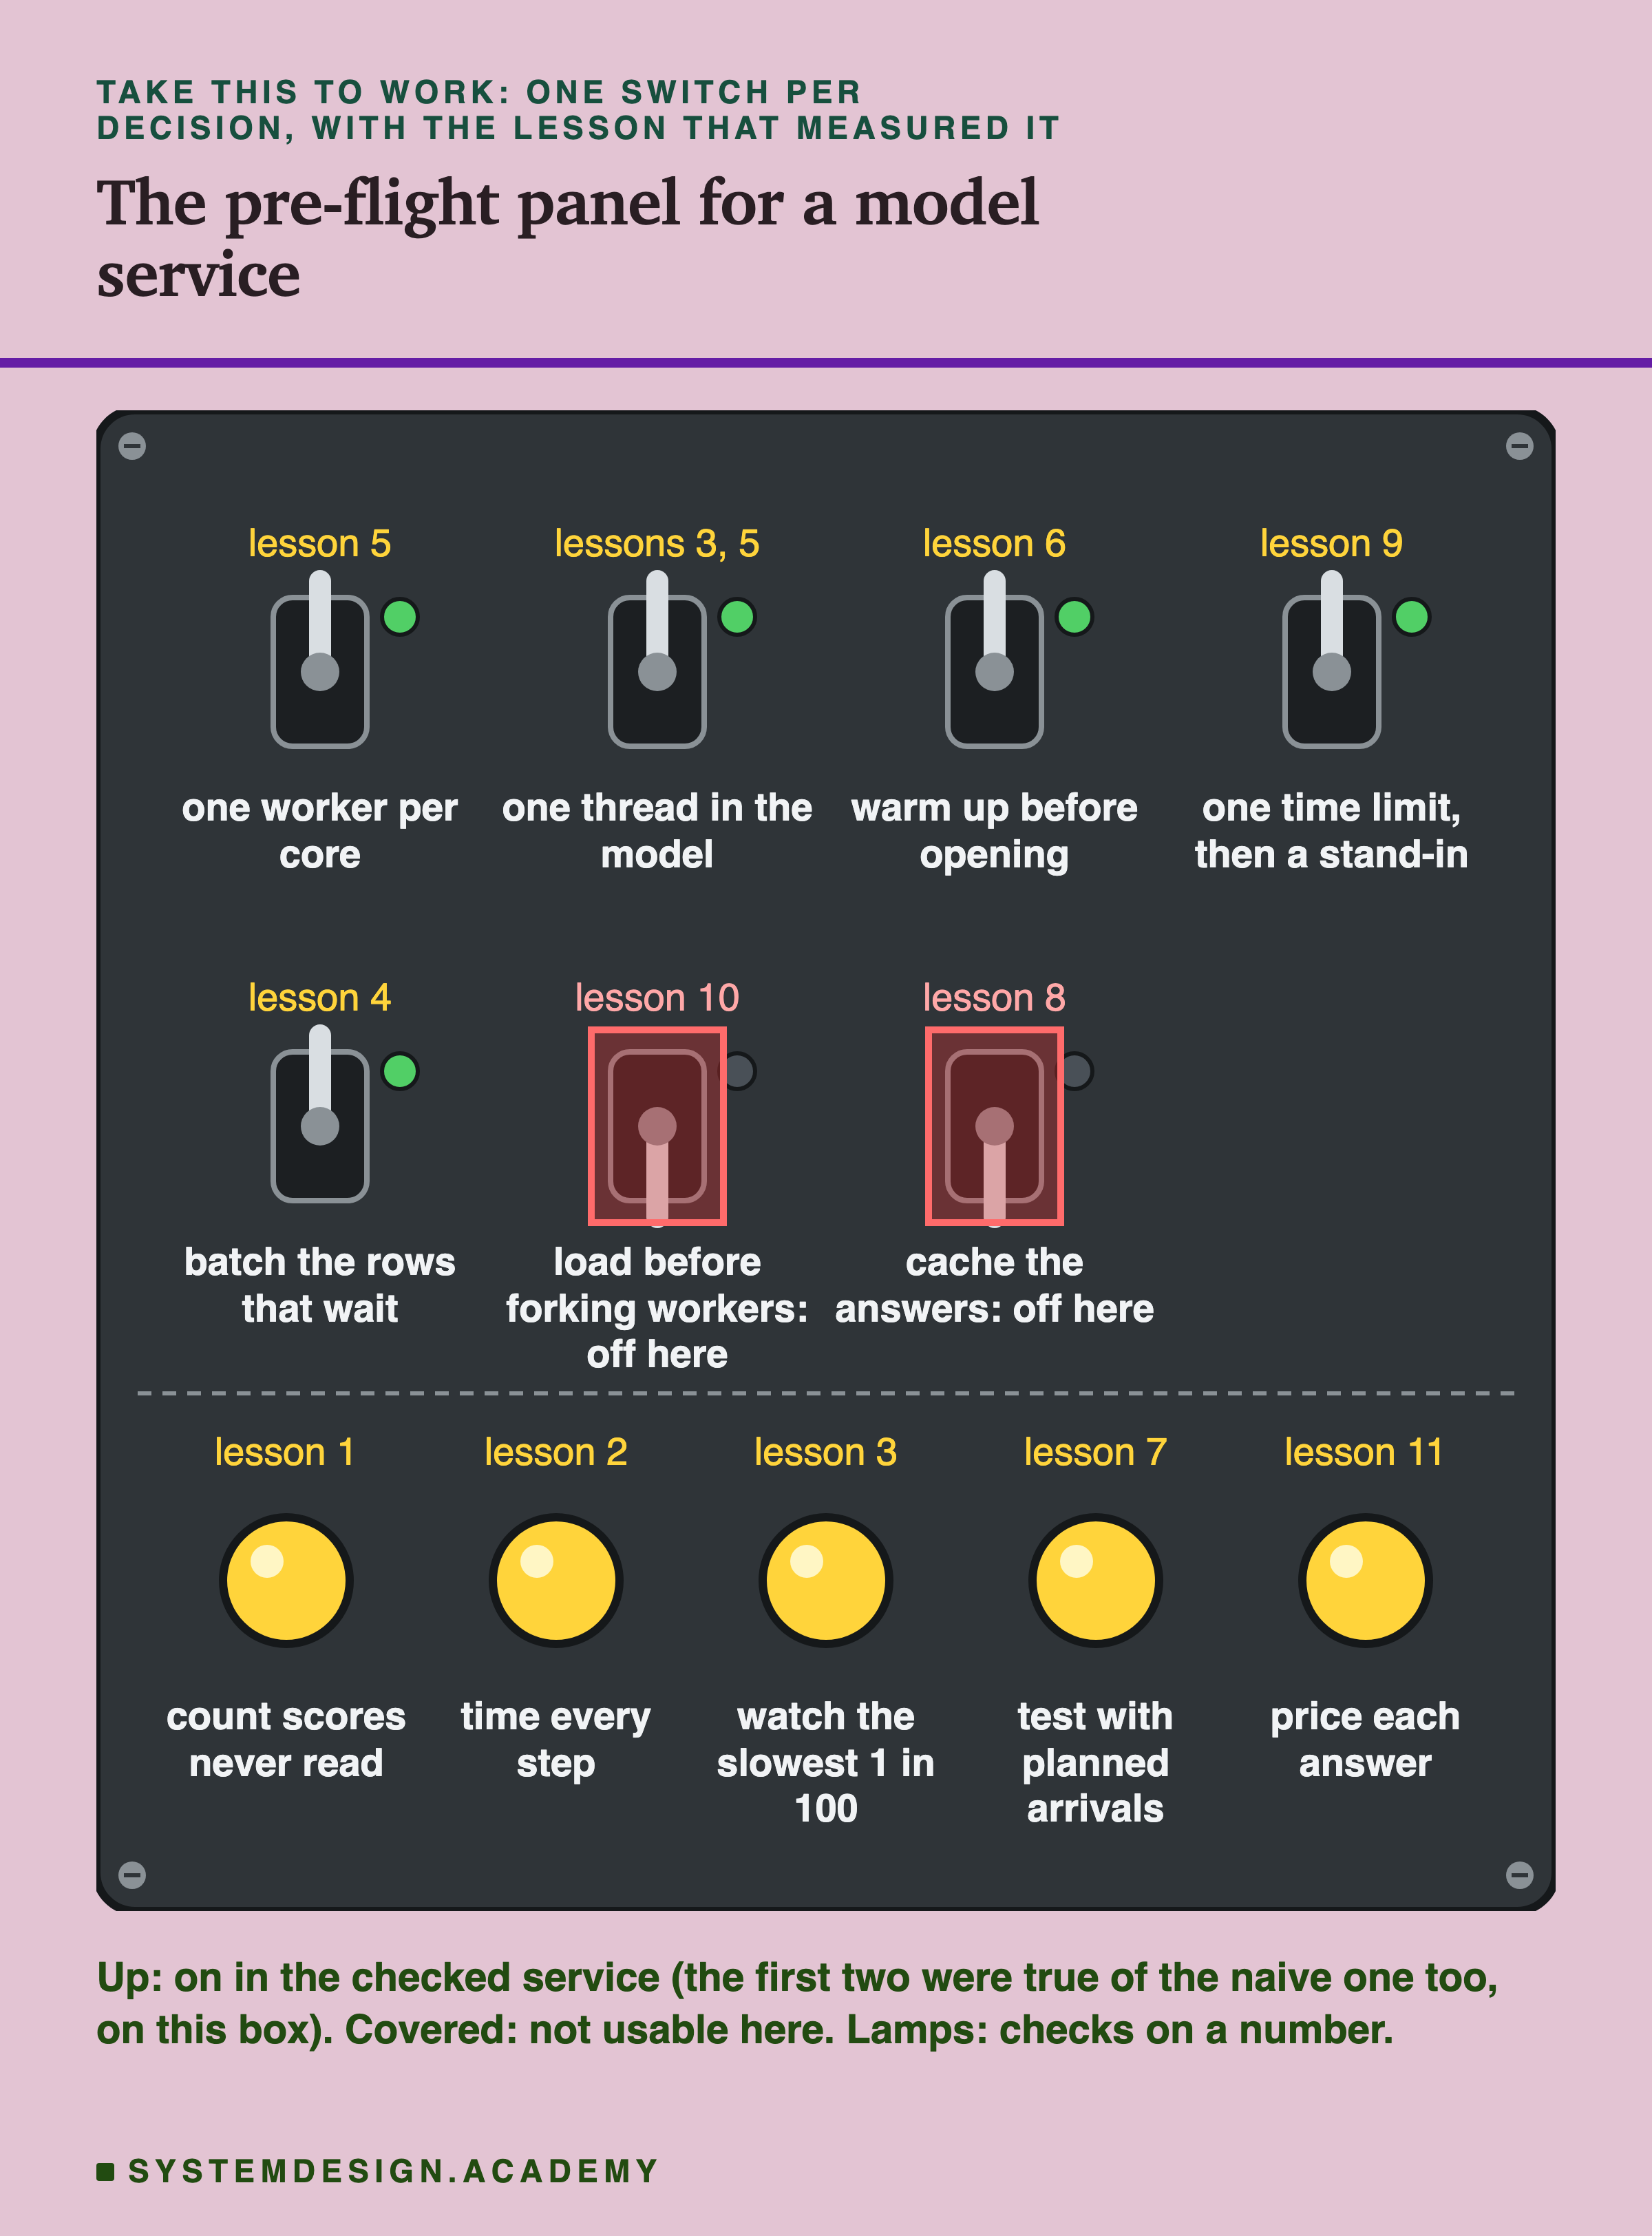
| Decision | Lesson | What it measured | When this does NOT apply |
|---|---|---|---|
| Decide online or nightly by counting how many scores are read | 1 | a month-old score could not be told apart from a live one in ranking, and 99.1% of nightly scores were never read | when the answer changes within hours, or a new customer needs a score before tonight |
| Time every step of one request before changing anything | 2 |
Does This Item Apply to Me?
A checklist is only useful if you know which lines to skip. This little decision tree asks the three questions that decided it here.
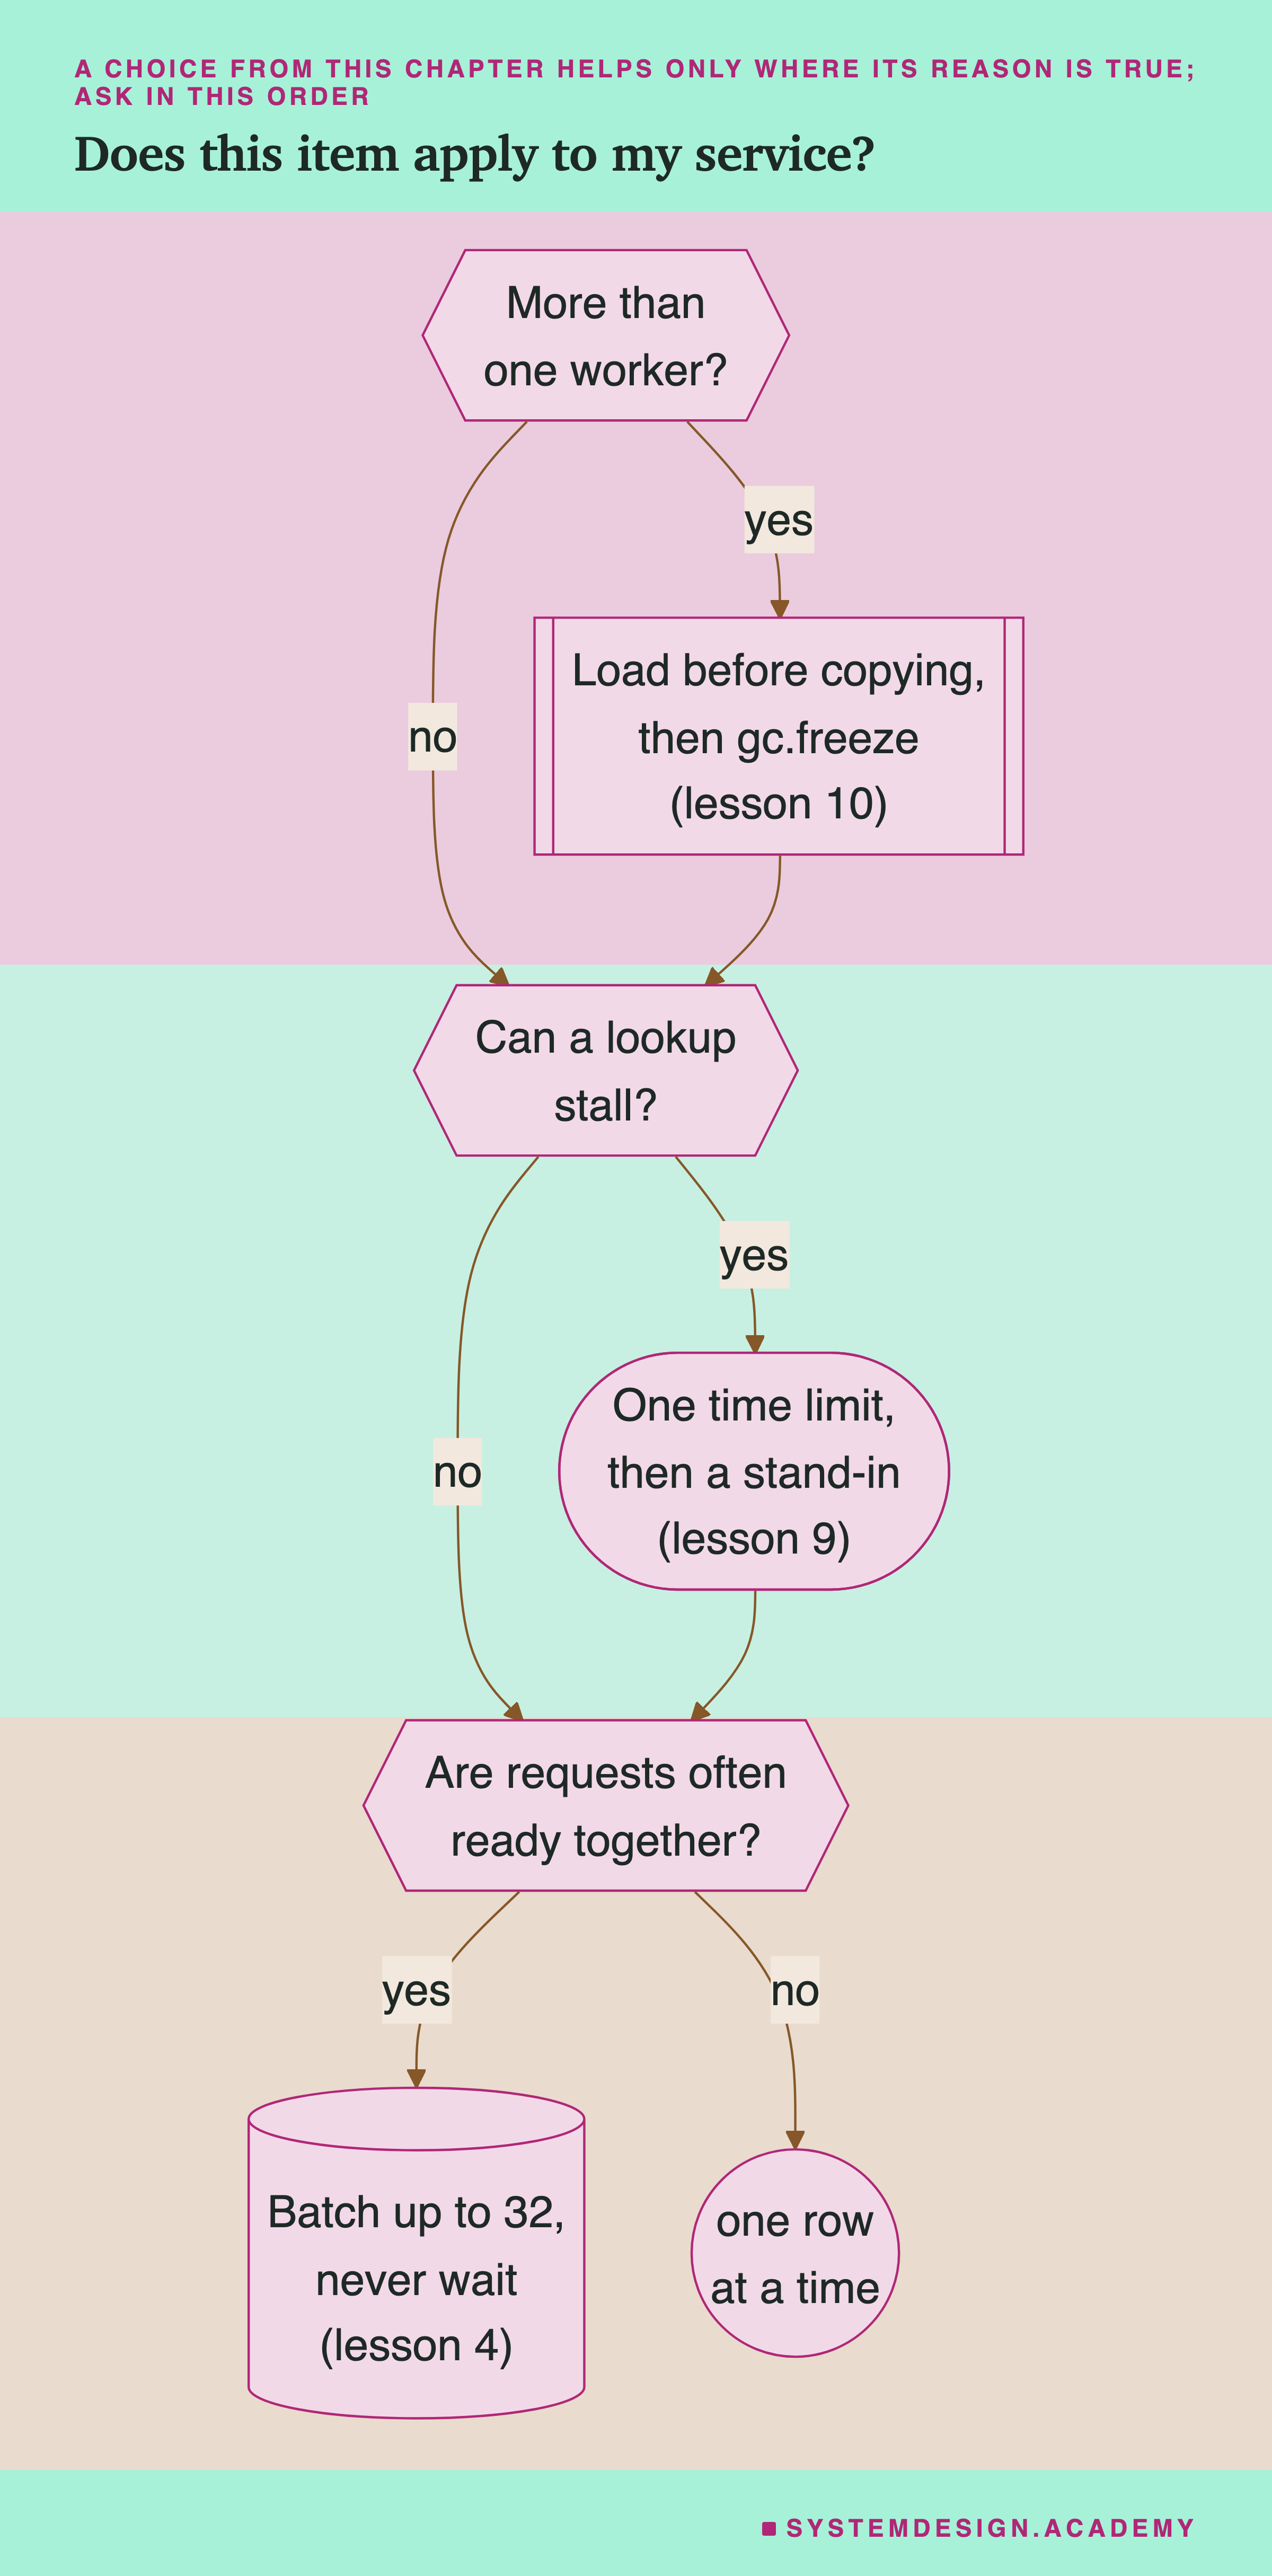
Start with how many workers you run. With more than one, lesson 10's recipe saves memory: load the model once, then make the copies, which share it, then call gc.freeze. That call tells Python's memory cleaner to leave the shared memory alone, so it stays shared. With one worker, skip it.
Next, ask whether a lookup can stall. Your service may wait for something outside itself, such as a database, a or another service. If so, give the whole request one time limit and a stand-in answer, and watch the stand-in share. Lesson 9 and this lesson both found that without a limit, the slowest answers are as slow as the slowest helper.
Last, ask whether requests are often ready together. If several requests often arrive at the same moment, batch them. If not, a batcher does little, as this lesson's rows-per-call numbers showed.
A few lines apply almost everywhere. Warm up before the door opens. Test with planned arrivals, timed from the plan, as lesson 7 did. And on a computer with more cores than workers, set one thread per worker, because the library may otherwise pick many.
My Twelve Guesses Before the Run, Checked
I wrote twelve guesses into the lab before it ran. Each is quoted word for word from the docstring. Seven were right, two were partly right and three were wrong.
-
"G1. Naive at 300 a second: slowest 1 in 100 above 500 ms in at least 4 of 5 rounds (lesson 9's no-limit arm: 1,030 ms, but 29.6 ms in 1 round of 5). Max above 1,000 ms in every round." Partly right. The max was above 1,000 ms in every round, 1,961 to 2,003 ms. But the slowest 1 in 100 was above 500 ms in only 2 of 5 rounds; in the other 3 it was 29.9 to 39.9 ms.
-
"G2. Checked at 150, 300 and 450 a second: slowest 1 in 100 at most 25 ms in every round (close to built in)." Right: 23.5 to 24.5 ms. As the guess says, the limit builds most of this in.
-
"G3. Checked: max rate between 600 and 900 a second in every round, set by the store's 16 slots filling up (stand-ins above 5%), not by the core." Wrong on the numbers: 450, 600, 300, 450 and 450. The reason was right: every run that set a max rate failed on the live condition alone, with its slowest 1 in 100 still under 25 ms. From 800 a second the runs also failed on time.
-
"G4. Naive: no rate passes in at least 4 of 5 rounds (max rate "none"); naive at 150 a second may pass in a round where the hangs land just above the 1-in-100 mark." Right. No rate passed in any round. The second half could not happen: with this store, about 1.6 lookups in 100 are slow, not 1.
-
"G5. Launch to first answer between 1,200 and 2,500 ms in both arms; checked minus naive within plus or minus 100 ms and too close to call (the warm-up moves work before the port opens; it does not remove it)." Right: middle values 1,716 to 1,752 ms, never clearly different.
-
"G6. The first request's own wait: checked below naive in all 5 rounds at every rate, clearly different." Wrong. The middle values were lower for the checked service at every rate, but the gap was clear at only 1 rate of 10.
-
"G7. Checked at 300 a second: stand-in share between 1.0% and 2.5% in every round (lesson 9: 1.62%)." Right: 1.26% to 2.09%.
Try It Yourself
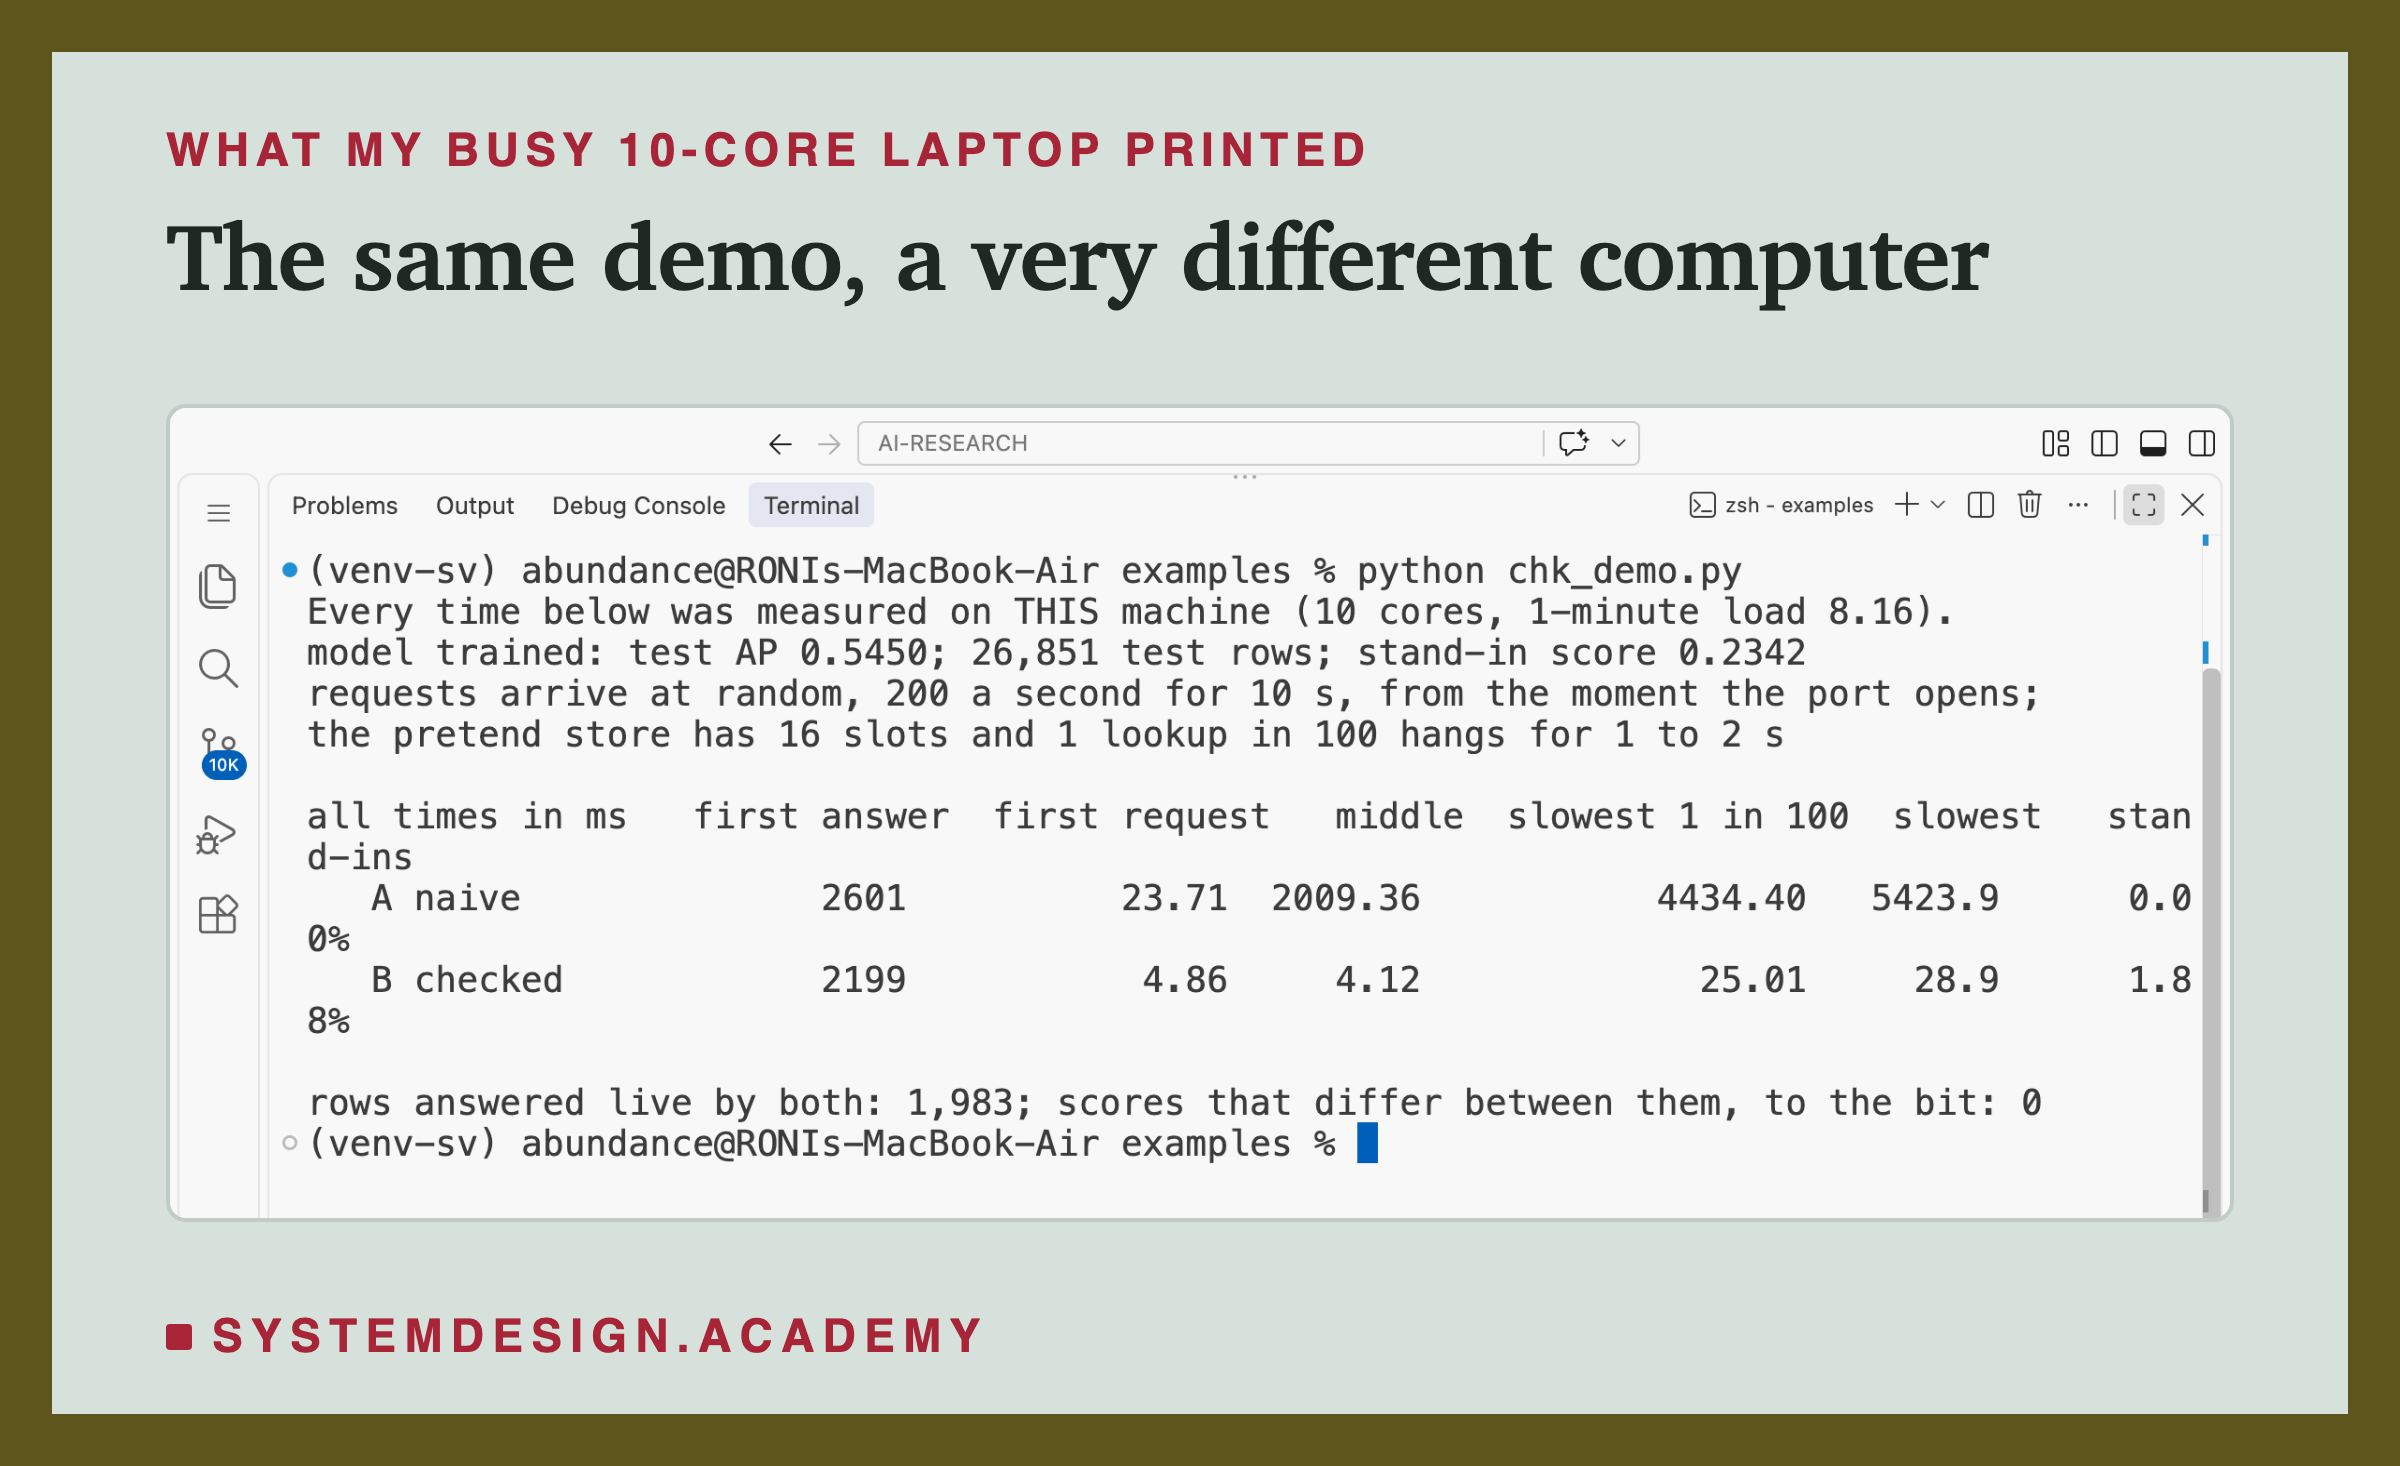
The full lab needs a rented machine for about an hour and a half. The demo, chk_demo.py, runs on your own computer. It starts the naive service and then the checked one, each from cold. It sends both one stream of random traffic, with lesson 9's pretend slow store inside, and prints a small table.
I wrote the demo's design into its docstring after the lab's design and before the demo first ran.
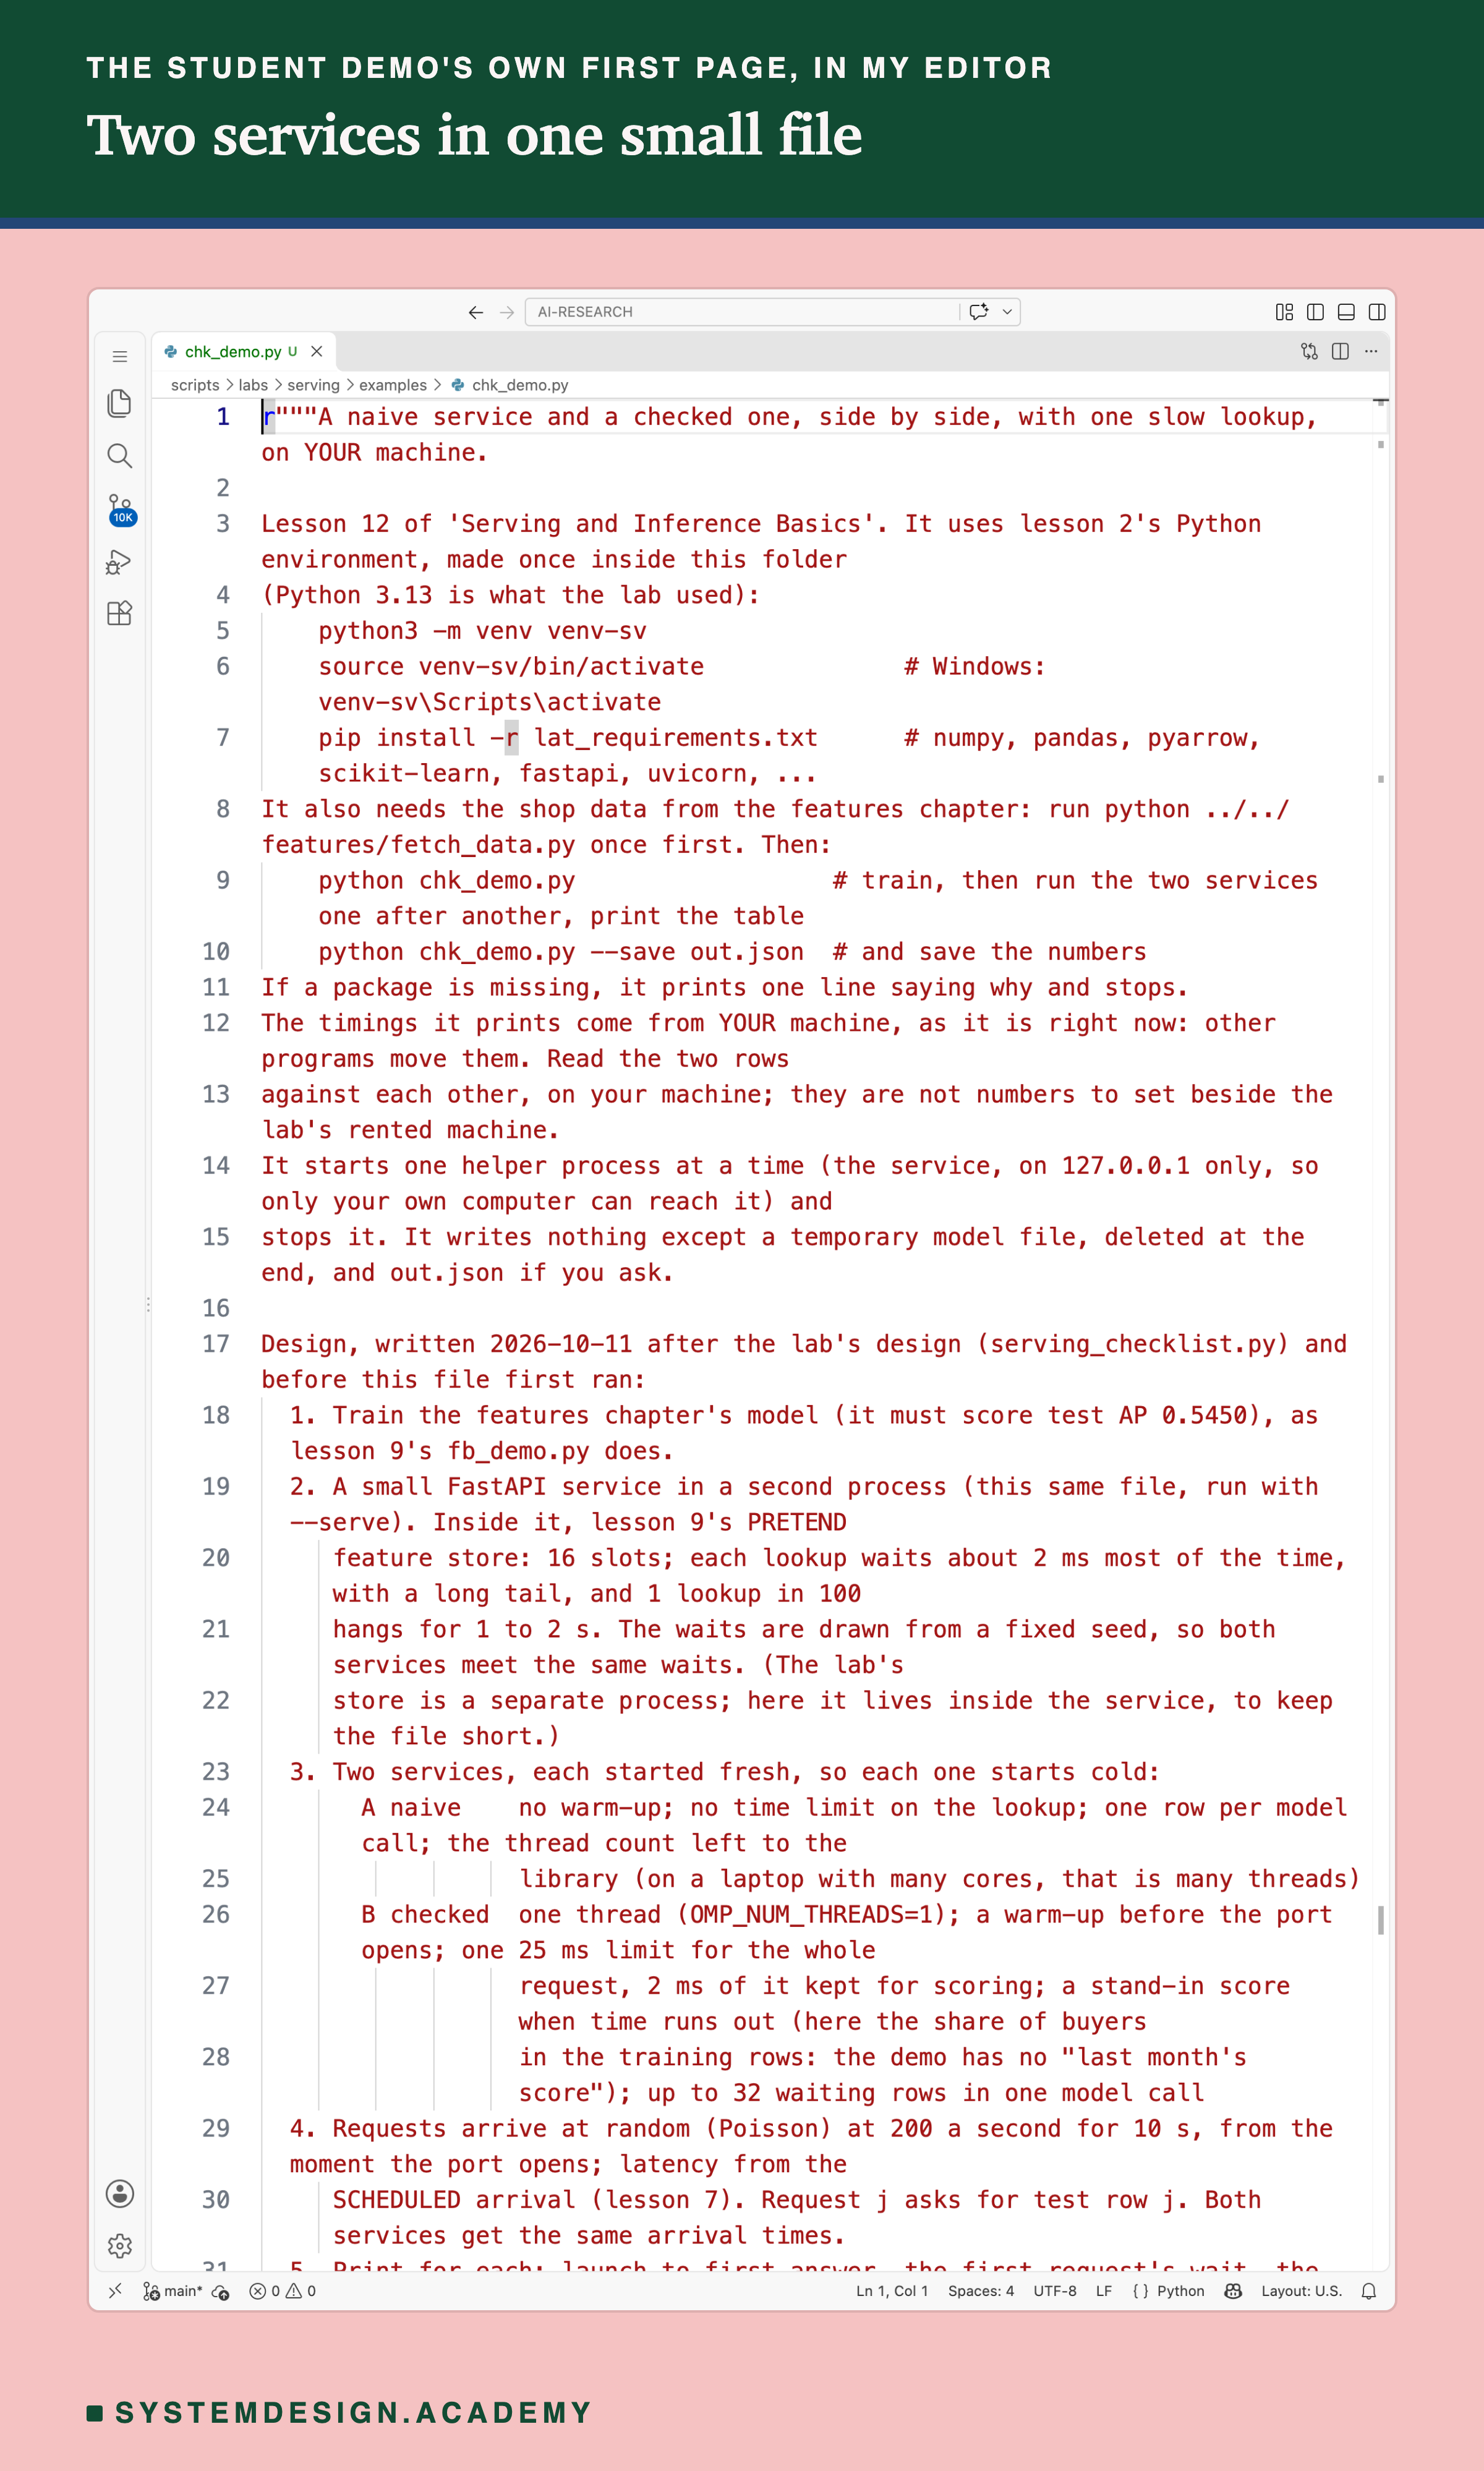
Before you run this lab. The demo uses lesson 2's Python environment, with the library versions of the lab's machine. If you made it for lessons 2 to 11, use it again. If not, make it once, inside the scripts/labs/serving/examples folder:
python3 -m venv venv-sv
source venv-sv/bin/activate        # on Windows: venv-sv\Scripts\activate
pip install -r lat_requirements.txt
I used Python 3.13. Then run python ../../features/fetch_data.py once, which downloads the shop data. Now run python chk_demo.py in the examples folder, with venv-sv active. It needs no graphics card, no cloud account and no administrator rights. If a package is missing, it prints one line saying why and stops. The service it starts listens on 127.0.0.1, an address only your own computer can reach.
The first line it prints says the numbers come from your machine, with its number of cores and its load at that moment. The demo also prints the model's AP, a score from 0 to 1 for how well the model ranks customers. It must be 0.5450, which proves it is the chapter's model. On a laptop with many cores, the naive service also uses many threads inside the model, which lesson 5 found slower. Read the two rows against each other, on your machine.
r"""A naive service and a checked one, side by side, with one slow lookup, on YOUR machine.

Lesson 12 of 'Serving and Inference Basics'. It uses lesson 2's Python environment, made once inside this folder
(Python 3.13 is what the lab used):
    python3 -m venv venv-sv
    source venv-sv/bin/activate              # Windows: venv-sv\Scripts\activate
    pip install -r lat_requirements.txt      # numpy, pandas, pyarrow, scikit-learn, fastapi, uvicorn, ...
It also needs the shop data from the features chapter: run python ../../features/fetch_data.py once first. Then:
    python chk_demo.py                  # train, then run the two services one after another, print the table
    python chk_demo.py --save out.json  # and save the numbers
If a package is missing, it prints one line saying why and stops.
The timings it prints come from YOUR machine, as it is right now: other programs move them. Read the two rows
against each other, on your machine; they are not numbers to set beside the lab's rented machine.
It starts one helper process at a time (the service, on 127.0.0.1 only, so only your own computer can reach it) and
stops it. It writes nothing except a temporary model file, deleted at the end, and out.json if you ask.

Design, written 2026-10-11 after the lab's design (serving_checklist.py) and before this file first ran:
  1. Train the features chapter's model (it must score test AP 0.5450), as lesson 9's fb_demo.py does.
  2. A small FastAPI service in a second process (this same file, run with --serve). Inside it, lesson 9's PRETEND
     feature store: 16 slots; each lookup waits about 2 ms most of the time, with a long tail, and 1 lookup in 100
     hangs for 1 to 2 s. The waits are drawn from a fixed seed, so both services meet the same waits. (The lab's
     store is a separate process; here it lives inside the service, to keep the file short.)
  3. Two services, each started fresh, so each one starts cold:
       A naive    no warm-up; no time limit on the lookup; one row per model call; the thread count left to the
                  library (on a laptop with many cores, that is many threads)
       B checked  one thread (OMP_NUM_THREADS=1); a warm-up before the port opens; one 25 ms limit for the whole
                  request, 2 ms of it kept for scoring; a stand-in score when time runs out (here the share of buyers
                  in the training rows: the demo has no "last month's score"); up to 32 waiting rows in one model call
  4. Requests arrive at random (Poisson) at 200 a second for 10 s, from the moment the port opens; latency from the
     SCHEDULED arrival (lesson 7). Request j asks for test row j. Both services get the same arrival times.
  5. Print for each: launch to first answer, the first request's wait, the middle wait, the slowest 1 in 100, the
     slowest of all, and the stand-in share. Then: rows answered live by both, and how many of them differ.

Author: Roni Das
Created: 2026-10-11
"""
import importlib.util
import json
import os
import socket
import subprocess
import sys
import tempfile
import threading
import time
from pathlib import Path
from queue import Queue
from time import perf_counter

NEEDED = ("numpy", "pandas", "pyarrow", "sklearn", "fastapi", "uvicorn")
missing = [m for m in NEEDED if importlib.util.find_spec(m) is None]
if missing:
    sys.exit(f"chk_demo.py needs {', '.join(missing)}: make the environment in its docstring "
             f"(pip install -r lat_requirements.txt), then run it with that environment's python.")

import numpy as np  # noqa: E402

RATE, SECONDS = 200, 10.0
WAYS = ("A naive", "B checked")


# ───────────────────────────── the service (python chk_demo.py --serve PORT FILE WAY) ─────────────────────────────
def serve(port: int, data_path: str, way: str) -> None:
    import asyncio
    import pickle
    from contextlib import asynccontextmanager

    import uvicorn
    from fastapi import FastAPI, Request
    from starlette.responses import Response

    checked = way == "B checked"
    d = pickle.loads(Path(data_path).read_bytes())
    model, X, stand_in = d["model"], d["X"], d["stand_in"]
    rng = np.random.default_rng(0)                    # the same waits for both services
    wait = 0.002 * np.exp(rng.standard_normal(len(X)))
    hang = rng.random(len(X)) < 0.01
    wait = np.where(hang, rng.uniform(1.0, 2.0, len(X)), wait)
    slots: list = []
    queue: list = []
    have: list = []

    async def store(row: int) -> list[float]:
        """The pretend feature store: wait for one of 16 slots, hold it for the drawn time, answer."""
        if not slots:
            slots.append(asyncio.Semaphore(16))
        async with slots[0]:
            if row >= 0:
                await asyncio.sleep(float(wait[row]))
        return X[max(row, 0)].tolist()

    async def batcher() -> None:
        """Up to 32 waiting rows in one model call; never waits on purpose for more."""
        while True:
            if not queue:
                have[0].clear()
                await have[0].wait()
            await asyncio.sleep(0)
            take = queue[:32]
            del queue[:32]
            p = model.predict_proba(np.array([f for f, _ in take], dtype=np.float64))[:, 1]
            for (_, fut), s in zip(take, p):
                fut.set_result(float(s))

    @asynccontextmanager
    async def lifespan(_app):
        if checked:                                   # the warm-up, before the port opens
            have.append(asyncio.Event())
            asyncio.get_running_loop().create_task(batcher())
            f = await store(-1)
            model.predict_proba(np.array([f], dtype=np.float64))
            model.predict_proba(np.array([f] * 32, dtype=np.float64))
        yield

    app = FastAPI(lifespan=lifespan)

    @app.post("/score")
    async def score(request: Request) -> Response:
        t_in = perf_counter()
        q = json.loads(await request.body())
        if not checked:
            feats = await store(q["row"])                                   # no time limit
            p = float(model.predict_proba(np.array([feats], dtype=np.float64))[0, 1])
            out = {"id": q["id"], "score": p, "stand_in": False}
        else:
            left = t_in + 0.025 - 0.002 - perf_counter()                    # one budget for the whole request
            try:
                feats = await asyncio.wait_for(store(q["row"]), max(left, 0.0))
            except TimeoutError:
                feats = None
            if feats is None:
                out = {"id": q["id"], "score": stand_in, "stand_in": True}
            else:
                fut = asyncio.get_running_loop().create_future()
                queue.append((feats, fut))
                have[0].set()
                out = {"id": q["id"], "score": await fut, "stand_in": False}
        return Response(content=json.dumps(out).encode(), media_type="application/json")

    uvicorn.run(app, host="127.0.0.1", port=port, log_level="warning")


# ───────────────────────────── the model ─────────────────────────────
def build():
    """The features chapter's model and its test rows (lesson 9's fb_demo.py build step)."""
    from sklearn.metrics import average_precision_score
    here = Path(__file__).resolve().parent
    sys.path.insert(0, str(here.parents[1] / "features"))
    import task
    from what_a_feature_is import HAND_COLS, hgb, joined

    ev = task.load_events()
    lab_tr, _, lab_te = task.splits(ev)
    tr = joined(ev, lab_tr, task.TRAIN_CUTOFFS)
    te = joined(ev, lab_te, task.TEST_CUTOFFS)
    model = hgb(0).fit(tr[HAND_COLS].to_numpy(float), tr["label"].to_numpy())
    X = np.ascontiguousarray(te[HAND_COLS].to_numpy(np.float64))
    p = model.predict_proba(X)[:, 1]
    y, cut = te["label"].to_numpy(), te["cutoff"].to_numpy()
    ap = float(np.mean([average_precision_score(y[cut == c], p[cut == c]) for c in np.unique(cut)]))
    assert round(ap, 4) == 0.5450, ap
    return model, X, ap, float(tr["label"].mean())


# ───────────────────────────── launch, then the open-loop tester (lesson 7's) ─────────────────────────────
def connect(port: int):
    import http.client
    c = http.client.HTTPConnection("127.0.0.1", port, timeout=30)
    c.connect()
    c.sock.setsockopt(socket.IPPROTO_TCP, socket.TCP_NODELAY, 1)
    return c


def run_way(way: str, data_path: str, n_rows: int) -> dict:
    s = socket.socket()
    s.bind(("127.0.0.1", 0))
    port = s.getsockname()[1]
    s.close()
    env = {k: v for k, v in os.environ.items() if k != "OMP_NUM_THREADS"}
    if way == "B checked":
        env["OMP_NUM_THREADS"] = "1"
    rng = np.random.default_rng(1)                    # the same arrivals for both services
    at = np.cumsum(rng.exponential(1 / RATE, size=int(RATE * SECONDS * 1.5) + 50))
    at = at[at < SECONDS]
    lats = np.zeros(len(at))
    answers: list = [None] * len(at)
    done_at = np.zeros(len(at))
    q: Queue = Queue()
    start = [0.0]
    t_launch = perf_counter()
    svc = subprocess.Popen([sys.executable, __file__, "--serve", str(port), data_path, way], env=env)
    try:
        while True:
            try:
                socket.create_connection(("127.0.0.1", port), timeout=1).close()
                break
            except OSError:
                time.sleep(0.001)

        def sender() -> None:
            c = connect(port)
            while True:
                j = q.get()
                if j is None:
                    break
                c.request("POST", "/score", body=json.dumps({"id": j, "row": j % n_rows}),
                          headers={"Content-Type": "application/json"})
                answers[j] = json.loads(c.getresponse().read())
                done_at[j] = perf_counter()
                lats[j] = done_at[j] - (start[0] + at[j])          # from the SCHEDULED arrival
            c.close()

        pool = [threading.Thread(target=sender, daemon=True) for _ in range(64)]
        for th in pool:
            th.start()
        start[0] = perf_counter() + 0.002
        for j, a in enumerate(at):
            d = start[0] + a - perf_counter()
            if d > 0:
                time.sleep(d)
            q.put(j)
        for _ in pool:
            q.put(None)
        for th in pool:
            th.join()
    finally:
        svc.terminate()
        svc.wait()
    lat = lats * 1000
    return {"n": len(lat), "first_answer_ms": (done_at.min() - t_launch) * 1000, "first_request_ms": lat[0],
            "p50": float(np.percentile(lat, 50)), "p99": float(np.percentile(lat, 99)), "max": float(lat.max()),
            "stand_in_share": float(np.mean([a["stand_in"] for a in answers])),
            "scores": [None if a["stand_in"] else a["score"] for a in answers]}


def main() -> None:
    try:
        load = f"{os.getloadavg()[0]:.2f}"
    except (AttributeError, OSError):
        load = "not available on this system"
    n = os.cpu_count()
    print(f"Every time below was measured on THIS machine ({n} {'core' if n == 1 else 'cores'}, 1-minute load {load}).")
    model, X, ap, stand_in = build()
    print(f"model trained: test AP {ap:.4f}; {len(X):,} test rows; stand-in score {stand_in:.4f}")
    print(f"requests arrive at random, {RATE} a second for {SECONDS:.0f} s, from the moment the port opens;")
    print("the pretend store has 16 slots and 1 lookup in 100 hangs for 1 to 2 s\n")
    import pickle
    out = {"load": load, "cores": n, "test_ap": ap, "ways": {}}
    print("all times in ms   first answer  first request   middle  slowest 1 in 100  slowest   stand-ins")
    res = {}
    with tempfile.TemporaryDirectory() as tmp:
        dp = Path(tmp) / "data.pkl"
        dp.write_bytes(pickle.dumps({"model": model, "X": X, "stand_in": stand_in}))
        for way in WAYS:
            r = run_way(way, str(dp), len(X))
            res[way] = r
            out["ways"][way] = {k: v for k, v in r.items() if k != "scores"}
            print(f"   {way:<12}{r['first_answer_ms']:13.0f}{r['first_request_ms']:15.2f}{r['p50']:9.2f}"
                  f"{r['p99']:18.2f}{r['max']:9.1f}{r['stand_in_share']:11.2%}")
    a, b = res["A naive"]["scores"], res["B checked"]["scores"]
    both = [(x, y) for x, y in zip(a, b) if x is not None and y is not None]
    diff = sum(x != y for x, y in both)
    print(f"\nrows answered live by both: {len(both):,}; scores that differ between them, to the bit: {diff}")
    out["live_both"], out["live_differ"] = len(both), diff
    if "--save" in sys.argv:
        Path(sys.argv[sys.argv.index("--save") + 1]).write_text(json.dumps(out, indent=1))


if __name__ == "__main__":
    if len(sys.argv) > 1 and sys.argv[1] == "--serve":
        serve(int(sys.argv[2]), sys.argv[3], " ".join(sys.argv[4:]))
    else:
        main()
Flip the Switches Yourself
This box runs in your browser and needs nothing but Python. It is a make-believe service with a pretend clock: a pretend store with 16 places, 1 lookup in 100 hanging, and one core. The time each step takes comes from lessons 2, 3 and 4, with its source written next to it. Everything else is made up.
Press Run. Then switch the items off one at a time. With TIME_LIMIT = False the slowest answers jump to about a second. With WARM_UP = False only the first request's wait changes. With BATCHING = False only the rows per call change, because at 300 requests a second few requests are ready together. Then set RATE = 1000 with the time limit on, and watch the stand-ins take over, as they did on the real box.
Every random draw has its own list of dice rolls, written down first. So switching an item on or off meets exactly the arrivals and the lookups it met before. A seed is the number that picks which lists of dice rolls you get, and one seed is luck, so it runs five.
The report script writes the box's real numbers at 300 requests a second into the last line, so you can compare. With all three items on, the pretend service's slowest 1 in 100 is exactly 23.5 ms in every seed. That is 23 ms of limit plus one request's work, so it is built in. About 1.7% to 2.0% of its answers are stand-ins; the box measured 23.75 ms and 1.71%.
With TIME_LIMIT = False the pretend service prints slowest-1-in-100 times above a second in all five seeds, while the box's middle round at 300 a second was only 39.9 ms. The box simply got fewer slow lookups than average in 3 of its 5 rounds, so its slowest 1 in 100 landed just below the hangs. The pretend service is also simpler than the real one. Its time limit starts at the request's arrival. It charges the core a fixed time for each request. And its store never slows down from its own work.
The Lab's Code, Piece by Piece
The lab has one file that runs on my laptop, small files that run on the rented machine, and the step script you saw above.
serving_checklist.py, on my laptop, holds the design and my twelve guesses in its docstring, written before any run, and a labelled note added after the runs. Its commands are check, which checks every file is there, and prepare, which copies lesson 9's two stand-in files. status reads the machine's console. cost works out the bill and checks that everything was deleted. The others are collect, which copies the raw files into results/chk-raw/ through chk_redact.py and does the arithmetic, and factcheck, which finds each outside claim in its source.
chk_files/chk_service.py is the service, both arms in one file. CHK_ARM is a setting the program reads when it starts, and it picks naive or checked. The file imports lesson 2's service unchanged, for the model and the shape of a request. The checked arm's warm-up runs in a start-up step that the web server, uvicorn, finishes before it opens the door. The batcher is lesson 4's, with no timed wait.
chk_files/chk_client.py is the tester. It starts the service itself, so the cold start and the traffic are read on one clock. Then it runs lesson 7's timetable of requests and checks every answer against the machine's own reference score, to the last digit.
When to Use the Checklist, and When Not To
Use it as a list of questions, not a list of answers. Each line says what to measure, and why. The numbers belong to one small model on one small machine. Your model, your helper and your traffic will give different numbers, and maybe a different answer.
A time limit with a stand-in belongs wherever a request waits for something outside the service. But watch the stand-in share as closely as the waiting times. A service can look fast while it quietly stops answering with the model, as the checked service did above 600 requests a second. The limit hides a full helper; it does not fix one.
Do not copy a setting that has no reason to apply. Loading the model before copying workers saves memory only when there are several workers. A cache helps only when the same question comes back and an old answer is still a good answer. A batcher helps only when requests are ready together.
Do not judge a service by its first answer. Both services here took about 1.7 seconds to give their first answer, almost all of it Python starting. If a service must answer fast right after it starts, the fix is to keep a warm copy running, not to warm it faster.
And do not trust a load test that you did not run with planned arrivals. Every number in this lesson was timed from the planned moment. A polite tester would have hidden the hung lookups, as lesson 7 showed.
What This Lab Cannot Tell You
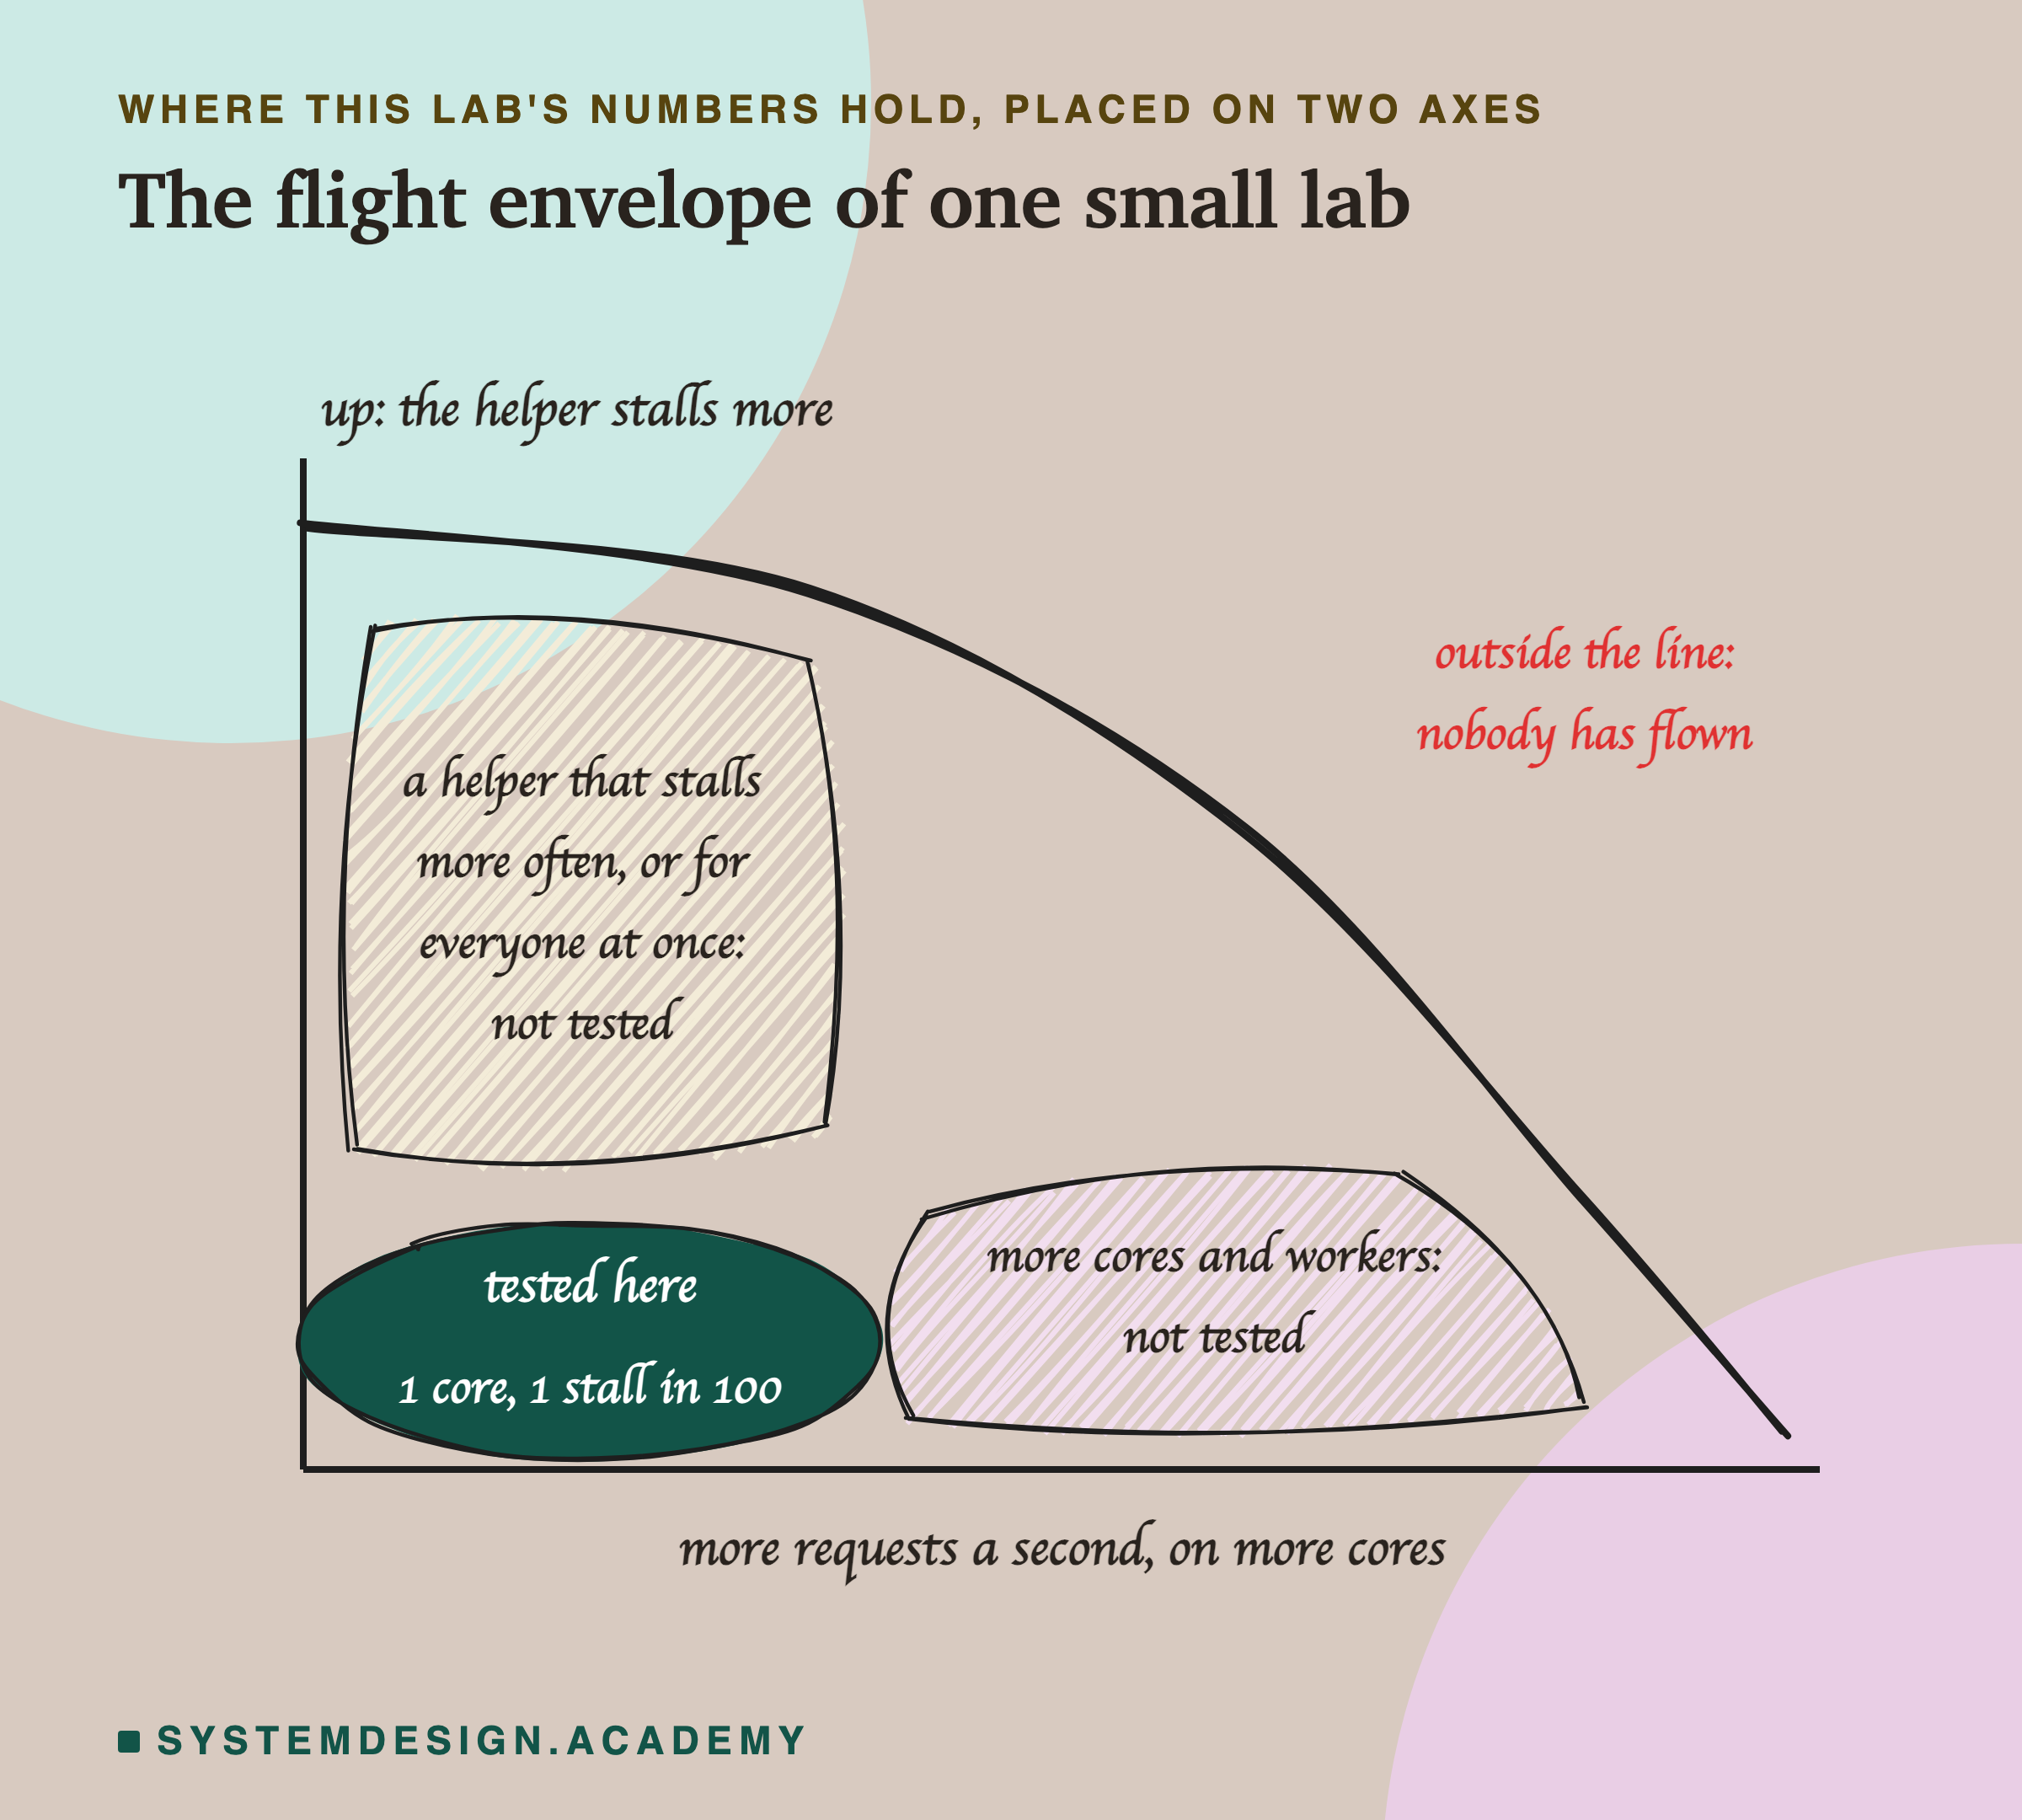
Everything shared one core, the tester included. On a bigger machine with one worker per core, the numbers would change, and lesson 5's advice was never tested beyond one core.
The slow helper was lesson 9's pretend store, on the same box, with slow lookups that use no processor time and are independent of each other. A real store across a network can be slow for everyone at once. Its size was chosen by hand in lesson 9, and that size set the checked service's limit here.
The model is small and runs on the processor. A big neural network on a graphics card would spend its time very differently, and batching would matter much more. That case sits on neither axis of the picture above: it is a different kind of lab.
The traffic was steady and random, for 15 seconds a run. Real traffic rises and falls, and a cold start can land in the busy hour.
The first schedule stopped on its first counted run because of a fault in the run script, which step 7b explains. I fixed it and restarted. No counted run came from the first schedule, and nothing about the arms changed. I logged in four times to find the fault, while nothing was running, and the commands are shown above. The copy step was recorded twice, because the first recording lost its top lines.
One setting from lesson 9 was not tried. Passing the deadline down to the store, so it drops work nobody waits for, was not on this lesson's list. On this box it is the most likely way to push the checked service past 450 requests a second.
Knowledge Check
Knowledge Check
4 questions - Score 80% to pass
The naive service never met the 25 ms target, not even at 150 requests a second. What was the main reason?
Above 600 requests a second, the checked service's slowest answers stayed near 25 ms. What failed first?
The checked service warmed up before opening its door. What did that change?
This lab used one worker. Why was lesson 10's recipe, loading the model before copying workers and then gc.freeze, left out?