Contents Part 1 · The SOC from zero
Part 1 · The SOC from zero
What a security operations centre does all day, told through one ordinary shift
Who works in a SOC, what tier 1, tier 2 and tier 3 analysts do, and why most of the day is deciding which alerts matter.
Free page Code zip with this page
About 30 minutes to read, and about 15 minutes for the hands-on lab.
Your progress0 of 6 checks answered right
It fills only when a prediction matches the measured result. Reading a page does not move it. It is kept in this browser.
Hands-On AI SOC Analyst: Build AI Agents for Security Operations. Part 1, The SOC from zero.
Download the code for this page: lesson-1.1.zip. It holds START-HERE.md with every step and its expected output, the code, the real alerts from our lab, the diagrams, and this page as a PDF.
The introduction showed one attack and the alerts it raised. This page steps back and shows the people who read those alerts: who works in a security operations centre, what each of them does, and how an ordinary shift really goes. Then you work through a real shift's alerts yourself, the way a junior analyst does on the first day.
After this page you will be able to:
- say who works in a SOC, and what tier 1, tier 2 and tier 3 analysts each do;
- explain why most of an analyst's day is deciding which alerts matter;
- read a real queue of Wazuh alerts, most serious first, and say which one to open first and why;
- tell two alerts with the same rule apart by the evidence around them;
- name the four steps of the triage routine: look, enrich, decide and record.
What you need first: the page "Before you start", or simply Python 3.10 or newer. This page runs on the real alerts saved in the zip, so you do not need the lab running. If your cloud lab from "Before you start" is running, you can pull your own alerts too.
Time: about 35 minutes, with 10 minutes of hands-on.
Dates and times: every time on this page is in UTC, the time zone the logs use. Our lab run was on 13 November 2026, from 02:09 to 02:12 UTC, which was 07:39 to 07:42 in the morning where we work, in India.

The problem: forty alerts before lunch, and only one of them matters
Picture Asha on her first week as a junior analyst. She opens her screen at nine in the morning, and there is already a list of alerts waiting: a failed login here, a new user account there, a server that reported a changed setting. By lunch the list has grown by forty more. Her team lead told her one thing on the first day: "Most of these are nothing. Your job is to find the one that is not, and to be able to say why you closed the others."
That is the whole problem of a security operations centre in two sentences. A company's computers produce a steady stream of alerts. Most of them are harmless: an employee who mistyped a password, an administrator who added an account, a backup job that touched a thousand files. A few are the beginning of an attack. They often look almost the same. If the SOC treats every alert as an emergency, the analysts drown and stop reading carefully. If it treats every alert as noise, the one real attack slips through.
Why it matters: a missed alert has a cost, and so does a false alarm
An attack that nobody notices keeps going. An attacker who guessed one password today may read the company's files tomorrow and lock them with ransomware next week, a program that scrambles a company's files and demands money to unlock them. The earlier a SOC notices, the smaller the damage. That is why a SOC runs day and night, and why analysts are measured on how quickly they notice a real attack and how quickly they respond to it.
A false alarm has a cost too. Every alert that turns out to be harmless still takes an analyst's time to check. When the harmless ones pile up, people start to skim, and skimming is how a real attack gets closed by mistake. Security teams call this alert fatigue: so many alerts that people stop reading them properly. The page "What an alert is, and why most alerts are noise" goes into it in depth. For now, keep one idea: the job is not to react to alerts, it is to judge them.
Who works in a SOC
A SOC is usually organised in tiers, like the floors of a building. An alert starts on the ground floor and climbs only when it has to:
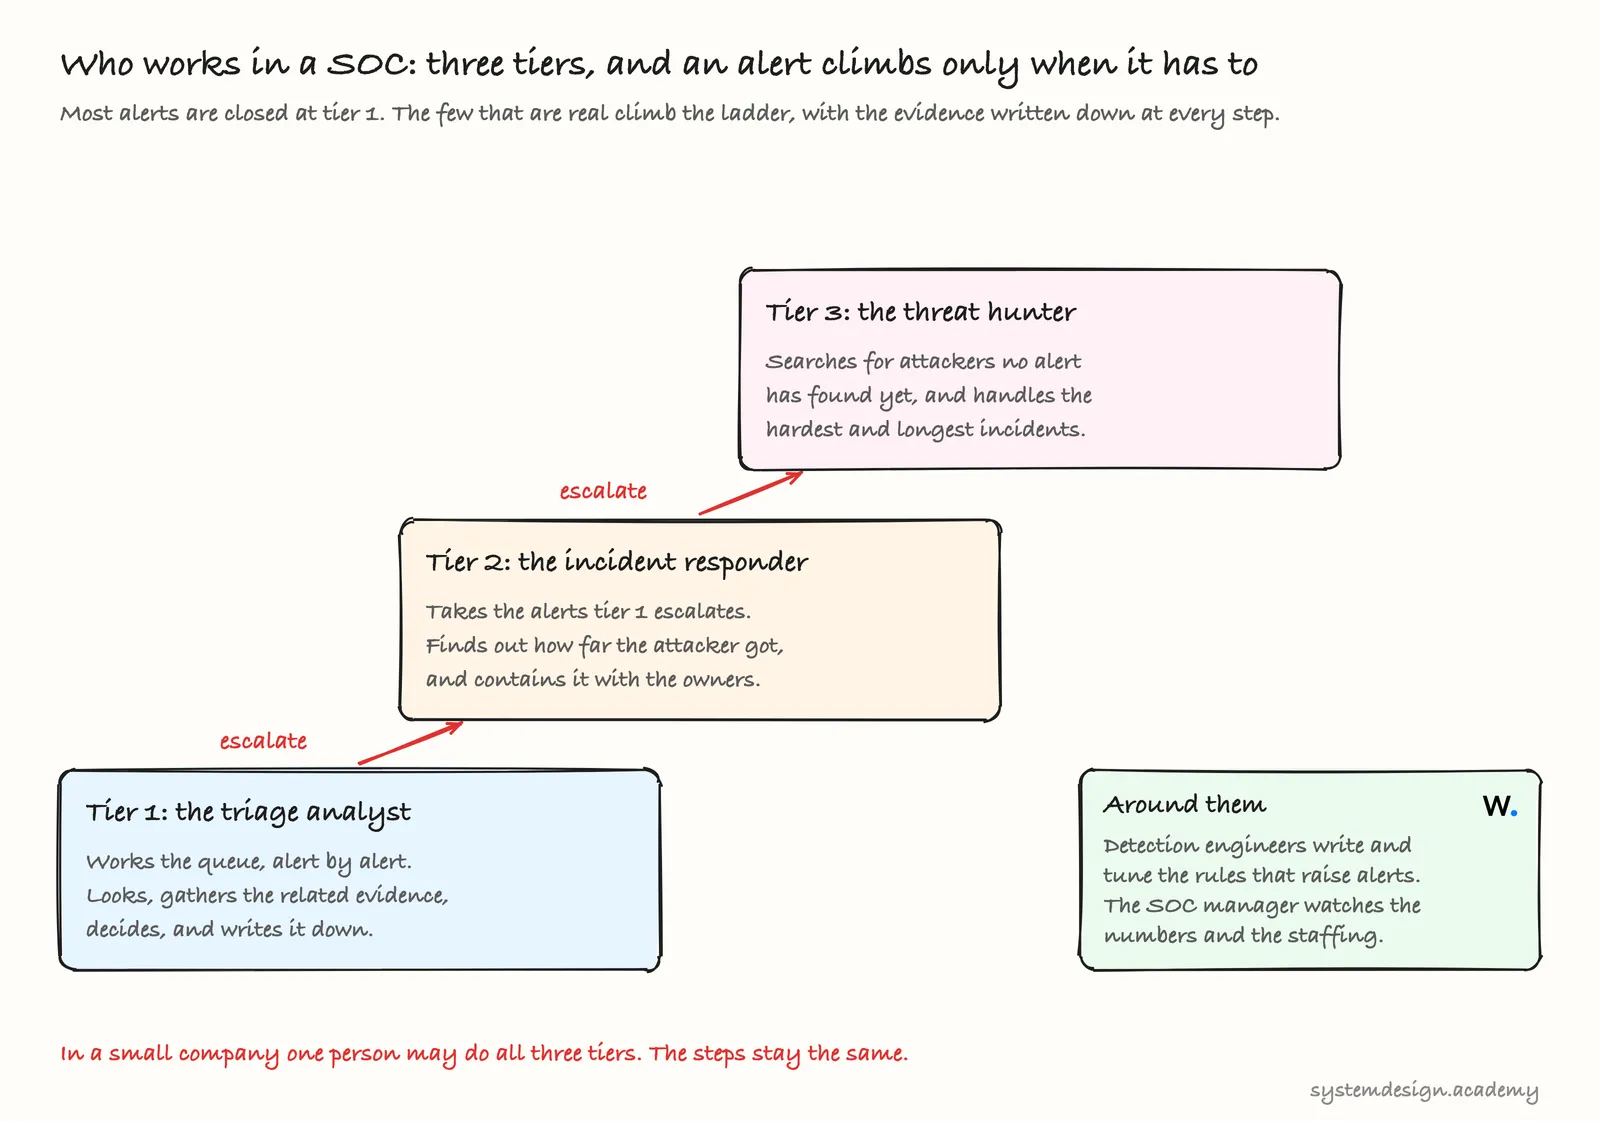
- Tier 1, the triage analyst. This is where almost everyone starts, and where Asha is. Tier 1 works the queue, the list of alerts waiting to be looked at, one alert at a time. For each one, they decide: harmless, needs a closer look, or real and urgent. Triage is a word borrowed from hospitals, where a nurse decides which patient a doctor sees first. Most alerts end here, closed, with a short note saying why.
- Tier 2, the incident responder. When tier 1 decides an alert is real, they escalate it, which means hand it up to the next tier with the evidence. Tier 2 finds out how far the attacker got: which machines, which accounts, which files. They work with the owners of those systems to contain the attack, which means stop it from spreading, for example by disconnecting a machine or resetting a password.
- Tier 3, the threat hunter. Tier 3 does not wait for alerts. They start from an idea about how an attacker might behave and search the logs for signs of it, to find attackers that no rule has noticed yet. They also take the hardest and longest incidents. Part 4 of this course teaches hunting.
- Around them are the detection engineers, who write and tune the rules that raise the alerts, and the SOC manager, who watches the numbers, such as how many alerts arrive each day and how long each one takes, and makes sure there are enough people on every shift.
In a large company these are different people, often in different time zones so the SOC never sleeps. In a small company one person may do all of it. The steps stay the same, which is why this course teaches the steps.
What a shift really looks like
A shift is mostly the queue. Alerts arrive at all hours, in bursts. Some come from attacks, many come from ordinary work, and the analyst sees only the alert at first, not the story behind it.
To show you a real queue, we ran a short shift on our cloud lab on 13 November 2026, the same lab as the introduction, in our own AWS account. Over about two and a half minutes, from 02:09:30 to 02:11:52 in UTC, three things happened, the same mix of ordinary and dangerous that a real shift has:
- Ordinary work. The administrator, working from the computer
admin-pcat the address10.20.1.50, logged in to the practice server over SSH, the standard way to log in to a Linux server from another computer, at 02:09:30. To keep the lab small, he uses the samestudentaccount as everyone else. On a second login he mistyped the password once and got it right at 02:09:44. Then, at 02:09:50, a new account calledbackup-svcwas added on the server for a backup job. - An attack. From the Kali Linux machine at
10.20.2.66, Kali being a free toolkit that security testers use, the attacker ran hydra, a password-guessing tool, with ten common passwords for the userstudent, from 02:10:46 to 02:11:19. Then he used the right password and logged in at 02:11:22. This is the attack from the introduction. - More ordinary work. The administrator logged in once more at 02:11:41 to look around.
Wazuh, the SIEM (security information and event management tool) that collects the lab's logs and raises alerts, raised 41 alerts in all. Two programs on the server wrote most of the lines behind them: sshd, the program that runs SSH, and PAM, the part of Linux that checks passwords for other programs. The first failure alert came at 02:10:47, one second after hydra started at 02:10:46 by its own clock. You will meet every one of them in the hands-on part. Here is how they arrived over time:
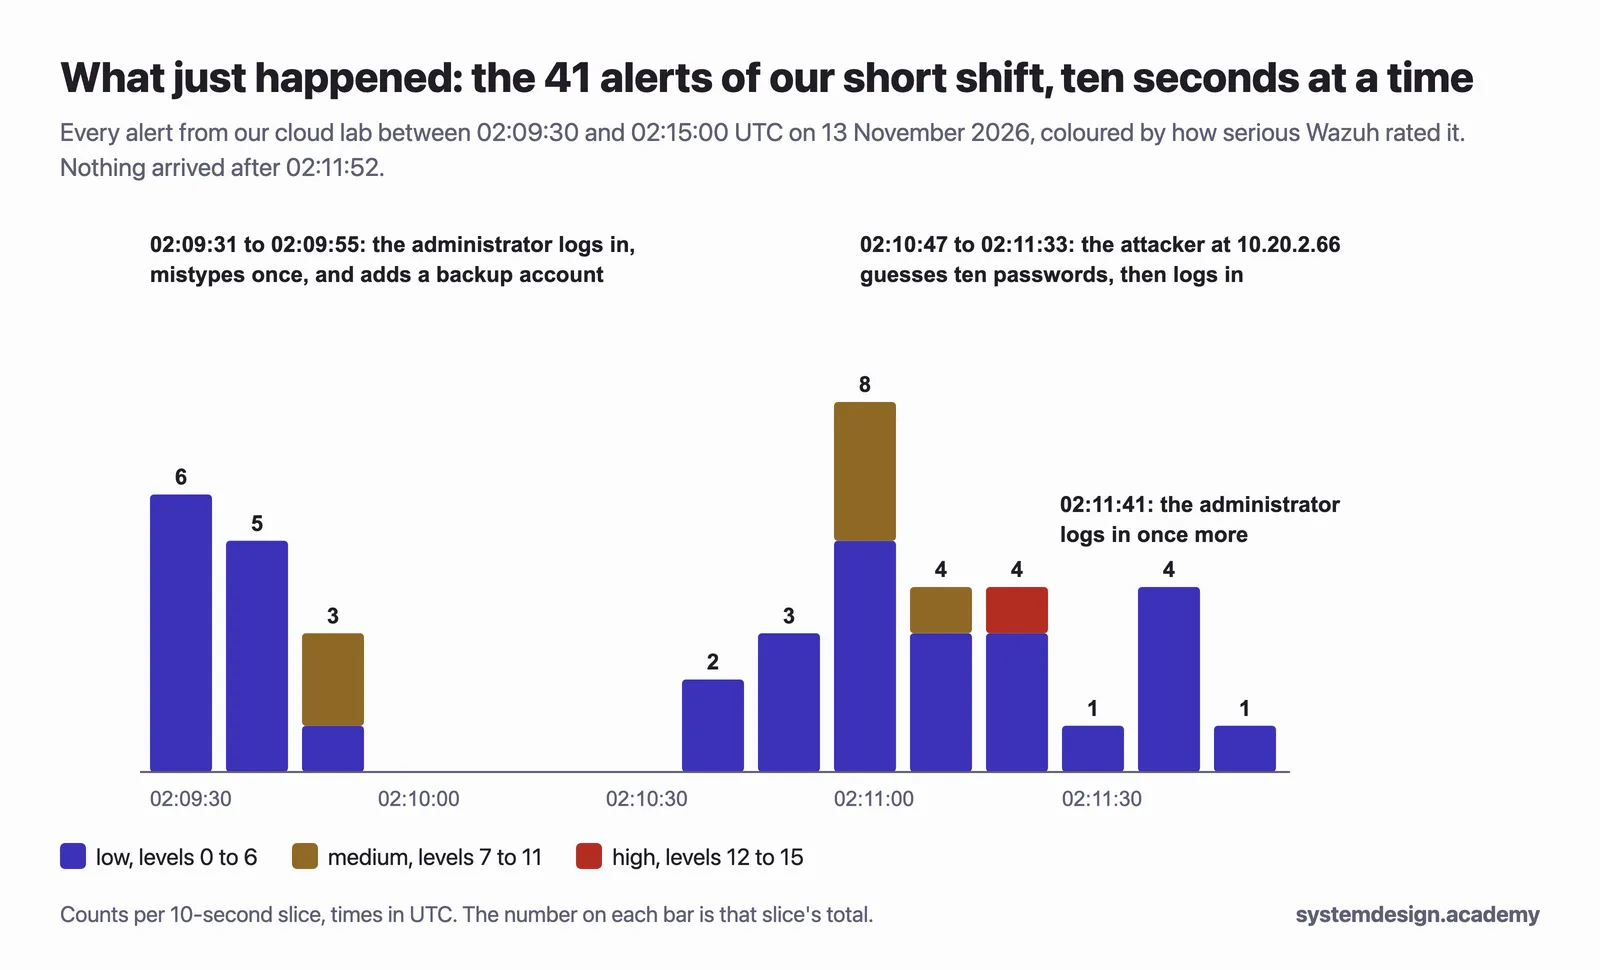
Look at the chart for a moment before reading on. The first burst, the administrator's ordinary work, has medium alerts in it. The second burst, the attack, has the one high alert. Without the story we just told you, an analyst would see only bars and rule numbers. Finding the story is the job.
The idea: triage is a routine, and the routine is the same for every alert
Experienced analysts do not rely on instinct alone. They follow the same four steps for every alert, which is what makes their decisions fast and their notes trustworthy:
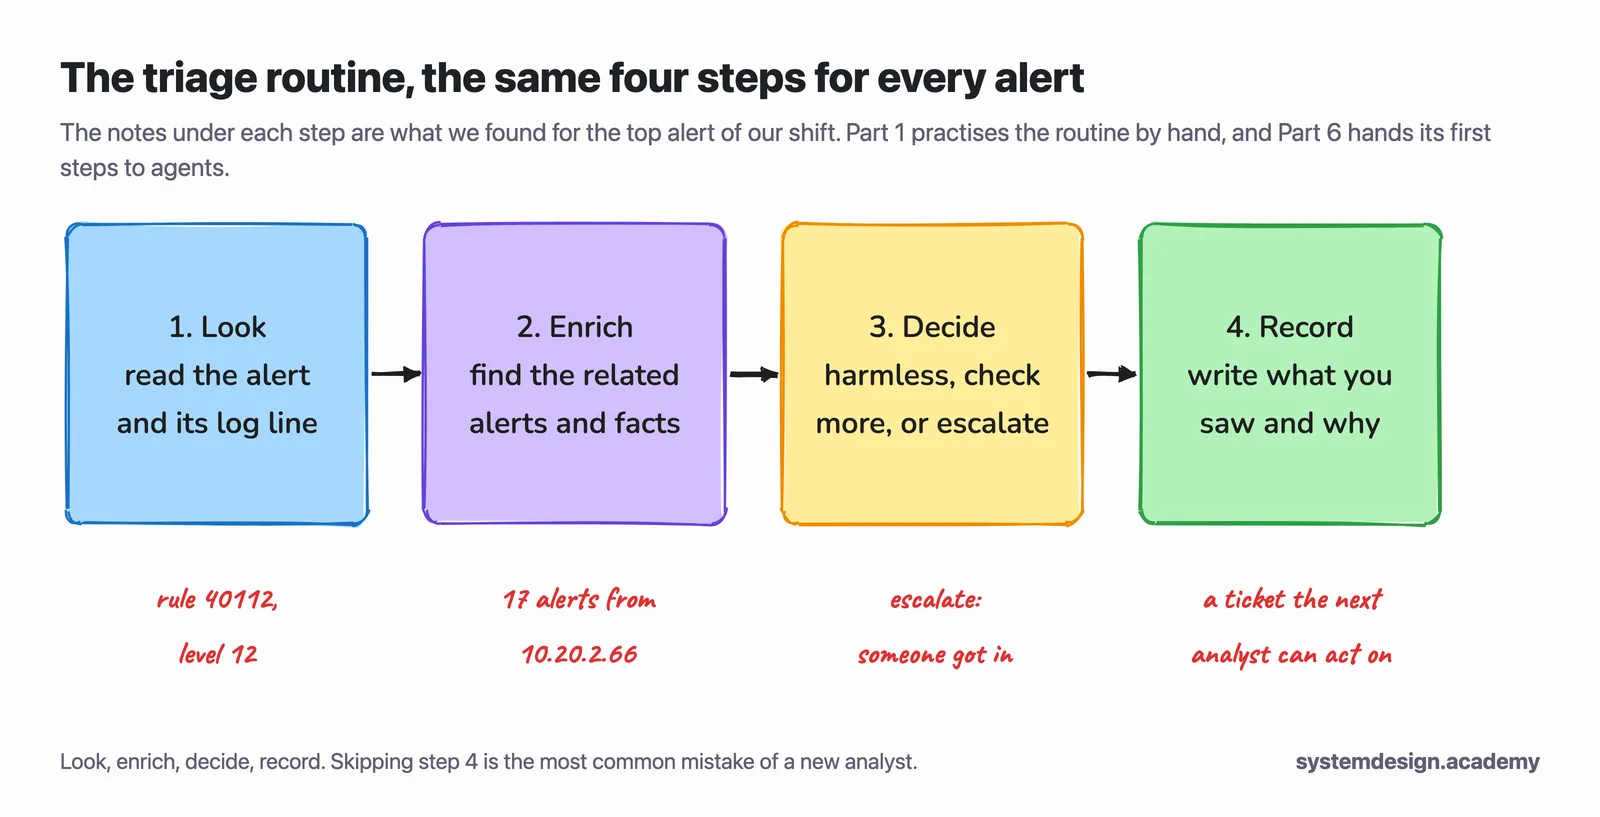
- Look. Read the alert: which rule fired, at what level, on which machine, for which user, from which address, and the raw log line it came from.
- Enrich. Gather what the alert alone does not say: what else came from the same address, what else happened to the same user, what happened just before and just after, and whether the address is known to belong to someone in the company. Enrichment means adding the context that turns an alert into evidence.
- Decide. With the evidence in front of you, choose one of three outcomes: it is harmless and can be closed, it needs a closer look, or it is real and must be escalated.
- Record. Write down what you saw and why you decided. The next analyst, your team lead, or you at three in the morning next month must be able to understand your decision without asking you. The page "Writing an incident ticket by hand" teaches this step properly.
The rest of Part 1 practises this routine by hand, alert by alert. In Part 6 you hand its first three steps to AI agents, and you keep the fourth one, the decision that matters, under a person's control.
Hands-on: work through a real shift's alerts
You will now read the queue of our shift exactly as a tier 1 analyst would: first the whole queue, then the alerts from each address, then the raw log lines behind the most puzzling alert. Everything runs on your own computer from the files in the zip.
What you need
- Python 3.10 or newer.
python3 --versionprints the version. On Windows, use the Ubuntu terminal from "Before you start". - The zip from the top of this page, unpacked. There is no package to install and no key to set.
Get the files ready
Unpack lesson-1.1.zip, open a terminal, and go into the lab folder inside it:
cd ~/Downloads/lesson-1.1/lab
It holds four files:
| File | What it is |
|---|---|
alerts.json | the 41 real alerts from our shift, exactly as Wazuh stored them, saved on 13 November 2026 |
queue.py | shows the alerts as a tier 1 analyst meets them: as a queue, most serious first |
pull_alerts.py | saves the alerts from your own cloud lab to alerts.json, if it is running |
README.md | the same steps, in short |
Step 1, optional: pull the alerts from your own lab
Skip this step if your lab is not running: the alerts.json in the zip is ours, and every output below comes from it. If your lab is running, this saves your own alerts instead. First open the tunnel from "Before you start" in a second terminal, in the lab folder of that page's zip, and leave it open:
./lab.sh tunnel
Then, back in this page's lab folder, first keep a copy of our alerts, because the script replaces alerts.json and every output below comes from ours:
cp alerts.json alerts.ours.json
Now give the script the indexer's password without showing it on the screen, and pull the alerts for the times your shift started and ended, in UTC. The path assumes you unpacked both zips side by side, for example in ~/Downloads:
export INDEXER_PASSWORD="$(../../lesson-before/lab/lab.sh password)"
python3 pull_alerts.py 2026-11-13T02:09:30Z 2026-11-13T02:15:00Z
saved 41 alerts to alerts.json

The script asks the Wazuh indexer, through the tunnel at https://localhost:9200, for every alert between those two times, and changes nothing. The end time matters: without it, anything your lab raised later, such as the alerts of a Windows server you added afterwards, would join the shift. If you run it against your own lab, you will have your own times and your own count. When one of our reviewers ran the same shift on a fresh lab, the 17 alerts from the attacker's address matched ours rule for rule, while the administrator's alerts and the session alerts with no address came out a few fewer, 36 alerts in all. One reason is a real gap you will meet again in Part 2: the Wazuh agent skipped one login at the moment the server's journal rotated, and its own log said so. The journal is the system log that Ubuntu keeps, and it is started afresh, or rotated, from time to time.
Predict, then measure
The shift produced 41 alerts, including a real attack. How many of them do you expect Wazuh to rate high, level 12 to 15?
The measured result appears once you lock in. Only your first answer counts toward your progress.
Step 2: open the queue
python3 queue.py
THE QUEUE: 41 alerts, most serious first (times in UTC)
time     lvl   rule  machine          from         user        what the rule says
02:11:23  12  40112  linux-server-01  10.20.2.66   student     Multiple authentication failures followed by a ...
02:11:03  10   2502  linux-server-01  10.20.2.66   student     syslog: User missed the password more than one ...
02:11:09  10   5763  linux-server-01  10.20.2.66   student     sshd: brute force trying to get access to the ...
02:11:19  10   2502  linux-server-01  10.20.2.66   student     syslog: User missed the password more than one ...
02:09:51   8   5901  linux-server-01  -            -           New group added to the system.
02:09:51   8   5902  linux-server-01  -            backup-svc  New user added to the system.
02:11:03   8   5758  linux-server-01  10.20.2.66   student     Maximum authentication attempts exceeded.
02:09:37   5   5503  linux-server-01  10.20.1.50   student     PAM: User login failed.
02:09:39   5   5760  linux-server-01  10.20.1.50   student     sshd: authentication failed.
02:10:47   5   5503  linux-server-01  10.20.2.66   student     PAM: User login failed.
02:10:49   5   5760  linux-server-01  10.20.2.66   student     sshd: authentication failed.
02:10:51   5   5760  linux-server-01  10.20.2.66   student     sshd: authentication failed.
... and 29 more below these (python3 queue.py --all shows them)

HOW SERIOUS: alerts in each band
  high (12-15)     1
  medium (7-11)    6
  low (0-6)       34

WHERE FROM: alerts grouped by the address they came from
  no address   19 alerts, highest level 8
  10.20.2.66   17 alerts, highest level 12
  10.20.1.50    5 alerts, highest level 5
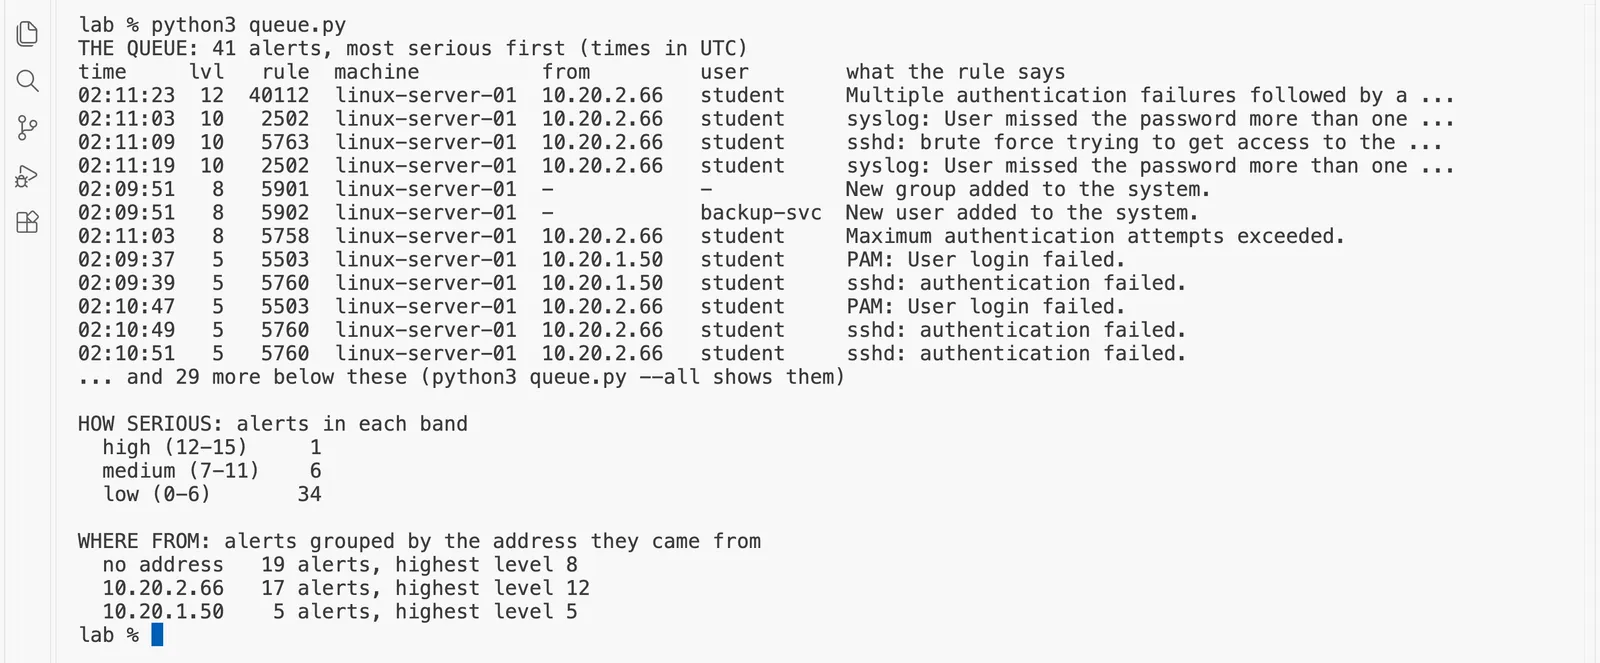
Read the output in three parts.
- The queue. The alerts are sorted by level, highest first, then by time. Each row is one alert: the time in UTC, the Wazuh level, the rule number, the machine, the address it came from, the user, and what the rule says. A dash means the alert has no address, which happens when the event did not come over the network, such as an account created on the server itself.
- How serious. Wazuh rates every rule from 0 to 15. We grouped the levels into three bands to make the queue easier to read: 1 high alert, 6 medium and 34 low. Those three bands are ours, not Wazuh's.
- Where from. The same 41 alerts, grouped by address. The biggest group, 19 alerts, has no address at all: they are the "session opened" and "session closed" lines that Linux writes for every login, the lines about the new account, which was made on the server itself, and one line, rule 2501, in which the server noted that it cut off the attacker's first connection, a line that Wazuh did not tag with an address. One address,
10.20.2.66, raised 17 alerts, including the only high one.
What just happened. Here is the same result as a picture. Each layer asks a narrower question:
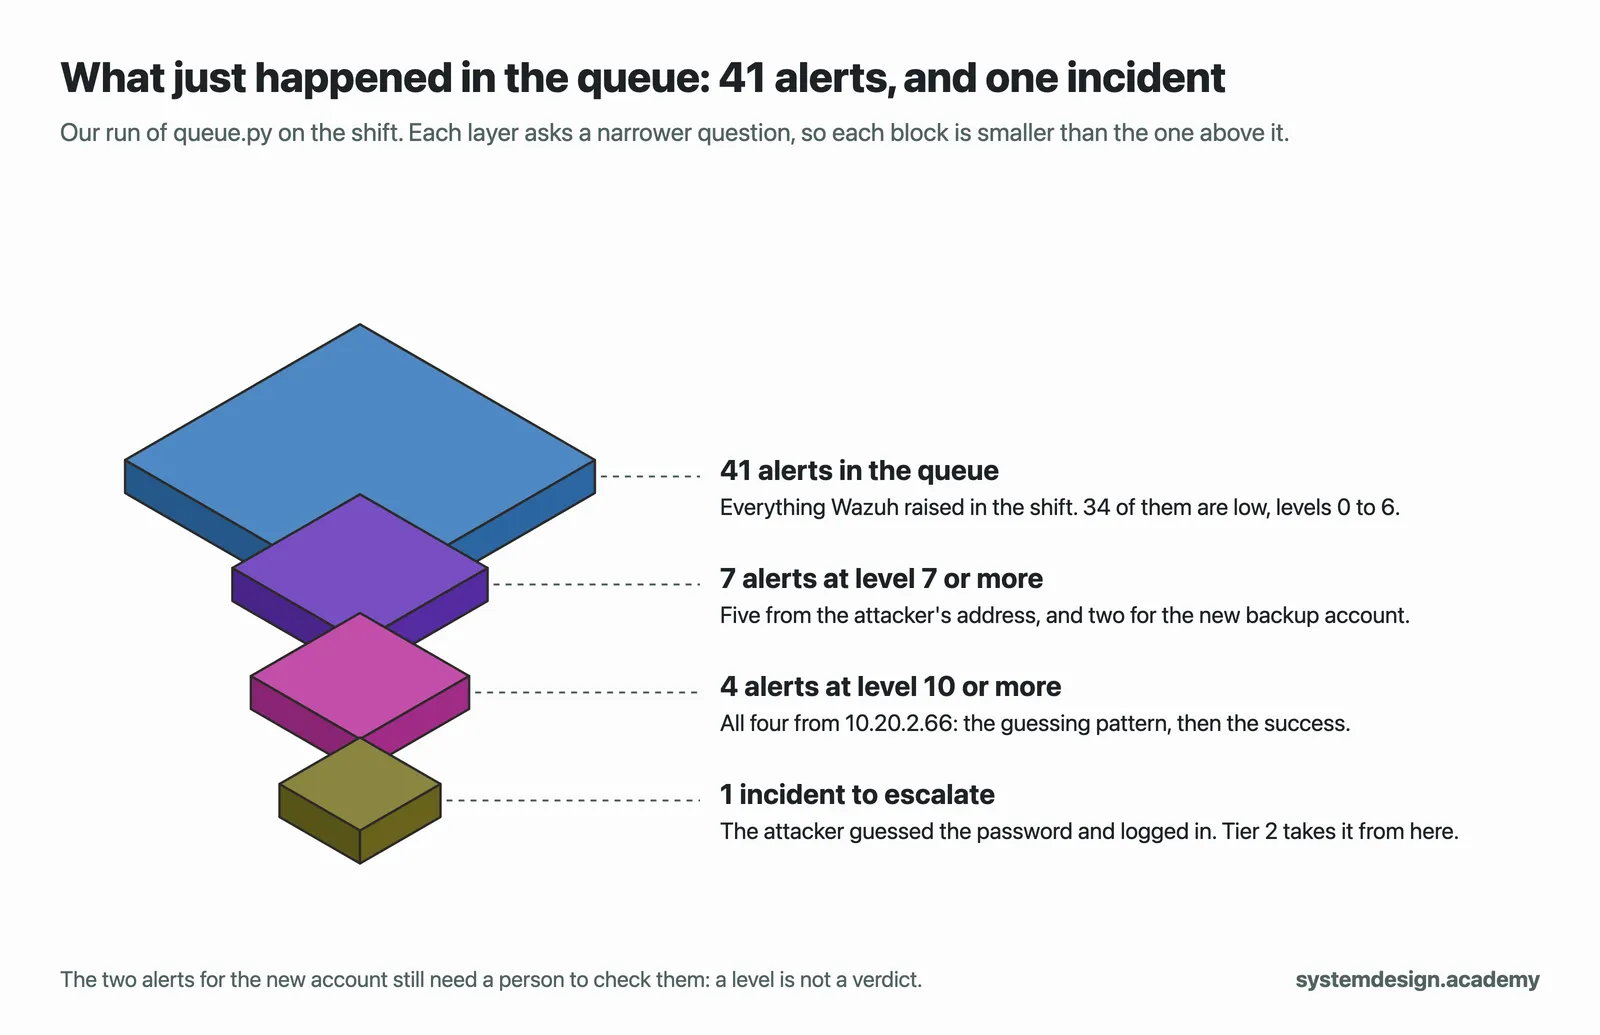
So which alert does a tier 1 analyst open first? The queue already answered it: the highest level, rule 40112.
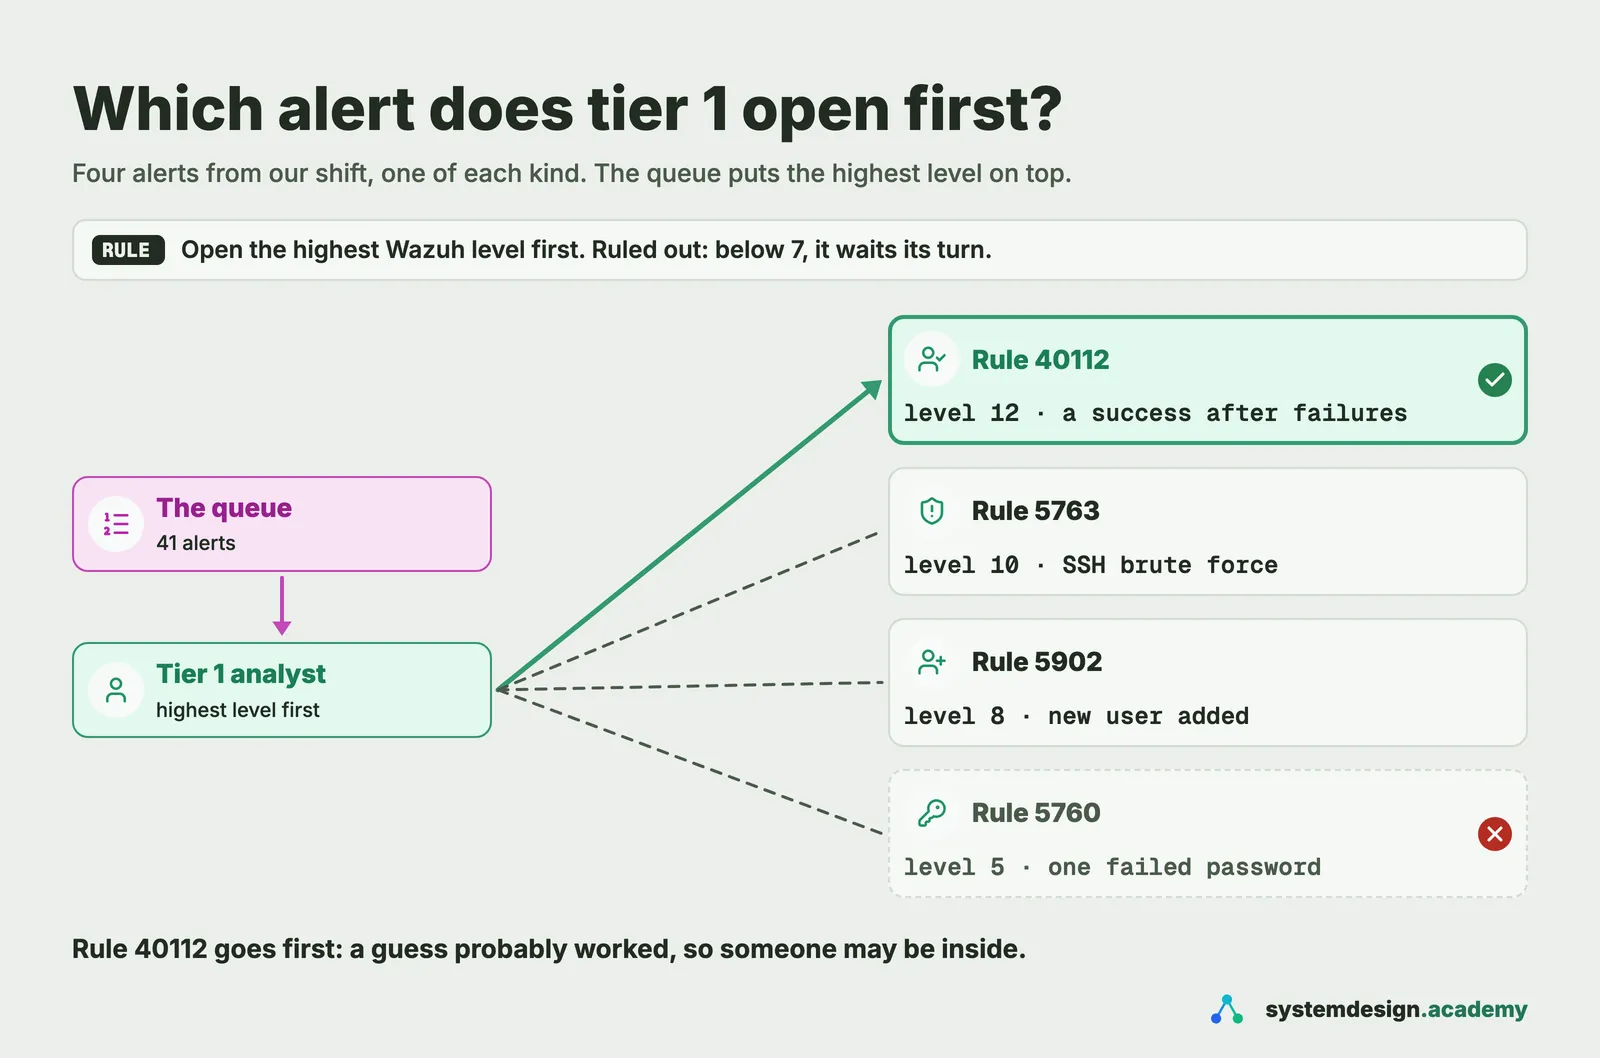
Sorting by level is a good first rule, and every SIEM offers it. But a level is Wazuh's opinion of a rule, written long before your alert happened. It is not a verdict about your alert. The next two steps show why.
Step 3: look at everything from one address
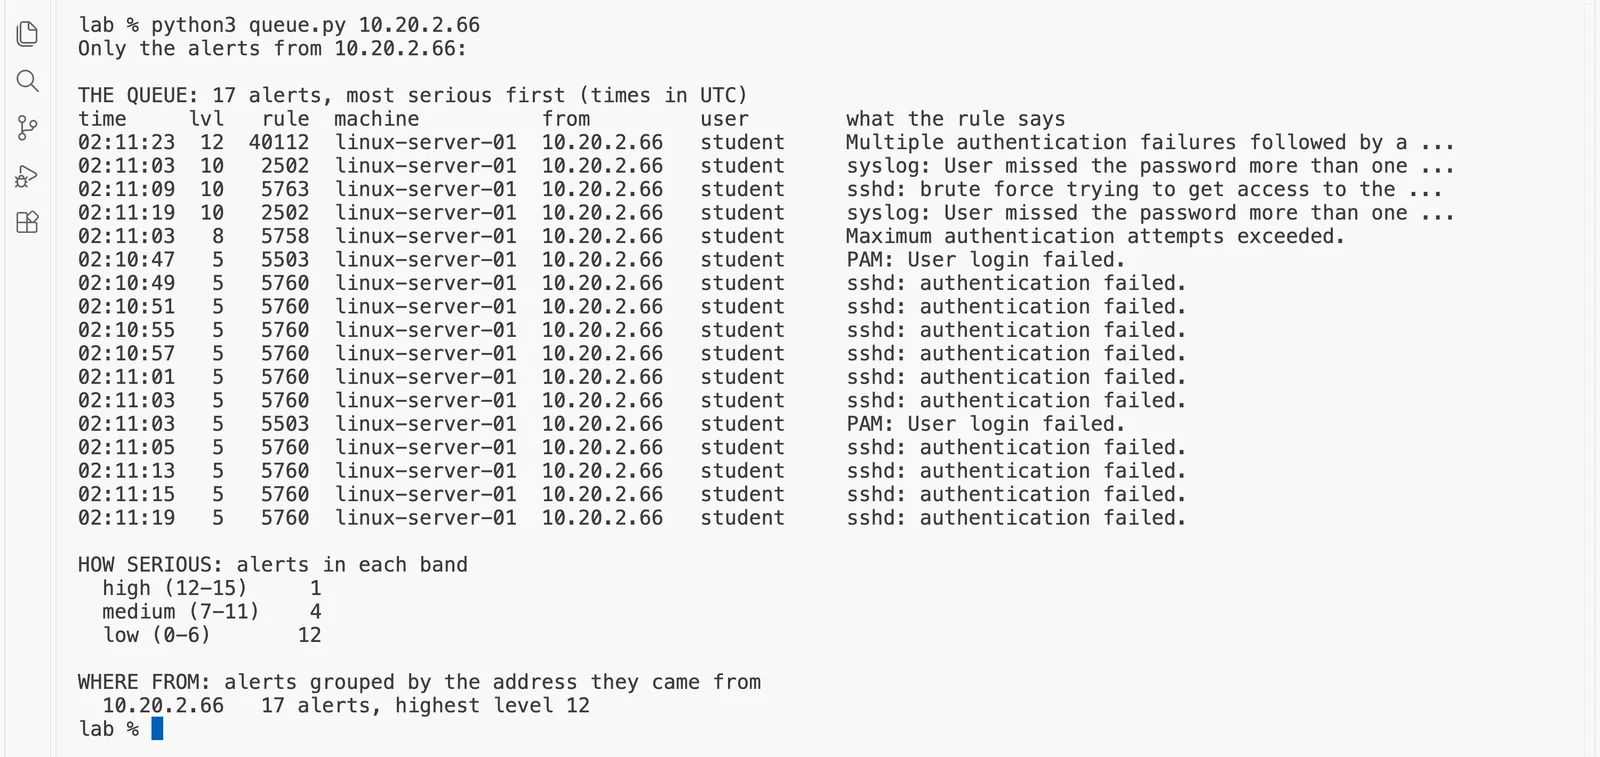
Step 2 showed that two addresses raised failed-login alerts. Both raised rule 5760, "sshd: authentication failed", at level 5. Are they the same kind of event? Ask the queue for each address on its own. First the attacker's:
python3 queue.py 10.20.2.66
Only the alerts from 10.20.2.66:

THE QUEUE: 17 alerts, most serious first (times in UTC)
time     lvl   rule  machine          from         user        what the rule says
02:11:23  12  40112  linux-server-01  10.20.2.66   student     Multiple authentication failures followed by a ...
02:11:03  10   2502  linux-server-01  10.20.2.66   student     syslog: User missed the password more than one ...
02:11:09  10   5763  linux-server-01  10.20.2.66   student     sshd: brute force trying to get access to the ...
02:11:19  10   2502  linux-server-01  10.20.2.66   student     syslog: User missed the password more than one ...
02:11:03   8   5758  linux-server-01  10.20.2.66   student     Maximum authentication attempts exceeded.
02:10:47   5   5503  linux-server-01  10.20.2.66   student     PAM: User login failed.
02:10:49   5   5760  linux-server-01  10.20.2.66   student     sshd: authentication failed.
02:10:51   5   5760  linux-server-01  10.20.2.66   student     sshd: authentication failed.
02:10:55   5   5760  linux-server-01  10.20.2.66   student     sshd: authentication failed.
02:10:57   5   5760  linux-server-01  10.20.2.66   student     sshd: authentication failed.
02:11:01   5   5760  linux-server-01  10.20.2.66   student     sshd: authentication failed.
02:11:03   5   5760  linux-server-01  10.20.2.66   student     sshd: authentication failed.
02:11:03   5   5503  linux-server-01  10.20.2.66   student     PAM: User login failed.
02:11:05   5   5760  linux-server-01  10.20.2.66   student     sshd: authentication failed.
02:11:13   5   5760  linux-server-01  10.20.2.66   student     sshd: authentication failed.
02:11:15   5   5760  linux-server-01  10.20.2.66   student     sshd: authentication failed.
02:11:19   5   5760  linux-server-01  10.20.2.66   student     sshd: authentication failed.

HOW SERIOUS: alerts in each band
  high (12-15)     1
  medium (7-11)    4
  low (0-6)       12

WHERE FROM: alerts grouped by the address they came from
  10.20.2.66   17 alerts, highest level 12
Then the administrator's:
python3 queue.py 10.20.1.50
Only the alerts from 10.20.1.50:

THE QUEUE: 5 alerts, most serious first (times in UTC)
time     lvl   rule  machine          from         user        what the rule says
02:09:37   5   5503  linux-server-01  10.20.1.50   student     PAM: User login failed.
02:09:39   5   5760  linux-server-01  10.20.1.50   student     sshd: authentication failed.
02:09:31   3   5715  linux-server-01  10.20.1.50   student     sshd: authentication success.
02:09:45   3   5715  linux-server-01  10.20.1.50   student     sshd: authentication success.
02:11:41   3   5715  linux-server-01  10.20.1.50   student     sshd: authentication success.

HOW SERIOUS: alerts in each band
  high (12-15)     0
  medium (7-11)    0
  low (0-6)        5

WHERE FROM: alerts grouped by the address they came from
  10.20.1.50    5 alerts, highest level 5
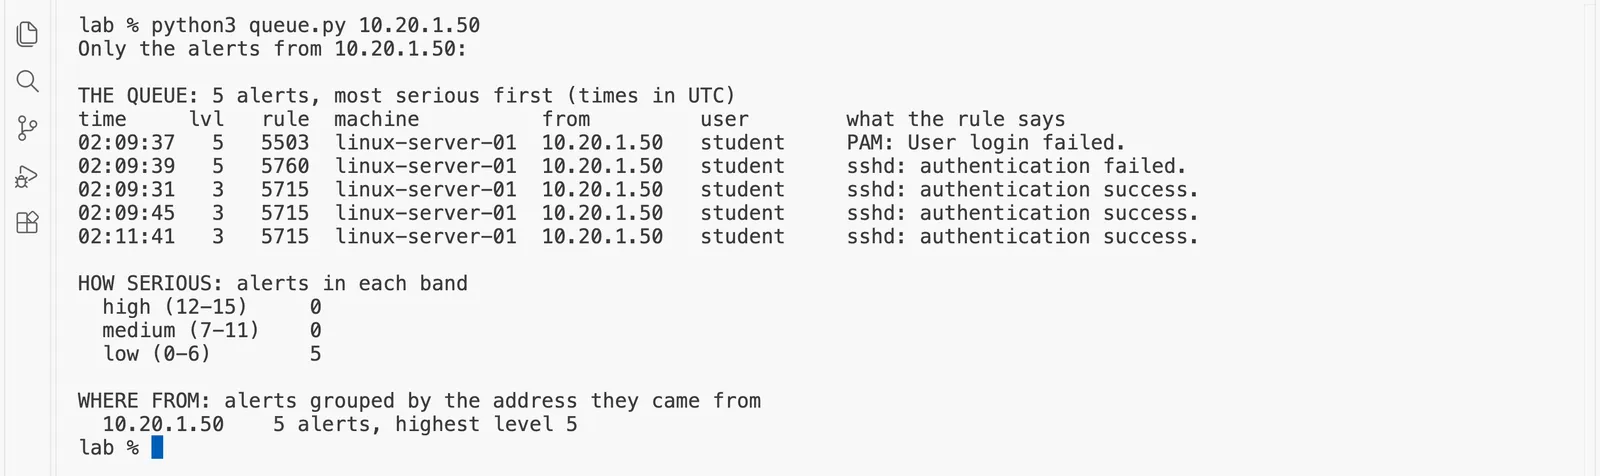
What just happened. The same rule told two different stories once we looked around it:
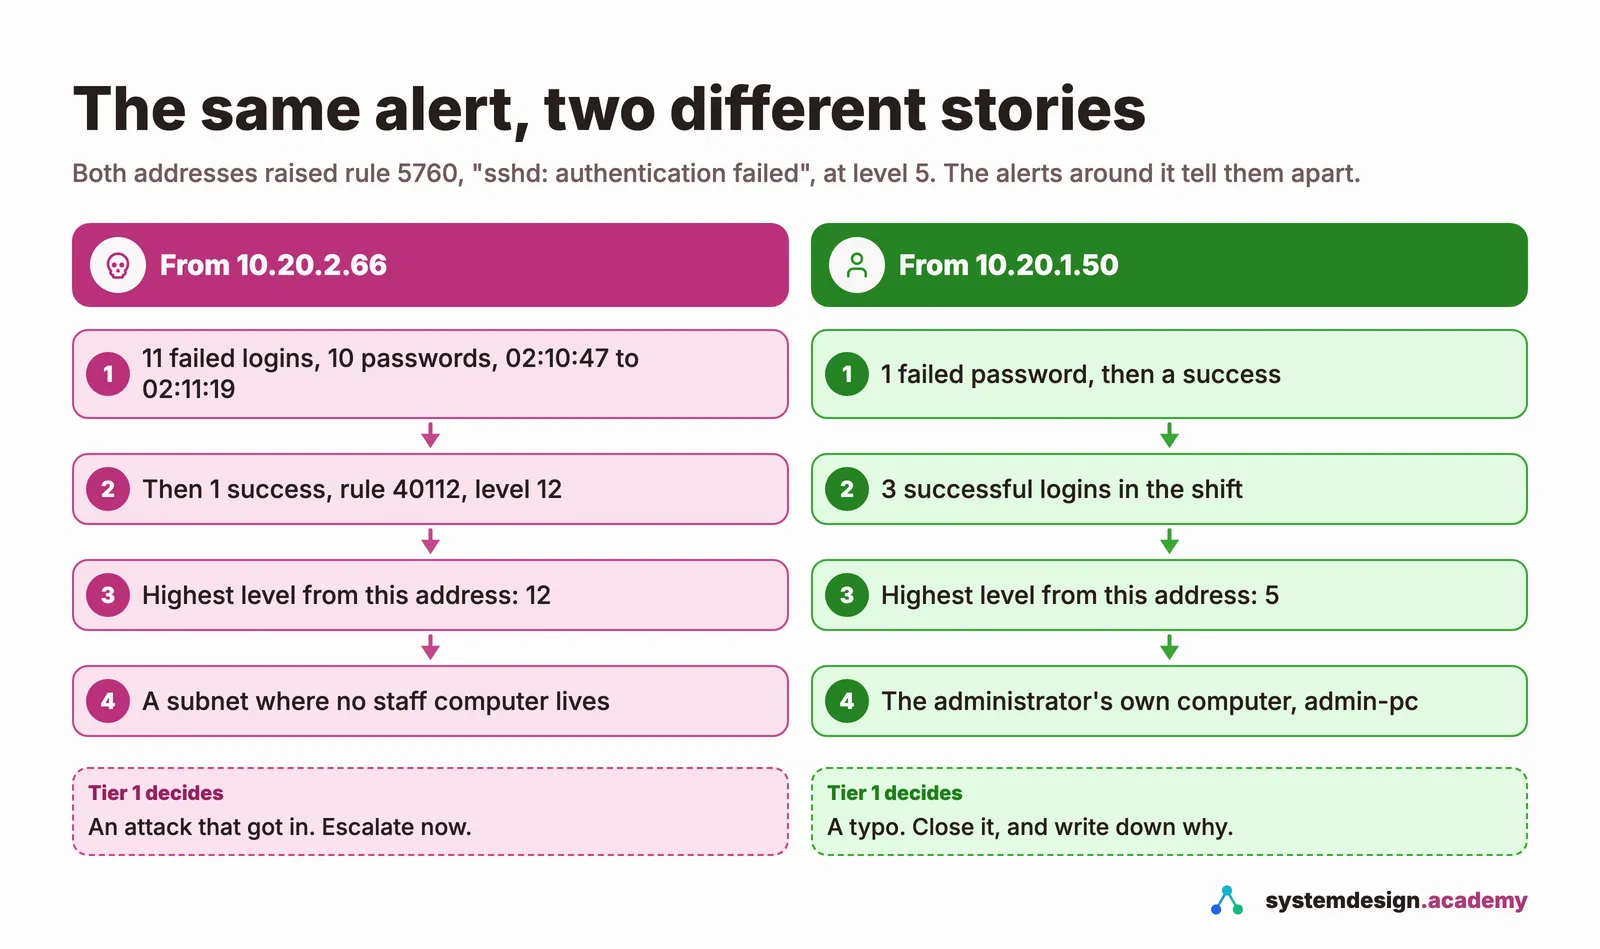
This is the enrich step of the routine. The alert alone, "authentication failed, level 5", could not tell you which address was the administrator and which was the attacker. The alerts around it could. In a real company the enrich step would also ask the asset list who 10.20.1.50 belongs to. In our lab we know, because the lab's template gives the administrator's computer that address and names it admin-pc. Part 4 adds public threat intelligence to this step.
Predict, then measure
A new account, backup-svc, appeared on the server around the time of the attack. Did the attacker create it?
The measured result appears once you lock in. Only your first answer counts toward your progress.
Step 4: read the raw log lines behind the most puzzling alert
The queue had two medium alerts with no address at all: rule 5901, "New group added to the system", and rule 5902, "New user added to the system", for the account backup-svc, at level 8. A new account appearing shortly before an attack is exactly the kind of thing an attacker does to keep a way back in. Did the attacker make it? Every Wazuh alert keeps the raw log line it came from, in a field called full_log. Search the saved alerts for the lines about new accounts and successful logins:
grep '"full_log"' alerts.json | grep -E 'useradd|Accepted password'
  "full_log": "Nov 13 02:09:30 linux-server-01 sshd[6087]: Accepted password for student from 10.20.1.50 port 35648 ssh2",
  "full_log": "Nov 13 02:09:44 linux-server-01 sshd[6174]: Accepted password for student from 10.20.1.50 port 51822 ssh2",
  "full_log": "Nov 13 02:09:50 linux-server-01 useradd[6249]: new group: name=backup-svc, GID=1002",
  "full_log": "Nov 13 02:09:50 linux-server-01 useradd[6249]: new user: name=backup-svc, UID=1002, GID=1002, home=/home/backup-svc, shell=/usr/sbin/nologin, from=none",
  "full_log": "Nov 13 02:11:22 linux-server-01 sshd[6278]: Accepted password for student from 10.20.2.66 port 48560 ssh2",
  "full_log": "Nov 13 02:11:41 linux-server-01 sshd[6365]: Accepted password for student from 10.20.1.50 port 60584 ssh2",

grep prints every line of a file that contains a pattern. The first grep keeps only the lines with the raw log, and the second keeps those that mention useradd (the Linux program that creates accounts) or a successful SSH login.
What just happened. Laid out in time order, the lines answer the question:
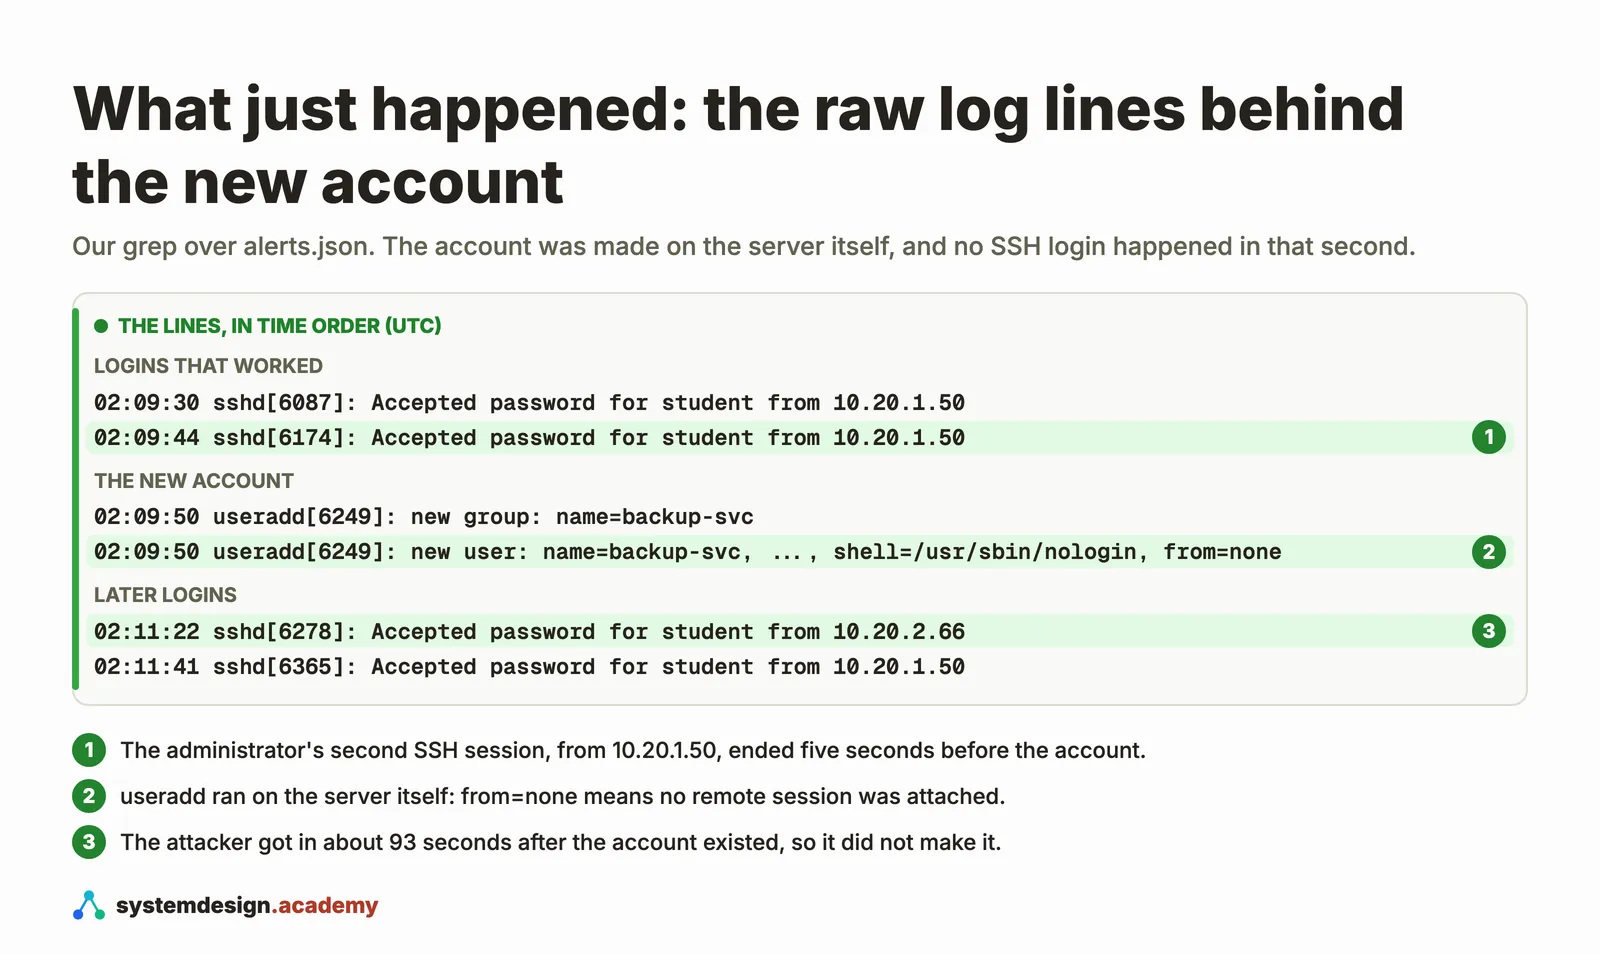
The attacker logged in at 02:11:22. The account had existed since 02:09:50, about 93 seconds earlier. So the attacker did not create it. It was made on the server itself, by a program running as the all-powerful root user with no remote session attached (from=none), five seconds after the administrator's second SSH session had ended. Its shell is /usr/sbin/nologin, which means nobody can log in to it interactively, a normal choice for an account that only runs a job.
This is the decide and record steps. A careful tier 1 note for the two account alerts might read: "New account backup-svc created at 02:09:50 UTC by useradd on the server, about 93 seconds before the brute-force success from 10.20.2.66, with a nologin shell. Not created by the attacker. Confirm with the administrator that it was planned; close if confirmed." Notice the last sentence. The logs make the attacker an unlikely author, but only the administrator can confirm the account was planned. A good note says what the evidence shows and what it does not.
And the escalation for the attack itself is now easy to write, because the evidence is already gathered: eleven failed passwords for student from 10.20.2.66 between 02:10:47 and 02:11:19 UTC, then a successful login at 02:11:22, rule 40112 at level 12. That goes to tier 2 now, with the advice to treat the student account as known to the attacker.
What the dashboard showed for the same shift
You do not need the dashboard for this page, but here is the same shift as Wazuh's own dashboard drew it, in our browser through the lab's tunnel, so you can recognise it when you open yours. The times are in India Standard Time, five and a half hours ahead of UTC:
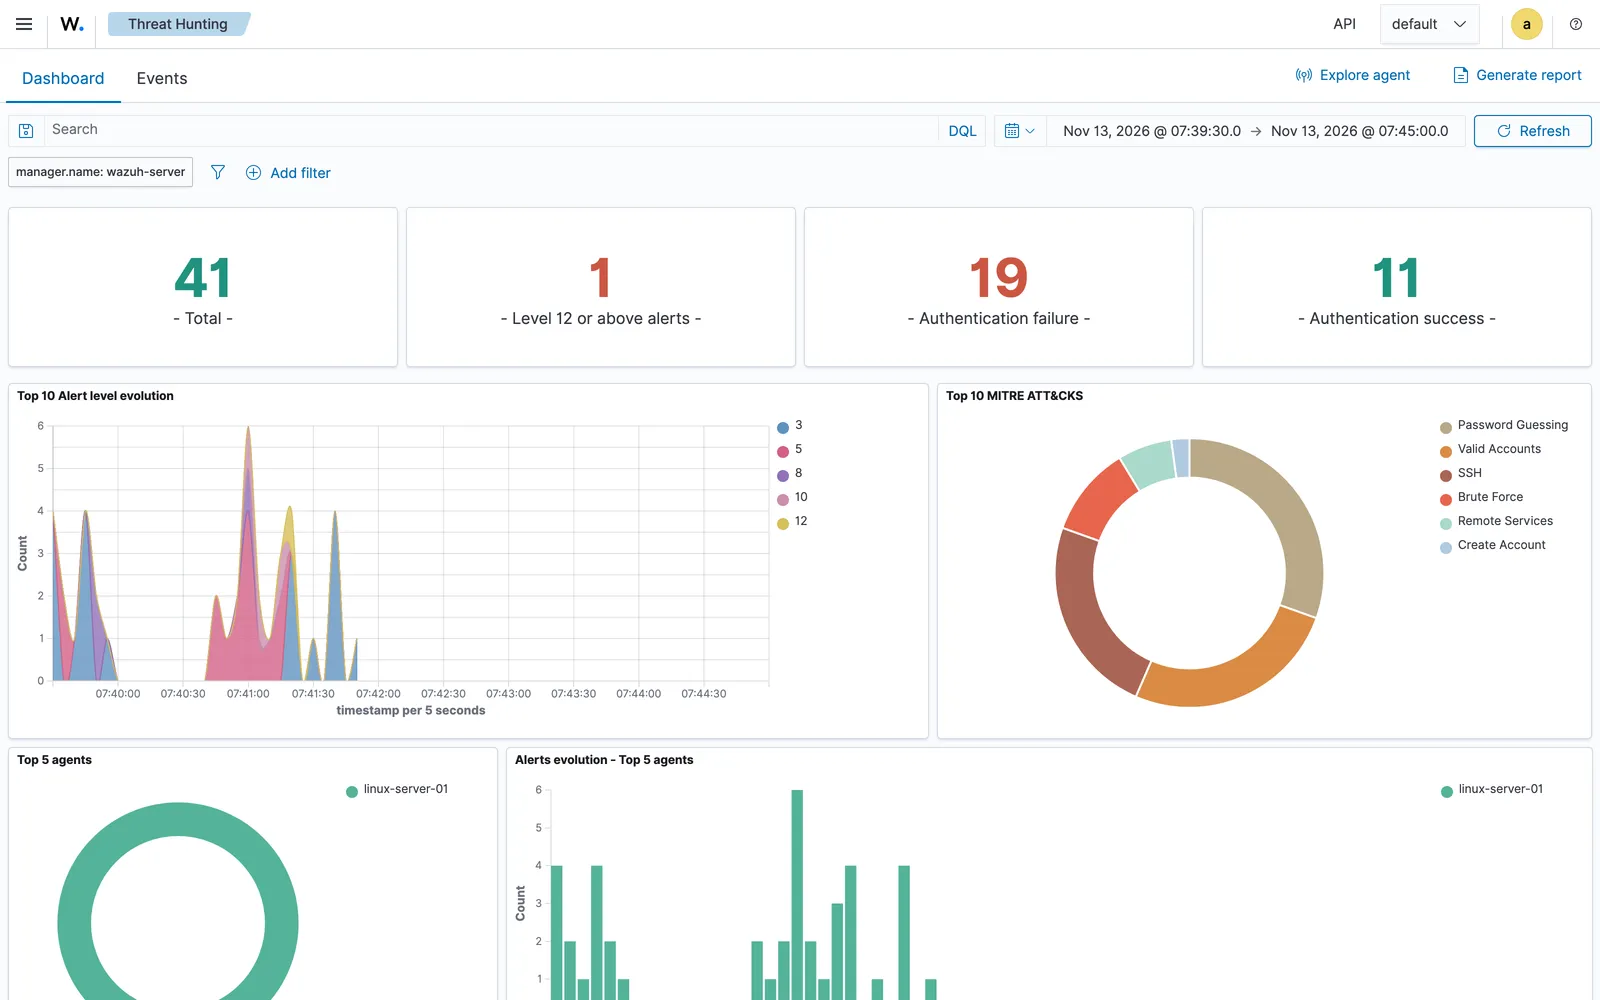
Look at two counters, because they do not match what you might expect. "Authentication failure" says 19: the 18 alerts in Wazuh's group for single failures (eleven from rule 5760, three from 5503, two from 2502, one from 5758 and one from 2501) plus the one alert in its group for repeated failures, rule 5763. "Authentication success" says 11, although only 4 logins worked: it adds the 3 "sshd: authentication success" alerts and 8 "PAM: Login session opened" alerts, because in this lab Ubuntu opened two sessions for each of these logins, one for the connection and one for the user's own background services, which start again when the user has been logged out for a few seconds. The attacker's login is counted only through its two session lines, not through its SSH success line, because that line was raised as rule 40112, which is in neither success group. When two tools disagree on a count, the first question is always what each one counts.
Troubleshooting
| What you see | Why, and what to do |
|---|---|
python3: command not found | Python is not installed, or on Windows you are in PowerShell. Use the Ubuntu terminal, and follow "Before you start". |
FileNotFoundError: ... alerts.json | You are not in the lab folder. Run cd into it, then ls to see the four files. |
pull_alerts.py prints Connection refused | The tunnel is not open. Run ./lab.sh tunnel in a second terminal, in the lab folder of "Before you start", and leave it open. Or skip step 1 and use the alerts.json from the zip. |
pull_alerts.py says Set the password first | Run the export INDEXER_PASSWORD=... line from step 1 in the same terminal, then try again. |
pull_alerts.py prints HTTP Error 401 | The password is wrong or empty. Run ../../lesson-before/lab/lab.sh password on its own to check that it prints one line. |
saved 0 alerts | The times you gave miss your shift, or are not in UTC. Check both times, each with the Z at the end. |
The code
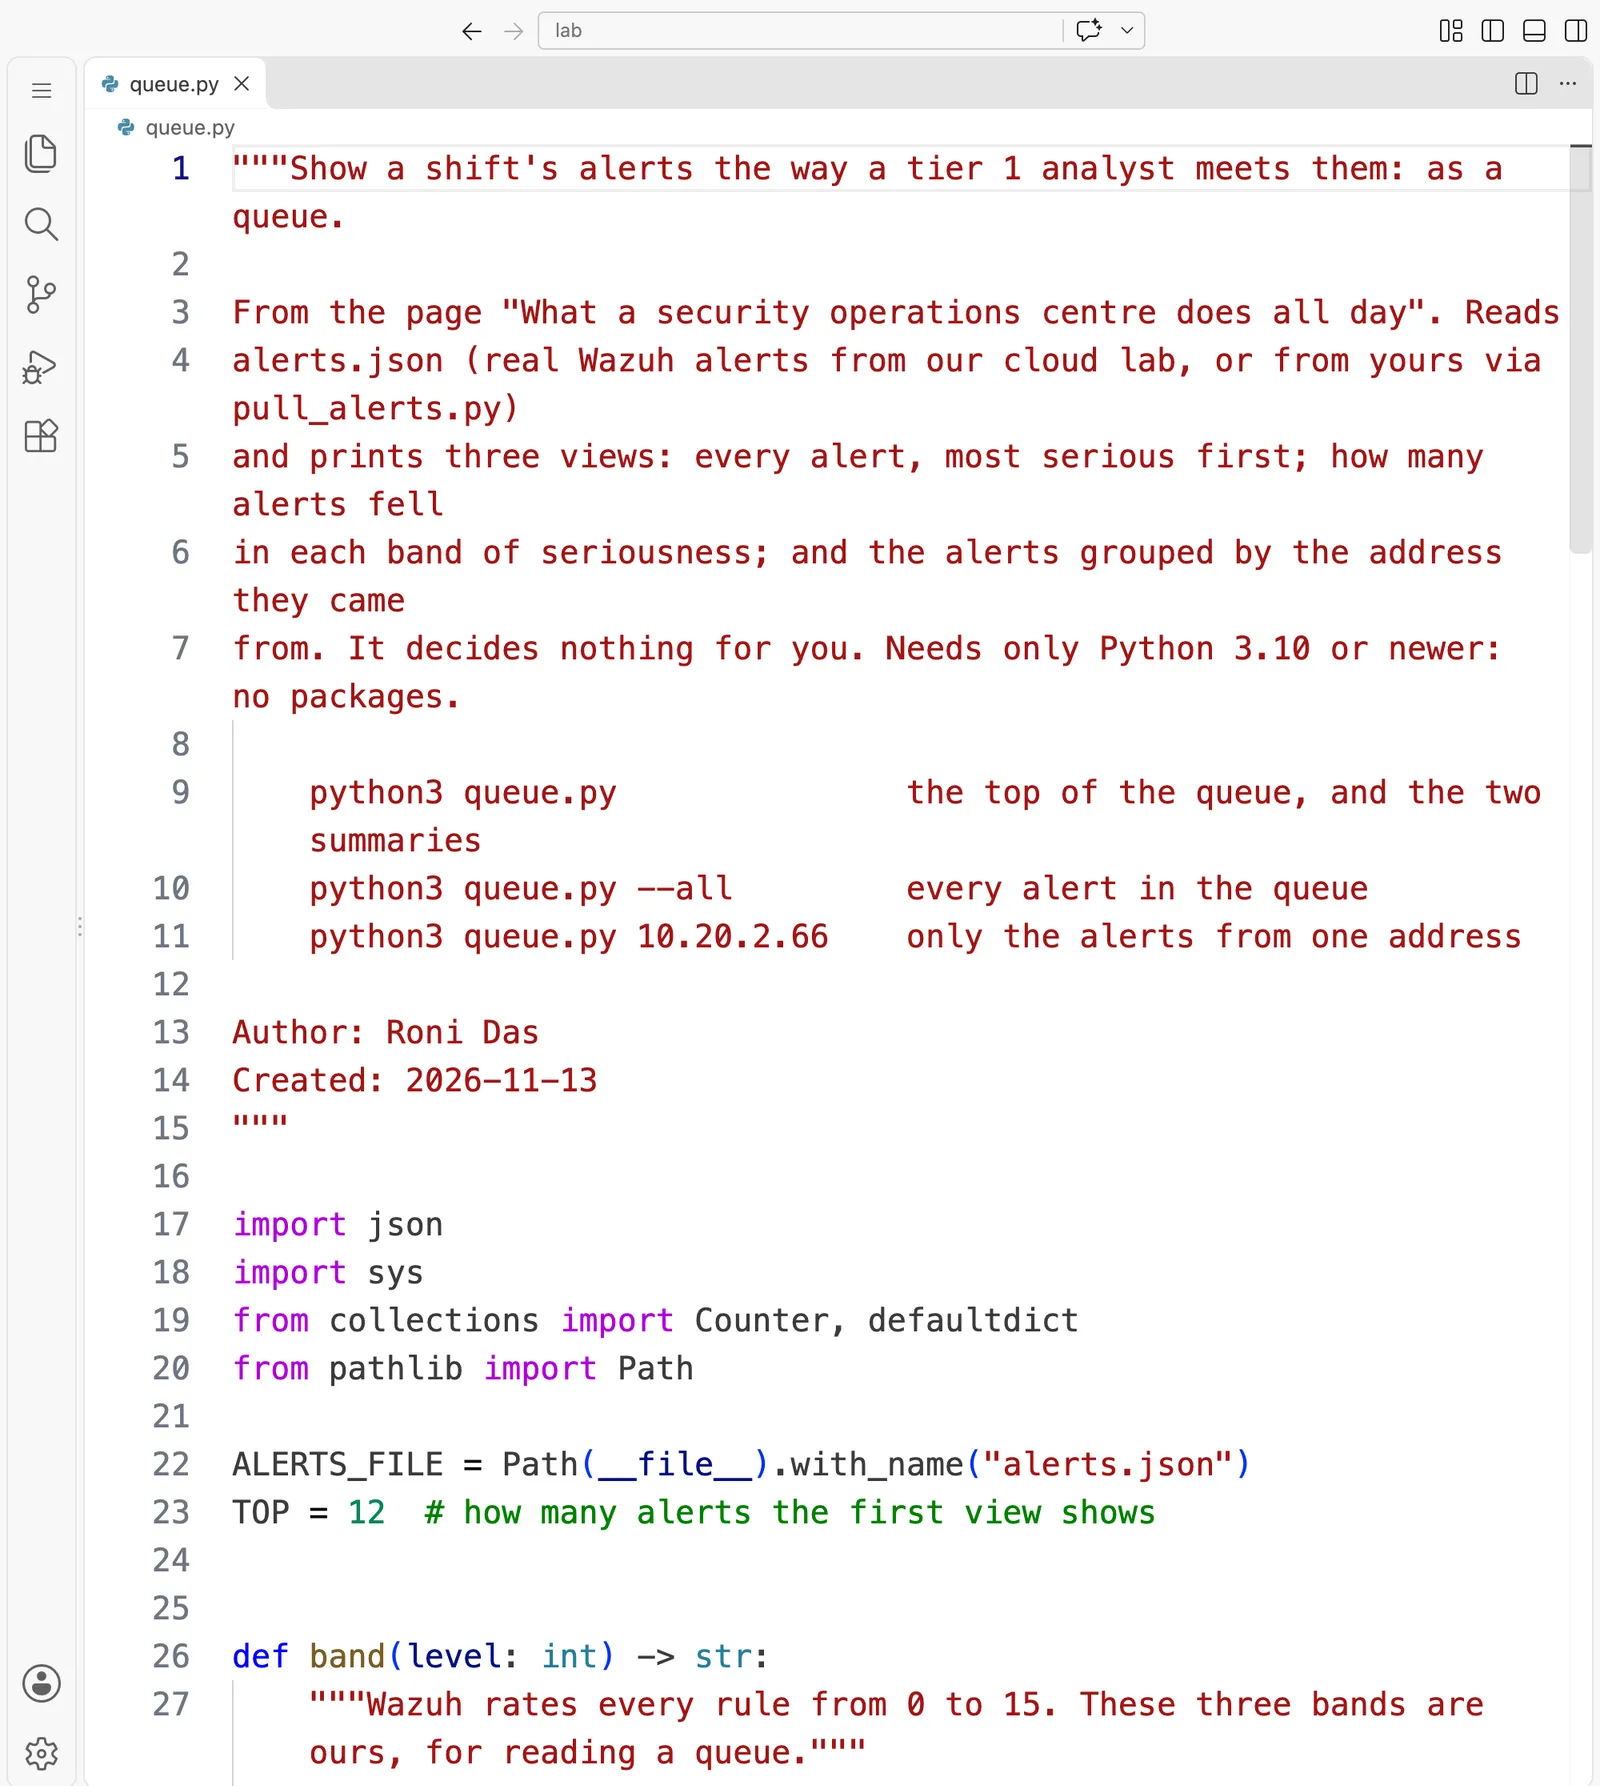
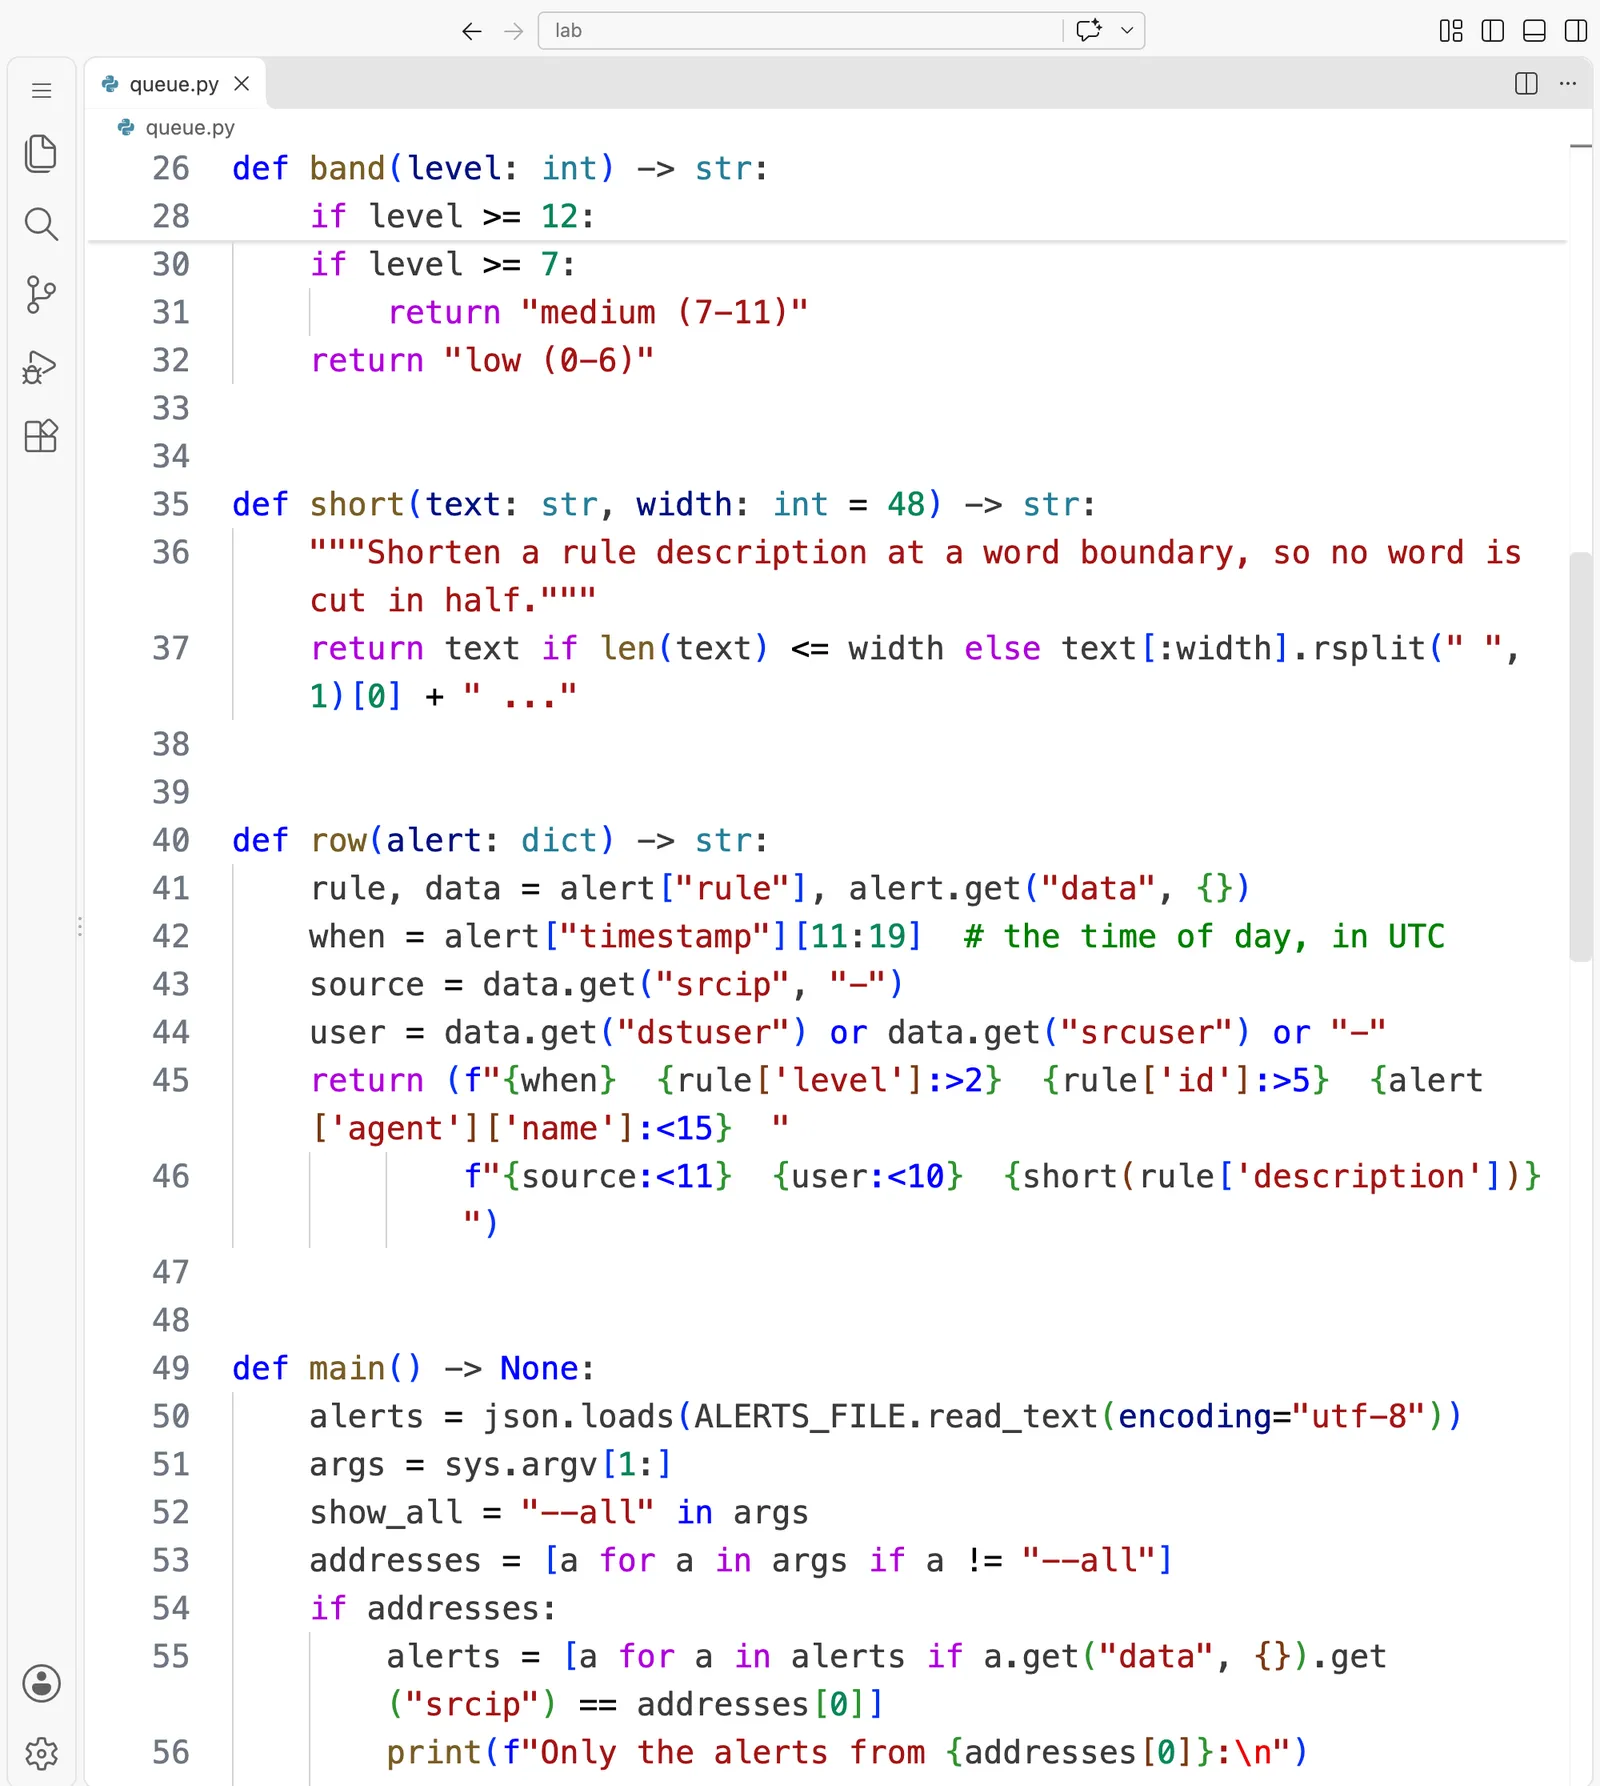
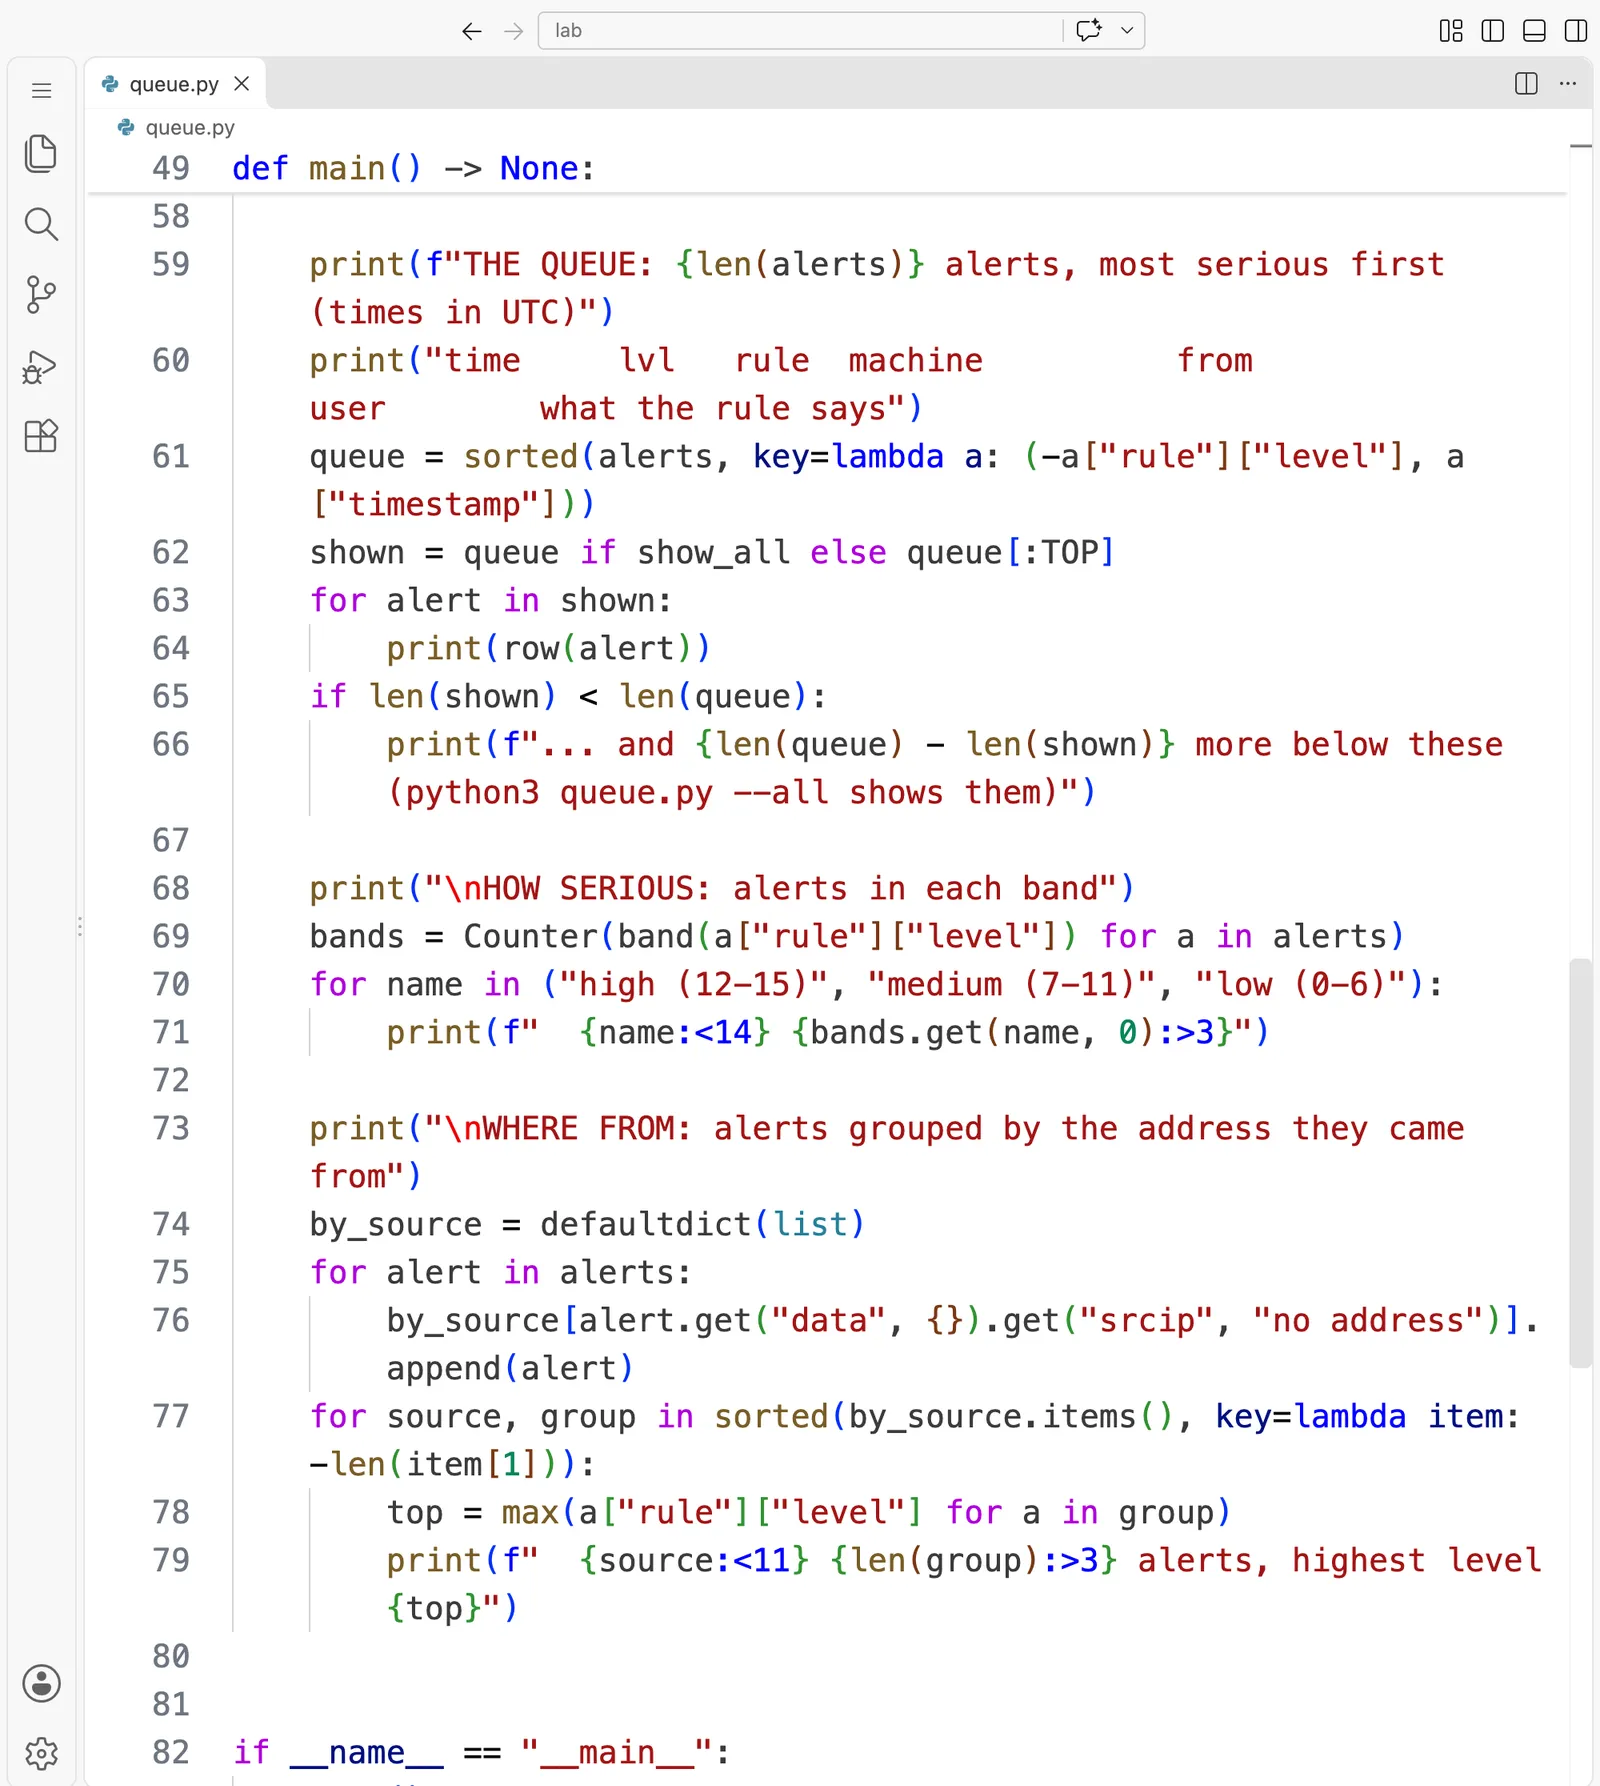
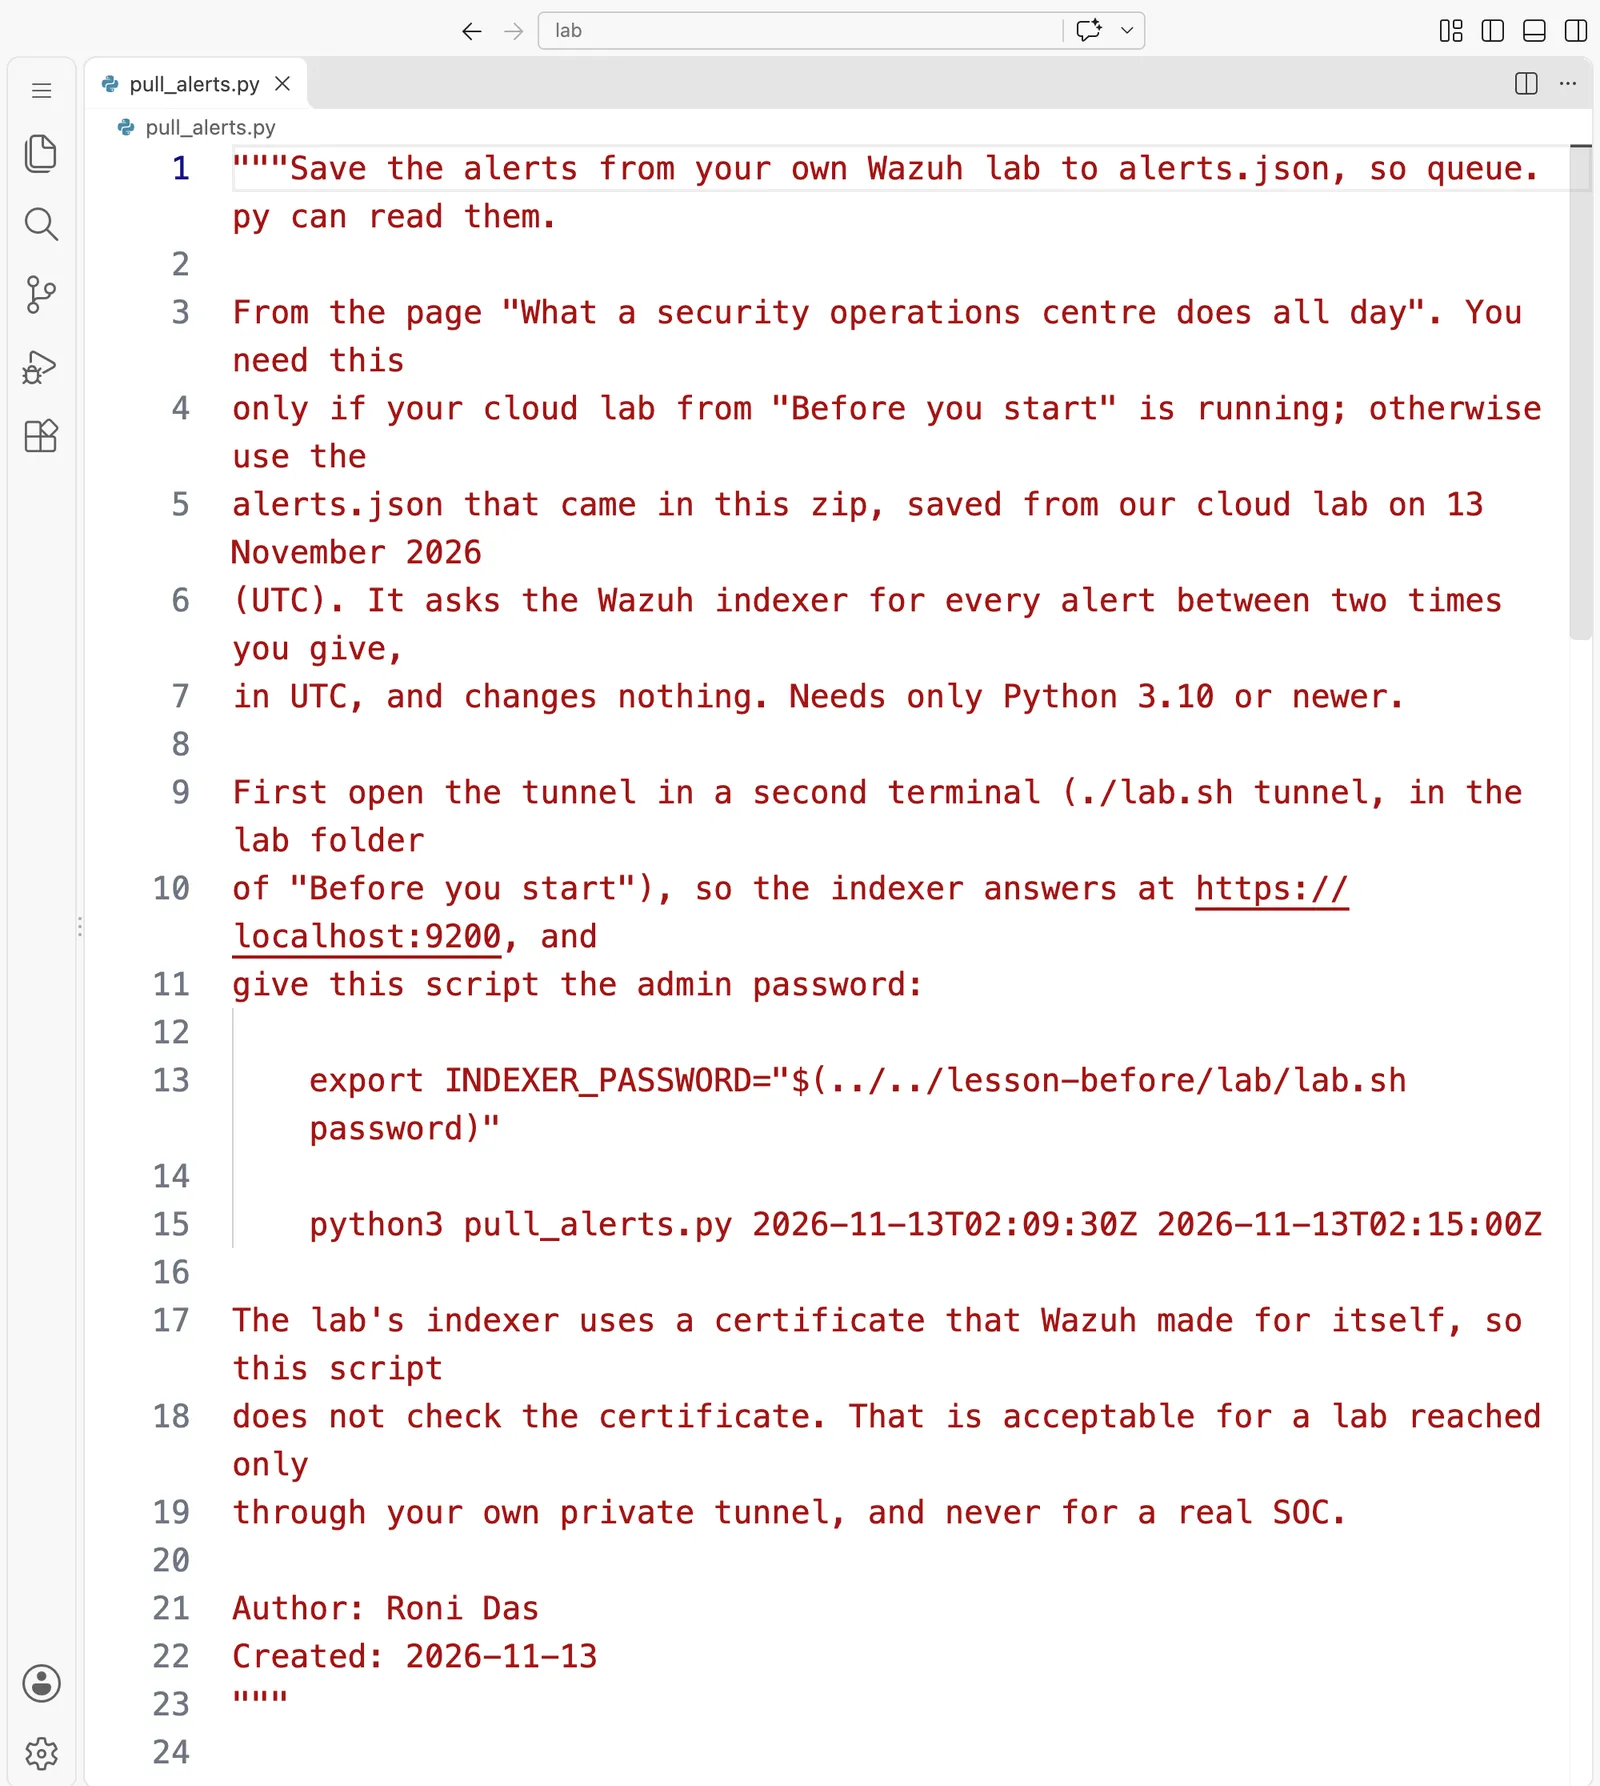
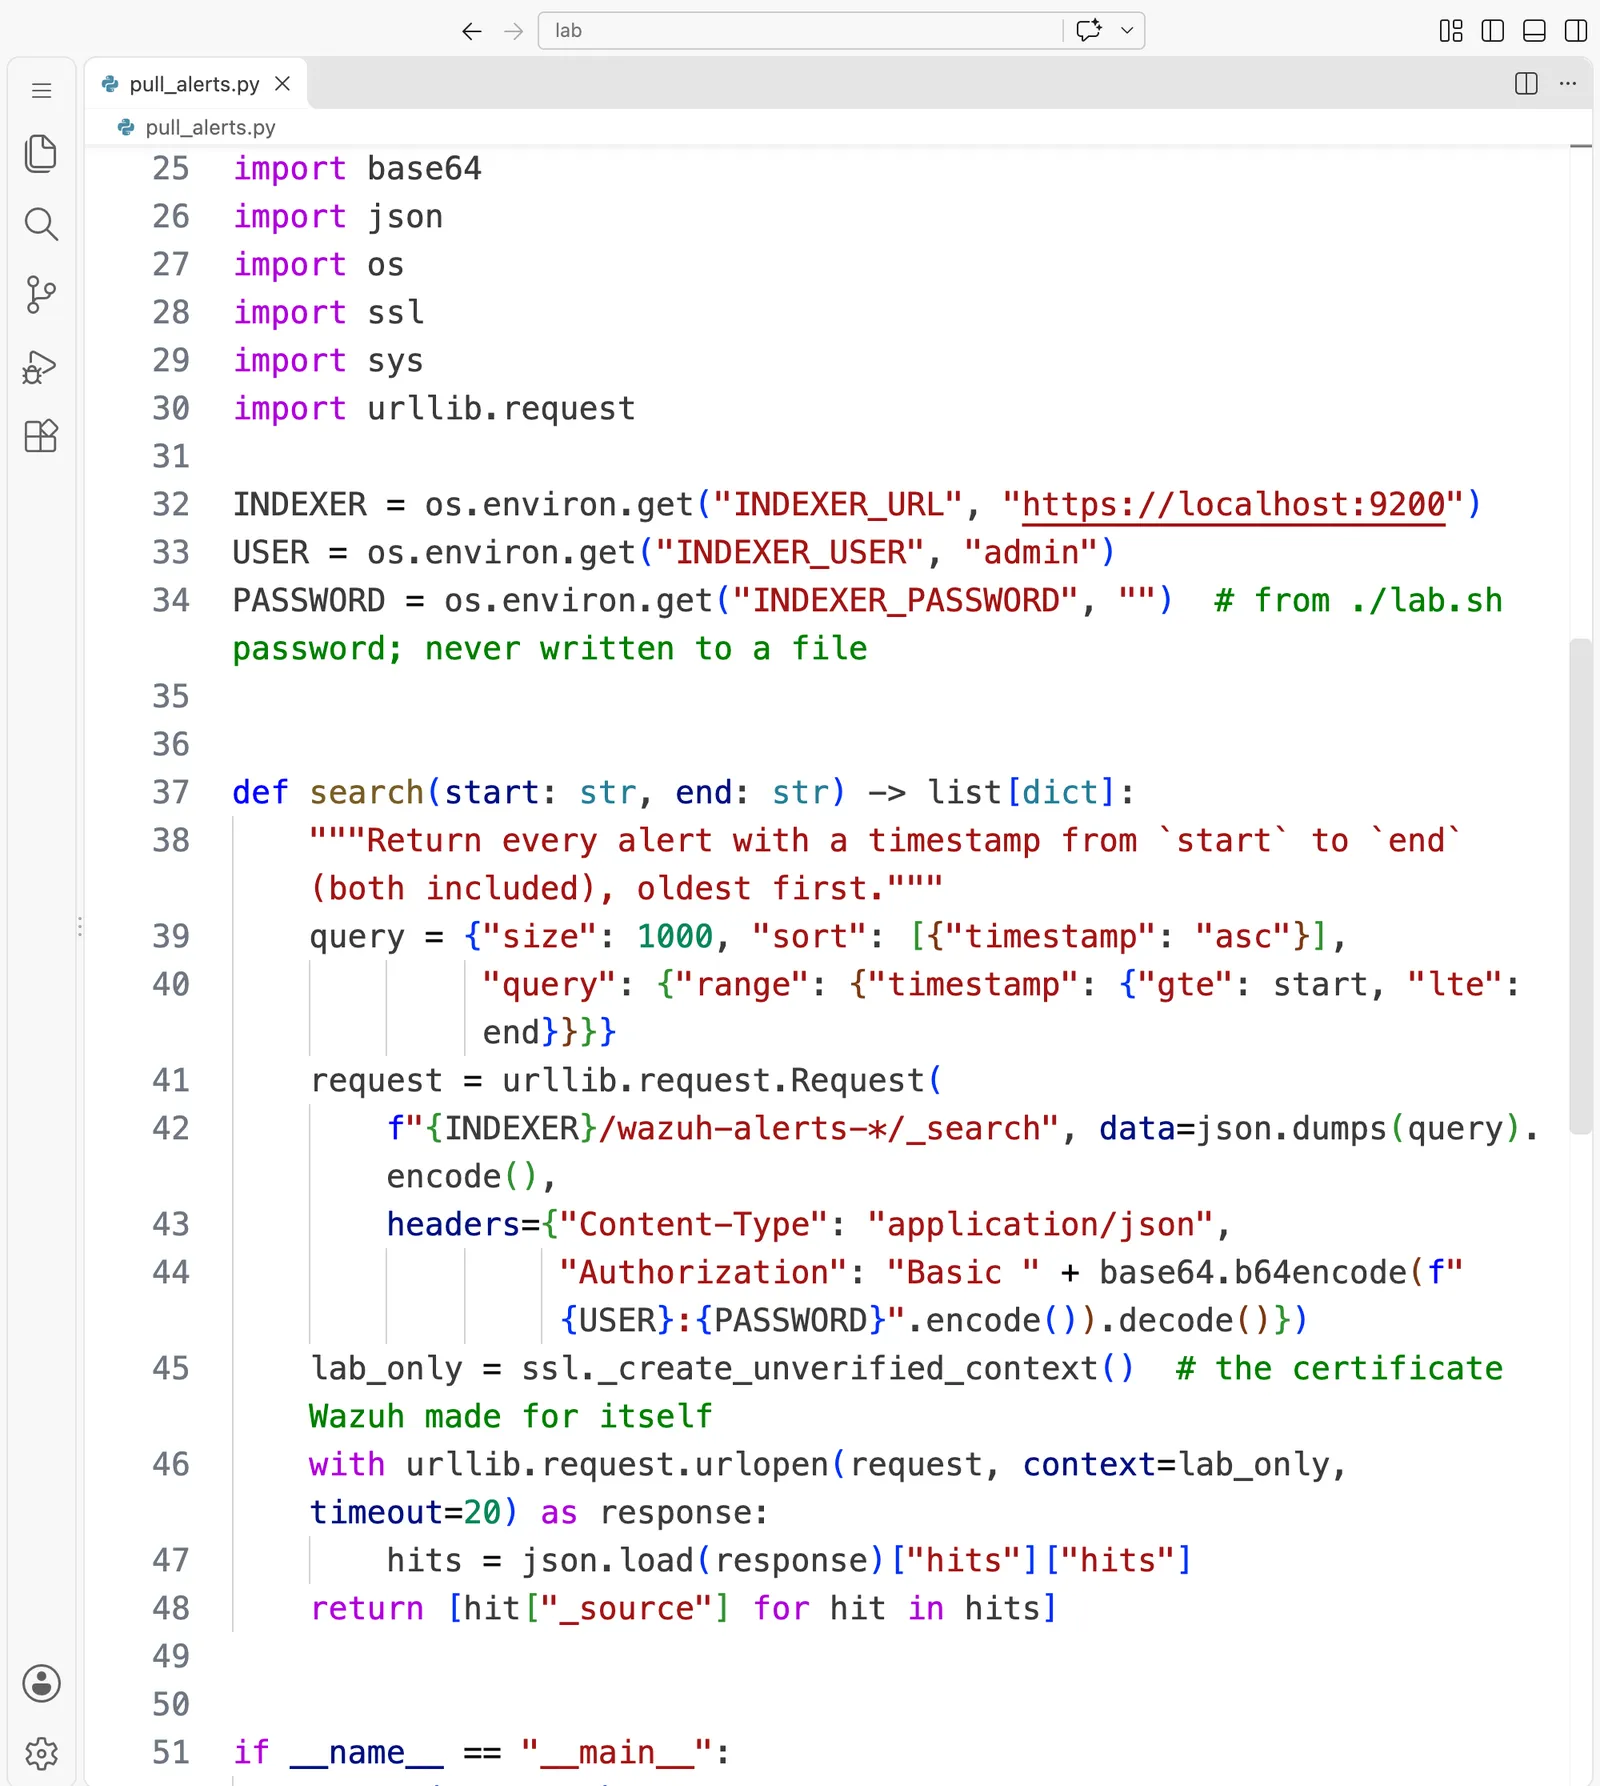
Everything above came from two short programs. Here is each one as it looks in VS Code, in full, and then as text you can copy.
queue.py

"""Show a shift's alerts the way a tier 1 analyst meets them: as a queue.

From the page "What a security operations centre does all day". Reads
alerts.json (real Wazuh alerts from our cloud lab, or from yours via pull_alerts.py)
and prints three views: every alert, most serious first; how many alerts fell
in each band of seriousness; and the alerts grouped by the address they came
from. It decides nothing for you. Needs only Python 3.10 or newer: no packages.

    python3 queue.py               the top of the queue, and the two summaries
    python3 queue.py --all         every alert in the queue
    python3 queue.py 10.20.2.66    only the alerts from one address

Author: Roni Das
Created: 2026-11-13
"""

import json
import sys
from collections import Counter, defaultdict
from pathlib import Path

ALERTS_FILE = Path(__file__).with_name("alerts.json")
TOP = 12  # how many alerts the first view shows


def band(level: int) -> str:
    """Wazuh rates every rule from 0 to 15. These three bands are ours, for reading a queue."""
    if level >= 12:
        return "high (12-15)"
    if level >= 7:
        return "medium (7-11)"
    return "low (0-6)"


def short(text: str, width: int = 48) -> str:
    """Shorten a rule description at a word boundary, so no word is cut in half."""
    return text if len(text) <= width else text[:width].rsplit(" ", 1)[0] + " ..."


def row(alert: dict) -> str:
    rule, data = alert["rule"], alert.get("data", {})
    when = alert["timestamp"][11:19]  # the time of day, in UTC
    source = data.get("srcip", "-")
    user = data.get("dstuser") or data.get("srcuser") or "-"
    return (f"{when}  {rule['level']:>2}  {rule['id']:>5}  {alert['agent']['name']:<15}  "
            f"{source:<11}  {user:<10}  {short(rule['description'])}")


def main() -> None:
    alerts = json.loads(ALERTS_FILE.read_text(encoding="utf-8"))
    args = sys.argv[1:]
    show_all = "--all" in args
    addresses = [a for a in args if a != "--all"]
    if addresses:
        alerts = [a for a in alerts if a.get("data", {}).get("srcip") == addresses[0]]
        print(f"Only the alerts from {addresses[0]}:\n")
        show_all = True

    print(f"THE QUEUE: {len(alerts)} alerts, most serious first (times in UTC)")
    print("time     lvl   rule  machine          from         user        what the rule says")
    queue = sorted(alerts, key=lambda a: (-a["rule"]["level"], a["timestamp"]))
    shown = queue if show_all else queue[:TOP]
    for alert in shown:
        print(row(alert))
    if len(shown) < len(queue):
        print(f"... and {len(queue) - len(shown)} more below these (python3 queue.py --all shows them)")

    print("\nHOW SERIOUS: alerts in each band")
    bands = Counter(band(a["rule"]["level"]) for a in alerts)
    for name in ("high (12-15)", "medium (7-11)", "low (0-6)"):
        print(f"  {name:<14} {bands.get(name, 0):>3}")

    print("\nWHERE FROM: alerts grouped by the address they came from")
    by_source = defaultdict(list)
    for alert in alerts:
        by_source[alert.get("data", {}).get("srcip", "no address")].append(alert)
    for source, group in sorted(by_source.items(), key=lambda item: -len(item[1])):
        top = max(a["rule"]["level"] for a in group)
        print(f"  {source:<11} {len(group):>3} alerts, highest level {top}")


if __name__ == "__main__":
    main()
band()turns Wazuh's 0 to 15 level into our three bands. Change the numbers and the summary changes with them.short()shortens a long rule description at a space, so no word is cut in half.main()prints the three views. With an address, it keeps only that address's alerts and shows them all.
pull_alerts.py
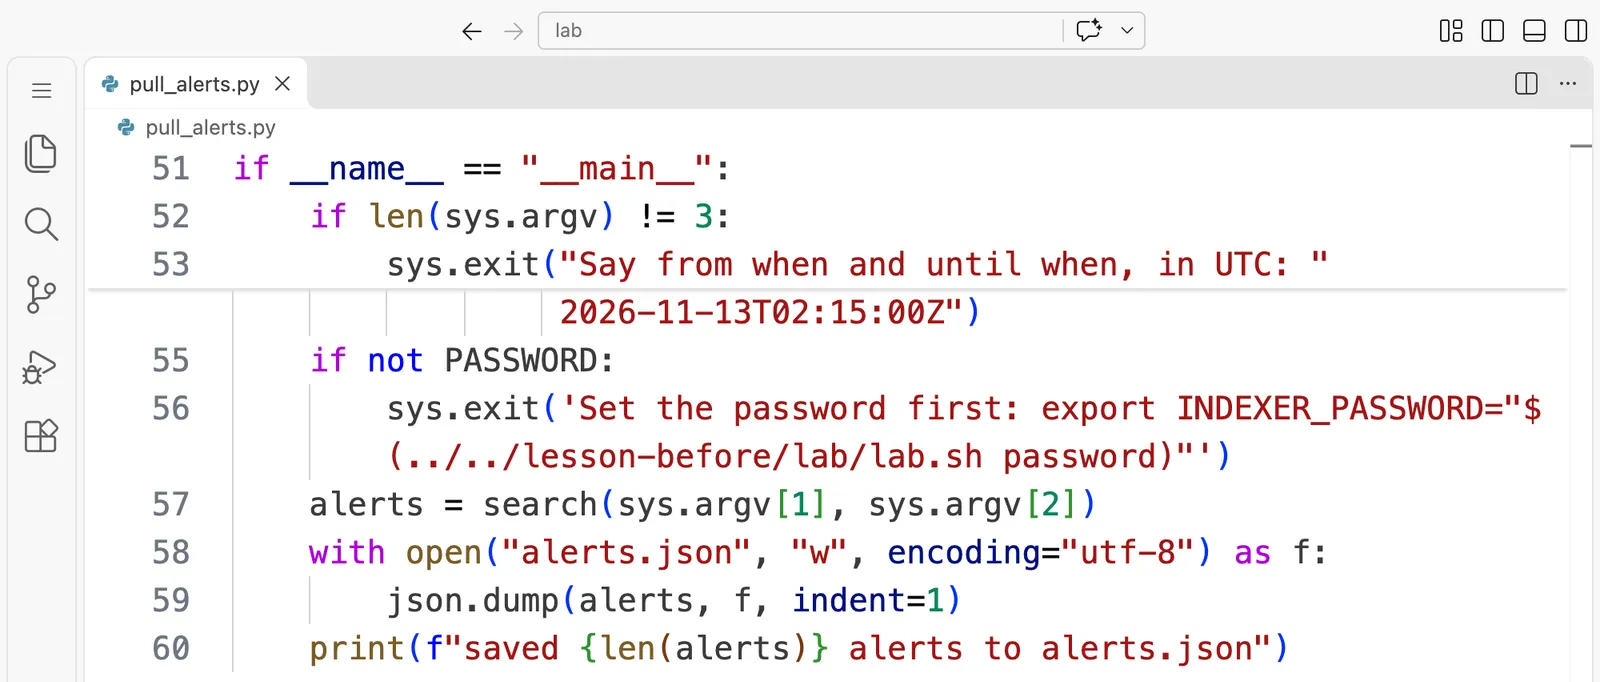
"""Save the alerts from your own Wazuh lab to alerts.json, so queue.py can read them.

From the page "What a security operations centre does all day". You need this
only if your cloud lab from "Before you start" is running; otherwise use the
alerts.json that came in this zip, saved from our cloud lab on 13 November 2026
(UTC). It asks the Wazuh indexer for every alert between two times you give,
in UTC, and changes nothing. Needs only Python 3.10 or newer.

First open the tunnel in a second terminal (./lab.sh tunnel, in the lab folder
of "Before you start"), so the indexer answers at https://localhost:9200, and
give this script the admin password:

    export INDEXER_PASSWORD="$(../../lesson-before/lab/lab.sh password)"

    python3 pull_alerts.py 2026-11-13T02:09:30Z 2026-11-13T02:15:00Z

The lab's indexer uses a certificate that Wazuh made for itself, so this script
does not check the certificate. That is acceptable for a lab reached only
through your own private tunnel, and never for a real SOC.

Author: Roni Das
Created: 2026-11-13
"""

import base64
import json
import os
import ssl
import sys
import urllib.request

INDEXER = os.environ.get("INDEXER_URL", "https://localhost:9200")
USER = os.environ.get("INDEXER_USER", "admin")
PASSWORD = os.environ.get("INDEXER_PASSWORD", "")  # from ./lab.sh password; never written to a file


def search(start: str, end: str) -> list[dict]:
    """Return every alert with a timestamp from `start` to `end` (both included), oldest first."""
    query = {"size": 1000, "sort": [{"timestamp": "asc"}],
             "query": {"range": {"timestamp": {"gte": start, "lte": end}}}}
    request = urllib.request.Request(
        f"{INDEXER}/wazuh-alerts-*/_search", data=json.dumps(query).encode(),
        headers={"Content-Type": "application/json",
                 "Authorization": "Basic " + base64.b64encode(f"{USER}:{PASSWORD}".encode()).decode()})
    lab_only = ssl._create_unverified_context()  # the certificate Wazuh made for itself
    with urllib.request.urlopen(request, context=lab_only, timeout=20) as response:
        hits = json.load(response)["hits"]["hits"]
    return [hit["_source"] for hit in hits]


if __name__ == "__main__":
    if len(sys.argv) != 3:
        sys.exit("Say from when and until when, in UTC: "
                 "python3 pull_alerts.py 2026-11-13T02:09:30Z 2026-11-13T02:15:00Z")
    if not PASSWORD:
        sys.exit('Set the password first: export INDEXER_PASSWORD="$(../../lesson-before/lab/lab.sh password)"')
    alerts = search(sys.argv[1], sys.argv[2])
    with open("alerts.json", "w", encoding="utf-8") as f:
        json.dump(alerts, f, indent=1)
    print(f"saved {len(alerts)} alerts to alerts.json")
- The query asks the
wazuh-alerts-*indices for up to 1,000 alerts with atimestampfrom your start time to your end time, oldest first. - It logs in as
adminwith the password you exported asINDEXER_PASSWORD, and it stops with a clear message if you forgot. The password never goes into a file. - It skips the certificate check, which is acceptable for a lab reached only through your own private tunnel and never for a real SOC.
Questions people ask
- What does a SOC analyst do all day?
Most of the day is the queue: one alert after another, each judged with the same routine of look, enrich, decide and record. Most alerts are harmless, so the skill is finding the few that are not and writing down why the others were closed. In our lab's short shift, Wazuh raised 41 alerts in about two and a half minutes, and only one of them was an incident to escalate.
- What is the difference between tier 1, tier 2 and tier 3 in a SOC?
Tier 1 triages the queue, alert by alert, and closes or escalates each one. In our shift, tier 1 escalated one incident out of 41 alerts. Tier 2 takes the escalated incidents, finds out how far the attacker got, and contains the attack with the owners of the systems. Tier 3 hunts for attackers that no alert has found yet and handles the hardest incidents.
- How do I know which alert to look at first?
Start with the highest Wazuh level, because the rule's author rated it as the most serious. In our shift that was rule 40112 at level 12, "Multiple authentication failures followed by a success", which means a guessed password probably worked. Then look around it, because a level is the rule's opinion, not a verdict about your alert.
- Why do two alerts with the same rule need different decisions?
The rule describes one log line, not the story around it. In our shift, rule 5760, "sshd: authentication failed", fired once for the administrator at 10.20.1.50, who mistyped a password and then logged in, and ten times for the attacker at 10.20.2.66, whose guessing ended in a break-in. Only the other alerts from each address told them apart.
- Can I practise SOC triage without a job in a SOC?
Yes. This page gives you the 41 real alerts from our cloud lab in
alerts.json, so you can work through a real queue with Python alone. When you build the lab from "Before you start", you can run the same shift and triage your own alerts.
Knowledge check
Answer all five questions before you read the answers below them.
1. A new tier 1 analyst sees two alerts with exactly the same rule, 5760 "sshd: authentication failed", at level 5. What should they do?
- A. Treat them the same way, because the rule and the level are the same.
- B. Close both, because level 5 is low.
- C. Look at what else came from each address before deciding, because the same rule can tell different stories.
- D. Escalate both, because failed logins can be the start of an attack.
2. In our shift, which alert came first in the queue, and why was that the right one to open first?
- A. Rule 5902, a new user, because new accounts are the most dangerous thing in a log.
- B. The oldest alert, because a queue is first in, first out.
- C. Rule 5760, because there were the most of them.
- D. Rule 40112 at level 12, because it means a login succeeded after many failures, so someone may be inside.
3. What is tier 2's job when tier 1 escalates an incident?
- A. Find out how far the attacker got, and contain the attack with the owners of the systems.
- B. Check whether tier 1 sorted the queue correctly.
- C. Write new detection rules so the alert does not fire again.
- D. Search the logs for attackers no rule has found yet.
4. The account backup-svc was created about 93 seconds before the attacker logged in. What does the evidence in the logs support?
- A. The attacker created it, because it appeared during the same shift as the attack.
- B. Nothing can be said without the dashboard.
- C. The attacker did not create it, because the attacker had not logged in yet, and the line shows
from=none; the administrator should still confirm it was planned. - D. It is harmless, because its level was only 8.
5. Try it. Run python3 queue.py --all in your lab folder. How many alerts in the shift came from rule 5715, "sshd: authentication success", and which address were they from?
- A. 4, all from 10.20.2.66.
- B. 3, all from 10.20.1.50.
- C. 1, from 10.20.2.66.
- D. 0, because successful logins do not raise alerts.
Answers
1. C. The rule says what happened in one log line, not why. In our shift the same rule came from the administrator's typo and from an attacker's guessing; the alerts around each one told them apart. A is the trap the whole page is about. B and D both decide without looking, one by closing too much and one by escalating too much.
2. D. Rule 40112 at level 12 means failures were followed by a success from the same address: someone probably got in. That is the most urgent fact of the shift, and the queue put it on top. A is tempting, and new accounts do deserve a check, but here the level and the evidence both rank it lower. C confuses how often with how serious. B treats the queue as first in, first out, which ignores how serious each alert is.
3. A. Tier 2 responds: how far did the attacker get, and how do we stop it spreading, together with the system owners. B is a team lead's review, not tier 2's job. C is a detection engineer's work. D is tier 3, the threat hunter.
4. C. The raw lines show the account was made at 02:09:50 by useradd on the server with no remote session attached (from=none), and the attacker's first successful login was at 02:11:22. The logs make the attacker an unlikely author, but only the administrator can confirm the account was planned, so a good note says both. A mistakes "in the same shift" for "caused by". B is wrong: the raw logs held the answer. D trusts a level as if it were a verdict.
5. B. queue.py --all lists three alerts from rule 5715, at 02:09:31, 02:09:45 and 02:11:41, all from 10.20.1.50, the administrator. The attacker's successful login did not raise a 5715 alert: that same log line matched the correlation rule 40112 at level 12, and one log line gives one alert, so it appears as 40112 instead. That is why A and C are wrong, and D is wrong because Wazuh does alert on successful logins, at a low level.
Going deeper, for working engineers and staff engineers
You can skip this part and lose nothing you need for the next page.
The numbers a SOC is run by. Two times matter most: the mean time to detect, from the first malicious event to the moment someone knows, and the mean time to respond, from knowing to containing. In our lab the detection was nearly instant: the attacker's successful login was written to the server's journal at 02:11:22.95, and Wazuh's rule 40112 alert was stamped one second later, at 02:11:23.91, and searchable at once. In a real SOC the slow part is the human queue: an alert can wait for minutes or hours before anyone opens it, which is the delay AI triage aims to shorten. The page "The report a SOC manager asks for" computes these numbers from your own lab.
What a level is. A Wazuh rule's level is set once, by whoever wrote the rule, for every machine that rule will ever run on. Rule 5902, "New user added to the system", is level 8 on a developer's workstation and on a domain controller alike. That is why mature SOCs add context the rule cannot know, such as how important the machine is and whether the user is privileged, and compute their own priority. Part 6 does this in code when it groups an alert storm into one case.
Counting is a source of disagreement. In alerts.json, 18 alerts carry the rule group authentication_failed (rules 5760, 5503, 2502, 5758 and 2501), 1 carries authentication_failures (5763) and 11 carry authentication_success (5715 three times and 5501 eight times). The dashboard's counters add groups, so they read 19 and 11 for a shift with ten wrong passwords from one address, one typo, and four logins that worked. When a manager asks "how many failed logins did we see?", the honest answer names what was counted.
Why the attacker's success shows as 40112 and not 5715. Wazuh evaluates a log line through a tree of rules and raises one alert, for the deepest rule that matched. The line "Accepted password for student from 10.20.2.66" matched 5715 first, then the child correlation rule 40112 (an authentication_success within 240 seconds of an authentication_failures event from the same source IP), so only 40112 was raised. If your queue ever "loses" an event, look for the rule that replaced it.
Times and zones. Wazuh stores timestamp in UTC, the server wrote its log in UTC, and the dashboard showed the browser's zone. A SOC that spans countries agrees on UTC in every ticket. Our scripts print UTC and say so.
Words from this page
| Word | What it means |
|---|---|
| tier 1, triage analyst | the analyst who works the queue and decides, alert by alert, what is harmless and what is real |
| tier 2, incident responder | the analyst who takes escalated incidents, finds how far the attacker got, and contains it |
| tier 3, threat hunter | the analyst who searches for attackers no alert has found, and handles the hardest incidents |
| detection engineer | the person who writes and tunes the rules that raise alerts |
| queue | the list of alerts waiting to be looked at |
| triage | deciding which alerts need attention first, and what each one is |
| escalate | hand an alert up to the next tier, with the evidence |
| contain | stop an attack from spreading, for example by disconnecting a machine or resetting a password |
| enrich | add the context an alert alone does not have, such as other alerts from the same address |
| alert fatigue | so many alerts that people stop reading them carefully |
full_log | the field in a Wazuh alert that keeps the raw log line the alert came from |
What to keep
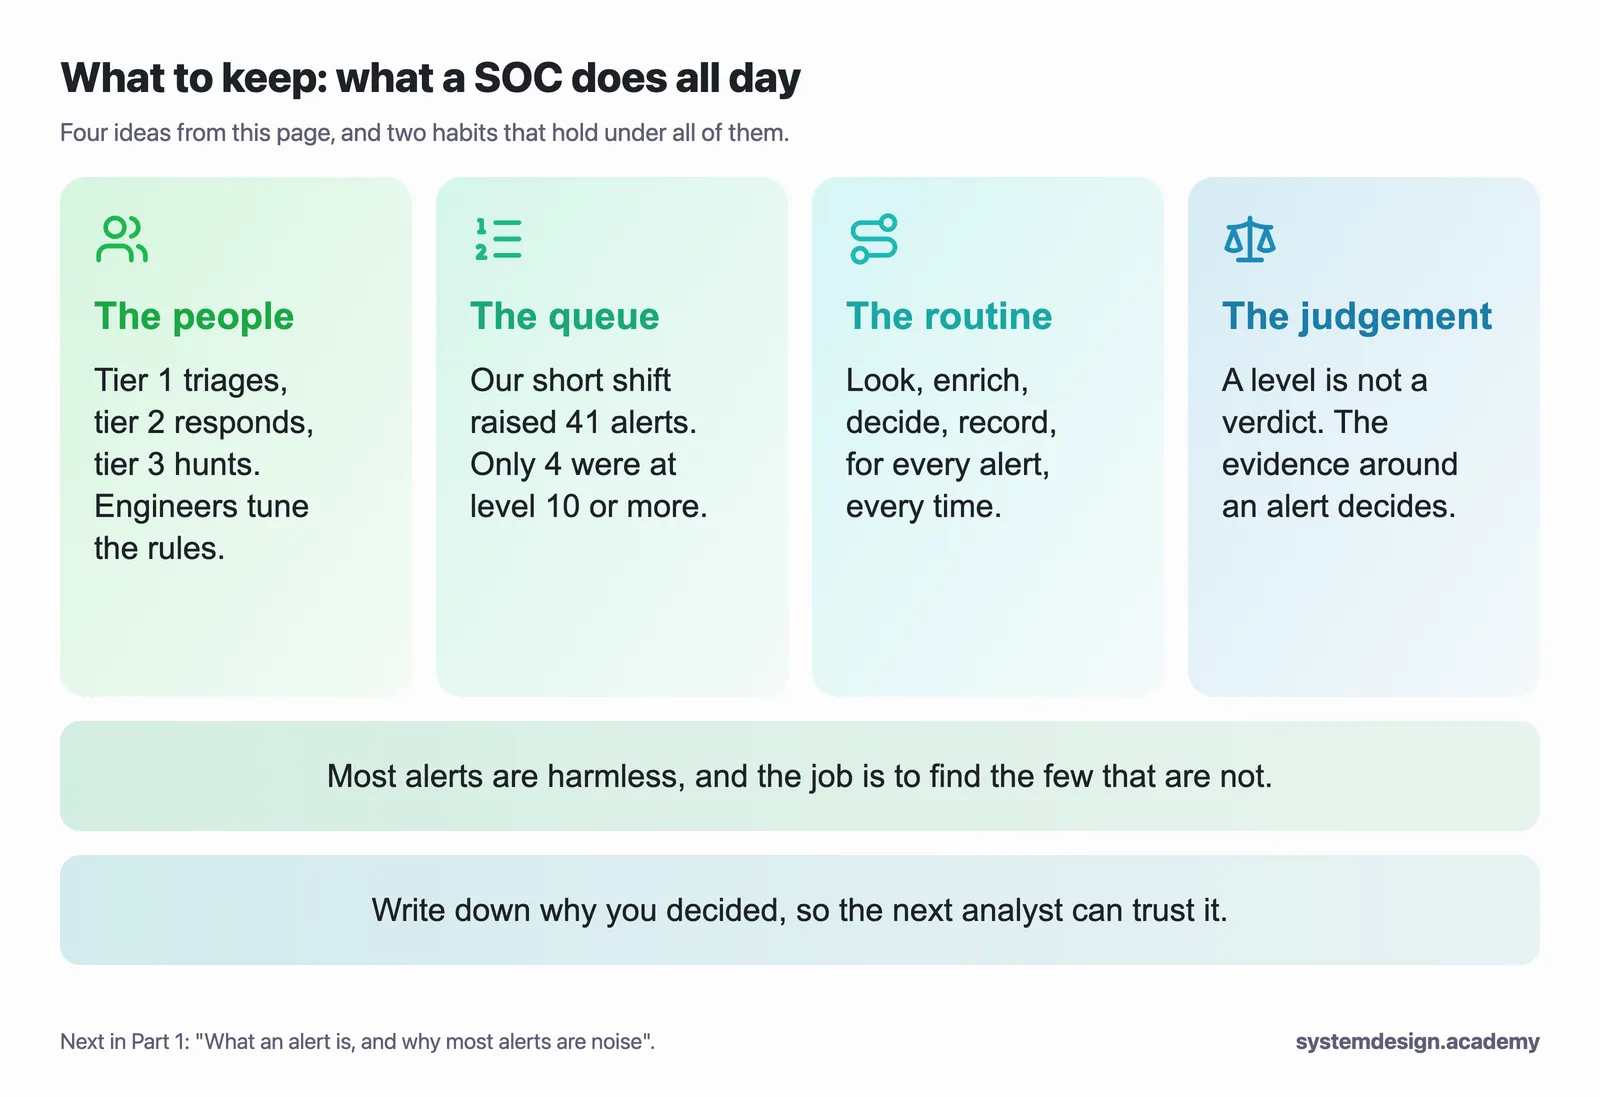
A SOC's day is the queue. Tier 1 judges each alert with the same routine: look, enrich, decide, record. Our short shift raised 41 alerts; the level put the real incident on top, but only the evidence around each alert could tell the administrator's typo from the attacker's guessing, and only the raw log lines could show that the new account was not the attacker's.
Download the code for this page: lesson-1.1.zip.
The next page in Part 1, "What an alert is, and why most alerts are noise", looks closely at true and false alarms, and at why a quiet SOC is not the same as a safe one.
Sources
- Our own lab run of 13 November 2026 in our own AWS account, built from the template in "Before you start": Wazuh 4.14.10 on its own server, an Ubuntu 24.04 practice server with
wazuh-agent4.14.10, the administrator's computeradmin-pcat 10.20.1.50 and the Kali Linux attacker at 10.20.2.66. The 41 alerts arelab/alerts.jsonin the zip, pulled from the indexer through the lab's tunnel for 02:09:30 to 02:15:00 UTC. Every terminal output above is filled from thescriptrecording of our VS Code terminal,runs/session-2026-11-13-cloud.log, with the prompt set to show only the folder name. The dashboard screenshots were taken in our own headless browser through the same tunnel, on the same data. - Wazuh documentation, version 4.14: rules classification and levels, https://documentation.wazuh.com/4.14/user-manual/ruleset/rules/rules-classification.html, and the alert fields, https://documentation.wazuh.com/4.14/user-manual/manager/alert-management.html.
- The Wazuh rules quoted are from the manager's own ruleset files:
0095-sshd_rules.xml(5715, 5758, 5760, 5763),0085-pam_rules.xml(5501, 5502, 5503),0020-syslog_rules.xml(2501, 2502, 5901, 5902) and0280-attack_rules.xml(40112).