Made by systemdesign.academy, the site with 984 interactive system design and AI engineering lessons.
See all 150 questions in this pack13 sections, in the order the PDF prints them. The answers are in the PDF; 5 are free below.
Descriptive statistics (11)
1.How do you detect outliers, and should you remove them? junior
2.Population vs sample, parameter vs statistic: what is the difference? junior
3.Average order value is 604 rupees, but the median order is 377. Which one goes in the board deck, and why? junior
4.What is standard deviation, and how is it different from variance? junior
5.You need to show delivery times for 20 cities. Would you use histograms, box plots, violin plots or ECDFs, and why? juniorfree below
6.What is a percentile, and how do you compute p90? junior
7.What is skewness, and how do you handle a heavily skewed feature? mid
8.What is Simpson's paradox? Give a real example. mid
9.Pearson or Spearman correlation: when do they disagree? mid
10.Correlation is not causation. How would you check whether X causes Y? mid
11.Why can the average of ratios differ from the ratio of averages, and which should a metric use? staff
Probability (5)
12.Support tickets per agent per day have a mean of 3 and a variance of 9. Is that Poisson, and when would you use a binomial instead? junior
13.What is the expected number of dice rolls to get a six? junior
14.What is the central limit theorem, and why does it matter for A/B tests? mid
15.A test is 99% accurate and you test positive. What is the chance you have the disease? midfree below
16.How do you estimate the median time until a user churns when most users have not churned yet? senior
Sampling and confidence intervals (9)
17.What is sampling bias? Give real examples. junior
18.What is the difference between standard deviation and standard error? junior
19.Simple random, stratified or cluster sampling: when do you use each? junior
20.What is bootstrapping, and how do you get a confidence interval from it? mid
21.What is a confidence interval, and what does "95%" actually mean? mid
22.How many samples do you need to estimate a proportion within plus or minus 2 points? mid
23.How do you compute a confidence interval for the difference between two conversion rates? senior
24.How do you sample uniformly from a stream of unknown length? senior
25.Why do small samples and rare events need a different confidence interval (Wilson, exact)? staff
Hypothesis testing (14)
26.What are the null and alternative hypotheses in a test? junior
27.What are Type I and Type II errors, and how do alpha and beta relate? mid
28.The worst 10% of delivery hubs got a coaching program, and their on-time rate improved the next month. Did coaching work? mid
29.One-tailed or two-tailed test: when is a one-tailed test acceptable? mid
30.t-test, z-test or chi-square test: which one do you use when? mid
31.What is a p-value? Give the exact definition. mid
32.What is statistical power, and what increases it? mid
33.Walk through a chi-square test of independence. mid
34.Paired or unpaired t-test? Show the difference with an example. mid
35.When do you use a non-parametric test such as Mann-Whitney U? mid
36.What is a permutation test, and why does it need so few assumptions? senior
37.Why does testing 20 metrics produce false positives, and how do Bonferroni and Benjamini-Hochberg help? senior
38.What is a minimum detectable effect, and how do you size an A/B test from it? senior
39.Statistically significant but not important: how do you tell the difference? senior
A/B testing (17)
40.Walk through how you design an A/B test from scratch. junior
41.How do you choose the randomization unit: user, session or page view? mid
42.What is the peeking problem in A/B testing? mid
43.What is a sample ratio mismatch, and how do you test for it? mid
44.What is an A/A test, and why run one? senior
45.How do you analyze a ratio metric such as clicks per session when the unit is the user? senior
46.Only 30% of users in the treatment group ever opened the new feature. How do you estimate its effect, and its effect on the people who actually used it? senior
47.How do you choose guardrail metrics alongside the primary metric? senior
48.What are novelty and primacy effects? senior
49.Conversion is up 2% but revenue is flat. How do you investigate? staff
50.How would you build an experimentation platform for 300 concurrent experiments? staff
51.When you cannot run an A/B test, what do you do instead? staff
52.Bayesian vs frequentist A/B testing: what changes in practice? staff
53.Why does A/B testing break on a marketplace or social network? staff
54.What is CUPED, and how does it reduce variance? staff
55.How can you stop an experiment early without inflating false positives? staff
56.How do you correct for selection bias in observational data? staff
SQL (20)
57.What is the difference between WHERE and HAVING? junior
58.Find the second-highest salary in each department. junior
59.What rows do INNER, LEFT and FULL OUTER joins return? junior
60.Remove duplicate rows, keeping the latest row per key. junior
61.Compute month-over-month revenue growth with LAG. mid
62.Pivot event counts by type into one row per user. mid
63.How do NULLs behave in COUNT, AVG and NOT IN? mid
64.Compute a 7-day rolling average of daily revenue. mid
65.Build a conversion funnel from an events table. mid
66.Why does a filter in WHERE turn a LEFT JOIN into an INNER JOIN? mid
67.ROW_NUMBER, RANK or DENSE_RANK: how do they differ on ties? mid
68.My SUM doubled after a join. Why, and how do I fix it? senior
69.How do you compute a median or a p90 per group in SQL, for example delivery minutes per city? senior
70.Write a query for a monthly retention cohort table. senior
71.Find users who spend more than the average of their city. senior
72.What share of first-time buyers make a second purchase within 30 days? Write the SQL. seniorfree below
73.A query is slow. How do you speed it up? senior
74.Group raw events into sessions using a 30-minute inactivity gap. senior
75.Find users who made purchases on 3 or more consecutive days. senior
76.Write the SQL for an A/B test readout from an assignment table and a purchases table. staff
pandas (12)
77.groupby with agg, transform or apply: which do you use when? junior
78.loc or iloc: what is the difference? junior
79.How do you find and handle missing values in pandas? junior
80.How do you merge DataFrames safely, and how do you catch an accidental many-to-many join? mid
81.Why is apply slow, and how do you vectorize it? mid
82.How do you resample, roll and shift a time series in pandas? mid
83.Wide to long and back: when do you use melt, pivot and pivot_table? mid
84.What is chained assignment, and what does Copy-on-Write change in pandas 3? senior
85.Event timestamps arrive as strings in mixed formats, some in UTC and some in IST. How do you parse them and count daily active users per local day in pandas? senior
86.How do you cut the memory of a large DataFrame? senior
87.Each order row holds a list of product IDs. How do you find which pairs of products are most often bought together in pandas? senior
88.When do you move from pandas to Polars, DuckDB or Spark? senior
Linear and logistic regression (14)
89.What is linear regression, and what does a coefficient mean? junior
90.Which models need feature scaling, and which do not? junior
91.Why not use linear regression for a yes/no target? junior
92.R-squared or adjusted R-squared: why does adding a junk feature raise R-squared? mid
93.statsmodels and scikit-learn give different logistic regression coefficients on the same data. Why? mid
94.How do you interpret a logistic regression coefficient? mid
95.What are the assumptions of linear regression? mid
96.How do you put categorical variables into a regression, and what is the dummy variable trap? mid
97.How do you model a non-linear relationship with a linear model? senior
98.You fit a marketing mix model with 12 correlated channel spends. Lasso, ridge or elastic net, and why might lasso drop a channel that really works? senior
99.What is multicollinearity, and how does VIF detect it? senior
100.What is heteroscedasticity, and what does it do to your conclusions? senior
101.Orders per user are counts with many zeros. Why not ordinary least squares, and what do you use instead? senior
102.What is the difference between a confidence interval and a prediction interval? senior
Trees, ensembles and other classical models (12)
103.How does a decision tree choose where to split? junior
104.Bagging or boosting: what is the difference? junior
105.Logistic regression or gradient boosting for a churn model: how do you choose? mid
106.Why does a random forest reduce variance compared with a single tree? mid
107.How does k-means work, and how do you choose k? mid
108.How do you detect overfitting, and how do you fix it? mid
109.Compute Gini impurity and information gain for a split. mid
110.How does gradient boosting build each new tree from the errors of the previous ones? senior
111.Why can tree models not extrapolate beyond the training range? senior
112.Which XGBoost or LightGBM hyperparameters matter most, and how do you tune them? senior
113.What is the curse of dimensionality, and why does it hurt k-nearest neighbors? senior
114.Impurity importance, permutation importance or SHAP: which can you trust? staff
Model evaluation metrics (14)
115.Why is accuracy misleading on imbalanced data? junior
116.Your fraud model has precision 0.80 and recall 0.50. Explain both to the head of risk in rupees, and say what happens if you lower the threshold. junior
117.How does k-fold cross-validation work, and why use it? mid
118.MAE, RMSE or MAPE: what goes wrong with each? mid
119.PR-AUC or ROC-AUC: which should you use on imbalanced data? mid
120.What is the F-beta score, and when do you choose beta above or below 1? mid
121.A product manager asks whether an AUC of 0.78 is good enough to launch. What do you say? mid
122.Macro, micro or weighted averaging for multi-class metrics: what changes? senior
123.What is calibration, and how do you fix a badly calibrated model? senior
124.Resampling, class weights or threshold moving: how do you handle class imbalance? senior
125.When does SMOTE help, and when does it hurt? senior
126.Log loss and accuracy can disagree. Why? senior
127.How do you evaluate a lending model when you only see outcomes for approved applicants? staff
128.Why can ROC-AUC go up while the business metric goes down? staff
Feature engineering and leakage (8)
129.Which features would you build from a timestamp? junior
130.What is data leakage? Give three examples. junior
131.How do you build features from a customer's event history (recency, frequency, monetary value)? mid
132.Your churn model scores 0.84 AUC in cross-validation but 0.53 on customers who joined last month. What happened? senior
133.How do you turn text into features for a classical model? senior
134.Which features would you build from pickup and drop latitude and longitude for a delivery-time model? senior
135.A feature looks too good to be true. How do you find target leakage? staff
136.How does preprocessing before the train/test split leak information? staff
Time series and forecasting (3)
137.What are trend, seasonality and autocorrelation, and how do you see them in a daily metric? mid
138.Orders dropped 8% today. How do you tell a real anomaly from normal noise before you start a root-cause hunt? mid
139.How would you forecast daily orders for the next four weeks, and how do you know the forecast is any good? seniorfree below
Product sense and metrics case studies (11)
140.How would you define a North Star metric for a food delivery app? mid
141.Daily active users fell 10% yesterday. How do you investigate? mid
142.Where are users dropping off in a sign-up funnel, and what would you do? mid
143.How do you measure retention correctly? senior
144.Estimate how many food delivery orders are placed in Bengaluru on a weekday. senior
145.How do you structure an answer to a product case interview? staff
146.Engagement went up but retention went down. How do you decide what to ship? staff
147.How would you define success metrics for a new feature like Stories? staff
148.Which metrics would you track for a two-sided marketplace like ride hailing? staff
149.How do you design a metric that people cannot easily game? staff
150.A coupon A/B test shows a small average lift. How do you find which users the coupon actually works for, and who should get it next time? stafffree below
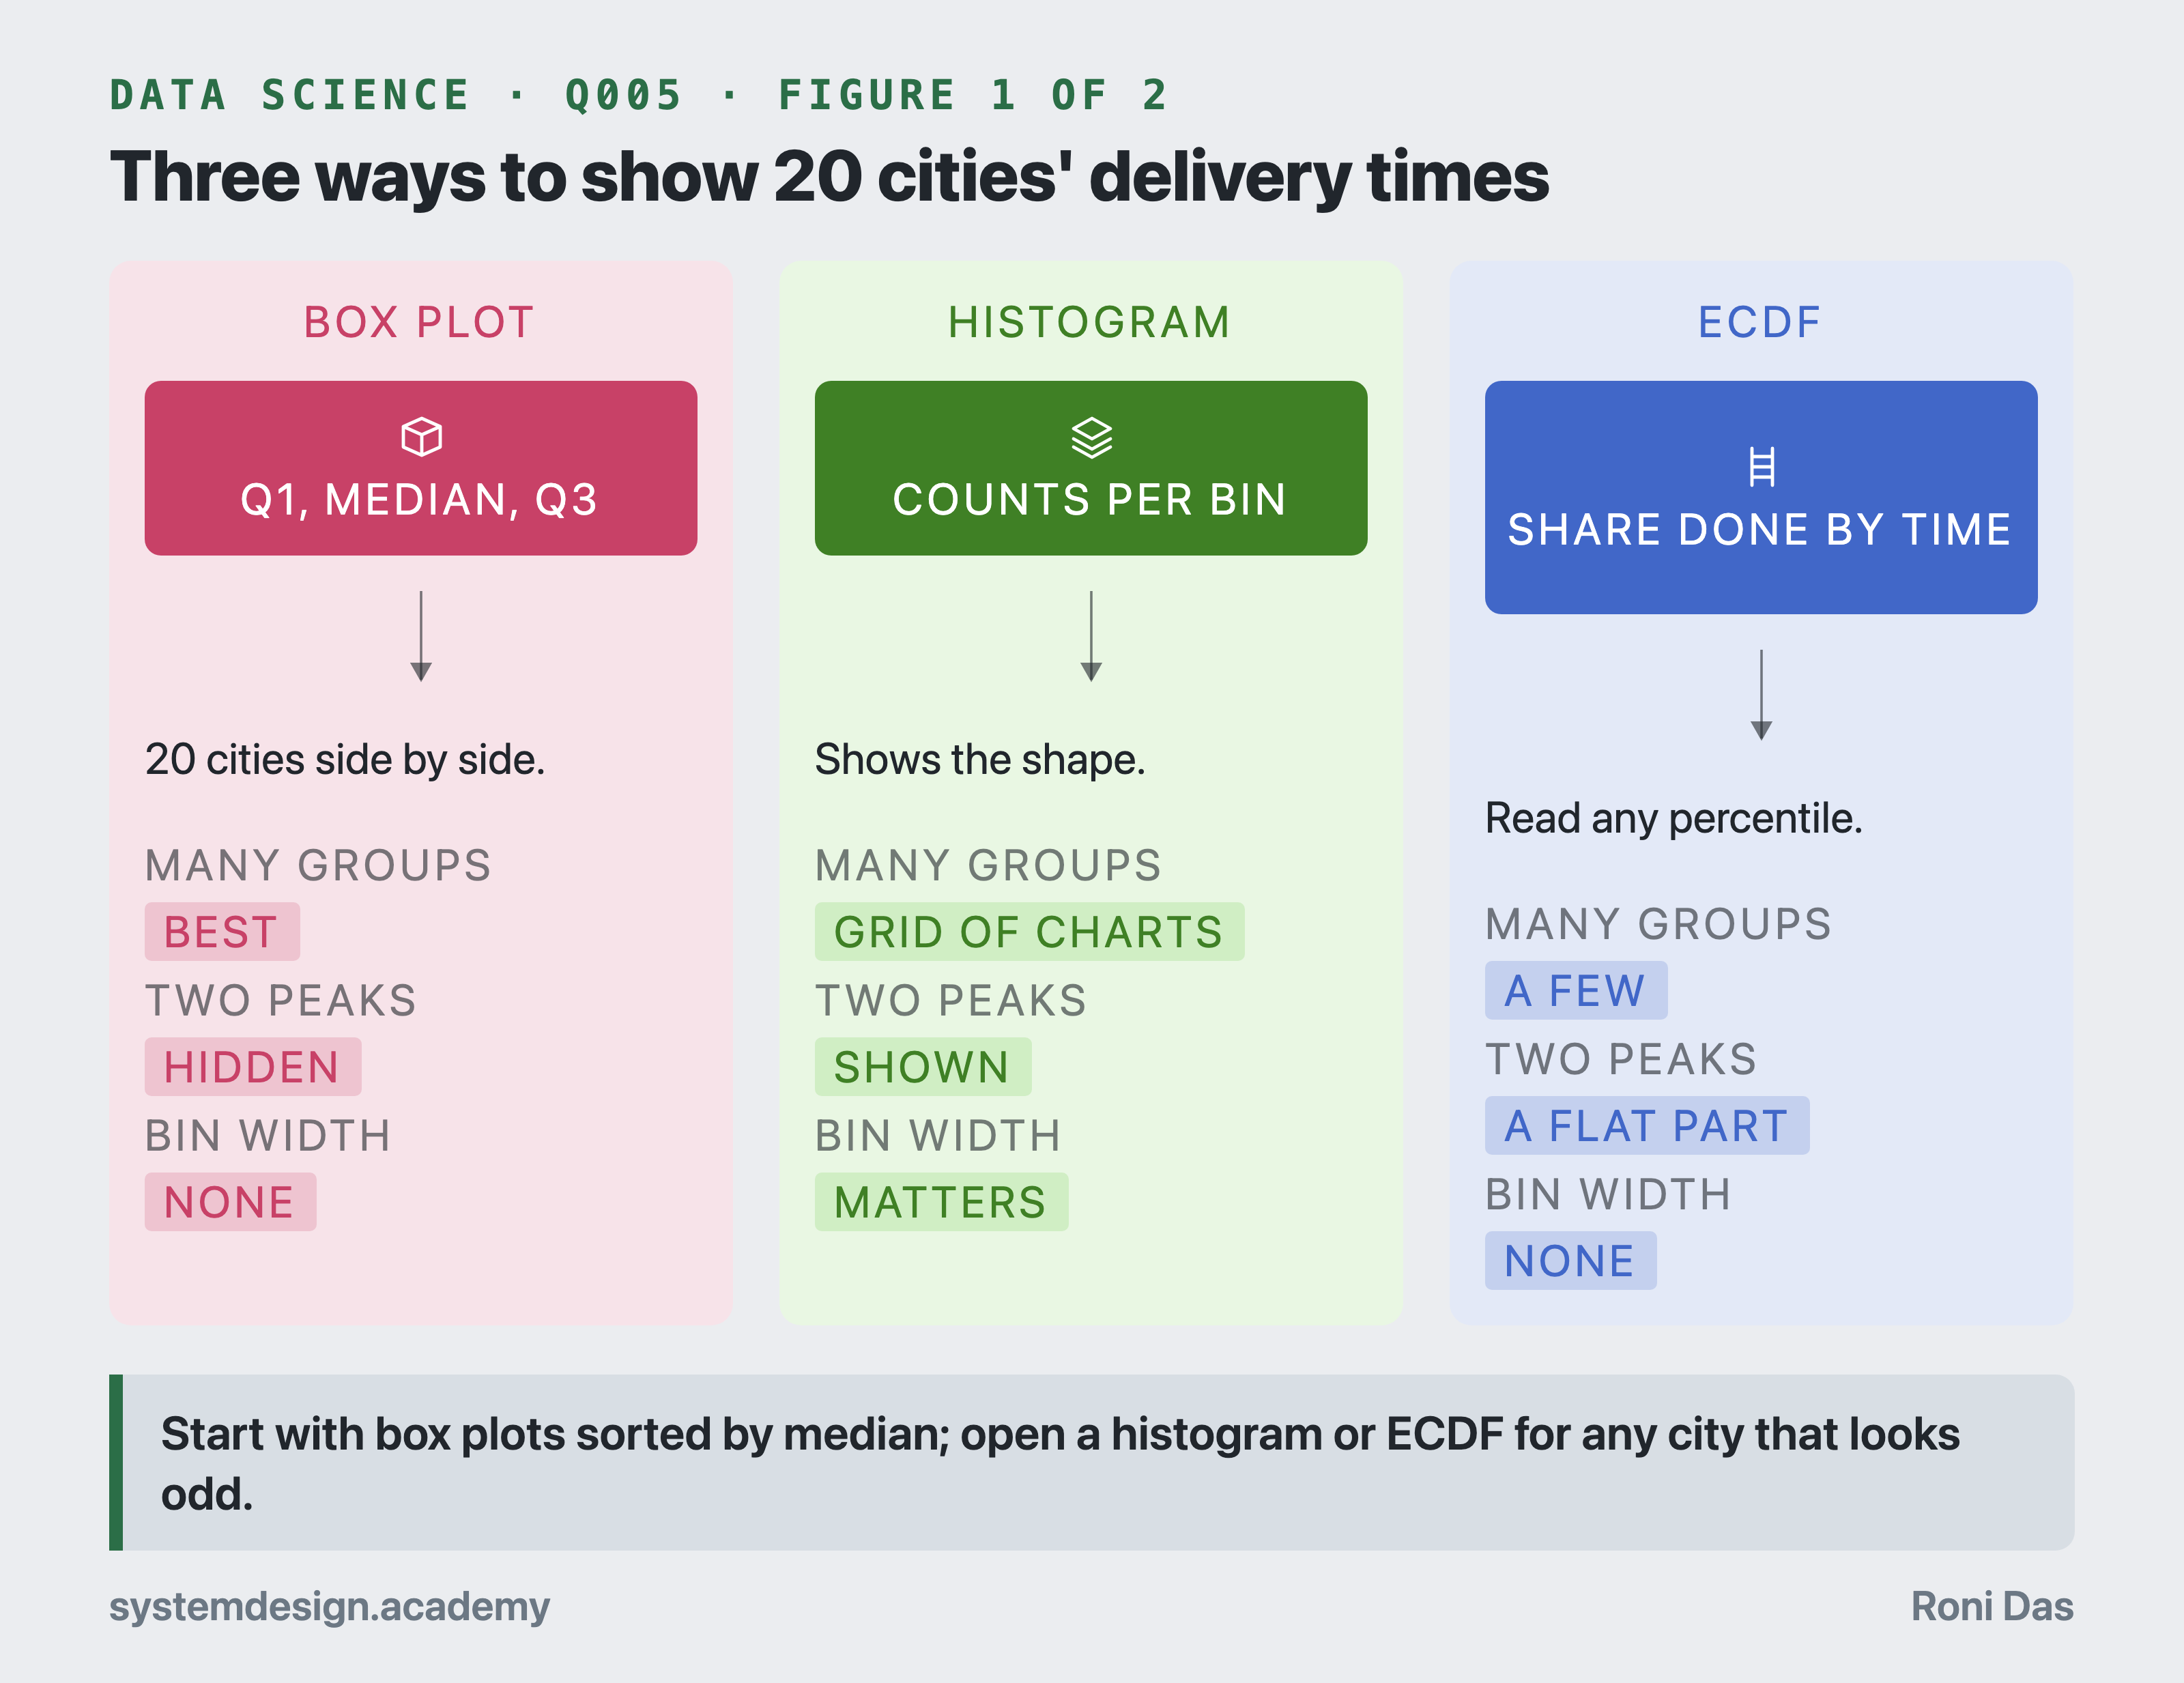
Three panels comparing box plots, histograms and ECDFs on comparing many cities, showing peaks and needing a bin width.
Why it is asked: Choosing a chart is choosing what the reader can see. The interviewer checks that you know what each chart hides, not only how to draw it.
I would start with box plots sorted by median, with each city's order count printed next to it, and then open a histogram or ECDF for any city that looks unusual, because a box plot can hide a distribution with two peaks.
What each chart does:
- Box plot: the box runs from Q1 to Q3 (the 25th and 75th percentiles, the middle half of orders), the line inside is the median, the whiskers reach the furthest points within 1.5 x IQR (interquartile range, the box length), and dots beyond them are outliers. Twenty boxes fit side by side, so it is the best first view.
- Histogram: bars count orders in bins of equal width. It shows shape, but changes with the bin width; 20 of them need small multiples (a grid of small charts sharing axes).
- Violin plot: a box plot with a smoothed histogram on each side. It shows peaks, but the smoothing can invent shape for a city with few orders.
- ECDF (empirical cumulative distribution function): for every x, the share of orders delivered within x minutes. It has no bins, any percentile can be read off it, and a few cities overlay cleanly.
Example from a simulation with 400 orders per city: City A and City B have almost the same box (median 32.0 minutes, Q1 23.8 vs 24.1, Q3 40.6 vs 40.9). Their histograms differ: A has one broad hump, B has two peaks near 24 and 41 minutes. Only 6% of B's orders take 29 to 35 minutes, against 18.5% of A's.
Always show sample size: 40 orders look as certain as 40,000.
What the interviewer listens for
Box plots compare many groups at once but can hide two peaks.
Histograms show shape but depend on the bin width.
ECDFs need no bins and show every percentile.
Small multiples (a grid of small charts) with shared axes, and the sample size per city.
Follow-ups the interviewer may ask
How would you order the 20 boxes? Hint: by median, or by p90 if the slow tail is the business problem, never alphabetically.
A violin plot shows a bump for a city with 30 orders. Do you trust it? Hint: no; smoothing invents shape with few points, so show the raw points.
What would you show a non-technical audience? Hint: the median and p90 per city, plus the share of orders later than the promised time.
Common mistakes
Trusting a box plot alone when the shape matters.
Comparing histograms drawn with different bins or axes.
Hiding sample sizes, so a tiny city looks as reliable as a big one.
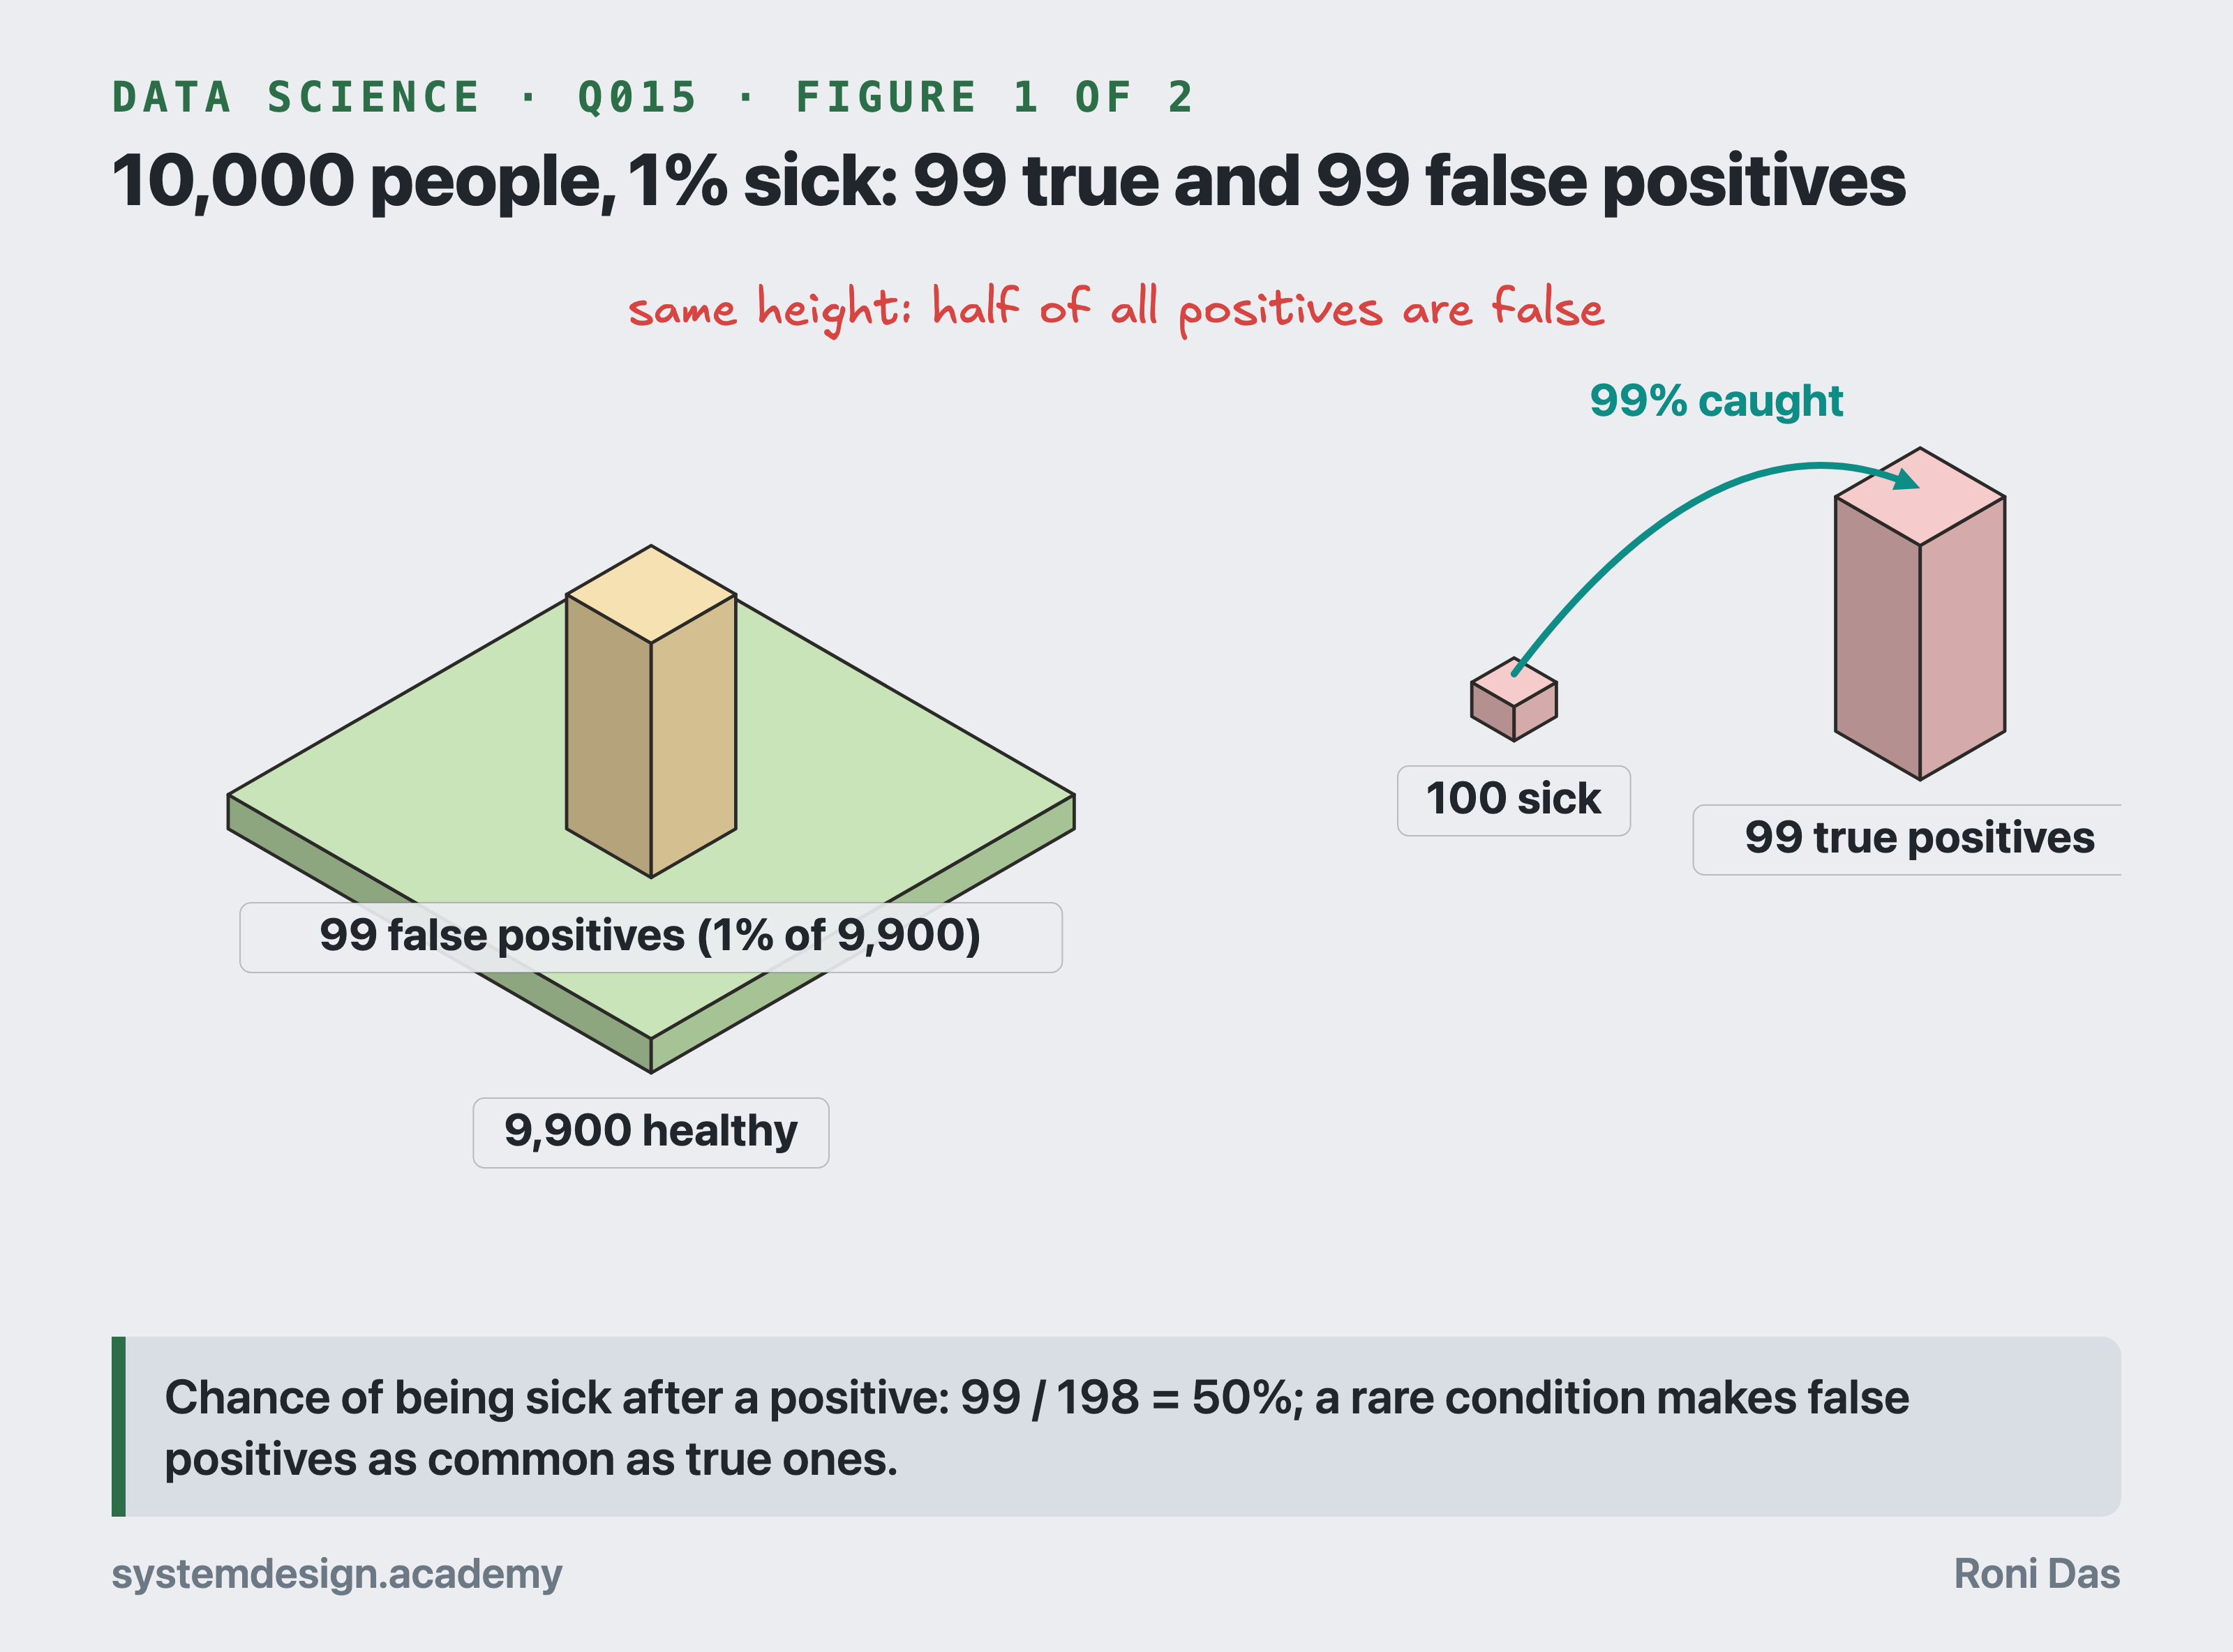
Isometric blocks: a large slab of 9,900 healthy people and a small block of 100 sick people produce two equal towers of 99 false positives and 99 true positives.
Why it is asked: This is the classic base-rate question; it tests whether you ask for the prevalence instead of answering 99%.
It depends on how common the disease is; if 1% of people have it and the test is 99% sensitive and 99% specific, the chance is only 50%.
First I would ask what '99% accurate' means. Assume sensitivity = 99% (it catches 99% of sick people) and specificity = 99% (it correctly clears 99% of healthy people), and a prevalence (base rate) of 1%.
Work it out for 10,000 people:
- 100 are sick, and the test catches 99 of them (true positives).
- 9,900 are healthy, and 1% of them, 99 people, test positive anyway (false positives).
- So 99 + 99 = 198 people test positive, and only 99 of them are sick: 99 / 198 = 50%.
The answer moves a lot with the base rate. With the same test:
- prevalence 0.1%: P(sick | positive), the chance of being sick given a positive test, = 9.0%;
- prevalence 10%: P(sick | positive) = 91.7%.
The lesson for data science: precision (the share of flagged cases that are real) depends on the base rate. A fraud model with 99% specificity still produces mostly false alarms if only 0.1% of transactions are fraud. That is why you report precision at the real base rate, not just accuracy or ROC-AUC (a ranking-quality score).
What the interviewer listens for
Ask for the base rate and what 'accurate' means.
Count true and false positives in a concrete population.
Prevalence 1%: 99 true vs 99 false positives, so 50%.
Precision collapses when the positive class is rare.
Follow-ups the interviewer may ask
How would a second independent positive test change it? Hint: prior 50% becomes 99 x 0.99 / (99 x 0.99 + 99 x 0.01) = 99%.
What metric would you show a fraud team? Hint: precision and recall at the operating threshold, at the real fraud rate.
Why is accuracy useless here? Hint: a test that says 'healthy' to everyone is 99% accurate at 1% prevalence.
Common mistakes
Answering 99%.
Not asking for prevalence.
Treating sensitivity and P(disease | positive) as the same thing.
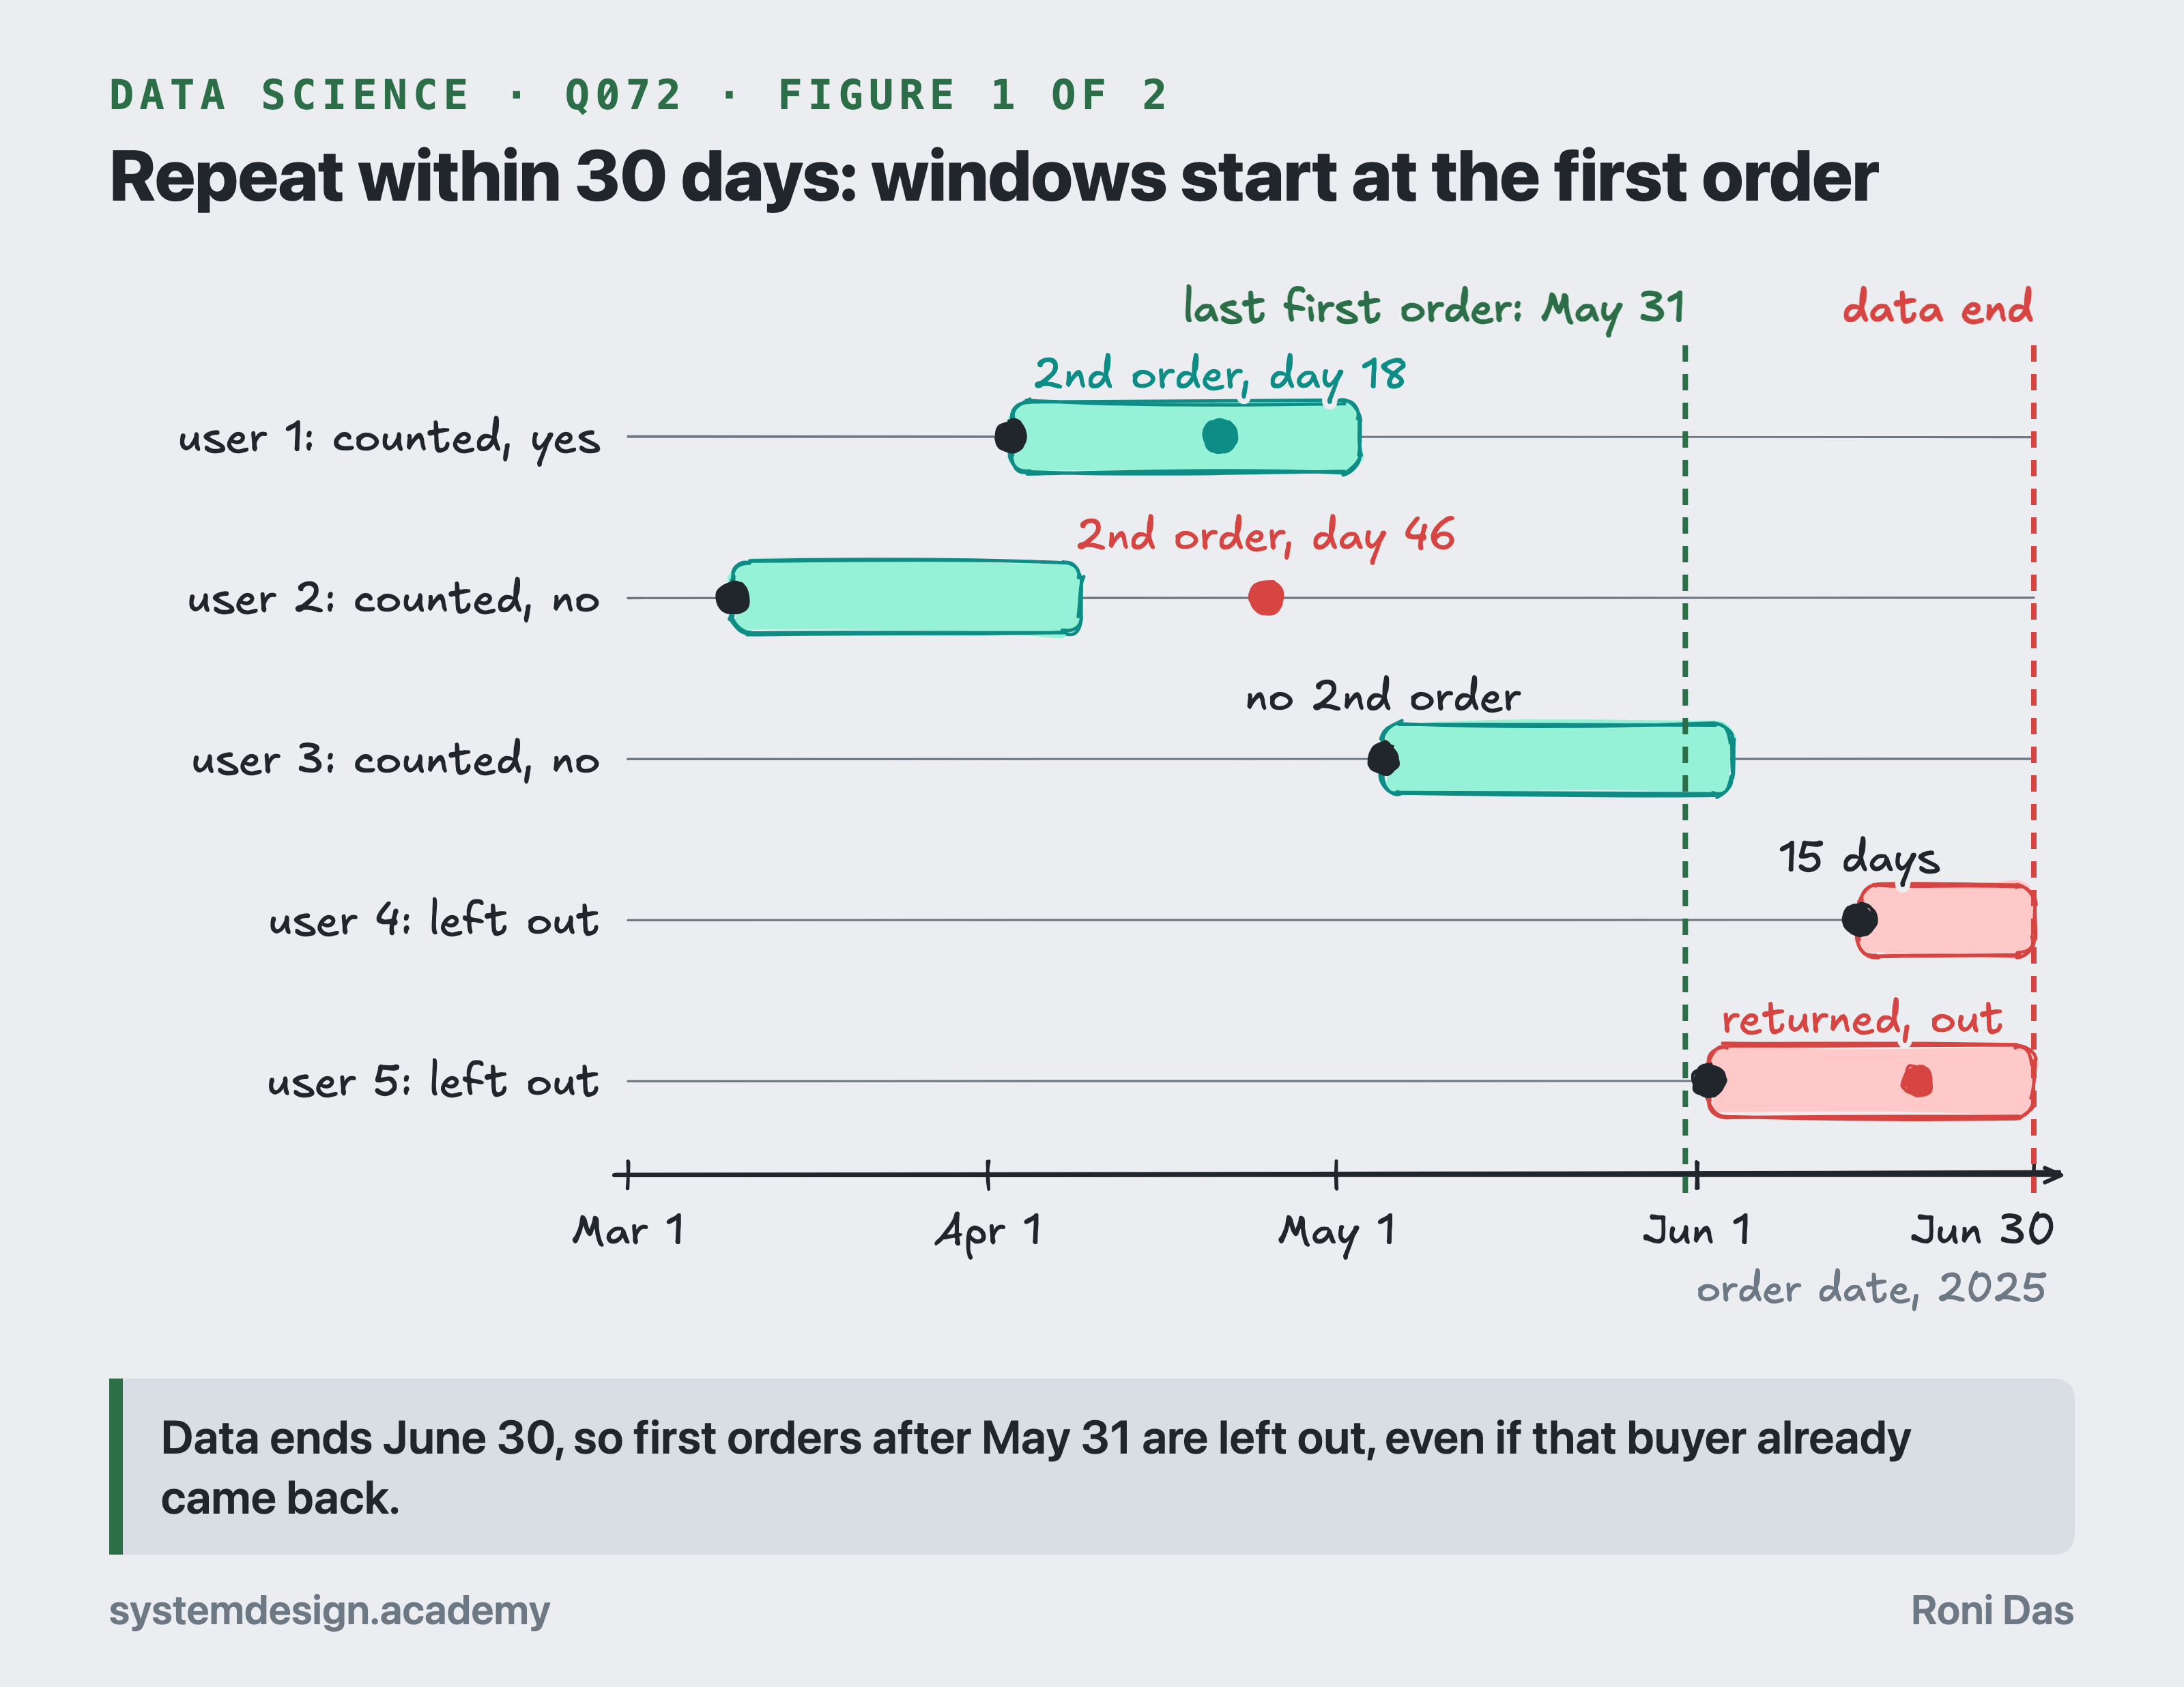
Hand-drawn timeline of five users from March 1 to June 30: two counted users with 30-day windows, one repeat after 46 days that does not count, and two June buyers left out because their window runs past the data end.
Why it is asked: Repeat rate is a core retention metric for any commerce app. The interviewer checks that you count users rather than orders, measure the window from the first purchase, and notice that recent buyers have not had 30 days to come back.
Find each user's first order and the date of their next order, then take the share of users whose next order falls within 30 days of the first; include only users whose first order is at least 30 days before the data ends, because the others have not had a full 30 days to come back.
Steps (DuckDB query in the code below):
- One row per user: ROW_NUMBER() over each user's orders by date marks the first order (rn = 1), and LEAD(order_date) (the next row's value) on the same window gives the next order's date.
- The flag: next_date <= first date + 30. A user with no next order has a NULL next_date, which the CASE turns into 0.
- The denominator is users, not orders: COUNT(*) over the rn = 1 rows.
- Right-censoring means we stopped watching before the outcome window finished. The data ends on June 30, so only users whose first order is on or before May 31 are counted.
On 4,000 simulated users with first orders from January to June 2025, the query keeps 3,309 users and gives 35.3%. Without the date filter it gives 32.9%, because 691 June buyers had less than 30 days to return; the June cohort alone shows 21.3%, against 34% to 37% for the other months. The true rate in the simulation is 35.2%.
Drop late users whatever they did, including those who already came back. Keeping only the late users who returned would push the rate up instead. To track the metric over time, report it per first-order month (a cohort) and mark the newest month as incomplete.
What the interviewer listens for
One row per user: first order (ROW_NUMBER = 1) plus the next order date (LEAD or a self-join).
The 30-day window starts at each user's first order.
Count users, not orders.
Right-censoring: drop users whose first order is within 30 days of the data end (35.3% vs 32.9% here).
Follow-ups the interviewer may ask
Two orders placed 5 minutes apart: is that a repeat? Hint: decide on a rule, such as a second order on a later day or a gap of more than an hour, and write it into the metric definition.
How would you use the users you dropped? Hint: a survival curve (Kaplan-Meier) uses each user's partial follow-up instead of discarding it.
How do you show the trend? Hint: the same query grouped by first-order month, with the last month flagged as incomplete.
Common mistakes
Dividing by orders instead of first-time buyers.
Including buyers whose 30-day window has not finished, which drags the rate down.
Excluding only the late buyers who did not return, which pushes it up.
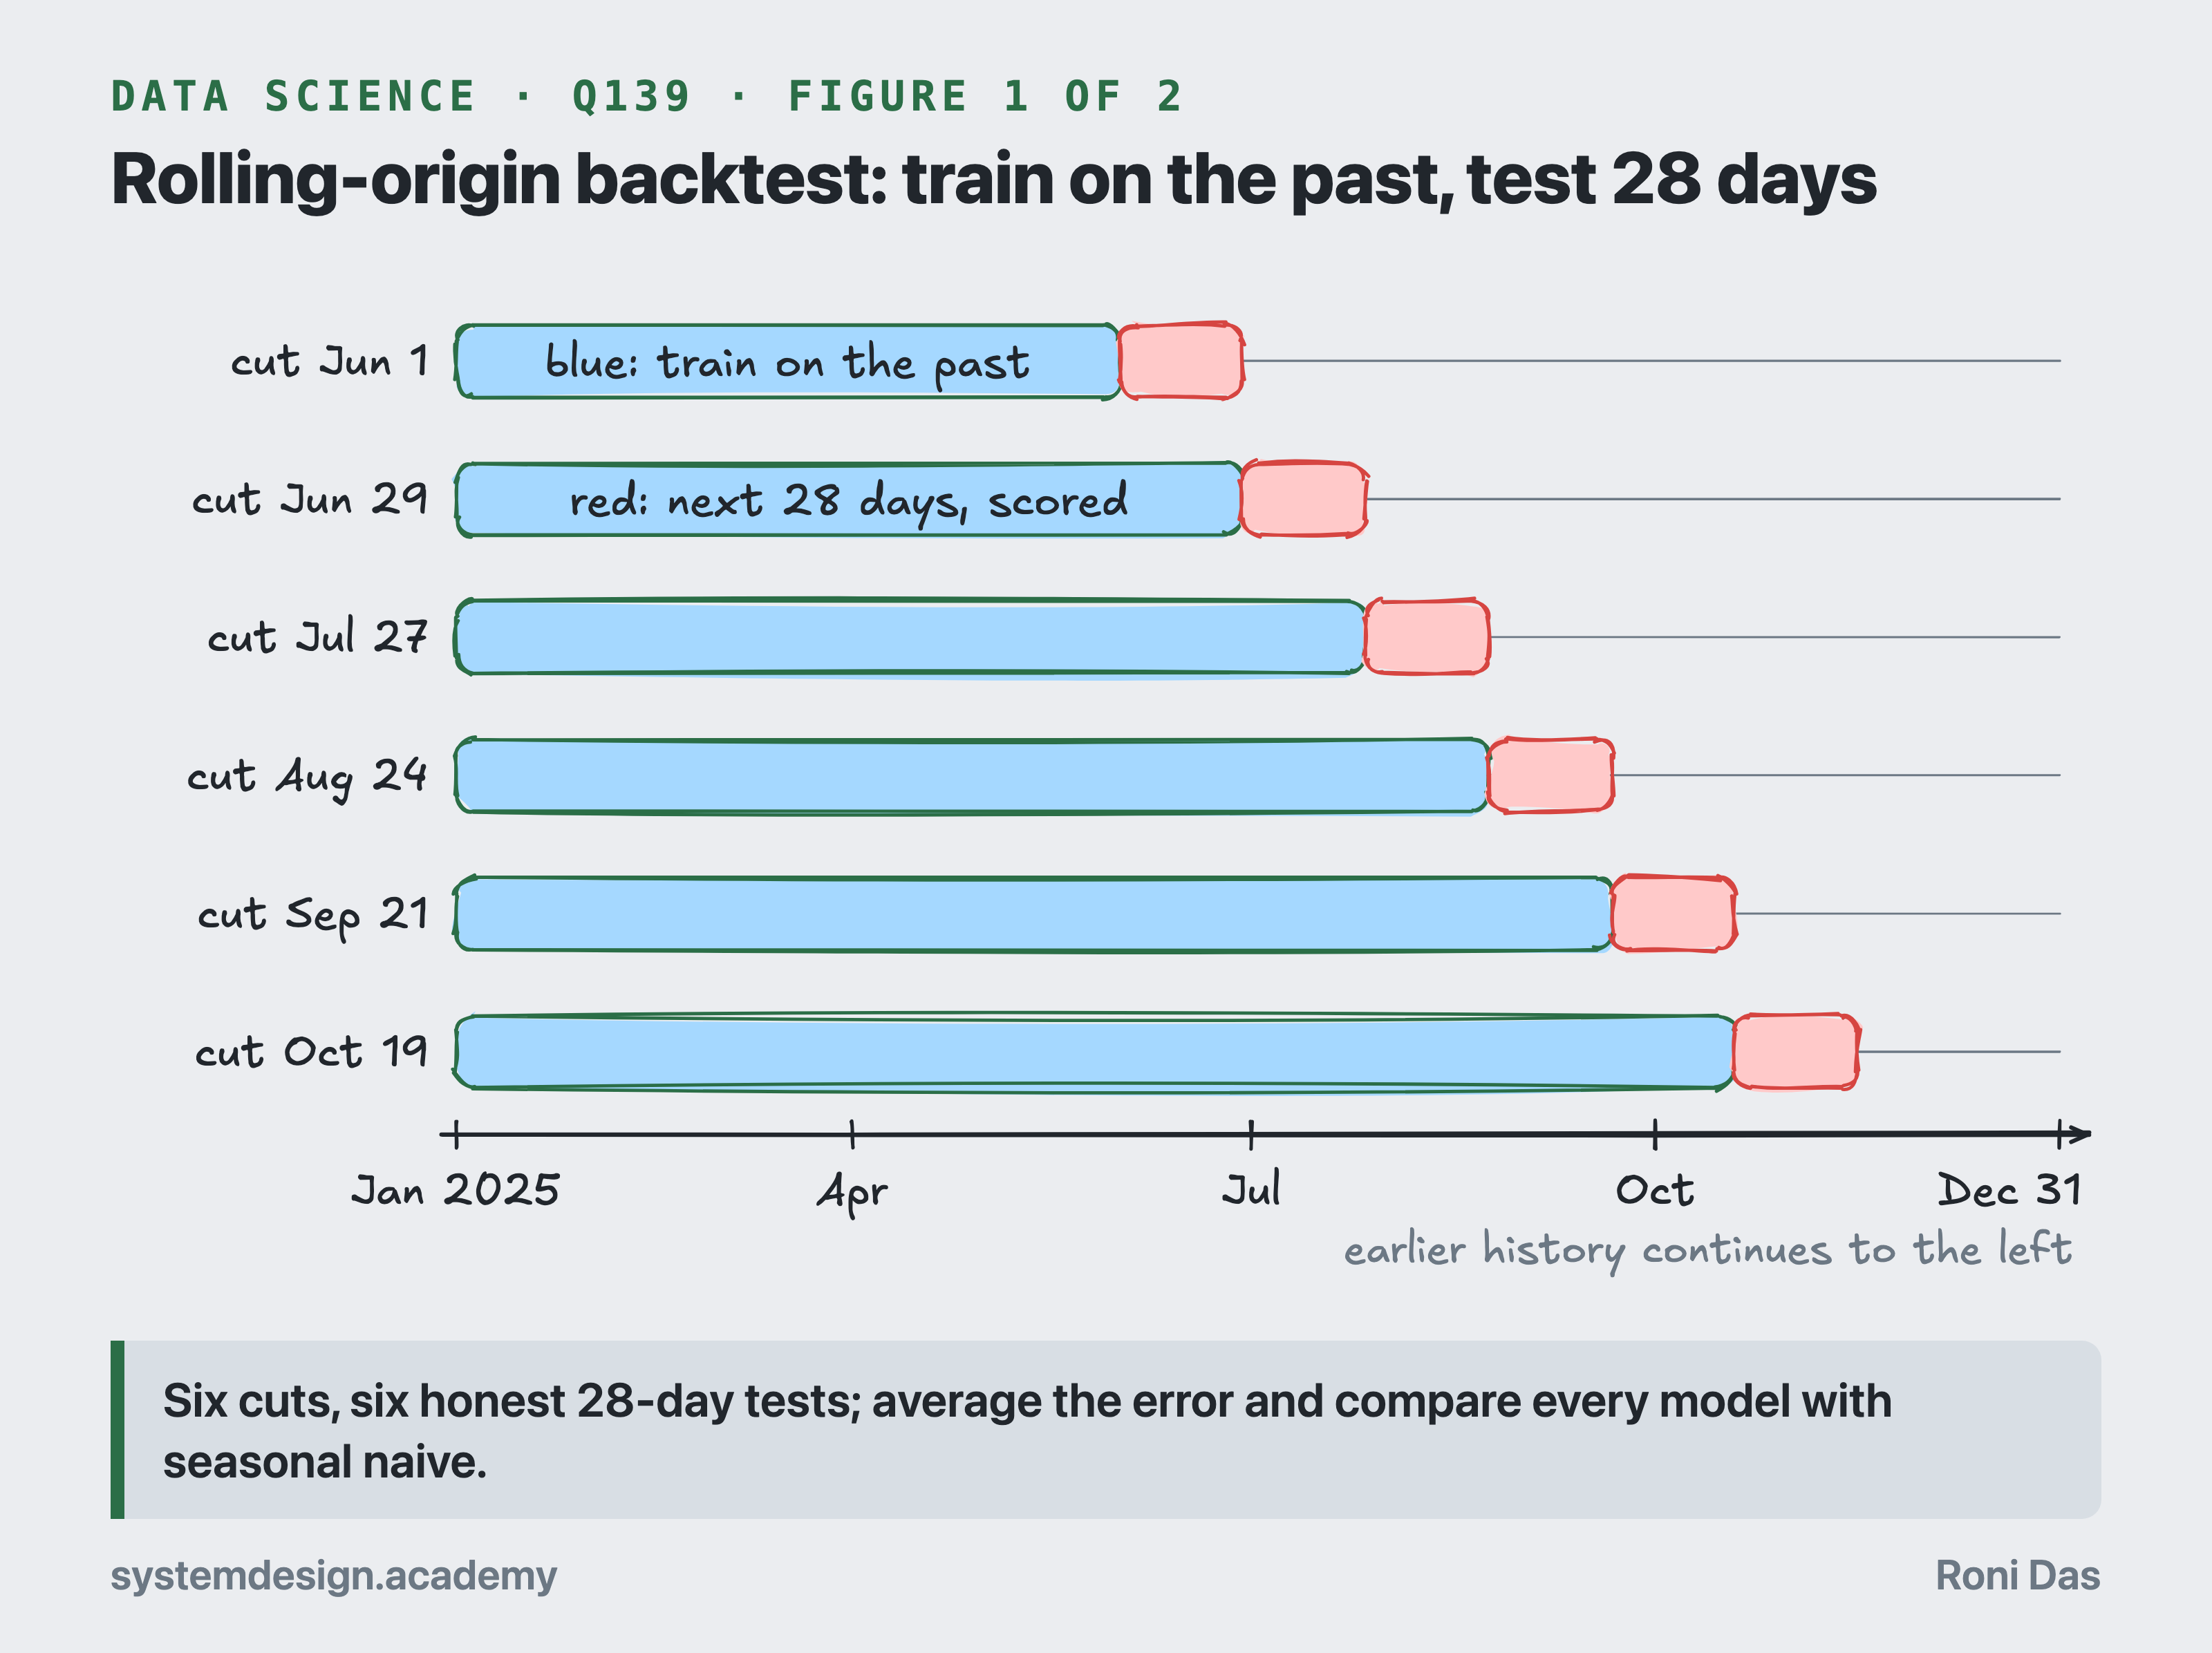
Hand-drawn timeline of a rolling-origin backtest: six cuts from June 1 to October 19, 2025; each trains on all earlier data and is scored on the next 28 days.
Why it is asked: Forecasts drive staffing, inventory and rider supply. The interviewer wants a baseline, an honest backtest and a range, not just the name of a model.
Start from a simple seasonal baseline, keep a more complex model only if it beats that baseline in an honest backtest, and report a range, not a single number.
1. Look at the data: trend, the weekly cycle, holidays and sales, outages, and level shifts.
2. Baselines. Seasonal naive means each future day equals the same weekday last week. It is often the best simple method, so every model must beat it.
3. Candidates: exponential smoothing with a weekly season (ETS, which updates level, trend and season as each day arrives), a regression on calendar and holiday features, or gradient boosting on lag features (orders 7, 14 and 28 days ago, rolling means). Trees cannot extrapolate a trend, so let them predict changes, not levels.
4. Backtest with rolling origins: cut the history at several dates, train only on data before each cut, forecast the next 28 days and score. A random split lets the model see the future.
5. Metrics: WAPE (total absolute error divided by total actual orders), because MAPE divides by each day's actual and becomes huge on days with zero or few orders; bias (are we always under?); and error by horizon week.
6. Uncertainty: prediction intervals from quantile models (which predict high and low values) or from backtest errors, because staffing plans use the high end.
In a simulation with two years of daily orders and six origins, copying the last day gave 15.2% WAPE, seasonal naive 4.9%, and ETS with a damped trend (a trend that slowly flattens) and weekly season 3.8%. ETS is worth keeping; a model that cannot beat 4.9% is not.
Then monitor live error and retrain on a schedule.
What the interviewer listens for
Seasonal naive (same weekday last week) is the bar to beat.
Rolling-origin backtest, never a random split.
WAPE, bias and error by horizon, not MAPE on low-volume days.
Give prediction intervals; plans use the high end.
Follow-ups the interviewer may ask
How do you handle Diwali? Hint: holiday features built from earlier years, and a separate error check on holiday days.
Why can gradient boosting on raw levels not forecast growth? Hint: trees only predict values seen in training, so model differences or ratios.
How many backtest origins do you need? Hint: enough to cover different seasons, for example one every four weeks over the last six months.
Common mistakes
A random train-test split on time series.
No baseline, so nobody knows whether the model adds anything.
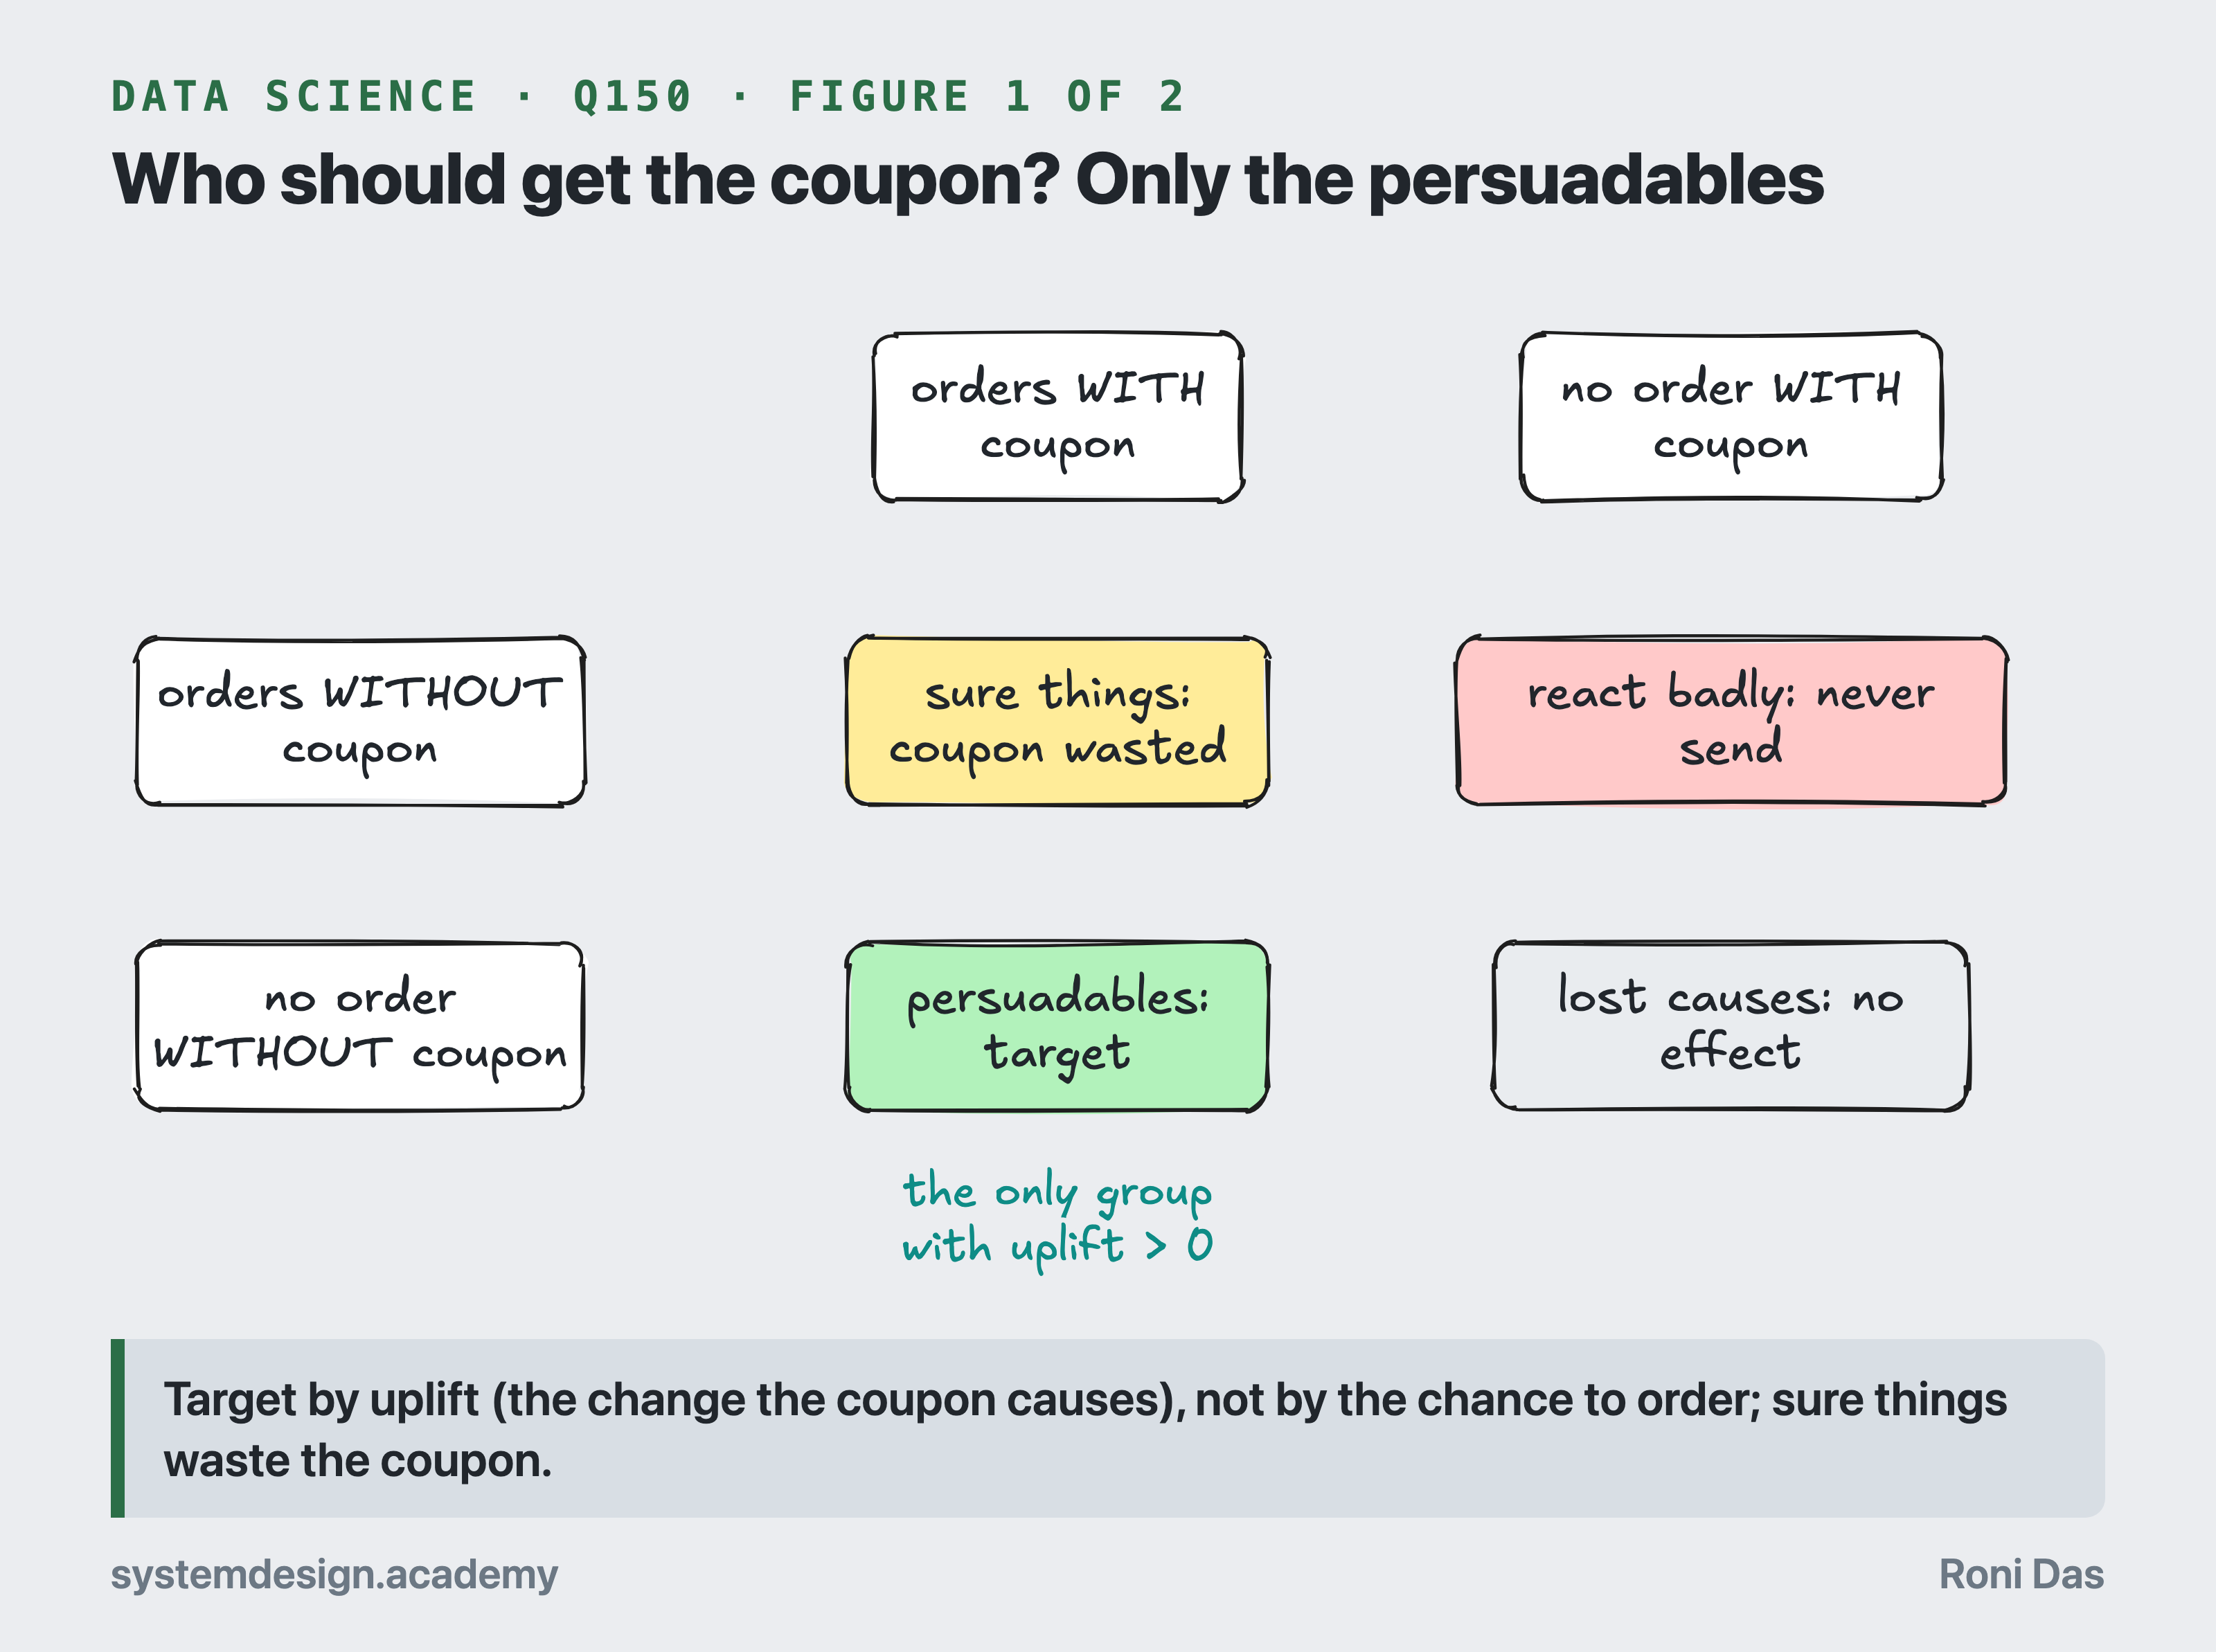
Hand-drawn two-by-two grid of users by whether they order without and with a coupon: sure things, persuadables, lost causes and users who react badly; only persuadables should get the coupon.
Why it is asked: Coupons and offers are the biggest controllable spend at many consumer companies. The interviewer checks that you target by the effect of the coupon, not by who is likely to order, and that you prove the rule with money and a new test.
Estimate the effect separately for different users (heterogeneous treatment effects), give the coupon only where the expected extra margin beats its cost, and confirm the targeting rule with a new randomized test.
A small average can hide very different users:
- Persuadables order only because of the coupon, so it pays here.
- Sure things would have ordered anyway, so the coupon is pure cost.
- Lost causes do not order either way.
- A few order less with the coupon: never send it to them.
Targeting users most likely to order picks sure things.
How to find who responds:
- Pre-registered segments (new vs returning, days since last order): compare the coupon and no-coupon groups inside each, correcting for the number of segments.
- Uplift models predict each user's outcome with the coupon minus without it. A T-learner fits one model per group (coupon, no coupon) and subtracts the predictions.
- Check on randomized holdout data that the top-ranked users show a bigger coupon vs no-coupon gap.
In a simulation (120,000 users, average lift 1.34 points), a T-learner found 3.1 to 3.4 points in the top two deciles (tenths of users by predicted uplift) and -1.4 in the bottom one. The 30% most likely to order showed no lift (-0.04). With 120 rupees margin per extra order and a 50-rupee discount per coupon order, coupons for everyone lost 3,480 rupees per 1,000 users (about 1,550 margin on 12.9 extra orders minus 5,030 discounts on 101 coupon orders). Giving them only to the 20.6% whose predicted uplift x margin beat the expected cost earned about 80.
Finally, test 'targeted rule vs coupon for all vs none': uplift models are noisy.
What the interviewer listens for
An average lift hides persuadables, sure things and lost causes.
Uplift = outcome with the coupon minus without it, per user.
Validate on randomized holdout data with an uplift or Qini curve.
Target where uplift x margin beats the cost; confirm with a new test.
Follow-ups the interviewer may ask
Why not give coupons to the users most likely to order? Hint: they are mostly sure things; in the simulation that group showed no lift.
How do you evaluate an uplift model when no user is seen in both arms? Hint: rank randomized holdout users by predicted uplift and compare treatment and control within each rank group (a Qini curve).
What changes when the coupon budget is fixed? Hint: rank users by predicted profit per coupon and fill the budget from the top.
Common mistakes
Targeting by the chance to order instead of by uplift.
Slicing many segments after the test and shipping the best one.
Shipping a targeting rule without a new randomized test.
Statistics, hypothesis and A/B tests, SQL, pandas, classical ML, metrics and product case studies.
150 questions and 191 diagrams, each with why it is asked, a full answer, what the interviewer listens for, follow-ups, common mistakes and a diagram. By Roni Das.