May we use cookies so Meta, Google, LinkedIn and ChatGPT see your visit and we learn which ads work? PrivacyMay we use cookies to see which pages help, and let Meta, Google, LinkedIn and ChatGPT see your visit, so we know which of our ads work? That way we spend less on ads that do not work. We do not sell your data, and the site works the same if you decline. You can change your answer at any time under Cookie settings at the foot of the page. Privacy policy
Loading...
System Design and AI Engineering, by Roni Das. 989 interactive lessons in two courses.: 770 in System Design and 219 in AI Engineering.
A System Design Course With Diagrams: Every Kind of Drawing, With a Lesson to Try
Is there a system design course that teaches with diagrams?
Yes. The System Design course by System Design Masterclass at systemdesign.academy has 770 lessons, and 695 of them have a diagram you build one step at a time. The lessons also use architecture drawings with real products, sequence diagrams, hash rings, state machines, trace waterfalls, flame graphs and hand-drawn whiteboard sketches, and 18 lessons are free to try.
Save your progress and get the interview checklist PDF
System Design Interview Cheat Sheet: the 7 interview stages, the 10 points a scorecard grades, 12 classic systems. 18 pages. Free with an account.
This page shows the kinds of diagram our System Design course teaches with, one kind at a time, each with a lesson you can open and see, in 12 short answers. It is about our own course and does not rank anyone else's.
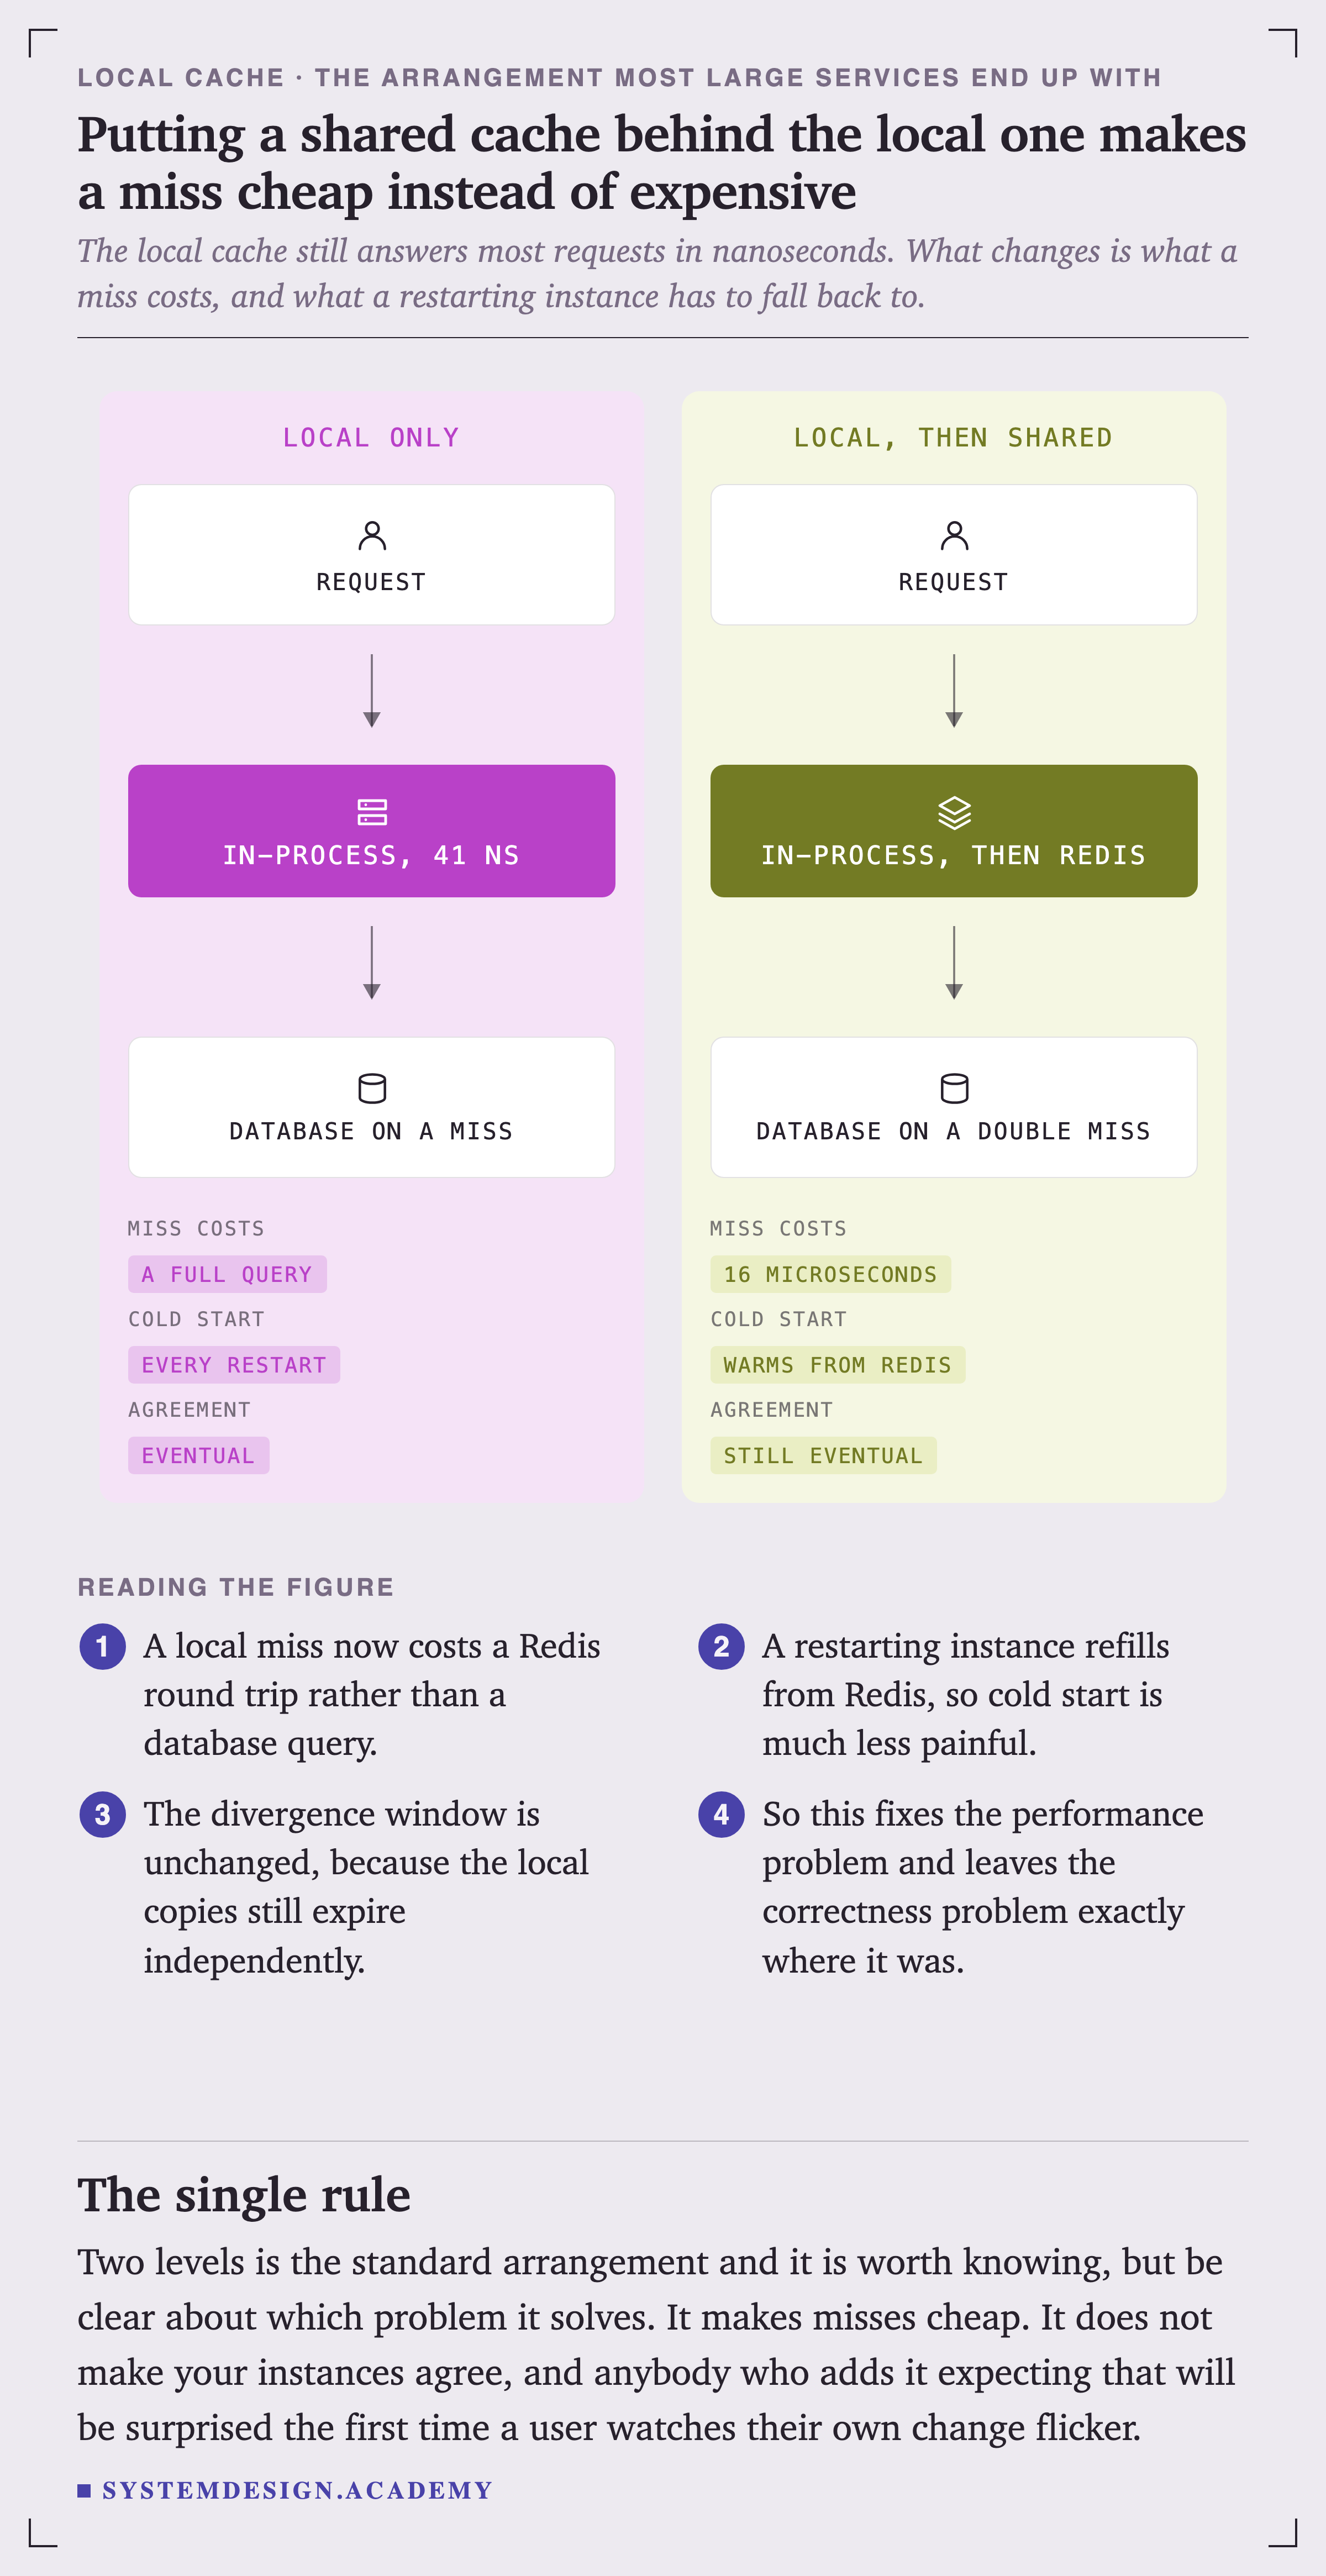
An architecture figure from the free Local Cache lessonTwo designs drawn side by side in coloured lanes, with the measured cost of a miss under each one and a numbered legend that tells you how to read it. Most drawn figures in the course follow this shape: a title that states the point, the picture, then what to notice.
An architecture figure from the free Local Cache lessonTwo designs drawn side by side in coloured lanes, with the measured cost of a miss under each one and a numbered legend that tells you how to read it. Most drawn figures in the course follow this shape: a title that states the point, the picture, then what to notice.
The short answer
If you learn best from pictures, look for a course where diagrams build step by step and change shape to fit the idea. Ours does, with architecture drawings, sequence diagrams, rings, state machines and sketches, and its first lessons are free so you can check.
This page is the free part.
The course goes deeper on system design
₹1,111 in India/$35 everywhere elseonce, for the whole course
The System Design course covers system design across a run of lessons, not one page. These 4 alone are about 139 minutes of step-by-step reading, 1 of them with code you run in the browser, all with a quiz.
1. Why a system design course should teach with diagrams
What a diagram does that a paragraph cannot, and whose course this page describes.
Why learn system design from diagrams?
System design is about parts and the paths between them: where a request goes, which server holds which data, what happens when one part fails. A paragraph can only describe those paths one at a time. A diagram shows all of them at once, so you can see where the bottleneck or the single point of failure is before anyone names it.
It is also how the work is done. In a design review or a system design interview you are expected to draw the system and talk through it, so learning from drawings that are built the way you would build them is practice for the real thing.
Whose course does this page describe?
This page is written by System Design Masterclass at systemdesign.academy about our own System Design course: 770 lessons in 23 chapters, about 290 hours of reading, written by Roni Das. 695 of those lessons have at least one diagram you step through, and many also have drawn figures and real lab recordings. Every count on this page is taken from the lesson files. We do not rank other courses here.
2. The kinds of diagram in the lessons
Each kind with a lesson where you can see it. The diagram is picked to fit the idea, so you meet many kinds, not one template.
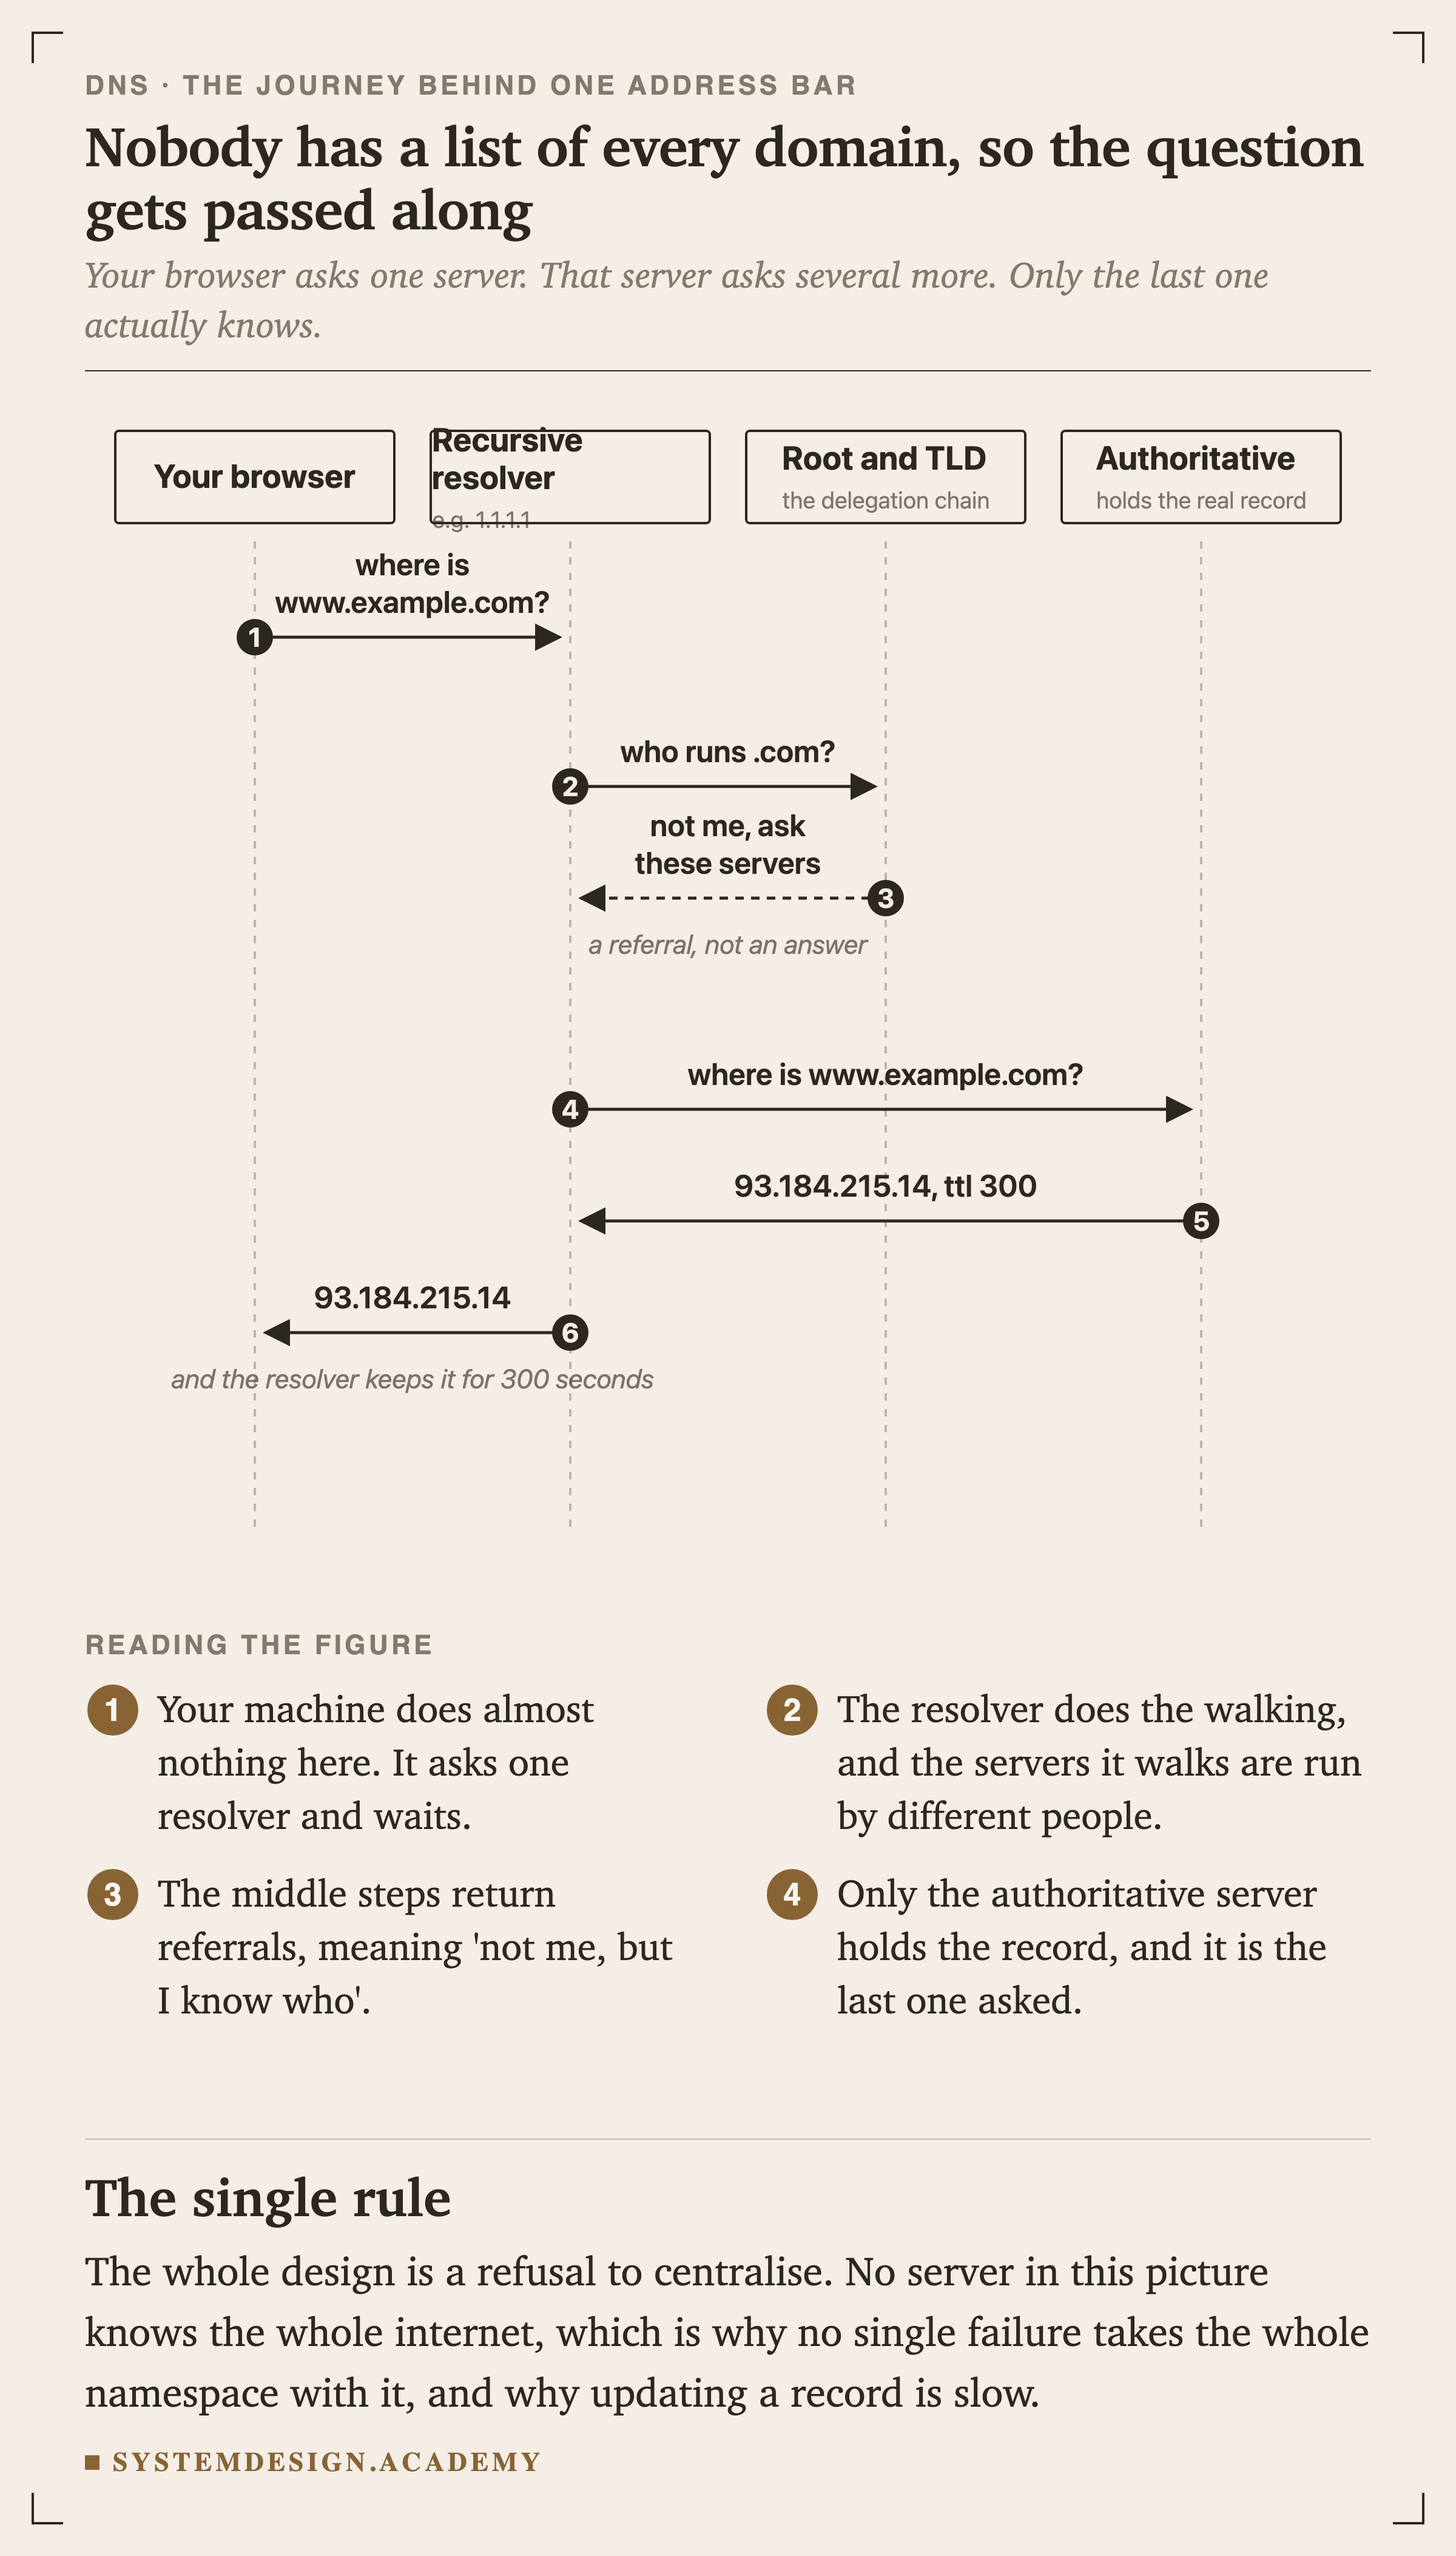
A sequence diagram from the free DNS lessonWhen the order of messages is the lesson, the course draws lifelines and numbered arrows. Here one address bar lookup is followed through four servers, and only the last one actually knows the answer.
It is a diagram that builds in front of you. You press the next step button, one more part appears, and a short note explains why it is there. 695 of the 770 System Design lessons have at least one. Counted across both our courses, System Design and AI Engineering, there are 3,041 different diagrams of this kind placed in 776 lessons.
In the Two-Phase Commit lesson, the first step shows the coordinator sending PREPARE to every participant, the second shows each one voting yes or no, and the third shows the commit going out. You can go back a step whenever you want to look again, which is how a teacher draws on a whiteboard rather than showing a finished picture with twenty boxes at once.
Are there architecture diagrams with real products?
Yes. When the lesson is about how a system is put together, the diagram is an architecture drawing: clients, load balancers, services, caches and databases, with numbered arrows for the path a request takes and real product names such as nginx, Redis or Postgres where the lesson uses them.
In the Load Balancing lesson, three users reach the same public address and the drawing shows the balancer spreading their connections across a pool of servers. The figure at the top of this page, from the free Local Cache lesson, is a drawn architecture figure: two designs in coloured lanes, with the measured cost of a miss under each.
How does the course show the order things happen in?
With sequence diagrams: one vertical line per part of the system and numbered arrows down the page, so you can read who sends what, and in what order. This is the most common kind in the course, because so much of system design is about order: retries, timeouts, handshakes and race conditions.
The figure in this section is from the free DNS lesson. It follows one lookup from your browser through a resolver, the root and TLD servers and finally the authoritative server, and points out that the middle servers send referrals, not answers.
Some ideas have a natural shape of their own, and the course draws them that way. Consistent hashing is drawn as a ring: first three servers each owning an arc, then the same three with virtual nodes spread around the ring so the load evens out. A circuit breaker is drawn as a state machine with its closed, open and half-open states and the events that move it between them.
Slow requests are drawn as a trace waterfall, where the Latency lesson shows how little of 250 milliseconds is your own program, and as a flame graph in the APM lesson, where the widest bar is the function that cost the most time. There are also comparison tables, timelines, layered stacks, flowcharts for decisions, database schema drawings and charts with real axes.
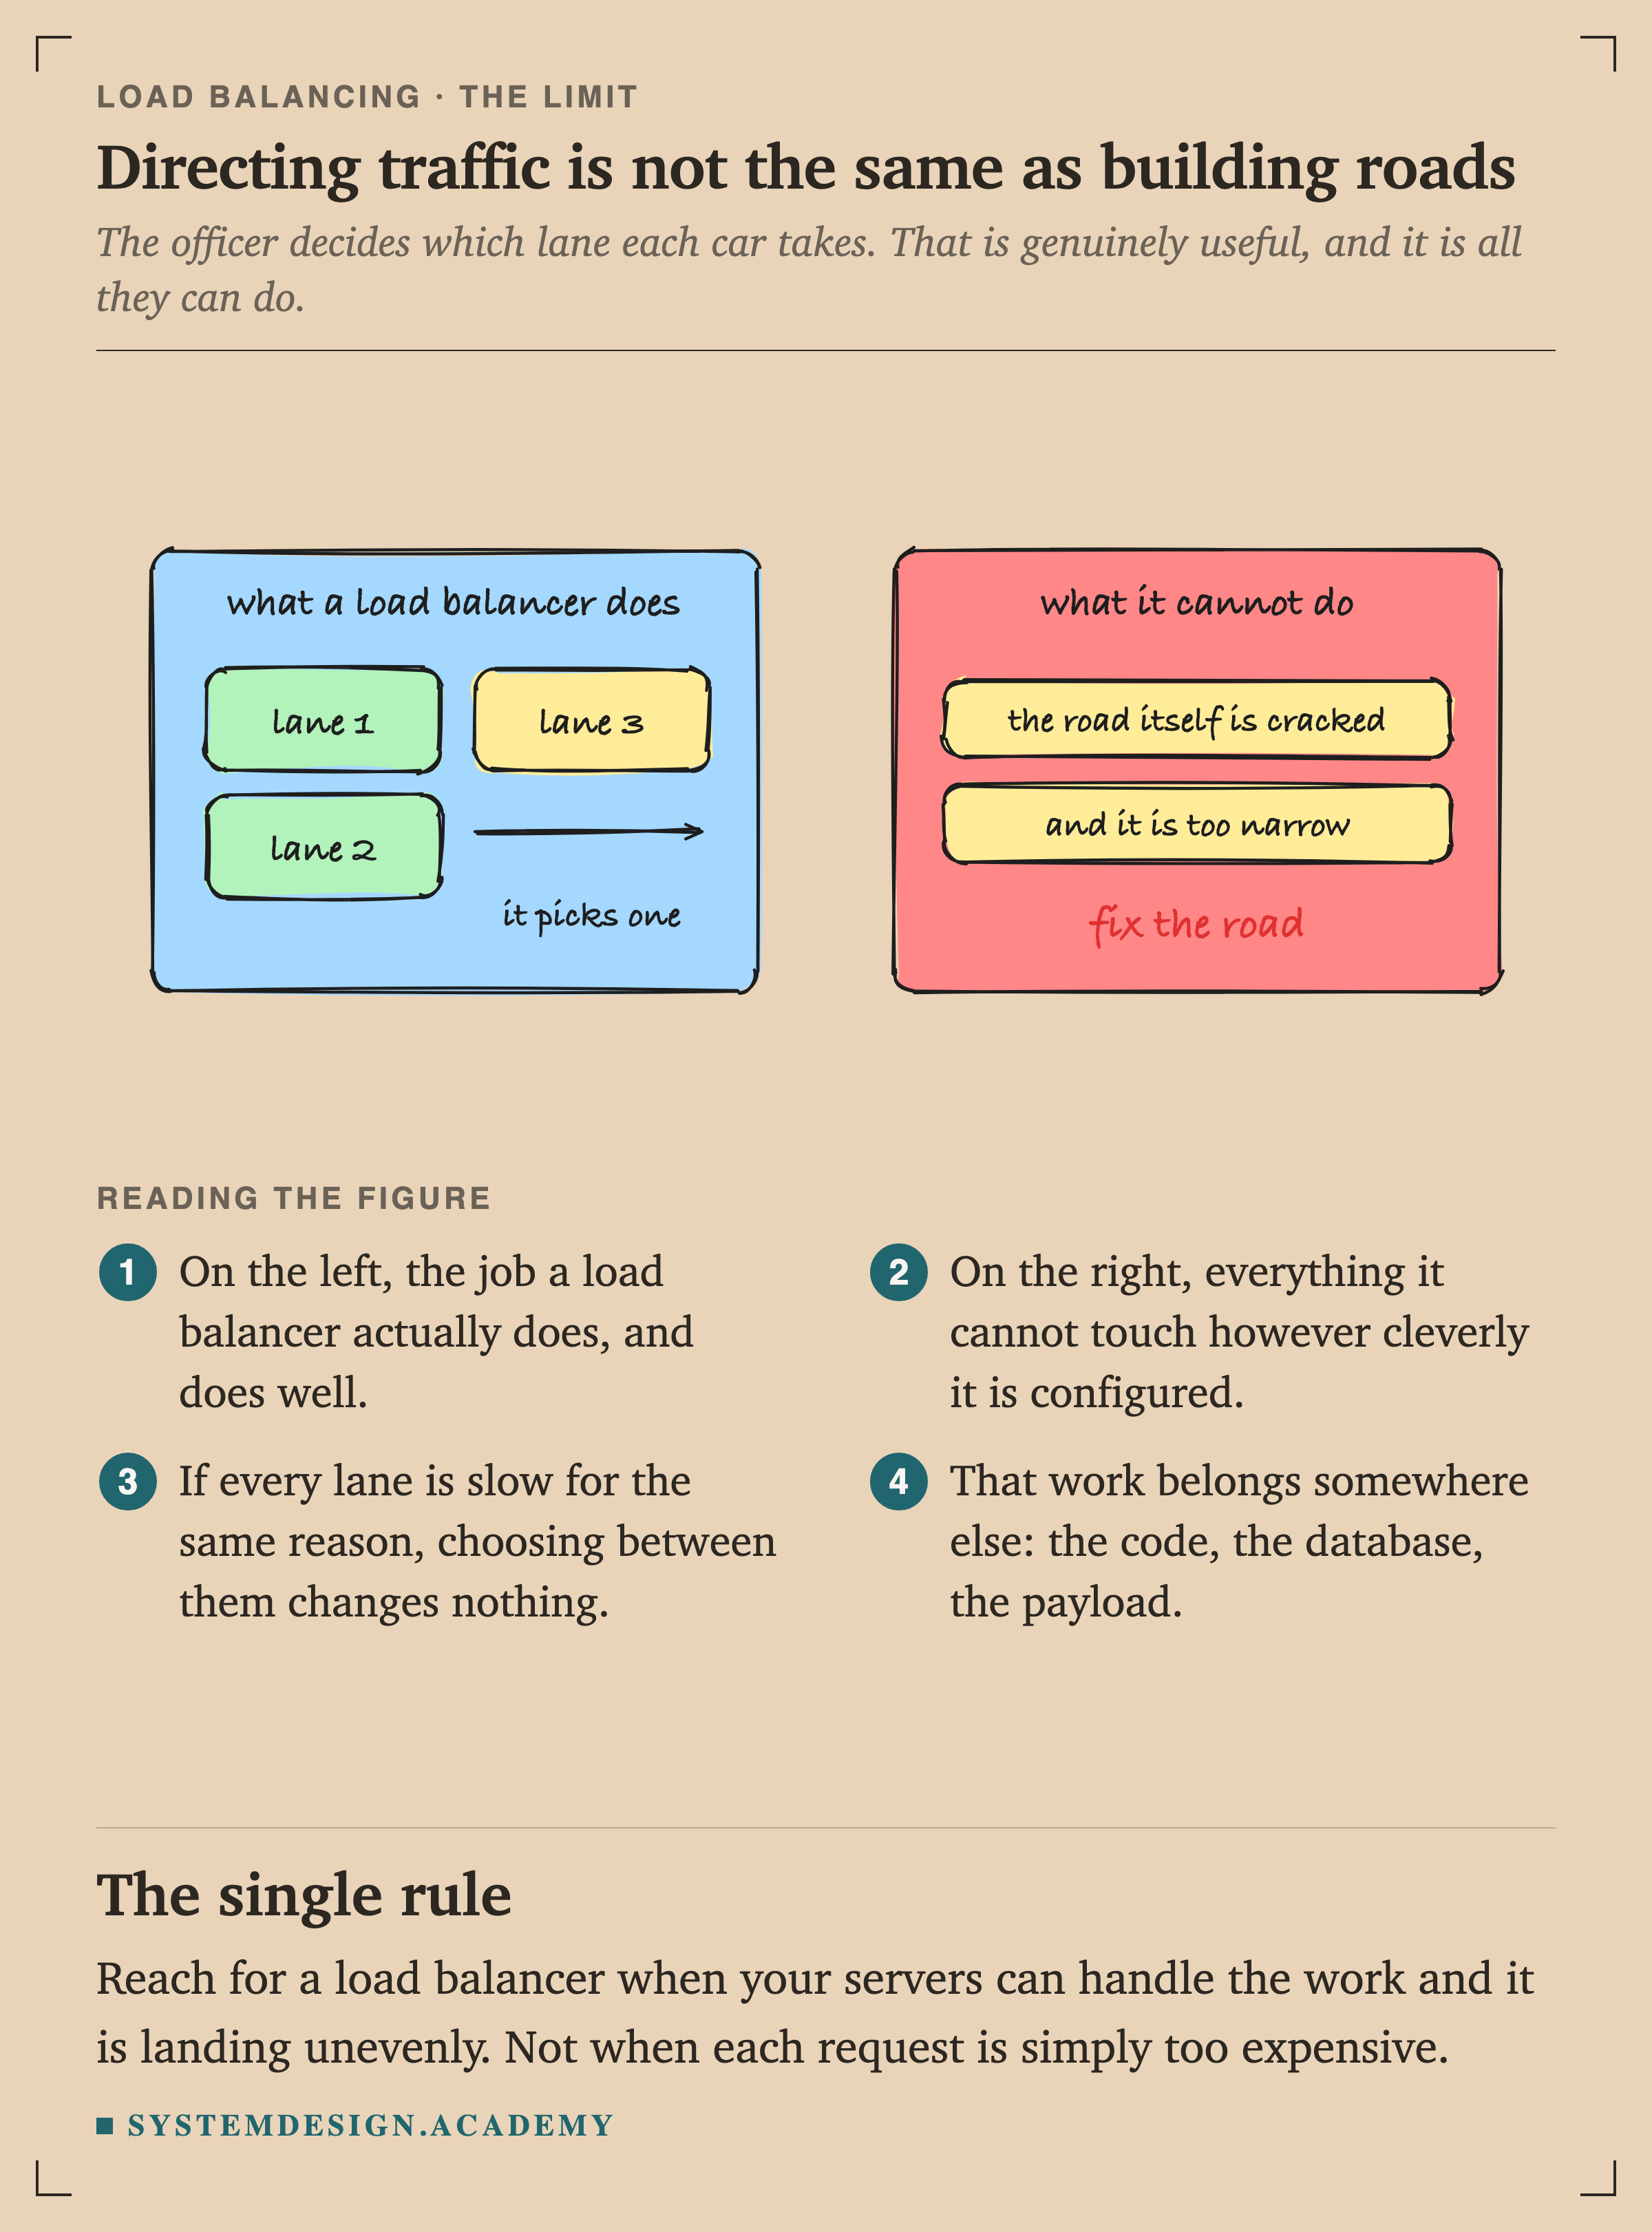
Yes. Where an everyday comparison explains an idea better than a technical drawing, the lesson uses a hand-drawn sketch in the style of a whiteboard. The Load Balancing lesson ends with one: a traffic officer can choose which lane each car takes, but cannot fix a cracked or narrow road, just as a load balancer cannot make a slow server fast.
The Cross-Region Replication lesson uses hand-drawn sketches too, including a timeline of a real cloud outage and two notebooks kept in different towns to explain a replica that is a day behind.
A hand-drawn sketch from the Load Balancing lessonSome ideas are clearer as a whiteboard sketch than as a polished drawing. This one is the limit of a load balancer: it can choose a lane, but it cannot fix a slow server.
Diagrams are the centre of each lesson, with words, checks and full designs around them.
How do I read a diagram if I am a beginner?
Every step of a step-by-step diagram has a short written note beside it, and the drawn figures carry a numbered legend that says what to look at first. Lessons open with the problem in everyday words before they show a picture, so you know what question the diagram answers before you see it.
If something still does not make sense, every lesson has an AI tutor beside it that answers from that lesson, so you can ask about a box or an arrow without leaving the page.
Do the diagrams help me draw my own designs?
They are meant to. Every lesson ends with a short quiz that asks you to apply the idea, and the course ends with 20 capstone designs, such as a URL shortener and a chat system like WhatsApp, each built up from requirements to architecture to the deep dives where the hard choices are. Seeing the same kinds of drawing over and over is what lets you draw them yourself in an interview.
No. The System Design course is a self-paced interactive course: text, diagrams you step through, drawn figures, runnable code where code helps, labs and quizzes. You read at your own speed, and a diagram waits on the step you are looking at for as long as you need, which a video cannot do.
If you prefer to learn from recorded video classes for interview preparation, our System Design Interview Bootcamp is a separate product made of recorded classes.
How to look at the diagrams yourself before you pay.
Can I see the diagrams before I pay?
Yes. 18 lessons are free to read, with no card needed. Latency has a trace waterfall and step-by-step diagrams, DNS has the sequence diagram shown above, and Local Cache has the architecture figure at the top of this page.
You pay once and keep the course for life, including every lesson and diagram added to it later. There is no subscription. The price for your country is shown in the box near the top of this page and on the pricing page. You can also buy it together with the AI Engineering course in one payment.
How is system design done in a real production system?
The answers on this page are the short version. The lessons below are the long one, with the trade-offs and failure cases, starting with "Two-Phase Commit".
The lessons that teach the next part
How two-phase commit makes a distributed transaction all-or-nothing, and why it blocks if the coordinator crashes. Includes a 2PC coordinator in code.
Every answer on this page comes from our System Design course: 770 lessons on databases, caching, scaling, messaging and reliability, each drawn step by step. You learn why the answer is right, which is what an interviewer checks with the second question. 18 lessons are free to read, with no card needed.
These questions are a start. The interview asks more.
Get all 200 questions in the System Design and Distributed Systems pack
Each question has why it is asked, a full answer, what the interviewer listens for, the follow-ups, the common mistakes and a diagram (268 diagrams in all). A PDF you keep, junior to staff level.
Pay by UPI, cards or netbanking through Razorpay. Pay by card or PayPal, in US dollars. Download at once from My packs.
NEWSystem Design Hands-On
Included in the System Design course: real systems, built live
Postgres Sharding: Complete Hands-On (PgBouncer + Citus). 2 h 36 min and 20 chapters: one PostgreSQL loaded until it breaks, then four shards behind a router you write, PgBouncer and Citus, with the 139-page slide deck. The first 15 minutes are free to watch.