System design interview guide
Canva System Design Interview: How Canva Counts Billions of Content Uses to Pay Its Creators
Short answer
A good scenario to practise for a Canva system design interview is counting content usage to pay creators. We have no public source that Canva asks it. Canva pays creators based on billions of usages of their templates, images and videos each month, and the count must never be wrong. The key idea is to keep every raw event and recount from it, so fixing the code also fixes the numbers. Canva keeps raw usage events in DynamoDB and copies them into Snowflake, a data warehouse. SQL jobs remove duplicates, classify each usage by payment rules and add up the totals. A scheduled worker copies the totals to service databases at a controlled rate. Canva cut pipeline latency from over a day to under one hour.
Two courses by the author of this page:
770 lessons · 18 free to read
₹1,111 in India · $35 elsewhere, once
Get System DesignYou own this course
219 lessons · 10 free to read
₹1,333 in India · $35 elsewhere, once
Get Generative AI and Agentic AIYou own this course
Save your progress and get the interview checklist PDF
Canva says 260 million people used it every month in 2025. Creators who publish templates, images and videos on Canva are paid by how often their work is used. In 2024 Canva wrote that it pays creators based on billions of content usages each month. It also wrote that usage of creator content had doubled every 18 months since the program began.
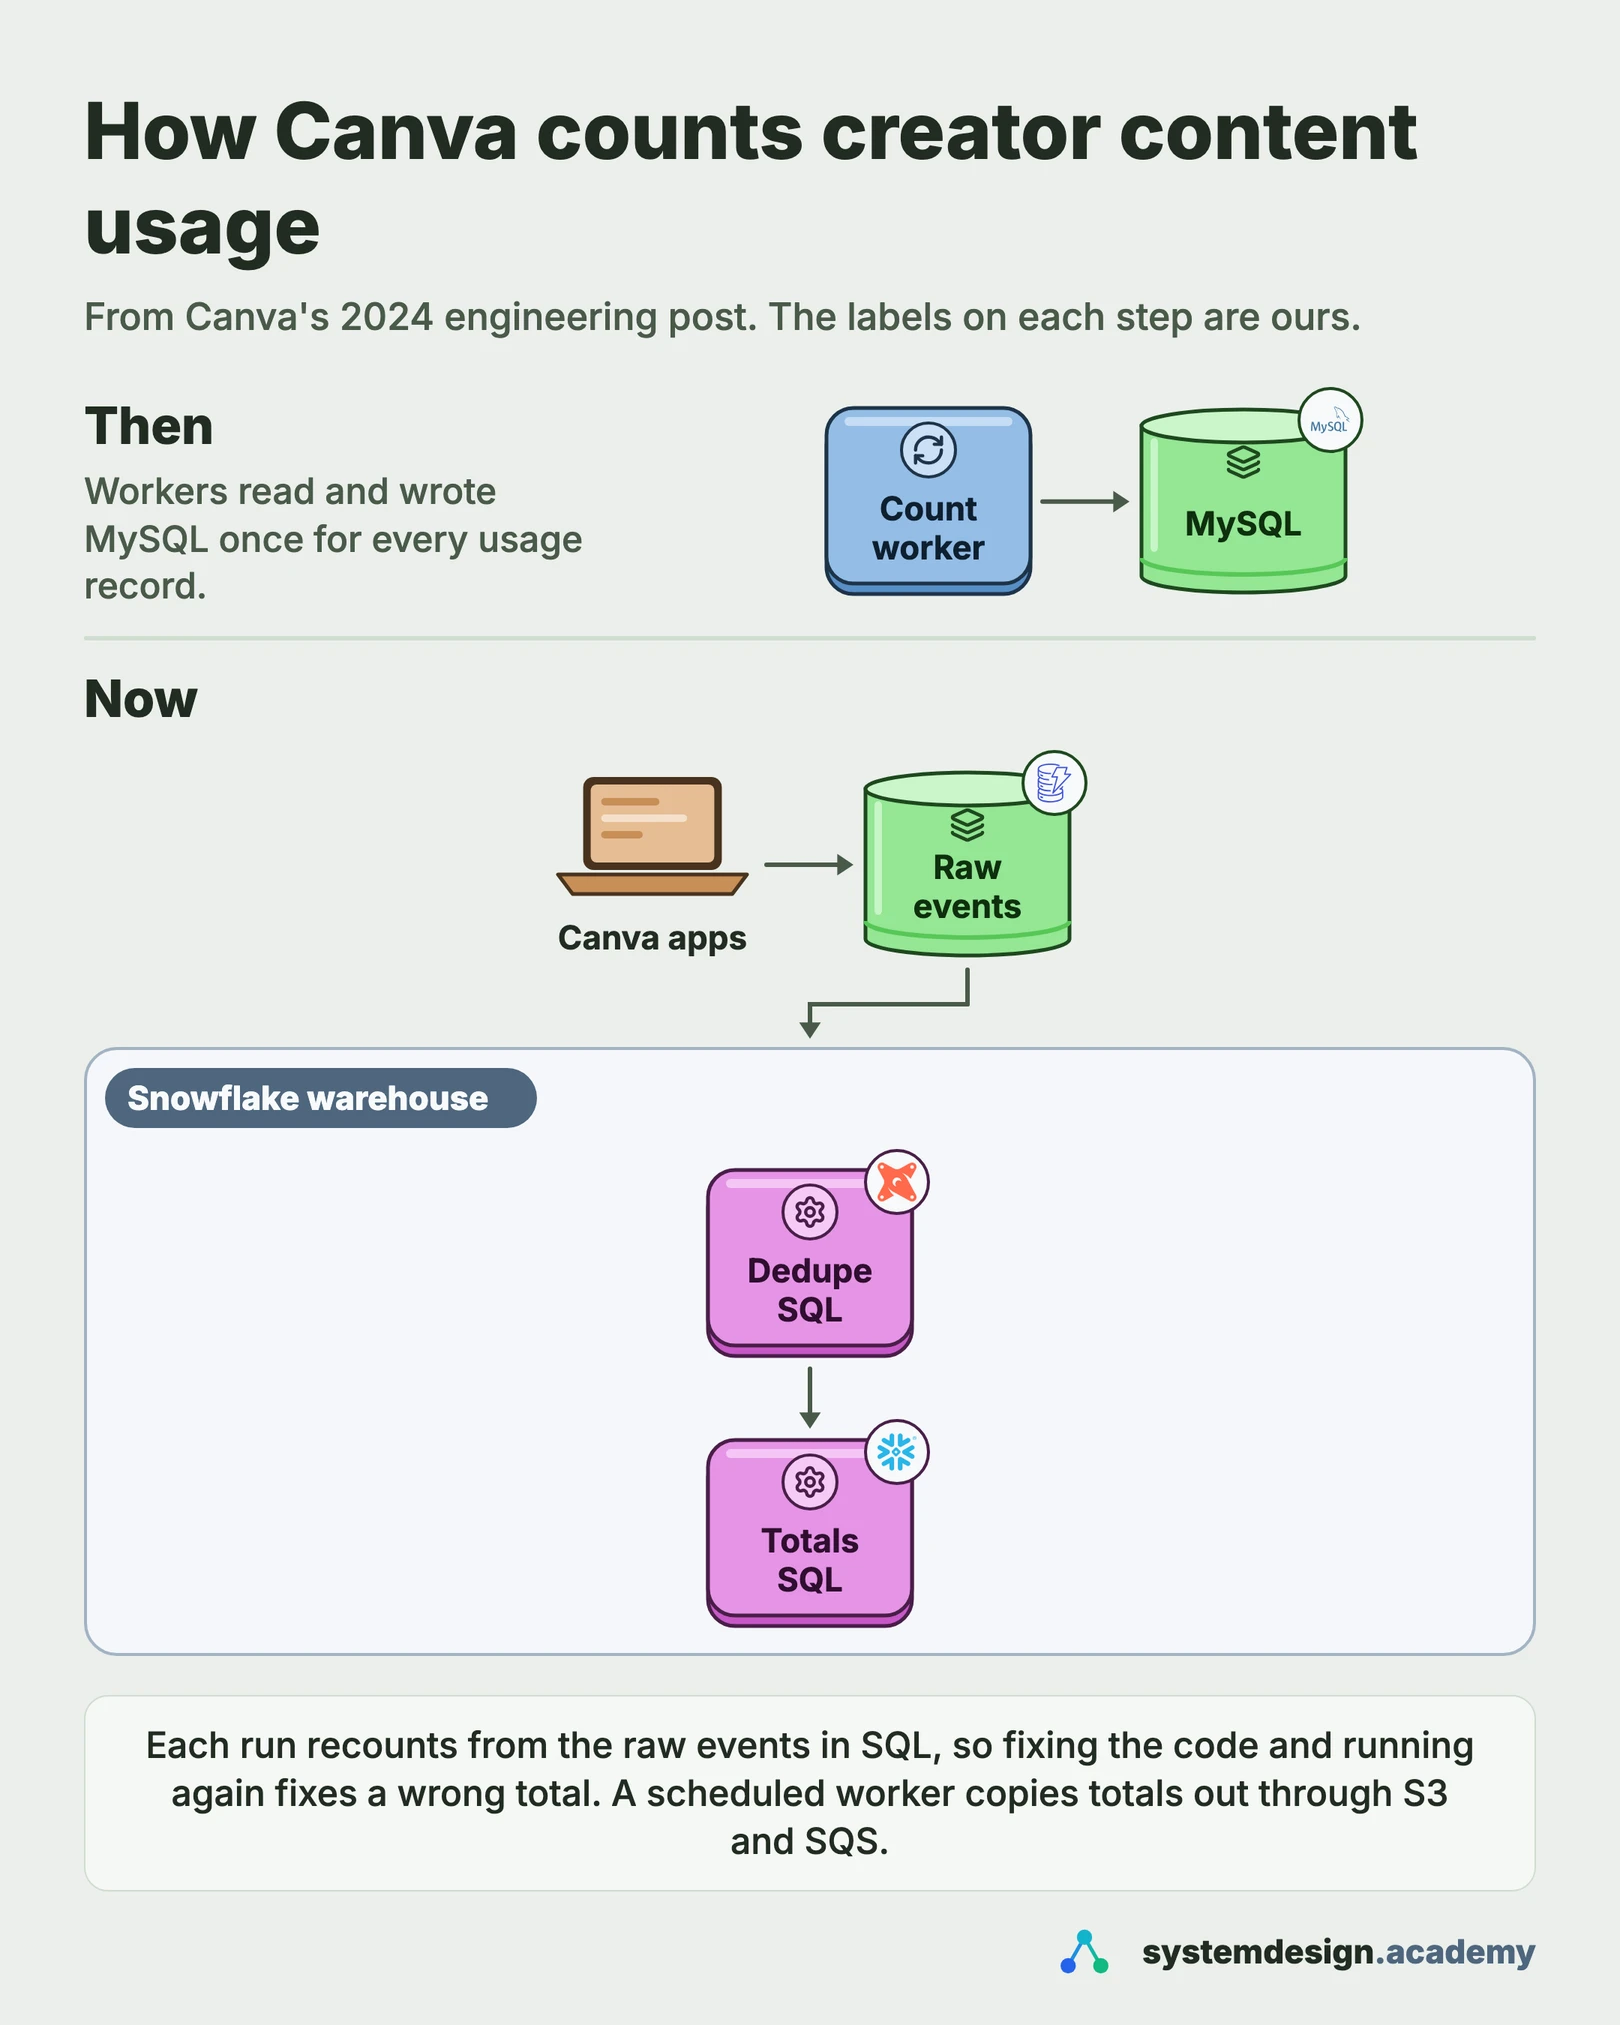
Designing Canva's usage counting means turning billions of raw events into a payment that is never wrong. A usage event is a record sent by an app when someone uses a creator's template or image. Canva's own post splits the work into three stages. First, collect the events and drop invalid ones. Second, remove duplicates and classify each usage by rules that decide how it is paid. Third, add up the totals per template, per brand and so on. Canva first built this with worker services on MySQL, one database round trip per record. As usage grew, that became too slow and too hard to repair. Canva moved the raw events to DynamoDB, copied them into Snowflake, a data warehouse, and rewrote the counting as SQL. Each run now recounts from the raw events. Pipeline latency fell from over a day to under one hour.

Where it shows up
A common type of question for backend, data and platform roles. Close relatives are design an ad click counter, design a royalty or payout system, and design a metrics pipeline. We have no public source that Canva uses this exact question. This guide is built from Canva's own engineering writing, so you can reason with real numbers.
Spec sheetCanva
- 01Monthly users
- 260M
- 02Counted usages per second, estimated
- ~1,900 average, ~5,800 peak
- 03Cost of one round trip per record
- ~58 days a month of work
- 04Raw event storage, estimated
- ~5 TB a month
worked through below, with the maths
Canva in its own numbers
Every figure below is quoted from Canva's own engineering writing. Tap a source to check it.
260M
people using Canva every month in 2025
Canva newsroom, 2025 in reviewBillions
of content usages counted each month to pay creators
Canva Engineering, 202418 months
how often usage of creator content doubled after the program began
Canva Engineering, 2024Under 1 hour
pipeline latency after the move to a warehouse, down from over a day
Canva Engineering, 202450%+
less data stored, and thousands of lines of counting code removed
Canva Engineering, 202425B
product analytics events collected a day, a separate pipeline, at 99.999% uptime
Canva Engineering, 2024
Why this question is asked
Counting sounds easy, and that is the trap. The question tests whether you see that a payment count must be exact, while a dashboard count can be roughly right. It tests whether you know that events arrive twice, late, or with a new type nobody told you about. It tests whether you can choose between counting a little at a time and recounting everything from the source. Most of all, it tests whether you plan for the day the count is wrong. Canva's own lesson was that fixing code is easier than fixing broken data. A candidate who draws a counter that goes up by one per event has missed most of the question.
What the interviewer asks
“How would you design the system that counts how often each creator's templates, images and videos are used on Canva, so creators can be paid each month? Hundreds of millions of people use the product. The count decides real income, so it must not be wrong, and it must be fixable when something goes wrong.”
Ask these back before you draw
- 1.What counts as one usage? (Canva's Help Center says a template usage is each time a design is downloaded, printed or presented, and for elements, each Pro element export.)
- 2.How fresh must the totals be? Monthly for payment, or near real time for a creator's statistics screen?
- 3.Which content types are in scope: templates only, or images and videos too? (Canva counts all three.)
- 4.Can the rules for what counts change during a month, and must old months be recounted when they do?
- 5.Are free and paid templates both paid? (Canva's Help Center says creators are paid for both Free and Pro template usage.)
This page is the free part.
The course goes deeper on the Canva design
₹1,111 in India$35 everywhere elseonce, for the whole course
The System Design course covers the Canva design across a run of lessons, not one page. These 4 alone are about 103 minutes of step-by-step reading, every one with a quiz.
- Data Deduplication
Eliminate redundant copies of data to save storage, content-addressable storage and hash-based dedup.
- At-Least-Once Delivery
Never lose a message, but you might see it twice.
- Idempotency
Why some operations are safe to retry and others charge you twice, and how to make everything safe.
- ELT
Extract, Load, Transform, load raw data first, transform in the warehouse.
all part of
System Design Masterclass
770 lessons · about 290 hours · 18 free to read
₹1,111in India, by UPI
$35everywhere else, by card or PayPal
It is really nice and good Please join the course
You own this course
Continue with Data Deduplicationpay once,
yours for life
Live from the course bench
Before you design Canva, try the questions it rests on.
Real interview questions, live diagrams and measured lab results, pulled at random from the lessons. A new set every time you come back.

01Requirements
Requirements
Always clarify these in the first 5 minutes of the interview. Do not start drawing boxes until both lists are agreed.
Functional requirements
- Apps on the web and on phones send a usage event when a creator's content is used
- Invalid events are dropped, and duplicate events are removed before counting
- Each usage is classified by rules that decide how it is paid, and the rules can change
- Totals are produced per piece of content, per creator and per other dimensions, such as per brand
- Totals are copied out to the services that pay creators and show them their statistics
- A wrong total, from overcounting, undercounting or a wrong classification, can be corrected and recounted
Non-functional requirements
- Accuracy first: Canva wrote that the count should never be wrong, because creators' income and trust are at stake
- Scale with growth: usage doubled every 18 months, so the design must not grow cost in a straight line with every record
- Fresh enough: Canva cut pipeline latency from over a day to under one hour
- Easy to operate: fixing a problem should mean rerunning a job, not engineers editing database rows by hand
- Keep a full copy of the raw events, so missing data can be found and backfilled
- Do not overload the service databases when copying the results into them
02Scale estimates
Back-of-envelope scale estimates
Show your math. Pulling numbers from thin air signals you have not thought about the load.
Monthly users
260M
Canva's own 2025 review says 260 million people used Canva every month. Not every user touches creator content, but the count must cover anyone who might.
Counted usages per second, estimated
~1,900 average, ~5,800 peak
Canva says billions of usages a month and does not give the exact figure. Assume 5 billion; that is our assumption. A month is about 2.6 million seconds. 5,000,000,000 / 2,592,000 is about 1,900 a second. Assume the busiest hours run at three times the average: about 5,800 a second.
Cost of one round trip per record
~58 days a month of work
Canva's first design made at least one database round trip for every usage record, with one read and one write. Assume each round trip takes 1 ms, done one at a time. 5 billion x 1 ms is 5 million seconds, about 58 days, for one month of data. Batching 100 records per trip cuts that to about 14 hours. But it still grows in a straight line with the data, and the data doubles every 18 months.
Raw event storage, estimated
~5 TB a month
Raw events include duplicates and events that will not be paid. Assume 2 raw events per counted usage and 500 bytes per event in JSON. 10 billion x 500 bytes is about 5 TB a month. For comparison, Canva wrote that its MySQL instance reached several TBs and had to be doubled in size every 8 to 10 months.
Growth to plan for
4x in 3 years
Canva says usage of creator content doubled every 18 months. Two doublings in three years is four times today. A design that only just copes now will fail long before then.
Copying totals out, estimated
~17 minutes a run
The warehouse is not built to answer millions of small queries in milliseconds, so totals are copied into service databases. Assume 2 million changed total rows per run, written at 2,000 rows a second to protect the database. 2,000,000 / 2,000 is 1,000 seconds, about 17 minutes. Canva wrote that it had to tune this rate carefully, because too fast caused CPU spikes on its RDS databases.
03Architecture
High-level architecture
Draw it as three stages, the way Canva describes it: collect, deduplicate and classify, then aggregate. Aggregate means add up. On the left, Canva's web and phone apps send usage events. A collection service checks each event and drops invalid ones. Canva moved these raw usage events into DynamoDB, a key-value database run by AWS, which scales its storage without anyone resizing a server. A data replication pipeline then copies the raw events into Snowflake. Snowflake is an OLAP database, short for online analytical processing: a warehouse built to scan and add up huge tables, rather than to serve many small reads and writes. Inside Snowflake, scheduled jobs written in SQL with a tool called dbt do the counting. One job turns the JSON events into proper columns. The next removes duplicates and applies the classification rules. The last one adds up usages per template, per brand and so on. Each run recounts from the raw events, so a fixed bug fixes the totals on the next run. On the right, a scheduled worker unloads the totals. It writes them to S3, Amazon's file store, and uses SQS, a managed queue, so no batch is lost. It then loads them into the service databases at a controlled rate. Payment and creator statistics read from those databases, never from the warehouse directly.
In a real interview, sketch this on the whiteboard before diving into any single box.
04One request
What happens to one usage, from a click to a creator's payment
The stages and the stores are from Canva's 2024 post. The event fields, the dedupe key and the batch sizes are this design's choices, because Canva has not published them.
- 1
A user exports a design
Someone downloads a design built on a creator's template. The app sends a usage event with an event ID, the user, the template, the event type and a time. In this design the event ID is created on the device, so a retry sends the same ID again.
- 2
The event is checked and stored
The collection service validates the event and drops it if it is broken. Valid raw events are written to DynamoDB, where Canva keeps its raw usage events. Nothing is counted yet.
- 3
The events reach the warehouse
A data replication pipeline copies the raw events into Snowflake. Canva wrote that it extracts the JSON and projects the fields it needs into their own columns, because JSON was not a good fit for warehouse queries.
- 4
Duplicates go, rules apply
A SQL job removes duplicate events and matches each usage against the classification rules. The rules decide what counts as a distinct usage and how it is paid. In this design, two events with the same event ID count once.
- 5
Totals are recounted
A second SQL job adds up the deduplicated usages per template, per brand and so on. It compares the new totals with the last run's totals and overwrites any that changed. A total that should no longer exist is set to zero.
- 6
Totals reach the payment side
A scheduled worker queries the new totals, writes them to S3 and tracks each batch in SQS. It loads them into the service databases at a tuned rate. Creators are paid from those totals each month.
05Components
Core components
Walk through each service. The interviewer wants to hear what each one owns, not just the names.
Collection service
Receives usage events from web browsers and phone apps, validates them and filters out bad ones. Canva's post lists this as the first stage. In this design it writes each valid event to the raw store and returns quickly; it does no counting.
Raw usage store (DynamoDB)
Holds every raw usage event as it arrived. Canva moved the raw events here from MySQL to ease its storage pressure. DynamoDB grows its storage without anyone moving to a bigger server. Canva also wrote that a backup of all events is very helpful when data goes missing.
Replication into the warehouse
A data replication pipeline from Canva's data platform copies data from service databases into Snowflake. Canva wrote that this pipeline's reliability is vital, because every count depends on the raw events arriving complete.
Snowflake (OLAP warehouse)
Does the heavy counting. Snowflake keeps storage and compute separate, so compute can grow for a big run without moving data. Canva wrote that it can now aggregate billions of usage events in a few minutes, mostly in memory. Canva chose Snowflake for most regions because it was already its main data warehouse.
dbt transformations
dbt is a tool that runs SQL files in order, each building on the one before. Canva wrote each stage as one SQL query: extract the JSON, deduplicate and classify, aggregate. Middle steps are SQL views, saved queries rather than stored tables, so there is less data to keep and repair.
Unload worker (S3 and SQS)
A scheduled worker that queries Snowflake, writes the results to S3 and uses SQS so no export is lost. It loads them into the service databases. Canva wrote that the hard part was tuning its rate, so the load did not make the service databases throttle.
Payment and creator statistics services
Read the totals from their own databases, which answer small requests in milliseconds. In this design they never query the warehouse directly. Canva's Help Center says royalties come from a monthly royalty pool shared by usage.
06Data model
Data model
Pick the right store per table. Justify each choice with the access pattern, not by reflex.
usage_event_raw (DynamoDB)event_id (partition key)user_idcontent_idevent_typeoccurred_atpayload (JSON)In this design, one item per event, written once and never changed. The event ID makes a resend land on the same key, which is the first line of defence against duplicates. Canva has published that raw usage events live in DynamoDB as JSON, but not the item layout.
usage_deduped (SQL view in Snowflake)event_idcontent_idcreator_idusage_type (after classification)day_idA view, not a stored table. It keeps one row per distinct usage and attaches the paid usage type from the classification rules. Because it is a view, a change to the rules changes its output on the next run with no data to patch.
daily_template_usages (Snowflake)day_idtemplate_idtemplate_brandusage_countThe table name and the day_id and template_brand columns appear in Canva's own SQL example, which sums usage_count grouped by day and brand. The other columns here are this design's.
usage_totals (service database)month_idcontent_idusage_typeusage_countbatch_idIn this design: the copy the payment service reads, loaded by the unload worker. The batch ID lets a load be retried without counting a batch twice. Rows are replaced by the next run's values, never added to.
07Deep dives
Deep dives
These are the conversations the interviewer is steering you toward. Practice each one until you can talk through it without notes.
Why the first design stopped scaling
Canva started with what its team knew best: MySQL and a set of worker services. The deduplication worker scanned the usage table one record at a time. It kept a pointer to the last record it had processed. Each record cost at least one database round trip, with one read and one write to increase a counter. Canva's post makes the key point plainly. A full scan takes O(N) queries, where N is the number of records. Batching C records per query gives O(N / C), which is still O(N). Adding threads would help, but it makes the code much harder to maintain and debug. One bad record also held up every record behind it. Storage grew too. MySQL on RDS does not spread itself across machines, so Canva doubled the instance size whenever it ran low. That happened every 8 to 10 months. Free storage once fell by almost 500 GB, half of what was left, in six months. Canva does not call MySQL a bad first choice. It served the program well for its first two years and let the team deliver in a reasonable time. The lesson for an interview is to say when you would change the design, and what you would measure first.
What counts as one usage: deduplication and classification
This is where the business rules live, and where Canva says many of its incidents came from. Deduplication removes events that describe the same usage twice. Events can arrive twice because apps and servers retry, so plan for it. Classification then matches each usage against rules that decide whether it is paid and how. Canva's Help Center gives the public version of the rules. For templates, a usage is each time a design is downloaded, printed or presented. For elements, such as images, a usage is a Pro element export. Creators are paid for both Free and Pro template usage. Canva wrote that the classification rules change from time to time, and a bug can put a usage into the wrong type. It calls that misclassification. Two more failures matter. Overcounting happens when an app adds a new event type that should not count, and the counting side is not told. Undercounting happens when a new type that should count is never sent to the counting service. In the interview, name all three. Then say how you would notice them and how you would repair them.
Fix the code, not the data: recount from the source
The old design kept many layers of saved results: a deduplication table, an aggregation table and a table of counters. When a rule was wrong, engineers had to pause the pipeline, work out which rows were wrong, and patch every layer by hand. Canva wrote that this took days, with several engineers checking each other's work. The new design keeps the middle steps as SQL views and recounts each period from the raw events. The aggregation step compares its new totals with the totals from the last run, using an outer join. An outer join keeps rows that appear on either side, not only rows that match. Canva's post shows the four cases. A total that is the same stays. A total that changed is overwritten. A total that is new is added. A total that no longer appears is set to zero. So a misclassified usage moves from the wrong type to the right one on the next run, with nobody editing a database. This works only while the raw events are correct and complete. That is why the raw store matters so much. The listing below shows the idea. It is an illustration, not Canva's code.
with new_counts as (
  select month_id, content_id, usage_type, count(*) as usage_count
  from {{ ref('usage_deduped') }}
  where month_id = {{ var('month') }}
  group by month_id, content_id, usage_type
),
old_counts as (
  select * from {{ this }} where month_id = {{ var('month') }}
)
select
  coalesce(n.month_id, o.month_id)     as month_id,
  coalesce(n.content_id, o.content_id) as content_id,
  coalesce(n.usage_type, o.usage_type) as usage_type,
  coalesce(n.usage_count, 0)           as usage_count  -- gone now: 0
from new_counts n
full outer join old_counts o
  on  n.content_id = o.content_id
and n.usage_type = o.usage_typeOLTP or OLAP: why counting moved to a warehouse
OLTP, online transaction processing, describes databases like MySQL and DynamoDB. They are built for many small reads and writes, each touching a few rows. OLAP, online analytical processing, describes warehouses like Snowflake. They are built to scan and add up billions of rows in one query. Canva's first fix was to move the raw events to DynamoDB, which eased the storage pressure. It then thought about moving everything to DynamoDB and decided not to. The reason is worth repeating in an interview. DynamoDB would fix storage, but the counting would still make one round trip per record. So Canva changed the method, not only the database. It moved to ELT: extract the data, load it into the warehouse, then transform it there with SQL. The older pattern, ETL, transforms the data before loading it. Recounting a whole month needs a lot of compute, because it reads all the month's data in one go. Snowflake keeps storage and compute apart, so compute can be scaled up for the run. Canva reported that billions of usage events now aggregate in a few minutes. End to end, the pipeline went from over a day to under one hour.
Getting results out of the warehouse safely
A warehouse is good at big scans and bad at many small, fast requests. Canva wrote that OLAP databases are not good at serving large volumes of requests within milliseconds. So the payment and statistics services cannot read Snowflake directly. Canva built a scheduled worker that queries Snowflake, writes the results to S3 as an intermediate store, and uses SQS for durability, so export data is not lost. The hard part was speed. Writing too fast caused CPU spikes on the RDS databases that receive the data and made them throttle. Too slow, and totals arrive late. Canva tuned the ingestion query and a rate limit to find the middle. In this design, each load carries a batch ID, and the target table is replaced row by row, never added to. Then a worker that crashes and reloads the same batch cannot count it twice. Say this in the interview. Every copy step is a place where data can be lost or doubled.
Collecting events reliably: lessons from Canva's analytics pipeline
Canva runs a separate pipeline for product analytics, the events that measure how people use features. Canva has not said that usage events for creator payments travel through it. Its 2024 post is still the best public guide to how Canva collects events, so in this design we borrow its methods. That pipeline collects 25 billion events a day with 99.999% uptime. Every event must match a Protobuf schema, a typed description of its fields, and broken events are discarded at the server. Schemas must stay compatible both ways, so old events can be read with new schemas and new events with old ones. The server passes events on through Kinesis Data Streams, an AWS service for streams of records. Canva chose it over Kafka on AWS because it cost much less and needed far less tuning. Events are batched in groups of a few hundred and compressed, which gave a 10x compression ratio. When a Kinesis shard is busy, events go to SQS instead, which kept the server's response time under 20 ms at P99. Events land in Snowflake through Snowpipe Streaming. In 2025 Canva reported that this brought the time until new data can be queried down to about 10 minutes. Finally, the pipeline delivers each event at least once, and each consumer must remove duplicates itself. That last point is the one to carry over. Whatever collects usage events, the counting stage must expect duplicates.
Common mistakes candidates make
Mistake one: a counter that goes up by one for each event, in a normal database. At our assumed 1,900 usages a second, that is a write per event. It is also impossible to repair, because the counter forgets which events made it. Keep the raw events and derive the count from them. Mistake two: forgetting duplicates. Apps retry, and Canva's analytics pipeline promises delivery at least once, not exactly once. Give each event an ID and count each ID once. Mistake three: treating the rules as fixed. Canva says the classification rules change, and many of its incidents were misclassification. Design so a rule change means rerunning a job. Mistake four: serving the payment screen straight from the warehouse. Copy totals into a database built for fast reads, and control the copy rate. Mistake five: no plan for wrong numbers. Say how you would spot overcounting, undercounting and misclassification. Then say how you would backfill missing data from the raw copy. Mistake six: inventing Canva's numbers. Canva has not published its usage rules engine, its exact usage count or its royalty pool. Say that, and state your own assumption.
08Trade-offs
Trade-offs to discuss
Every senior interviewer expects you to surface at least 3 of these. Pick the decisions, state the alternatives, and justify your choice.
Count as you go vs recount from the raw events
Counting as you go gives fresh numbers and little compute per event. But every mistake is baked into the stored counters, and fixing them means editing data. Recounting from the raw events costs a big job each run. In exchange, a code fix is also a data fix. Canva chose the recount. Its incidents fell from one or more a month, in the worst case, to one every few months.
OLTP database vs OLAP warehouse for the counting
An OLTP database such as MySQL or DynamoDB is simple and serves fast reads. It forces one round trip per record when counting. A warehouse such as Snowflake scans billions of rows in minutes but cannot serve millisecond reads. Canva counts in the warehouse and copies the results back into service databases.
Saved middle tables vs SQL views
Saving each stage's output makes it easy to see what has been processed. It also gives you more data to store and more places to repair. Canva made the middle stages SQL views and kept only the source and the final totals. It reported over 50% less data stored.
DynamoDB for everything vs DynamoDB for raw events only
Moving every table to DynamoDB would have fixed storage. Canva wrote that it would also have meant rewriting most of the code, and the round trips would remain. It kept DynamoDB for the raw events, where its storage scaling helps most, and did the counting elsewhere.
Counting logic in service code vs in dbt SQL
SQL in dbt was simpler and removed thousands of lines of code. The cost is a second system. Canva wrote that the dbt service has its own release schedule, so schema changes need care. It also needs its own build and deploy pipeline, which costs extra.
Fast unload vs a rate-limited unload
Loading totals as fast as possible makes them available sooner. Canva found it pushed RDS CPU into spikes and could make the service databases throttle. A tuned rate limit is slower but keeps the payment and statistics services healthy while the load runs.
Free PDF · 18 pages
Get the free System Design Interview Cheat Sheet
The interview in seven stages, the numbers worth knowing by heart, and twelve classic systems on one page each, every line linked to the lesson it comes from.
09Follow-ups
Follow-up questions to expect
After the main design, the interviewer usually picks one part and asks more. Here is what to say.
An app team adds a new event type, and nobody tells you. What happens?
If it should not be paid, the totals go up wrongly. Canva calls this overcounting. With a recount design, you add the type to the exclusion rules and rerun the period. The outer join lowers the wrong totals. In this design, an alert also fires when an unknown event type appears in the raw store.
A week of events for one content type never arrived. How do you repair it?
That is undercounting. Find the exact window of missing data, load it from a backup copy of the raw events, and rerun the recount for that period. Canva wrote that its old design took up to several days to backfill. Recounting in the warehouse makes it a rerun.
How do you stop a retried event from being counted twice?
Give each event an ID when it is created, so a retry carries the same ID. The raw store keys on that ID, and the deduplication view keeps one row per ID. Downstream, each unload batch has an ID and replaces rows rather than adding to them.
Creators want to see their numbers today, not at the end of the month. What changes?
In this design, creator statistics read the latest recount, which Canva's pipeline delivers in under an hour. If that is not fresh enough, add a separate fast path for an approximate live count. Keep payments on the recounted totals only, and label the live number as an estimate.
How would you know the totals are right before money is paid?
Canva's advice is to observe from day one: watch the latency and throughput of each step, the load on RDS and any missing data. In this design, compare each run with the last, check raw counts against deduplicated counts per event type, and hold the payout if a change is far outside normal.
10In production
How Canva actually does it
Every fact about Canva on this page comes from Canva's own writing. The estimates and anything marked 'in this design' or 'assume' are ours. The three stages, the MySQL design and its limits, the move of raw events to DynamoDB, the move to Snowflake and dbt, the outer join repair, the latency, storage and incident figures and the unload worker all come from one post. It is Canva's 2024 engineering post on counting billions. The 25 billion events a day, Protobuf schemas, Kinesis, compression and the SQS fallback describe Canva's product analytics pipeline, from a separate 2024 post. Canva has not said that creator usage events travel through that pipeline. The 10 minute time to query is from a 2025 post on Snowpipe Streaming. What counts as a template or element usage comes from the Canva Help Center. The monthly user figure is from Canva's 2025 review in its newsroom. Canva has not published its exact monthly usage count, its event format, its deduplication key, its classification rules or the size of its royalty pool.
Sources
- Canva Engineering: Scaling to Count Billions (2024)
- Canva Engineering: How Canva collects 25 billion events per day (2024)
- Canva Engineering: The foundations of Canva's continuous data platform with Snowpipe Streaming (2025)
- Canva newsroom: A transformative year for Canva, 2025 in review
- Canva Help Center: About the Canva Creators program
Lessons to study before this interview
If any of these topics are fuzzy, the interviewer will catch it. Each lesson is 15 to 60 minutes with diagrams, code, and a quiz.
Data Deduplication
advanced / consistency models
At-Least-Once Delivery
intermediate / messaging event systems
Idempotency
foundation / core fundamentals
ELT
advanced / stream batch processing
Batch Processing
advanced / stream batch processing
Lambda Architecture
advanced / stream batch processing
Columnar Storage
intermediate / database types storage
Key-Value Stores
intermediate / database types storage
Materialized Views
foundation / database fundamentals
Schema Evolution
intermediate / devops cicd
Capstone: Design a Real-Time Analytics Dashboard
capstone / capstone
System design interviews at companies in the US, UK, Canada and Singapore
41 walkthroughs of real systems at well-known companies, each built from that company's own engineering blog, talks or filings, with the numbers cited.
Banking, payments and trading
Commerce and delivery
Rides and maps
- Grab system design (Singapore)
- Uber system design
Feeds, social and messaging
Streaming and media
AI labs and big tech
Developer and collaboration tools
- GitHub system design
- Atlassian system design (Australia)
- Canva system design (this page) (Australia)
- Figma system design
- Datadog system design
- Dropbox system design
- Databricks system design
- Snowflake system design
- Zoom system design
11FAQ
Frequently asked questions
Go deeper
This guide is built on these 6 lessons. Each one teaches one piece of the Canva design above, step by step.
- Data DeduplicationSystem Design · consistency models · 25 min
- At-Least-Once DeliverySystem Design · messaging event systems · 18 min
- IdempotencySystem Design · core fundamentals · 28 min
- ELTSystem Design · stream batch processing · 32 min
- Batch ProcessingSystem Design · stream batch processing · 46 min
- Lambda ArchitectureSystem Design · stream batch processing · 48 min
Practice with 770 system design lessons
Lifetime access for ₹1,111 in India or $35 elsewhere. Interactive diagrams, quizzes, and 20 capstone projects to practise on.

This one question is not enough for the interview.
Get all 200 questions in the System Design and Distributed Systems pack
Each question has why it is asked, a full answer, what the interviewer listens for, the follow-ups, the common mistakes and a diagram (268 diagrams in all). A PDF you keep, junior to staff level.
Pay by UPI, cards or netbanking through Razorpay. Pay by card or PayPal, in US dollars. Download at once from My packs.
NEWSystem Design Hands-On
Included in the System Design course: real systems, built live
Postgres Sharding: Complete Hands-On (PgBouncer + Citus). 2 h 36 min and 20 chapters: one PostgreSQL loaded until it breaks, then four shards behind a router you write, PgBouncer and Citus, with the 139-page slide deck. The first 15 minutes are free to watch.

Self-paced bootcamp · new class every week
System Design Interview Bootcamp
System design interview preparation in 14 recorded classes: the framework, estimation, the building blocks and 14 real designs, with two 1:1 mock interviews. Classes 1 to 4 are out, and its first 3 minutes are free.