System design interview guide
Datadog System Design Interview: How Metrics and Logs Are Stored and Queried
Short answer
A good scenario to practise for a Datadog system design interview is a monitoring platform that stores metrics and logs. We have no public source that Datadog asks it. The key idea is that metrics and logs need two different storage systems behind one shared intake. The Datadog Agent on each host sends metric points and log lines to intake. Intake writes them into Kafka, a durable log. Metrics go to a real-time timeseries database, built in Rust, with tags in a separate index. Logs and other events go to Husky. Its stateless Writers upload columnar files to object storage such as S3. They record each file in a FoundationDB metadata store. Queries ask the metadata which files could match and skip most of them. About 80% of the rest come from cache. Datadog reported more than 100 trillion events a day in 2025.
Two courses by the author of this page:
770 lessons · 18 free to read
₹1,111 in India · $35 elsewhere, once
Get System DesignYou own this course
219 lessons · 10 free to read
₹1,333 in India · $35 elsewhere, once
Get Generative AI and Agentic AIYou own this course
Save your progress and get the interview checklist PDF
Datadog wrote in 2025 that it processes more than 100 trillion events and billions of queries every day. It had about 32,700 customers at the end of 2025. Its metrics and its logs live in two different storage systems, each built in house.
Designing Datadog's monitoring platform is two storage problems behind one front door. An agent on each customer host sends metric points and log lines. Intake services write them into Kafka, a durable log that many readers can consume. Metrics go to a real-time timeseries database, with a separate index for their tags. Logs and other events go to Husky, an event store. Husky keeps its files in object storage such as Amazon S3. FoundationDB, a distributed database with strong transactions, records which files exist. Most of the interview is about why the two kinds of data need different stores. The rest is about keeping one noisy customer from hurting all the others.

Where it shows up
A common type of question for backend, storage and infrastructure roles, especially at companies that build or run monitoring systems. We have no public source that Datadog uses this exact question. This guide is built from Datadog's own engineering blog, incident report and filings, so you can reason with real numbers.
Spec sheetDatadog
- 01Events per second, estimated
- ~1.2 billion/s
- 02Raw event bytes, estimated
- ~100 PB/day
- 03One metric point on disk
- < 2 bytes, typical
- 04Points per host per day, estimated
- ~576,000
worked through below, with the maths
Datadog in its own numbers
Every figure below is quoted from Datadog's own engineering writing. Tap a source to check it.
100T+
events a day across logs, traces and network data
Datadog engineering blog, 2025~32,700
customers at 31 December 2025
Datadog 10-K, FY202560x
faster ingestion when the Rust RTDB was rolled out for distribution metrics
Datadog engineering blog, 2025~80%
result cache hit rate on Husky file queries that survive metadata pruning
Datadog engineering blog, 20250.4%
of Husky file queries that need a blob storage read
Datadog engineering blog, 202540+
Kafka and ZooKeeper clusters, in 2019
Datadog blog, 2019
Why this question is asked
This design tests whether you can tell two kinds of data apart. A metric is a number over time, and it compresses to almost nothing. A log line is kilobytes of text with fields nobody can predict. One store cannot serve both well. The question also tests multi-tenancy, which means many customers sharing the same machines. One customer's burst must not slow everyone else's alerts. A strong answer separates the write path from the read path, and it talks about cost per byte.
What the interviewer asks
“Design a monitoring platform like Datadog. Customers install an agent on their hosts. The agent sends metrics and logs. Customers build dashboards, search their logs and set alerts that must fire within seconds.”
Ask these back before you draw
- 1.Is this metrics and logs only, or traces and other events too? (Start with metrics and logs.)
- 2.How fresh must data be for an alert? Seconds, or minutes?
- 3.How long do we keep data? (Datadog's docs list 15 months for metric tags and values.)
- 4.Do customers choose which log fields are searchable, or must every field be searchable?
- 5.Is one customer allowed to burst far above its normal volume without warning?
This page is the free part.
The course goes deeper on the Datadog design
₹1,111 in India$35 everywhere elseonce, for the whole course
The System Design course covers the Datadog design across a run of lessons, not one page. These 4 alone are about 72 minutes of step-by-step reading, every one with a quiz.
- Time-Series Databases
Databases built for timestamped data, metrics, IoT sensors, financial ticks, and observability.
- LSM Trees
How an LSM tree turns random writes into fast sequential ones: the memtable, WAL and SSTables, size-tiered vs leveled compaction, and what reads cost.
- Columnar Storage
Store data by column instead of by row, the secret behind modern analytics engines.
- Object Storage
The storage model that powers the modern internet, flat, scalable, and dirt cheap.
all part of
System Design Masterclass
770 lessons · about 290 hours · 18 free to read
₹1,111in India, by UPI
$35everywhere else, by card or PayPal
It is really nice and good Please join the course
You own this course
Continue with Time-Series Databasespay once,
yours for life
Live from the course bench
Before you design Datadog, try the questions it rests on.
Real interview questions, live diagrams and measured lab results, pulled at random from the lessons. A new set every time you come back.

01Requirements
Requirements
Always clarify these in the first 5 minutes of the interview. Do not start drawing boxes until both lists are agreed.
Functional requirements
- An agent on each host collects metrics and logs and sends them to the platform
- A metric is a name, tags, a timestamp and a number; queries filter and group by tags
- Logs can be searched by text and by any field, without choosing indexed fields in advance
- Dashboards refresh live, and monitors (alerts) evaluate the same data every few seconds
- Each customer only ever sees its own data
- Old data stays queryable for the retention period the customer pays for
Non-functional requirements
- Very high write volume: Datadog reported more than 100 trillion events a day in 2025
- Most written data is never read: in 2024 Datadog said only about 30% of written metric data is consistently queried
- No duplicates: one duplicate event can make a monitor fire wrongly, and it breaks billing
- Strong isolation: one customer's burst or heavy query must not slow other customers
- Alerts and live data matter more than history when something breaks
- Each region keeps working on its own if another region fails
02Scale estimates
Back-of-envelope scale estimates
Show your math. Pulling numbers from thin air signals you have not thought about the load.
Events per second, estimated
~1.2 billion/s
Datadog's 2025 query post says more than 100 trillion events a day. 100 trillion / 86,400 seconds is about 1.16 billion events per second on average. Peaks are higher. This covers logs, traces and network data, not metrics alone.
Raw event bytes, estimated
~100 PB/day
Assume an average event of 1 KB. That is our assumption, based on Datadog saying log sizes are 'measured in kilobytes, not bytes'. Trace and network events may be smaller. 100 trillion x 1 KB is about 100 petabytes a day before compression. At that volume, cheap object storage with stateless compute is far easier to run than replicated local disks.
One metric point on disk
< 2 bytes, typical
Datadog's 2022 Husky post says a point is a 16-byte <timestamp, float64> pair. It adds that in most modern metrics databases, delta-of-delta encoding brings it under two bytes in most cases. Delta-of-delta means storing how much the gap between timestamps changed, which is usually zero. Datadog has not published a bytes-per-point figure for its own RTDB.
Points per host per day, estimated
~576,000
Datadog's docs give a 15-second collection interval for Agent integrations. That is 4 points a minute, 5,760 a day, per metric. Assume 100 metrics per host (our assumption): 576,000 points. Most modern metrics databases store a point in under 2 bytes. At that size, this is under about 1.2 MB a day.
File queries that read blob storage
4 in 1,000
Datadog's 2025 sample had 1,000 file (fragment) queries. Metadata pruned 300 and the result cache 560. Column metadata pruned 78 and other caches 28. Of the last 34, 30 were served from local cache and 4 went to blob storage.
03Architecture
High-level architecture
Draw one front door and two storage systems. The Datadog Agent runs on each customer host. It sends metric points and log lines to Datadog's intake services, through a load balancer. Intake writes everything into Kafka. Kafka lets several teams read the same stream for different jobs: analysis, indexing and archiving. On the metrics side, two services read Kafka. The real-time timeseries database (RTDB) stores <timeseries_id, timestamp, value>. The index database stores <timeseries_id, tags>, so a query can find which series match env:prod. The RTDB holds recent points. The posts cited here do not describe where Datadog keeps 15 months of metric history. In this design we assume older points are rolled up into coarser intervals and moved to cheaper storage. On the logs side, a Shard Router reads Kafka and writes events back to Kafka, grouped into shards per customer. A shard is one slice of a customer's data, owned by one worker at a time. Husky Writers read those shards. They buffer events briefly and upload files to blob storage such as S3. Datadog calls each of these files a fragment. Then the Writers commit each new file to a metadata store built on FoundationDB. Compactors merge small files into big ones in the background. At query time, Husky Readers scan files and return partial results, and a query service merges them. The Writers are never asked anything at query time, so heavy queries cannot slow ingestion.
In a real interview, sketch this on the whiteboard before diving into any single box.
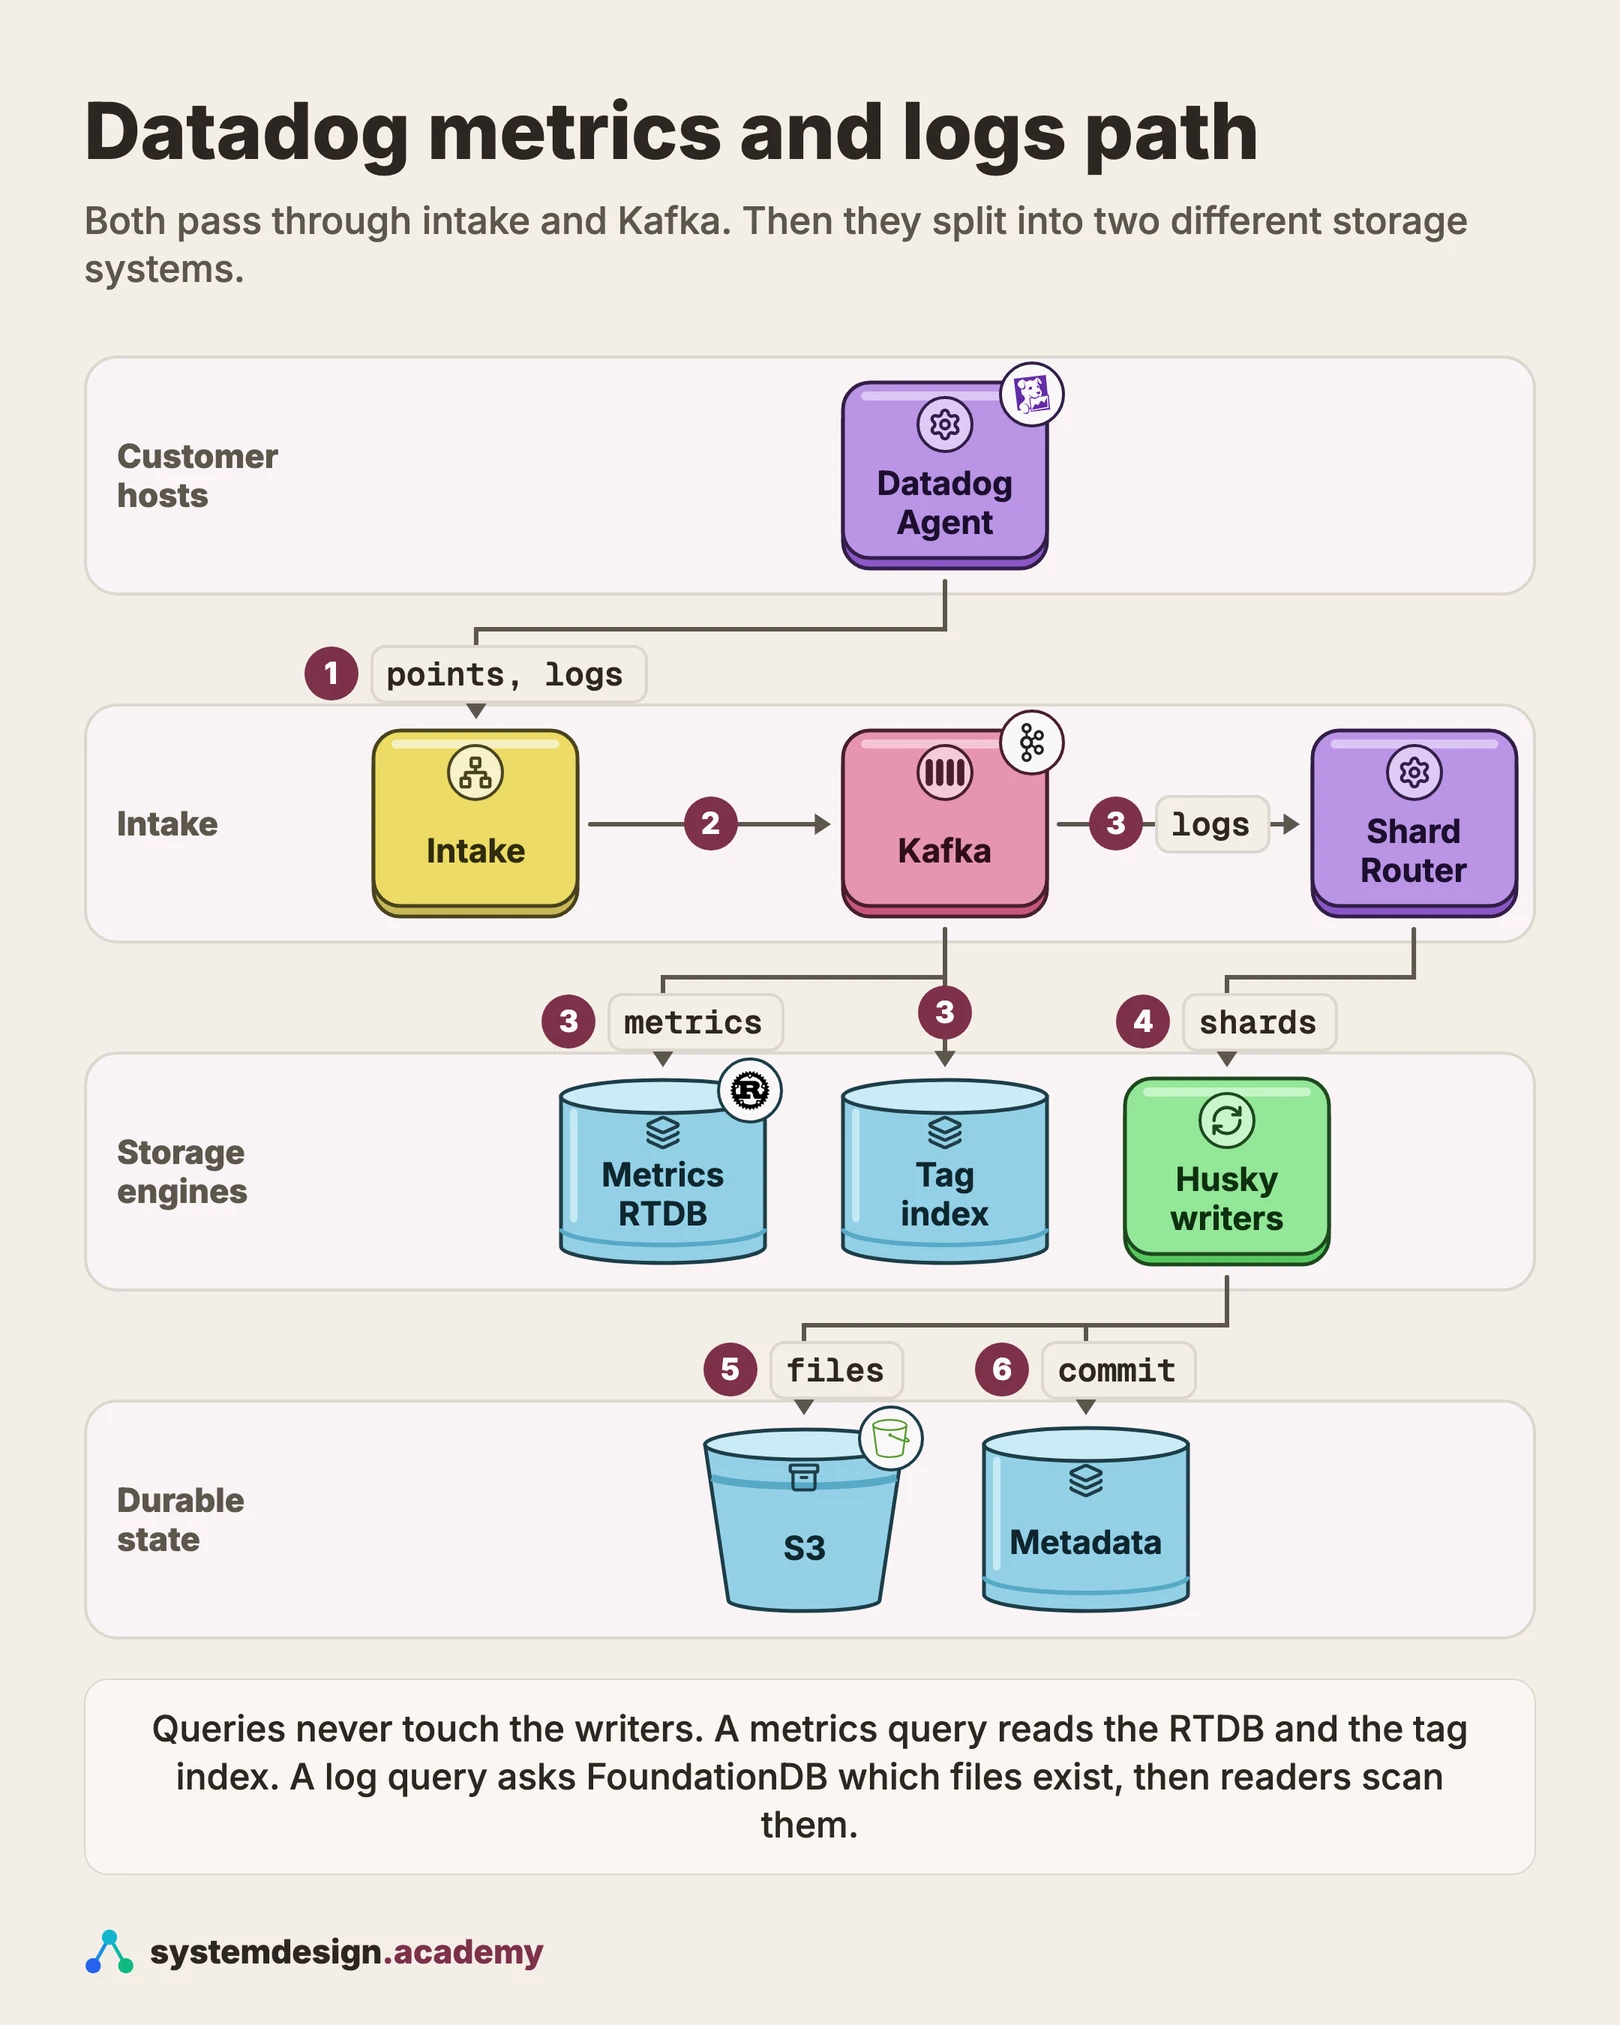
04One request
What happens to one metric point and one log line, step by step
This walk joins Datadog's 2024 metrics platform overview with its Husky posts from 2022 to 2025.
- 1
The Agent collects
The Datadog Agent on a host runs its integrations every 15 seconds. The same agent also collects logs. It sends metric points and log lines to Datadog's intake over the network.
- 2
Intake writes to Kafka
Intake receives the data behind a load balancer, processes it and writes it into Kafka. From here, analysis, indexing and archiving each read the stream on their own.
- 3
Metrics land in the RTDB
An RTDB node runs one intake worker per Kafka partition. Each worker sends a point to the storage shard that owns its series. There is typically one storage shard per CPU core. The tags go to the index database.
- 4
Logs are routed to shards
The Shard Router picks a shard for each log event from its customer, timestamp and event ID. The same event always lands on the same shard. That makes duplicates easy to catch.
- 5
Writers make files and commit them
A Husky Writer buffers events and writes a columnar file to blob storage. A columnar file stores each field's values together, so a query reads only the fields it needs. The Writer commits the file and its event IDs to FoundationDB in one transaction. Only then is the data visible.
- 6
A query fans out and streams back
The query planner splits the time range into steps. Orchestrators ask the metadata service which files overlap and prune most of them. Readers scan what is left, and partial results stream back to the dashboard.
05Components
Core components
Walk through each service. The interviewer wants to hear what each one owns, not just the names.
Datadog Agent
Software on each customer host. Datadog's 10-K says one agent collects metrics, traces and logs. Agent integrations collect every 15 seconds. Its built-in DogStatsD server takes custom metrics from applications over UDP. It aggregates the points for each unique metric into one point every 10 seconds.
Intake and Kafka
Intake services accept data and write it into Kafka, a durable, replicated log. Kafka decouples senders from storage: if a store falls behind, data waits in Kafka instead of being lost. Datadog ran more than 40 Kafka and ZooKeeper clusters in 2019. ZooKeeper is the coordination service older Kafka versions needed.
Real-time timeseries database (RTDB)
Stores recent metric points as <timeseries_id, timestamp, value>. The 2025 version is written in Rust. Its storage engine, Monocle, is a log-structured merge tree (LSM tree). Writes go to memory first and are flushed to sorted files. Data is split into shards, typically one per CPU core.
Timeseries index
Maps each timeseries ID to its tags, such as env:prod or service:web. Since its 2024 redesign it also keeps the reverse map, from each tag to the series that carry it. This is called an inverted index. It lets a filter like env:prod find its series without scanning them all. Datadog built it on RocksDB and later rewrote it in Rust.
Shard Router and Sharding Allocator
The Shard Router groups each customer's log events into shards, which are groups of Kafka partitions. The Sharding Allocator decides which shards a customer gets for each few-minute window. In 2023 Datadog wrote that it stores that choice in FoundationDB, so every router agrees.
Husky Writers, Compactors and Readers
Husky splits the old storage node into three stateless roles. Writers turn events into files. Compactors merge small files into large sorted ones. Readers run queries over files and return partial results. Each role scales on its own.
Metadata store on FoundationDB
The single source of truth for which files each customer can see. Writers and compactors commit changes in atomic transactions, so a query never sees a file twice or half a compaction. In 2022 Datadog said it chose FoundationDB for its strictly serializable transactions. That means every transaction appears to happen at one instant, in real-time order.
Query planner, orchestrator and readers
The planner validates and splits a query into time steps. Orchestrators fetch file metadata, prune files that cannot match and dispatch the rest to readers. Readers keep several caches, and results stream back as they arrive.
06Data model
Data model
Pick the right store per table. Justify each choice with the access pattern, not by reflex.
metric point (RTDB)timeseries_idtimestampvalue (float64, or a DDSketch for distributions)Datadog's own tuple. A DDSketch is a compact summary of a distribution that can estimate percentiles. The series key is hashed to a storage shard. Points are compressed in files. Datadog has not published its own on-disk size per point.
timeseries indextimeseries_idmetric nametags (env:prod, service:web, host:...)tag -> series IDs (inverted index)Datadog's <timeseries_id, tags> tuple, plus the inverted index from its 2024 post. Answers 'which series match these filters', and groups series for a query. Kept separate from the points so each store can be tuned for its job.
Husky fragment (a file in blob storage)customer tabletime windowcolumns (any field)row groupssort key: service, status, env, timestampA columnar file, similar to Parquet. Row groups are blocks of rows inside one file. Each customer gets its own table, and files never mix customers. Writers produce files of about a thousand rows; compaction grows them to about a million.
fragment metadata (FoundationDB)customertime bucketfile pathversionrow countmin/max timestamppruning regex per sort columnOur sketch; Datadog has not published this schema. Datadog's 2025 post lists file paths, versions, row counts, time bounds and pruning data. It is what the query orchestrator reads first. A query only touches files whose time range overlaps and whose pruning regex could match.
shard placement (FoundationDB)customer_idtime range (a few minutes)shard listOur sketch; Datadog has not published this schema. A placement is immutable once created. Any router that asks for the same customer and timestamp gets the same answer. A per-customer salt is computed and used in the hash that picks the first shard.
07Deep dives
Deep dives
These are the conversations the interviewer is steering you toward. Practice each one until you can talk through it without notes.
Why metrics and logs need two different stores
Datadog wrote in 2022 that metrics systems store pre-aggregated tuples of <timeseries_id, timestamp, float64>. A million events in one second can collapse into a single 16-byte point. In most modern metrics databases, delta-of-delta encoding stores that point in under two bytes. The price is that tags must be long-lived dimensions, like datacenter, service or pod name. Short-lived values like a transaction ID would create millions of series. Logs are the opposite. Datadog says log sizes are 'measured in kilobytes, not bytes'. A logs product is useless without high-cardinality fields like stack traces and UUIDs. Cardinality means how many distinct values a field can take. A field like env has a handful; a field like user_id has millions. So metrics want a compact store that computes series fast. Logs want a store that keeps every event with all its context and aggregates at query time. In an interview, say this split out loud before you draw any database.
Kafka in the middle, and routing log events to shards
Datadog's 2024 metrics post says intake writes points into Kafka, and several services consume the same stream. That buys two things. A slow store does not push back on customers, and a new consumer can be added without touching intake. Datadog's 2019 Kafka post adds a warning from experience. In an unclean leader election, a replica that is missing recent writes becomes the leader, and those writes are lost. That once happened on an old Datadog cluster. Datadog recovered the data because it was writing to a primary and a secondary Kafka cluster. For logs, Datadog described a Shard Router in front of Husky in 2023. It gives each customer a list of shards and picks one per event by hashing the event ID. Each list is valid only for a window of a few minutes, and it never changes once created. Datadog calls these time-bounded Shard Placements. A burst gets more shards in the next window, and old events still route the same way.
import hashlib

def route(event, allocator):
    # Same tenant + timestamp -> same placement (Datadog keeps these in FoundationDB)
    placement = allocator.get_placement(event.tenant_id, event.ts)
    shards = placement.shards                  # e.g. [2, 3, 4], fixed for a few minutes
    digest = hashlib.blake2b(event.event_id.encode(), digest_size=8).digest()
return shards[int.from_bytes(digest, "big") % len(shards)] # same on every routerThe metrics store: six generations to a Rust RTDB
Datadog wrote in 2025 that its real-time metrics store is the sixth generation in a 15-year line. It started on Cassandra and moved to Redis. Then came MDBM, a memory-mapped key-value store. Next was a B+ tree in Go; a B+ tree is the sorted tree most databases use for indexes. RocksDB was added for DDSketch distribution data. The newest RTDB, built in Rust, unifies both. Every series key is hashed to a shard, typically one shard per CPU core. Intake, cache, files and query work are all split the same way. So there are no locks on the write path. The engine, Monocle, is an LSM tree with tiered compaction. Tiered compaction merges files in batches, which saves CPU on heavy writes. Each file keeps its min and max timestamp in memory, plus a Bloom filter. A Bloom filter is a small structure that can say 'definitely not in this file'. When Datadog rolled the RTDB out for distribution metrics, it reported 60x faster ingestion. High-cardinality queries were 5x faster, and cost efficiency doubled. Its 2024 post adds that a new tag index design, rewritten in Rust, cut query timeouts by 99%.
Husky: storage split from compute, files in S3
Datadog's first logs system was a clustered search store. One bad node could hurt every customer on the cluster. Adding nodes made things worse, because overloaded nodes started moving data. The second version made every node a cluster of one. Husky, introduced in 2022, goes further. It splits storage into Writers, Compactors and Readers. The only stateful parts are blob storage, such as S3, and the FoundationDB metadata store. Datadog called Husky a distributed, schemaless, vectorized column store. Schemaless means any field can be queried without being declared first. Vectorized means it processes a batch of values at a time. The change had a cost. Median query latency rose by a few hundred milliseconds, because remote storage is slower than a local SSD. Datadog took that trade. In return, p95, p99 and maximum latency fell by seconds to hundreds of seconds. The p99 is the latency that 99 out of 100 queries beat.
Exactly-once ingestion without a separate dedup database
Datadog wrote in 2023 that one duplicate event can make a monitor fire wrongly or stay silent. Duplicates come from retries, restarts and network blips. Husky Writers are stateless, so they cannot just remember every ID in memory. Datadog rejected a side store like Redis or Cassandra. It would create two sources of truth that could disagree. Instead, the Writers store event IDs in Husky itself, in separate ID tables, one per shard. The IDs and the event data are committed in the same FoundationDB transaction. So either both exist or neither does. Recent IDs are kept in memory and older ones are paged in. Datadog said Writers page in IDs about a hundred times faster than they process events. Sometimes two writers briefly own one shard. Versioned commits reject the late one, and it resets to the last committed point.
Compaction and pruning: read as little as possible
Writers produce files of about a thousand rows. Too many small files make object storage slow and costly, because every file is a request. Datadog's 2025 compaction post describes two passes. Size-tiered compaction merges files until they hold about a million rows. Locality compaction then sorts rows by a sort key. For logs that key is service, status, env, timestamp. Each file ends up covering a narrow slice of services. For each sort column, Husky stores a small regex that matches every value in the file and never misses one. A query for service:reader skips any file whose regex cannot match. Datadog says locality compaction let it cut its query worker pool by 30 percent when it first rolled out.
The query path: plan, prune, cache, stream
Datadog's 2025 query post names four services: planner, orchestrator, metadata service and reader. The planner splits, say, a seven-day query into time steps. Orchestrators fetch file metadata and prune. Readers hold caches. After metadata pruning, the result cache answers about 80% of the file queries that remain. That is because dashboards refresh and monitors repeat the same queries. The blob range cache, on local disk, hits about 70%. In Datadog's sample of 1,000 file queries, only 34 read real data and only 4 touched blob storage. To keep caches warm, a file is routed to the same reader every time. To keep customers apart, each customer gets its own subset of readers, called shuffle sharding. A slow file must not hold up the page, so partial results stream back. In one example, 7 of 8 files answered within one second. Datadog's 2022 Husky post adds that monitor queries can run apart from queries typed by people. Then neither can starve the other.
Common mistakes candidates make
The first mistake is one database for everything. Candidates put metrics and logs in Elasticsearch or in one timeseries store. That fails here because the shapes differ by two to three orders of magnitude in size per event. Say instead that metrics go to a compressed series store and logs to a columnar event store. The second mistake is adding nodes to a hot cluster during an incident. Datadog's first logs system got worse when it scaled out, because nodes started moving data while overloaded. Say instead that compute is stateless and data lives in object storage. The third mistake is ignoring duplicates. In monitoring, a duplicate is a false alert and a billing error. Name the dedup key and where it is committed. The fourth mistake is treating all queries as equal. A human exploring logs must never delay the monitors that page someone at night. Say you isolate them in separate reader pools.
08Trade-offs
Trade-offs to discuss
Every senior interviewer expects you to surface at least 3 of these. Pick the decisions, state the alternatives, and justify your choice.
Two stores (metrics RTDB and Husky) vs one general store
Two stores cost more to build and run. But a point in a typical metrics database compresses to under 2 bytes. A log line is kilobytes with unpredictable fields. A store tuned for one does poorly at the other. Datadog built separate engines and shares only intake and Kafka.
Files in object storage vs data on local disks
Local SSDs are faster, and Husky's median query got a few hundred milliseconds slower. Object storage removes shards and replicas from the design. Compute scales freely, and a query can burst onto many readers. Datadog chose the slower median for much better tail latency.
FoundationDB as the single source of truth vs a simpler key-value store
A strongly consistent, transactional store is harder to run. In return, a file and its event IDs commit together. A compaction swaps old files for new ones in one step. Queries never see half a change. A quorum is a majority of nodes that must agree before the cluster acts. Datadog's 2023 incident report notes the other side: stores that need a quorum stop entirely when they lose it.
Tiered compaction vs leveled compaction in the RTDB
Leveled compaction keeps reads cheap but merges constantly. Tiered compaction merges in batches and saves CPU on heavy writes. The cost is more overlapping files to read. In general it also uses more disk until a merge runs. Datadog wrote in 2025 that most metrics queries hit recent data. Per-file time ranges and Bloom filters let a query skip most of the overlap.
Statically sharded data stores vs quorum-based clusters
Datadog wrote after its 2023 outage that a fleet of independent shards degrades roughly in line with the nodes lost. A quorum cluster runs perfectly until it loses the quorum, then refuses to work. Quorum clusters are easier to manage day to day. Datadog said the outage made it re-examine that choice.
Shuffle sharding readers vs one shared pool
One shared pool wastes nothing but lets one heavy customer slow everyone. A dedicated pool per customer is safe but mostly idle. Shuffle sharding gives each customer a subset of readers sized to its usage. Two customers then rarely share all their readers.
Free PDF · 18 pages
Get the free System Design Interview Cheat Sheet
The interview in seven stages, the numbers worth knowing by heart, and twelve classic systems on one page each, every line linked to the lesson it comes from.
09Follow-ups
Follow-up questions to expect
After the main design, the interviewer usually picks one part and asks more. Here is what to say.
One customer suddenly sends 100 times its normal log volume. What happens?
Its current shard placement is fixed for a few minutes, so the burst first lands on its existing shards. Writers autoscale on CPU, so each writer holds fewer shards and can take more from each. The Autosharder sees the higher byte count and gives the customer more shards in the next placement. An overloaded shard can also be excluded from future placements so it can drain.
A customer tags a metric with user_id and creates ten million new series overnight. What breaks?
Each new tag value creates a new timeseries. In general, metrics cost grows with the number of series, not the number of points. The index feels it first, because it must store every new tag and series ID. In this design we assume a per-customer limit on new series, with a warning before anything is dropped. Datadog wrote in 2024 that its index redesign handles metrics with 20 times higher cardinality on the same hardware.
Where does the event ID come from, and how long do you remember it?
The ID must be fixed before the first send. Otherwise a retry gets a new ID and slips past the check. Datadog has not published where its event IDs are assigned. In this design we assume the sender sets the ID once, and every retry reuses it. Datadog wrote in 2023 that its ID tables can have a time-to-live, so old IDs expire after a set time.
How do you stop a user's huge log search from delaying alerts?
Run monitor queries and human queries on separate reader pools. Husky can do this because readers are stateless and any pool can read any file. Inside a pool, give each customer its own subset of readers with shuffle sharding. Datadog's RTDB also queues queries by cost and priority instead of running them all at once.
A bad OS update takes down tens of thousands of nodes in five regions at once. What do you restore first?
Live data and alerts, then history. That is the order Datadog chose on 8 March 2023. A systemd security update deleted container network routes, and the update was scheduled for the same hour in every region. Datadog first restored real-time ingestion so monitors worked again, then backfilled data that had arrived but was not processed. Datadog wrote that most of its services use one system for live data and a separate one for history. It said that separation let products work again earlier.
10In production
How Datadog actually does it
Every fact about Datadog on this page comes from Datadog's own writing and filings. The estimates and anything marked 'in this design' or 'assume' are ours. The metrics overview, with intake, Kafka, the database and the index, is from the 2024 post Timeseries indexing at scale. The six generations and the RTDB numbers are from the 2025 post on the Rust timeseries engine. Husky's design is from four posts. They are the 2022 introduction, the 2023 ingestion post, and the 2025 posts on compaction and on queries. The Kafka lessons are from 2019. The outage is from Datadog's incident report, published 16 May 2023, on the 8 March 2023 incident. Customer counts are from the FY2025 10-K. Collection intervals and retention are from Datadog's docs. Datadog has not published every detail, such as how its intake services validate data. Where this guide fills a gap, it says so. Posts describe the system at their date, so quote the year in an interview.
Sources
- Datadog: Introducing Husky, Datadog's third-generation event store (2022)
- Datadog: Husky, exactly-once ingestion and multi-tenancy at scale (2023)
- Datadog: Husky, efficient compaction at Datadog scale (2025)
- Datadog: Inside Husky's query engine, real-time access to 100 trillion events (2025)
- Datadog: Evolving our real-time timeseries storage again, built in Rust (2025)
- Datadog: Timeseries indexing at scale (2024)
- Datadog: Lessons learned from running Kafka at Datadog (2019)
- Datadog: 2023-03-08 incident, infrastructure connectivity issue affecting multiple regions (2023)
- Datadog, Inc. annual report on Form 10-K for fiscal year 2025 (SEC EDGAR)
- Datadog docs: Data collection and resolution
- Datadog docs: Data retention periods
- Datadog docs: DogStatsD
Lessons to study before this interview
If any of these topics are fuzzy, the interviewer will catch it. Each lesson is 15 to 60 minutes with diagrams, code, and a quiz.
Time-Series Databases
intermediate / database types storage
LSM Trees
intermediate / database types storage
Columnar Storage
intermediate / database types storage
Object Storage
intermediate / database types storage
Bloom Filters
intermediate / database types storage
Consistent Hashing
intermediate / data replication distribution
Exactly-Once Delivery
intermediate / messaging event systems
Log Aggregation
intermediate / observability monitoring
Metrics Aggregation
intermediate / observability monitoring
Bulkhead Pattern
advanced / reliability resilience
Capstone: Design a Metrics/Monitoring System
capstone / capstone
System design interviews at companies in the US, UK, Canada and Singapore
41 walkthroughs of real systems at well-known companies, each built from that company's own engineering blog, talks or filings, with the numbers cited.
Banking, payments and trading
Commerce and delivery
Rides and maps
- Grab system design (Singapore)
- Uber system design
Feeds, social and messaging
Streaming and media
AI labs and big tech
Developer and collaboration tools
- GitHub system design
- Atlassian system design (Australia)
- Canva system design (Australia)
- Figma system design
- Datadog system design (this page)
- Dropbox system design
- Databricks system design
- Snowflake system design
- Zoom system design
11FAQ
Frequently asked questions
Go deeper
This guide is built on these 6 lessons. Each one teaches one piece of the Datadog design above, step by step.
- Time-Series DatabasesSystem Design · database types storage · 15 min
- LSM TreesSystem Design · database types storage · 25 min
- Columnar StorageSystem Design · database types storage · 18 min
- Object StorageSystem Design · database types storage · 14 min
- Bloom FiltersSystem Design · database types storage · 22 min
- Consistent HashingSystem Design · data replication distribution · 25 min
Practice with 770 system design lessons
Lifetime access for ₹1,111 in India or $35 elsewhere. Interactive diagrams, quizzes, and 20 capstone projects to practise on.

This one question is not enough for the interview.
Get all 200 questions in the System Design and Distributed Systems pack
Each question has why it is asked, a full answer, what the interviewer listens for, the follow-ups, the common mistakes and a diagram (268 diagrams in all). A PDF you keep, junior to staff level.
Pay by UPI, cards or netbanking through Razorpay. Pay by card or PayPal, in US dollars. Download at once from My packs.
NEWSystem Design Hands-On
Included in the System Design course: real systems, built live
Postgres Sharding: Complete Hands-On (PgBouncer + Citus). 2 h 36 min and 20 chapters: one PostgreSQL loaded until it breaks, then four shards behind a router you write, PgBouncer and Citus, with the 139-page slide deck. The first 15 minutes are free to watch.

Self-paced bootcamp · new class every week
System Design Interview Bootcamp
System design interview preparation in 14 recorded classes: the framework, estimation, the building blocks and 14 real designs, with two 1:1 mock interviews. Classes 1 to 4 are out, and its first 3 minutes are free.